active trader - june2001
TRANSCRIPT
ACTIVE TRADER • June 2001 • www.activetradermag.com 1
JUNE 2001 ISSUE
2 E d i t o r ’s Note
3 C o n t r i b u t o r s
4 Chat Room
5 Inside the MarketBy Jeff Ponczak
1 3 Web Wa t c hBroker-Trader matchmaker: HighOffer.com.
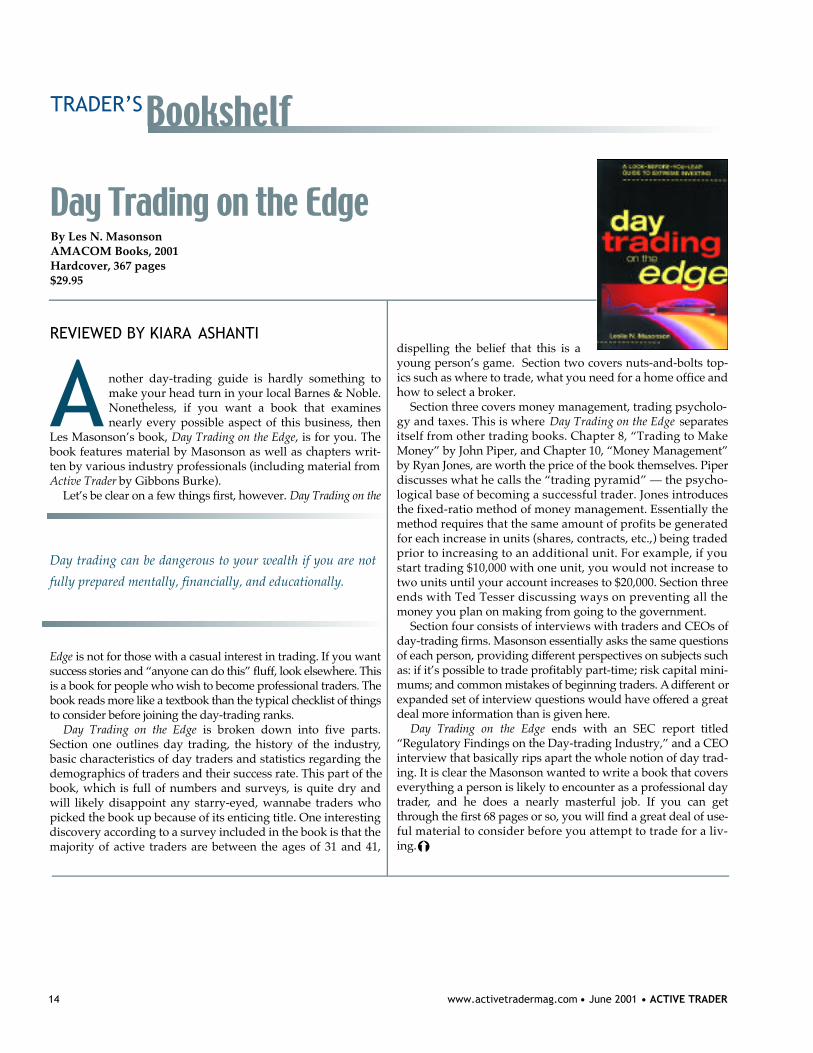
1 4 Tra d e r ’s BookshelfKiara Ashanti reviews Day Trading on the Edgeby Les N. Masonson.
1 5 New Products
Technology for Tra d e r s1 7 Software Screening
A review of ProphetStation, a real-time analysis and market-tracking platform.By Scott Os
Trading Stra t e g i e s1 9 One- and two-bar price patterns
Learn about simple price patterns that signal short-term reversals.By Martin Pring
2 3 Holding on to profitsStudy a trailing stop technique you can use to capture profits on any time frame.By Dave Baker
2 6 Catch the third The subjective character of Elliott Wave makes it too difficultfor most traders to use in day-to-day trading. A short-term chart pattern can help you catch the important third wave as it’s about to take off.By Eric S. Hadik
3 0 MACD divergencesA trader describes how to use the MACD indicator to build a top-down trading approach in the currency market.By Gary Tilkin
3 3 The execution solutionTips and techniques on trade execution, order routing and trading technology.By M. Rogan LaBier
Advanced Stra t e g i e s3 5 Measuring trend momentum
It’s every trader’s dream to build an indicator that can adjustits behavior with the moods of the market. Here’s a look at a dynamic moving average that responds to changes in momentum rather than prices.By Tushar Chande
3 8 Trading Systems Lab
Face of Tra d i n g4 0 Keeping it simple
By Allen Sykora
Trading Psychology4 2 Mind over money management
How to improve your ability to assume risk and take your trading to the next level. By Dr. Ari Kiev
Risk Control & Money Management4 5 Analyzing the cringe curve
Match the risk profile of your strategy with the ability to accept losses.By Daryl Guppy
Trading Basics4 7 Riding the learning curve
The two most common mistakes among new traders are the inability to take losses and the tendency to trade too many strategies at once. Learn how to avoid these pitfalls.By Stan Kim
4 9 Indicator InsightUnderstanding and using the Advance-Decline line.
The Big Picture5 1 Acting vs. reacting
Successful traders use trading plans that allow them to act instead of react. Two tools that help you do that are the displaced moving average (DMA) and Fibonacci levels.By Thomas Stridsman
Business of Tra d i n g5 5 Keeping your trading business simple
Do you think you need to incorporate to get the best tax treatment as a trader? Maybe…maybe not.By Robert A. Green, CPA
5 8 After Hours
5 9 Trade Diary
2 www.activetradermag.com • June 2001 • ACTIVE TRADER
W hen it comes to trading psychology, thereare two basic schools of thought. The firstdismisses the importance of the mentalaspect of trading, claiming research andstrategy render emotion and interpretation
moot. Once you have a system, and thediscipline to follow it, your feelings aboutthe market shouldn’t matter.
The second group believes trading is,first and foremost, a mental exercise, andthat success or failure stems directly fromyour psychological outlook and approachto the markets. A trading plan may beessential to success, but the discipline totrade it effectively, and the ability to bal-ance discipline with flexibility, is purely amatter of the mind.
The truth, as usual, is probably some-w h e re in between. The reason many peo-ple are attracted to systematic tradinga p p roaches is the promise to remove emo-tion from trading — a tacit acknowledg-ment of the role of psychology in trading.Anyone who has made the switch fro mpaper trading to real trading, or incre a s e dtheir trading size, knows the mind gamesthat accompany putting money at risk.
How many traders have been sabo-taged by the inability to stick with their approaches duringrough patches in the market? How many others have givenaway money by not honoring their stops because when it camedown to it, they just couldn’t stand the thought of a loss? Whatabout the traders who, flush with success, increase their risktoo dramatically? And don’t forget traders who have troubleassuming even the lowest levels of risk. Then again, the best“attitude” in the world won’t salvage a haphazard tradingplan.
This month features several articles that stress the role oftrade exits, risk control and psychology in a winning tradingapproach. They offer a range of perspectives on one of themore complex areas of trading: the balance between risk andpsychology — how to match your trading personality with therisk demands of the markets and use techniques that promoteyour trading goals instead of undercutting them.
Most strategy articles focus on where to enter a trade. In“Holding on to your profits” (p. 42), trader David Baker right-ly points out that exiting a trade successfully is more than halfthe trading battle and shows how a simple, price-sensitivetrailing stop technique can help accomplish this goal on anytime frame.
“Analyzing the cringe curve” (p. 76) looks not so much atthe mechanics of placing stop orders but at our ability to honorand execute them. Author Daryl Guppy navigates the psycho-logical twists and turns we take as a loss increases in size, andhow to better match your risk level with your ability to execute
trades.Most discussions of risk control involve
ways of minimizing risk. But for sometraders, the inability to assume more risk(depending on the circumstances) is almostas much of a problem as not being able tohandle any risk. In “Mind over money man-agement” (p. 72), Dr. Ari Kiev looks at thisless-discussed aspect of the risk-psychologyproblem — one that prevents many tradersfrom taking their careers to the next level.
In “Acting vs. reacting” (p. 88), senioreditor Thomas Stridsman looks at howeffective risk control and money manage-ment is built on the ability to be proactive— to operate with a plan instead of a seriesof ad hoc responses to events. He illustratesthis point by analyzing two approaches oftrader Joe DiNapoli that allow short-termtraders to establish stop levels and price tar-gets in advance.
In the Trading Basics section, Stan Kimdiscusses the ongoing educational process
of trading (“Riding the learning curve,” p. 82), and howtraders can avoid the two most common mistakes and usetheir experience to improve bottom-line results.
Our Trading Strategies section features an analysis of chartpatterns by noted analyst Martin Pring (see p. 34). Find outhow simple one-and two-bar price patterns can offer cluesabout short-term momentum moves.
Very few traders are able to operate completely on autopilot,removing themselves from the stress of the market and disen-gaging from their emotions. One 20-year veteran trader Irecently spoke to surprised me by saying, despite years of con-sistent profitability, he found trading as stressful as when hefirst started. What he had learned to do was accept the risk andstress that goes with trading — managing his emotions ratherthan attempting to ignore or overpower them — in the frame-work of his trading and money management plan.
Mark Etzkorn, Editor-in-chief
Anyone who has
made the switch from
paper trading to real
trading, or increased
their trading size,
knows the mind games
that accompany
putting money at risk.
EDITOR’SNote
Striking a B A L A N C E
THIS MONTH’S Contributors▼ Martin J. Pring is editor of a number of monthly publications, including theIntermarket Review and the Traders Daily Fix. He is author of Technical Analysis Explainedand a pioneer in the development of multimedia CD-ROM tutorials on technical. Pring’sbooks, CDs and videos are available at www.pring.com. Free streaming educational mul-timedia presentations, articles, charts and online chart books are also pro v i d e d .
▼ David Baker is a professional day trader and the president ofStrategic Traders (www.strategictraders.com), a nightly educationand selection service designed to help short-term traders developstrategies for each day. He has been a featured analyst onBizNewsOne Television (KJLA) and featured as one of 12 traders inThe Best: Conversations with Top Traders (M. Gordon Publishing,2000). He can be reached at davidb@strategic traders.com.
▼ Tushar Chande is president of LongView Capital Management LLC ([email protected]). He is author of Beyond Technical Analysis (2001, 2nd Edition) and The NewTechnical Trader (1994), both published by John Wiley & Sons. A prominent innovator intechnical analysis, his indicators such as VIDYA, CMO and AROON are now includedin many technical analysis packages.
▼ M. Rogan LaBier is a former Nasdaq market maker, sales-trader, registered principalof Terra Nova Trading and head trader at MB Trading. Currently he is CEO of RocketTrading (www.rockettrading.com), a company catering to high-end “hyper-active” daytraders. He is also author of The Tools of the Trade, the best-selling e-book about trade exe-cution. The Nasdaq Traders’ Toolkit, published by John Wiley & Sons in December 2000, is
the updated hardcover version of this book.
▼ Stan Kim has been trading full time since 1994 and is a frequentspeaker at investment and trading seminars. He also does privateconsulting and mentoring on a limited basis. His book Never TradeIn The Tail of the Snail is scheduled to be published this year. Heholds an MBAfrom UCLA. Kim can be contacted via his Web site atwww.snailtrader.com.
▼ Daryl Guppy is a private equity and derivatives trader. He is the author of MarketTrading Tactics, Share Trading and Chart Trading. He speaks regularlyon trading in Australia and Asia. He can be contacted viawww.guppytraders.com.
▼ Ari Kiev, M.D. is a trading coach and management consultant toseveral trading firms in New York. His latest book is Trading in theZone: Maximizing Performance with Focus and Discipline. His firstbook was Trading to Win: The Psychology of Mastering the Markets.
▼ Erik S. Hadik is president of INSIIDE Track Trading (www.insi-idetrack.com) and editor of INSIIDE Track newsletter and the Weekly Re-Lay fax/e-mailservice. He is also author of Eric Hadik’s Tech Tip Reference Library — a 120-page col-lection of indicators he has taught since 1989.
▼ Robert A. Green is a CPA and his firm, GreenTraderTax.com, con-sults traders on tax solutions, reviews or prepares their tax returnsand sets up business entities and retirementplans. For more information or help about thisand other trader tax matters, visit www.greentradertax.com or www.tradertax.com. ContactGreen at [email protected].
▼ Gary L. Tilkin is president of Global Forex Trading, an onlineForex dealer. He can be reached via www.gftltd.com,[email protected] or (800) 465-4373.
ACTIVE TRADER • June 2001 • www.activetradermag.com 3
4 www.activetradermag.com • June 2001 • ACTIVE TRADER
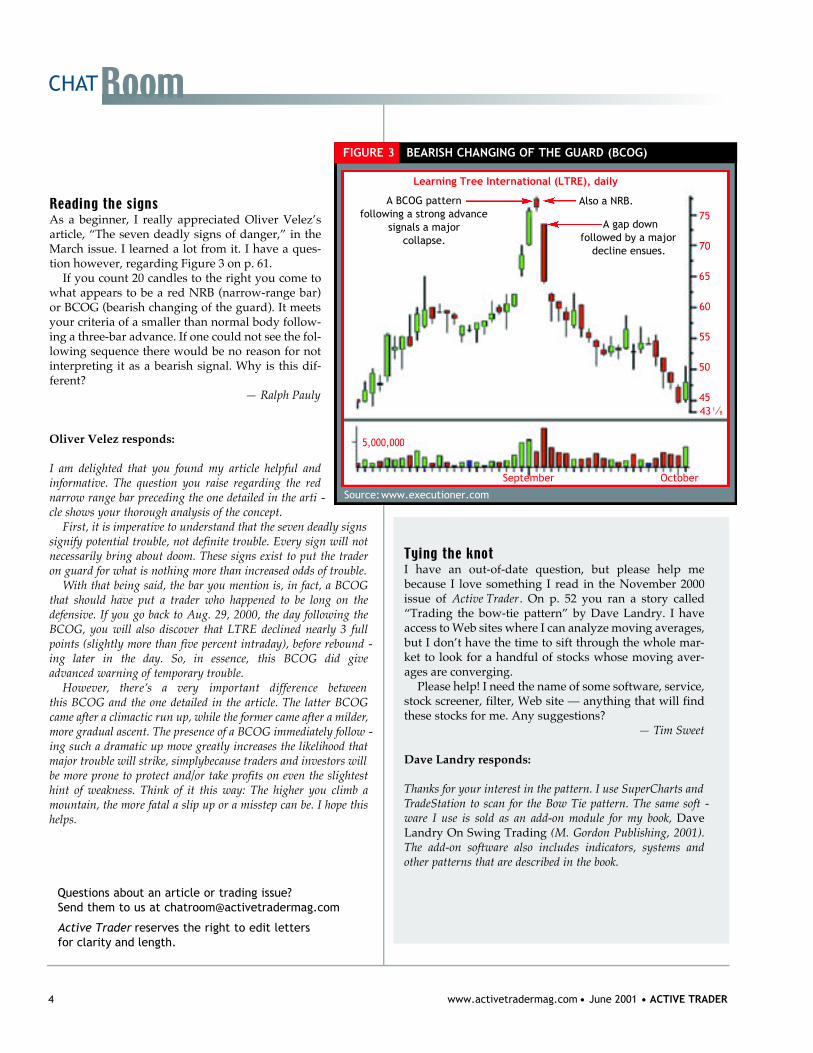
As a beginner, I really appreciated Oliver Velez’sarticle, “The seven deadly signs of danger,” in theMarch issue. I learned a lot from it. I have a ques-tion however, regarding Figure 3 on p. 61.
If you count 20 candles to the right you come towhat appears to be a red NRB (narrow-range bar)or BCOG (bearish changing of the guard). It meetsyour criteria of a smaller than normal body follow-ing a three-bar advance. If one could not see the fol-lowing sequence there would be no reason for notinterpreting it as a bearish signal. Why is this dif-ferent?
— Ralph Pauly
Oliver Velez responds:
I am delighted that you found my article helpful andinformative. The question you raise regarding the rednarrow range bar preceding the one detailed in the arti -cle shows your thorough analysis of the concept.
First, it is imperative to understand that the seven deadly signssignify potential trouble, not definite trouble. Every sign will notnecessarily bring about doom. These signs exist to put the traderon guard for what is nothing more than increased odds of trouble.
With that being said, the bar you mention is, in fact, a BCOGthat should have put a trader who happened to be long on thedefensive. If you go back to Aug. 29, 2000, the day following theBCOG, you will also discover that LTRE declined nearly 3 fullpoints (slightly more than five percent intraday), before rebound -ing later in the day. So, in essence, this BCOG did giveadvanced warning of temporary trouble.
H o w e v e r, there ’s a very important difference betweenthis BCOG and the one detailed in the article. The latter BCOGcame after a climactic run up, while the former came after a milder,more gradual ascent. The presence of a BCOG immediately follow -ing such a dramatic up move greatly increases the likelihood thatmajor trouble will strike, simplybecause traders and investors willbe more prone to protect and/or take profits on even the slightesthint of weakness. Think of it this way: The higher you climb amountain, the more fatal a slip up or a misstep can be. I hope thishelps.
Questions about an article or trading issue? Send them to us at [email protected]
Active Trader reserves the right to edit letters for clarity and length.
I have an out-of-date question, but please help mebecause I love something I read in the November 2000issue of Active Trader. On p. 52 you ran a story called“Trading the bow-tie pattern” by Dave Landry. I haveaccess to Web sites where I can analyze moving averages,but I don’t have the time to sift through the whole mar-ket to look for a handful of stocks whose moving aver-ages are converging.
Please help! I need the name of some software, service,stock screener, filter, Web site — anything that will findthese stocks for me. Any suggestions?
— Tim Sweet
Dave Landry responds:
Thanks for your interest in the pattern. I use SuperCharts andTradeStation to scan for the Bow Tie pattern. The same soft -ware I use is sold as an add-on module for my book, DaveLandry On Swing Trading (M. Gordon Publishing, 2001).The add-on software also includes indicators, systems andother patterns that are described in the book.
FIGURE 3 BEARISH CHANGING OF THE GUARD (BCOG)
Source: www.executioner.com
75
70
65
60
55
50
45
September October
Learning Tree International (LTRE), daily
A BCOG pattern following a strong advance
signals a major collapse.
A gap downfollowed by a major
decline ensues.
Also a NRB.
5,000,000
43 1⁄8
CHATRoom

ACTIVE TRADER • June 2001 • www.activetradermag.com 5
INSIDE THE Market BY JEFF PONCZAK
The newest feature
Hey, let me tell you about…
W ith the trading land-scape changing virtuallyevery day, direct-accesscompanies are realizing
the need to adapt with it. One thing thathas changed drastically in the past yearor so is how direct-access firms promotethemselves.
“Director of marketing” — a positionnot found on every direct-access firm’spayroll a year ago — is now a given, andsome companies have even hired outsidefirms to supplement their own market-ing programs.
Most direct-access brokers haveadvertised in various financial publica-tions. However, more firms are findingthat while advertising will get people toknow they exist, it takes marketing totruly get the message across to traders.
Indeed, the ability to stand out is cru-cial in today’s marketplace. Because alld i rect-access brokers provide essentiallythe same service (they allow traders tobypass the middleman, often pro v i d i n ginstant execution), each company musts t ress the little things that set it apart.
Many firms promote their educationalprograms. Others claim they have supe-rior customer service, and still others(most companies, actually) are alwaystouting the latest bell or whistle theyhave added to their platforms.
At the recent Online Trading Expo in
New York City, dozens of dire c t - a c c e s sfirms displayed their wares. While mostshow attendees were savvy enough toknow the diff e rence between dire c t -access trading and using a standardonline bro k e r, the expo provided anopportunity for firms to show thou-sands of potential customers the littled i ff e rences that make their companiesu n i q u e .
“What you really have to do is edu-cate,” says Ross Ditlove, CEO of MBTrading. “You have to take a step back-wards and teach them how it started,what direct-access really is to the indus-try today, and then tell them the differ-ence [between you and other firms].”
One firm that decided to have somefun in New York was On-Site Trading —the company used an Austin Powerslook-alike to draw people in. The carica-ture was well done and it certainly drewattention to On-Site Trading.
“It’s a branding issue as much as any-thing else,” says the company’s presi-dent Gary Mednick. “We’re very cog-nizant of that. We know we’re probablyat the end of a growth cycle, and nowwe’re entering the second phase.
“The first phase was [aimed at get-ting] customers to know about [ourproduct]. Now they know about it, so aswe get through the second growth cycle,branding is going to be very key.”
Such concentrated marketing cam-paigns are a far cry from the industry’sonce-popular technique of dressing ayoung, buxom blonde in a tight shirt anda low skirt and placing her in front of acompany’s booth.
“I could never imagine stooping tothat level and present the company in away that we’re not,” Ditlove says. “Weknow exactly who we want to be; weknow exactly who we want as clients,and hopefully the two meet.”
Of course, all the marketing in theworld won’t do any good unless thecompany has something to back it up.
“There are a lot of firms popping up,and lately, a lot have been going out ofbusiness,” says Tradescape CEO OmarAmanet. “It’s one thing to recreate thetechnology, but it’s quite a different thingto recreate the business processes sur-rounding the technology.”
For companies that have yet to put al a rge amount of time and money into mar-keting, positive word-of-mouth — howmany companies have thrived over thepast few years — remains a key part of suc-c e s s .
“We’ve done very little in terms ofmarketing and advertising,” says KyleZ a s k y, president of Edgetrade.com.“We’ve grown organically because peo-ple who become our customers are reallygood about referrals.”Ý
6 www.activetradermag.com • June 2001 • ACTIVE TRADER
INSIDE THE MarketAmeriTradeCast?
Casting another line in the direct-access pond
T he sound heard ru s h i n gthrough the trading worldin mid-February was directaccess moving into the
mainstream again. On Feb. 14, onlinebroker Ameritrade bought direct-accessfirm TradeCast, becoming the latest “tra-ditional” online broker to enter theworld of direct access.
Ameritrade purchased Houston-based TradeCast for 7.5 million shares ofAmeritrade stock, plus the possibility for750,000 more based on TradeCast’s suc-cess. The move comes in the wake ofDatek’s announcement that it wouldoffer direct-access trading and an agree-ment between E-Trade and direct-accessfirm A.B. Watley, and just before CharlesSchwab began offering dire c t - a c c e s strading (see “Schwab does it again,”opposite page). Schwab purc h a s e dd i rect-access firm CyBerCorp inFebruary 2000.
“ We feel they have one of the top plat-forms in the industry,” says A m e r i t r a d echief information officer Jim Ditmore .“They have a very good managementteam, and we’re very comfortable withtheir business-to-business strategy. Thosew e re the three big things.”
Ameritrade had been interested inentering the direct-access area for quitesome time, while Tradecast had beenactively pursuing a partner among main-stream online brokers.
“We talked to a lot of players over the
last year,” says TradeCast founder andpresident Bobby Earthman. “We wentwith Ameritrade mainly because of [its]interest in what we were doing on thebusiness-to-business space.
“It was a real good fit. I don’t thinkthere’s a broker on the Street that’s goingto have the combinationof the infrastructure andcosts of Ameritrade andthe technology ofTradeCast,” he says.
TradeCast’s business-to-business agenda includeslicensing TradeCast toinstitutions and other trad-ing firms. While there areh u n d reds of companiesi n t e rested in using dire c t -access software, there are only a handful offirms providing the technology.
“Ameritrade is a good householdbrand, but it’s not something people useon Wall Street,” Earthman says. “Yo uwant the whole array of that pro f e s s i o n a lspace to be using your product. You wantmoney managers, investment advisors,p roprietary trading firms, day tradingfirms. We ’ re going to keep the high-endactive brand called TradeCast. I thinkstrategically that’s very important.”
TradeCast will function as an inde-pendent business unit and will beadding clearing services thro u g hAdvanced Clearing, a division ofAmeritrade.
“Most of the impetus for the deal wasto get new clients in a strategic seg-ment,” Ditmore says. “We are re a l l ylooking at becoming a significant force inthe pro segment, and we feel thatTradeCast is an excellent launching plat-form for that. But TradeCast and
Ameritrade are very dif-f e rent platforms, and[keeping highly activeAmeritrade customers]has not been an over-whelming impetus forus.”
Still, there are ani n c reasing number ofactive traders at the tra-ditional online firms —traders who might be
tempted to leave their existing broker forone of the direct-access variety. WhileAmeritrade is accustomed to battlingother online brokers for their share of theinvesting public, the battle for activetraders is beginning to heat up.
“This was a space that wasn’t reallylooked at by the big players, but now thebig players are having to adopt itbecause it’s eating their best customers,”Earthman says. “There’s going to be abig battle among the Schwabs, E-Tradesand Ameritrades. There will be someother players, but we’re going to be thedominant player in that game. There’sno doubt in my mind.”Ý
ACTIVE TRADER • June 2001 • www.activetradermag.com 7
INSIDE THE Market
In mid-March, Charles Schwab be-came the latest online broker tov e n t u re into the world of dire c ta c c e s s .
Yes, that Charles Schwab. The one thatpaid almost $500 million for dire c t -access firm CyBerCorp in February 2000.However, Schwab is confident its intro-duction of Street Smart Pro makes per-fect sense.
“ We see Schwab and CyBerCorp coex-isting side-by-side,” says Beth Stelluto,Schwab’s senior vice president of A c t i v eTrader Marketing. “[Street Smart Pro] isreally designed for customers who aretrading actively but are looking muchm o re at a portfolio view of what they’redoing and looking for investment re t u r n sto enhance their overall portfolio.
“CyBerCorp is much more on the high-ly active end of the trading continuum.It’s targeting folks who are using tradingstrategies for equities and options anddoing their trading for current income.”
C u r re n t l y, Schwab and CyBerCorpexist as different companies. A traderwishing to use both firms must have twoaccounts. While Schwab has hundreds ofcustomers who do just that, it wanted tocreate a separate system to make it easi-er for certain traders to take advantageof direct access without going throughthe hassle of opening a new account.
“[Many] people wanted to do theirtrading with Schwab but wanted to takeadvantage of some of these advancedtools and technologies that were availableat CyBerCorp,” says Jim Hawn, vice pre s-ident of Electronic Brokerage at Schwab.“ N o w, if I placed a trade in Street SmartP ro, I could contact my Schwab accountrep and they would see the trade. Theycan’t see CyBerCorp trades.”
Schwab used CyBerTrader as the basisfor Street Smart Pro, using suchCyBerCorp technology as Level II,s t reaming news, interactive charting,and time and sales.
“Prior to the acquisition of CyBerCorp,we had extensive plans to move into thisa rea of providing streaming quotes and
news and more robust charting,” Hawnsays. “The acquisition allowed us to dra-matically reduce our time to market,because we were able to leverage theirengineering talent as well as technologythat CyBerCorp had pioneere d .
“It would be wrong to say that we justcloned CyBerTrader. [We...] went out toour customers and asked them whatthey needed. [We...] also went out to cus-tomers of mainline competitors and
asked them what their needs were. Wetook those and put together a productdevelopment agenda that we worked onwith CyBerCorp. That allowed us tobasically customize a product that wast a rgeted to Schwab customers andpotential Schwab customers.”
Customers must make at least 10trades per month and have a minimumequity level of $50,000 to be eligible touse Street Smart Pro.Ý
A recent J.P. Morgan studyshowed that an active tradercan accrue yearly commis-sion fees totaling between
$75,000 and $100,000. A new planunveiled by direct-access firmTradescape may be able to take a bite outof that number.
Under the plan, any Tradescape cus-tomer who places a limit order androutes it through MarketXT — the ECNowned by Tradescape — will receive arebate of one penny per share. That’s $10per 1,000 shares. A standard Tradescapecommission is $7.95.
“That’s what the next wave of compe-tition is going to be — price in the direct-access space,” says Tradescape CEOOmar Amanet. “An average active trad-er who uses Tradescape and makes [hisor her] trades through MarketXT [andaverages 1,000 shares per transaction]will receive $120,000 back. That willbring down the transaction costs, and ifyou bring that down, incrementally, vol-ume will explode.”
And volume is what MarketXT needs.While about 300 million shares tradet h rough Tradescape daily, MarketXTaverages only 5 million shares per day.Island, the No. 1 volume ECN, routinely
trades 200 million shares per day.Because of ECN transaction fees,
Tradescape will still be able to makemoney, even when giving a rebate to cus-tomers using MarketXT. ECNs chargebrokers a fee when they put an order inthe system. MarketXT will charge bro-kers a half-cent per share, while institu-tional traders will be charged 1.5 cents.While Tradescape could lose money if aretail order is matched by a bro k e r,Amanet says that happens only in aboutone percent of all trades.
MarketXT is an “active” ECN, mean-ing it will search through the otherECNs, SOES and SelectNet to determinethe best price for a particular stock, thenroute the trade to that destination.Ý
Get paid to trade
A penny for your shares
Direct access x2
Schwab does it again
8 www.activetradermag.com • June 2001 • ACTIVE TRADER
INSIDE THE Market
• • • • • • • • QUICK SCALPS • • • • • • • • QUICK SCALPS
IT’S A MATCH▼ CheMatch.com, a chemical industry exchange, has partnered with the Chicago Mercantile Exchange and will be thefirst B2B hub to offer online futures trading to individual investors. CheMatch hopes to have the service available bymid-year.
Although CheMatch is not licensed by the Commodity Futures Trading Commission, it will route its business through Globex,avoiding the need for CFTC sanctioning. In return, the CME gets CheMatch’s product line.
INDICATIONS ARE…▼ The Chicago Fed in early March introduced a new monthly economic indicator, the Chicago Fed National ActivityIndex. It is a weighted average of 85 existing monthly indicators taken from five categories: output and income;employment, unemployment and hours; personal consumption, housing starts and sales; manufacturing and trade sales;and inventories and orders.
The index is designed to provide an indication of current and future economic activity and inflation. It will usually bereleased during the first week of a new month, and it will be listed in the Active Trader Trading Calendar.
SENDING A MESSAGE▼ A federal court ruling handed down in mid-February makes it easier for anonymous Internet message board postersto express their opinions. A judge ruled that Global Telemedia International could not sue a group of anonymous postersfor derogatory comments they made about the company. The judge ruled that the posts were opinions, not facts, andtherefore not libelous.
David Carter, the presiding judge, wrote, “The postings [in question] are full of hyperbole, invective, short-hand phrasesand language not generally found in fact-based documents, such as corporate press releases or SEC filings.”
A STREAM JOB▼ Online brokerage firm Datek has unveiled a new streaming quote service that gives free, real-time information fromECNs. The Streamer ECN, which is available to all traders even if they are not Datek clients, provides streaming dataand real-time quotes from ECNs such as Island, REDIBook and Archipelago. More information is available at www.stream-er.com.
A NASDAQ MESS▼ A snafu in the trading of Nasdaq stock Axcelis Technologies in late February has a group of day traders up in arms.After someone accidentally entered the wrong price when making an offer, the price of the stock shot up to $93. It hadbeen trading in the $10 range since October of 1999. Nasdaq couldn’t halt trading, so they voided any trades that weremade when the stock was trading at more than $22.
Five Texas-based day traders who sold short when the stock was going up, then exited their trades at $19, are furious.Since the short sale transaction was voided, they are stuck with shares of Axcelis at $19, almost double its market value.
A BAD RECOMMENDATION▼ Noted Merrill Lynch analyst Henry Blodget made a name for himself during the tech run up of the last few years.Blodget was extremely bullish on the sector and gained notoriety when he issued a $1,000 price target on Qualcomm inlate 1999.
However, when the tech bubble burst, so did Blodget’s favorite stocks. One investor who got burned in the mess is tak-ing Blodget to arbitration. He bought 4,600 shares of InfoSpace Inc. at around $125 a share and held it in a rapidly declin-ing market because Blodget maintained a “buy” recommendation on the stock. The stock was trading at about $3.50 inmid-March.
The arbitration filing alleges that Blodget’s rating was primarily because Merrill Lynch had a connection with InfoSpaceand the success of the stock helped Merrill’s investment banking division.
PENNIES FROM NASDAQ▼ The SEC approved a pair of Nasdaq rules on a one-year, pilot basis. Both rules are modifications of old rules causedby Nasdaq’s conversion to decimals. The modified Manning Rules state that any market maker who intends to stepahead of a customer order must improve price by at least a penny. This applies to all stocks, regardless of price (the oldrule depended on whether a stock was priced above or below $10). Likewise, the new short sale rule states that shortsales must be done on a downtick of at least one cent.
The Nasdaq must provide the SEC with a report on trading activity under the new rules when the pilot program ends.
ACTIVE TRADER • June 2001 • www.activetradermag.com 9
INSIDE THE Market
Not so super
Doubting SuperMontage
W hile the coming of Sup-erMontage, Nasdaq’s newquotation and executionsystem, is inevitable (see
“ A Super day for Nasdaq,” Active Tr a d e r,April 2001, p. 15), there is still somedebate over whether the plan will be ben-eficial to traders.
The latest to chime in on the anti-SuperMontage side of the discussion isTodd Eyler of research and analysis firmForrester Research. In a note entitled,“Investors need an alternative to Su-perMontage,” Eyler thinks SuperMon-tage will cause a greater dependence onE l e c t ronic Communication Networks(ECNs).
Eyler doesn’t think SuperMontagewill provide the best price, as it won’tprevent internalization — where a bro-
ker sends an order to an in-house marketmaker rather than routing it to anothermarket maker who may have a betterprice — or payment for order flow. Also,writes Eyler, “Investor orders will stillflow through broker-dealers, who willretain the ability to buy or sell ahead oflarge investor orders and generate risk-f ree trading profits at investors’expense.”
Eyler is also concerned about Nasdaq’ssloppy track re c o rd when it comes totechnological re l i a b i l i t y. He points outhow the exchange delayed decimaliza-tion because of technological concerns.
“ With SuperMontage, Nasdaq willbecome the central point of trade execu-tion — and failure — for all Nasdaq stocktrades, even though its SelectNet ord e rrouting system remains unre l i a b l e . ”
Eyler also believes SuperMontage isanti-competitive, saying, “Since 1997,when ECNs began to compete againstdealers, bid-ask spreads for Nasdaqstocks have fallen by 30 percent. TheSuperMontage plan directly thre a t e n sthe ECN’s survival by consolidating allof their order books and centralizingtrade execution.”
Eyler’s prediction: Traders will adaptand find ways to bypass SuperMontageby using direct-access software to tradethrough ECNs and avoid Nasdaq entire-ly, and institutions will take an equitystake in ECNs.
“ To ensure re p resentation of theirinterests,” Eyler says, “smart investorswill become equity investors in leadingECNs — similar to what A m e r i c a nCentury has done with Archipelago.”Ý
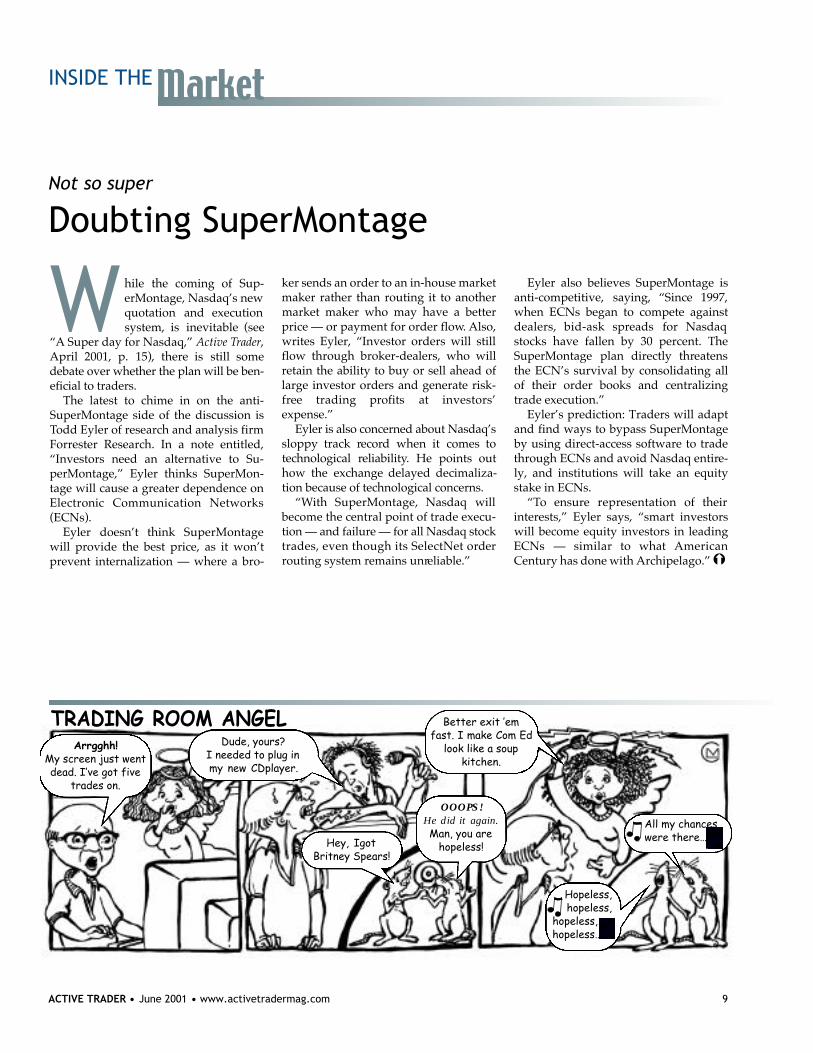
Better exit ’em fast. I make Com Ed
look like a soupkitchen.
Dude, yours? I needed to plug inmy new CDplayer.
Hey, Igot Britney Spears!
OOOPS! He did it again.Man, you are
hopeless!
Hopeless, hopeless,
hopeless, hopeless…
All my chanceswere there…
Arrgghh! My screen just wentdead. I’ve got five
trades on.
TRADING ROOM ANGEL
10 www.activetradermag.com • June 2001 • ACTIVE TRADER
INSIDE THE Market
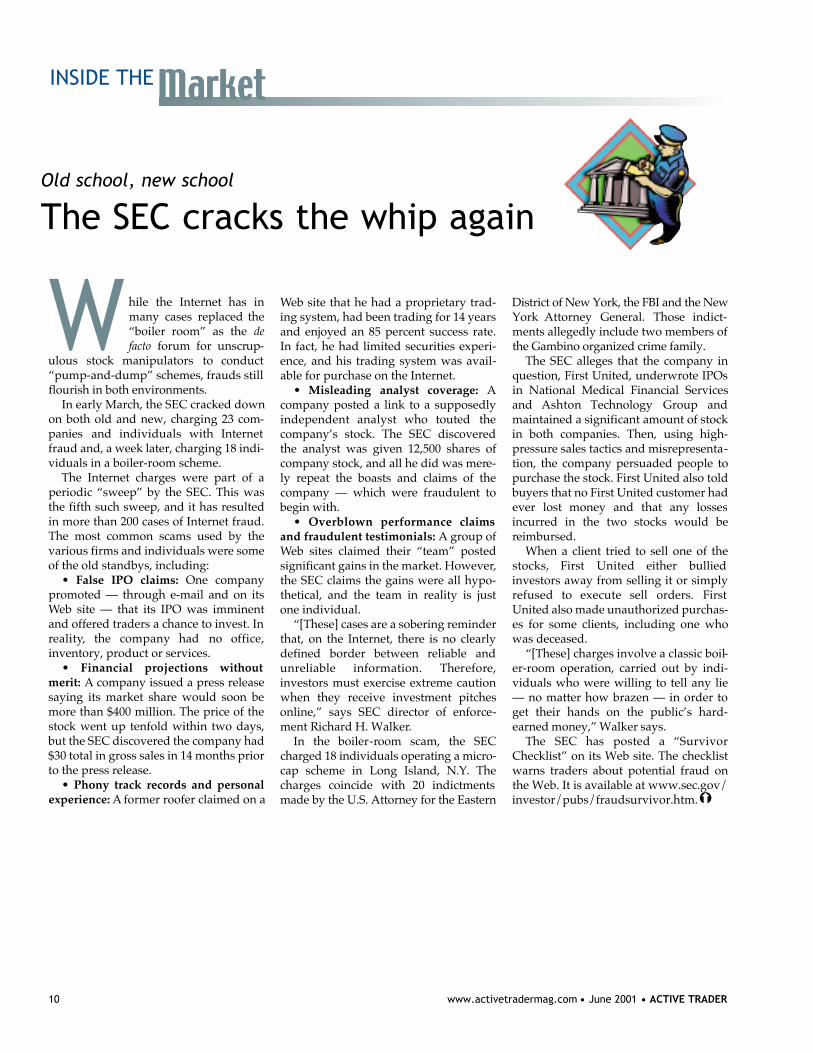
Old school, new school
The SEC cracks the whip again
W hile the Internet has inmany cases replaced the“boiler room” as the d ef a c t o f o rum for unscru p-
ulous stock manipulators to conduct“pump-and-dump” schemes, frauds stillflourish in both enviro n m e n t s .
In early March, the SEC cracked downon both old and new, charging 23 com-panies and individuals with Internetfraud and, a week later, charging 18 indi-viduals in a boiler-room scheme.
The Internet charges were part of aperiodic “sweep” by the SEC. This wasthe fifth such sweep, and it has resultedin more than 200 cases of Internet fraud.The most common scams used by thevarious firms and individuals were someof the old standbys, including:
• False IPO claims: One companypromoted — through e-mail and on itsWeb site — that its IPO was imminentand offered traders a chance to invest. Inre a l i t y, the company had no off i c e ,inventory, product or services.
• Financial projections withoutmerit: A company issued a press releasesaying its market share would soon bemore than $400 million. The price of thestock went up tenfold within two days,but the SEC discovered the company had$30 total in gross sales in 14 months priorto the press release.
• Phony track records and personalexperience: A former roofer claimed on a
Web site that he had a proprietary trad-ing system, had been trading for 14 yearsand enjoyed an 85 percent success rate.In fact, he had limited securities experi-ence, and his trading system was avail-able for purchase on the Internet.
• Misleading analyst coverage: Acompany posted a link to a supposedlyindependent analyst who touted thecompany’s stock. The SEC discoveredthe analyst was given 12,500 shares ofcompany stock, and all he did was mere-ly repeat the boasts and claims of thecompany — which were fraudulent tobegin with.
• Overblown performance claimsand fraudulent testimonials: A group ofWeb sites claimed their “team” postedsignificant gains in the market. However,the SEC claims the gains were all hypo-thetical, and the team in reality is justone individual.
“[These] cases are a sobering reminderthat, on the Internet, there is no clearlydefined border between reliable andu n reliable information. There f o re ,investors must exercise extreme cautionwhen they receive investment pitchesonline,” says SEC director of enforce-ment Richard H. Walker.
In the boiler- room scam, the SECc h a rged 18 individuals operating a micro-cap scheme in Long Island, N.Y. Thec h a rges coincide with 20 indictmentsmade by the U.S. Attorney for the Eastern
District of New York, the FBI and the NewYork Attorney General. Those indict-ments allegedly include two members ofthe Gambino organized crime family.
The SEC alleges that the company inquestion, First United, underwrote IPOsin National Medical Financial Servicesand Ashton Technology Group andmaintained a significant amount of stockin both companies. Then, using high-pressure sales tactics and misrepresenta-tion, the company persuaded people topurchase the stock. First United also toldbuyers that no First United customer hadever lost money and that any lossesincurred in the two stocks would bereimbursed.
When a client tried to sell one of thestocks, First United either bulliedinvestors away from selling it or simplyrefused to execute sell orders. FirstUnited also made unauthorized purchas-es for some clients, including one whowas deceased.
“[These] charges involve a classic boil-er-room operation, carried out by indi-viduals who were willing to tell any lie— no matter how brazen — in order toget their hands on the public’s hard-earned money,” Walker says.
The SEC has posted a “SurvivorChecklist” on its Web site. The checklistwarns traders about potential fraud onthe Web. It is available at www.sec.gov/investor/pubs/fraudsurvivor.htm.Ý
Last month, we looked at the origins of
direct-access trading. In part two of a three-
part series, we’ll discuss how new Order
Handling Rules changed the trading land -
scape by allowing the creation of Electronic
Communications Networks (ECNs) and
giving individual traders the chance to
trade directly with the exchanges, creating
the boom in short-term trading.
I n the mid 1990s, “SOES Bandits”using early direct-access technolo-gy in day-trading rooms wereenjoying success picking off mar-
ket makers who were slow to updatetheir quotes on the Nasdaq’s SmallOrder Execution System. However, theywere the fortunate ones. For the averageindividual stock trader, the only optionwas to call their broker on the phone,who would then route the order to aNasdaq market maker.
H o w e v e r, there was a pro b l e m .Traders claimed — and the Securitiesand Exchange Commission (SEC) lateragreed — that market makers were arti-ficially inflating spreads for their ownprofit. As a result, the SEC created newrules (the Order Handling Rules) con-cerning the trading of Nasdaq stocks inthe fall of 1996. They went into effect inJanuary 1997.
Among other things, the new rulesallowed for the creation of “AlternativeTrading Systems.” This led to the origi-
nal ECNs, and trading as most peopleknew it changed forever.
However, there was some confusion— and some concern — when the ruleswere first announced. Initially, the SECpresented several rules but did not spec-ify which ones would eventually takeaffect. And, before it was made clear thatECNs would be allowed, not everybodyhad an optimistic take on the future.
“We thought the world of SOES trad-ing was coming to an end with thelaunch of the order handling rules,” saysOmar Amanet, founder and CEO ofd i rect-access firm Tr a d e s c a p e . c o m“From an early insider’s perspective, itwas widely viewed as the death of daytrading. But what ended up happeningis that the order handling rules led to thelaunch of ECNs, and what we didn’trealize back then was that the real bene-fit we derived out of SOES was automat-ed execution, which up until that pointwasn’t present anywhere else.”
Once the SEC clarified things, trading
would never be the same.“The rules were pretty clear,” says
Stuart Townsend, who along with wifeMarrGwen founded Townsend A n a-lytics, a pioneering firm in the annals ofdirect-access trading. “However, I don’tthink anyone understood what the realramifications were.”
The ramifications were that, for thefirst time, traders would be able to usealternate systems to trade stocks, systemsthat would allow them to avoid the mid-dleman and trade directly with othermarket participants. Instinet, an ECNformed in the late 1960s, already pro v i d-ed that service to institutions — and theSEC hoped the new rules would accentu-ate Instinet’s impact. However, there wasno similar system for individual traders.
That was about to change. Four ECNsw e re formed in early 1997 includingIsland and A rchipelago, the major play-ers in today’s retail ECN arena. ECNsdon’t function exactly like brokers — thatis, an individual trader doesn’t send an
ACTIVE TRADER • June 2001 • www.activetradermag.com 11
INSIDE THE Market
A whole new ballgame
1 9 9 7 : ECNs open up the playing field
12 www.activetradermag.com • June 2001 • ACTIVE TRADER
o rder directly to an ECN. Rather, certainb rokers have access to ECNs, and ord e r ssent through that broker can be routed toan ECN, bypassing the exchange.
A rchipelago — which was created inl a rge part thanks to technology pro v i d e dby Townsend Analytics — and Islandwork diff e re n t l y. Island is a matchingECN. It executes trades, often instanta-n e o u s l y, in its order book. A rchipelago isan “active” ECN. It uses a pro p r i e t a r ylogarithm to search out the best price,whether that be on an ECN or thro u g hNasdaq’s SOES or SelectNet.
There is some debate over which ECN— Archipelago or Island — was mostcrucial to the development of short-termtrading, but there’s no question thatdirect-access trading would not be possi-ble without them.
“When we argued that we should beallowed to do this, the first thing every-body said was, ‘You have no liquidity,’”MarrGwen Townsend says. “And wesaid, ‘We only need one customer, andwe’ll get them the best price.’ The SECwas persuaded, and I think that waswhat really revolutionized the stockmarket. We had a program that automat-ically searched out the best price.”
Besides Townsend, CyBerCorp was amajor player early in the world of direct
access.“Island came to us and a few of the
other software developers and asked usto write software that would connect oursoftware to theirs so there would bemore liquidity,” recalls CyBerCorp exec-utive vice president Butch Jones.
“It was kind of a two-way street,” saysCyBerCorp founder Philip Berber. “Theyneeded the flow of orders from the typesof traders our software was serving. Wecould see that this was a new world, andyou no longer needed to go throughNasdaq to get your Nasdaq orders exe-cuted. In the spirit of innovation, wecould see that to interface these ECNswas both good for our technology andalso good for our customers.”
Apparently, the trading world agreed.There are currently 10 ECNs, and in 2000Island matched more than 53 billionshares.
“Island really set the standard ,because they had the fastest matchingsystem, the most liquidity,” CyBerCorpCOO Greg Farris says. “They were theones that on the ECN front really brokethe ground.”
Still, since the SOES Bandits wereenjoying success without the use ofECNs, the technology was a bit slow tocatch on. Archipelago, when it was first
formed, did not even have its ownemployees — they leased them from atrading firm.
“But gradually (traders) saw theadvantages of trading on Archipelago,”Stuart Townsend says. “Even more thanthe SOES traders, some of the larger pro-prietary groups started to use it becauseof the execution quality. Once they start-ed using it, there was enough liquidityand enough action and then the daytraders started using it more.”
Barely two years after the creation ofECNs, direct-access trading became anational phenomenon. Goldman Sachsand E-Trade, sensing the changing at-m o s p h e re, invested in A rc h i p e l a g o .People quit their jobs to try their hand attrading, and a raging bull market fueledthe fire.
“If you look at [direct-access trading]over a three- or five-year horizon, youcouldn’t anticipate the growth,” Berbersays. “But on a year-to-year basis, it wasabsolutely on plan. The trends we antici-pated in the marketplace and the growthopportunities were exactly in line withwhat we had predicted.”
Still, in 1997, no one could have fore-seen what would happen in February2000. Charles Schwab, a traditional WallStreet firm, purchased CyBerCorp in adeal valued at almost $500 million.
“[Two years] or so ago, we thought itwas inevitable that direct access wouldbe embraced and used by a much broad-er type of online trader/investor, ”Berber says. “That’s what took us downthe path of seeking strategic partners,which led to the acquisition. We wereseeking to position CyBerCorp optimal-ly, given the inevitability of the trend.”
D i rect access has since become aneven bigger piece of the mainstre a mtrading pie (see “Casting another line inthe direct-access pond,” p. 14 and““Schwab does it again,” p. 15), and anentire industry — Web sites, books, mag-azines — has emerged from it.
It’s important to remember, though,that direct-access trading is still less thanfive years old. In the final installment ofthe series, we’ll look at what the futuremay bring for the technology and theindustry.Ý
INSIDE THE Market
The pioneers
Back in January 1997, the market wasn’t flooded with direct-access firms.In the early days of online day trading, you could practically count theplayers on one hand.
The earliest direct-access firms were familiar names: Townsend, CyBerCorpand TradeCast provided most of the software and technology to fledgling com-panies looking to enter the direct-access business. More than four years later,while the number of direct-access brokers has increased exponentially, thenumber of software providers hasn’t.
Townsend, through its RealTick product, provides dozens of firms with direct-access software. CyBerCorp and Tradecast are also still big players in the soft-ware game, and each have a successful brokerage as well (Townsend is not abroker, although it has long been affiliated with Terra Nova Trading). Tradescapehas been successful at both aspects even though it didn’t enter the scene untilmonths after its competitors.
Tradescape CEO Omar Amanet began his financial software career withCyberCorp founder Philip Berber. Amanet eventually went on his own to formTradescape in May of 1997, and initially targeted only well-experienced, high-net-worth traders. Eventually, he branched out to include newer traders, andtoday his company is the No. 1 direct-access broker from a volume standpoint.
ACTIVE TRADER • June 2001 • www.activetradermag.com 13
A primary reason Electr o n i cCommunications Networks(ECNs) such as Island andA rchipelago have become so
popular is the market efficiency they provide.By matching buyers directly with sellers,ECNs reduce the cost of trading and increaseprofit potential for individual traders.
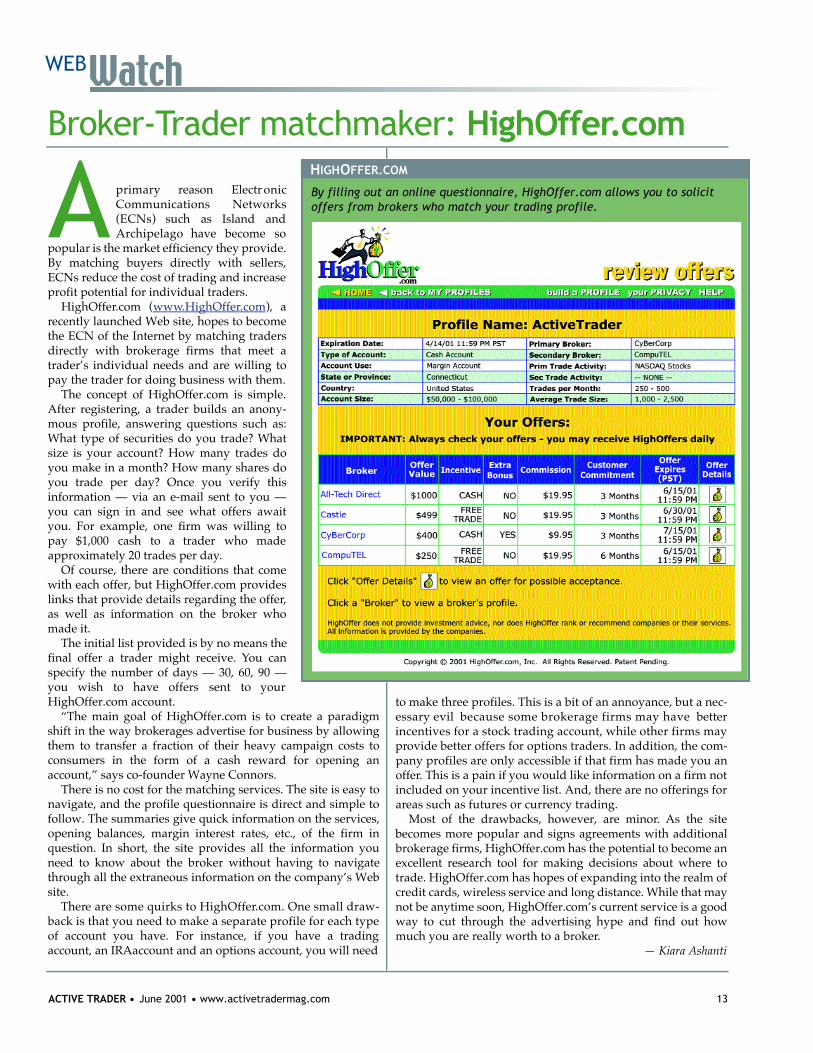
H i g h O ff e r.com (w w w. H i g h O ff e r. c o m), arecently launched Web site, hopes to becomethe ECN of the Internet by matching tradersdirectly with brokerage firms that meet atrader’s individual needs and are willing topay the trader for doing business with them.
The concept of HighOffer.com is simple.After registering, a trader builds an anony-mous profile, answering questions such as:What type of securities do you trade? Whatsize is your account? How many trades doyou make in a month? How many shares doyou trade per day? Once you verify thisinformation — via an e-mail sent to you —you can sign in and see what offers awaityou. For example, one firm was willing topay $1,000 cash to a trader who madeapproximately 20 trades per day.
Of course, there are conditions that comewith each offer, but HighOffer.com provideslinks that provide details regarding the offer,as well as information on the broker whomade it.
The initial list provided is by no means thefinal offer a trader might receive. You canspecify the number of days — 30, 60, 90 —you wish to have offers sent to yourHighOffer.com account.
“The main goal of HighOffer.com is to create a paradigmshift in the way brokerages advertise for business by allowingthem to transfer a fraction of their heavy campaign costs toconsumers in the form of a cash reward for opening anaccount,” says co-founder Wayne Connors.
There is no cost for the matching services. The site is easy tonavigate, and the profile questionnaire is direct and simple tofollow. The summaries give quick information on the services,opening balances, margin interest rates, etc., of the firm inquestion. In short, the site provides all the information youneed to know about the broker without having to navigatethrough all the extraneous information on the company’s Website.
T h e re are some quirks to HighOff e r.com. One small draw-back is that you need to make a separate profile for each typeof account you have. For instance, if you have a tradingaccount, an IRAaccount and an options account, you will need
to make three profiles. This is a bit of an annoyance, but a nec-essary evil because some brokerage firms may have betterincentives for a stock trading account, while other firms mayp rovide better offers for options traders. In addition, the com-pany profiles are only accessible if that firm has made you ano ff e r. This is a pain if you would like information on a firm notincluded on your incentive list. And, there are no offerings fora reas such as futures or currency trading.
Most of the drawbacks, however, are minor. As the sitebecomes more popular and signs agreements with additionalbrokerage firms, HighOffer.com has the potential to become anexcellent research tool for making decisions about where totrade. HighOffer.com has hopes of expanding into the realm ofcredit cards, wireless service and long distance. While that maynot be anytime soon, HighOffer.com’s current service is a goodway to cut through the advertising hype and find out howmuch you are really worth to a broker.
— Kiara Ashanti
WEBWatchB r o k e r - Trader matchmaker: H i g h O f f e r. c o m
HIGHOFFER.COM
By filling out an online questionnaire, HighOffer.com allows you to solicitoffers from brokers who match your trading profile.
14 www.activetradermag.com • June 2001 • ACTIVE TRADER
REVIEWED BY KIARA ASHANTI
A nother day-trading guide is hardly something tomake your head turn in your local Barnes & Noble.Nonetheless, if you want a book that examinesnearly every possible aspect of this business, then
Les Masonson’s book, Day Trading on the Edge, is for you. Thebook features material by Masonson as well as chapters writ-ten by various industry professionals (including material fromActive Trader by Gibbons Burke).
Let’s be clear on a few things first, however. Day Trading on the
E d g e is not for those with a casual interest in trading. If you wantsuccess stories and “anyone can do this” fluff, look elsewhere. Thisis a book for people who wish to become professional traders. Thebook reads more like a textbook than the typical checklist of thingsto consider before joining the day-trading ranks.
Day Trading on the Edge is broken down into five parts.Section one outlines day trading, the history of the industry,basic characteristics of day traders and statistics regarding thedemographics of traders and their success rate. This part of thebook, which is full of numbers and surveys, is quite dry andwill likely disappoint any starry-eyed, wannabe traders whopicked the book up because of its enticing title. One interestingdiscovery according to a survey included in the book is that themajority of active traders are between the ages of 31 and 41,
dispelling the belief that this is ayoung person’s game. Section two covers nuts-and-bolts top-ics such as where to trade, what you need for a home office andhow to select a broker.
Section three covers money management, trading psycholo-gy and taxes. This is where Day Trading on the Edge s e p a r a t e sitself from other trading books. Chapter 8, “Trading to MakeMoney” by John Piper, and Chapter 10, “Money Management”by Ryan Jones, are worth the price of the book themselves. Piperdiscusses what he calls the “trading pyramid” — the psycho-logical base of becoming a successful trader. Jones intro d u c e sthe fixed-ratio method of money management. Essentially themethod re q u i res that the same amount of profits be generatedfor each increase in units (shares, contracts, etc.,) being tradedprior to increasing to an additional unit. For example, if youstart trading $10,000 with one unit, you would not increase totwo units until your account increases to $20,000. Section thre eends with Ted Tesser discussing ways on preventing all themoney you plan on making from going to the government.
Section four consists of interviews with traders and CEOs ofday-trading firms. Masonson essentially asks the same questionsof each person, providing diff e rent perspectives on subjects suchas: if it’s possible to trade profitably part-time; risk capital mini-mums; and common mistakes of beginning traders. Ad i ff e rent orexpanded set of interview questions would have off e red a gre a tdeal more information than is given here .
Day Trading on the Edge ends with an SEC report titled“Regulatory Findings on the Day-trading Industry,” and a CEOinterview that basically rips apart the whole notion of day trad-ing. It is clear the Masonson wanted to write a book that coverseverything a person is likely to encounter as a professional dayt r a d e r, and he does a nearly masterful job. If you can gett h rough the first 68 pages or so, you will find a great deal of use-ful material to consider before you attempt to trade for a liv-i n g .Ý
TRADER’SBookshelf
Day Trading on the Edge By Les N. MasonsonAMACOM Books, 2001Hardcover, 367 pages$29.95
Day trading can be dangerous to your wealth if you are not
fully prepared mentally, financially, and educationally.
ACTIVE TRADER • June 2001 • www.activetradermag.com 15
NEWProducts
▼ TraderProfile, from TraderProfile LLC, is a tool that recordsand maintains a database of allthe trades a user makes eachday, without manual input. Fora review of each trade, the usercan call up a daily and intra-day stock chart with the entryand exit transactions plottedd i rectly over the chart.Tr a d e r P rofile performs morethan 23 automated analyses ofpersonal trading performance,such as how well the traderdoes when going long strongvs. weak stocks, or how wellovernights have performed vs.day trades. It also includes anend-of-day charting packageoptimized for day traders. On-
Site Trading Inc. (www.onsitetrading.com) is the first broker to supportTraderProfile. More information is available at www.traderprofile.com.
▼ Tradetrek.com’s Money Trek is a tech-nical trading training tool for both begin-ning and experienced online investorsand traders. It lets users practice makingtrading decisions based on technicalindicators and is designed to improvetheir chart reading and trading skills.Money Trek keeps track of paper tradingactivities, so the user can gauge his orher moves against the market and others.Tradetrek offers three versions of MoneyTrek: Interday Trek is available now, freeof charge; at press time, Intraday Trekand Portfolio Trek had not yet beenreleased but will be available forTradetrek.com’s paying subscribers. Form o re information go towww.tradetrek.com
▼ Appian Graphics, provider of extend-ed desktop technology, recently releasedAppian Hurricane, part of a new line ofgraphics cards based on ATI’s Radeongraphics accelerator. With 32MB of DDRRAM and ATI’s new RADEON VEgraphics pro c e s s o r, the A p p i a nHurricane is capable of dual-screen reso-lution up to 1600x1200x16bpp at 75Hz.The Appian Hurricane offers one DVIand one analog output and comes with aDVI-to-analog adapter. The card comeswith Appian’s HydraVision desktop-management software and theAppianXtras suite. With the PCI-formatcard (unreleased at press time), userswill be able to power up to 16 displayswith eight Appian Hurricanes (sevenPCI, one AGP). The Appian HurricaneAGP version is available for a suggestedretail price of $199. For more informa-tion, visit www.appian.com
▼ Street Falcon Inc. has introduced as o f t w a re aimed at helping individualinvestors manage stock portfolios by col-lecting information from a customer’ sonline brokerage accounts, analyzing riskand calculating appropriate diversifica-tion. Street Falcon also tracks prices,splits, dividends and dividend re i n v e s t-ments for each stock from the date of pur-chase to the most recent quote. Three ver-sions are available: Street FalconS t a n d a rd tracks a portfolio from multipleonline accounts, minimizes tax exposure ,calculates returns, synchronizes transac-tions and tracks purchases of new lotst h rough dividend reinvestment. Stre e tFalcon Professional builds on theS t a n d a rd version with: risk-adjustedreturn calculation, assessment andadjustment of risk levels, portfolio opti-mization and hidden trading cost detec-tion. Street Falcon Gold has all the fea-t u res of the Professional version, but alsolets the investor check skill factor. To pur-chase the software or for more informa-tion, go to www. s t reetfalcon.com. A f re edemo version is also available.
16 www.activetradermag.com • June 2001 • ACTIVE TRADER
▼ eCharts.com (www.echarts.com), a free educationaltechnical analysis web site from Equis InternationalInc., is now online. Features include: current invest-ment information and articles; the MetaStock OnlineJava Chart Applet with access to Reuters Data; theTrader Optimization Profile (T.O.P.) by trading coachMark Douglas; the eCharts HotStocks Report; currentcommentary from top names in the industry; discus-sion group forums; tips; events calendar; and a learn-ing library.
▼ T r a d e C a s t has introduced version 4.1of TradeCast Elite. Upgrades includeadditional dire c t - o rder entries, the abilityto place reserve orders, total keyboardcustomization, enhanced SelectNet pre f-e rencing and multiple direct-ECN ord e rd e l i v e r y. In addition, Elite will allowusers to send trades through the IslandECN. And, TradeScout, Tr a d e C a s t ’ ss m a r t - o rder routing system, will nowautomatically send orders to dire c t - c o n-nect or “active” ECNs. More informationis available at www. t r a d e c a s t . c o m .
▼ Hold Brothers launched its Grayboxs o f t w a re trading system for activetraders. Highlights of the system include:Asuper ECN key that will send orders toall ECNs at a specific price; the ability tosend multiple orders to all market mak-ers and ECNs at multiple prices; the abil-ity to place an order at the top of an ECNbook with a single keystroke; smart ord e rrouting and an integrated ECN ord e rbook. More information is available atw w w. h o l d b ro t h e r s . c o m .
▼ Charles Schwab changed its option-pricing structure and will charge a flatrate based on a trader’s market activityand the size of the transaction. The newpricing structure will most benefit activetraders who take advantage of Schwab’se l e c t ronic channels. Detailed informa-tion is available at www.schwab.com.
▼ Online broker Web Street has teamedwith Xigo Inc. to allow its customers toreceive personalized news and eventsalerts, and technical alerts, courtesy ofXigo. Among the notifications Web Streetcustomers can receive are: analyst rec-ommendations, company news, price,volume and P/E ratio targets, real-timenews and end-of-day summaries. Moreinformation can be found at www.web-street.com and www.xigo.com.
▼ Rina Systems recently announcedPortfolioStream, a portfolio testing andoptimization platform for TradeStation.P o r t f o l i o S t ream tests large baskets ofstocks, futures or indices across severaltrading system input combinations in acompletely automated enviro n m e n t .Studies of systems can run across thesebaskets, generate reports for each sys-tem/market combination and each port-folio. Reports can be filtered and sortedfor user defined performance criteria tofind desirable strategies and portfolios.Users can choose money managementstrategies to test portfolios with differentposition size and capitalization. Form o re information visit www. r i n a s y s-tems.com.
NEWProducts
Send your new product information to: Amy Brader, Managing Editor, or Jeff Ponczak, Associate Editor Active Trader Magazine • 555 West Madison, Suite 1210 • Chicago, IL 60661 • Fax: (312) 775-5423
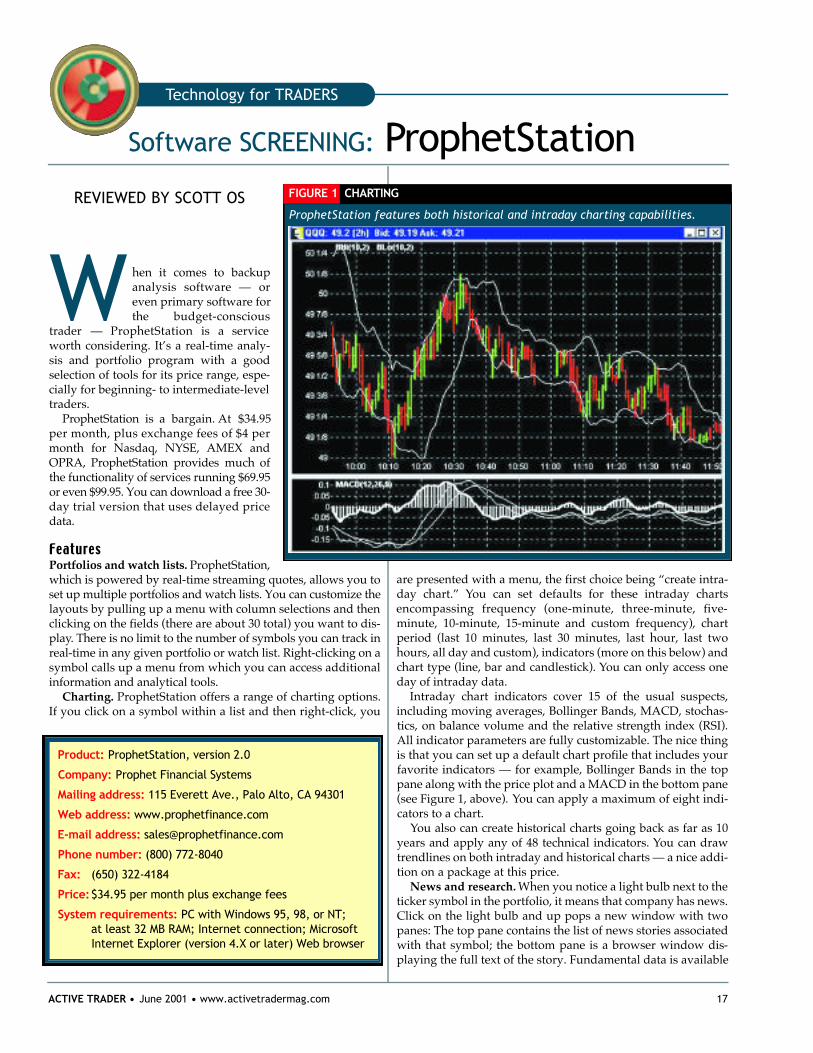
REVIEWED BY SCOTT OS
W hen it comes to backupanalysis software — oreven primary software forthe budget-conscious
trader — ProphetStation is a serviceworth considering. It’s a real-time analy-sis and portfolio program with a goodselection of tools for its price range, espe-cially for beginning- to intermediate-leveltraders.
P rophetStation is a bargain. At $34.95per month, plus exchange fees of $4 permonth for Nasdaq, NYSE, AMEX andOPRA, ProphetStation provides much ofthe functionality of services running $69.95or even $99.95. You can download a free 30-day trial version that uses delayed priced a t a .
Portfolios and watch lists. P ro p h e t S t a t i o n ,which is powered by real-time streaming quotes, allows you toset up multiple portfolios and watch lists. You can customize thelayouts by pulling up a menu with column selections and thenclicking on the fields (there are about 30 total) you want to dis-p l a y. There is no limit to the number of symbols you can track inreal-time in any given portfolio or watch list. Right-clicking on asymbol calls up a menu from which you can access additionalinformation and analytical tools.
Charting. ProphetStation offers a range of charting options.If you click on a symbol within a list and then right-click, you
are presented with a menu, the first choice being “create intra-day chart.” You can set defaults for these intraday chartsencompassing frequency (one-minute, three-minute, five-minute, 10-minute, 15-minute and custom frequency), chartperiod (last 10 minutes, last 30 minutes, last hour, last twohours, all day and custom), indicators (more on this below) andchart type (line, bar and candlestick). You can only access oneday of intraday data.
Intraday chart indicators cover 15 of the usual suspects,including moving averages, Bollinger Bands, MACD, stochas-tics, on balance volume and the relative strength index (RSI).All indicator parameters are fully customizable. The nice thingis that you can set up a default chart profile that includes yourfavorite indicators — for example, Bollinger Bands in the toppane along with the price plot and a MACD in the bottom pane(see Figure 1, above). You can apply a maximum of eight indi-cators to a chart.
You also can create historical charts going back as far as 10years and apply any of 48 technical indicators. You can drawtrendlines on both intraday and historical charts — a nice addi-tion on a package at this price.
News and research. When you notice a light bulb next to theticker symbol in the portfolio, it means that company has news.Click on the light bulb and up pops a new window with twopanes: The top pane contains the list of news stories associatedwith that symbol; the bottom pane is a browser window dis-playing the full text of the story. Fundamental data is available
ACTIVE TRADER • June 2001 • www.activetradermag.com 17
Technology for TRADERS
Software S C R E E N I N G: Pr o p h e t S t a t i o n
ProphetStation features both historical and intraday charting capabilities.
FIGURE 1 CHART I N G
P r o d u c t : ProphetStation, version 2.0
C o m p a n y : Prophet Financial Systems
Mailing address: 115 Everett Ave., Palo Alto, CA 94301
Web address: w w w. p r o p h e t f i n a n c e . c o m
E-mail address: s a l e s @ p r o p h e t f i n a n c e . c o m
Phone number: (800) 772-8040
Fa x : (650) 322-4184
P r i c e :$34.95 per month plus exchange fees
System requirements: PC with Windows 95, 98, or NT; at least 32 MB RAM; Internet connection; Microsoft Internet Explorer (version 4.X or later) Web browser

f rom Yahoo, and a complete set of reports from Zack’sInvestment Research is available as well.
A l e r t s . The alert capabilities are relatively complete for ap roduct at this price level. They include the ability to pull up awindow given certain circumstances (using as a trigger priceaction, news events or any column value in a portfolio), the abil-ity to highlight the row containing the symbol, audio alerts and,most importantly, e-mail alerts. If you have a pager or cell phonewith an e-mail address, you can configure ProphetStation toalert that device when a wide range of conditions are met.
Other features. One of the program’s coolest features is acolumn inside the portfolio that displays a miniature version ofthe chart for each symbol (see Figure 2, above). Obviously, achart of this size isn’t useful for technical analysis, but if youwant to see a particular symbol’s trend over the day, a quickglance is all it takes.
P rophetStation also contains a separate ticker along the top ofthe portfolio pane that displays index data. You may select fro ma range of indices or specify other markets you want to track.
Nasdaq Level II is limited at this point to the Island book.There is a menu item for streaming Archipelago quotes, but theconnection didn’t work.
ProphetStation is easy to learn and use. It takes up a relatively
small amount of memory on your system so you can run it andany number of other applications simultaneously withoutadverse effects.
Using the software was easy. Creating multiple-window work-spaces is a simple process and changing technical indicatorsre q u i res a simple point and click. Right-clicks control most of theaction. If you right-click on a symbol within a portfolio, you canaccess charts, alerts and re s e a rch for that symbol. If you right-click within a chart, all of the chart variables such as fre q u e n c y,chart period and indicators are available for modification.
The software had a few glitches, as do many streaming-quote platforms. When setting up an intraday chart in approx-imately one-quarter of a 19-inch display, using a one-minutefrequency setting and anything greater than a 240-minute chartperiod, the plot got blurry. It looked like the bars were beingplotted too close together to make them out. A solution to thisis to set the chart period to a value less than four hours. (Aninquiry to ProphetStation’s technical support e-mail addressgenerated the response that they were aware of and workingon the problem and a fix would be released soon.) The newrelease was not available at press time, but that kind ofresponse from a technical support department is what wewould like to see more often from vendors.
Also, the separate index ticker bar at the top of the portfolio isonly updated once every 60 seconds. This means the index dataisn’t actually real-time. To work around this just enter the indexd i rectly into your portfolio. That way the index will be updatedin real-time from the same source as the rest of the symbols.
Data. The quote and chart performance are good, and thedata appeared to be high quality. (Prophet Financial, the makerof ProphetStation, is known for the quality of its data, which italso sells in a number of end-of-day formats). One of the prob-lems with some streaming-quote applications is the quality ofthe data. A few bad data points can throw off your analysis andyour trading.
Despite its minor drawbacks, ProphetStation is a solid re a l - t i m eanalysis platform for traders who do not need Level II quotes oradvanced analysis features. Like other streaming quote pro-grams, it has a few bugs, but for its price, it’s a winner.Ý
SOFTWARE SUMMARY
Product: ProphetStation
What it is: Real-time analysis platform with streaming quotes, charting, alerts and watch lists
Who the product is for: Stock, futures, option and mutual fund traders
Skill level: Beginner to intermediate
Upside: Relatively inexpensive; program uses few system resources; good selection of analysis tools (including a “trend” chart that is visible within a portfolio)
Downside: No Level II quotes (Island book only)
18 www.activetradermag.com • June 2001 • ACTIVE TRADER
ProphetStation’s quote screen allows you to monitor a wide range of data on your favorite stocks, including intraday“trend charts” (seventh column from the left).
FIGURE 2 PORTFOLIO TRACKING
BY MARTIN PRING
I t is accepted among techniciansthat prices in all markets at alltimes are determined by psychol-ogy rather than fundamentals.
Garfield Drew, a well-known technicianin the 1940s, put it best when he said,“Stocks do not sell for what they areworth, but for what people think theyare worth.”
How else could you explain the phe-nomenal rise of the so-called “nifty-fifty”growth stocks in the late 1960s? Thesestocks flew up to incredible valuationsby the start of the 1973-74 bear market.Even though most of the companies con-tinued to increase earnings during the1970s, few exceeded their 1973 highsuntil the 1980s.
Such examples indicate that it is notearnings that drive prices, but the atti-tude of traders and investors to thoseearnings. Fortunately for market techni-cians, specific price patterns and forma-tions often provide vital clues that senti-ment is changing.
Most people are familiar with patternssuch as the head-and-shoulders, trian-gles, rectangles and so on, which arelonger-term chart formations. For short-er-term traders, price patterns that formover the course of just one or two barsoften identify reversal points. These
used to be called one- and two-day pat-terns, but with the advent of intradaycharts, one- and two-“bar” is moreappropriate.
One factor that influences the signifi-cance of a pattern is its size or length.Because one- and two-bar patterns donot take very long to form, they have, bydefinition, only short-term significance.For example, under normal circ u m-stances a one-day pattern would only beexpected to affect price over a five- to 15-day period. A two-bar pattern on a 10-minute bar chart would influence thetrend over the course of the next 50 to 60minutes or so. However, these kinds ofpatterns can reliably signal short-termtrend reversals.
We will concentrate on four short-term patterns: inside bars, outside bars,key reversal bars and two-bar reversals.To begin, let’s establish the key reasonsthese patterns are useful. First, they gen-erally reflect exhaustion points and areassociated with reversals of the prevail-ing trend. In an uptrend, they developwhen buyers have temporarily pushedprices up too far and, in a sense, need arest; in a downtrend, they form whenthere is little, if any, supply because sell -
ers have finished liquidating their hold-ings.
Second, for these formations to bee ffective there must be something toreverse. This means top patterns shouldbe preceded by meaningful rallies andbottom formations should be precededby sharp sell-offs.
It is important to interpret these pat-terns not so much in black-and-whiteterms, but in shades of gray. In otherwords, not all patterns are created equal.Some show all of the typical characteris-tics of the pattern in a clear-cut manner.Others will reflect only a few characteris-tics in a mild way. Consequently, whatwe may call a “five-star” pattern — onethat clearly displays the full range ofcharacteristics — is more likely to resultin a strong reversal than, say, a “two-star” pattern with mild characteristics.Always use common sense when inter-preting these patterns; don’t immediate-ly conclude the presence of one of theseformations guarantees a quick, pro f-itable price reversal.
The first pattern we will look at is theoutside bar.
Outside bars are those for which thetrading range totally encompasses that
ACTIVE TRADER • June 2001 • www.activetradermag.com 19
O N E - and T W O - B A Rprice patternsFor short-term trading, a few one- and two-bar patterns can be among the most useful tools you can use. Find out how to identify reversal points with these simple formations.
TRADING Strategies
20 www.activetradermag.com • June 2001 • ACTIVE TRADER
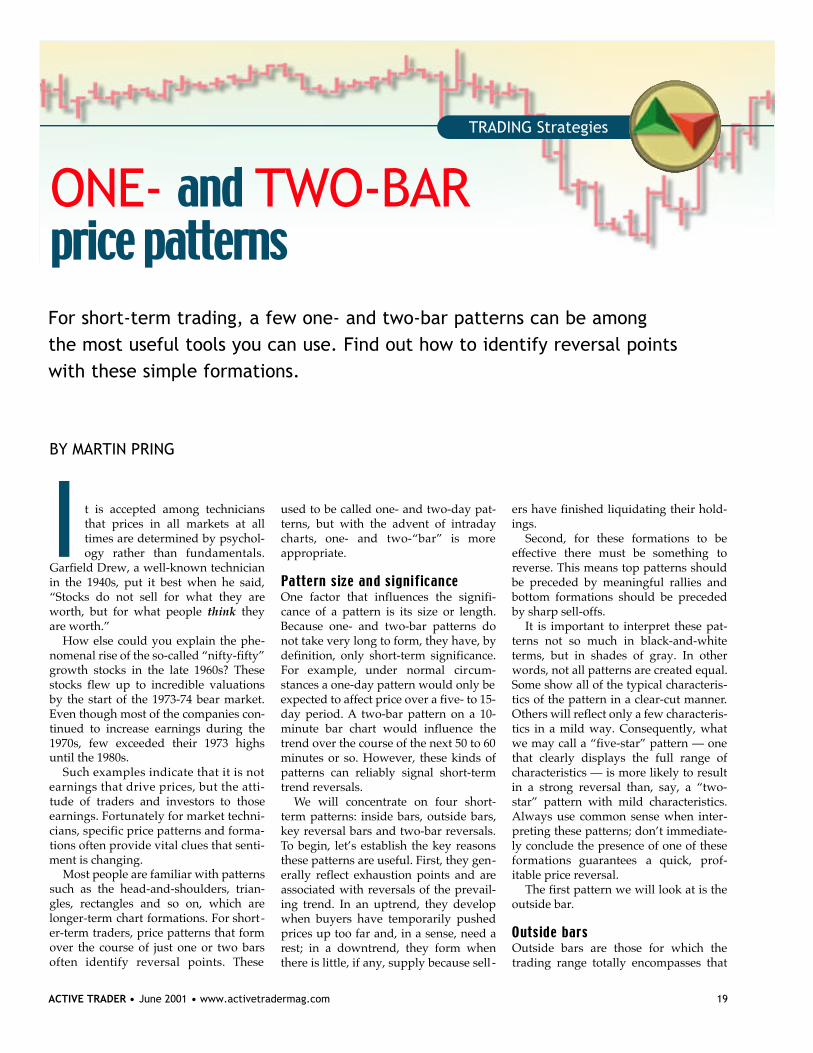
of the previous bar. This patternwill appear after both down-trends and uptrends, and is astrong signal of exhaustion. InFigure 1, notice the persistentdowntrend on the afternoon ofMarch 20. At 4:20 p.m., an out-side bar encompassed the previ-ous bar and formed the lowpoint for the move. This outsidebar was a strong indication ofdemand because it opened nearits low and closed almost at itshigh. Note also the high volumethat accompanied it.
Although Figure 1 is an excel-lent example of a outside-barreversal pattern, again re m e m-ber that any chart pattern shouldbe interpreted in shades of grayrather than black and white.Some patterns offer clearer signsof exhaustion than others. Theastute technician searches foradditional clues to determine thed e g ree of exhaustion in a partic-ular reversal pattern. Consider anon-market situation: You couldsimply s a y the word “help,” butif you shout “help!” from therooftop, you will get the mes-sage out far more clearly thatyou need help. The same princi-ple operates in the market.
What are the clues, then? Thewider the bar, the stronger thesignal. If the outside bar encom-passes the trading range ofthree or four bars it is likely, allelse being equal, to be more sig-nificant than if it barely encom-passes one bar, and so on.
In Figure 1, the outside barre p resents a five-star signalbecause it has all the character-istics of a strong reversal: morethan one bar was encompassed,a significant volume rise accom-panied the outside bar and thetrading action immediatelyafter the outside bar occurredon low volume, indicating there was nonew heavy selling pressure.
Still, a caveat is necessary: Not all one-and two-bar patterns are followed byreversals. As technical traders we arealways dealing in probabilities, nevercertainties. This means that outside bars,along with other technical patterns, can
and do fail from time to time. Alwaysuse stop-loss orders to protect yourself.
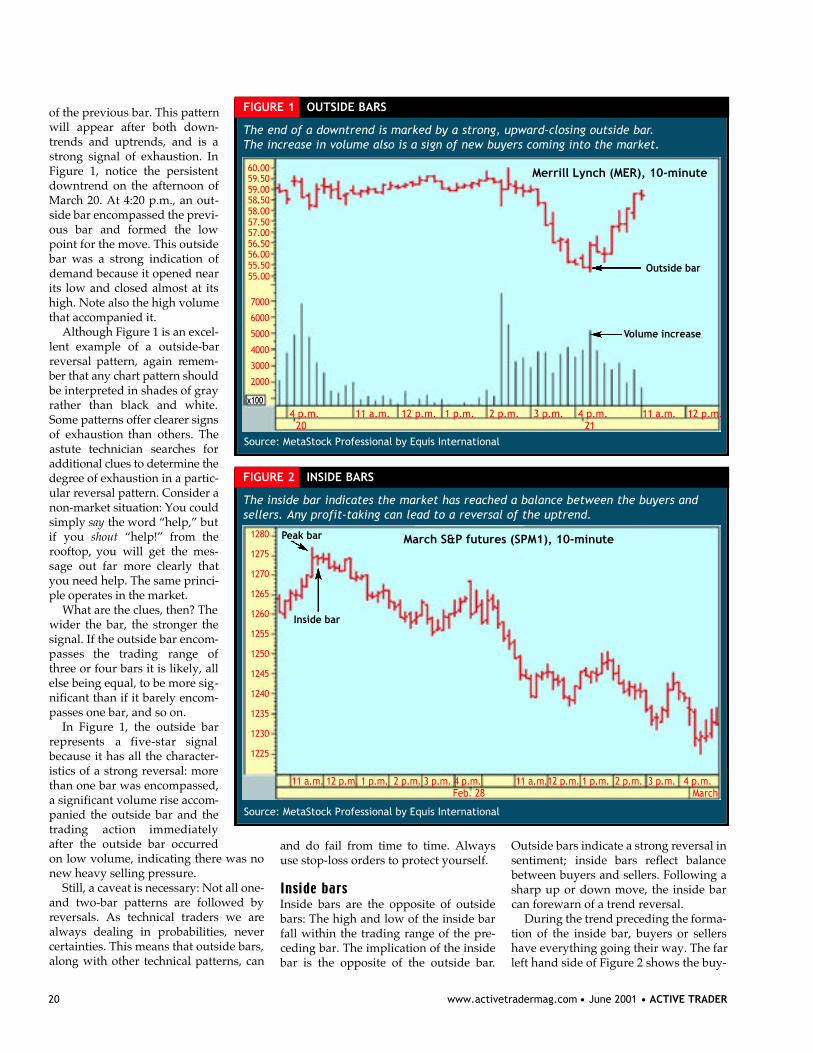
Inside bars are the opposite of outsidebars: The high and low of the inside barfall within the trading range of the pre-ceding bar. The implication of the insidebar is the opposite of the outside bar.
Outside bars indicate a strong reversal insentiment; inside bars reflect balancebetween buyers and sellers. Following asharp up or down move, the inside barcan forewarn of a trend reversal.
During the trend preceding the forma-tion of the inside bar, buyers or sellershave everything going their way. The farleft hand side of Figure 2 shows the buy-
The inside bar indicates the market has reached a balance between the buyers andsellers. Any profit-taking can lead to a reversal of the uptrend.
FIGURE 2 INSIDE BARS
March S&P futures (SPM1), 10-minutePeak bar
Inside bar
11 a.m. 12 p.m. 1 p.m. 2 p.m. 3 p.m. 4 p.m. 11 a.m.12 p.m. 1 p.m. 2 p.m. 3 p.m. 4 p.m.Feb. 28 March
1 2 8 0
1 2 7 5
1 2 7 0
1 2 6 5
1 2 6 0
1 2 5 5
1 2 5 0
1 2 4 5
1 2 4 0
1 2 3 5
1 2 3 0
1 2 2 5
Source: MetaStock Professional by Equis International
The end of a downtrend is marked by a strong, upward-closing outside bar.The increase in volume also is a sign of new buyers coming into the market.
FIGURE 1 OUTSIDE BARS
Merrill Lynch (MER), 10-minute
Outside bar
Volume increase
4 p.m. 11 a.m. 12 p.m. 1 p.m. 2 p.m. 3 p.m. 4 p.m. 11 a.m. 12 p.m.20 2 1
6 0 . 0 05 9 . 5 05 9 . 0 05 8 . 5 05 8 . 0 05 7 . 5 05 7 . 0 05 6 . 5 05 6 . 0 05 5 . 5 05 5 . 0 0
7 0 0 0
6 0 0 0
5 0 0 0
4 0 0 0
3 0 0 0
2 0 0 0
x 1 0 0
Source: MetaStock Professional by Equis International
ACTIVE TRADER • June 2001 • www.activetradermag.com 21
ers are in charge. Following thepeak bar, the development ofthe inside bar is significantbecause it suggests the markethas reached a balance betweenbuyers and sellers. This bal-anced state can be enough toentice longs to lock in profits. Ifthey do this en masse, a short-term reversal is the result.
T h ree key characteristics givethe inside-bar pattern power.First, the pattern should be pre-ceded by a sharp up move ordown move. Second, the tradingrange of the first bar (the bar pre-ceding the inside bar) should bequite wide relative to pre v i o u sbars. The wide bar indicates thes t rong, underlying momentumof the prevailing trend hasreached a climax. Finally, thetrading range of the inside barshould be much smaller than thep receding bar, which indicatesbuyers and sellers are now muchm o re evenly matched. As aguideline, the sharper the con-trast between the two bars, theg reater the potential for re v e r s a l .The greater the number of afore-mentioned elements, the higherthe probability the pattern is sig-naling a change in tre n d .
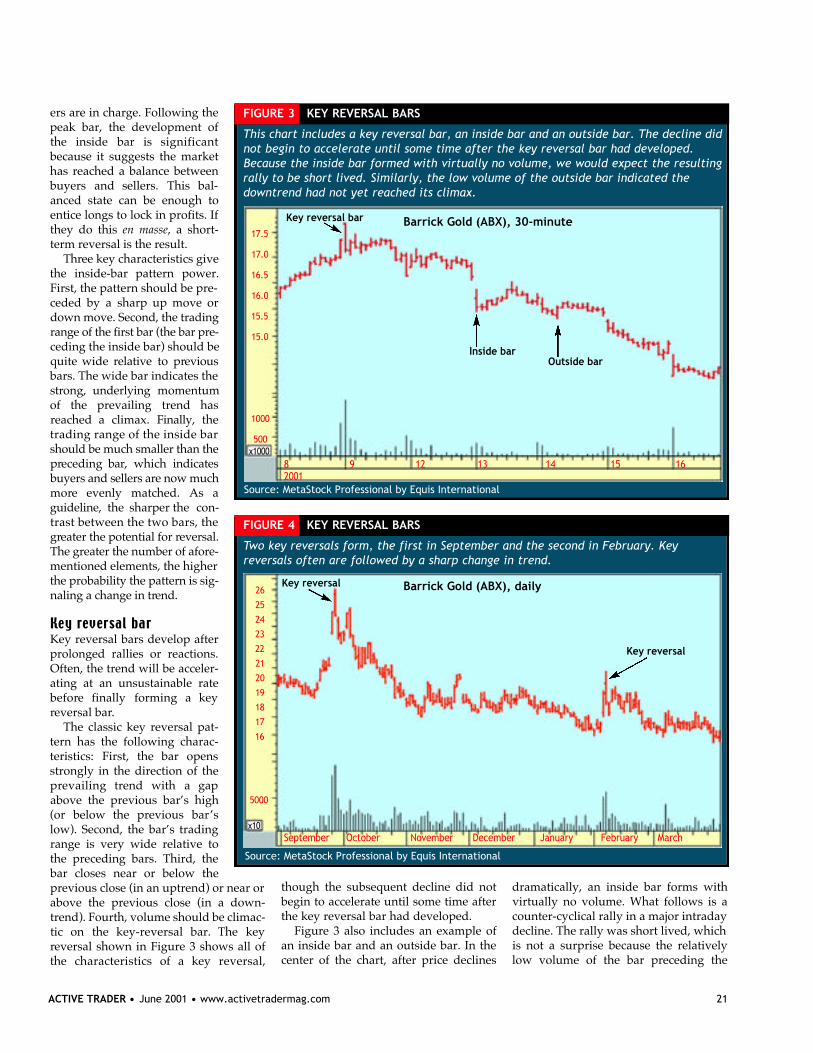
Key reversal bars develop afterprolonged rallies or reactions.Often, the trend will be acceler-ating at an unsustainable rateb e f o re finally forming a keyreversal bar.
The classic key reversal pat-tern has the following charac-teristics: First, the bar opensstrongly in the direction of thep revailing trend with a gapabove the previous bar’s high(or below the previous bar’ slow). Second, the bar’s tradingrange is very wide relative tothe preceding bars. Third, thebar closes near or below theprevious close (in an uptrend) or near orabove the previous close (in a down-trend). Fourth, volume should be climac-tic on the key-reversal bar. The keyreversal shown in Figure 3 shows all ofthe characteristics of a key re v e r s a l ,
though the subsequent decline did notbegin to accelerate until some time afterthe key reversal bar had developed.
Figure 3 also includes an example ofan inside bar and an outside bar. In thecenter of the chart, after price declines
dramatically, an inside bar forms withvirtually no volume. What follows is acounter-cyclical rally in a major intradaydecline. The rally was short lived, whichis not a surprise because the relativelylow volume of the bar preceding the
This chart includes a key reversal bar, an inside bar and an outside bar. The decline didnot begin to accelerate until some time after the key reversal bar had developed.Because the inside bar formed with virtually no volume, we would expect the resultingrally to be short lived. Similarly, the low volume of the outside bar indicated thedowntrend had not yet reached its climax.
FIGURE 3 KEY REVERSAL BARS
Barrick Gold (ABX), 30-minuteKey reversal bar
Inside barOutside bar
8 9 12 13 14 15 162 0 0 1
1 7 . 5
1 7 . 0
1 6 . 5
1 6 . 0
1 5 . 5
1 5 . 0
1 0 0 0
5 0 0x 1 0 0 0
Source: MetaStock Professional by Equis International
Two key reversals form, the first in September and the second in February. Key reversals often are followed by a sharp change in trend.
FIGURE 4 KEY REVERSAL BARS
Barrick Gold (ABX), dailyKey reversal
Key reversal
September October November December January February March
2 6
2 5
2 4
2 3
2 2
2 1
2 0
1 9
1 8
1 7
1 6
5 0 0 0
x 1 0
Source: MetaStock Professional by Equis International
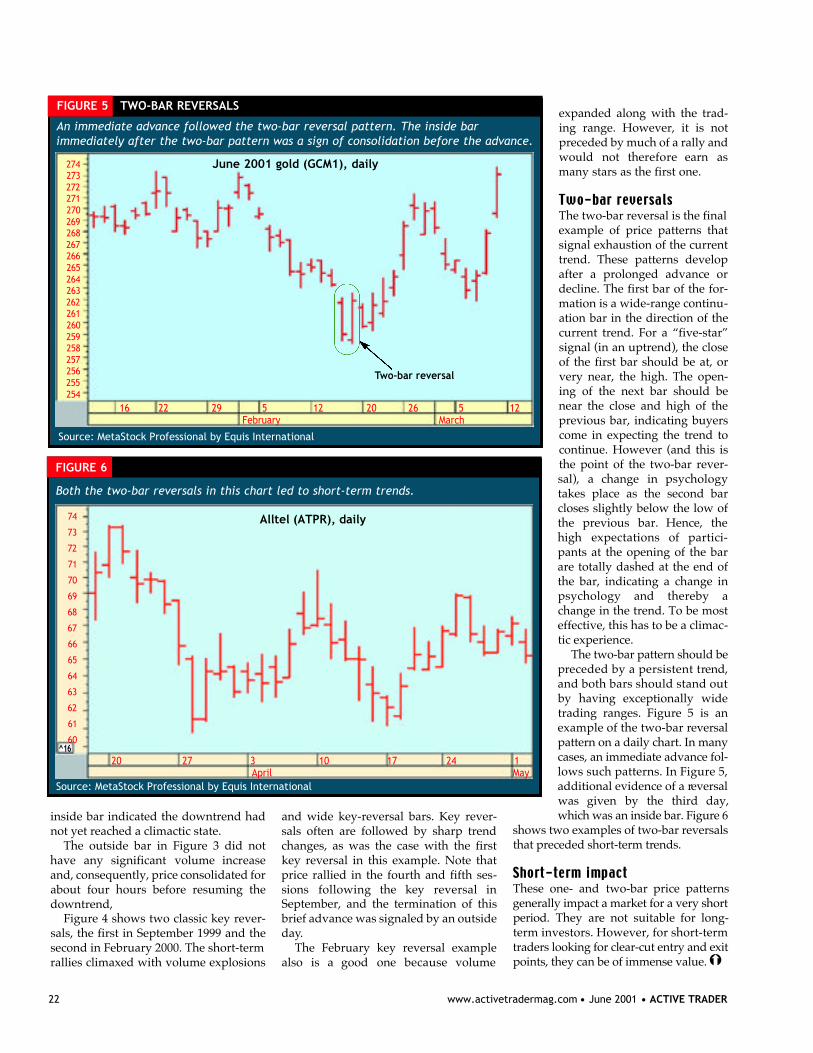
22 www.activetradermag.com • June 2001 • ACTIVE TRADER
inside bar indicated the downtrend hadnot yet reached a climactic state.
The outside bar in Figure 3 did nothave any significant volume incre a s eand, consequently, price consolidated forabout four hours before resuming thedowntrend,
Figure 4 shows two classic key rever-sals, the first in September 1999 and thesecond in February 2000. The short-termrallies climaxed with volume explosions
and wide key-reversal bars. Key rever-sals often are followed by sharp trendchanges, as was the case with the firstkey reversal in this example. Note thatprice rallied in the fourth and fifth ses-sions following the key reversal inSeptember, and the termination of thisbrief advance was signaled by an outsideday.
The February key reversal examplealso is a good one because volume
expanded along with the trad-ing range. However, it is notpreceded by much of a rally andwould not there f o re earn asmany stars as the first one.
The two-bar reversal is the finalexample of price patterns thatsignal exhaustion of the currenttrend. These patterns developafter a prolonged advance ordecline. The first bar of the for-mation is a wide-range continu-ation bar in the direction of thecurrent trend. For a “five-star”signal (in an uptrend), the closeof the first bar should be at, orvery near, the high. The open-ing of the next bar should benear the close and high of theprevious bar, indicating buyerscome in expecting the trend tocontinue. However (and this isthe point of the two-bar rever-sal), a change in psychologytakes place as the second barcloses slightly below the low ofthe previous bar. Hence, thehigh expectations of partici-pants at the opening of the barare totally dashed at the end ofthe bar, indicating a change inpsychology and thereby achange in the trend. To be mosteffective, this has to be a climac-tic experience.
The two-bar pattern should bep receded by a persistent tre n d ,and both bars should stand outby having exceptionally widetrading ranges. Figure 5 is anexample of the two-bar re v e r s a lpattern on a daily chart. In manycases, an immediate advance fol-lows such patterns. In Figure 5,additional evidence of a re v e r s a lwas given by the third day,which was an inside bar. Figure 6
shows two examples of two-bar re v e r s a l sthat preceded short-term tre n d s .
These one- and two-bar price patternsgenerally impact a market for a very shortperiod. They are not suitable for long-term investors. However, for short-termtraders looking for clear-cut entry and exitpoints, they can be of immense value.Ý
Both the two-bar reversals in this chart led to short-term trends.
FIGURE 6
Alltel (ATPR), daily
20 27 3 10 17 24 1April May
7 4
7 3
7 2
7 1
7 0
6 9
6 8
6 7
6 6
6 5
6 4
6 3
6 2
6 1
6 0
Source: MetaStock Professional by Equis International
1̂ 6
An immediate advance followed the two-bar reversal pattern. The inside bar immediately after the two-bar pattern was a sign of consolidation before the advance.
FIGURE 5 TWO-BAR REVERSALS
June 2001 gold (GCM1), daily
Two-bar reversal
16 22 29 5 12 20 26 5 12 February March
2 7 42 7 32 7 22 7 12 7 02 6 92 6 82 6 72 6 62 6 52 6 42 6 32 6 22 6 12 6 02 5 92 5 82 5 72 5 62 5 52 5 4
Source: MetaStock Professional by Equis International

ACTIVE TRADER • June 2001 • www.activetradermag.com 23
F or many people, trading suc-cess is exclusively a matter ofthe bottom line. However, atrader’s skill is based not on
how much money he or she makes buton the consistency of returns. Goodtraders profit over time by consistentlycutting losses quickly and letting win-ners run.
Of course, talking about this and actu-ally doing it are two different things. Toaccomplish this goal you need to designa strategy that fits your personality andrisk profile. Contrary to popular belief,p rofessional traders do not speculate;they look for trades with the highestprobability of success.
This approach is required not only foropening positions, but also for closingthem — a frequently overlooked aspectof trading. Unfortunately, the vast major-
ity of trading books in circu-lation today focus on how toopen positions; you’d havea tough time finding onethat focuses on how to exitthem.
Volatility has incre a s e ddramatically over the lastfew years. Thanks to thisshift in dynamics, many“classic” stop techniques arenot working as efficiently asthey have in the past. Thewhipsaws that occur in justone day can stop a trader
out of all his or her positions. The traderthen often watches, exasperated, as themarket completely rebounds withinmoments. With this in mind, it is neces-sary to find a trailing stop technique thatis able to accelerate quickly and smooth-ly while allowing for the present marketvolatility.
When you have a profit in a position,it is necessary to move beyond the initialstop and use a trailing stop to protectyour gains. The “Baker Five-and-Dime”(F&D) allows you to do that. Thisapproach is unique in that it does not usea fixed percentage or number of points todetermine an exit level. Rather, it adjustsitself automatically based on the volatili-ty and speed of the stock.
The F&D requires three technical indi-cators: a five-period moving average, a10-period moving average and volume.While the method works on any timeframe, three- and five-minute chartswork best for intraday trading. Limitingthe number of technical studies helps
prevent confusion resulting from con-flicting signals.
Although it is not specifically requiredfor the pattern, volume provides addi-tional confirmation for a move. Priceshifts backed by volume tend to be moresignificant. When trying to determinehow significant a move is, compare thevolume of the current price bar to that ofthe last 20 bars. This will help show howmany traders are participating in themove and can help to indicate the end ofa move, such as a pullback.
There are two variations of the F&D, onefor trending markets and one for non-trending (choppy) markets. A trendingmarket can be defined several ways. Thefirst kind of trending market is simply ab i g g e r- p i c t u re bull market, in whichstocks are in a longer-term uptrend andtend to rally out of pullbacks.
The second type of trending market isone with a consistent intraday pattern(regardless of what’s happening on abigger-picture basis) that can be deter-mined by simply looking at a five- or 10-minute chart. Which way is the marketmoving in general: up, down or side-ways? In a bigger-picture bull market itis not necessary to determine each day ifthe market is “trending” or not, althoughit helps to have an idea of the day’s direc-tion. However, in a bigger-picture bearor choppy market, it is important todetermine if the market is “trending” ona given day. Most importantly, the key isto have a feel for the overall situation.
For example, from 1995 through early
BY DAVID BAKER
TRADING Strategies
H O L D I N G on to P R O F I T SGetting in a position is one thing.
Getting out of it with a profit is another.
This trailing stop technique can help you hold
on to profits in trending and choppy markets
by adjusting to market volatility.
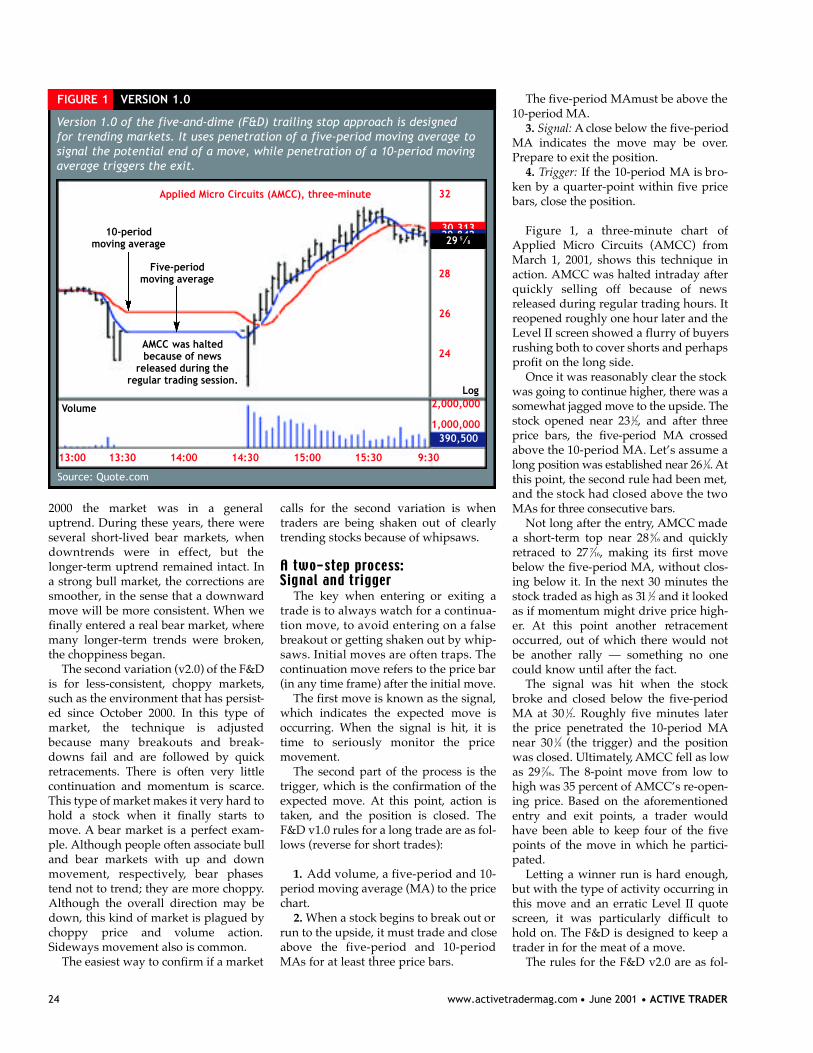
24 www.activetradermag.com • June 2001 • ACTIVE TRADER
2000 the market was in a generaluptrend. During these years, there wereseveral short-lived bear markets, whend o w n t rends were in effect, but thelonger-term uptrend remained intact. Ina strong bull market, the corrections aresmoother, in the sense that a downwardmove will be more consistent. When wefinally entered a real bear market, wheremany longer-term trends were broken,the choppiness began.
The second variation (v2.0) of the F&Dis for less-consistent, choppy markets,such as the environment that has persist-ed since October 2000. In this type ofmarket, the technique is adjustedbecause many breakouts and bre a k-downs fail and are followed by quickretracements. There is often very littlecontinuation and momentum is scarce.This type of market makes it very hard tohold a stock when it finally starts tomove. A bear market is a perfect exam-ple. Although people often associate bulland bear markets with up and downmovement, re s p e c t i v e l y, bear phasestend not to trend; they are more choppy.Although the overall direction may bedown, this kind of market is plagued bychoppy price and volume action.Sideways movement also is common.
The easiest way to confirm if a market
calls for the second variation is whentraders are being shaken out of clearlytrending stocks because of whipsaws.
The key when entering or exiting atrade is to always watch for a continua-tion move, to avoid entering on a falseb reakout or getting shaken out by whip-saws. Initial moves are often traps. Thecontinuation move refers to the price bar(in any time frame) after the initial move.
The first move is known as the signal,which indicates the expected move isoccurring. When the signal is hit, it istime to seriously monitor the pricemovement.
The second part of the process is thetrigger, which is the confirmation of theexpected move. At this point, action istaken, and the position is closed. TheF&D v1.0 rules for a long trade are as fol-lows (reverse for short trades):
1. Add volume, a five-period and 10-period moving average (MA) to the pricec h a r t .
2. When a stock begins to break out orrun to the upside, it must trade and closeabove the five-period and 10-periodMAs for at least three price bars.
The five-period MAmust be above the10-period MA.
3. Signal: A close below the five-periodMA indicates the move may be over.Prepare to exit the position.
4. Trigger: If the 10-period MA is bro-ken by a quarter-point within five pricebars, close the position.
F i g u re 1, a three-minute chart ofApplied Micro Circuits (AMCC) fromMarch 1, 2001, shows this technique inaction. AMCC was halted intraday afterquickly selling off because of newsreleased during regular trading hours. Itreopened roughly one hour later and theLevel II screen showed a flurry of buyersrushing both to cover shorts and perhapsprofit on the long side.
Once it was reasonably clear the stockwas going to continue higher, there was asomewhat jagged move to the upside. Thestock opened near 23 1⁄2, and after thre eprice bars, the five-period MA c ro s s e dabove the 10-period MA. Let’s assume along position was established near 26 1⁄4. A tthis point, the second rule had been met,and the stock had closed above the twoMAs for three consecutive bars.
Not long after the entry, AMCC madea short-term top near 28 9⁄16 and quicklyretraced to 27 7⁄16, making its first movebelow the five-period MA, without clos-ing below it. In the next 30 minutes thestock traded as high as 31 1⁄2 and it lookedas if momentum might drive price high-e r. At this point another re t r a c e m e n toccurred, out of which there would notbe another rally — something no onecould know until after the fact.
The signal was hit when the stockbroke and closed below the five-periodMA at 30 1⁄2. Roughly five minutes laterthe price penetrated the 10-period MAnear 30 1⁄4 (the trigger) and the positionwas closed. Ultimately, AMCC fell as lowas 29 7⁄16. The 8-point move from low tohigh was 35 percent of AMCC’s re-open-ing price. Based on the aforementionedentry and exit points, a trader wouldhave been able to keep four of the fivepoints of the move in which he partici-pated.
Letting a winner run is hard enough,but with the type of activity occurring inthis move and an erratic Level II quotescreen, it was particularly difficult tohold on. The F&D is designed to keep atrader in for the meat of a move.
The rules for the F&D v2.0 are as fol-
Version 1.0 of the five-and-dime (F&D) trailing stop approach is designed for trending markets. It uses penetration of a five-period moving average tosignal the potential end of a move, while penetration of a 10-period movingaverage triggers the exit.
FIGURE 1 VERSION 1.0
Source: Quote.com
10-period moving average
Five-period moving average
2,000,000
1,000,000390,500
30.31329.84229 5⁄8
13:00 13:30 14:00 14:30 15:00 15:30 9:30
Volume
Log
32
28
26
24AMCC was haltedbecause of news
released during theregular trading session.
Applied Micro Circuits (AMCC), three-minute
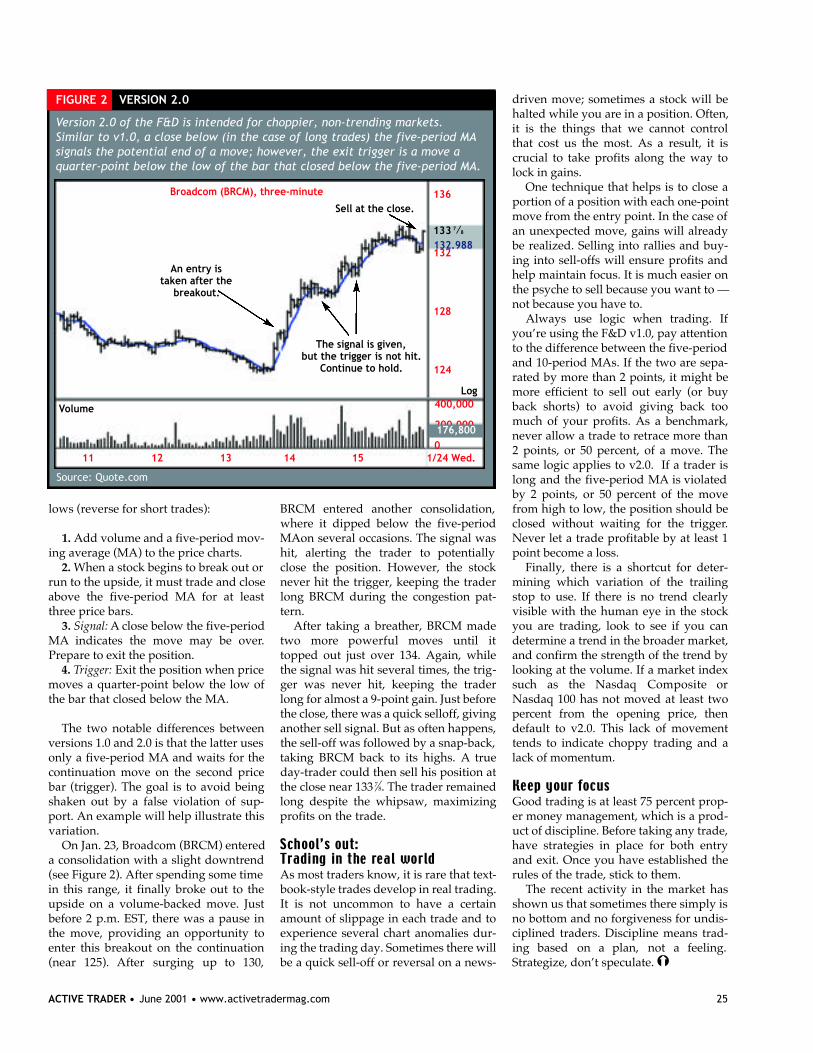
ACTIVE TRADER • June 2001 • www.activetradermag.com 25
lows (reverse for short trades):
1. Add volume and a five-period mov-ing average (MA) to the price charts.
2. When a stock begins to break out orrun to the upside, it must trade and closeabove the five-period MA for at leastthree price bars.
3. Signal: A close below the five-periodMA indicates the move may be over.Prepare to exit the position.
4. Trigger: Exit the position when pricemoves a quarter-point below the low ofthe bar that closed below the MA.
The two notable differences betweenversions 1.0 and 2.0 is that the latter usesonly a five-period MA and waits for thecontinuation move on the second pricebar (trigger). The goal is to avoid beingshaken out by a false violation of sup-port. An example will help illustrate thisvariation.
On Jan. 23, Broadcom (BRCM) entereda consolidation with a slight downtrend(see Figure 2). After spending some timein this range, it finally broke out to theupside on a volume-backed move. Justbefore 2 p.m. EST, there was a pause inthe move, providing an opportunity toenter this breakout on the continuation(near 125). After surging up to 130,
BRCM entered another consolidation,where it dipped below the five-periodMAon several occasions. The signal washit, alerting the trader to potentiallyclose the position. However, the stocknever hit the trigger, keeping the traderlong BRCM during the congestion pat-tern.
After taking a breather, BRCM madetwo more powerful moves until ittopped out just over 134. Again, whilethe signal was hit several times, the trig-ger was never hit, keeping the traderlong for almost a 9-point gain. Just beforethe close, there was a quick selloff, givinganother sell signal. But as often happens,the sell-off was followed by a snap-back,taking BRCM back to its highs. A trueday-trader could then sell his position atthe close near 133 7⁄8. The trader remainedlong despite the whipsaw, maximizingprofits on the trade.
As most traders know, it is rare that text-book-style trades develop in real trading.It is not uncommon to have a certainamount of slippage in each trade and toexperience several chart anomalies dur-ing the trading day. Sometimes there willbe a quick sell-off or reversal on a news-
driven move; sometimes a stock will behalted while you are in a position. Often,it is the things that we cannot controlthat cost us the most. As a result, it iscrucial to take profits along the way tolock in gains.
One technique that helps is to close aportion of a position with each one-pointmove from the entry point. In the case ofan unexpected move, gains will alreadybe realized. Selling into rallies and buy-ing into sell-offs will ensure profits andhelp maintain focus. It is much easier onthe psyche to sell because you want to —not because you have to.
Always use logic when trading. Ifyou’re using the F&D v1.0, pay attentionto the difference between the five-periodand 10-period MAs. If the two are sepa-rated by more than 2 points, it might bemore efficient to sell out early (or buyback shorts) to avoid giving back toomuch of your profits. As a benchmark,never allow a trade to retrace more than2 points, or 50 percent, of a move. Thesame logic applies to v2.0. If a trader islong and the five-period MA is violatedby 2 points, or 50 percent of the movefrom high to low, the position should beclosed without waiting for the trigger.Never let a trade profitable by at least 1point become a loss.
Finally, there is a shortcut for deter-mining which variation of the trailingstop to use. If there is no trend clearlyvisible with the human eye in the stockyou are trading, look to see if you candetermine a trend in the broader market,and confirm the strength of the trend bylooking at the volume. If a market indexsuch as the Nasdaq Composite orNasdaq 100 has not moved at least twop e rcent from the opening price, thendefault to v2.0. This lack of movementtends to indicate choppy trading and alack of momentum.
Good trading is at least 75 percent prop-er money management, which is a prod-uct of discipline. Before taking any trade,have strategies in place for both entryand exit. Once you have established therules of the trade, stick to them.
The recent activity in the market hasshown us that sometimes there simply isno bottom and no forgiveness for undis-ciplined traders. Discipline means trad-ing based on a plan, not a feeling.Strategize, don’t speculate.Ý
Version 2.0 of the F&D is intended for choppier, non-trending markets. Similar to v1.0, a close below (in the case of long trades) the five-period MAsignals the potential end of a move; however, the exit trigger is a move aquarter-point below the low of the bar that closed below the five-period MA.
FIGURE 2 VERSION 2.0
Source: Quote.com
Broadcom (BRCM), three-minute
An entry is taken after the
breakout.
Sell at the close.
400,000
200,000
0176,800
11 12 13 14 15 1/24 Wed.
Volume
Log
136
132
128
124
133 7⁄8
132.988
The signal is given, but the trigger is not hit.
Continue to hold.
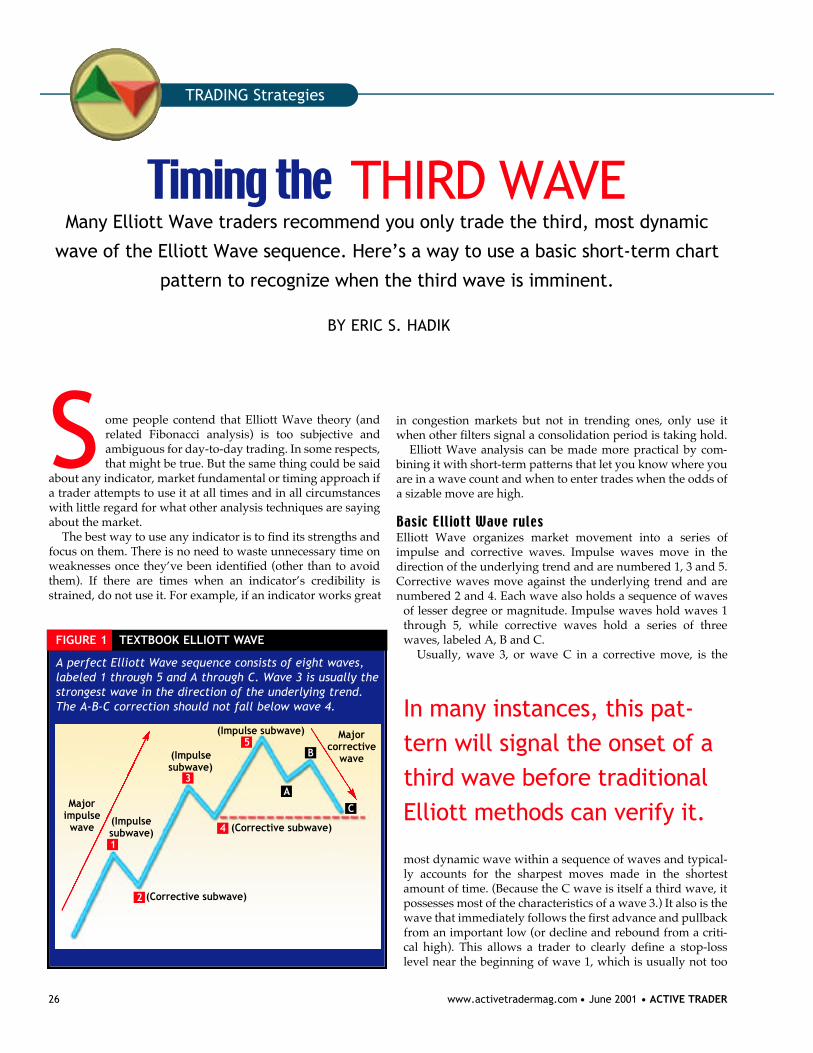
S ome people contend that Elliott Wave theory (andrelated Fibonacci analysis) is too subjective andambiguous for day-to-day trading. In some respects,that might be true. But the same thing could be said
about any indicator, market fundamental or timing approach ifa trader attempts to use it at all times and in all circumstanceswith little regard for what other analysis techniques are sayingabout the market.
The best way to use any indicator is to find its strengths andfocus on them. There is no need to waste unnecessary time onweaknesses once they’ve been identified (other than to avoidthem). If there are times when an indicator’s credibility isstrained, do not use it. For example, if an indicator works great
in congestion markets but not in trending ones, only use itwhen other filters signal a consolidation period is taking hold.
Elliott Wave analysis can be made more practical by com-bining it with short-term patterns that let you know where youare in a wave count and when to enter trades when the odds ofa sizable move are high.
Elliott Wave organizes market movement into a series ofimpulse and corrective waves. Impulse waves move in thedirection of the underlying trend and are numbered 1, 3 and 5.Corrective waves move against the underlying trend and arenumbered 2 and 4. Each wave also holds a sequence of waves
of lesser degree or magnitude. Impulse waves hold waves 1through 5, while corrective waves hold a series of threewaves, labeled A, B and C.
Usually, wave 3, or wave C in a corrective move, is the
most dynamic wave within a sequence of waves and typical-ly accounts for the sharpest moves made in the shortestamount of time. (Because the C wave is itself a third wave, itpossesses most of the characteristics of a wave 3.) It also is thewave that immediately follows the first advance and pullbackfrom an important low (or decline and rebound from a criti-cal high). This allows a trader to clearly define a stop-losslevel near the beginning of wave 1, which is usually not too
26 www.activetradermag.com • June 2001 • ACTIVE TRADER
TRADING Strategies
Timing the THIRD WAV EMany Elliott Wave traders recommend you only trade the third, most dynamic
wave of the Elliott Wave sequence. Here’s a way to use a basic short-term chart
pattern to recognize when the third wave is imminent.
BY ERIC S. HADIK
In many instances, this pat-tern will signal the onset of athird wave before traditionalElliott methods can verify it.
A perfect Elliott Wave sequence consists of eight waves,labeled 1 through 5 and A through C. Wave 3 is usually thestrongest wave in the direction of the underlying trend.The A-B-C correction should not fall below wave 4.
FIGURE 1 TEXTBOOK ELLIOTT WAVE
Majorimpulsewave
(Impulsesubwave)
(Impulsesubwave)
(Impulse subwave)
(Corrective subwave)
(Corrective subwave)
Majorcorrective
wave
1
2
3
4
A
B
C
5
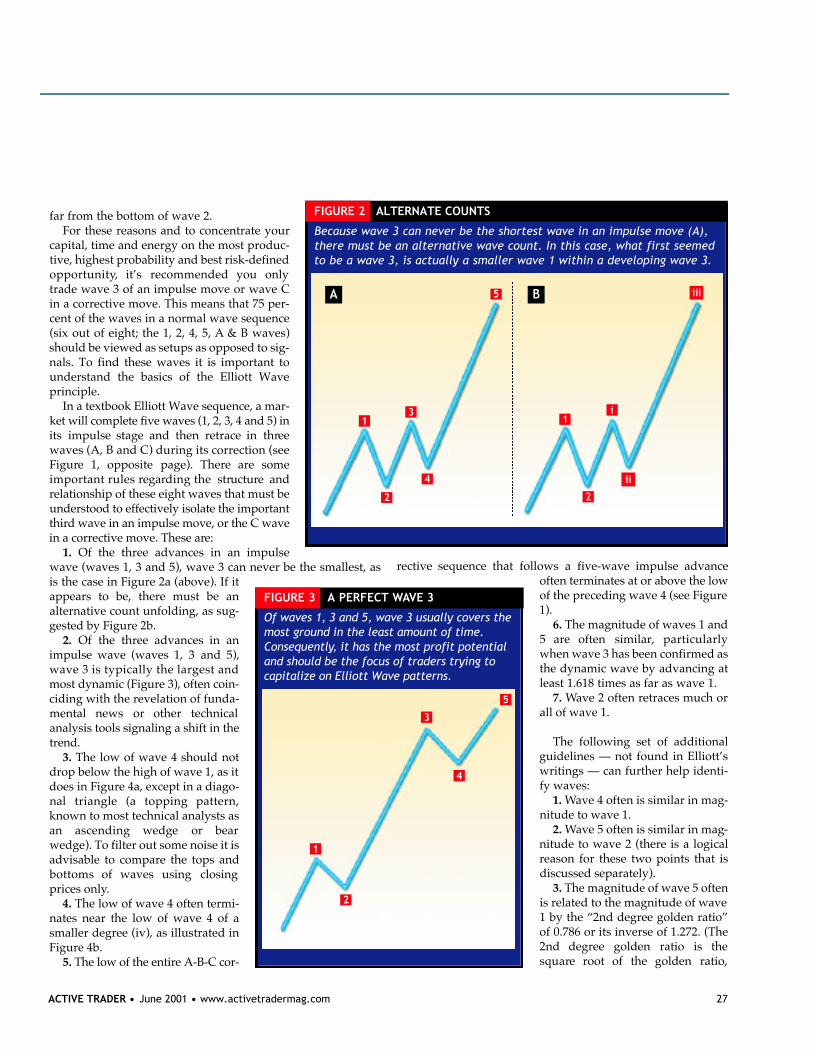
far from the bottom of wave 2.For these reasons and to concentrate your
capital, time and energy on the most produc-tive, highest probability and best risk-definedo p p o r t u n i t y, it’s recommended you onlytrade wave 3 of an impulse move or wave Cin a corrective move. This means that 75 per-cent of the waves in a normal wave sequence(six out of eight; the 1, 2, 4, 5, A & B waves)should be viewed as setups as opposed to sig-nals. To find these waves it is important tounderstand the basics of the Elliott Waveprinciple.
In a textbook Elliott Wave sequence, a mar-ket will complete five waves (1, 2, 3, 4 and 5) inits impulse stage and then retrace in thre ewaves (A, B and C) during its correction (seeF i g u re 1, opposite page). There are someimportant rules re g a rding the stru c t u re andrelationship of these eight waves that must beunderstood to effectively isolate the importantt h i rd wave in an impulse move, or the C wavein a corrective move. These are :
1. Of the three advances in an impulsewave (waves 1, 3 and 5), wave 3 can never be the smallest, asis the case in Figure 2a (above). If itappears to be, there must be analternative count unfolding, as sug-gested by Figure 2b.
2 . Of the three advances in animpulse wave (waves 1, 3 and 5),wave 3 is typically the largest andmost dynamic (Figure 3), often coin-ciding with the revelation of funda-mental news or other technicalanalysis tools signaling a shift in thet re n d .
3. The low of wave 4 should notdrop below the high of wave 1, as itdoes in Figure 4a, except in a diago-nal triangle (a topping pattern,known to most technical analysts asan ascending wedge or bearwedge). To filter out some noise it isadvisable to compare the tops andbottoms of waves using closingprices only.
4. The low of wave 4 often termi-nates near the low of wave 4 of asmaller degree (iv), as illustrated inFigure 4b.
5. The low of the entire A-B-C cor-
rective sequence that follows a five-wave impulse advanceoften terminates at or above the lowof the preceding wave 4 (see Figure1 ) .
6. The magnitude of waves 1 and5 are often similar, particularlywhen wave 3 has been confirmed asthe dynamic wave by advancing atleast 1.618 times as far as wave 1.
7. Wave 2 often retraces much orall of wave 1.
The following set of additionalguidelines — not found in Elliott’swritings — can further help identi-fy waves:
1. Wave 4 often is similar in mag-nitude to wave 1.
2. Wave 5 often is similar in mag-nitude to wave 2 (there is a logicalreason for these two points that isdiscussed separately).
3. The magnitude of wave 5 oftenis related to the magnitude of wave1 by the “2nd degree golden ratio”of 0.786 or its inverse of 1.272. (The2nd degree golden ratio is thes q u a re root of the golden ratio,
ACTIVE TRADER • June 2001 • www.activetradermag.com 27
Of waves 1, 3 and 5, wave 3 usually covers themost ground in the least amount of time.C o n s e q u e n t l y, it has the most profit potentialand should be the focus of traders trying tocapitalize on Elliott Wave patterns.
FIGURE 3 A PERFECT WAVE 3
1
2
3
4
5
Because wave 3 can never be the shortest wave in an impulse move (A),there must be an alternative wave count. In this case, what first seemedto be a wave 3, is actually a smaller wave 1 within a developing wave 3.
FIGURE 2 ALTERNATE COUNTS
1
2
3
4
5
1
2
i
ii
iiiBA
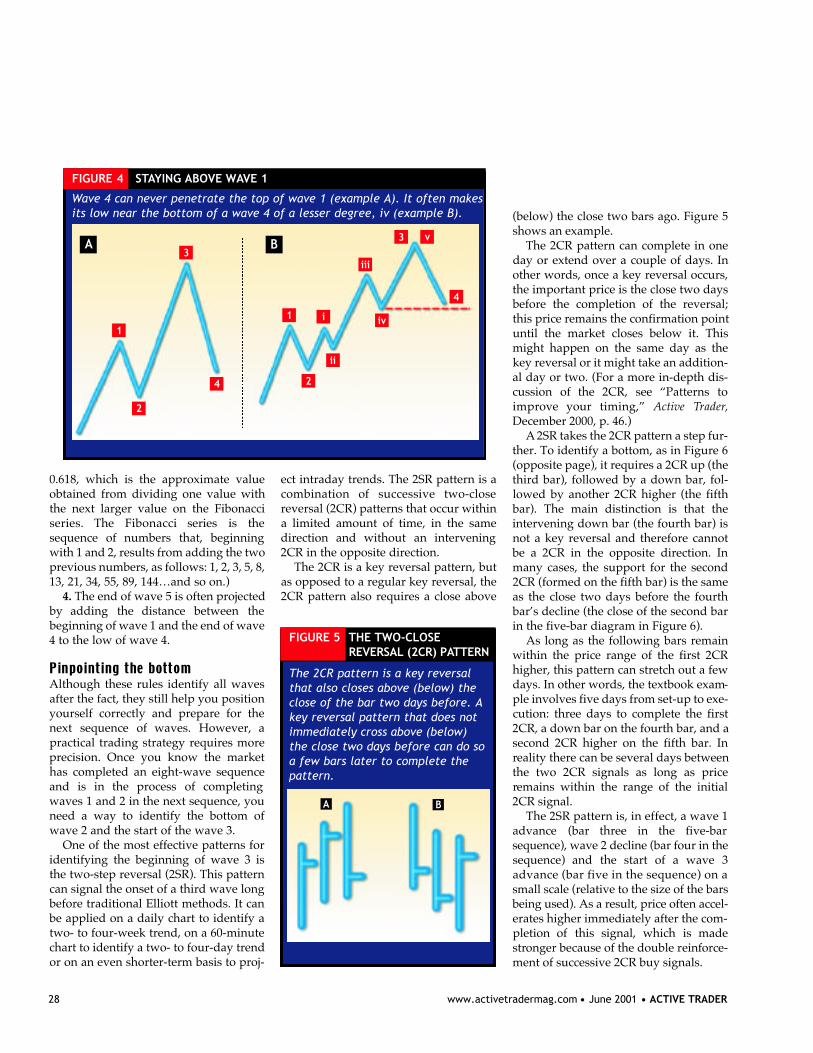
28 www.activetradermag.com • June 2001 • ACTIVE TRADER
0.618, which is the approximate valueobtained from dividing one value withthe next larger value on the Fibonacciseries. The Fibonacci series is thesequence of numbers that, beginningwith 1 and 2, results from adding the twoprevious numbers, as follows: 1, 2, 3, 5, 8,13, 21, 34, 55, 89, 144…and so on.)
4. The end of wave 5 is often projectedby adding the distance between thebeginning of wave 1 and the end of wave4 to the low of wave 4.
Although these rules identify all wavesafter the fact, they still help you positionyourself correctly and prepare for thenext sequence of waves. However, apractical trading strategy requires moreprecision. Once you know the markethas completed an eight-wave sequenceand is in the process of completingwaves 1 and 2 in the next sequence, youneed a way to identify the bottom ofwave 2 and the start of the wave 3.
One of the most effective patterns foridentifying the beginning of wave 3 isthe two-step reversal (2SR). This patterncan signal the onset of a third wave longbefore traditional Elliott methods. It canbe applied on a daily chart to identify atwo- to four-week trend, on a 60-minutechart to identify a two- to four-day trendor on an even shorter-term basis to proj-
ect intraday trends. The 2SR pattern is acombination of successive two-closereversal (2CR) patterns that occur withina limited amount of time, in the samed i rection and without an intervening2CR in the opposite direction.
The 2CR is a key reversal pattern, butas opposed to a regular key reversal, the2CR pattern also requires a close above
(below) the close two bars ago. Figure 5shows an example.
The 2CR pattern can complete in oneday or extend over a couple of days. Inother words, once a key reversal occurs,the important price is the close two daysbefore the completion of the reversal;this price remains the confirmation pointuntil the market closes below it. Thismight happen on the same day as thekey reversal or it might take an addition-al day or two. (For a more in-depth dis-cussion of the 2CR, see “Patterns toi m p rove your timing,” Active Tr a d e r,December 2000, p. 46.)
A 2SR takes the 2CR pattern a step fur-ther. To identify a bottom, as in Figure 6(opposite page), it requires a 2CR up (thethird bar), followed by a down bar, fol-lowed by another 2CR higher (the fifthbar). The main distinction is that theintervening down bar (the fourth bar) isnot a key reversal and therefore cannotbe a 2CR in the opposite direction. Inmany cases, the support for the second2CR (formed on the fifth bar) is the sameas the close two days before the fourthbar’s decline (the close of the second barin the five-bar diagram in Figure 6).
As long as the following bars remainwithin the price range of the first 2CRhigher, this pattern can stretch out a fewdays. In other words, the textbook exam-ple involves five days from set-up to exe-cution: three days to complete the first2CR, a down bar on the fourth bar, and asecond 2CR higher on the fifth bar. Inreality there can be several days betweenthe two 2CR signals as long as priceremains within the range of the initial2CR signal.
The 2SR pattern is, in effect, a wave 1advance (bar three in the five-barsequence), wave 2 decline (bar four in thesequence) and the start of a wave 3advance (bar five in the sequence) on asmall scale (relative to the size of the barsbeing used). As a result, price often accel-erates higher immediately after the com-pletion of this signal, which is mades t ronger because of the double re i n f o rc e-ment of successive 2CR buy signals.
Wave 4 can never penetrate the top of wave 1 (example A). It often makesits low near the bottom of a wave 4 of a lesser degree, iv (example B).
FIGURE 4 STAYING ABOVE WAVE 1
1
2
3
3
4
4
1
2
i
ii
iv
v
iii
BA
The 2CR pattern is a key reversalthat also closes above (below) theclose of the bar two days before. Akey reversal pattern that does notimmediately cross above (below)the close two days before can do soa few bars later to complete thepattern.
FIGURE 5 THE TWO-CLOSE REVERSAL (2CR) PAT T E R N
A B
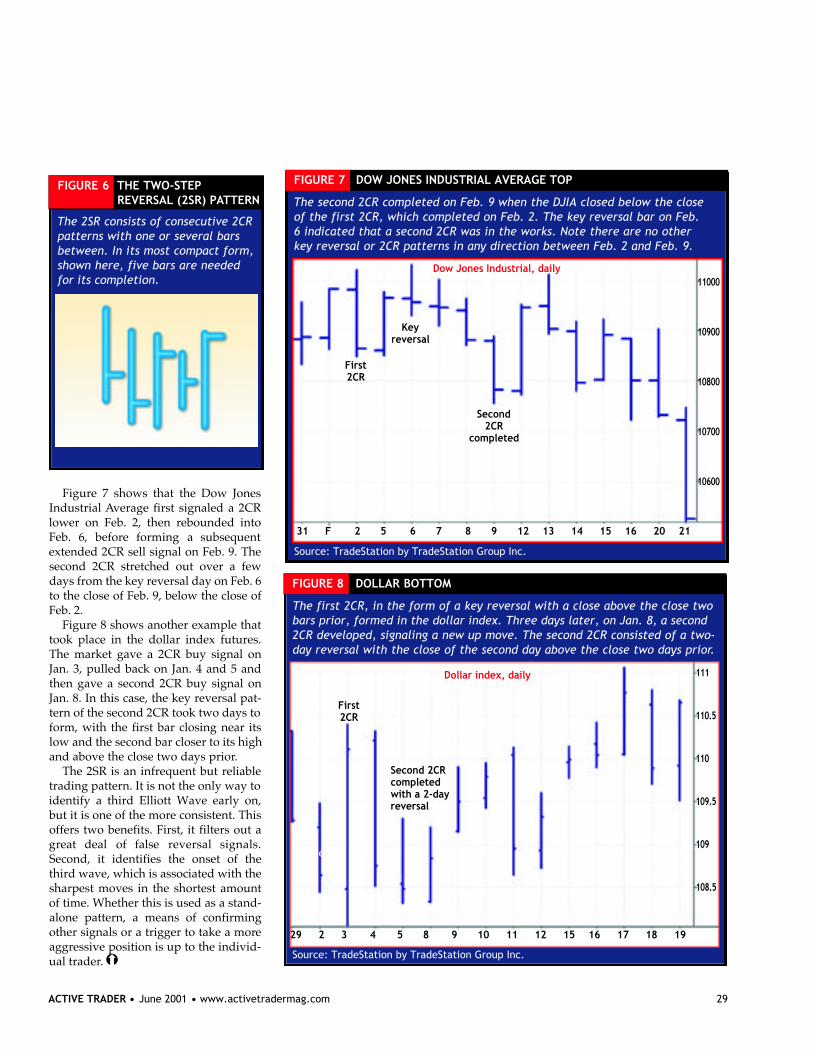
Figure 7 shows that the Dow JonesIndustrial Average first signaled a 2CRlower on Feb. 2, then rebounded intoFeb. 6, before forming a subsequentextended 2CR sell signal on Feb. 9. Thesecond 2CR stretched out over a fewdays from the key reversal day on Feb. 6to the close of Feb. 9, below the close ofFeb. 2.
Figure 8 shows another example thattook place in the dollar index futures.The market gave a 2CR buy signal onJan. 3, pulled back on Jan. 4 and 5 andthen gave a second 2CR buy signal onJan. 8. In this case, the key reversal pat-tern of the second 2CR took two days toform, with the first bar closing near itslow and the second bar closer to its highand above the close two days prior.
The 2SR is an infrequent but reliabletrading pattern. It is not the only way toidentify a third Elliott Wave early on,but it is one of the more consistent. Thisoffers two benefits. First, it filters out ag reat deal of false reversal signals.Second, it identifies the onset of thethird wave, which is associated with thesharpest moves in the shortest amountof time. Whether this is used as a stand-alone pattern, a means of confirmingother signals or a trigger to take a moreaggressive position is up to the individ-ual trader.Ý
ACTIVE TRADER • June 2001 • www.activetradermag.com 29
The 2SR consists of consecutive 2CRpatterns with one or several barsbetween. In its most compact form,shown here, five bars are neededfor its completion.
FIGURE 6 THE TWO-STEP REVERSAL (2SR) PATTERN The second 2CR completed on Feb. 9 when the DJIA closed below the close
of the first 2CR, which completed on Feb. 2. The key reversal bar on Feb.6 indicated that a second 2CR was in the works. Note there are no otherkey reversal or 2CR patterns in any direction between Feb. 2 and Feb. 9.
FIGURE 7 DOW JONES INDUSTRIAL AVERAGE TOP
Source:
Source: TradeStation by TradeStation Group Inc.
First 2CR
Second2CR
completed
31 F 2 5 6 7 8 9 12 13 14 15 16 20 21
1 1 0 0 0
1 0 9 0 0
1 0 8 0 0
1 0 7 0 0
1 0 6 0 0
Keyreversal
Dow Jones Industrial, daily
The first 2CR, in the form of a key reversal with a close above the close twobars prior, formed in the dollar index. Three days later, on Jan. 8, a second2CR developed, signaling a new up move. The second 2CR consisted of a two-day reversal with the close of the second day above the close two days prior.
FIGURE 8 DOLLAR BOTTOM
Source:
Source: TradeStation by TradeStation Group Inc.
First 2CR
Second 2CRcompletedwith a 2-dayreversal
29 2 3 4 5 8 9 10 11 12 15 16 17 18 19
1 1 1
1 1 0 . 5
1 1 0
1 0 9 . 5
1 0 9
1 0 8 . 5
Dollar index, daily
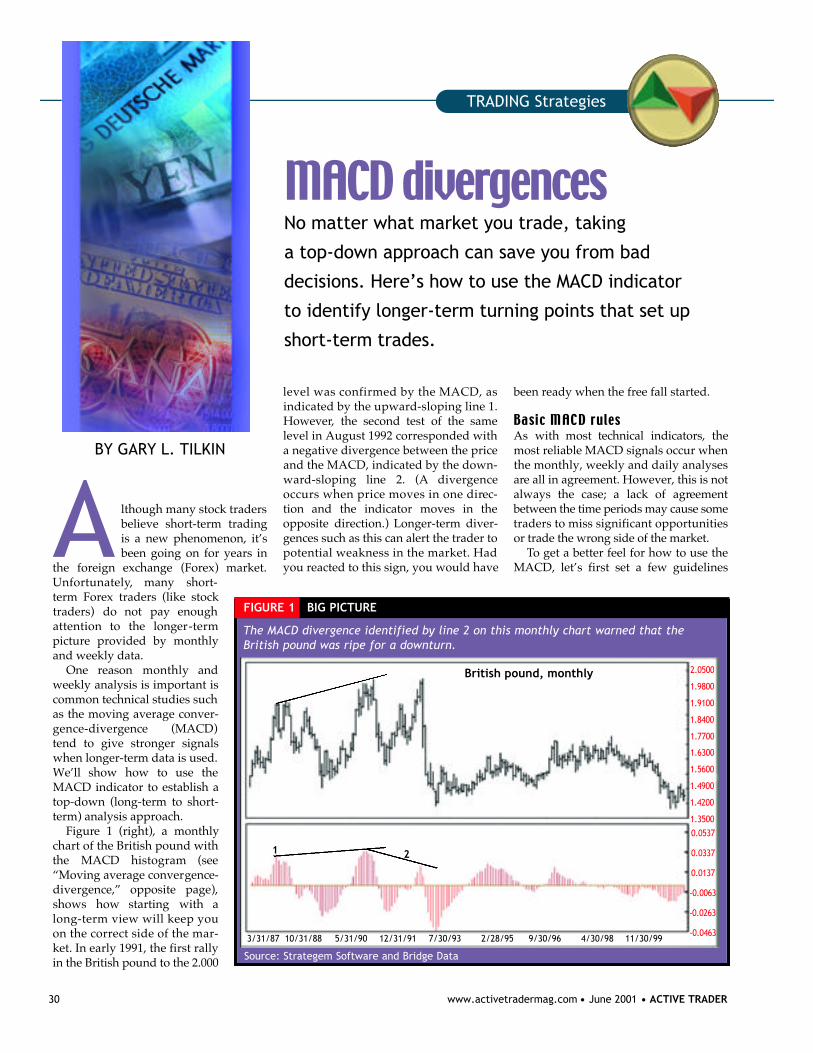
BY GARY L. TILKIN
A lthough many stock tradersbelieve short-term tradingis a new phenomenon, it’sbeen going on for years in
the foreign exchange (Forex) market.U n f o r t u n a t e l y, many short-term Forex traders (like stocktraders) do not pay enoughattention to the longer- t e r mpicture provided by monthlyand weekly data.
One reason monthly andweekly analysis is important iscommon technical studies suchas the moving average conver-g e n c e - d i v e rgence (MACD)tend to give stronger signalswhen longer-term data is used.We’ll show how to use theMACD indicator to establish atop-down (long-term to short-term) analysis approach.
F i g u re 1 (right), a monthlychart of the British pound withthe MACD histogram (see“Moving average converg e n c e -d i v e rgence,” opposite page),shows how starting with along-term view will keep youon the correct side of the mar-ket. In early 1991, the first rallyin the British pound to the 2.000
level was confirmed by the MACD, asindicated by the upward-sloping line 1.H o w e v e r, the second test of the samelevel in August 1992 corresponded witha negative divergence between the priceand the MACD, indicated by the down-w a rd-sloping line 2. (A d i v e rg e n c eoccurs when price moves in one dire c-tion and the indicator moves in theopposite direction.) Longer-term diver-gences such as this can alert the trader topotential weakness in the market. Hadyou reacted to this sign, you would have
been ready when the free fall started.
As with most technical indicators, themost reliable MACD signals occur whenthe monthly, weekly and daily analysesa re all in agreement. However, this is notalways the case; a lack of agre e m e n tbetween the time periods may cause sometraders to miss significant opportunitiesor trade the wrong side of the market.
To get a better feel for how to use theMACD, let’s first set a few guidelines
30 www.activetradermag.com • June 2001 • ACTIVE TRADER
The MACD divergence identified by line 2 on this monthly chart warned that theBritish pound was ripe for a downturn.
FIGURE 1 BIG PICTURE
British pound, monthly
1 2
3/31/87 10/31/88 5/31/90 12/31/91 7/30/93 2/28/95 9/30/96 4/30/98 11/30/99
2 . 0 5 0 0
1 . 9 8 0 0
1 . 9 1 0 0
1 . 8 4 0 0
1 . 7 7 0 0
1 . 6 3 0 0
1 . 5 6 0 0
1 . 4 9 0 0
1 . 4 2 0 0
1 . 3 5 0 0
0 . 0 5 3 7
0 . 0 3 3 7
0 . 0 1 3 7
- 0 . 0 0 6 3
- 0 . 0 2 6 3
- 0 . 0 4 6 3
Source: Strategem Software and Bridge Data
MACD divergencesNo matter what market you trade, taking
a top-down approach can save you from bad
decisions. Here’s how to use the MACD indicator
to identify longer-term turning points that set up
short-term trades.
TRADING Strategies
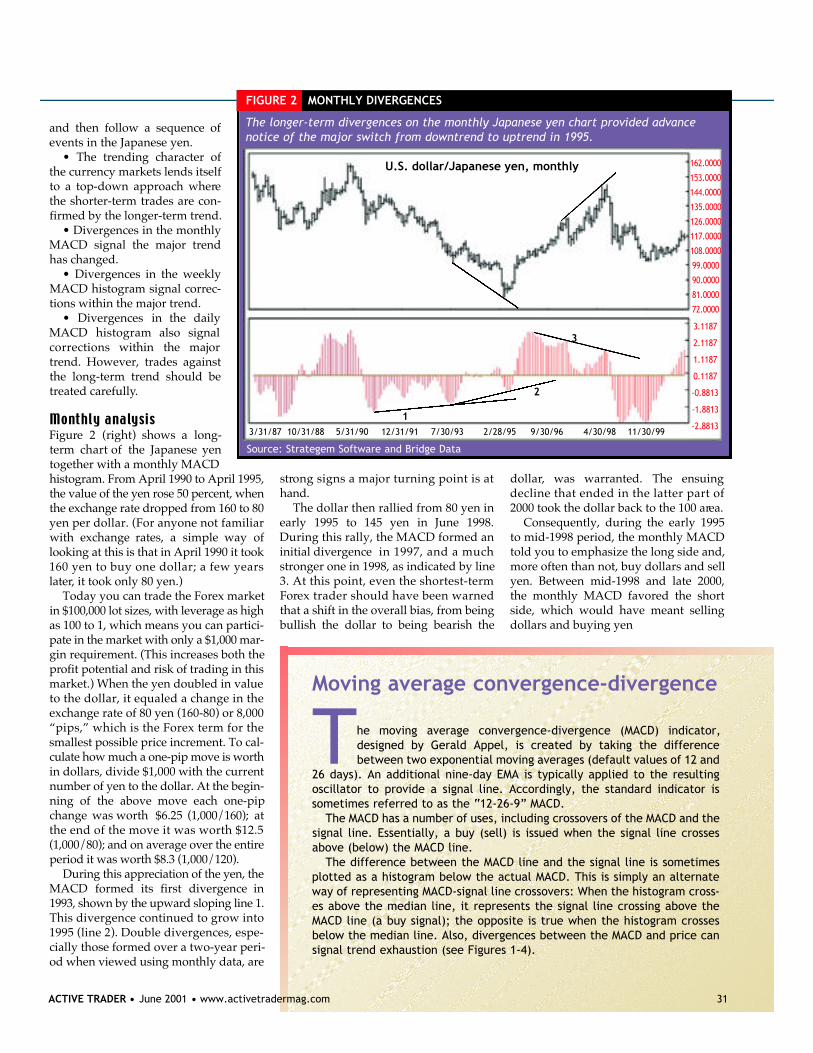
and then follow a sequence ofevents in the Japanese yen.
• The trending character ofthe currency markets lends itselfto a top-down approach wherethe shorter-term trades are con-firmed by the longer-term trend.
• Divergences in the monthlyMACD signal the major trendhas changed.
• Divergences in the weeklyMACD histogram signal correc-tions within the major trend.
• Divergences in the dailyMACD histogram also signalc o r rections within the majortrend. However, trades againstthe long-term trend should betreated carefully.
F i g u re 2 (right) shows a long-term chart of the Japanese yentogether with a monthly MACDhistogram. From April 1990 to April 1995,the value of the yen rose 50 percent, whenthe exchange rate dropped from 160 to 80yen per dollar. (For anyone not familiarwith exchange rates, a simple way oflooking at this is that in April 1990 it took160 yen to buy one dollar; a few yearsl a t e r, it took only 80 yen.)
Today you can trade the Forex marketin $100,000 lot sizes, with leverage as highas 100 to 1, which means you can partici-pate in the market with only a $1,000 mar-gin re q u i rement. (This increases both thep rofit potential and risk of trading in thismarket.) When the yen doubled in valueto the dollar, it equaled a change in theexchange rate of 80 yen (160-80) or 8,000“pips,” which is the Forex term for thesmallest possible price increment. To cal-culate how much a one-pip move is worthin dollars, divide $1,000 with the curre n tnumber of yen to the dollar. At the begin-ning of the above move each one-pipchange was worth $6.25 (1,000/160); atthe end of the move it was worth $12.5(1,000/80); and on average over the entireperiod it was worth $8.3 (1,000/120).
During this appreciation of the yen, theMACD formed its first divergence in1993, shown by the upward sloping line 1.This divergence continued to grow into1995 (line 2). Double divergences, espe-cially those formed over a two-year peri-od when viewed using monthly data, are
s t rong signs a major turning point is ath a n d .
The dollar then rallied from 80 yen inearly 1995 to 145 yen in June 1998.During this rally, the MACD formed aninitial divergence in 1997, and a muchs t ronger one in 1998, as indicated by line3. At this point, even the shortest-termF o rex trader should have been warnedthat a shift in the overall bias, from beingbullish the dollar to being bearish the
d o l l a r, was warranted. The ensuingdecline that ended in the latter part of2000 took the dollar back to the 100 are a .
Consequently, during the early 1995to mid-1998 period, the monthly MACDtold you to emphasize the long side and,more often than not, buy dollars and sellyen. Between mid-1998 and late 2000,the monthly MACD favored the shortside, which would have meant sellingdollars and buying yen
The longer-term divergences on the monthly Japanese yen chart provided advancenotice of the major switch from downtrend to uptrend in 1995.
FIGURE 2 MONTHLY DIVERGENCES
U.S. dollar/Japanese yen, monthly
1
3
2
3/31/87 10/31/88 5/31/90 12/31/91 7/30/93 2/28/95 9/30/96 4/30/98 11/30/99
1 6 2 . 0 0 0 0
1 5 3 . 0 0 0 0
1 4 4 . 0 0 0 0
1 3 5 . 0 0 0 0
1 2 6 . 0 0 0 0
1 1 7 . 0 0 0 0
1 0 8 . 0 0 0 0
9 9 . 0 0 0 0
9 0 . 0 0 0 0
8 1 . 0 0 0 0
7 2 . 0 0 0 0
3 . 1 1 8 7
2 . 1 1 8 7
1 . 1 1 8 7
0 . 1 1 8 7
- 0 . 8 8 1 3
- 1 . 8 8 1 3
- 2 . 8 8 1 3
Source: Strategem Software and Bridge Data
Moving average convergence-divergence
The moving average convergence-divergence (MACD) indicator,designed by Gerald Appel, is created by taking the differencebetween two exponential moving averages (default values of 12 and
26 days). An additional nine-day EMA is typically applied to the resultingoscillator to provide a signal line. Accordingly, the standard indicator issometimes referred to as the “12-26-9” MACD.
The MACD has a number of uses, including crossovers of the MACD and thesignal line. Essentially, a buy (sell) is issued when the signal line crossesabove (below) the MACD line.
The difference between the MACD line and the signal line is sometimesplotted as a histogram below the actual MACD. This is simply an alternateway of representing MACD-signal line crossovers: When the histogram cross-es above the median line, it represents the signal line crossing above theMACD line (a buy signal); the opposite is true when the histogram crossesbelow the median line. Also, divergences between the MACD and price cansignal trend exhaustion (see Figures 1-4).
ACTIVE TRADER • June 2001 • www.activetradermag.com 31
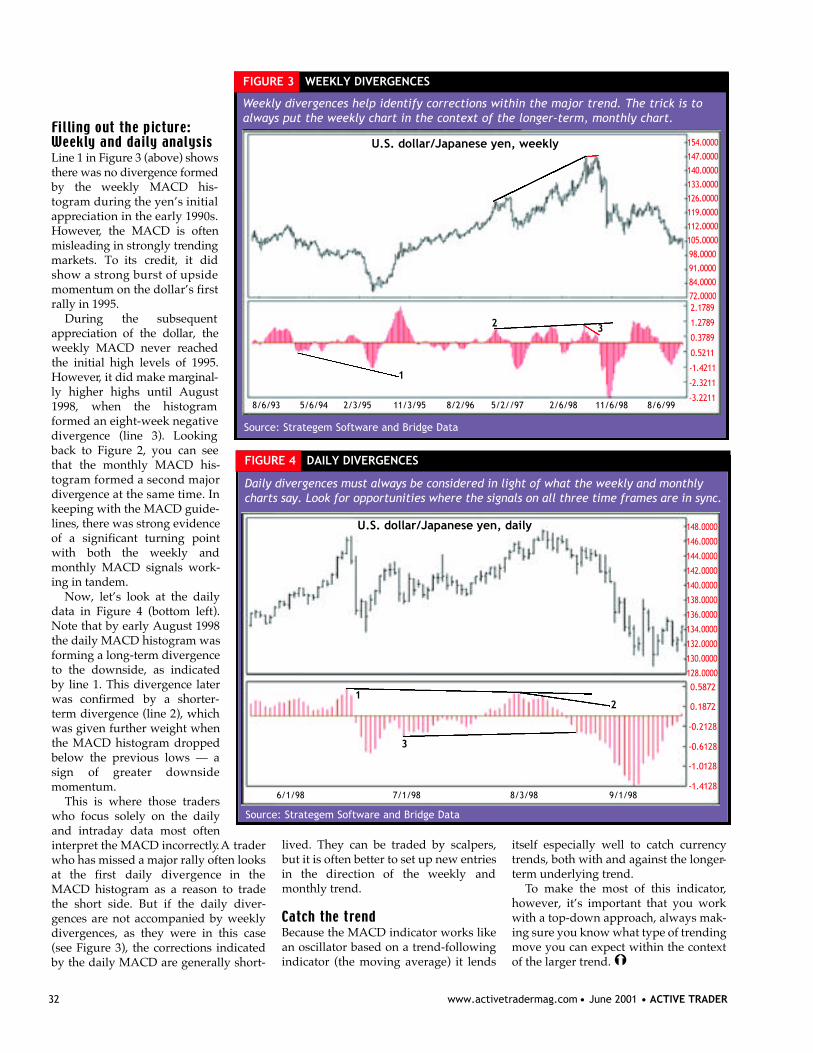
32 www.activetradermag.com • June 2001 • ACTIVE TRADER
Line 1 in Figure 3 (above) showst h e re was no divergence formedby the weekly MACD his-togram during the yen’s initiala p p reciation in the early 1990s.H o w e v e r, the MACD is oftenmisleading in strongly tre n d i n gmarkets. To its credit, it didshow a strong burst of upsidemomentum on the dollar’s firstrally in 1995.
During the subsequenta p p reciation of the dollar, theweekly MACD never re a c h e dthe initial high levels of 1995.H o w e v e r, it did make marg i n a l-ly higher highs until A u g u s t1998, when the histogramformed an eight-week negatived i v e rgence (line 3). Lookingback to Figure 2, you can seethat the monthly MACD his-togram formed a second majord i v e rgence at the same time. Inkeeping with the MACD guide-lines, there was strong evidenceof a significant turning pointwith both the weekly andmonthly MACD signals work-ing in tandem.
Now, let’s look at the dailydata in Figure 4 (bottom left).Note that by early August 1998the daily MACD histogram wasforming a long-term divergenceto the downside, as indicatedby line 1. This divergence laterwas confirmed by a shorter-term divergence (line 2), whichwas given further weight whenthe MACD histogram droppedbelow the previous lows — asign of greater downsidemomentum.
This is where those traderswho focus solely on the dailyand intraday data most ofteninterpret the MACD incorrectly.A traderwho has missed a major rally often looksat the first daily divergence in theMACD histogram as a reason to tradethe short side. But if the daily diver-gences are not accompanied by weeklydivergences, as they were in this case(see Figure 3), the corrections indicatedby the daily MACD are generally short-
lived. They can be traded by scalpers,but it is often better to set up new entriesin the direction of the weekly andmonthly trend.
Because the MACD indicator works likean oscillator based on a trend-followingindicator (the moving average) it lends
itself especially well to catch currencytrends, both with and against the longer-term underlying trend.
To make the most of this indicator,however, it’s important that you workwith a top-down approach, always mak-ing sure you know what type of trendingmove you can expect within the contextof the larger trend.Ý
Daily divergences must always be considered in light of what the weekly and monthlycharts say. Look for opportunities where the signals on all three time frames are in sync.
FIGURE 4 DAILY DIVERGENCES
U.S. dollar/Japanese yen, daily
1
3
2
6/1/98 7/1/98 8/3/98 9/1/98
1 4 8 . 0 0 0 0
1 4 6 . 0 0 0 0
1 4 4 . 0 0 0 0
1 4 2 . 0 0 0 0
1 4 0 . 0 0 0 0
1 3 8 . 0 0 0 0
1 3 6 . 0 0 0 0
1 3 4 . 0 0 0 0
1 3 2 . 0 0 0 0
1 3 0 . 0 0 0 0
1 2 8 . 0 0 0 0
0 . 5 8 7 2
0 . 1 8 7 2
- 0 . 2 1 2 8
- 0 . 6 1 2 8
- 1 . 0 1 2 8
- 1 . 4 1 2 8
Source: Strategem Software and Bridge Data
Weekly divergences help identify corrections within the major trend. The trick is toalways put the weekly chart in the context of the longer-term, monthly chart.
FIGURE 3 WEEKLY DIVERGENCES
U.S. dollar/Japanese yen, weekly
1
32
8/6/93 5/6/94 2/3/95 11/3/95 8/2/96 5/2//97 2/6/98 11/6/98 8/6/99
1 5 4 . 0 0 0 0
1 4 7 . 0 0 0 0
1 4 0 . 0 0 0 0
1 3 3 . 0 0 0 0
1 2 6 . 0 0 0 0
1 1 9 . 0 0 0 0
1 1 2 . 0 0 0 0
1 0 5 . 0 0 0 0
9 8 . 0 0 0 0
9 1 . 0 0 0 0
8 4 . 0 0 0 0
7 2 . 0 0 0 02 . 1 7 8 9
1 . 2 7 8 9
0 . 3 7 8 9
0 . 5 2 1 1
- 1 . 4 2 1 1
- 2 . 3 2 1 1
- 3 . 2 2 1 1
Source: Strategem Software and Bridge Data
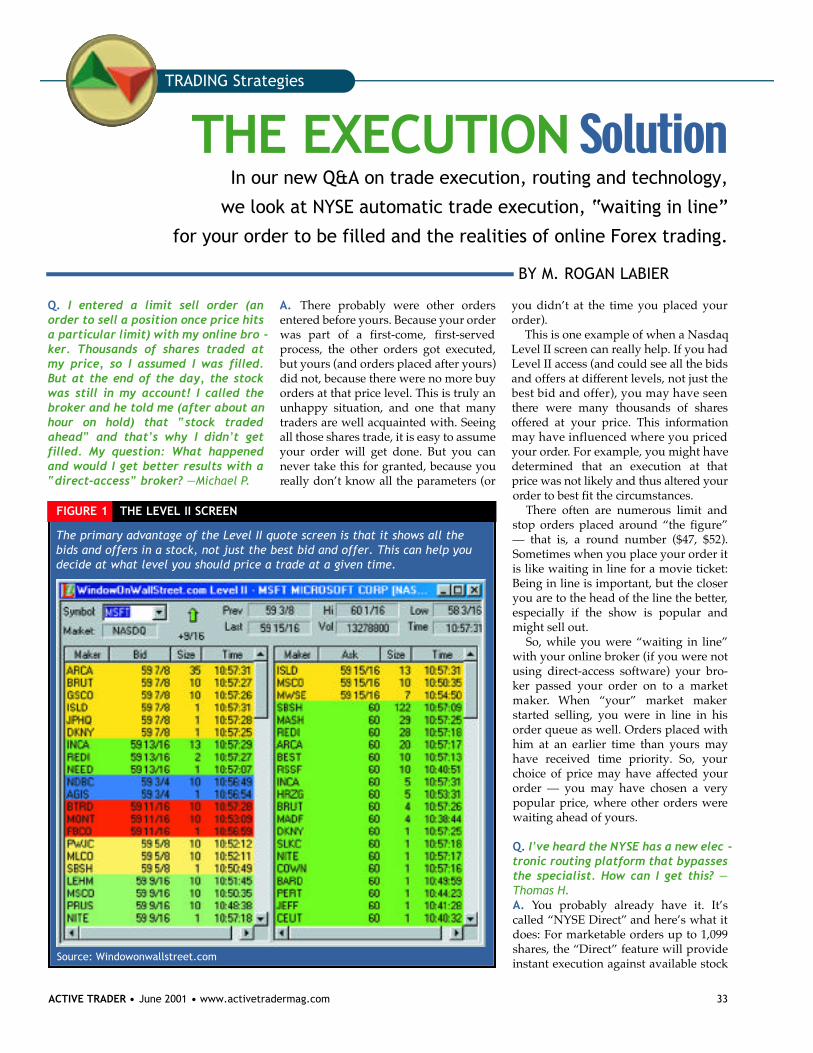
Q. I entered a limit sell order (anorder to sell a position once price hitsa particular limit) with my online bro -ker. Thousands of shares traded atmy price, so I assumed I was filled.But at the end of the day, the stockwas still in my account! I called thebroker and he told me (after about anhour on hold) that “stock tradedahead” and that’s why I didn’t getfilled. My question: What happenedand would I get better results with a“direct-access” broker? —Michael P.
A. There probably were other ordersentered before yours. Because your orderwas part of a first-come, first-servedprocess, the other orders got executed,but yours (and orders placed after yours)did not, because there were no more buyorders at that price level. This is truly anunhappy situation, and one that manytraders are well acquainted with. Seeingall those shares trade, it is easy to assumeyour order will get done. But you cannever take this for granted, because youreally don’t know all the parameters (or
you didn’t at the time you placed yourorder).
This is one example of when a NasdaqLevel II screen can really help. If you hadLevel II access (and could see all the bidsand offers at diff e rent levels, not just thebest bid and offer), you may have seent h e re were many thousands of share so ff e red at your price. This informationmay have influenced where you pricedyour ord e r. For example, you might havedetermined that an execution at thatprice was not likely and thus altered youro rder to best fit the circumstances.
There often are numerous limit andstop orders placed around “the figure”— that is, a round number ($47, $52).Sometimes when you place your order itis like waiting in line for a movie ticket:Being in line is important, but the closeryou are to the head of the line the better,especially if the show is popular andmight sell out.
So, while you were “waiting in line”with your online broker (if you were notusing direct-access software) your bro-ker passed your order on to a marketm a k e r. When “your” market makerstarted selling, you were in line in hisorder queue as well. Orders placed withhim at an earlier time than yours mayhave received time priority. So, yourchoice of price may have affected yourorder — you may have chosen a verypopular price, where other orders werewaiting ahead of yours.
Q. I’ve heard the NYSE has a new elec -tronic routing platform that bypassesthe specialist. How can I get this? —Thomas H.A. You probably already have it. It’scalled “NYSE Direct” and here’s what itdoes: For marketable orders up to 1,099shares, the “Direct” feature will provideinstant execution against available stock
ACTIVE TRADER • June 2001 • www.activetradermag.com 33
TRADING Strategies
The primary advantage of the Level II quote screen is that it shows all thebids and offers in a stock, not just the best bid and offer. This can help youdecide at what level you should price a trade at a given time.
FIGURE 1 THE LEVEL II SCREEN
Source: Windowonwallstreet.com
TH E E X E C U T I O N S o l u t i o nIn our new Q&A on trade execution, routing and technology,
we look at NYSE automatic trade execution, “waiting in line”
for your order to be filled and the realities of online Forex trading.
BY M. ROGAN LABIER
in price-time priority (i.e., first-come,first-served) without passing thro u g hthe hands of the specialist.
Member firms of the NYSE have inte-grated the feature, called “NYSE Direct,”into their software platforms. When youplace an order to the NYSE, it will be sentto an NYSE member firm your brokeragehas an agreement with; that memberfirm will in turn send the order to thefloor of the exchange. If an immediatee l e c t ronic execution is possible, themember firm will automatically desig-nate the order “Direct.” If your ordercannot be executed in its entirety (in thecase of a limit order where the total num-ber of shares you want to buy or sell arenot available), the remaining orders gointo the specialist’s book.
As a retail user, you do not need to doanything different to take advantage ofNYSE Direct. The new feature is an add-on to the SuperDot system and was qui-etly rolled out in December 2000.
Has this new feature significantlyspeeded up orders? Results aren’t avail-able yet, but take note — next time youtrade a small amount of an NYSE stock,your order may have “gone direct.”
Q. My browser crashes all the time; itseems to happen especially when I goto place an order (to my online bro -ker). What can I do? —Wendy Z.A . First of all, make sure that you clearyour “Temporary Internet Files” (alsocalled browser “cache”) on a re g u l a rbasis (Temporary Internet Files is a dire c-tory within the Windows dire c t o r y ) .These files are all the pages, pictures, etc.,you have looked at online. Your bro w s e rs t o res these files on an ongoing basis andif you do a lot of Web surfing, you willrapidly build up a huge collection.
When you try to access a particularWeb page, it will first check theTemporary Internet Files folder to see ifthat page is already stored. But thischecking process can grind to a halt asthe number of files in this folder becomesu n w i e l d y. As a result, your browser ceas-es to function. For easy, step-by-stepd i rections on how to clear the files, go tow w w. o rd e r X c h a t . c o m / c l e a r.htm. For arelated discussion go to www. o rd e r Xc h a t . c o m / t r a c e r t . h t m .
Q. I’ve heard about day trading theForex currency market. How does thespeed of execution in the Forex mar -
ket compare to direct-access tradingof stock? —Richard P.A. In the last couple of years, as direct-access equity trading systems havematured, Forex trading platforms havecome online. However, execution in theForex market is different from Nasdaqtrading in many respects.
Without getting into the particulars ofc u r rency trading, I’ll concentrate on theexecution question. In the Forex market,retail traders do not trade directly in theinterbank market (the network of banksand institutions among which the tradesa re actually executed). Rather, the mem-bers of the interbank market create a mar-ket “around” the bids and offers. Thesebids and offers are the prices available tothe retail trader. Often, there are no for-mal commission charges in Forex trad-ing; the currency trading firms pro f i tf rom the spreads they set. Better firmsmake very tight markets. However, sinceretail traders don’t have access to theactual interbank quotes, it is difficult tomonitor just how tight the firm is keepingits market.
T h e re are essentially two types of
firms. Both maintain two-sided marketsand display those quotes in their soft-ware. However, some firms guarantee tohonor those quotes, while others do not.In the former case, the quotes presentedin the software are firm, and you mayexecute against them at any time. In thelatter case, you must request a quote forthe trade you would like to execute. Aquote will be provided immediately,against which you may execute. So, exe-cution in the online Forex markets can bevery fast, but the process is significantlydifferent from execution in the equitymarkets.
As time goes on, innovations will cer-tainly occur in online Forex trading,making the market more accessible toretail traders. After all, the Forex marketis a true 24-hour market. It moves fromregion to region across the globe, linkedup continuously at the interbank level.The global foreign exchange market ishuge on a dollar volume, around 140times bigger than the NYSE on a dailybasis. Forex trading is ubiquitous inEurope, and is rapidly gaining populari-ty in the United States.Ý
34 www.activetradermag.com • June 2001 • ACTIVE TRADER
On a PC, the “C:/Windows/Temporary Internet Files” folder contains all theWeb pages and images you’ve downloaded to your computer when surfing theWeb. When this folder becomes too congested, it can slow down your browser(or cause crashes). Emptying it from time to time can improve performance.
FIGURE 2 TEMPORARY INTERNET FILES
Source: Microsoft
ACTIVE TRADER • June 2001 • www.activetradermag.com 35
O f all the price-based techni-cal indicators, few are aspopular as simple movingaverages. A simple mov-
ing average (SMA) is the average of aspecific price point, usually the close,over a prescribed time period.
The primary function of moving aver -ages is to “smooth” prices, thus identify-ing the underlying trend. Countless sys-tems have been built using moving aver-ages and many billions of dollars tradedbased on their signals. As a tool, they arerobust, simple to construct and easy tounderstand.
As with all technical indicators, SMAshave their limitations. Since they smoothpast data, they lag the actual price move-ment (i.e., any decline in the price of astock will not be detected by the SMAu n t i lseveral time periods later). Many attemptshave been made to make moving averagesm o re sensitive to recent data. The weight-ed moving average (WMA), for example,
gives greater weight to recent data.S i m i l a r l y, the exponential moving average(XMA) also gives the greatest weight tothe most recent data, but unlike the WMA,the XMA takes all available data intoaccount. In these instances, fixed weightsa re assigned to the data in calculating themoving average.
The variable-index dynamic movingaverage (VIDYA), originally developedin 1992, uses market information — suchas volatility — to make the weightingscheme used to compute the movingaverage more responsive to market
action. Since its inception, it has beenadded to many commercial softwarepackages and inspired many othertraders to build their own dynamic mov-ing averages.
One of the features of VIDYA thatmakes it particularly attractive is that itflattens when the market consolidates.(To learn more about this indicator seeThe New Technical Trader, Chande andK roll, John Wiley & Sons, 1994, andBeyond Technical Analysis, second edition,John Wiley & Sons, 2001.)
H o w e v e r, a new variable moving aver-age — one that is, like VIDYA, re s p o n s i v eto market consolidations but is more
ADVANCED Strategies
M E A S U R I N G trend momentumMost technical analysis
indicators monitor either
price direction or price
m o m e n t u m .
H e r e ’s an indicator that
does both, changing
its behavior with the
dynamics of the market.
BY TUSHAR CHANDE
trend momentum
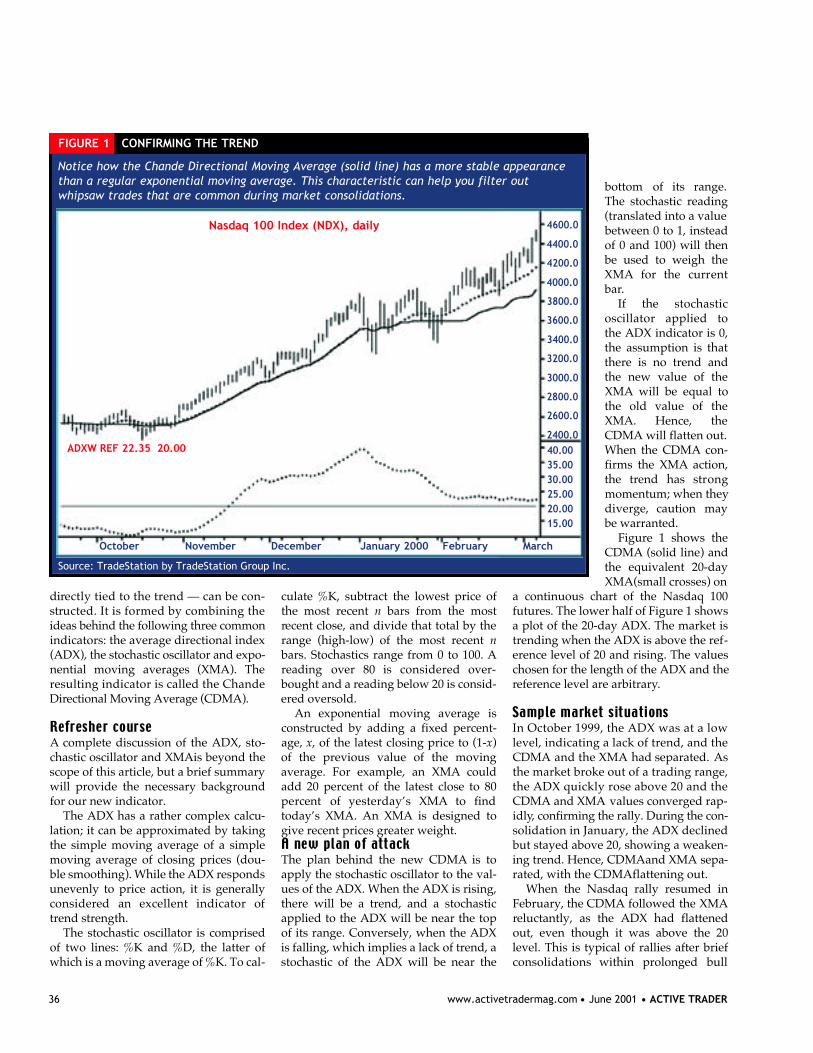
36 www.activetradermag.com • June 2001 • ACTIVE TRADER
d i rectly tied to the trend — can be con-s t ructed. It is formed by combining theideas behind the following three commonindicators: the average directional index(ADX), the stochastic oscillator and expo-nential moving averages (XMA). Theresulting indicator is called the ChandeD i rectional Moving Average (CDMA).
A complete discussion of the ADX, sto-chastic oscillator and XMAis beyond thescope of this article, but a brief summarywill provide the necessary backgroundfor our new indicator.
The ADX has a rather complex calcu-lation; it can be approximated by takingthe simple moving average of a simplemoving average of closing prices (dou-ble smoothing). While the ADX respondsunevenly to price action, it is generallyc o n s i d e red an excellent indicator oftrend strength.
The stochastic oscillator is comprisedof two lines: %K and %D, the latter ofwhich is a moving average of %K. To cal-
culate %K, subtract the lowest price ofthe most recent n bars from the mostrecent close, and divide that total by therange (high-low) of the most recent nbars. Stochastics range from 0 to 100. Areading over 80 is considered over-bought and a reading below 20 is consid-ered oversold.
An exponential moving average isconstructed by adding a fixed percent-age, x, of the latest closing price to (1-x)of the previous value of the movingaverage. For example, an XMA couldadd 20 percent of the latest close to 80p e rcent of yesterday’s XMA to findtoday’s XMA. An XMA is designed togive recent prices greater weight.
The plan behind the new CDMA is toapply the stochastic oscillator to the val-ues of the ADX. When the ADX is rising,there will be a trend, and a stochasticapplied to the ADX will be near the topof its range. Conversely, when the ADXis falling, which implies a lack of trend, astochastic of the ADX will be near the
bottom of its range.The stochastic reading(translated into a valuebetween 0 to 1, insteadof 0 and 100) will thenbe used to weigh theX M A for the curre n tbar.
If the stochasticoscillator applied tothe ADX indicator is 0,the assumption is thatthere is no trend andthe new value of theXMA will be equal tothe old value of theXMA. Hence, theCDMA will flatten out.When the CDMA con-firms the XMA action,the trend has stro n gmomentum; when theyd i v e rge, caution maybe warranted.
Figure 1 shows theCDMA (solid line) andthe equivalent 20-dayXMA(small crosses) on
a continuous chart of the Nasdaq 100futures. The lower half of Figure 1 showsa plot of the 20-day ADX. The market istrending when the ADX is above the ref-erence level of 20 and rising. The valueschosen for the length of the ADX and thereference level are arbitrary.
In October 1999, the ADX was at a lowlevel, indicating a lack of trend, and theC D M A and the XMA had separated. A sthe market broke out of a trading range,the ADX quickly rose above 20 and theC D M A and XMA values converged rap-i d l y, confirming the rally. During the con-solidation in January, the ADX declinedbut stayed above 20, showing a weaken-ing trend. Hence, CDMAand XMA s e p a-rated, with the CDMAflattening out.
When the Nasdaq rally resumed inFebruary, the CDMA followed the XMAreluctantly, as the ADX had flattenedout, even though it was above the 20level. This is typical of rallies after briefconsolidations within prolonged bull
Notice how the Chande Directional Moving Average (solid line) has a more stable appearancethan a regular exponential moving average. This characteristic can help you filter out whipsaw trades that are common during market consolidations.
FIGURE 1 CONFIRMING THE TREND
October November December January 2000 February March
4600.0
4400.0
4200.0
4000.0
3800.0
3600.0
3400.0
3200.0
3000.0
2800.0
2600.0
2400.040.0035.0030.0025.0020.0015.00
Nasdaq 100 Index (NDX), daily
Source: TradeStation by TradeStation Group Inc.
ADXW REF 22.35 20.00
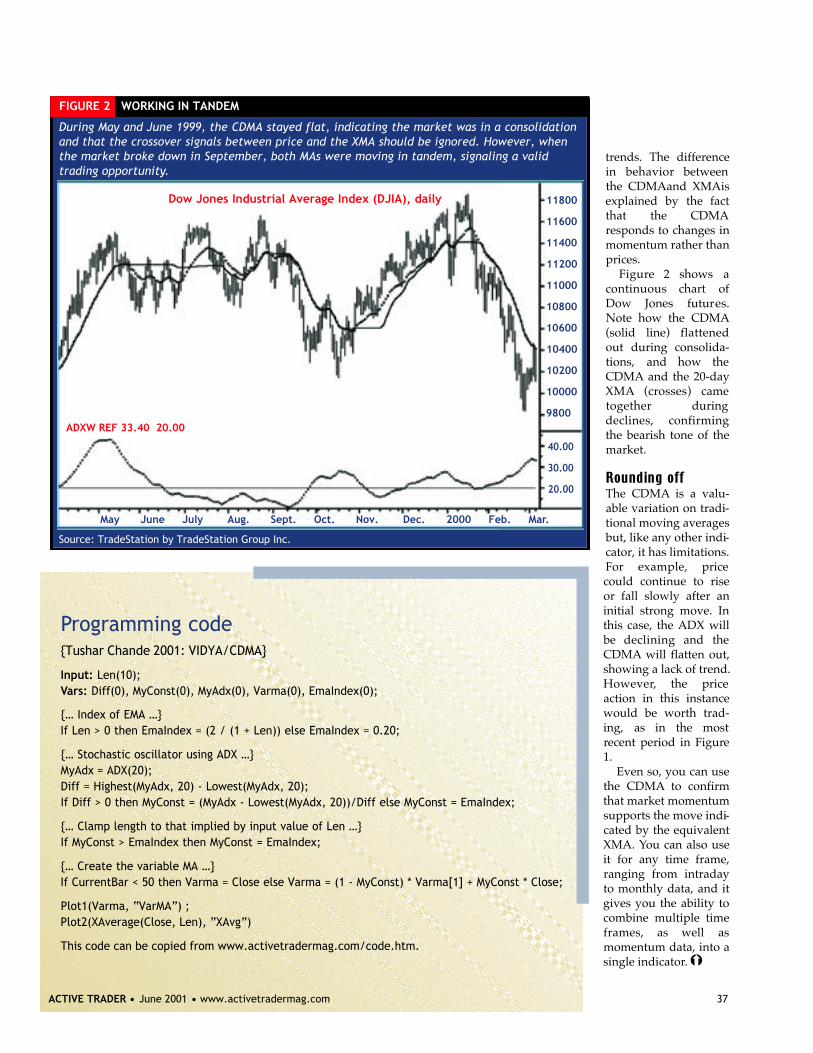
trends. The differencein behavior betweenthe CDMAand XMAisexplained by the factthat the CDMAresponds to changes inmomentum rather thanprices.
F i g u re 2 shows acontinuous chart ofDow Jones future s .Note how the CDMA(solid line) flattenedout during consolida-tions, and how theCDMA and the 20-dayX M A ( c rosses) cametogether duringdeclines, confirmingthe bearish tone of themarket.
The CDMA is a valu-able variation on tradi-tional moving averagesbut, like any other indi-cator, it has limitations.For example, pricecould continue to riseor fall slowly after aninitial strong move. Inthis case, the ADX willbe declining and theCDMA will flatten out,showing a lack of trend.H o w e v e r, the priceaction in this instancewould be worth trad-ing, as in the mostrecent period in Figure1.
Even so, you can usethe CDMA to confirmthat market momentumsupports the move indi-cated by the equivalentXMA. You can also useit for any time frame,ranging from intradayto monthly data, and itgives you the ability tocombine multiple timeframes, as well asmomentum data, into asingle indicator.Ý
Programming code {Tushar Chande 2001: VIDYA/CDMA}
Input: Len(10);Vars: Diff(0), MyConst(0), MyAdx(0), Varma(0), EmaIndex(0);
{… Index of EMA …}If Len > 0 then EmaIndex = (2 / (1 + Len)) else EmaIndex = 0.20;
{… Stochastic oscillator using ADX …}MyAdx = ADX(20);Diff = Highest(MyAdx, 20) - Lowest(MyAdx, 20);If Diff > 0 then MyConst = (MyAdx - Lowest(MyAdx, 20))/Diff else MyConst = EmaIndex;
{… Clamp length to that implied by input value of Len …}If MyConst > EmaIndex then MyConst = EmaIndex;
{… Create the variable MA …}If CurrentBar < 50 then Varma = Close else Varma = (1 - MyConst) * Varma[1] + MyConst * Close;
Plot1(Varma, “VarMA”) ;Plot2(XAverage(Close, Len), ”XAvg”)
This code can be copied from www.activetradermag.com/code.htm.
During May and June 1999, the CDMA stayed flat, indicating the market was in a consolidationand that the crossover signals between price and the XMA should be ignored. However, whenthe market broke down in September, both MAs were moving in tandem, signaling a validtrading opportunity.
FIGURE 2 WORKING IN TANDEM
May June July Aug. Sept. Oct. Nov. Dec. 2000 Feb. Mar.
40.00
30.00
20.00
Dow Jones Industrial Average Index (DJIA), daily
Source: TradeStation by TradeStation Group Inc.
11800
11600
11400
11200
11000
10800
10600
10400
10200
10000
9800ADXW REF 33.40 20.00
ACTIVE TRADER • June 2001 • www.activetradermag.com 37

38 www.activetradermag.com • June 2001 • ACTIVE TRADER
Markets: Stocks, stock index futures, indextracking stocks (SPYs, DIAs, QQQs), futuresand currencies
System logic:This system is a combination of two techniquestested in previous issues of Active Trader. Themoving average slope (MAS) trend filter(“Building a better trend indicator,” May 2001,p. 80) and the Meander short-term entry tech-nique (“Moving beyond the closing price,”October 2000, p.100, and the January/February2001 Trading System Lab, p. 108).
The following test uses six foreign currencies. We also decid-ed to test only the robustness of the entry technique; the exitstrategy is to close each position after two days, rain or shine.
The MAS indicator is the difference between today’s 80-daymoving average value and its value 11 days ago. When today’smoving average value is higher than it was 11 days ago, thetrend is considered to be up, and the system will look for longentry signals only. Reverse the reasoning for short trades.
The logic behind the Meander is a bit more complex. It’s acombination between Bollinger Bands and momentum thatuses all available price information from each bar, so that allopen, high, low and closing prices are treated equally in theindicator’s construction. Together with the MAS trend filter itallows you to identify short-term overbought and oversoldmarket conditions suitable for placing orders in the direction ofthe underlying trend.
Rules:1. Go long if the MAS indicator signals an uptrend and the
price crosses below the one standard deviation boundary of the Meander indicator (an oversold signal).
2. Go short if the MAS indicator signals a downtrend and the price crosses above the one standard deviation boundary of the Meander indicator (an overbought signal).
3. Exit all trades on the close after two days, counting the day for the entry as the first day in the trade, no matter how late in the day the entry took place.
Test period:January 1995 to March 2001
Test data: Daily currency spot prices against the dollar for theJapanese yen, Swiss franc, British pound, Canadian dollar,
Australian dollar and Euro (the Germanmark was used up until December 1998).No money was deducted for slippage andcommissions.
System analysis:First, there are a few numbers missing inthe strategy summary report because wehave calculated all values as percentagesinstead of dollars, which also means theequity chart shows the cumulative equitygrowth as a percentage rather than a dollarvalue. However, the results are perfectlyvalid for evaluating the system’s robust-ness. (The filter and entry techniques alsoare taken “as is” from the stock market andtherefore completely un-optimized for thecurrency markets.)
When evaluating this system a fewthings need to be addressed. The averagetrade is very small in percentage terms, butbecause the profits are continuously com-pounded and immediately put to use in all
Old faithful250
225
200
175
150
125
100
75
50
EQUITY CURVE
SAMPLE TRADES
115
114
113
112
111
110
109
108
107
106
105
Japanese yen, daily
September October November December
Source: TradeStation by TradeStation Group Inc.
Buy
Buy
BuyBuy
BuyBuy
Buy Buy Buy
Buy
LX
LXLX
LX
LXLXLX
LX
LX
LX
SX
SXSX
SX
SXSell
SellSell
Sell
Sell
The TRADING Systems Lab
1/23/95 7/24/95 1/22/96 7/22/96 1/20/97 7/21/97 7/20/98 1/18/99 7/19/99 1/17/00 7/17/00 1/15/01
ACTIVE TRADER • June 2001 • www.activetradermag.com 39
Disclaimer: The Trading System Lab is intended for educational purposes only to provide a perspective on different market concepts. It is not meant to recommend orpromote any trading system or approach. Traders are advised to do their own research and testing to determine the validity of a trading idea. Past performance does notguarantee future results; historical testing may not reflect a system’s behavior in real-time trading.
LEGEND: End. equity ($) — equity at the end of test period • Total return(%) — total percentage return over test period • Avg. annual ret. (%) —average continuously compounded annual return • Profit factor — grossprofit/gross loss • Avg. tied cap (%) — average percent of total available cap -ital tied up in open positions • Win. months (%) — percentage profitablemonths over test period • Max DD (%) — maximum drop in equity •Longest flat — longest period, in months, spent between two equity highs •No. trades — number of trades • Avg. trade ($) — amount won or lost bythe average trade • Avg. DIT— average days in trade • Avg. win/loss ($)— average wining and losing trade, respectively • Lrg. win/loss ($) —largest wining and losing trade, respectively • Win. trades (%) — percentwinning trades • TIM (%) — amount of time there is at least one open posi -tion for entire portfolio, and each market, respectively • Tr./Mark./Year —trades per market per year • Tr./Month — trades per month for all markets
LEGEND: Cumulative returns — Most recent: most recent return from start toend of the respective periods •Average: the average of all cumulative returns fromstart to end of the respective periods • Best: the best of all cumulative returns fromstart to end of the respective periods • Worst: the worst of all cumulative returnsfrom start to end of the respective periods • St. dev: the standard deviation of allcumulative returns from start to end of the respective periods
Annualized returns — The ending equity as a result of the cumulative returns,raised by 1/n, where n is the respective period in number of years
(33.3 months). If you would like to optimize thissystem, we recommend you focus on shorteningthis period to less than 18 months. This too couldbe remedied by adding a few stop and exit tech-niques, which also should help lower the draw-down. Remember, however, that both the draw-down and the length of the flat period are highlydependent on how all the markets within the port-folio interact. In this case, most markets went heav-ily against us during the Asian economic crisis inlate 1997 through late 1998.
Send Active Trader your systemsIf you have a trading system or idea you’d like to see tested,send it to us at the Trading System Lab. We’ll test it on aportfolio of stocks or futures (for now, max 30 markets, usingdaily data starting Jan. 1, 1990), using true portfolio analy-sis/optimization.
Most system testing software only allows you to test onemarket at a time. Our system testing technique lets all mar-kets share the same account and is based on the interactionwithin the portfolio as a whole.
Start by e-mailing system logic (in TradeStation’sEasyLanguage or in an Excel spreadsheet) and a short descrip-tion to [email protected], and we’ll get backto you.
Note: Each system must have a clearly defined stop losslevel and a suggested optimal amount to risk per trade.
DRAWDOWN CURVE1/23/95 7/24/95 1/22/96 7/22/96 1/20/97 7/21/97 7/20/98 1/18/99 7/19/99 1/17/00 7/17/00 1/15/01
0.00%
-5.00%
-10.00%
-15.00%
-20.00%
-25.00%
Profitability Trade statistics
End. equity ($): N/A No. trades: 1,653
Total return (%): 132 Avg. trade (%): 0.05
Avg. annual ret. (%): 15.0 Avg. DIT: 2.0
Profit factor: N/A Avg. win/loss (%): 0.60 (0.62)
Avg. tied cap ($): N/A Lrg. win/loss (%): 4.45 (6.12)
Win. months (%): 63.5 Win. trades(%): 55.0
Drawdown TIM (%): 88.0/34.3
Max DD (%): 21.6 Tr./Mark./Year: 45.9
Longest flat (m): 33.3 Tr./Month: 23.0
STRATEGY SUMMARY
future trades, even an average profit as small as this one willadd up over time, provided the system is robust. A few well-designed exit techniques should improve performance.
One major disadvantage of the system is that the flat period(time between two equity highs) is much too long for comfort
ROLLING TIME WINDOW RETURN ANALYSISCumulative 12 24 36 48 60
months months months months months
Most recent: 22.25% 28.81% 33.62% 26.49% 69.53%Average: 14.53% 26.42% 30.96% 50.08% 81.05%Best: 59.01% 92.05% 94.54% 95.66% 98.32%Worst: -16.09% -10.09% -3.90% 22.07% 57.28%St. dev.: 17.35% 30.15% 26.15% 21.54% 12.20%
Annualized 12 24 36 48 60 months months months months months
Most recent: 22.25% 13.49% 10.14% 6.05% 11.14%Average: 14.53% 12.44% 9.41% 10.68% 12.61%Best: 59.01% 38.58% 24.84% 18.27% 14.68%Worst: -16.09% -5.18% -1.32% 5.11% 9.48%St. dev: 17.35% 14.08% 8.05% 5.00% 2.33%
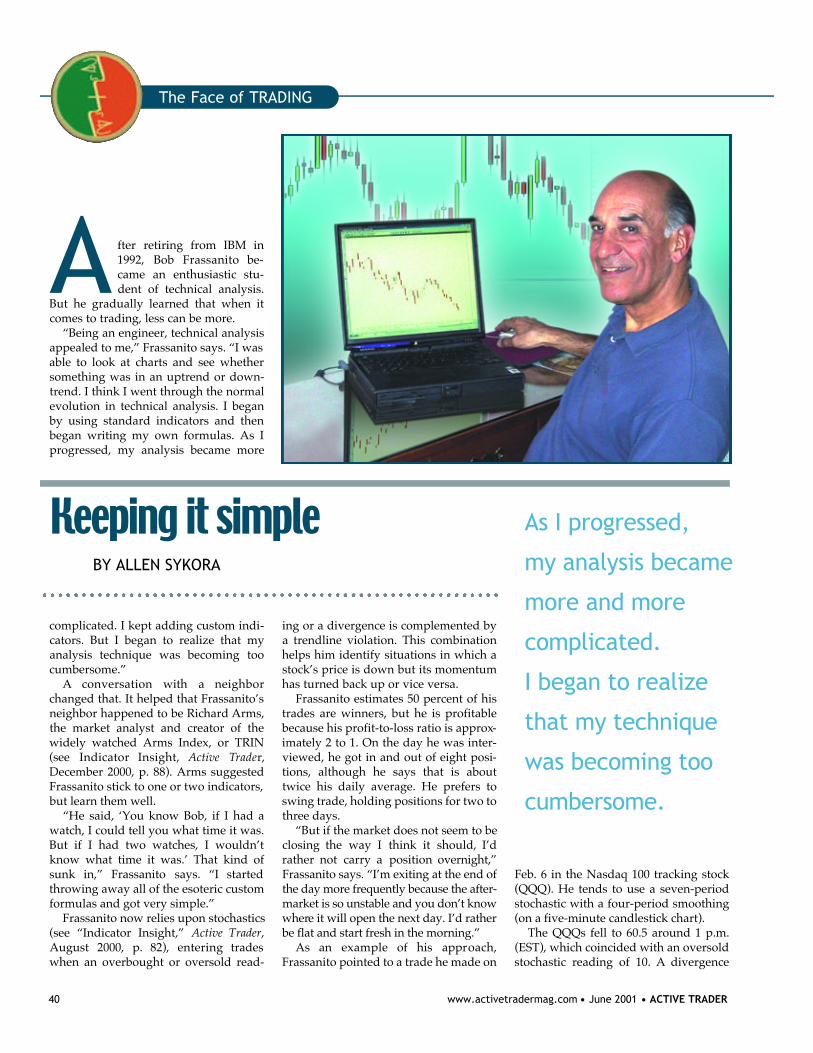
40 www.activetradermag.com • June 2001 • ACTIVE TRADER
A fter retiring from IBM in1992, Bob Frassanito be-came an enthusiastic stu-dent of technical analysis.
But he gradually learned that when itcomes to trading, less can be more.
“Being an engineer, technical analysisappealed to me,” Frassanito says. “I wasable to look at charts and see whethersomething was in an uptrend or down-trend. I think I went through the normalevolution in technical analysis. I beganby using standard indicators and thenbegan writing my own formulas. As Iprogressed, my analysis became more
complicated. I kept adding custom indi-cators. But I began to realize that myanalysis technique was becoming toocumbersome.”
A conversation with a neighborchanged that. It helped that Frassanito’sneighbor happened to be Richard Arms,the market analyst and creator of thewidely watched Arms Index, or TRIN(see Indicator Insight, Active Tr a d er,December 2000, p. 88). Arms suggestedFrassanito stick to one or two indicators,but learn them well.
“He said, ‘You know Bob, if I had awatch, I could tell you what time it was.But if I had two watches, I wouldn’tknow what time it was.’ That kind ofsunk in,” Frassanito says. “I startedthrowing away all of the esoteric customformulas and got very simple.”
Frassanito now relies upon stochastics(see “Indicator Insight,” Active Trader,August 2000, p. 82), entering tradeswhen an overbought or oversold read-
ing or a divergence is complemented bya trendline violation. This combinationhelps him identify situations in which astock’s price is down but its momentumhas turned back up or vice versa.
Frassanito estimates 50 percent of histrades are winners, but he is profitablebecause his profit-to-loss ratio is approx-imately 2 to 1. On the day he was inter-viewed, he got in and out of eight posi-tions, although he says that is abouttwice his daily average. He prefers toswing trade, holding positions for two tothree days.
“But if the market does not seem to beclosing the way I think it should, I’drather not carry a position overnight,”Frassanito says. “I’m exiting at the end ofthe day more frequently because the after-market is so unstable and you don’t knoww h e re it will open the next day. I’d ratherbe flat and start fresh in the morning.”
As an example of his appro a c h ,Frassanito pointed to a trade he made on
Feb. 6 in the Nasdaq 100 tracking stock(QQQ). He tends to use a seven-periodstochastic with a four-period smoothing(on a five-minute candlestick chart).
The QQQs fell to 60.5 around 1 p.m.(EST), which coincided with an oversoldstochastic reading of 10. A divergence
Keeping it simpleBY ALLEN SYKORA
The Face of TRADING
As I progressed,
my analysis became
more and more
complicated.
I began to realize
that my technique
was becoming too
c u m b e r s o m e .
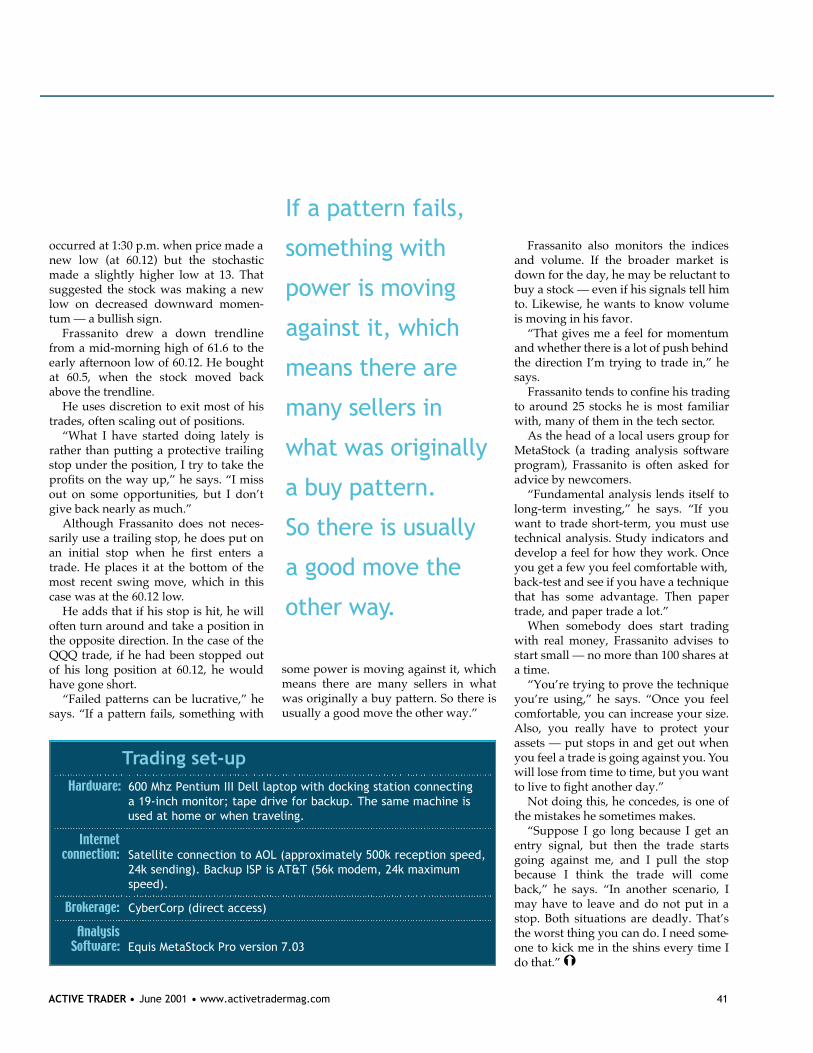
ACTIVE TRADER • June 2001 • www.activetradermag.com 41
occurred at 1:30 p.m. when price made anew low (at 60.12) but the stochasticmade a slightly higher low at 13. Thatsuggested the stock was making a newlow on decreased downward momen-tum — a bullish sign.
Frassanito drew a down tre n d l i n efrom a mid-morning high of 61.6 to theearly afternoon low of 60.12. He boughtat 60.5, when the stock moved backabove the trendline.
He uses discretion to exit most of histrades, often scaling out of positions.
“What I have started doing lately israther than putting a protective trailingstop under the position, I try to take theprofits on the way up,” he says. “I missout on some opportunities, but I don’tgive back nearly as much.”
Although Frassanito does not neces-sarily use a trailing stop, he does put onan initial stop when he first enters atrade. He places it at the bottom of themost recent swing move, which in thiscase was at the 60.12 low.
He adds that if his stop is hit, he willoften turn around and take a position inthe opposite direction. In the case of theQQQ trade, if he had been stopped outof his long position at 60.12, he wouldhave gone short.
“Failed patterns can be lucrative,” hesays. “If a pattern fails, something with
some power is moving against it, whichmeans there are many sellers in whatwas originally a buy pattern. So there isusually a good move the other way.”
Frassanito also monitors the indicesand volume. If the broader market isdown for the day, he may be reluctant tobuy a stock — even if his signals tell himto. Likewise, he wants to know volumeis moving in his favor.
“That gives me a feel for momentumand whether there is a lot of push behindthe direction I’m trying to trade in,” hesays.
Frassanito tends to confine his tradingto around 25 stocks he is most familiarwith, many of them in the tech sector.
As the head of a local users group forMetaStock (a trading analysis softwareprogram), Frassanito is often asked foradvice by newcomers.
“Fundamental analysis lends itself tolong-term investing,” he says. “If youwant to trade short-term, you must usetechnical analysis. Study indicators anddevelop a feel for how they work. Onceyou get a few you feel comfortable with,back-test and see if you have a techniquethat has some advantage. Then papertrade, and paper trade a lot.”
When somebody does start tradingwith real money, Frassanito advises tostart small — no more than 100 shares ata time.
“You’re trying to prove the techniqueyou’re using,” he says. “Once you feelcomfortable, you can increase your size.Also, you really have to protect yourassets — put stops in and get out whenyou feel a trade is going against you. Youwill lose from time to time, but you wantto live to fight another day.”
Not doing this, he concedes, is one ofthe mistakes he sometimes makes.
“Suppose I go long because I get anentry signal, but then the trade startsgoing against me, and I pull the stopbecause I think the trade will comeback,” he says. “In another scenario, Imay have to leave and do not put in astop. Both situations are deadly. That’sthe worst thing you can do. I need some-one to kick me in the shins every time Ido that.”Ý
Trading set-upHardware: 600 Mhz Pentium III Dell laptop with docking station connecting
a 19-inch monitor; tape drive for backup. The same machine is used at home or when traveling.
Internetconnection: Satellite connection to AOL (approximately 500k reception speed,
24k sending). Backup ISP is AT&T (56k modem, 24k maximum speed).
Brokerage: CyberCorp (direct access)
AnalysisSoftware: Equis MetaStock Pro version 7.03
If a pattern fails,
something with
power is moving
against it, which
means there are
many sellers in
what was originally
a buy pattern.
So there is usually
a good move the
other way.

42 www.activetradermag.com • June 2001 • ACTIVE TRADER
R isk unavoidably involves uncertainty, in trading asin all areas of life. One trader defines risk thisway: “Risk is how much you are willing to loseon any single bet,” he says. “This has to do
with your tolerance — your tolerance for uncertainty.Anything other than cash is risk.”
The most commonly emphasized aspect of risk con-trol is the need to curtail losses quickly. The flipside isdiscussed less frequently: Some traders suffer froman inability to assume thenecessary risk to realize ap rofit. No trader shouldincur risk unnecessarily,but a trader who tries tokeep losses too small willsimply put himself out ofbusiness incre m e n t a l l y. A l ltraders must understandthe environment inwhich they trade,learning to balancethe risks of themarket with theneed to acceptenough risk toprofit.
For the last 10years, I have partici-pated in the develop-ment of a short-term, cata-lyst-driven stock-tradinga p p roach built around the disci-pline of setting daily or weekly targ e t s .The objective is to minimize risk and maximizep rofitability by taking profits at the high point of the
TRADING Psychology
BY ARI KIEV, M.D.
Mind over MONEY MANAGEMENTMONEY MANAGEMENTThe risk door swings both ways: Taking too much risk or not taking enough
can sabotage your trading. Learn how to improve your understanding of risk
and trade according to the prevailing market conditions.
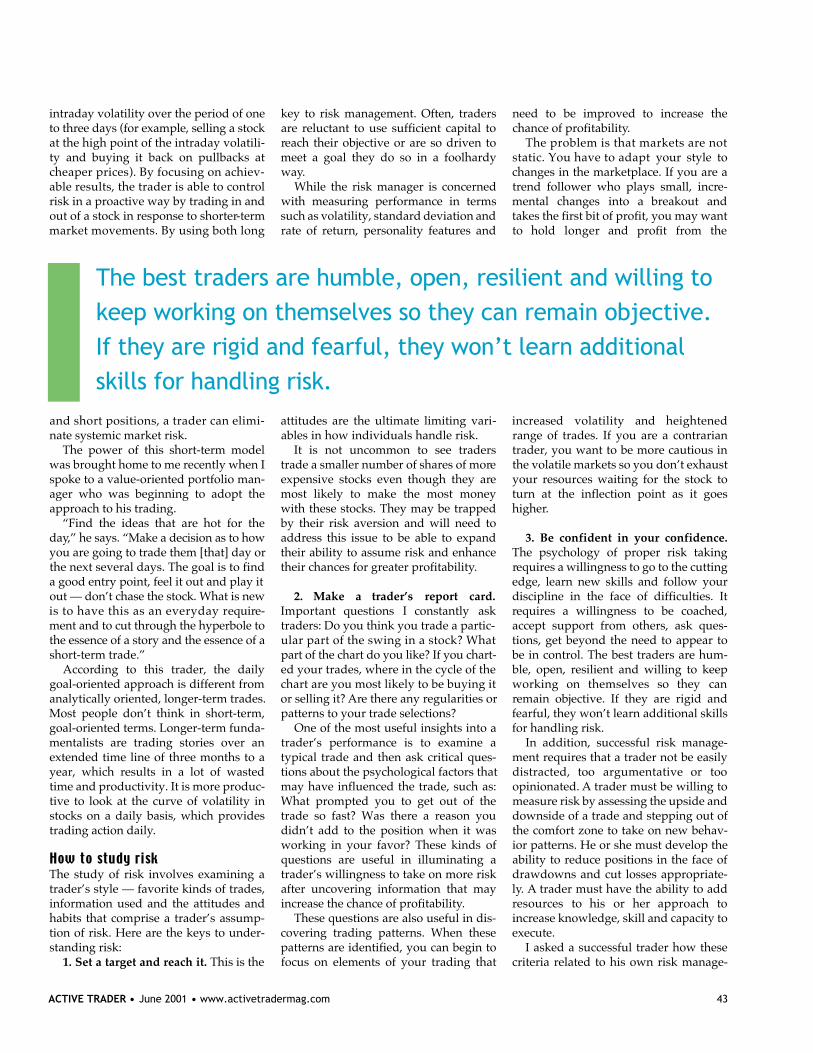
ACTIVE TRADER • June 2001 • www.activetradermag.com 43
intraday volatility over the period of oneto three days (for example, selling a stockat the high point of the intraday volatili-ty and buying it back on pullbacks atcheaper prices). By focusing on achiev-able results, the trader is able to contro lrisk in a proactive way by trading in andout of a stock in response to shorter- t e r mmarket movements. By using both long
and short positions, a trader can elimi-nate systemic market risk.
The power of this short-term modelwas brought home to me recently when Ispoke to a value-oriented portfolio man-ager who was beginning to adopt theapproach to his trading.
“Find the ideas that are hot for thed a y,” he says. “Make a decision as to howyou are going to trade them [that] day orthe next several days. The goal is to finda good entry point, feel it out and play itout — don’t chase the stock. What is newis to have this as an everyday re q u i re-ment and to cut through the hyperbole tothe essence of a story and the essence of ashort-term trade.”
A c c o rding to this trader, the dailygoal-oriented approach is different fromanalytically oriented, longer-term trades.Most people don’t think in short-term,goal-oriented terms. Longer-term funda-mentalists are trading stories over anextended time line of three months to ayear, which results in a lot of wastedtime and productivity. It is more produc-tive to look at the curve of volatility instocks on a daily basis, which providestrading action daily.
The study of risk involves examining atrader’s style — favorite kinds of trades,information used and the attitudes andhabits that comprise a trader’s assump-tion of risk. Here are the keys to under-standing risk:
1. Set a target and reach it. This is the
key to risk management. Often, tradersare reluctant to use sufficient capital toreach their objective or are so driven tomeet a goal they do so in a foolhardyway.
While the risk manager is concernedwith measuring performance in termssuch as volatility, standard deviation andrate of return, personality features and
attitudes are the ultimate limiting vari-ables in how individuals handle risk.
It is not uncommon to see traderstrade a smaller number of shares of moreexpensive stocks even though they aremost likely to make the most moneywith these stocks. They may be trappedby their risk aversion and will need toaddress this issue to be able to expandtheir ability to assume risk and enhancetheir chances for greater profitability.
2. Make a trader’s report card.Important questions I constantly asktraders: Do you think you trade a partic-ular part of the swing in a stock? Whatpart of the chart do you like? If you chart-ed your trades, where in the cycle of thechart are you most likely to be buying itor selling it? A re there any regularities orpatterns to your trade selections?
One of the most useful insights into atrader’s performance is to examine atypical trade and then ask critical ques-tions about the psychological factors thatmay have influenced the trade, such as:What prompted you to get out of thetrade so fast? Was there a reason youdidn’t add to the position when it wasworking in your favor? These kinds ofquestions are useful in illuminating atrader’s willingness to take on more riskafter uncovering information that mayincrease the chance of profitability.
These questions are also useful in dis-covering trading patterns. When thesepatterns are identified, you can begin tofocus on elements of your trading that
need to be improved to increase thechance of profitability.
The problem is that markets are notstatic. You have to adapt your style tochanges in the marketplace. If you are atrend follower who plays small, incre-mental changes into a breakout andtakes the first bit of profit, you may wantto hold longer and profit from the
i n c reased volatility and heightenedrange of trades. If you are a contrariantrader, you want to be more cautious inthe volatile markets so you don’t exhaustyour resources waiting for the stock toturn at the inflection point as it goeshigher.
3. Be confident in your confidence.The psychology of proper risk takingrequires a willingness to go to the cuttingedge, learn new skills and follow yourdiscipline in the face of difficulties. Itrequires a willingness to be coached,accept support from others, ask ques-tions, get beyond the need to appear tobe in control. The best traders are hum-ble, open, resilient and willing to keepworking on themselves so they canremain objective. If they are rigid andfearful, they won’t learn additional skillsfor handling risk.
In addition, successful risk manage-ment requires that a trader not be easilydistracted, too argumentative or tooopinionated. A trader must be willing tomeasure risk by assessing the upside anddownside of a trade and stepping out ofthe comfort zone to take on new behav-ior patterns. He or she must develop theability to reduce positions in the face ofdrawdowns and cut losses appropriate-ly. A trader must have the ability to addre s o u rces to his or her approach toincrease knowledge, skill and capacity toexecute.
I asked a successful trader how thesecriteria related to his own risk manage-
The best traders are humble, open, resilient and willing tokeep working on themselves so they can remain objective.If they are rigid and fearful, they won’t learn additionalskills for handling risk.

44 www.activetradermag.com • June 2001 • ACTIVE TRADER
ment approach. His answer: “I am trad-ing with $10 million. If I can grow, Ibelieve I can do five times as much with$50 million as with $10 million. Sometraders conversely may think of howmuch they can lose with the larg e ramount of money. That is why they arenot using all of their capital when theyare trading. They are dominated by aneed not to lose.”
To understand what it will take toi m p rove your risk profile, it is useful toconsider where you fall in the spectrum oftrading styles and approaches.
S p e c i f i c a l l y, think of a recent trade you
made and look at the chart of that stockover a period of time — say, the sixmonths prior to the trade. Answer the fol-lowing questions in relation to that trade:
• Where did you get into the trade? • Where did you add to the position?• Where did you get out, if you got
out?• Was there anything about your trad-
ing style that was reflected in the wayyou traded that stock?
• Did you buy it at the bottom andscale into the position as it movedupwards? Or did you buy it at the bot-tom and get out fast as it was going up?
• C o n v e r s e l y, did you see it as anopportunity to start shorting the stockprior to an anticipated inflection point,and did you get out after the inflectionpoint as the stock was going down?
• What does your approach to thetrade tell you about your general style oftrading and risk tolerance? Looking atthe same chart, can you see how othersmight have traded the stock?
• Do you know other traders whowould have traded it differently?
The value of this kind of considerationis that it begins to clarify the ways peopleapproach opportunities for taking risk.
Next consider:• What are some of the alternatives
you might have taken, or what steps doyou need to take to expand your tradingstyle and your assumption of risk?
• What are the barriers or obstacles todoing this?
• What might you have experiencedin the past in relationship to similartrades that is a sticking point for you —something you have trouble doingbecause it creates too much anxiety oruncertainty?
• Do you have difficulty increasingthe size of your positions, even whenyou know the fundamentals and thestock is moving in your direction?
By considering these kinds of ques-tions you come face to face with stepsneeded to become a better, more skilledand more flexible trader. In effect, a trad-er who has trouble accepting risk mustbe able to understand how to get bigger,how to hold longer, what to overcome inhis personality that is interfering withhis capacity to handle more risk.
In order to profit it is necessary to risksomething. If you risk too much anddon’t have a good reason for putting ona trade, you put yourself in jeopardy. Toput on a trade in as risk-free a way aspossible requires considerable practiceand, most of all, understanding yourown psychological contribution to theprocess — which ultimately is the key tothe whole game.
Learning to tolerate the uncertainty inorder to succeed or to reach a greater
level of success is essential. Sometimes,tolerating the uncertainty means ridingout a drawdown. If you ride out enoughdownturns, you get to a level wheredoing so will be easier. Believe it or not,when you take enough pain, you willeventually be able to relax and enjoy itmore.
You can learn to sell positions whenyou are down instead of holding on tothem. You will be able to admit a losingtrade and get out of it sooner. You willlearn to trade in “the zone” — not somemagical place, but a mindset of totalaction, focusing on the present moment,without concern for your emotions orpast mistakes. Being in the zone allowsyou to take appropriate risk, to balanceyour risk, to size your risk and to toleratethe uncertainty of risk. Being in the zonemeans you can tolerate the pain better.
Risk-taking re q u i res a certain amountof guts. Some traders gain confidence aftersuccesses and take on more risk. On theother hand, others remain so consumedby fear of failing they are unable to get anyb i g g e r.
On a micro basis, there is no “recipe”in learning how to trade. Risk-taking,though, is best done by focusing on theprocesses and tasks ahead. Risk-takingmeans a willingness to create a newvision for your trading and breaking theshackles of limiting life principles andpast perspectives. It means acting out-side the vicious circle that fear creates.Risk-taking means being willing to makeyour trades based on a goal that youhave previously set, following an actionthat you have already outlined. To man-age your risk is to engage in your tradingin a spontaneous and naturally open andhonest way. It means being willing tomake decisions to act before all the factsa re in and before you have checkedeverything out with “the experts.”
According to a successful bond trader,“The psychology of risk is the psycholo-gy of confidence. Trader confidencemeans knowing what to do in all situa-tions. Good markets make geniuses. Theconfidence that people have — the trad-er’s edge — is the confidence that theyare going to do it so that they might aswell do it bigger. That is the key. Step oneis to develop a methodology that makessome money. If you can get people tomake money steadily, then you onlyhave to turn up the gas a little bit andplay bigger.”Ý
If you ride out enoughdownturns, you get to a level where doing so will be easier.
ACTIVE TRADER • June 2001 • www.activetradermag.com 45
T here are two parts to riskcontrol: Having a risk man-agement plan in place andbeing able to implement it.
Unfortunately, when it comes time to act,many traders “cringe” — they can’t exe-cute because they are frozen by theprospect of taking losses.
By using records of past trades it ispossible to plot a “cringe curve” thatidentifies the risk levels we are able andunable to handle. From there we can bet-ter match our risk tolerance level withour ability to execute. First, we need tounderstand just why it is we cringe andhow we can measure it.
The primary control risk method is thestop-loss ord e r. However, although it is awell-known technique, only a few tradersapply it consistently. Stop-loss strategiesre q u i re discipline and willingness to act.It is astounding how many times we failto act when our stop-losses are hit. This isnot a problem with the stop-loss mecha-nism, but with our ability to use it. Weseem to find convenient excuses to aban-don our stops, ranging from the oldstandbys (my stop is too close, the pricelooks like it’s getting better) to the moreimaginative (the mouse stopped work-ing, the telephone rang and tied up theInternet line just before the close of trad-ing, visitors arrived and so on).
These are similar to the excuses weoften make when we have a dentalappointment. It is often only severe dis-comfort that encourages us to go. Atoothache is not enough to outweigh thepotential for more pain at the dentist.
Regardless of the excuse, we freezejust when action is re q u i red. The
prospect of financial loss is not enoughto outweigh the pain of executing a stop-loss order. We shy away from making adecision. The value of this freezing pointis measured in the potential dollars lostand it varies from trader to trader.
If we can develop a better understand-ing of the way our fear develops andwhere the freeze point is located, we canimprove the chances of acting on stop-loss orders. By re s e a rching our pasttrades we can develop a “cringe curve”to help us plot our position in real terms.
Start the process by identifying the sizeof the losses in your past trades. Twoimportant aspects of trading behaviortypically emerge.
•We are good at selling when a loss isquite small. For example, if the loss is$500 we sell the position without diffi-culty. Stop losses at this level are easy toexecute.
• We also are good at selling when aloss is very large. We’ll use a loss largerthan $4,500 in this example. These aretrades that have gone seriously wrong —when the evidence of failure is too largeto be ignored. It often takes a long timeto make the sell decision, and it is rarelyrelated to a formal stop loss level. Oncethe decision is made we tend to sell atwhatever price is available. These selldecisions are like cleaning out the spareroom. It’s distasteful, but once done it isa bit of a relief.
Between the two extremes of a smallloss and a very large loss, a series of curvesc o m p a re our willingness to take action onour stop-losses with the size of the dollar
loss incurred. These curves fall into foursections with quite diff e rent shapes. Figure1 (below) shows an example.
Section 1 is the type of curve weexpect, with a steady rise from our abili-ty to act quickly and efficiently to thearea where action becomes more diffi-cult. As the level of loss increases in dol-lar terms, the ability to act on a stop-lossdecision is diminished. A $500 loss iseasy to take. (Your starting figure may bed i ff e rent, but the shape of the curveremains the same.) By the time the lossgrows to $1,500 it takes a little morethought before we click the mouse tosend the sell order. As the level of finan-cial pain increases, we find our goodintentions get weaker. In this example,by the time it sneaks to over $2,000 ourability to act is frozen. In trading, thisshows up as an “indecision zone” creat-ed by our inability to take action. Weintend to honor the stop-loss, but weactively seek reasons not to execute it.
This is section 2 of the curve. It is thefreeze point — the danger zone responsi-ble for more trading deaths than anyother factor. It is directly related to thesize of the potential loss. We have shownthis zone stretching from $2,000 to$3,000. Sometimes we can screw up ourcourage and take a larger-than-normalloss, but once a loss grows to this size itis very difficult to act on a stop order.The larger a loss grows the greater theprobability that we will fail to act.
The shape of the curve changes in sec-tion 2 to create this freeze point. There isno gradual move from action to inaction.As the size of the loss grows we moverapidly through this zone of indecision
Knowing how much to risk isn’t the same as being able to handle risk. Here’s a technique you can use to analyzeyour risk tolerance and make sure your stop-losses are placed at levels where you can execute them.
BY DARYL GUPPY
RISK Control and MONEY Management
Analyzing the CRINGE CURV E
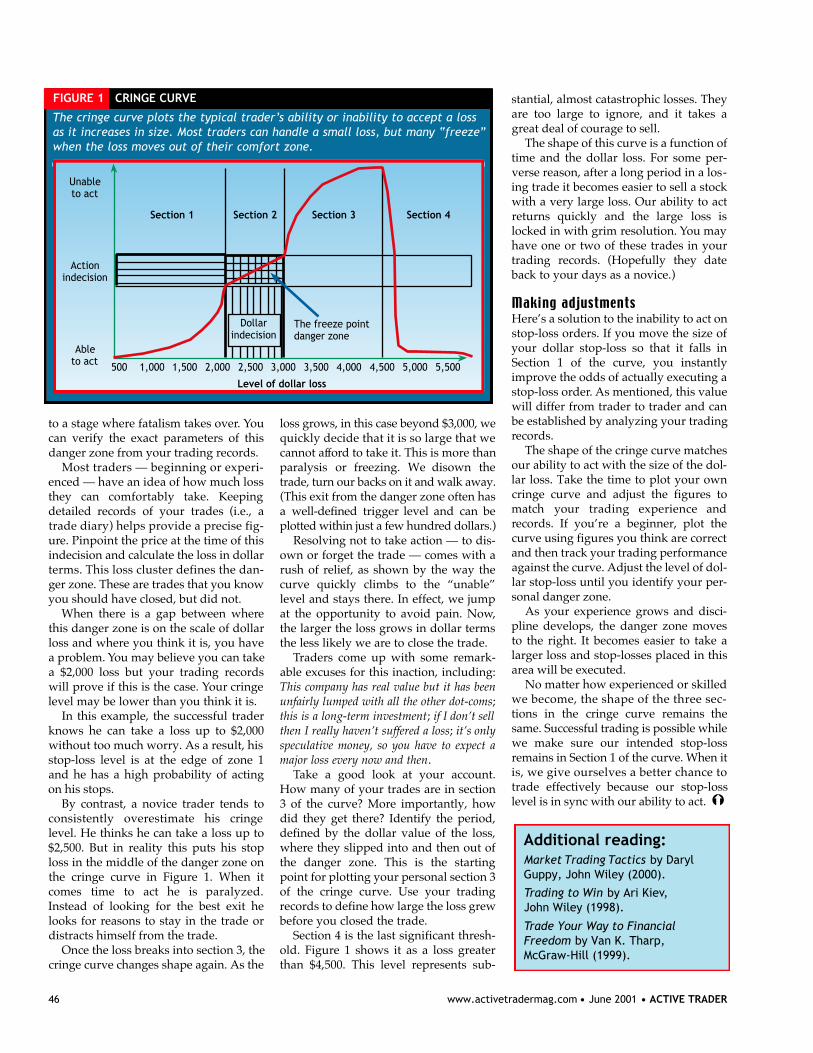
46 www.activetradermag.com • June 2001 • ACTIVE TRADER
to a stage where fatalism takes over. Youcan verify the exact parameters of thisdanger zone from your trading records.
Most traders — beginning or experi-enced — have an idea of how much lossthey can comfortably take. Keepingdetailed re c o rds of your trades (i.e., atrade diary) helps provide a precise fig-u re. Pinpoint the price at the time of thisindecision and calculate the loss in dollarterms. This loss cluster defines the dan-ger zone. These are trades that you knowyou should have closed, but did not.
When there is a gap between wherethis danger zone is on the scale of dollarloss and where you think it is, you havea problem. You may believe you can takea $2,000 loss but your trading recordswill prove if this is the case. Your cringelevel may be lower than you think it is.
In this example, the successful traderknows he can take a loss up to $2,000without too much worry. As a result, hisstop-loss level is at the edge of zone 1and he has a high probability of actingon his stops.
By contrast, a novice trader tends toconsistently overestimate his cringelevel. He thinks he can take a loss up to$2,500. But in reality this puts his stoploss in the middle of the danger zone onthe cringe curve in Figure 1. When itcomes time to act he is paralyzed.Instead of looking for the best exit helooks for reasons to stay in the trade ordistracts himself from the trade.
Once the loss breaks into section 3, thecringe curve changes shape again. As the
loss grows, in this case beyond $3,000, wequickly decide that it is so large that wecannot aff o rd to take it. This is more thanparalysis or freezing. We disown thetrade, turn our backs on it and walk away.(This exit from the danger zone often hasa well-defined trigger level and can beplotted within just a few hundred dollars.)
Resolving not to take action — to dis-own or forget the trade — comes with arush of relief, as shown by the way thecurve quickly climbs to the “unable”level and stays there. In effect, we jumpat the opportunity to avoid pain. Now,the larger the loss grows in dollar termsthe less likely we are to close the trade.
Traders come up with some remark-able excuses for this inaction, including:This company has real value but it has beenunfairly lumped with all the other dot-coms;this is a long-term investment; if I don’t sellthen I really haven’t suffered a loss; it’s onlyspeculative money, so you have to expect amajor loss every now and then.
Take a good look at your account.How many of your trades are in section3 of the curve? More importantly, howdid they get there? Identify the period,defined by the dollar value of the loss,where they slipped into and then out ofthe danger zone. This is the startingpoint for plotting your personal section 3of the cringe curve. Use your tradingrecords to define how large the loss grewbefore you closed the trade.
Section 4 is the last significant thresh-old. Figure 1 shows it as a loss greaterthan $4,500. This level represents sub-
stantial, almost catastrophic losses. Theyare too large to ignore, and it takes agreat deal of courage to sell.
The shape of this curve is a function oftime and the dollar loss. For some per-verse reason, after a long period in a los-ing trade it becomes easier to sell a stockwith a very large loss. Our ability to actreturns quickly and the large loss islocked in with grim resolution. You mayhave one or two of these trades in yourtrading re c o rds. (Hopefully they dateback to your days as a novice.)
Here’s a solution to the inability to act onstop-loss orders. If you move the size ofyour dollar stop-loss so that it falls inSection 1 of the curve, you instantlyimprove the odds of actually executing astop-loss order. As mentioned, this valuewill differ from trader to trader and canbe established by analyzing your tradingrecords.
The shape of the cringe curve matchesour ability to act with the size of the dol-lar loss. Take the time to plot your owncringe curve and adjust the figures tomatch your trading experience andrecords. If you’re a beginner, plot thecurve using figures you think are correctand then track your trading performanceagainst the curve. Adjust the level of dol-lar stop-loss until you identify your per-sonal danger zone.
As your experience grows and disci-pline develops, the danger zone movesto the right. It becomes easier to take alarger loss and stop-losses placed in thisarea will be executed.
No matter how experienced or skilledwe become, the shape of the three sec-tions in the cringe curve remains thesame. Successful trading is possible whilewe make sure our intended stop-lossremains in Section 1 of the curve. When itis, we give ourselves a better chance totrade effectively because our stop-losslevel is in sync with our ability to act. Ý
The cringe curve plots the typical trader’s ability or inability to accept a lossas it increases in size. Most traders can handle a small loss, but many “freeze”when the loss moves out of their comfort zone.
FIGURE 1 CRINGE CURVE
Unable to act
Action indecision
Able to act
Section 1 Section 2 Section 3 Section 4
Dollarindecision
The freeze pointdanger zone
4,000 4,500 5,000 5,5003,5003,0002,5002,0001,5001,000500
Level of dollar loss
Additional reading:Market Trading Tactics by DarylGuppy, John Wiley (2000).
Trading to Win by Ari Kiev,John Wiley (1998).
Trade Your Way to FinancialFreedom by Van K. Tharp, McGraw-Hill (1999).
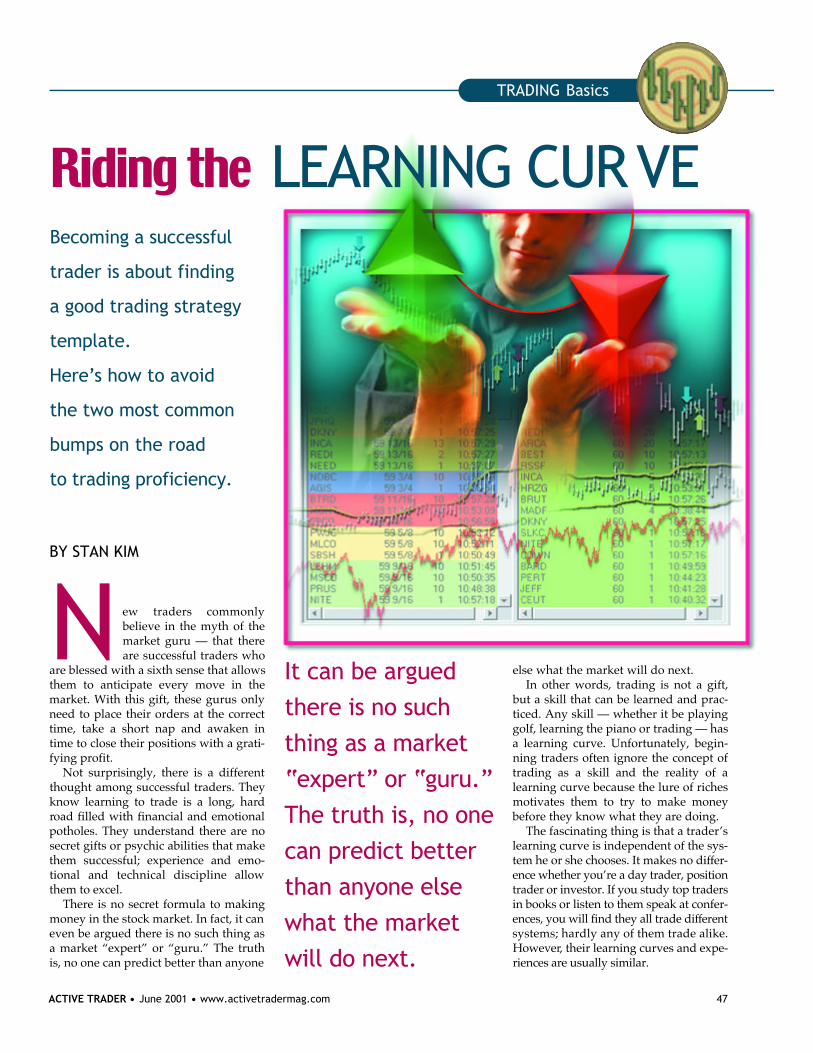
ACTIVE TRADER • June 2001 • www.activetradermag.com 47
BY STAN KIM
N ew traders commonlybelieve in the myth of themarket guru — that thereare successful traders who
are blessed with a sixth sense that allowsthem to anticipate every move in themarket. With this gift, these gurus onlyneed to place their orders at the correcttime, take a short nap and awaken intime to close their positions with a grati-fying profit.
Not surprisingly, there is a differentthought among successful traders. Theyknow learning to trade is a long, hardroad filled with financial and emotionalpotholes. They understand there are nosecret gifts or psychic abilities that makethem successful; experience and emo-tional and technical discipline allowthem to excel.
There is no secret formula to makingmoney in the stock market. In fact, it caneven be argued there is no such thing asa market “expert” or “guru.” The truthis, no one can predict better than anyone
else what the market will do next.In other words, trading is not a gift,
but a skill that can be learned and prac-ticed. Any skill — whether it be playinggolf, learning the piano or trading — hasa learning curve. Unfortunately, begin-ning traders often ignore the concept oftrading as a skill and the reality of alearning curve because the lure of richesmotivates them to try to make moneybefore they know what they are doing.
The fascinating thing is that a trader’ slearning curve is independent of the sys-tem he or she chooses. It makes no diff e r-ence whether you’re a day trader, positiontrader or investor. If you study top tradersin books or listen to them speak at confer-ences, you will find they all trade diff e re n tsystems; hardly any of them trade alike.H o w e v e r, their learning curves and expe-riences are usually similar.
Becoming a successful
trader is about finding
a good trading strategy
template.
H e r e ’s how to avoid
the two most common
bumps on the road
to trading proficiency.
Riding the LEARNING CURV E
TRADING Basics
It can be argued
there is no such
thing as a market
“expert” or “guru.”
The truth is, no one
can predict better
than anyone else
what the market
will do next.

48 www.activetradermag.com • June 2001 • ACTIVE TRADER
There is nothing more important orvaluable than experience. By under-standing the learning curve of trading,you can learn to set goals by it, eliminatecommon mistakes and accentuateimportant trading skills, regardless ofyour system or time frame.
When asked what they want to accom-plish in the markets, most traders pro b a b l ywould respond, “Make money.” However,a beginning or struggling trader’s firstgoal should be consistency. Whether atrader initially makes money is not as sig-nificant to a long-term trading career asforming a template for correct trading,which can be rebuilt and improved overtime. The creation of this template shouldbe the first and foremost goal.
However, the most common tradinglearning curve is distinguished by twomajor pitfalls. These mistakes are primesuspects in the poor performance or fail-ure of most traders, and the pain andfrustration they cause can haunt a traderthroughout his or her career.
Mistake No. 1: Not cutting losses. Many traders know the financial and
emotional pain of having just one or twobig losers wipe out an extended run ofprofitable trades. It is common to hear, “Imade $10,000 last month, but I had twobad trades that lost double that.” Or, “IfI just had gotten rid of XYZ, I wouldhave been up 50 percent last year.”
The reasons for not cutting losses vary,but the most common is that tradersdon’t want to admit they are wro n gabout positions they put on. While it istrue that a couple of big winners canmake your month, it is more likely that acouple of big losers will destroy yourmonth — and the month before that aswell. If you recognize intuitively orempirically that large losses are crushingyour portfolio, then you have faced thelearning curve’s first major challenge.
One exercise that has turned manytraders’ performances around is practic-ing taking losses, with the goal that thelosses will not be huge. Many traders whoundertake this exercise and resign them-selves to the fact that they will lose, re p o r t( remarkably) their first monthly profit.
Practicing taking losses re q u i res acompletely diff e rent mindset fro mdreaming about big profits. You are notfocused on how much you will make orhow good you will feel. You are simply
focused on the process of mechanicallyaccepting losses, proving to yourself thatyou can honor your stops. You focus onexecution without “keeping score” ofprofits or losses.
Good traders do not make up the rulesof probability; they live by them. Andone truth about probability in trading isthat inevitably you will pick a loser thatwill devastate your portfolio — unlessyou stop it first.
One effective technique that can beused on any time frame is to move yourstop up to breakeven at the first chance,then trail a 50-percent stop as the stockmoves in your direction. In other words,as soon as your position becomes prof-itable, move your stop to your entrypoint. This protects you from losingmoney on the position and essentiallyturns it into a “free trade.” As the posi-tion moves in your direction, move yourstop up so 50 percent of your profit isprotected. If a stock moves forward acertain amount, and then retraces morethan half that amount, exit your trade.While many different techniques can beused, the key is to always have somekind of stop-loss system.
A stop-loss is like insurance. While itis true that the price of this insurance ishigh, there is a reason: The cost of failurein trading could be everything you have.
Mistake No. 2: Too many tradingideas.
With today’s heavy marketing of trad-ing products, and the plethora of marketinformation available, it is only naturalto assume that each bit of informationcan help you get one step closer to yourultimate goal. It does not. Not only doesattempting to use too many trading sys-tems and ideas at one time not work in apractical sense, it also contributes signif-icantly to your stress level.
Traders often get caught up in trying tofind the solutions to detailed tradingp roblems instead of focusing on the bigp i c t u re. Before some traders understandtrading diff e rent time frames, they areconcerned about interpreting Level II.B e f o re they understand chart patterns,they wonder whether wireless tradingwill give them an advantage. Before theyunderstand valid breakouts, they wonderif exotic options strategies will put themon the cover of F o r b e s. In other word s ,many traders try to maximize theirreturns before they have any returns. Thetemplate is not formed. There is no basis
f rom which to move forward .An example is a trader mulling over
the money he might lose if he does notpossess a direct-access trading platform.A g ross fallacy in the market is that fasteris better. However, speed doesn’t makeyou better or worse trader; it simplyaccentuates what you are already doing.If you trade a system that has not beensuccessful and don’t have a consistenttemplate from which to work, faster toolsand brighter lights won’t help youbecome more successful; they will simplyhelp you lose at a faster pace.
Another common mistake amongbeginning traders is changing timeframes when a trade goes against them.Your intraday trade is down $500, and ina wave of inspiration (read: desperation),you decide it becomes a long-terminvestment. Or, the opposite may occur:You set up a trade with a two-week hori-zon, then get nervous and sell when youare two points up. A solution to main-taining discipline in your time frame isto keep long-term investments separatefrom your short-term trades. Use differ-ent brokers whose tools are appropriatefor each of your trading and investmenttime frames.
The key is to focus on a single system,strategy or approach, one that can berepeated over and over. This is your tem-plate. The very best traders in the worlda re not known for their skill at tradingn u m e rous systems. They look for a patternthey are comfortable with and trade itrepeatedly. For new traders, the besta p p roach is to understand basic tradingsystems and pick the one that best fits theirtime frame and emotional disposition.
Further, this is an ongoing process, nota weekend project. Recognizing thelearning curve of trading, and actingupon it, allows you to objectively assessperformance patterns rather than subjec-tively reacting to the ups and downs ofdaily trading.
The first and most difficult goal in trad-ing is to consistently make money. It doesnot matter if it is $1 per month, as long asyou haven’t lost money. You can grow asyou pro g ress along the learning curve. Atrader who learns to cut his losses andfocuses on a single trading approach hasaccomplished the most difficult task inbecoming a successful trader: building andfollowing a template of consistency.Ý
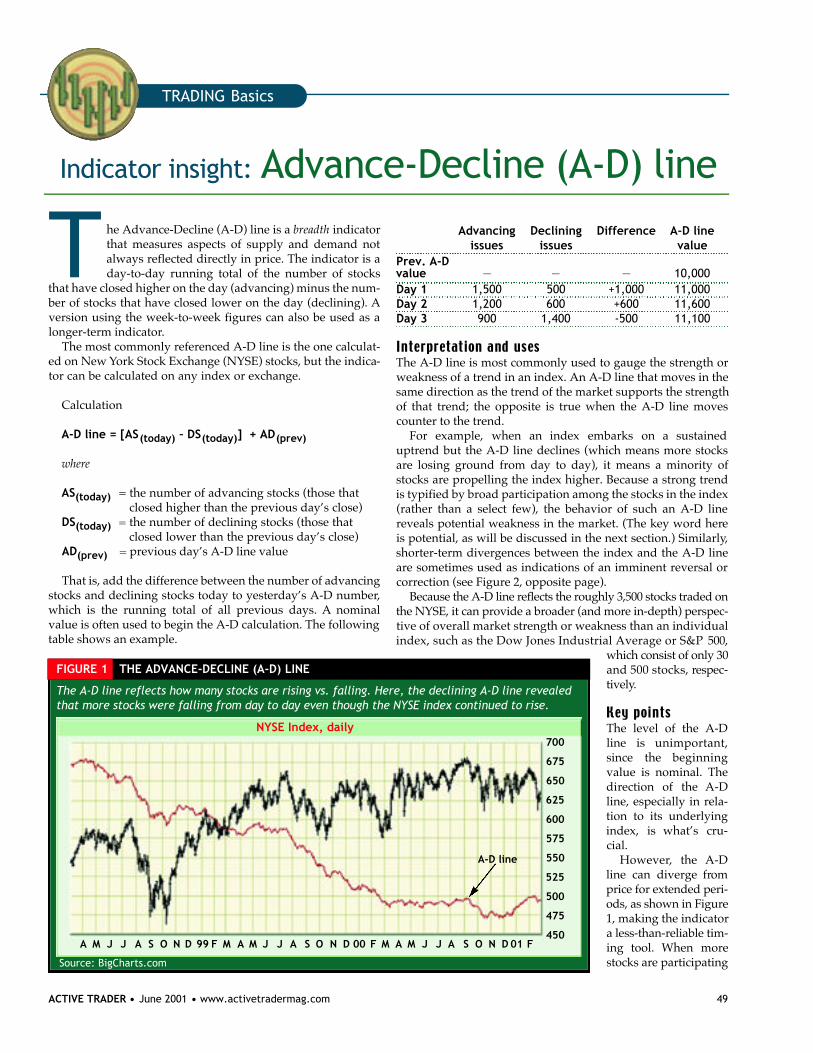
ACTIVE TRADER • June 2001 • www.activetradermag.com 49
T he Advance-Decline (A-D) line is a breadth indicatorthat measures aspects of supply and demand notalways reflected directly in price. The indicator is aday-to-day running total of the number of stocks
that have closed higher on the day (advancing) minus the num-ber of stocks that have closed lower on the day (declining). Aversion using the week-to-week figures can also be used as alonger-term indicator.
The most commonly referenced A-D line is the one calculat-ed on New York Stock Exchange (NYSE) stocks, but the indica-tor can be calculated on any index or exchange.
Calculation
A-D line = [AS(today) – DS(today)] + AD(prev)
where
AS(today) = the number of advancing stocks (those that closed higher than the previous day’s close)
DS(today) = the number of declining stocks (those that closed lower than the previous day’s close)
AD(prev) = previous day’s A-D line value
That is, add the difference between the number of advancingstocks and declining stocks today to yesterday’s A-D number,which is the running total of all previous days. A nominalvalue is often used to begin the A-D calculation. The followingtable shows an example.
Advancing Declining Difference A-D lineissues issues value
Prev. A-D value — — — 10,000Day 1 1,500 500 +1,000 11,000Day 2 1,200 600 +600 11,600Day 3 900 1,400 -500 11,100
The A-D line is most commonly used to gauge the strength orweakness of a trend in an index. An A-D line that moves in thesame direction as the trend of the market supports the strengthof that trend; the opposite is true when the A-D line movescounter to the trend.
For example, when an index embarks on a sustaineduptrend but the A-D line declines (which means more stocksare losing ground from day to day), it means a minority ofstocks are propelling the index higher. Because a strong trendis typified by broad participation among the stocks in the index(rather than a select few), the behavior of such an A-D linereveals potential weakness in the market. (The key word hereis potential, as will be discussed in the next section.) Similarly,shorter-term divergences between the index and the A-D lineare sometimes used as indications of an imminent reversal orcorrection (see Figure 2, opposite page).
Because the A-D line reflects the roughly 3,500 stocks traded onthe NYSE, it can provide a broader (and more in-depth) perspec-tive of overall market strength or weakness than an individualindex, such as the Dow Jones Industrial Average or S&P 5 0 0 ,
which consist of only 30and 500 stocks, re s p e c-t i v e l y.
The level of the A-Dline is unimportant,since the beginningvalue is nominal. Thed i rection of the A - Dline, especially in rela-tion to its underlyingindex, is what’s cru-cial.
H o w e v e r, the A - Dline can diverge fro mprice for extended peri-ods, as shown in Figure1, making the indicatora less-than-reliable tim-ing tool. When morestocks are participating
Indicator insight: Advance-Decline (A-D) line
The A-D line reflects how many stocks are rising vs. falling. Here, the declining A-D line revealedthat more stocks were falling from day to day even though the NYSE index continued to rise.
FIGURE 1 THE ADVANCE-DECLINE (A-D) LINE
A M J J A S O N D 99 F M A M J J A S O N D 00 F M A M J J A S O N D 01 F
700
675
650
625
600
575
550
525
500
475
450
A-D line
NYSE Index, daily
Source: BigCharts.com
TRADING Basics
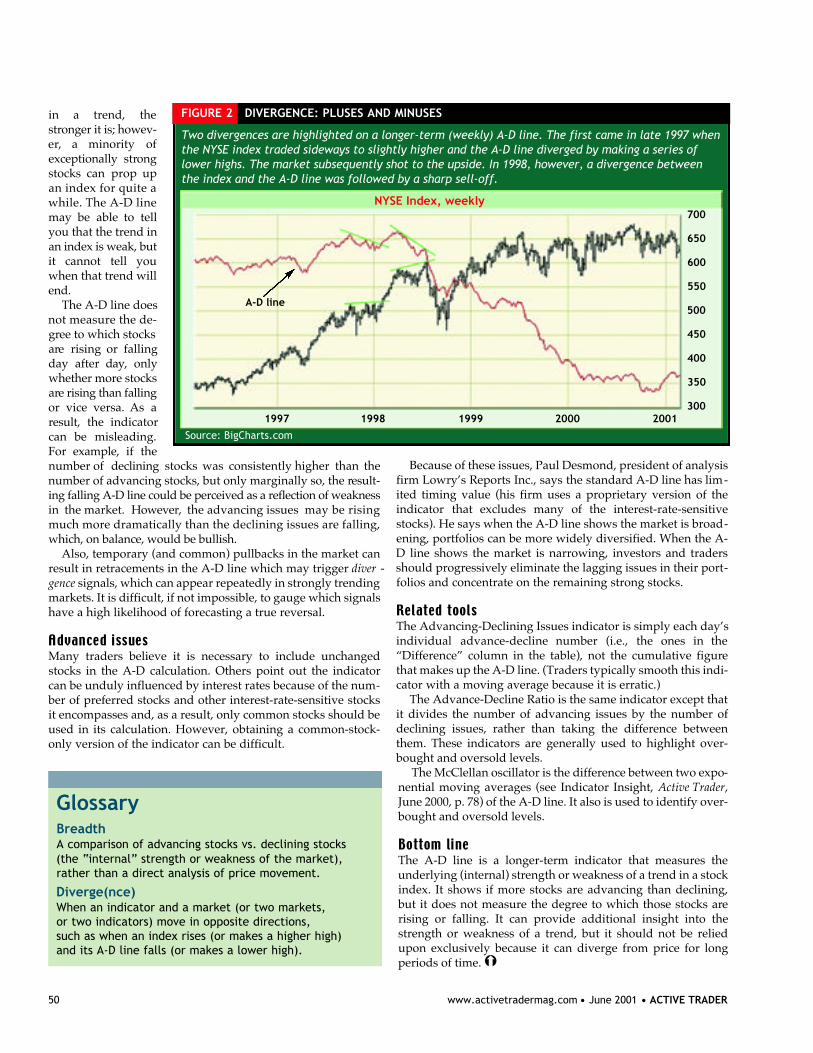
50 www.activetradermag.com • June 2001 • ACTIVE TRADER
in a trend, thes t ronger it is; howev-e r, a minority ofexceptionally stro n gstocks can prop upan index for quite awhile. The A-D linemay be able to tellyou that the trend inan index is weak, butit cannot tell youwhen that trend wille n d .
The A-D line doesnot measure the de-g ree to which stocksa re rising or fallingday after day, onlywhether more stocksa re rising than fallingor vice versa. As aresult, the indicatorcan be misleading.For example, if thenumber of declining stocks was consistently higher than thenumber of advancing stocks, but only marginally so, the re s u l t-ing falling A-D line could be perceived as a reflection of weaknessin the market. However, the advancing issues may be risingmuch more dramatically than the declining issues are falling,which, on balance, would be bullish.
Also, temporary (and common) pullbacks in the market canresult in retracements in the A-D line which may trigger diver -gence signals, which can appear repeatedly in strongly trendingmarkets. It is difficult, if not impossible, to gauge which signalshave a high likelihood of forecasting a true reversal.
Many traders believe it is necessary to include unchangedstocks in the A-D calculation. Others point out the indicatorcan be unduly influenced by interest rates because of the num-ber of preferred stocks and other interest-rate-sensitive stocksit encompasses and, as a result, only common stocks should beused in its calculation. However, obtaining a common-stock-only version of the indicator can be difficult.
Because of these issues, Paul Desmond, president of analysisfirm Lowry’s Reports Inc., says the standard A-D line has lim-ited timing value (his firm uses a proprietary version of theindicator that excludes many of the intere s t - r a t e - s e n s i t i v estocks). He says when the A-D line shows the market is broad-ening, portfolios can be more widely diversified. When the A-D line shows the market is narrowing, investors and tradersshould progressively eliminate the lagging issues in their port-folios and concentrate on the remaining strong stocks.
The Advancing-Declining Issues indicator is simply each day’sindividual advance-decline number (i.e., the ones in the“Difference” column in the table), not the cumulative figurethat makes up the A-D line. (Traders typically smooth this indi-cator with a moving average because it is erratic.)
The Advance-Decline Ratio is the same indicator except thatit divides the number of advancing issues by the number ofdeclining issues, rather than taking the difference betweenthem. These indicators are generally used to highlight over-bought and oversold levels.
The McClellan oscillator is the difference between two expo-nential moving averages (see Indicator Insight, Active Trader,June 2000, p. 78) of the A-D line. It also is used to identify over-bought and oversold levels.
The A-D line is a longer-term indicator that measures theunderlying (internal) strength or weakness of a trend in a stockindex. It shows if more stocks are advancing than declining,but it does not measure the degree to which those stocks arerising or falling. It can provide additional insight into thestrength or weakness of a trend, but it should not be reliedupon exclusively because it can diverge from price for longperiods of time.Ý
GlossaryBreadthA comparison of advancing stocks vs. declining stocks (the “internal” strength or weakness of the market), rather than a direct analysis of price movement.
Diverge(nce)When an indicator and a market (or two markets, or two indicators) move in opposite directions, such as when an index rises (or makes a higher high) and its A-D line falls (or makes a lower high).
Two divergences are highlighted on a longer-term (weekly) A-D line. The first came in late 1997 when the NYSE index traded sideways to slightly higher and the A-D line diverged by making a series oflower highs. The market subsequently shot to the upside. In 1998, however, a divergence betweenthe index and the A-D line was followed by a sharp sell-off.
1997 1998 1999 2000 2001
700
650
600
550
500
450
400
350
300
A-D line
NYSE Index, weekly
Source: BigCharts.com
FIGURE 2 DIVERGENCE: PLUSES AND MINUSES
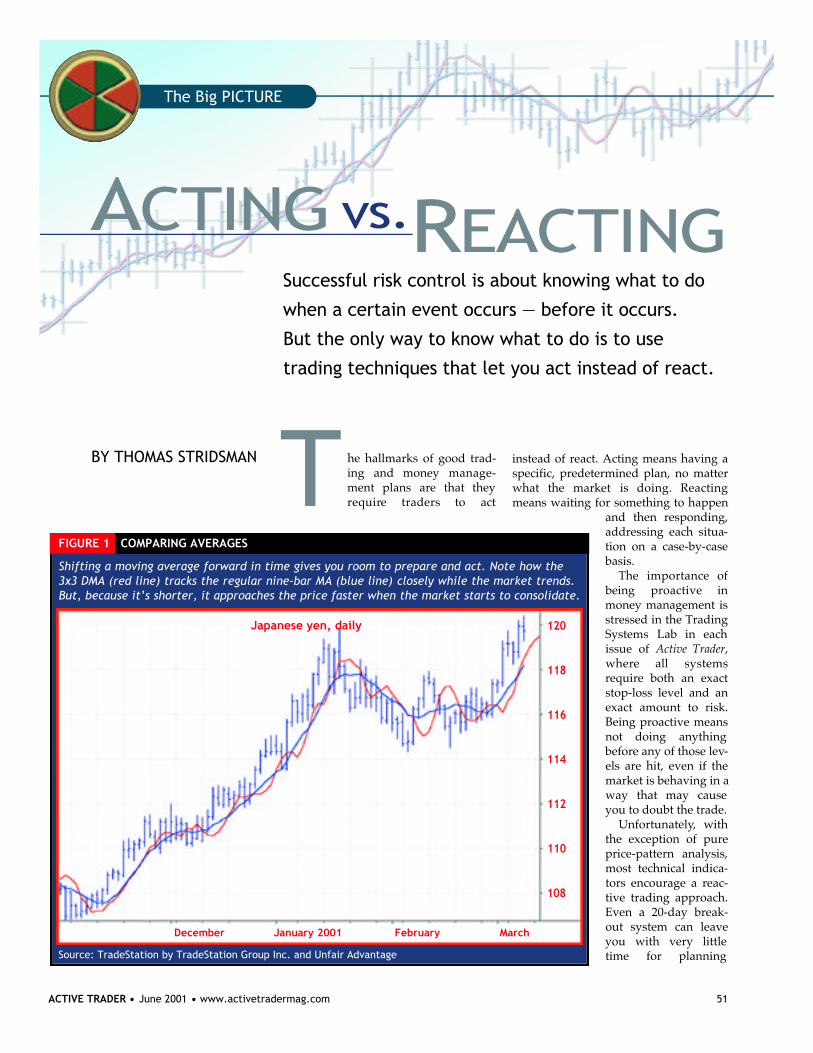
ACTIVE TRADER • June 2001 • www.activetradermag.com 51
T he hallmarks of good trad-ing and money manage-ment plans are that theyre q u i re traders to act
instead of react. Acting means having aspecific, predetermined plan, no matterwhat the market is doing. Reactingmeans waiting for something to happen
and then re s p o n d i n g ,addressing each situa-tion on a case-by-casebasis.
The importance ofbeing proactive inmoney management isstressed in the TradingSystems Lab in eachissue of Active Trader,w h e re all systemsrequire both an exactstop-loss level and anexact amount to risk.Being proactive meansnot doing anythingbefore any of those lev-els are hit, even if themarket is behaving in away that may causeyou to doubt the trade.
U n f o r t u n a t e l y, withthe exception of pureprice-pattern analysis,most technical indica-tors encourage a reac-tive trading approach.Even a 20-day break-out system can leaveyou with very littletime for planning
Successful risk control is about knowing what to do
when a certain event occurs — before it occurs.
But the only way to know what to do is to use
trading techniques that let you act instead of react.
RE A C T I N GAC T I N G v s .
Shifting a moving average forward in time gives you room to prepare and act. Note how the3x3 DMA (red line) tracks the regular nine-bar MA (blue line) closely while the market trends.But, because it’s shorter, it approaches the price faster when the market starts to consolidate.
FIGURE 1 COMPARING AVERAGES
December January 2001 February March
120
118
116
114
112
110
108
Japanese yen, daily
Source: TradeStation by TradeStation Group Inc. and Unfair Advantage
BY THOMAS STRIDSMAN
The Big PICTURE
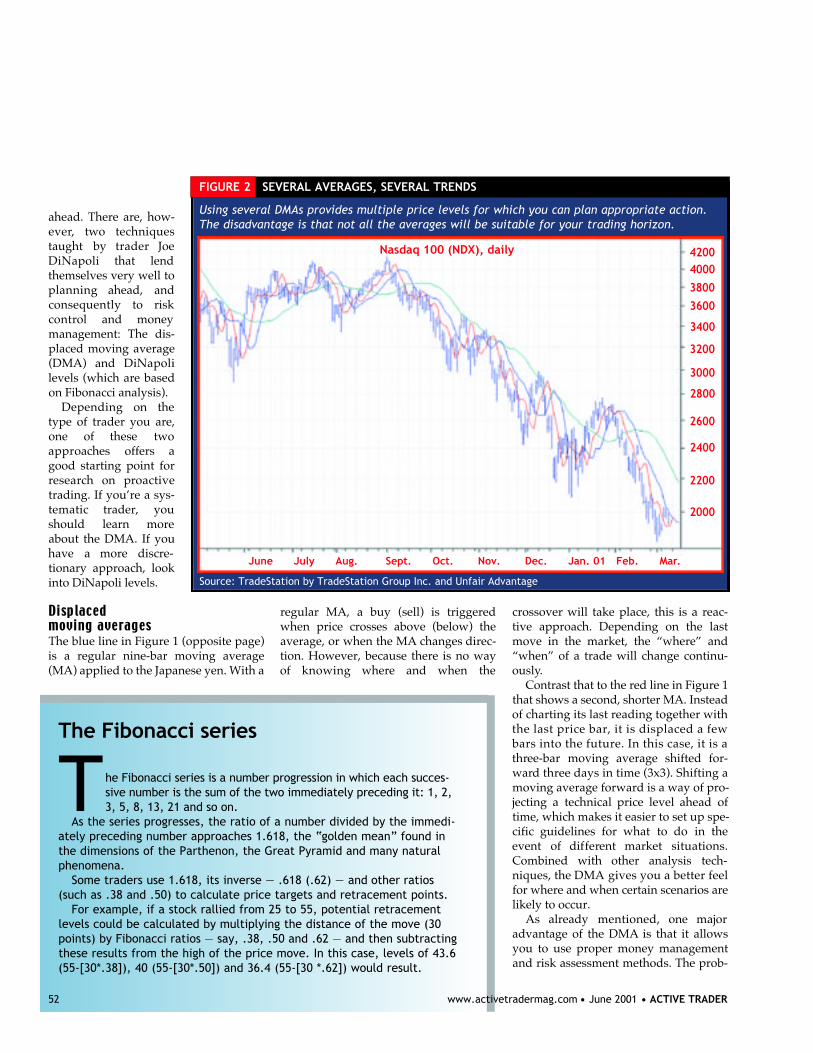
ahead. There are, how-e v e r, two techniquestaught by trader JoeDiNapoli that lendthemselves very well toplanning ahead, andconsequently to riskc o n t rol and moneymanagement: The dis-placed moving average(DMA) and DiNapolilevels (which are basedon Fibonacci analysis).
Depending on thetype of trader you are,one of these twoa p p roaches offers agood starting point forre s e a rch on pro a c t i v etrading. If you’re a sys-tematic trader, youshould learn moreabout the DMA. If youhave a more discre-tionary approach, lookinto DiNapoli levels.
The blue line in Figure 1 (opposite page)is a regular nine-bar moving average(MA) applied to the Japanese yen. With a
regular MA, a buy (sell) is triggeredwhen price crosses above (below) theaverage, or when the MA changes direc-tion. However, because there is no wayof knowing where and when the
crossover will take place, this is a reac-tive approach. Depending on the lastmove in the market, the “where” and“when” of a trade will change continu-ously.
Contrast that to the red line in Figure 1that shows a second, shorter MA. Insteadof charting its last reading together withthe last price bar, it is displaced a fewbars into the future. In this case, it is at h ree-bar moving average shifted for-w a rd three days in time (3x3). Shifting amoving average forward is a way of pro-jecting a technical price level ahead oftime, which makes it easier to set up spe-cific guidelines for what to do in theevent of diff e rent market situations.Combined with other analysis tech-niques, the DMA gives you a better feelfor where and when certain scenarios arelikely to occur.
As already mentioned, one majoradvantage of the DMA is that it allowsyou to use proper money managementand risk assessment methods. The prob-
Using several DMAs provides multiple price levels for which you can plan appropriate action.The disadvantage is that not all the averages will be suitable for your trading horizon.
FIGURE 2 SEVERAL AVERAGES, SEVERAL TRENDS
June July Aug. Sept. Oct. Nov. Dec. Jan. 01 Feb. Mar.
42004000
3800
3600
3400
3200
3000
2800
2600
2400
2200
2000
Nasdaq 100 (NDX), daily
Source: TradeStation by TradeStation Group Inc. and Unfair Advantage
The Fibonacci series
T he Fibonacci series is a number progression in which each succes-sive number is the sum of the two immediately preceding it: 1, 2,3, 5, 8, 13, 21 and so on.
As the series progresses, the ratio of a number divided by the immedi-ately preceding number approaches 1.618, the “golden mean” found inthe dimensions of the Parthenon, the Great Pyramid and many naturalphenomena.
Some traders use 1.618, its inverse — .618 (.62) — and other ratios(such as .38 and .50) to calculate price targets and retracement points.
For example, if a stock rallied from 25 to 55, potential retracementlevels could be calculated by multiplying the distance of the move (30points) by Fibonacci ratios — say, .38, .50 and .62 — and then subtractingthese results from the high of the price move. In this case, levels of 43.6(55-[30*.38]), 40 (55-[30*.50]) and 36.4 (55-[30 *.62]) would result.
52 www.activetradermag.com • June 2001 • ACTIVE TRADER
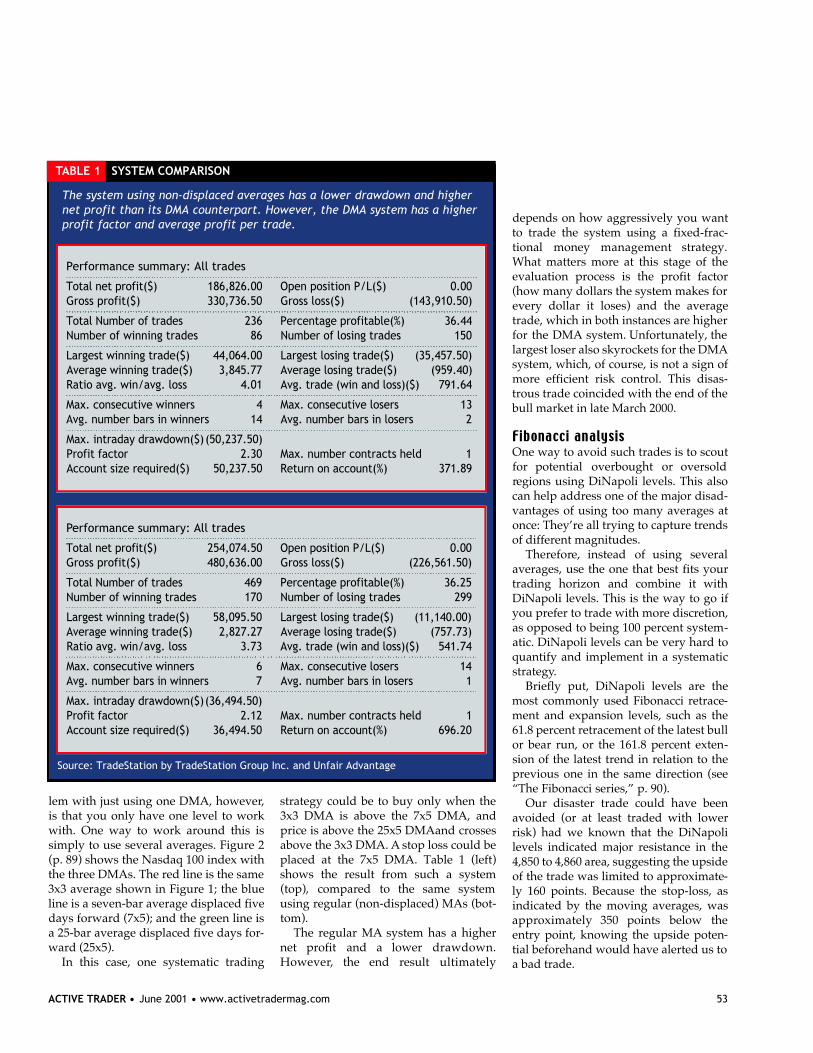
lem with just using one DMA, however,is that you only have one level to workwith. One way to work around this issimply to use several averages. Figure 2(p. 89) shows the Nasdaq 100 index withthe three DMAs. The red line is the same3x3 average shown in Figure 1; the blueline is a seven-bar average displaced fivedays forward (7x5); and the green line isa 25-bar average displaced five days for-ward (25x5).
In this case, one systematic trading
strategy could be to buy only when the3x3 DMA is above the 7x5 DMA, andprice is above the 25x5 DMAand crossesabove the 3x3 DMA. A stop loss could beplaced at the 7x5 DMA. Table 1 (left)shows the result from such a system(top), compared to the same systemusing regular (non-displaced) MAs (bot-tom).
The regular MA system has a highernet profit and a lower drawdown.H o w e v e r, the end result ultimately
depends on how aggressively you wantto trade the system using a fixed-frac-tional money management strategy.What matters more at this stage of theevaluation process is the profit factor(how many dollars the system makes forevery dollar it loses) and the averagetrade, which in both instances are higherfor the DMA system. Unfortunately, thelargest loser also skyrockets for the DMAsystem, which, of course, is not a sign ofmore efficient risk control. This disas-trous trade coincided with the end of thebull market in late March 2000.
One way to avoid such trades is to scoutfor potential overbought or oversoldregions using DiNapoli levels. This alsocan help address one of the major disad-vantages of using too many averages atonce: They’re all trying to capture trendsof different magnitudes.
T h e re f o re, instead of using severalaverages, use the one that best fits yourtrading horizon and combine it withDiNapoli levels. This is the way to go ifyou prefer to trade with more discretion,as opposed to being 100 percent system-atic. DiNapoli levels can be very hard toquantify and implement in a systematicstrategy.
Briefly put, DiNapoli levels are themost commonly used Fibonacci retrace-ment and expansion levels, such as the61.8 percent retracement of the latest bullor bear run, or the 161.8 percent exten-sion of the latest trend in relation to theprevious one in the same direction (see“The Fibonacci series,” p. 90).
Our disaster trade could have beenavoided (or at least traded with lowerrisk) had we known that the DiNapolilevels indicated major resistance in the4,850 to 4,860 area, suggesting the upsideof the trade was limited to approximate-ly 160 points. Because the stop-loss, asindicated by the moving averages, wasa p p roximately 350 points below theentry point, knowing the upside poten-tial beforehand would have alerted us toa bad trade.
TABLE 1 SYSTEM COMPARISON
The system using non-displaced averages has a lower drawdown and highernet profit than its DMA counterpart. However, the DMA system has a higherprofit factor and average profit per trade.
Source: TradeStation by TradeStation Group Inc. and Unfair Advantage
Performance summary: All trades
Total net profit($) 1 8 6 , 8 2 6 . 0 0 Open position P/L($) 0 . 0 0Gross profit($) 3 3 0 , 7 3 6 . 5 0 Gross loss($) ( 1 4 3 , 9 1 0 . 5 0 )
Total Number of trades 2 3 6 Percentage profitable(%) 3 6 . 4 4Number of winning trades 8 6 Number of losing trades 1 5 0
Largest winning trade($) 4 4 , 0 6 4 . 0 0 Largest losing trade($) ( 3 5 , 4 5 7 . 5 0 )Average winning trade($) 3 , 8 4 5 . 7 7 Average losing trade($) ( 9 5 9 . 4 0 )Ratio avg. win/avg. loss 4 . 0 1 Avg. trade (win and loss)($) 7 9 1 . 6 4
Max. consecutive winners 4 Max. consecutive losers 1 3Avg. number bars in winners 1 4 Avg. number bars in losers 2
Max. intraday drawdown($) ( 5 0 , 2 3 7 . 5 0 )Profit factor 2 . 3 0 Max. number contracts held 1Account size required($) 5 0 , 2 3 7 . 5 0 Return on account(%) 3 7 1 . 8 9
Performance summary: All trades
Total net profit($) 2 5 4 , 0 7 4 . 5 0 Open position P/L($) 0 . 0 0Gross profit($) 4 8 0 , 6 3 6 . 0 0 Gross loss($) ( 2 2 6 , 5 6 1 . 5 0 )
Total Number of trades 4 6 9 Percentage profitable(%) 3 6 . 2 5Number of winning trades 1 7 0 Number of losing trades 2 9 9
Largest winning trade($) 5 8 , 0 9 5 . 5 0 Largest losing trade($) ( 1 1 , 1 4 0 . 0 0 )Average winning trade($) 2 , 8 2 7 . 2 7 Average losing trade($) ( 7 5 7 . 7 3 )Ratio avg. win/avg. loss 3 . 7 3 Avg. trade (win and loss)($) 5 4 1 . 7 4
Max. consecutive winners 6 Max. consecutive losers 1 4Avg. number bars in winners 7 Avg. number bars in losers 1
Max. intraday drawdown($)( 3 6 , 4 9 4 . 5 0 )Profit factor 2 . 1 2 Max. number contracts held 1Account size required($) 3 6 , 4 9 4 . 5 0 Return on account(%) 6 9 6 . 2 0
ACTIVE TRADER • June 2001 • www.activetradermag.com 53
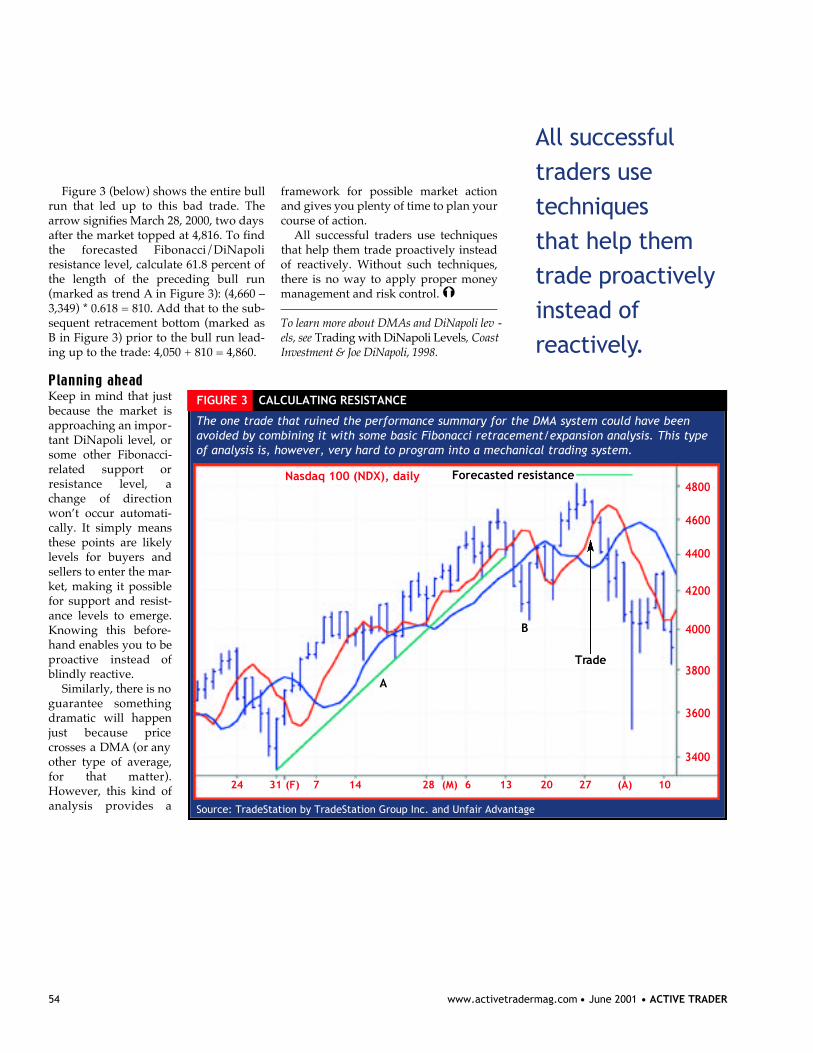
54 www.activetradermag.com • June 2001 • ACTIVE TRADER
Figure 3 (below) shows the entire bullrun that led up to this bad trade. Thearrow signifies March 28, 2000, two daysafter the market topped at 4,816. To findthe forecasted Fibonacci/DiNapoliresistance level, calculate 61.8 percent ofthe length of the preceding bull ru n(marked as trend A in Figure 3): (4,660 –3,349) * 0.618 = 810. Add that to the sub-sequent retracement bottom (marked asB in Figure 3) prior to the bull run lead-ing up to the trade: 4,050 + 810 = 4,860.
Keep in mind that justbecause the market isapproaching an impor-tant DiNapoli level, orsome other Fibonacci-related support orresistance level, achange of dire c t i o nwon’t occur automati-cally. It simply meansthese points are likelylevels for buyers andsellers to enter the mar-ket, making it possiblefor support and resist-ance levels to emerge.Knowing this before-hand enables you to bep roactive instead ofblindly reactive.
Similarly, there is noguarantee somethingdramatic will happenjust because pricecrosses a DMA (or anyother type of average,for that matter).However, this kind ofanalysis provides a
framework for possible market actionand gives you plenty of time to plan yourcourse of action.
All successful traders use techniquesthat help them trade proactively insteadof reactively. Without such techniques,there is no way to apply proper moneymanagement and risk control.
To learn more about DMAs and DiNapoli lev -els, see Trading with DiNapoli Levels, CoastInvestment & Joe DiNapoli, 1998.
Ý
All successfultraders use techniques that help themtrade proactively instead of r e a c t i v e l y.
The one trade that ruined the performance summary for the DMA system could have beenavoided by combining it with some basic Fibonacci retracement/expansion analysis. This typeof analysis is, however, very hard to program into a mechanical trading system.
FIGURE 3 CALCULATING RESISTANCE
24 31 (F) 7 14 28 (M) 6 13 20 27 (A) 10
4800
4600
4400
4200
4000
3800
3600
3400
Nasdaq 100 (NDX), daily Forecasted resistance
A
Trade
B
Source: TradeStation by TradeStation Group Inc. and Unfair Advantage
BY ROBERT A. GREEN, CPA
I n trading, an edge can come inmany forms: a particular pat-tern, superior execution capa-bilities, better money manage-
ment and so on.Another edge is properly struc-
turing your trading business fortax purposes. Traders are often
enticed by the potential benefitsof various business entities(corporations, LLCs, etc.) andare eager to establish them.However, these benefits arenot always what theyappear to be at first glance.
“One-man shows” whotrade for their ownaccounts are interested inseparate legal entities fortheir trading businessesbecause they think trading
in an entity will lower theirtax liabilities. However, for
the majority of traders this isnot true. Unincorporated
traders are able to take advan-tage of all of the trader tax benefits
without having a separate legal enti-t y. There is one exception: The re a s o n
a stock trader should consider a separatelegal entity is to create earned income tofund a re t i rement account.
While many proposals from propri-etary trading firms and tax professionalsare attractive in “form,” traders need tolook closer at the “substance,” or realityof a tax and business structure, as wellas its underlying legal agreements.
ACTIVE TRADER • June 2001 • www.activetradermag.com 55
When evaluating business and tax structures
for trading in an entity, traders need to consider
substance over form. An unincorporated trading
business is the best choice for most traders.
The Business of TRADING
Keeping your trading business S I M P L E
56 www.activetradermag.com • June 2001 • ACTIVE TRADER
In many cases, traders are being soldform, which is materially different fromthe underlying substance. Because cer-tain business proposals may lead to trou-ble, sometimes traders should just sayno. The bottom line: The InternalRevenue Service (IRS), many state taxauthorities, and the Securities andExchange Commission (SEC) value sub-stance over form.
Next, we’ll explain how unincorporat-ed traders can take full advantage of alltrader tax laws and benefits by qualify-ing as being in the business of trading.
To unlock trader tax benefits (businessdeductions and “ordinary trading loss”treatment vs. “capital loss” limitations),a trader first must qualify as being “inthe business of trading.” Traders are con-sidered by the IRS to be in the business oftrading when they trade frequently, con-tinuously and actively — regardless ifthis activity takes place through a busi-ness entity or not. These qualificationsare subjective rather than objective.
Some traders who don’t qualify asbeing in the business of trading believethat conducting their trading activity in aseparate legal entity will help them qual-ify for trader tax benefits. This is not tru e .An entity may appear to be a tradingbusiness in form, but the IRS will look atthe underlying activity — the substance— in making its decision. If the businessactivity is really just investing and doesnot rise to the level of a trading business,the IRS will consider the entity to be aninvestment company and not a tradingbusiness. In that case, the trader is notable to take advantage of any trader taxbenefits (no business expenses and noo rdinary loss tre a t m e n t ) .
In terms of trading business expenses,incorporated and unincorporated tradersreceive similar tax treatment. Tr a d e r sdeduct their trading business expensesf rom gross income. To report tradingbusiness expense deductions, an unincor-porated trader uses Schedule C and anincorporated trader uses the re g u l a rdeduction lines of an entity tax re t u r n .Unincorporated traders should file a foot-note with their individual tax re t u r n sexplaining the trading business expenses
reported on Schedule C are connected totrading gains and losses reported oneither Schedule D or Form 4797.
Unincorporated traders with tradingbusiness expenses are able to deducttheir entire trading business expenses(and trading losses — if they have filedfor mark-to-market accounting tre a t-ment) against all other types of incomeon their individual income tax return(see “Get the tax refund you deserve,”Active Trader, March 2001, p. 128).
A trader who establishes a C-corpora-tion and has a trading loss in his or her
first year will not get immediate taxrelief from trading business expensesand trading losses. The C-corporation isa separately taxed entity, so the lossescannot be utilized on the trader’s indi-vidual tax return. However, the C-corpo-ration tax losses can be carried forwardto a future corporate tax year.
Unincorporated traders are able todeduct their home office expenses (see“ H o m e - o ffice tax deductions for traders,”Active Tr a d e r, April 2001, p. 102). Incor-porated traders do not have a home-off i c etax form, making it difficult for them toget tax benefits from a home off i c e .
Unincorporated traders are allowedthe same business expense treatment asincorporated traders, including but notlimited to: no limitations on businessexpenses and the ability to depreciatecomputers, equipment and furniture.
In terms of trading gains and losses andmark-to-market (MTM) accounting treat-ment, incorporated and unincorporatedtraders also receive similar tax treatment.Both groups are permitted to elect mark-to-market (MTM) accounting treatment.MTM converts capital gains and losses toordinary gains and losses.
Without MTM, unincorporated andincorporated traders are subject to “capi-tal-loss limitation” rules, wash sales andare allowed to carry over excess capitallosses. The only areas in which incorpo-rated and unincorporated traders differwithout MTM is that unincorporatedtraders are allowed a net capital-lossdeduction of $3,000 per tax year; a C-cor-poration is not.
In electing MTM, the only diff e re n c e sbetween incorporated and unincorporat-ed traders are unincorporated tradersmust elect MTM by April 15 of the curre n ttax year (three-and-a-half months fro mthe beginning of the calendar year) andincorporated traders must elect MTMwithin two-and-a-half months of thebeginning of their fiscal or calendar year.
Tax strategy: An unincorporated traderwho missed the April 15, 2001, deadlinefor electing MTM for calendar year 2001may be interested in incorporating a newentity that can elect MTM within 75 daysof its inception. For example, say a trader
Some traders who
don’t qualify
as being in the
business of trading
believe that
conducting their
trading activity
in a separate legal
entity will help
them qualify for
trader tax benefits.
This is not true.

misses the April 15, 2001, MTM deadlineand later decides he wants MTM for 2001.The trader can stop trading as an individ-ual (or wait until he is at breakeven for the2001 calendar year) and then incorporatea new entity to conduct his trading for thebalance of the year. The trader electsMTM for this new entity and re m a i n swithout MTM as an individual.
In terms of earned income and self-employment tax laws, incorporated andunincorporated traders receive similartax treatment. “Earned income” refers toincome a taxpayer earns from service-related work, as opposed to non-earnedincome from sources like investing.
Trading in securities is not earnedincome, so trading gains are exemptfrom self-employment taxation. The dif-ference between incorporated and unin-corporated traders here is that incorpo-rated traders can pay themselvessalaries, thereby creating earned income.This salary is then subject to social secu-rity and Medicare taxes (the equivalentof self-employment taxes) and a retire-ment plan can be set up and funded in
connection with this salary.Trading in commodities is earned
income, so trading gains are subject toself-employment taxation. Incorporatedand unincorporated commodity tradersreceive similar tax treatment.
Tax strategy: Traders in securities inter-ested in setting up a tax-deductibleretirement plan should consider incorpo-rating. Traders in commodities interest-ed in setting up a tax-deductible retire-ment plan don’t need to incorporate.Commodity traders are paying self-employment taxes on their trading gains,so they might as well consider the taxadvantages of a retirement plan deduc-tion. Traders in securities have the luxu-ry of not paying self-employment taxes— unless they want a retirement plan.The tax deduction from the retirementplan contribution usually offsets the costof self-employment taxes.
Stock traders who want re t i rement plansneed to be “incorporated.” Entity choicesa re a C-corporation, an S-corporation, aLimited Liability Company (LLC), or Part-
nership, all of which are taxed diff e re n t l y. One decision traders need to make is
whether to incorporate in their homestate or out-of-state. Many traders arei n t e rested in out-of-state entities inNevada or Delaware because these stateshave no state income taxes. However,many high-tax states (includingCalifornia) consider this a sham — formover substance. Some states will ignore atrader’s out-of-state incorporation andwill tax the trader’s out-of-state entity inthe trader’s home state.
One choice a trader should consider isa “flow-through” entity in his or herhome state. A f l o w - t h rough entity’s tax-able activity is reported on the trader’ sindividual tax return. (Tax losses or tax-able gains “flow through” to the trader’ sindividual tax return.) The trader re c e i v e simmediate tax relief for losses and doesnot pay double taxation for gains (i.e., onthe entity level and then again on the indi-vidual level).
Traders should consider a separate legalentity only if they trade stocks (ratherthan commodities) and if they want tofund a tax-deductible retirement plan inconnection with their trading businessincome.
For most other traders a business enti-ty is unnecessary. You don’t have toinform the IRS or your state that you arean unincorporated trading business, andthere is no deadline for claiming this partof trader tax status. A trader on extensionfor 2000 after April 15, 2001, can still fileas an unincorporated trading businessusing Schedule C for tax year 2000.Traders can also amend tax returns fromprior tax years to report trading expens-es on Schedule C. The second part oftrader tax status, MTM, cannot be usedafter the fact. It can only be used if youfiled your MTM election on time, as pre-viously described.
Don’t be fooled by the form of a trad-ing business entity. All the substance oftrader tax benefits can be reaped as anunincorporated trader. Unincorporatedtraders actually have more flexibility andoptions than incorporated traders. Afteryou have had success for several years,then you can consider an entity to set upand fund a retirement plan, which everytrader does need.Ý
ACTIVE TRADER • June 2001 • www.activetradermag.com 57
After Hours crossword solution

58 www.activetradermag.com • June 2001 • ACTIVE TRADER
AFTERHours
ON THE JOB
ACROSS1 Greenspan’s group (abbr.) 5 Direct-access firm ___Corp7 Volatility index9 A ratio many investors look at10 Some think these are too wide11 All stocks trade in these14 Active Trader’s Trading Systems ___,
or where a scientist works16 A highly traded Nasdaq stock
20 Traders are always looking for ____outs21 CNBC anchor Mathisen23 How you load your software,
or a no-risk place to put your money24 Small, mid or large26 Sell an options contract27 Opposite of puts28 John Bollinger’s indicator29 What every trader aims for31 Symbol for Intel
34 Another answer for 1 across36 You might use a stop for this37 ____stick charts39 Symbol for Dow Jones tracking stock40 Symbol for Amazon.com41 Market or limit42 Before 51 across44 Nickname for S&Ptracking stock46 Profit ___ should be greater than 1:147 Symbol for Nortel Networks48 After 51 across, commissions, etc.51 They go to the IRS52 Reversal’s friend53 On a Level II screen, it might be
green or red
DOWN2 Price3 Be careful when using this4 Symbol for Canadian chip maker6 A measure of dividend7 Highly erratic8 Fundamentals9 This often occurs after a failed breakout12 Yours should be at least 17 inches (pl.)13 Traders hope this kind of cut only occurs
at the barber15 Market _____ (not a specialist)17 Not resistance18 Yours may be at home19 Nasdaq software company22 ____ hours start at 4 p.m. (EST)25 The second C in CCI30 Another term for money32 If you’re reading this magazine,
you’re probably one33 In the market, the opposite of bulls35 Archipelago, Island, Instinet, e.g.38 There are6 1⁄2 in every market day.39 Subtract, as in commission42 Microsoft chairman Bill43 One of the three major indices (3 wds.)45 See 43 down (abbr.)49 You shouldn’t trade based on this50 Symbol for the parent company of CNBC
You left theoffice early.
Where are you?
©2001, Active Trader MagazineI had to do some
research. I'm studyingsome bar charts.
21 3
9
8
4 5 6 7
13
121110
14
15 16 17 18 19
2120
22
23 24 25
28
27
29 30
31 32 33 34 35 36
3837
39 40 41
42 43
44 45
47 48
50
5251 53
4946
26
Constructed using Crossword Weaver
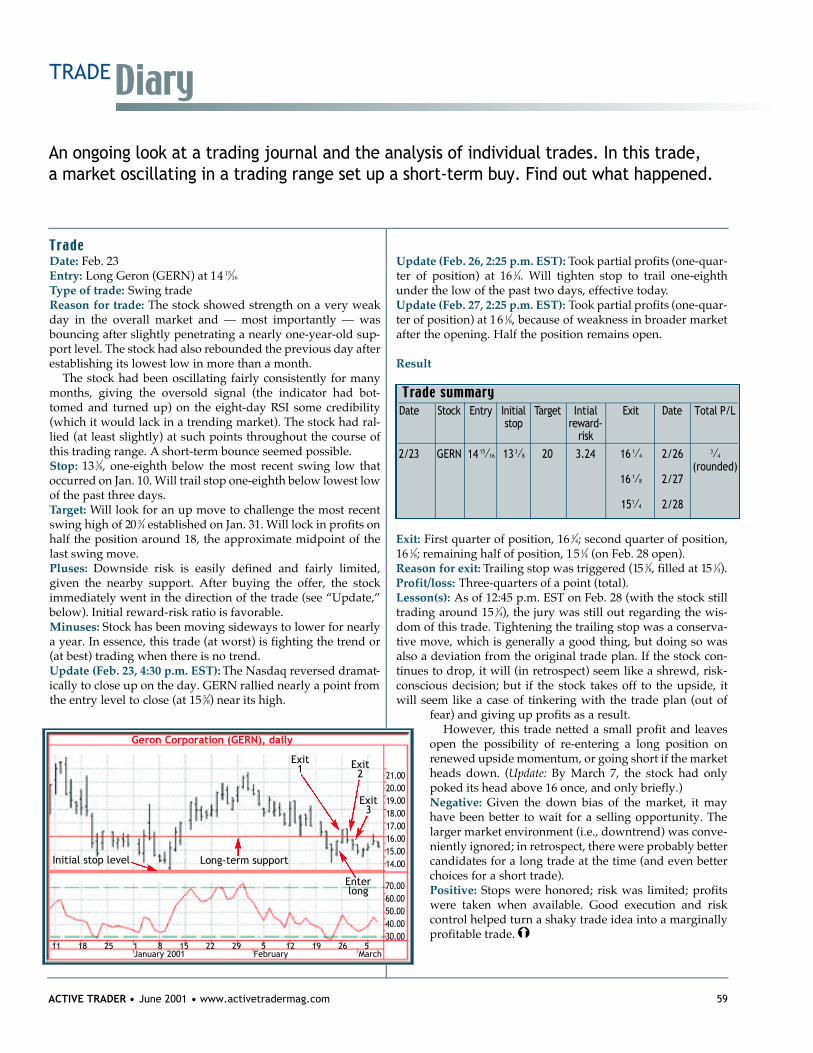
ACTIVE TRADER • June 2001 • www.activetradermag.com 59
Date: Feb. 23Entry: Long Geron (GERN) at 14 15⁄16
Type of trade: Swing tradeReason for trade: The stock showed strength on a very weakday in the overall market and — most importantly — wasbouncing after slightly penetrating a nearly one-year-old sup-port level. The stock had also rebounded the previous day afterestablishing its lowest low in more than a month.
The stock had been oscillating fairly consistently for manymonths, giving the oversold signal (the indicator had bot-tomed and turned up) on the eight-day RSI some credibility(which it would lack in a trending market). The stock had ral-lied (at least slightly) at such points throughout the course ofthis trading range. A short-term bounce seemed possible. Stop: 13 3⁄8, one-eighth below the most recent swing low thatoccurred on Jan. 10. Will trail stop one-eighth below lowest lowof the past three days.Target: Will look for an up move to challenge the most recentswing high of 20 3⁄4 established on Jan. 31. Will lock in profits onhalf the position around 18, the approximate midpoint of thelast swing move. Pluses: Downside risk is easily defined and fairly limited,given the nearby support. After buying the offer, the stockimmediately went in the direction of the trade (see “Update,”below). Initial reward-risk ratio is favorable.Minuses: Stock has been moving sideways to lower for nearlya year. In essence, this trade (at worst) is fighting the trend or(at best) trading when there is no trend.Update (Feb. 23, 4:30 p.m. EST): The Nasdaq reversed dramat-ically to close up on the day. GERN rallied nearly a point fromthe entry level to close (at 15 5⁄8) near its high.
Update (Feb. 26, 2:25 p.m. EST): Took partial profits (one-quar-ter of position) at 16 1⁄4. Will tighten stop to trail one-eighthunder the low of the past two days, effective today.Update (Feb. 27, 2:25 p.m. EST): Took partial profits (one-quar-ter of position) at 16 1⁄8, because of weakness in broader marketafter the opening. Half the position remains open.
Result
Exit: First quarter of position, 16 1⁄4; second quarter of position,16 1⁄8; remaining half of position, 15 1⁄4 (on Feb. 28 open).Reason for exit: Trailing stop was triggered (15 3⁄8, filled at 15 1⁄4).Profit/loss: Three-quarters of a point (total).Lesson(s): As of 12:45 p.m. EST on Feb. 28 (with the stock stilltrading around 15 1⁄4), the jury was still out regarding the wis-dom of this trade. Tightening the trailing stop was a conserva-tive move, which is generally a good thing, but doing so wasalso a deviation from the original trade plan. If the stock con-tinues to drop, it will (in retrospect) seem like a shrewd, risk-conscious decision; but if the stock takes off to the upside, itwill seem like a case of tinkering with the trade plan (out of
fear) and giving up profits as a result.However, this trade netted a small profit and leaves
open the possibility of re-entering a long position onrenewed upside momentum, or going short if the marketheads down. (Update: By March 7, the stock had onlypoked its head above 16 once, and only briefly.) Negative: Given the down bias of the market, it mayhave been better to wait for a selling opportunity. Thelarger market environment (i.e., downtrend) was conve-niently ignored; in retrospect, there were probably bettercandidates for a long trade at the time (and even betterchoices for a short trade). Positive: Stops were honored; risk was limited; profitswere taken when available. Good execution and riskcontrol helped turn a shaky trade idea into a marginallyprofitable trade.Ý
An ongoing look at a trading journal and the analysis of individual trades. In this trade, a market oscillating in a trading range set up a short-term buy. Find out what happened.
D a t e S t o c k E n t r y I n i t i a l Ta r g e t Intial E x i t D a t e Total P / Ls t o p r e w a r d -
r i s k
2 / 2 3 GERN 14 15⁄16 13 3⁄8 20 3.24 16 1⁄4 2/26 3⁄4
(rounded)16 1⁄8 2/27
151⁄4 2/28
Geron Corporation (GERN), daily
Exit1 Exit
2
Exit3
Long-term support
Enterlong
Initial stop level
2 1 . 0 02 0 . 0 01 9 . 0 01 8 . 0 01 7 . 0 01 6 . 0 01 5 . 0 01 4 . 0 0
7 0 . 0 06 0 . 0 05 0 . 0 04 0 . 0 03 0 . 0 0
11 18 25 1 8 15 22 29 5 12 19 26 5January 2001 February March
TRADEDiary