active galactic nuclei - university of...
TRANSCRIPT

Active Galactic Nuclei
Karina Caputi
Physics of Galaxies 2018-2019 Q4Rijksuniversiteit Groningen

A bit of history…

Seyfert galaxies
Broad-line emission from galactic nuclei are know since early 1900’s
The displayed broad lines could only be excited by photons more energetic than those from young stars
Carl Seyfert

QSO first discovery
Boom of radioastronomy in 1950s: Third Cambridge (3C) Catalogue
Most 3C sources were identified with elliptical galaxies…but a few looked point-like (like stars)
They indicated redshifts unusually high for such bright objects
Maarten Schmidt3C 273 has B,V < 13 mag and z=0.158
And contemporary works by Sandage, Matthews, etc.

Searching for far away QSOs
Fan et al. (2006)

Farthest QSOs known to date
Mortlock et al. (2011)
z=7.085
Very rare objects: < 1 quasar per Gpc^3 at z=6, or <1 per 100 sq. deg.
Bañados et al. (2017)
z=7.54

The AGN components

QSO and AGN
AGN/QSO classification is complex - QSO are the the most luminous AGN(outshine host galaxy, so they look point-like)
Credit: A. Simonnet
✦ blue light excess
✦ light variability in some cases
✦ optical light polarisation
✦ X-ray emission due to accretion
✦ radio quiet or loud (some with jets)
✦ some have broad (> 1000 km/s) line emission (permitted lines) - AGN type 1
✦ Others only narrow lines - AGN type 2

The central engineThe central engine is a supermassive black hole accreting gas
Black hole mass ~ 10 - 10 Msun - event horizon size of solar system6 8
Gas supplied at a rate of ~ 1 Msun/yr
Gas being accreted forms a disk which is heated by frictionUV, optical and X-ray
14.3. MAXIMUM ENERGY RELEASE IN SPHERICAL ACCRETION 337
Table 14.1: Energy released by accretion onto various objects
Accretion onto Max energy released (erg g−1) Ratio to fusionBlack hole 4.5×10²⁰ 75Neutron star 1.3×10²⁰ 20White dwarf 1.3×10¹⁷ 0.02Normal star 1.9×10¹⁵ 10−4
14.3 Maximum Energy Release in Spherical Accretion
The most spectacular consequence of accretion is that it isan efficient mechanism for extracting gravitational energy.
• The energy released by accretion is approximately
∆Eacc = GMmR
,
whereM is the mass of the object, R is its radius, andm is the mass accreted.
• In Table 14.1 the amount of energy released per gramof hydrogen accreted onto the surface of various ob-jects is summarized (see Exercise).
• From Table 14.1, we see that accretion onto verycompact objects is a much more efficient source ofenergy than is hydrogen fusion.
• But accretion onto normal stars or even white dwarfsis much less efficient than converting the equivalentamount of mass to energy by fusion.
Credit: M. Guidry
338 CHAPTER 14. BLACK HOLES AS CENTRAL ENGINES
Let us assume for the moment, unrealistically, that all ki-netic energy generated by conversion of gravitational en-ergy in accretion is radiated from the system (we addressthe issue of efficiency for realistic accretion shortly). Thenthe accretion luminosity is
Lacc =GMMR
≃ 1.3×10²¹!
M/M⊙
R/km
"!
Mg s−1
"
erg s−1,
if we assume a steady accretion rate M.

The central engine (cont.)
14.3. MAXIMUM ENERGY RELEASE IN SPHERICAL ACCRETION 339
Table 14.2: Some Eddington-limited accretion rates
Compact object Radius (km) Max accretion rate (g s−1)White dwarf ∼ 104 1021
Neutron star ∼ 10 1018
14.3.1 Limits on Accretion Rates
The Eddington luminosity is
Ledd =4πGMmpc
σ,
with σ ithe effective cross section for photon scattering.
• For fully ionized hydrogen, we may approximate σby the Thomson cross section to give
Ledd ≃ 1.3×1038!
MM⊙
"
erg s−1.
• If the Eddington luminosity is exceeded (in whichcase we say that the luminosity is super-Eddington),accretion will be blocked by the radiation pressure,implying that there is a maximum accretion rate oncompact objects.
• Equating Lacc and Ledd gives
Mmax ≃ 1017!
Rkm
"
g s−1
Eddington-limited accretion rates based on this formulaare given in Table 14.2.
Credit: M. Guidry
Accretion efficiencies:
340 CHAPTER 14. BLACK HOLES AS CENTRAL ENGINES
14.3.2 Accretion Efficiencies
• For the gravitational energy released by accretion to be extracted,it must be radiated or matter must be ejected at high kinetic en-ergy (for example, in AGN jets).
• Generally, we expect that such processes are inefficient and thatonly a fraction of the potential energy available from accretioncan be extracted to do external work.
• This issue is particularly critical when black holes are the cen-tral accreting object, since they have no “surface” onto whichaccretion may take place and the event horizon makes energyextraction acutely problematic.
• Let us modify our previous equation for accretion power by in-troducing an efficiency factor η that ranges from 0 to 1:
Lacc = 2ηGMMR
.
• Specializing for the black hole case, it is logical to take theSchwarzschild radius (the radius of the event horizon for a spher-ical black hole), which is given by
Rsc =2GMc2
= 2.95!
MM⊙
"
km,
to define the “accretion radius”, since any energy to be extractedfrom accretion must be emitted from outside that radius.
η=0.1 - typical value (up to 0.3-0.4 for rotating black holes)

The broad-line region
Urry & Padovani (1995)
Broad-line region extends 0.01-0.1 pc around central engine
Very hot gas clouds w/ v ~1000-10,000 km/s
Although different components are present (scaled) in both stellar and supermassive black holes, broad-line regions are exclusive to supermassive black holes
Direct visibility is extremely difficult

The dusty torus
Current evidence suggests that dusty torus is clumpy rather than homogenous
Tristram et al.
Circinus

The narrow-line region
Urry & Padovani (1995)
Narrow-line region extends 100-1000 pcout of central engine
Well resolved for nearby AGN with HST
Gas clouds w/ v ~100-500 km/s
Overlaps host galaxy (distinction unclear)

AGN Classification

The Unification Scheme
Urry & Padovani (1995)
AGN type 1-2 classification depends only on the viewing angle
Key: polarised light

Radiative versus jet mode (more recent classif.)– 9 –
Direct AGN light
Jet mode Radiative mode
Low−excitation radio source
Type 2 Type 1
High−excitation radio source
Light dominated by host galaxy
Edd EddL/L > 0.01
Rad
io L
oud
Rad
io Q
uiet
* Weak (or absent) narrow, low
* Old stellar population; little SF
* FR1 or FR2 radio morphology * Moderate radio luminosity
* Very massive early−type galaxy* Very massive black hole
* Massive early−type galaxy* Massive black hole* Old stellar population with some
on−going star formation* High radio luminosity* Mostly FR2 morphology* Strong high−ionisation narrow lines
excitation radio source, but withaddition of:
* Direct AGN light* Broad permitted emission lines
Host galaxy properties like Type−2
* Direct AGN light* Broad permitted emission lines* Bias towards face−on orientation
* Sometimes, beamed radio emission
AGN LINER
* Old stellar population; little SF* Weak, small−scale radio jets
* Massive early−type galaxy* Massive black hole
* Moderate strength, low−ionisationnarrow emission lines
* Moderate mass black hole
* Weak or no radio jets* Strong high−ionisation narrow lines
galaxy with pseudo−bulge
ionisation emission lines
Host galaxy properties like high−
* Significant central star−formation
L/L < 0.01~ ~
Radio−loud QSO
Radio Quiet QSO / Seyfert 1 Type 2 QSO / Seyfert 2
* QSOs more luminous than Seyferts
QSO and Seyfert 2, respectively, butwith addition of:
* Moderately massive early−type disk
Fig. 4.— The categorisation of the local AGN population adopted throughout this review. The blue textdescribes typical properties of each AGN class. These, together with the spread of properties for each class,will be justified throughout the review.
2.2. Finding AGN
This review is focused on insights into the co-evolution of SMBHs and galaxies that have been derivedfrom large surveys of the local universe. For such investigations of the radiative-mode AGN it is the obscured(Type 2) AGN that are far and away the more valuable. In these objects the blinding glare of the UV andoptical continuum emission from the central accretion disk has been blocked by the natural coronagraphcreated by the dusty obscuring structure. The remaining UV and optical continuum is generally dominatedby the galaxy’s stellar component (Kauffmann et al. 2003a) which can then be readily characterized. Inthe sections to follow we will therefore restrict our discussion of radiative-mode AGN to techniques thatcan recognize Type 2 AGN. For the jet-mode AGN the intrinsic UV and optical emission from the AGNis generally weak or absent unless the observer is looking directly down the jet axis (e.g. Urry & Padovani1995). Thus, the host galaxy properties can be easily studied without contamination.
Heckman & Best (2013)

Spectral Properties

The SED contribution of different regions
Figure credit: B. Venemans
SpectralenergydistribuRon
1200KBB
torus
accreRondisk 30—50K
BB
11/12/2017 QuasarsandtheirhostgalaxiesintheEoR,Bariloche⎯BramVenemans
SpectralenergydistribuRon•UV/opRcal:accreRondisk•mid-infrared:hotdustandtorus•far-infrared:colddust�hostgalaxy
The Astrophysical Journal, 785:154 (22pp), 2014 April 20 Leipski et al.
10−14
10−13
10−12
ν F
ν [er
g s−1
cm
−2]
0.1 1 10 100rest wavelength (µm)
total fitUV/opt power law
NIR blackbodytorus model
FIR mod. BB
Figure 2. Schematic representation of the components used for SED fitting. Asan example, we use the observed photometry of the z = 5.03 QSO J1204−0021.(A color version of this figure is available in the online journal.)
The rest frame UV/optical and infrared SEDs of these10 objects can be fitted well with a combination of these 4components. The best fitting model combinations are shownin Figure 3 and Table 6 summarizes some basic propertiesdetermined from the fitting. Using these fits we also determinethe relative contributions of the different components to the totalinfrared SED. For this we combine the dust component in theNIR and the torus model, both of which are likely to be poweredby the AGN. We compare this AGN related emission to theadditional FIR component and show their relative contributionsto the total infrared emission as a function of wavelength inFigure 4. We see that in the presence of luminous FIR emission(LFIR ∼ 1013 L⊙), this component dominates the total infraredSED at rest frame wavelengths above ∼50 µm for all 10 objects.This means that in such cases of strong FIR/submillimeteremission, rest frame wavelengths !50 µm isolate the additionalFIR component without the need for full SED fits (at leastin our modeling approach). The possible heating source forthe additional FIR component (AGN versus star formation) isfurther discussed in Section 4.4.
We also extend a similar SED fitting approach to objectswith fewer Herschel detections. In cases where two PACSdetections are available (nine sources), these data providesufficient constraints for the torus model, while the upper limitsin the SPIRE bands (and in the millimeter where available; seeTable 4) limit the contribution of the additional FIR component(fixed to a temperature of 47 K). These fits are presented inFigure 5 and some basic properties derived from the fittedcomponents are presented in Table 6. From this table we use theUV/optical luminosity and the AGN-dominated dust luminosityto show that the ratio of the AGN-dominated dust-to-accretiondisk emission decreases with increasing UV/optical luminosity(Figure 6). This behavior may reflect the increase of the dustsublimation radius for more luminous UV/optical continuumemitters (e.g., Barvainis 1987) which, under the assumption of aconstant scale height, is often explained in terms of a decreasingdust covering factor with increasing luminosity in the contextof the so-called receding torus model (Lawrence 1991).
The measured FIR fluxes for our 10 FIR-detected objects fallonly moderately above the 3σ confusion noise limit (Table 5).Thus, the photometric upper limits for the nine FIR non-detections (i.e., only detected in PACS) yield upper limits on
10−15
10−14
10−13
10−12
J0338+0021z = 5.00
J0756+4104z = 5.09
10−15
10−14
10−13
J0927+2001z = 5.77
J1044−0125z = 5.78
10−15
10−14
10−13
J1148+5251z = 6.43
J1202+3235z = 5.31
10−15
10−14
10−13
J1204−0021z = 5.03
J1340+2813z = 5.34
0.1 1 10 100rest wavelength (µm)
10−15
10−14
10−13
J1602+4228z = 6.07
1 10 100rest wavelength (µm)
J1626+2751z = 5.30
1450Åz−band
y−bandJ, H, K
SpitzerHerschel
literature data(λrest > 10 µm)
Figure 3. SEDs of the 10 quasars detected in at least four Herschel bands. Theplots shows νFν in units of erg s−1 cm−2 over the rest frame wavelength. Thecolored lines indicate the results of a multi-component SED fit as describedin Section 4.1. They consist of a power-law (blue dotted), a blackbody ofT ∼ 1200 K (yellow dash-dotted), a torus model (green dashed), and a modifiedblackbody of ∼47 K (see Table 6; red long dashed). The black solid line showsthe total fit as the sum of the individual components.(A color version of this figure is available in the online journal.)
LFIR that do not differ significantly from the detection on anindividual basis (Table 6). Further constraints on the averageFIR properties of the PACS-only sources are provided by astacking analysis as presented in Section 4.4.
4.2. The SEDs at λrest < 4 µm
For two-thirds of the sample, the upper limits in the Herschelobservations do not provide strong constraints to MIR or FIRcomponents to allow full SED fitting. We therefore chose tolimit the fitting to rest frame wavelengths corresponding to theMIPS 24 µm band (∼3–4 µm rest frame) and shorter wherethe majority of the sources is well detected. For these data wefit a combination of a power-law in the UV/optical and a hotblackbody in the NIR. To minimize the influence from emissionlines (e.g., Lyα, Hα) and the small blue bump on the fittedpower-law slope, we limit the data points to Spitzer bands atλobs " 5.8 µm and only using the y-band photometry in therest frame UV. In those cases where no y-band photometry isavailable (five objects), we use the z-band instead. For selected
10
1200KBB
torus
accreRondisk 30—50K
mod.BB

The X-ray spectrum
Credit: G. Risaliti

The optical spectrum
Broad lines
Narrow lines
BPT diagram

The infrared spectrumQuasar 3C249.1
Siebenmorgen et al. (2005)
dusty torus
(power law at 1-5 um)
Silicate absorption
The importance of silicate absorption and PAH emission varies among AGN

AGN host galaxies
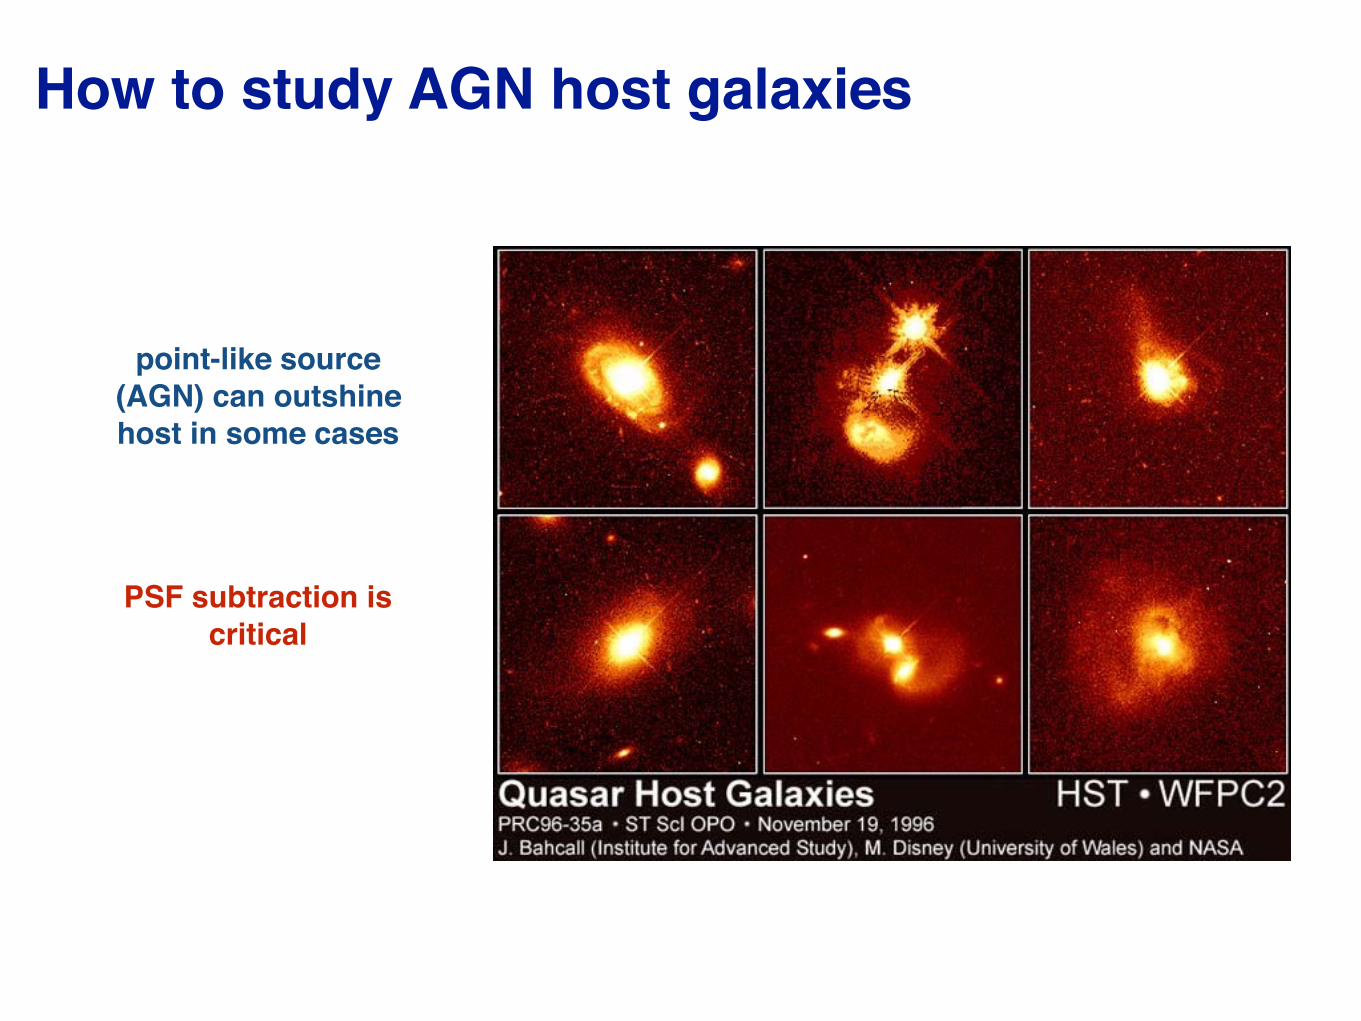
How to study AGN host galaxies
PSF subtraction is critical
point-like source (AGN) can outshine host in some cases

AGN feedback: positive or negative?
Negative feedback (i.e., which suppresses star formation) is
necessary to explain SF quenching of massive galaxies
Credit: J. Silk
radiative mode: large amounts of gas flow onto AGNjet mode: AGN drives powerful jets and cocoons that heat circumgalactic and halo gas
…but AGN outflows can also compress gas clouds and trigger
new star formation: positive feedback
Cresci et al. (2015)

QSO and the Intergalactic Medium
(IGM)

The Lyman-alpha forest

AGN in a cosmological context

The extragalactic X-ray background
Comastri et al. (2015)
total measured
modelled Compton-thick contribution