across seven bornean forest types in the gunung palung...
TRANSCRIPT

L E T T E RLong-term reproductive behaviour of woody plantsacross seven Bornean forest types in the GunungPalung National Park (Indonesia): suprannualsynchrony, temporal productivity and fruitingdiversity
Charles H. Cannon,1,2* Lisa M.
Curran,3 Andrew J. Marshall4 and
Mark Leighton5
1Department of Biological
Sciences, Texas Tech University,
Box 43131, Lubbock, TX 79409-
3131, USA2Xishuangbanna Tropical
Botanic Garden, Chinese
Academy of Sciences, Kunming,
Yunnan 650223, China3School of Forestry and
Environmental Studies, Yale
University, 205 Prospect Street,
New Haven, CT 06511, USA4Department of Anthropology
and Graduate Group in Ecology,
University of California, One
Shields Avenue, Davis, CA
95616, USA5Great Ape World Heritage
Species Project, c ⁄ o Carr
Foundation, 2 Arrow Street,
Suite 400, Cambridge, MA
02138, USA
*Correspondence: E-mail:
AbstractFor 68 months, we observed the reproductive behaviour of 7288 woody plants (172 figs,
1457 climbers and 5659 trees) spanning major soil and elevational gradients. Two
2–3 month community-wide supra-annual fruiting events were synchronized across five
forest types, coinciding with ENSO events. At least 27 genera in 24 families restricted
their reproduction to these events, which involved a substantial proportion of tree
diversity (> 80% of phylogenetic diversity). During these events, mean reproductive
levels (8.5%) represented an almost four-fold increase compared with other months.
These patterns indicate a strong behavioural advantage to this unusual reproductive
behaviour. Montane forest experienced a single, separate fruiting peak while the peat
swamp forest did not participate. Excluding these events, no temporal reproductive
pattern was detectible, at either the landscape or forest type. These phenological patterns
have major implications for the conservation of frugivore communities, with montane
and swamp forests acting as !keystone" forests.
KeywordsKeystone forest type, liana, mast fruiting, phenology, phylogenetic diversity, tropical
trees.
Ecology Letters (2007) 10: 956–969
I N T R O D U C T I O N
The seasonality and intensity of woody plant reproductionvaries considerably between equatorial tropical forests on acontinental scale (Bawa 1983; Appanah 1993; van Schaiket al. 1993; Sakai 2001; Primack & Cortlett 2005). South-East Asian tree communities in Sundaland (Myers et al.2000; Olson & Dinerstein 2002) are renowned forexhibiting community-wide supra-annual mast fruiting(Appanah 1993; Sakai et al. 1999; Kudo & Suzuki 2004),especially among the dominant canopy trees in the
Dipterocarpaceae (Janzen 1974; Ashton et al. 1988; Curranet al. 1999; Curran & Leighton 2000; Curran & Webb2000; Maycock et al. 2005). Several non-mutually exclusivemechanisms have been proposed to explain the evolutionand maintenance of this behaviour (Janzen 1974; Kelly1994; Isagi et al. 1997; Kelly & Sork 2002; Iwasa & Satake2004; Ichie et al. 2005; Sakai et al. 2006). In Borneanforests, these brief and infrequent pulses of fruits andseeds have a major impact on vertebrate populationdynamics (Leighton & Leighton 1983; Ostfeld & Keesing2000).
Ecology Letters, (2007) 10: 956–969 doi: 10.1111/j.1461-0248.2007.01089.x
! 2007 Blackwell Publishing Ltd/CNRS

At the community level, previous studies of plantreproductive behaviour in the aseasonal Malesian forestshave been limited to a single forest type. Here, we examinethe reproductive behaviour of terrestrial woody plantsacross a broad range of elevation, soil types and drainageconditions over a 68 month period within a single 15 km2
watershed in the Gunung Palung National Park (GPNP),West Kalimantan, Indonesia. Our observations includedwoody climbers, which are fundamental to understandingthe dynamics of the entire community (Schnitzer & Bongers2002), and figs (Ficus:Moraceae), known to be a !keystone"resources for many vertebrates (Leighton & Leighton 1983;Lambert & Marshall 1991; O"Brien et al. 1998; Harrison2003).
The GPNP watershed (15 km2) provides an idealresearch site to examine reproductive behaviour of woodyplants at both the alpha and beta levels of communitydiversity. Firstly, major regional climatic cues are largelycontrolled among the observed individuals. Secondly, soilsvary as much as 16-fold in available phosphorus, allowingdirect comparisons between sites with substantial differ-ences in nutrient availability (Paoli et al. 2005, 2006; Paoli &Curran 2007). Most importantly, the landscape pool of plantlineages is quite large and interaction across forest typeboundaries is extensive. This juxtaposition of differentforest types at a small geographic scales has been effectiveapproach at understanding tree distributional patterns(Curran et al. 1999; Webb & Peart 2000; Cannon &Leighton 2004; Paoli et al. 2006).
The current analysis addresses several fundamentalquestions. To what degree are supra-annual mast fruiting(SMF) events synchronized across forest types and plantgrowth forms? What level of synchrony is detectable outsideof SMF events? How diverse are the plant groups thatrestrict their reproduction to these events? Which foresttypes are most productive, in terms of total reproductivestem basal area?
M E T H O D S
Study site
The Gunung Palung National Park (GPNP, 90 000 ha WestKalimantan, Indonesia: 1º15¢S, 110º10¢E) contains mostmajor Bornean forest types. The 15 km2 study site withinGPNP spans a single large watershed. Detailed sitedescriptions have been provided previously (Curran &Leighton 2000; Cannon & Leighton 2004; Paoli et al. 2006).Seven distinctive forest types are recognized in this study.Poorly drained lowland sites include peat swamps withconsiderable humic accumulation and freshwater swampswith nutrient-poor gleyic soils. Freshwater swamp forestsundergo seasonal patterns of flooding because of large rain
events and poor drainage. Alluvial bench forests arescattered along the lower reaches of the main river system.These deposits are recent in origin and are a mixture ofparent rock material. Lowland sandstone and lowlandgranite forests are found below 300 m elevation on well-drained sites. Upland granite forests are found generallyabove 300 but below 700 m elevation. Montane forests arefound on the steep slopes and ridges above 700 m elevation.GPNP is a coastal mountain complex, influenced by theMassenerhebung effect, creating compressed vegetationalzonation (Grubb 1977).
Plant reproductive behaviour
Dimensions and locations of the 126 vegetation plots,mostly 0.1 ha in size, were similar to Cannon & Leighton(2004), but included more plots (Table S1). Sample areasvary among the seven forest types, with the largest samplingarea available for the lowland sandstone and the smallest inthe montane forest. We distinguished four plant growthforms: woody climbers, figs, small trees (14.5–24.5 cmDBH) and big trees (> 24.5 cm DBH). We broadlyconstrued Ficus spp. (Moraceae) as a !growth form", becauseof their unique hemi-epiphytic strategy and their widelyrecognized position as an asynchronously fruiting !keystone"resource for many animals (Leighton & Leighton 1983;Terborgh 1986; Lambert & Marshall 1991; O"Brien et al.1998; Shanahan et al. 2001; Marshall & Leighton 2006).Small trees were sampled using a nested design, within thelarger sample areas for figs, climbers and large trees. Allwoody plants rooted within the plot area were measured andobserved.
Plant reproductive behaviour in this study was observedbetween February 1986 and September 1991 for a total of68 months. !Reproduction" was defined as the production ofripe fruit with mature seed. Reproductive behaviour of allwoody plants rooted within each plot was monitored byvisually scanning the plant using binoculars and the groundunderneath the canopy for the presence of mature seed orripe fruit.
Statistical analysis
All analyses are standardized on a per hectare basis (TableS1). Individual plants were characterized as being either!sterile" or !reproductive" each month, based upon thepresence of mature seed or ripe fruit. The temporal patternof reproductive behaviour was examined at the level of theentire study site, among growth forms and among foresttypes. Observed values were compared with expectedvalues for each group of individuals. !Expected values" foreach group were generated by randomizing reproductivebehaviour (the dependent value) against an individual"s
Letter Landscape level Bornean plant reproduction 957
! 2007 Blackwell Publishing Ltd/CNRS

attributes, e.g., forest type, growth form (the independentvariables). Partial analyses for each group were performedby randomizing those individuals found in a specific foresttype or a particular growth form. A sufficient number ofrandomizations were performed until a normal distributionof !expected" values was obtained, usually 100 times.Randomizations were limited to prevent the completeremoval of the monthly variance among reproductivevalues, which occurs when randomizations are performedthousands of times. The significance of the observed valuewas determined by comparing it to the distribution of!expected" values, using standard non-parametric tech-niques (Manly 1997).
After examining the preliminary results, definitions for!mast" or supra-annual mast fruiting (SMF) and !background"or aseasonal fruiting (AF) fruiting periods were developedusing finite mixture theory (Strait et al. 1996). Finite mixturetheory simply evaluates the probability that a population ofvalues is best described by a single distribution, given amean and standard deviation, or a known !mixture" of twoor more distributions, each with a distinct mean andstandard deviation. This approach provides an effective andobjective method for classifying the observed reproductivebehaviour as being a SMF or AF period. After classifyingthe months into one of the seasons, subsequent tests ofreproductive behaviour were performed separately for thetwo seasons.
Taxonomic and phylogenetic diversity
Taxonomic identity of slightly > 60% of the !morpho-species" was determined to the genus level by several ofthe authors. A smaller subset of plants was identified tothe species level. Individuals of unknown taxonomicidentity were predominantly small trees and woodyclimbers. A supertree of phylogenetic diversity at thegenus level was generated using Phylocom (Webb &Donoghue 2005). To avoid biases in phylogenetic reso-lution, all phylogenetic structure in the supertree wascollapsed at the family level.
Two measures of diversity were generated: taxonomicand phylogenetic. !Expectations" for taxonomic diversitywere generated by randomizing generic names whilephylogenetic diversity was examined using the matrixrepresentation of the supertree. Phylogenetic diversity wasmeasured as the mean pair-wise phylogenetic distancesbetween each individual observed fruiting during a particularmonth, by counting the number of nodes separating the twoindividuals. The percentage of unknowns was controlledduring randomizations. Randomizations were limited toreproductive individuals. All analyses were written inMathematica 5.2 (Wolfram 1998) by CHC and can beprovided upon request.
Forest type productivity
Forest structural data was gathered in a much larger samplearea (Tables S2 and S3; see Marshall 2004). Plot locationswere chosen so that samples were randomly distributedwithin each forest type. Total sample area for woodyclimbers (> 4.5 cm DBH), large trees (> 34.5 cm DBH)and hemi-epiphytic figs (> 4.5 cm DBH) was 5 ha whilesmall trees (14.5–34.5 cm DBH) were sampled in half thearea. Hemi-epiphytic figs and climbers had to be rootedwithin the sample area.
Fruit productivity for each forest type was then calculatedby multiplying the number of fruiting individuals eachmonth with the mean basal area per hectare for each sizeclass of trees and climbers. Results were then combined toobtain total !fruiting basal area per hectare" for each month.The mean, standard deviation and maximum value werecalculated across the entire observation period for eachforest type. To determine the relative productivity amongforest types, the relative rank of fruit productivity wascalculated for each month and an average rank across foreach forest type was obtained for the entire observationperiod.
R E S U L T S
Community-level behaviour
During the 68 months of continuous monitoring ofreproductive behaviour across the seven forest types andthree growth forms, two brief episodes were identified as!supra-annual mast fruiting" or SMF events (Fig. 1). DuringAF months, no annual or biannual pattern of reproductionwas detected (Fig. S1). The two SMF events were separatedby nearly 4 years, each lasting only 2 or 3 months. Thesecond mast event (January–March 1991) lasted 3 monthsand, on average, fruiting levels were higher than in the firstmonitored mast event (February–March 1987). Averagereproductive levels during SMF events (8.5%) represent analmost fourfold increase in comparison to AF months. Oneperiod of significantly low reproductive activity (< 1.6%fruiting) lasted for 7 months, from September 1988 toMarch 1989. Only 1.0% of monitored individuals fruited inOctober 1988.
Both taxonomic and phylogenetic measures of diversitywere less than expected during SMF events (Fig. 1c–d).Trends between the two measures generally agreed,although the correlation between the two varied ininteresting ways. During AF months, reproductive individ-uals were generally more diverse than expected, particularlygiven phylodiversity in the 8 months with c. 3% reproduc-tion. Although all SMF months were significantly lessdiverse given taxonomic measures, one SMF month (the
958 C. H. Cannon et al. Letter
! 2007 Blackwell Publishing Ltd/CNRS

second highest level of reproduction observed) was notsignificantly less diverse given phylogenetic measures.Interestingly, the expectations for phylogenetic diversityare relatively invariant to sample size, indicating that thecentral tendency of average phylogenetic distance betweentwo individuals is stable for small sample sizes.
The decline in diversity during SMF events is largelybecause of the reproductive behaviour of the ecologicallydominant Dipterocarpaceae (Table S4). The genus Vaticawas the only genus, which did not completely restrict itsreproduction to SMF events, while the genera Dipterocarpus,Shorea and Hopea exhibited the highest ratio of observed toexpected number of individuals fruiting within the mastingevents (16.3, 11.5 and 11.1, respectively) of any taxonomicgroup. All species of Dipterocarpus significantly restrictedtheir reproduction to SMF events, while five of sixteenShorea species were more variable in their reproductivebehaviour (Table S4). These results agree well with moredetailed results published previously (Curran et al. 1999;Curran & Leighton 2000; Curran & Webb 2000).
While the Dipterocarpaceae dominated SMF events, awide diversity of other taxa participated as well. It isimportant to consider that the overall diversity contributedby the Dipterocarpaceae is relatively small. This family isrepresented by only four genera in our data, but all SMFevents involved at least 60 and as many as 90 genera. Givenphylogenetic diversity, the contribution of the Dipterocarp-aceae is obviously quite small (Fig. S2). Several species richgenera significantly restricted their reproduction to SMFevents, including Diospyros and Syzygium, two of the mostdiverse genera at the study site (Cannon & Leighton 2004).Overall, at least 27 genera in 24 families were determined tosignificantly restrict their reproduction to SMF events.These taxa include a number of small genera, includingNeoscortechinia (Euphorbiaceae), Ochanostachys (Olacaeae) andNephelium (Sapindaceae), which have the highest ratio ofreproductive events within SMF events versus outside, otherthan the Dipterocarpaceae. Other diverse and strictly SMFgenera include Lansium (Meliaceae), Artocarpus (Moraceae)and Castanopsis (Fagaceae). Additionally, the percentage ofunknown individuals that fruited during the SMF events wasgreater than expected, indicating that several taxa, which arerarely seen and poorly known at the study site, are SMF taxaand our current estimates for diversity during SMF eventsare clearly underestimates. Willughbeia spp. (Apocynaceae)was the only group of climbing plants which restricted,rather weakly, its behaviour to the SMF events. A fewgenera had significantly elevated levels of reproductionduring the months immediately preceding or following theSMF events without being strict SMF taxa: Polyalthia(Annonaceae), Calophyllum (Clusiaceae), including a genusof climbers, Rourea (Connaraceae; see Table S4). A singlespecies in the genus Cyathocalyx (Annon.) significantly
avoided the SMF events in its reproductive behaviour.These results are similar to those found using conventionalstatistical analyses (Marshall 2004).
Reproductive behaviour by growth form
Fruiting behaviour varied substantially among growth forms(Fig. 2) and the SMF events were most apparent within thetree community, being most sharply evident among large(> 24.5 cm DBH) trees (Fig. 2). Ficus (Moraceae) wereclearly aseasonal in their reproduction (Fig. 2a,e), withabsolutely no difference between the models assuming oneor two seasons. Throughout the study period, figs alsomaintained a much higher level of reproductive behaviour(averaging 5% of stems) than other growth forms. Thewoody climber community did participate weakly in the SMFevents, although the likelihood ratio of the mixed model ofreproduction assuming two seasons to a single model with asingle season is only marginally significant (Fig. 2b,f). Woodyclimbers also produced the most sustained period ofsignificantly increased reproduction (averaging 3.5% ofstems) for any plant form or forest type during the latterhalf of 1989 into 1990, for a period of 10 months.
When a single model for reproductive behaviour isassumed among trees, a majority of the observations aresignificantly below expectations, with only 1.1% of treeswere fruiting at the lowest point. But, when large and smalltrees are separated in the analysis and two seasonal patternsare assumed (SMF and AF), then only a small number oflow reproductive periods were observed (Fig. 2). Both largeand small trees exhibited SMF behaviour, although repro-duction levels during SMF events among small trees wassubstantially lower than among large trees and the first SMFevent in 1987 was less pronounced than the second SMFevent (Fig. 2). During the peak of second mast event, nearly15% of the large trees, across all forest types, werereproductive (Fig. 2).
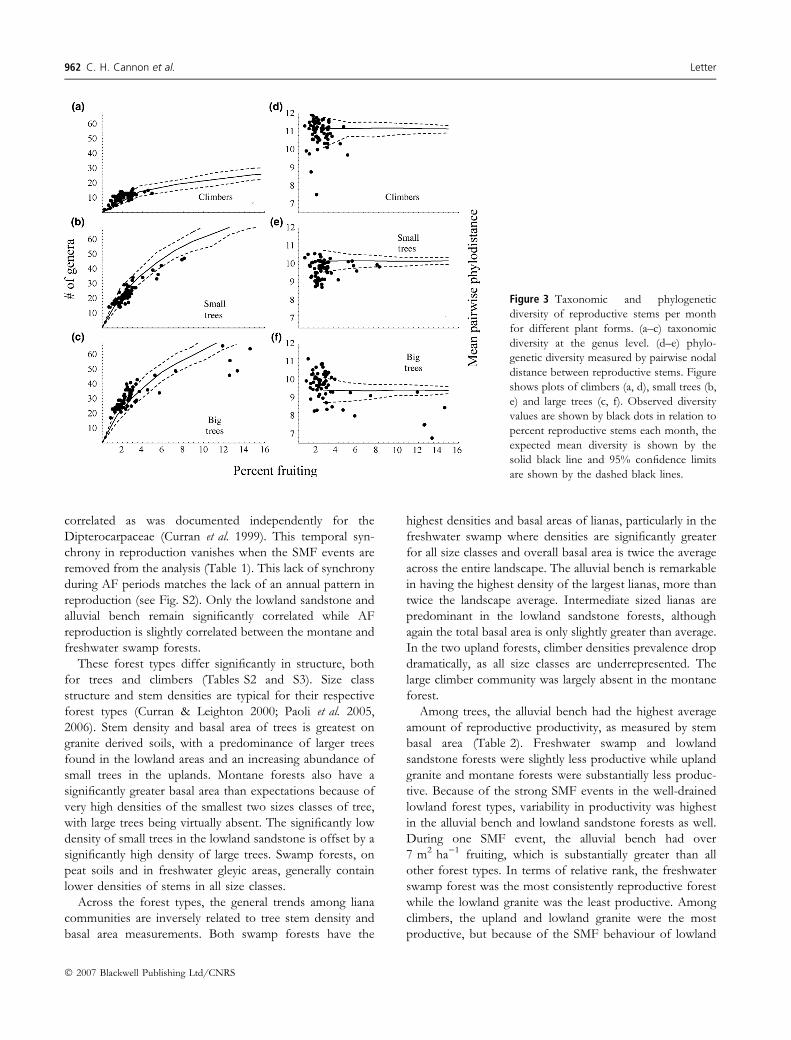
Taxonomic and phylogenetic diversity among woodyclimbers were roughly near expectations, although a fewmonths of high reproductive activity were significantly lessdiverse in terms of phylogenetic diversity than expected(Fig. 3). While taxonomic diversity was low among climbers,the phylogenetic diversity is substantially greater amongthese plants than either small or large trees. The relationshipbetween diversity of reproductive individuals and overallreproductive activity among small trees did not show asubstantially negative trend, as it does among large trees(Fig. 3). Diversity among reproductive small trees wasgenerally lower than expectations, particularly for thephylogenetic measure, suggesting that these small treeshave a greater level of synchrony within closely related taxa.The phylogenetic measures for diversity among large treesshow a strong negative correlation with overall reproductive
Letter Landscape level Bornean plant reproduction 959
! 2007 Blackwell Publishing Ltd/CNRS

behaviour. Again, it is important to note that these diversitylevels are still much greater than would be expected if onlythe Dipterocarpaceae participated (Fig. S2).
Reproductive behaviour by forest type
The two SMF events were apparent in five forest types,excluding only the montane and peat swamp forests (Fig. 4).Levels of participation in the SMF events varied substan-tially across forest types, with the alluvial bench demon-strating the greatest increase in reproduction (Fig. 4e,l) whileboth the upper granite (300–700 m a.s.l.) and freshwaterswamp forests only weakly participated (Fig. 4b,f,i,m).While the montane (> 700 m a.s.l.) and peat swamp forests
did not participate in the general mast events, each foresttype did exhibit sustained periods of higher than averagereproduction. Beginning in mid-1989, the montane forestexhibited a 6-month period of elevated reproduction(Fig. 4a,h), which correlated weakly with a similar andsimultaneous episode in the freshwater swamp. In the peatswamp, the reproductive peak preceded and overlappedwith the second SMF event (Fig. 4g). However, the mixturemodel results did not significantly differ between the singleand two season models. This lack of significance is due tothe complete absence of the first SMF event in the peatswamp. When the plant communities are analyzed separatelyamong forest types, the three !mid-season" months noted forthe entire community largely disappear. In the lowland
(a) (c)
(b) (d)
Figure 1 Community level patterns of reproduction over 68 months in a Bornean rainforest for all plants across all forest types. (a) Monthlylevels of reproduction. Percentage of stems reproducing per hectare is shown. Average number of stems observed each month = 4832(min = 4152, max = 5018). Observed levels of reproduction are shown by thick grey line. The expected mean level of reproduction, acrossthe entire observation period, is shown by the solid black line while 95% confidence limits are shown by the dashed black lines. The thin greyline illustrates a single replicate of fruiting behaviour, given temporal stochasticity. For statistical analysis, the two SMF events were separatedfrom the rest of the observation period. These SMF events are shown in the black boxes. (b) Frequency distribution of community-widelevels of reproduction for all plants across all forest types. The bar chart in the background represents the observed levels of reproduction bymonth. The black curves indicate the expected distributions from ten random reproductive patterns, chosen to represent the range ofstandard deviation values, given all months. The grey curves indicate the two expected distributions, given the assumption of two seasons:!SMF" and !background" reproduction. (c) Taxonomic diversity at the genus level, in relation to percentage of stems fruiting. Each pointindicates 1 month. Mean and 95% confidence limits are shown, as in (a, d). Phylogenetic diversity measured by pairwise nodal distancebetween reproductive individuals. Observed diversity values are shown by black dots in relation to percent reproductive stems each month,the expected mean diversity is shown by the solid red line, 95% confidence limits are shown by the dashed red lines and maximum andminimum values are shown by thin purple lines for randomizations.
960 C. H. Cannon et al. Letter
! 2007 Blackwell Publishing Ltd/CNRS

sandstone and alluvial bench, two !mid-season" months areapparent. This pattern suggests that the !mid-season" periodmay largely be due to slight differences in the timing ofreproduction among the forest types. Lowland granite hasthe lowest AF level (slightly > 2%), while SMF levels (12%)were among the highest (Fig. 4c,j).
Both in absolute terms and in the correlation withreproduction levels, forest types differed significantly in thepatterns of taxonomic and phylogenetic diversity relative toreproductive levels (Fig. 5). Montane forest had the lowestlevels of expected taxonomic diversity (Fig. 5a) while thelowland sandstone had the highest (Fig. 5d). The generalexpected level of phylogenetic diversity was similar across allforest types, indicating that while species numbers may belower in the montane forest, these taxa come from a diverseset of lineages. Few forest types exhibited negative trends
between taxonomic diversity and increasing reproductivelevels, primarily the lowland sandstone and peat swamp.This pattern was most pronounced in the peat swamp,where almost all months with > 5% reproduction fellsignificantly below expectations (Fig. 5g). Phylogeneticdiversity in each forest type was consistently belowexpectations, except in the montane and lowland granite(Fig. 5h,j). Declines in phylogenetic diversity with increasingreproductive participation were only weakly apparent inmost forest types (Fig. 5).
The correlation of reproductive levels across forest typeswas quite strong when the SMF events were included(Table 1). Reproduction across all plants in the three well-drained lowland forest types (lowland granite, lowlandsandstone and alluvial bench) were strongly correlated whilethe upper and lowland granite forests were also tightly
(a)(e)
(b) (f)
(c) (g)
(d) (h)
Figure 2 Fruiting behaviour over 68 monthsin a Bornean rainforest for different plantforms. (a) Figs: average number of stemsobserved each month = 116 (min = 93,max = 121); (b) Woody climbers: averagenumber of stems observed eachmonth = 951 (min = 847, max = 991); (c)Small trees (14.5–24.5 cm DBH); (d) Largetrees (> 24.5 cm DBH). Observed values areshown in thick grey line. The average level offruiting expected across all months is indica-ted by the solid black line while 95%confidence limits are shown by the dashedblack lines. The thin grey line illustrates asingle replicate of random fruiting behaviour.(e) Frequency distribution of fig reproductivelevels by month. (f) Frequency distributionof woody climber reproductive levels bymonth. (g) Frequency distribution of smalltree reproductive levels by month. (h) Fre-quency distribution of small tree reproduc-tive levels by month. Barcharts illustrateobserved levels of reproduction. Blackcurves assume a single season, grey curvesassume a mixed model with two seasons.
Letter Landscape level Bornean plant reproduction 961
! 2007 Blackwell Publishing Ltd/CNRS
correlated as was documented independently for theDipterocarpaceae (Curran et al. 1999). This temporal syn-chrony in reproduction vanishes when the SMF events areremoved from the analysis (Table 1). This lack of synchronyduring AF periods matches the lack of an annual pattern inreproduction (see Fig. S2). Only the lowland sandstone andalluvial bench remain significantly correlated while AFreproduction is slightly correlated between the montane andfreshwater swamp forests.
These forest types differ significantly in structure, bothfor trees and climbers (Tables S2 and S3). Size classstructure and stem densities are typical for their respectiveforest types (Curran & Leighton 2000; Paoli et al. 2005,2006). Stem density and basal area of trees is greatest ongranite derived soils, with a predominance of larger treesfound in the lowland areas and an increasing abundance ofsmall trees in the uplands. Montane forests also have asignificantly greater basal area than expectations because ofvery high densities of the smallest two sizes classes of tree,with large trees being virtually absent. The significantly lowdensity of small trees in the lowland sandstone is offset by asignificantly high density of large trees. Swamp forests, onpeat soils and in freshwater gleyic areas, generally containlower densities of stems in all size classes.
Across the forest types, the general trends among lianacommunities are inversely related to tree stem density andbasal area measurements. Both swamp forests have the
highest densities and basal areas of lianas, particularly in thefreshwater swamp where densities are significantly greaterfor all size classes and overall basal area is twice the averageacross the entire landscape. The alluvial bench is remarkablein having the highest density of the largest lianas, more thantwice the landscape average. Intermediate sized lianas arepredominant in the lowland sandstone forests, althoughagain the total basal area is only slightly greater than average.In the two upland forests, climber densities prevalence dropdramatically, as all size classes are underrepresented. Thelarge climber community was largely absent in the montaneforest.
Among trees, the alluvial bench had the highest averageamount of reproductive productivity, as measured by stembasal area (Table 2). Freshwater swamp and lowlandsandstone forests were slightly less productive while uplandgranite and montane forests were substantially less produc-tive. Because of the strong SMF events in the well-drainedlowland forest types, variability in productivity was highestin the alluvial bench and lowland sandstone forests as well.During one SMF event, the alluvial bench had over7 m2 ha)1 fruiting, which is substantially greater than allother forest types. In terms of relative rank, the freshwaterswamp forest was the most consistently reproductive forestwhile the lowland granite was the least productive. Amongclimbers, the upland and lowland granite were the mostproductive, but because of the SMF behaviour of lowland
Figure 3 Taxonomic and phylogeneticdiversity of reproductive stems per monthfor different plant forms. (a–c) taxonomicdiversity at the genus level. (d–e) phylo-genetic diversity measured by pairwise nodaldistance between reproductive stems. Figureshows plots of climbers (a, d), small trees (b,e) and large trees (c, f). Observed diversityvalues are shown by black dots in relation topercent reproductive stems each month, theexpected mean diversity is shown by thesolid black line and 95% confidence limitsare shown by the dashed black lines.
962 C. H. Cannon et al. Letter
! 2007 Blackwell Publishing Ltd/CNRS

granite climbers (Fig. S3), variability in reproductive pro-ductivity is quite high. In the lowland sandstone, climberswere the most consistently reproductive, ranking substan-tially higher than all other forest types across the observa-tion period. This high relative rank is largely due to the very
low variability in reproductive productivity as the mean andmaximum productivity values for the lowland sandstone arequite low. The freshwater swamp climber community wasthe second most consistently reproductive of the sevenforest types examined.
(a) (h)
(b) (i)
(c) (j)
(d) (k)
(e) (l)
(f) (m)
(g) (n)
Figure 4 Fruiting behaviour over68 months in a Bornean rainforest fordifferent forest types. (a) montane (meanN month)1 = 283, min = 266, max = 301);(b) upper granite (mean N month)1 = 640,min = 504, max = 678); (c) lower granite(mean N month)1 = 673, min = 572, max= 696); (d) lower sandstone (meanN month)1 = 1023, min = 911, max =1049); (e) alluvial bench (mean N month)1
= 646, min = 578, max = 671); (f) freshwa-ter swamp (mean N month)1 = 870,min = 676, max = 922); and (g) peat swamp(mean N month)1 = 688, min = 610,max = 701). Observed values are shown inthick grey line. The average level of fruitingexpected across all months is indicated bythe solid black line while 95% confidencelimits are shown by the dashed black lines.The thin grey line illustrates a single replicateof random fruiting behaviour. Frequencydistribution of reproductive levels by monthfollow: (h) montane; (i) upper granite; (j)lower granite; (k) lower sandstone; (l) alluvialbench; (m) freshwater swamp; and (n) peatswamp. Barcharts illustrate observed levelsof reproduction. Black curves assume asingle season, grey curves assume a mixedmodel with two seasons.
Letter Landscape level Bornean plant reproduction 963
! 2007 Blackwell Publishing Ltd/CNRS

Individual behaviour
Over 7288 individuals were monitored for 68 months,including 172 figs, 1457 lianas and 5659 trees (seeTable S1). More than half of these plants (4054 or 56%)were sterile during the observation period, including 66figs, 824 lianas and 3164 trees. Fig individuals were muchmore likely to fruit during the course of our observationsthan other growth forms: with only 38% sterile individuals,while both lianas and trees were right at expectations (57%and 56% sterile, respectively). Of the remaining 3234reproductive individuals, an average of 2.2 fruiting eventswas observed with an average total fruiting time of4.4 months or < 10% of the observation period. Oneindividual of an understory Baccaurea sp. (Euphorbiaceae)fruited almost continuously for a total of 44 months. Thenumber of fruiting events by individuals followed abinomial distribution, with the mode of the distributionat zero and a maximum of 16 separate reproductiveepisodes observed in a single individual.
More than half of the reproductive individuals (1654 or51%) participated in at least one SMF event. Less than 10%of reproductive individuals can be considered strictly!masting", as only 320 individuals completely restricted theirreproductive behaviour to the five SMF months. Byextending the SMF events period by a single month, bothpre- and post-peak, the total mast fruiting individualsincreased twofold to 768 individuals. Most of this increaseoccurred among trees. Fully 25% of tree individuals fruitedwithin this extended mast period, but at no other time in theobservation period. For all individuals with fruiting restric-ted to the expanded mast window, slightly more than aquarter (199) fruited in both mast events.
Among the forest types, the percentage of reproductiveindividuals varied relatively little from the general patternexcept in the montane forests, where 64% of all individualsdid produce fruit during the observation period. The
lowland granite and peat swamp had the lowest rates ofreproduction (40% and 41%, respectively) while thefreshwater swamp had the highest rate (47%) among theremaining forest types. The average fruiting duration forindividuals in different forest types varied from 5.1 monthsin the freshwater swamp down to 3.5, 3.7 and 3.7 months inthe lower granite, montane and upper granite, respectively.
D I S C U S S I O N
Supra-annual mast fruiting events
In this study, the SMF events were synchronized acrossseveral different forest types in a single watershed and asubstantial proportion of the community level taxonomicand phylogenetic woody tree diversity participated (60–70%of total genera and at least 80% of total supertree breadth).The events were most pronounced in the alluvial bench andlowland sandstone forests, tapering off both upslope and inpoorly drained lowland conditions. Synchronized SMFevents were not apparent in the montane and nutrient-poorpeat-swamp forests. The occurrence of a single and separatemast fruiting event in the montane forest may represent anindependent evolution of the behaviour. This montaneforest event was sustained for a longer period of time andexhibited little reduction in diversity with increasing levels ofreproduction.
The Dipterocarpaceae were the most extreme in theirspecialization on SMF behaviour, with three speciose genera(Dipterocarpus, Hopea and Shorea) having the greatest ratio ofobserved to expected reproductive events confined to thesebrief periods. Yet, a wide diversity of taxa significantlyrestricted their reproduction to SMF events as well,including several other unrelated speciose genera (Dacry-odes:Burseraceae, Diospyros:Ebenaceae, Artocarpus:Moraceaeand Syzygium:Myrtaceae). The negative relationship betweentaxonomic and phylogenetic diversity with level of repro-ductive behaviour is strongly apparent at the communitylevel while it largely disappears within a single forest type.This pattern occurs because the taxa participating in theSMF events are similar across forest types. However, withinforest types, diversity during SMF events was not or onlyslightly reduced, in comparison to expectations, suggestingthat most clades of the woody plant supertree areparticipating. In the montane forest, phylogenetic diversitymeasures did not decline with increasing levels of repro-duction, despite the low overall community diversity relativeto other forest types.
Among trees, larger individuals were clearly the majordrivers of the SMF events, as smaller individuals (14.5–24.5 cm DBH) rarely reached half their intensity. Themajority of woody climbers did not participate and only aweak event appears to have occurred in the lowland granite
Table 1 Regression values of reproductive levels by monthbetween each forest type
MO UG LG LS AB FS PS
MO 0.09 0.02 0.09 0.05 0.18 0.03UG 0.12 0.81** 0.74** 0.73** 0.59** 0.08LG 0.01 0.02 0.77** 0.80** 0.47* 0.08LS 0.13 0.01 0.02 0.90** 0.64** 0.10AB 0.01 0.02 0.11 0.40** 0.59** 0.19FS 0.22* 0.08 0.01 0.09 0.00 0.10PS 0.02 0.00 0.03 0.03 0.14 0.01
Values above the grey diagonal include the two mast events, whilevalues below exclude those events. Significant regression values are*P < 0.05; **P < 0.01.
964 C. H. Cannon et al. Letter
! 2007 Blackwell Publishing Ltd/CNRS

climber community (Fig. S3c). The bias in this behaviourtowards large trees, seems to indicate that the selectionpressure has not been experienced equally by the twogrowth forms.
Aseasonal fruiting
Outside of the SMF events, few, if any, apparent reproduc-tive cycles emerged (Table 2 and Fig. S1). Overall, the
(a)
(b)
(c)
(d)
(e)
(f)
(g)
(h)
(i)
(j)
(k)
(l)
(m)
(n)
Figure 5 Taxonomic and phylogeneticdiversity of reproductive stems per monthfor different forest types. (a–g) Taxonomicdiversity at the genus level. (h–n) Phylo-genetic diversity measured by pairwise nodaldistance between reproductive stems. Ob-served diversity values are shown by blackdots in relation to percent reproductivestems each month, the expected meandiversity is shown by the solid black lineand 95% confidence limits are shown by thedashed black lines. Letters correspond tohabitat types as in Figure 4.
Letter Landscape level Bornean plant reproduction 965
! 2007 Blackwell Publishing Ltd/CNRS

community displays a relatively constant background fruit-ing level of c. 2.5% of the stems (Fig. 1). Figs reproduce at amuch higher rate than the rest of the community (Fig. 2),providing further evidence of their keystone role (Leighton& Leighton 1983). Lowland granite forest had the lowest AFlevels, with average reproduction slightly < 2% of stems(Fig. 4j) while the upper montane and freshwater swampboth have substantially higher rates of constant reproduc-tion than other forest types (Fig. 4h,m). Phylogeneticdiversity at AF levels was generally lower than expectationsamong small trees while the converse held for large trees. Areduction in phylogenetic diversity at lower levels ofreproduction indicates a certain amount of taxonomicsynchrony while the converse indicates that individualsmay actually be staggering their reproduction. Anotherinteresting and important aspect of phylogenetic diversity isits invariance to sample size, indicating that phylogeneticmeasures not only capture a more relevant aspect of!diversity" than taxonomic measures, but also serve as amore robust descriptor than taxonomic diversity per se.
More than a third of the trees (> 40 cm DBH) neverfruited during the observation period (444 of a total of 1162individuals). No obvious bias was detected in the forest typedistribution of these non-reproductive individuals. Amonglegumes, the three most common large tree generapossessed the smallest fraction of sterile individuals (out33 trees of Sindora, Koompassia and Parkia only 1 was sterile).Because the ratio of fruiting to sterile unknown taxa is thesame for all trees, we can eliminate potentially undetectedcryptic and rare species among these sterile individuals.Other taxa in which most individuals were reproductive areDiospyros, Shorea, Irvingia:Simaroubaceae, Dipterocarpus andOchanostachys:Olacaceae. Several genera had ratios greaterthan one (more sterile trees than fruiting), includingCalophyllum:Clusiaceae, Atuna:Chrysobalanceae and Beilsch-media:Lauraceae.
Across the observation period, reproductive productivityof trees (e.g. basal area fruiting per hectare; Table 2),varied considerably across forest types. The two mostproductive types, alluvial bench and freshwater swampforests, achieved this distinction in very different ways.Alluvial bench forest was massively reproductive duringthe SMF events, indicated by both the large standarddeviation and maximum values, while the freshwaterswamp was more consistently reproductive. Peat-swampdisplayed the most consistent reproductive productivity ofall forest types. Woody climber productivity was highlyvariable across forest types, with productivity varyingalmost three-fold.
Conservation implications
Given the brief 2–3 month duration of SMF events and lowlevels of plant reproduction during long c. 4 year AFperiods, the vertebrate community of frugivores andomnivores in these forests experience chronic food short-ages (Curran & Leighton 2000; Wong et al. 2005). Thecomplete lack of synchrony among plants in different foresttypes during AF periods likely contributes to the mainten-ance of resident consumer populations, as they move locallyand follow fruit availability or shift to less preferred foodsources (Leighton & Leighton 1983; Leighton 1993;Fredriksson et al. 2006). Freshwater swamp forest appearsdistinctive among the forest types studied, as it maintainedgenerally high and consistent levels of productivity and onlyweakly participated in the SMF events. Our results highlightthe need for a diversity of forest types within managementunits for certain vertebrates, particularly potential !keystone"forest types (e.g. swamps and montane regions) that arecritical for some animal populations during periods of lowplant reproductive behaviour in the low to mid-elevationdipterocarp forests.
Table 2 Reproductive productivity of forest types for trees and climbers
Trees (m2 ha)1) Climbers (cm2 ha)1)
Mean SD Max Rank Mean SD Max Rank
MO 0.65 0.50 2.15 4.94 10.82 13.21 53.86 6.18
UG 1.24 1.17 6.77 3.04 61.31 112.23 573.72 4.55LG 1.21 2.51 15.86 5.14 23.51 22.79 87.48 5.27LS 1.66 2.69 12.13 3.47 82.74 54.72 313.22 2.26AB 1.39 2.29 12.53 3.99 44.78 60.31 267.30 4.40FS 0.99 0.81 4.43 3.72 79.99 45.90 212.35 2.40PS 0.97 0.58 2.28 3.69 59.19 55.50 242.49 3.78
Productivity is expressed by basal area of reproductive individuals during each month of observation. Mean, standard deviation and maximumvalues are shown for each forest type in the first three columns for each growth form. Rank is the average rank of productivity among allforest types for each month of observation. Lower ranks indicate higher relative productivity. Bold-faced rank values indicate the mostproductive type, italicized values indicate least productive.
966 C. H. Cannon et al. Letter
! 2007 Blackwell Publishing Ltd/CNRS

Synchronization of SMF events across Malesia is likelyregulated by environmental cues, particularly prolongeddroughts and their associated effects, caused by the El-NinoSouthern Oscillation (ENSO) cycle (Ashton et al. 1988;Curran et al. 1999). While the ENSO cycle currently repeatsroughly 2–3 times a decade, this pattern has potentiallychanged on a relatively short historical time scale. Paleocli-mate simulations indicate that the cycle may have been morefrequent and weaker during much of the Last Glacial Cycle(Bush 2007). This would mean that the current supra-annualnature of the SMF events would have been less apparentroughly 10 Ka and that forest productivity may have beenmore evenly distributed through time. Additionally, ENSOcycles are likely to shift due to global climate change(Trenberth & Hoar 1997) and the observed synchrony maybe disrupted or altered in various ways resulting in cascadingeffects on both frugivores and plant regeneration. Given thesynergies of land use and global climate change in South-East Asia, future changes in the cycle could unravel thesynchronization of the behaviour (Sherry et al. 2007).Current evidence suggests that the more frequent andintense droughts now occurring might cause reproductivemiscues and frequent but unsuccessful fruiting events(Harrison 2000; Maycock et al. 2005; Sakai et al. 2006).The predictability and intensity of the probable cue for SMFreproductive behaviour in the Bornean forests, bothhistorically and in the future, is a key component maintain-ing both this unusual reproductive behaviour among woodyplants within and across forest types but the current animalpopulations, which depend upon fruit and seed productionby these plants.
A C K N O W L E D G E M E N T S
We thank the Government of Indonesia for the privilege toconduct scientific research in West Kalimantan, specificallyDr Soetikno Wirjoatmijo, Dr Dedy Darnaedi andDr Rochadi Abdulhadi (Indonesian Institute of Sci-ences ⁄ LIPI-PPPB), Mr Herman Prayitno (formerly ofIndonesian Parks and Conservation ⁄ PHPA-Kalbar) andDr Kuswata Kartinawata (formerly UNESCO-MAB). CHCwould like to thank the Department of Biological Sciences,Texas Tech University; Conservation, Food and Health,Inc.; the National Geographic Society; the Nature Conser-vancy"s Indonesia Program; and the Explorer"s Club forsupporting this research in various ways. Financial supportfor LMC included a NSF Dissertation Improvement grant;Wildlife Conservation Society W. Alton Jones Foundation;Conservation International"s Biodiversity Support Program(grant no. 8510); UNESCO-MAB Young Scientist TrainingProgram, Mercer Fellowship, Arnold Arboretum of HarvardUniversity and Sigma Xi is gratefully acknowledge. Cur-rently, LCM is supported by the Santa Fe Institute
Robustness Program, NASA Earth Sciences Program,National Science Foundation Biocomplexity Program, JohnD. and Catherine T. MacArthur Foundation and theMacMillian International Institute and Tropical ResourcesInstitute, Yale University. AJM thanks the Arnold Arbor-etum of Harvard University and Conservation Internationalfor postdoctoral support. ML received financial support forthe Cabang Panti Research Site from National ScienceFoundation grant BNS-840-9299; the National GeographicSociety; Conservation, Food and Health, Inc.; and theMerck Foundation. Numerous research assistants from alarge number of countries participated in this work. Wegreatly appreciate their contribution and commitment toperforming long-term research.
R E F E R E N C E S
Appanah, S. (1993). Mass flowering of dipterocarp forests in theaseasonal tropics. J. Biosci., 18, 457–474.
Ashton, P.S., Givnish, T.J. & Appanah, S. (1988). Staggeredflowering in the Dipterocarpaceae: new insights into floralinduction and the evolution of mast fruiting in the aseasonaltropics. Am. Nat., 132, 44–66.
Bawa, K.S. (1983). Patterns of flowering in tropical plants. In:Handbook of Experimental Pollination Biology. (eds Jones, C.E. &Little, R.J.). Scientific and Academic Editions, New York, NY,pp. 394–410.
Bush, A.B.G. (2007). Extratropical influences on the El Nino-southern oscillation through the late quaternary. J. Clim., 20,788–800.
Cannon, C.H. & Leighton, M. (2004). Tree species distributionsacross five habitats in a Bornean rain forest. J. Veg. Sci., 15, 257–266.
Curran, L.M. & Leighton, M. (2000). Vertebrate responses tospatiotemporal variation in seed production of mast-fruitingdipterocarpaceae. Ecol. Monogr., 70, 101–128.
Curran, L.M. & Webb, C.O. (2000). Experimental tests of thespatiotemporal scale of seed predation in mast-fruiting Dip-terocarpaceae. Ecol. Monogr., 70, 129–148.
Curran, L.M., Caniago, I., Paoli, G.D., Astianti, D., Kusneti, M.,Leighton, M. et al. (1999). Impact of El Nino and logging oncanopy tree recruitment in Borneo. Science, 286, 2184–8.
Fredriksson, G., Wich, S. & Trisno (2006). Frugivory in sun bears(Helarctos malayanus) is linked to El Nino related fluctuations infruiting phenology, East Kalimantan, Indonesia. Biol. J. Linn. Soc.Lond., 89, 489–508.
Grubb, P.J. (1977). Control of forest growth and distribution onwet tropical mountains: with special reference to mineral nutri-tion. Annu. Rev. Ecol. Syst., 8, 83–107.
Harrison, R.D. (2000). Repercussions of El Nino: drought causesextinction and the breakdown of mutualism in Borneo. Proc. R.Soc. Lond. B Biol. Sci., 267, 911–915.
Harrison, R.D. (2003). Fig wasp dispersal and the stability of akeystone plant resource in Borneo. Proc. R. Soc. Lond. B Biol. Sci.,270, S76–S79.
Ichie, T., Kenta, T., Nakagawa, M., Sato, K. & Nakashizuka, T.(2005). Resource allocation to reproductive organs during
Letter Landscape level Bornean plant reproduction 967
! 2007 Blackwell Publishing Ltd/CNRS

masting in the tropical emergent tree, Dipterocarpus tempehes.J. Trop. Ecol., 21, 237–241.
Isagi, Y., Sugimura, K., Sumida, A. & Ito, H. (1997). How doesmasting happen and synchronize? J. Theor. Biol., 187, 231–239.
Iwasa, Y. & Satake, A. (2004). Mechanisms inducing spatiallyextended synchrony in mast seeding: The role of pollen couplingand environmental fluctuation. Ecol. Res., 19, 13–20.
Janzen, D.H. (1974). Tropical blackwater rivers, animals, and mastfruiting by the Dipterocarpaceae. Biotropica, 4, 69–103.
Kelly, D. (1994). The evolutionary ecology of mast seeding. TrendsEcol. Evol., 9, 465–470.
Kelly, D. & Sork, V.L. (2002). Mast seeding in perennial plants:why, how, where? Annu. Rev. Ecol. Syst., 33, 427–447.
Kudo, G. & Suzuki, S. (2004). Flowering phenology of tropical-alpine dwarf trees on Mount Kinabalu, Borneo. J. Trop. Ecol., 20,563–571.
Lambert, F.R. & Marshall, A.G. (1991). Keystone characteristics ofbird-dispersed Ficus in a Malaysian lowland rainforest. J. Ecol.,79, 793–809.
Leighton, M. (1993). Modeling dietary selectivity by Bornean orang-utans: evidence for integration of multiple criteria in fruit selec-tion. Int. J. Primatol., 14, 257–314.
Leighton, M. & Leighton, D.R. (1983). Vertebrate responses tofruiting seasonality within a Bornean rain forest. In: Tropical RainForests: Ecology and Management (eds Sutton, S.L., Whitmore, T.C.& Chadwick, A.C.). Blackwell Science, Oxford.
Manly, B.F.J. (1997). Randomization, Bootstrap and Monte Carlo Methodsin Biology. 2nd edn. Chapman and Hall, New York, NY.
Marshall, A.J. (2004). Population Ecology of Gibbons and Leaf Monkeysacross a Gradient of Bornean Forest Types. . PhD Dissertation.Department of Anthropology. Harvard University, Cambridge,MA.
Marshall, A.J. & Leighton, M. (2006). How does food availabilitylimit the population density of white-bearded gibbons? In:Feeding Ecology of the Apes and other Primates (eds Hohmann, G.,Robbins, M.M. & Boesch, C.). Cambridge University Press,Cambridge.
Maycock, C.R., Thewlis, R.N., Ghazoul, J., Nilus, R. & Burslem, D.(2005). Reproduction of dipterocarps during low intensity ma-sting events in a Bornean rain forest. J. Veg. Sci., 16, 635–646.
Myers, N., Mittermeier, R.A., Mittermeier, C.G., da Fonseca,G.A.B. & Kent, J. (2000). Biodiversity hotspots for conservationpriorities. Nature, 403, 853–858.
O"Brien, T.G., Kinnaird, M.F., Dierenfeld, E.S., Conklin-Brittain,N.L., Wrangham, R.W. & Silver, S.C. (1998). What"s so specialabout figs? Nature, 392, 668–668.
Olson, D.M. & Dinerstein, E. (2002). The Global 200: Priorityecoregions for global conservation. Ann. Mo. Bot. Gard., 89, 199–224.
Ostfeld, R.S. & Keesing, F. (2000). Pulsed resources and com-munity dynamics of consumers in terrestrial ecosystems. TrendsEcol. Evol., 15, 232–237.
Paoli, G.D. & Curran, L.M. (2007). Soil nutrients limit above-ground productivity in mature lowland tropical forests ofSouthwestern Borneo. Ecosystems, DOI: 10.1007/s10021-007-9042-y.
Paoli, G.D., Curran, L.M. & Zak, D.R. (2005). Phosphorus effi-ciency of Bornean rain forest productivity: evidence against theunimodal efficiency hypothesis. Ecology, 86, 1548–1561.
Paoli, G.D., Curran, L.M. & Zak, D.R. (2006). Soil nutrients andbeta diversity in the Bornean Dipterocarpaceae: evidence forniche partitioning by tropical rain forest trees. J. Ecol., 94, 157–170.
Primack, R. & Cortlett, R. (2005). Tropical rain forests: an ecological andbiogeographical comparison. Blackwell Publishers, Malden, MA.
Sakai, S. (2001). Phenological diversity in tropical forests. Popul.Ecol., 43, 77–86.
Sakai, S., Momose, K., Yumoto, T., Nagamitsu, T., Nagamasu, H.,Hamid, A.A. et al. (1999). Plant reproductive phenology overfour years including an episode of general flowering in a lowlanddipterocarp forest, Sarawak, Malaysia. Am. J. Bot., 86, 1414–1436.
Sakai, S., Harrison, R.D., Momose, K., Kuraji, K., Nagamasu, H.,Yasunari, T. et al. (2006). Irregular droughts trigger massflowering in aseasonal tropical forests in Asia. Am. J. Bot., 93,1134–1139.
van Schaik, C.P., Terborgh, J.W. & Wright, S.J. (1993). The phe-nology of tropical forests: adaptive significance and conse-quences for primary consumers. Annu. Rev. Ecol. Syst., 24, 353–377.
Schnitzer, S.A. & Bongers, F. (2002). The ecology of lianas andtheir role in forests. Trends Ecol. Evol., 17, 223–230.
Shanahan, M., So, S., Compton, S.G. & Corlett, R. (2001). Fig-eating by vertebrate frugivores: a global review. Biol. Rev., 76,529–572.
Sherry, R.A., Zhou, X.H., Gu, S.L., Arnone, J.A., Schimel, D.S.,Verburg, P.S. et al. (2007). Divergence of reproductive phenol-ogy under climate warming. Proc. Natl Acad. Sci. U. S. A., 104,198–202.
Strait, D.S., Moniz, M.A. & Strait, P.T. (1996). Finite mixturecoding: a new approach to coding continuous characters. Syst.Biol., 45, 67–78.
Terborgh, J. (1986). Keystone plant resources in the tropical forest.In: Conservation Biology: The Science of Scarcity and Diversity (ed Soule,M.). Sinauer, Sunderland, MA.
Trenberth, K.E. & Hoar, T.J. (1997). El Nino and climate change.Geophys. Res. Lett., 24, 3057–3060.
Webb, C.O. & Donoghue, M.J. (2005). Phylomatic: tree assemblyfor applied phylogenetics. Mol. Ecol. Notes, 5, 181–183.
Webb, C.O. & Peart, D.R. (2000). Habitat associations of trees andseedlings in a Bornean rain forest. J. Ecol., 88, 464–478.
Wolfram, S. (1998). The Mathematica Book. Wolfram Media ⁄ Cam-bridge University Press, Cambridge.
Wong, S.T., Servheen, C., Ambu, L. & Norhayati, A. (2005). Im-pacts of fruit production cycles on Malayan sun bears andbearded pigs in lowland tropical forest of Sabah, MalaysianBorneo. J. Trop. Ecol., 21, 627–639.
S U P P L E M E N T A R Y M A T E R I A L
The following supplementary material is available for thisarticle:
Figure S1 Annual reproductive behaviour of all woodyplants. Monthly observations are plotted for each year of thepercentage of the reproductive stems. Each year is indicatedby a different type of line, as shown in the legend.
968 C. H. Cannon et al. Letter
! 2007 Blackwell Publishing Ltd/CNRS

Figure S2 The relationship between percentage of repro-ductive stems and their overall phylogenetic diversity amonglarge trees (> 24.5 cm DBH). The lines and black dots areidentical to Figure 7. The grey dots indicate the averagephylodiversity measured among reproductive stems of theDipterocarpaceae.Figure S3 Fruiting patterns over 68 months in a Borneanrainforest for two plant forms in each forest type. Thecolumn of figures represents woody climbers and thesecond column represents all trees. Forest types are in thesame order as in Figure 8. (a, h) montane; (b, i) uppergranite; (c, j) lower granite; (d, k) lower sandstone; (e, l)alluvial bench; (f, m) freshwater swamp; and (g, n) peatswamp. Observed values are shown in thick green line. Theaverage level of fruiting expected across all months isindicated by the solid red line while 95% confidence limitsare shown by the dashed red lines. The inner thin purple lineillustrates a single random fruiting behaviour, while the twoouter thin purple lines indicate the maximum and minimumof all randomizations.Table S1 Sample areas and number of individuals observedfor reproductive behaviour for each growth form acrossthe different forest types. Sample areas for figs, climbersand big trees (> 24.5 cm DBH) are identical while sampleareas for small trees (14.5–24.5 cm DBH) were generallysmaller. Total number of individuals observed for eachplant form within each forest type is listed with stemdensity per hectare. Totals for forest types and plant formsare shown. Type labels are: MO, Montane; UG, UplandGranite; LG, Lowland Granite; LS, Lowland Sandstone;AB, Alluvial Bench; FS, Freshwater Swamp and PS, PeatSwamp.Table S2 Structural differences of tree communities amongforest types. Values are in stem density per hectare. BasalArea (BA) values are m2 ha)1. Forest types are indicated asfollows: PS, peat swamp; FS, freshwater swamp; AB, alluvialbench; LS, lowland sandstone; LG, lowland granite; UG,upland granite and MO, montane. Bold values are greaterthan expected, italicized values are less than expected.(*P < 0.95, **P < 0.99, ***P < 0.999).
Table S3 Structural differences of liana communities amongforest types. Values are in stem density per hectare. BasalArea (BA) values are m2 ha)1 Forest type types are indicatedas follows: PS = peat swamp, FS = freshwater swamp,AB = alluvial bench, LS = lowland sandstone, LG = low-land granite, UG = upland granite, MO = montane. Boldvalues are greater than expected; italicized values are lessthan expected. (*P < 0.95, **P < 0.99, ***P < 0.999).Table S4 Taxonomic groups that significantly restricted theirreproductive behaviour to the SMF events. Genera areorganized by family and species by genus. Taxa withsignificantly elevated levels of reproduction during themonths immediately preceding or following the SMF eventsare indicated by the following symbol #. !Diversity" indicatesthe number of species (including evenness) reported inCannon & Leighton (2004). !Obs in SMF" indicates thenumber of individuals observed fruiting during SMF events.!Ratio" indicates the ratio of observed to expected observa-tions in SMF events. Significance levels are *P < 0.05;**P < 0.01; ***P < 0.001. Significance was determined bynonparametric rank tests of observed against expectedvalues.
This material is available as part of the online articlefrom: http://www.blackwell-synergy.com/doi/full/10.1111/j.1461-0248.2007.01089.x
Please note: Blackwell publishing are not responsible for thecontent or functionality of any supplementary materialssupplied by the authors. Any queries (other than missingmaterial) should be directed to the corresponding author forthe article.
Editor, Marcel RejmanekManuscript received 17 April 2007First decision made 24 May 2007Manuscript accepted 9 June 2007
Letter Landscape level Bornean plant reproduction 969
! 2007 Blackwell Publishing Ltd/CNRS

Landscape level Bornean plant reproduction, Cannon et al. figures
Figure S1. Annual reproductive behavior of all woody plants. Monthly observations are plotted for each year of the percentage of the
reproductive stems. Each year is indicated by a different type of line, as shown in the legend.

Lan
dsc
ape
level
Born
ean p
lant
repro
duct
ion, C
annon e
t al
. fi
gure
s
Fig
ure
S2. T
he
rela
tionsh
ip b
etw
een p
erce
nta
ge
of
repro
duct
ive
stem
s an
d t
hei
r over
all
phy
logen
etic
div
ersi
ty a
mong l
arge
tree
s
(>24.5
cm
DB
H).
T
he
lines
and b
lack
dots
are
iden
tica
l to
Fig
ure
7. T
he
gra
y d
ots
indic
ate
the
aver
age
phylo
div
ersi
ty m
easu
red
among r
epro
duct
ive
stem
s of
the
Dip
tero
carp
acea
e.

Landscape level Bornean plant reproduction, Cannon et al. figures
Figure S3. Fruiting patterns over 68 months in a Bornean rainforest for two plant forms
in each forest type. The column of figures represents woody climbers and the second
column represents all trees. Forest types are in the same order as in Figure 8. a&h)
montane; b&i) upper granite; c&j) lower granite; d&k) lower sandstone; e&l) alluvial
bench; f&m) freshwater swamp; and g&n) peat swamp. Observed values are shown in
thick green line. The average level of fruiting expected across all months is indicated by
the solid red line while 95% confidence limits are shown by the dashed red lines. The
inner thin purple line illustrates a single random fruiting behavior, while the
two outer thin purple lines indicate the maximum and minimum of all randomizations.

Landscape level Bornean plant reproduction, Cannon et al. figures

Table S1. Sample areas and number of individuals observed for reproductive behavior
for each growth form across the different forest types. Sample areas for figs, climbers,
and big trees (>24.5 cm DBH) are identical while sample areas for small trees (14.5-24.5
cm DBH) were generally smaller. Total number of individuals observed for each plant
form within each forest type is listed with stem density per hectare. Totals for forest
types and plant forms are shown. Type labels are: MO=Montane; UG=Upland Granite;
LG=Lowland Granite; LS=Lowland Sandstone; AB=Alluvial Bench; FS=Freshwater
Swamp; and PS=Peat Swamp.
Forest
type
Sample
area
Figs Woody
climbers
Small trees
(15-25 cm)
Big trees
(>25 cm) Total
MO 0.7 / 0.7 0 (0) 21 (30.0) 200 (285.7) 98 (140.0) 319
UG 2.1 / 1.6 18 (8.6) 138 (65.7) 391 (244.4) 452 (215.2) 999
LG 2.9 / 1.8 22 (7.6) 136 (46.9) 350 (194.4) 591 (203.8) 1099
LS 4.2 / 3.0 38 (9.0) 334 (79.5) 471 (157.0) 681 (162.1) 1524
AB 3.0 / 2.0 47 (15.7) 185 (61.7) 342 (171.0) 446 (148. 7) 1020
FS 2.7 / 2.0 31 (11.5) 374 (138.5) 483 (241.5) 412 (152.6) 1300
PS 2.4 / 1.5 16 (6. 7) 269 (112.1) 357 (238.0) 385 (160.4) 1027
Total 18.0/12.6 172 1457 2594 3065 7288

Table S2. Structural differences of tree communities among forest types. Values are in
stem density per hectare. Basal Area (BA) values are m2ha
-1. Forest types are indicated
as follows: PS = peat swamp; FS = freshwater swamp; AB=alluvial bench; LS=lowland
sandstone; LG=lowland granite; UG=upland granite; and MO=montane. Bold values are
greater than expected, italicized values are less than expected. (*-p<0.95, **-p<0.99, ***-
p<0.999).
DBH Mean PS FS AB LS LG UG MO
15 214 180.4*** 202.4 166.8*** 164.4*** 192.** 245.2*** 344.8***
25 74 59.6*** 61.6*** 54.4*** 60.*** 78.8 95.2*** 108.4***
35 30 28 27.4* 28 25.*** 34.** 40.8*** 27.4*
45 20 18.6 17.2** 19.6 20 24.4*** 26.8*** 14.8***
60 6.8 5.*** 7.6 6.6 9.*** 11.*** 5.4** 3.***
75 4.1 2.8** 3.8 4.4 5.8*** 7.6*** 3.8 0.4***
90 3.5 1.8*** 2.8 5.2*** 8.*** 3.4 3.2 0.***
BA 838.2 700.7*** 669.6*** 650.5*** 826.2 1042.4*** 1236.0*** 937.4**

Table S3. Structural differences of liana communities among forest types. Values are in
stem density per hectare. Basal Area (BA) values are m2ha
-1 Forest type types are
indicated as follows: PS = peat swamp, FS = freshwater swamp, AB=alluvial bench,
LS=lowland sandstone, LG=lowland granite, UG=upland granite, MO=montane. Bold
values are greater than expected; italicized values are less than expected. (*-p<0.95, **-
p<0.99, ***-p<0.999).
DBH Mean PS FS AB LS LG UG MO
5 35.5 54.*** 56.2*** 34.8 42.6* 36.2 20.2*** 4.6***
7.5 10.8 14.8*** 16.2*** 12.4 15.*** 9.6 6.8*** 1.***
10 5.5 7.8*** 8.6*** 7.* 8.*** 4.6 2.6*** 0.***
15 1.1 0.8 2.*** 2.4*** 1 1 0.4** 0.2***
BA 4.0 6.4*** 7.9*** 4.2 4.7 3.5 1.0*** 0.1***

Table S4. Taxonomic groups that significantly restricted their reproductive behavior to
the SMF events. Genera are organized by family and species by genus. Taxa with
significantly elevated levels of reproduction during the months immediately preceding or
following the SMF events are indicated by the following symbol #. ‘Diversity’ indicates
the number of species (including evenness) reported in Cannon and Leighton (2004).
‘Obs in SMF’ indicates the number of individuals observed fruiting during SMF events.
‘Ratio’ indicates the ratio of observed to expected observations in SMF events.
Significance levels indicated are *:p<0.05; **:p<0.01; ***:p<0.001. Significance was
determined by nonparametric rank tests of observed against expected values.
Taxa Diversity
Obs in
SMF Ratio
Anacardiaceae
Gluta 4 (0.83) 9*** 3.5
Annonaceae
Polyalthia#
4 (0.53) 35 1.3
Apocynaceae
Willughbeia#
NA 20*** 2.4
Burseraceae
Dacryodes#
9 (0.85) 13*** 4.3
Chrysobalanaceae
Licania 1 (1) 2** 1.8
Clusiaceae
Calophyllum#
19 (0.85) 58 1.4
Connaraceae
Rourea#
Na 12 1.4
Cornaceae
Mastixia 1 (1) 4*** 2.8
Dilleniacae
Dillenia 1 (1) 7*** 3.7
Dipterocarpaceae
Dipterocarpus#
5 (0.26) 100*** 16.3
Dipterocarpus stellatus#
Na 9*** 7.8
Dipterocarpus step#
Na 6*** 5.2
Dipterocarpus sublamellata Na 52*** 9.5
Hopea 4 (0.9) 22*** 11.1
Shorea#
20 (0.92) 186*** 11.5
Shorea coriacea Na 9*** 5.7
Shorea crassa Na 11** 2.3
Shorea hopeifolia Na 11*** 5.3
Table OSM4 (cont.)

Taxa Diversity
Obs in
SMF Ratio
Dipterocarpaceae (cont.)
Shorea johorensis#
Na 8*** 6.7
Shorea leprosula Na 4*** 3.7
Shorea longisperma Na 4*** 2.9
Shorea parvifolia Na 10*** 6.0
Shorea parvistipulata#
Na 16*** 8.4
Shorea pauciflora Na 8*** 8.0
Shorea pinanga Na 11*** 7.2
Shorea quadrinervis#
Na 30*** 7.8
Ebenaceae
Diospyros 23 (0.95) 17*** 2.8
Euphorbiaceae
Neoscortechinia 4 (0.65) 10*** 6.2
Pimelodendron griffithianum Na 9* 2.6
Fabaceae
Koompassia 2 (0.98) 4*** 3.1
Fagaceae
Castanopsis Na 8*** 4.8
Icacinaceae
Stemonurus 2 (0.9) 14*** 2.5
Meliaceae
Lansium 1 (1) 4*** 2.7
Moraceae
Artocarpus 10 (0.85) 9* 1.9
Myristicaceae
Gymnacranthera 5 (0.77) 14* 2.0
Myrtaceae
Syzygium 54 (0.87) 62* 1.9
Olacaceae
Ochanostachys amentacea Na 31*** 5.8
Strombosia ceylanica Na 30* 2.2
Sapindaceae
Nephelium 7 (0.83) 9*** 5.4
Sapotaceae
Planchonella Na 3** 1.8
Simaroubaceae
Ailanthus 1 (1) 4* 2.1
Unknown
Unknown Na 277*** 3.3