acknowledgements - world bankdocuments.worldbank.org/curated/en/147561467993211574/... · web...
TRANSCRIPT
Improving Public Expenditures in Agriculture:
Empirical Evidence of the Effectiveness and Efficiency of Agricultural Public Expenditures in Mongolia
Kofi Amponsah and Charles Annor-Frempong
March 30, 2014
101085

TABLE OF CONTENTS
ACKNOWLEDGEMENTS............................................................................................ iiABBREVATIONS AND ACRONYMS.......................................................................... iii1 INTRODUCTION..................................................................................................8
1.1 Background, objective and rationale.............................................................81.2 Approach, methodology and data limitations................................................81.3 Structure of the report................................................................................10
2 OVERVIEW OF GOVERNMENT POLICIES AND PRIORITIES..........................113 REVIEW OF AGRICULTURAL SECTOR PERFORMANCE.................................13
3.1 Agriculture in the context of the national economy....................................133.2 Trends in gross agricultural output............................................................17
4 LEVEL AND COMPOSITION OF AGRICULTURAL EXPENDITURES................194.1 Trends in Agriculture Sector Expenditures................................................19
5 ECONOMIC COMPOSITION OF AGRICULTURAL EXPENDITURES................265.1 Analysis of current expenditures.................................................................265.2 Analysis of capital expenditures..................................................................295.3 Capital expenditures vs. current expenditures...........................................30
6 FUNCTIONAL COMPOSITION OF EXPENDITURES........................................347 AGRICULTURAL RESEARCH AND EXTENSION SERVICES............................378 BUDGET PROCESSES AND PERFORMANCE...................................................43
8.1 Budget preparation.....................................................................................438.2 Budget Execution........................................................................................458.3 Budget outcomes monitoring......................................................................50
9 EFFECTIVENESS AND EFFICIENCY OF SECTOR EXPENDITURES...............5110 CONCLUSIONS AND POLICY RECOMMENDATIONS..................................53REFERENCES..........................................................................................................56ANNEXES. SOURCE DATA AND PROGRAM IMPACTS..........................................58Annex 1. Main Agricultural Output Data.................................................................58Annex 2. Government Support to Crop Production.................................................60Annex 3. Livestock Disease Control Program..........................................................61Annex 4. Agriculture sector subsidies by subsector................................................64
Annex 5. Sample Aimag Veterinary Services Contract............................................65Annex 6. GDP data, (‘000) 2003-2013, NSO............................................................68Annex 7. Data on General Government Expenditure by Sector, 2003-2013, in MNT billions, MoF............................................................................................................70Annex 8. Data on MIA’s Expenditures by Economic Classification, MoF, 2003- 2013......................................................................................................................... 71Annex 9. Agriculture Sector Development Strategy, Summary of Costed Programs, 2007-2016, MIA.......................................................................................................76Annex 10. MIA Capital/ Investment Budget, in MNT billions,2013.........................77Annex 11. MIA’s Expenditure Classification by Program, in MNT billion, 2008-2013................................................................................................................................. 80Annex 12. MIA’s Approved Capital (Investment) Budget, in MNT billion, 2013.....83
FIGURES
Figure 1. Trends in sectoral contribution to GDP (%), 2002-2012..........................13Figure 2. Composition of agriculture sector GDP (2005-2011)...............................15Figure 3. Gross agricultural output in MNT billion, 2007-2011..............................18Figure 4. Trend in annual rate of growth of MIA budget (2004-2013)....................21Figure 5. Trends in agriculture expenditures as a share of the national budget and GDP (2003-2012).....................................................................................................22Figure 6. Comparison of major components of the current expenditure (2003-2013)................................................................................................................................. 27Figure 7. Trends in budgetary allocations to animal care services (2003-2013), MNT billion..............................................................................................................29Figure 8. Trends in allocation of major components of MIA's capital budget, (in MNT billions), 2003-2013........................................................................................30Figure 9. Trends in capital and current expenditures (in MNT billions), 2003-2013................................................................................................................................. 31Figure 11. Functional composition of expenditures, 2013......................................35Figure 12. MIA's budget execution performance planned vs. actual expenditures, in MNT billion, 2003-2011...........................................................................................46
TABLES
Table 1. Sectoral contribution to GDP, in billions of MNT, 2002-2012...................14Table 2. Composition of agriculture GDP (2005-2011), in billions of MNT.............15Table 3. Sectoral comparison of the national budget (% of total government expenditure), 2004-2013..........................................................................................16Table 4. Sectoral allocations of the national budget (2005-2013), in MNT billion. .17
Table 5. Trends in budget allocations to departments/agencies, in MNT ‘000, and as a percentage of total budget, 2008-2013............................................................20Table 6. International comparison of public expenditures on agriculture..............23Table 7. Budgetary allocations to provincial governments (in MNT billion), 2013. 24Table 8. Trends in MIA recurrent budget allocation (in MNT billion), 2003-2013..26Table 9. Donor off-budget expenditure (commitments) on agriculture, in millions of US$, 2012-2016.......................................................................................................32Table 10. Percentage of MIA’s functional budget allocated to ASDSP priority programs compared with ASDSP projections (%) 2008-2013.................................36Table 11. Science and Technology Fund (STF) allocations by sector, MNT billion 2008-2012................................................................................................................ 37Table 12. Budgetary allocations to agricultural research institutes, 2008-2012 (in MNT billion).............................................................................................................38Table 13. Category of expenditure by institution (in MNT '000), 2008-2013..........39Table 14.Trends in agricultural research and development expenditures, (in MNT '000), 2008-2013......................................................................................................40Table 15.Agriultral research spending: share of total agriculture expenditure and agricultural GDP (2008-2013)..................................................................................41Table 16. Trends in agricultural extension services expenditures and extension services expenditure as percentage of AgGDP (2008-2013)...................................42Table 17. MIA's Budget execution performance, 2003-2011...................................47
BOXES
Box 1.The budget preparation process in Mongolia................................................44

Foreword
We are pleased to share with you this review of public expenditures on the Mongolian agriculture sector. The purpose of the review is to analyze the allocation of government resources within the country’s agriculture sector in order to inform spending priorities and to provide the Ministry of Industry and Agriculture and other agencies with empirical information that will enable them to advocate for more and better targeted public funding for agricultural purposes.
This review was carried out under the guidance of the Ministry of Industry and Agriculture, and entailed an extensive analysis of available data and consultations with a variety of stakeholders. It provides insights into the relative size of the agriculture budget, and the levels, composition, effectiveness and efficiency of government agriculture expenditures.
The findings point to a number of serious issues inhibiting the effective and efficient management of sector expenditures. These include limited capacity for planning and budgeting on the part of the staff of the Ministry, as well as limited capability to monitor and evaluate budgetary performance or outcomes. Agricultural research and extension is underfunded, and donor coordination is weak. Local officials are insufficiently engaged in the planning and budgeting of sector programs. Based in part on these findings, the report presents a number of recommendations for the government to consider in resolving these issues.
The review is enriched by contributions from seasoned experts in the field of agriculture and public expenditure management, including experts from major development partners operating in the sector. It is comprehensive in its scope and content and can serve as a living document to guide resource allocation and expenditure management decisions in the Mongolia’s agriculture sector.
The main message of the report is that as Mongolia continues to work towards achieving its agricultural objectives, there is a need for policies aimed at increasing agricultural production and productivity to be driven by sustained allocation of public sector resources to the sector. The World Bank is committed to working closely with the Government of Mongolia to improve public expenditures in agriculture. With continued attention to improving public spending in agriculture, sustained progress in agricultural growth and poverty reduction can be achieved for the people of Mongolia.
Bert Hofman Juergen VoegeleCountry Director Senior DirectorMongolia, China and Korea AgricultureEast Asia and Pacific Region World BankWorld Bank
ACKNOWLEDGEMENTS
This report was prepared as part of the Mongolian agriculture sector review at the request of the Ministry of Industry and Agriculture (MIA). A consultative process was established throughout the preparation and review with the participation of the Ministry of Finance and relevant key stakeholders.
The public expenditure review was carried out by a World Bank team led by Charles Annor-Frempong (Senior Rural Development Specialist and Task Team Leader) and Kofi Amponsah (Primary Author). The team is thankful to Mark L. Lundell (Sector Manager, EASCS) and Iain G. Shuker (Sector Manager, EASER) for their support and leadership and to Coralie Gevers (Country Manager, Mongolia) for her guidance and encouragement.
The team is also grateful to Dr. Lkhasuren Choi-sh,Director General, Strategy Planning and Policy Department of Ministry of Industry and Agriculture for his direction and encouragement, and for putting together a support team which helped in organizing stakeholder meetings and collecting and collating data at both sector and higher level government institutions. The team included Bertreg Tsogbadrakh, Head of Finance and Investment Division and Janbota Khaval, Budget Officer.
Our special acknowledgments go to Bold Argazand (Sector Officer, Ministry of Finance, and Mongolia) and Badamtsetseg Batjargai (Director, Micro Economic Statistics Department, National Statistics Office, Mongolia) for collaborating and assisting the team in gathering expenditure and micro statistics data, which provided the basis for the analysis.
The team also express their sincere gratitude to the following: Aberash Berid Megashaw, Eliza McLeod, Elena A. Maslyukova (World Bank Library), Washington D.C., and Nilam Prasai International Food Policy Research Institute , Washington D.C., for their help in providing some of the initial data for the analysis.
We are especially grateful to Iain G. Shuker, Sergiy Zorya, Hardwick Tchale, and Stephen D. Mink (World Bank), for providing guidance and

useful comments which greatly helped in improving the quality of the report. Gunnar Larson (World Bank) edited the report and pictures provided by Li Lou and Tina Puntsag. Finally, we are grateful to all those who in diverse ways contributed to the execution of this analytical work.

ABBREVATIONS AND ACRONYMS
ADB Asian Development BankAgPER Agricultural Public Expenditure ReviewAgGDP Agricultural Gross Domestic ProductASDSP Agricultural Sector Development Strategy PaperAHRI Animal Husbandry Research InstituteASTI Agricultural Science and Technology IndicatorsAPSM Agricultural Products Stock MarketBIA Benefit Incidence AnalysisCPF Crop Protection FundCPSF Crop Protection Support FundDG Director GeneralDVAB Department of Veterinary and Animal BreedingDSPP Department of Strategic Policy and PlanningEU European UnionFAO Food and Agriculture OrganizationFID Finance and Investment DivisionFMD Foot and Mouth DiseaseFY Fiscal yearGDP Gross Domestic ProductGoM Government of MongoliaIBL Integrated Budget LawIFAD International Fund for Agriculture and DevelopmentIFPRI International Food Policy Research InstituteIMF International Monetary FundIPPMA Interprovincial Pastureland Management AuthorityJICA Japan International Cooperation AgencyKOICA Korean International Cooperation AgencyLCF Livestock Conservation FundLDF Local Development FundMCC Millennium Challenge CorporationMCNDS MDG-based Comprehensive National Development StrategyMEIAD Monitoring, Evaluation and Internal Audit DepartmentMIA Ministry of Industry and AgricultureMLP Mongolia Livestock ProgramMNT Mongolia TugrikMOES Ministry of Education and ScienceMoF Ministry of FinanceMTFF Medium Term Fiscal FrameworkNAEC National Agricultural Extension CenterNAGB National Animal Gene BankNSO National Statistics Office
O&M Operation and maintenancePAD Provincial Agricultural DepartmentPCN Project Concept NotePETS Public Expenditure Tracking SurveyPFM Public Financial ManagementPPP Public-Private PartnershipRFP Request for ProposalR&D Research and DevelopmentSCLVS State Central Laboratory for Veterinary and SanitarySDC Swiss Development CooperationSMEA Small and Medium Enterprises AgencySPC State Property CommissionSTF Science and Technology FundSLCVDV State Laboratory for Certification and Veterinary Drugs and VaccinesUB UlaanbaatarUN United NationsWB World BankWBG World Bank Group

EXECUTIVE SUMMARY
BACKGROUND
The objective of the agricultural sector public expenditure review (AgPER) was to examine the efficiency and effectiveness of agricultural sector expenditures in Mongolia. It was carried out at the request of the Department of Strategic Policy and Planning (DSPP), Ministry of Industry and Agriculture (MIA). The World Bank Group (WBG) collaborated with the Food and Agriculture Organization (FAO) of the United Nations and the DSPP under the overall direction and oversight of the Director General (DG) of DSPP.
The AgPER provides policy makers with a better understanding of: (a) trends in the level and composition of public expenditures in agriculture over the past five to ten years; (b) the economic and functional composition of agriculture expenditures; (c) the budget processes and performance in the agriculture sector; (d) issues inhibiting the effectiveness and efficiency of public expenditures in agriculture.
To achieve this objective a two dimensional (spending allocations and technical efficiency) analysis of the efficiency of government expenditure on agriculture was conducted. The efficiency of spending allocations was considered through an analysis of the economic and functional composition of sector expenditures. Public spending on agriculture in Mongolia was also compared with that in other countries in the region and elsewhere in the world, particularly countries with similar climatic conditions.
KEY FINDINGS
Relative size of the agriculture expenditures
Agriculture has performed remarkably well over the past decade although a very small proportion of the national budget is allocated to the sector. At the national level, agriculture’s contribution to gross domestic product (GDP) measured in nominal MNT has averaged around 17.4 percent compared with other important sectors in the Mongolian economy such as mining and quarrying (19.6 percent), manufacturing (6.2 percent), wholesale and retail (8.2 percent), and construction (2.2 percent). At the sector level, agricultural GDP (AgGDP) measured in nominal MNT increased
1

by 80 percent from 2002 to 2012, spurred by a sustained increase in crop and livestock outputs. Despite this remarkable performance, the share of the national budget allocated to agriculture (excluding forestry and fisheries) averaged just 2.4 percent over the period 2003-2012. Over the same period, agriculture expenditure as a share of GDP averaged only 1.1 percent.
Spending on agricultural research and development (R&D) is low. Public spending on R&D, (MIA and STF combined) amounted to MNT2.86 billion in 2008, which represented 7 percent of total agriculture spending, excluding fisheries and forestry. This figure decreased to MNT2.17billion in 2009 and increased steadily to a peak of MNT5.04 billion in 2012. It then declined to MNT3.67 billion, representing only 2.5 percent of total agriculture sector spending. As a share of agricultural GDP, expenditure on agricultural R&D represented 0.4 percent in 2008 and 0.5 percent in 2012.
Level of agriculture expenditures
The basis for budgetary allocations to MIA departments are often unclear. Because the Ministry’s expenditure statement does not break down budgets by department, it is difficult to determine on what basis budgetary allocations to various departments within MIA are made. A bulk allocation is made to the entire Ministry. For effective and efficient accounting and reporting of sector expenditures, this allocation should be broken down to capture all departments and divisions within MIA. Also, despite the increased fiscal responsibility following the recently approved Integrated Budget Law (IBL), there are disproportionately small allocations to the decentralized agricultural units in the 21 aimags. The majority of the expenditures go to paying salaries and wages. In 2013, budgetary allocations to the 21 aimags amounted to only MNT4.6 billion (1.6 percent) of the total sector budget.
Annual growth in the agricultural budget in nominal terms has been volatile over the past decade. In 2004 the agriculture budget grew by 11.7 percent. It grew by 0.9 percent in 2005, 36.4 percent in 2006, 112.6 percent in 2007, and 127.1 percent in 2008. It then declined by 24.6 percent in 2009, increased by 71 percent in 2010, and by 120.6 percent in 2011. It declined again by 24.6 percent in 2012, and increased by 56.6 percent in 2013. Recent increases in subsidies and transfers expenditures accounted for part
2

of the volatility in the agricultural budget. Subsidies constitute the bulk of the recurrent budget relative to other items such as goods and services.1
Limited information about donor off-budget expenditures (commitments) in the agriculture sector. Although a number of donors support MIA agricultural operations, information about how these resources are spent is difficult to obtain in the Ministry. Four donors in particular account for about 76 percent of total donor expenditures in the agriculture sector; FAO, IFAD, the Swiss Development Corporation, and the World Bank. Together, the four have commitments amounting to US$57 million out of total donor commitments of US$75 million between 2012 and 2016. This US$75 million in donor off-budget commitments amounts to about 26 percent of the total sector budget.
Mongolia spends a smaller percentage of its GDP on agriculture than comparable middle income countries in Asia and elsewhere. Despite its relatively higher agricultural value added of 17 percent of GDP, Mongolia spends proportionately less on agriculture than China, Philippines, Sri Lanka, Namibia, Cape Verde, and Paraguay. Mongolia spends a lower percentage of its national budget on agriculture than India, China, Philippines, Sri Lanka, and Thailand.
Economic and Functional Composition of Agriculture Expenditures
Economic composition of agriculture expenditures shows the dominance of capital expenditures against current expenditures. Capital expenditures have more than doubled compared with current expenditures over the period 2003-2013. The increase in capital expenditures is driven largely by the GoM’s investment in new construction (wells, water systems, veterinary and sanitary laboratories, disinfection facilities, etc.), acquisition of equipment, feasibility studies, design, and capital repairs (operation and maintenance). MIA earmarked MNT 157.8 billion for capital investments between 2012 and 2017. About 49.9 percent of its budget was allocated for capital expenditures in 2013. Yet the 1.9 percent of the capital budget that was allocated to operation and maintenance in 2013 is insufficient to sustain these investments.
1 See Gunjal, K and Charles Annor-Frempong. “Mongolia Agriculture Sector Review: Review, Estimation and Analysis of Agricultural Subsidies in Mongolia, December 2013” for a detailed study of agriculture sector subsidies.
3
Allocations to current expenditures are skewed towards subsidies and transfers. Disaggregation of current expenditures shows an imbalance between allocations to subsidies and transfers compared to current expenditures such as salaries and wages, and goods and services. Expenditures on subsidies and transfers grew from a modest 0.5 percent of total current expenditures in 2003 to 57.6 percent in 2013. This growth was driven by the government policy of supporting crop and livestock production, including agro-based enterprises and wheat farmers.
Expenditures by functional categories show underfunding of core public goods in the sector. MIA allocated 16 percent of its 2013 budget to livestock disease control and 11 percent to planning and policy. Core public goods such as research and development (R&D) and advisory services are comparatively underfunded, together receiving 4 percent of the national budget. In Kazakhstan by comparison, 5 percent of the national budget went to research and extension services in the same year. Sector budgets are not aligned with development priorities, and there is a significant divergence between the activities funded by the MIA and those described in the Agriculture Sector Development Strategy Paper (ASDSP). The ASDSP has not been fully referred to in the preparation of the annual budget.
Agricultural research institutes and extension services are underfunded. The research institutes receive most of their funding from the Ministry of Education and Science-managed Science and Technology Fund (STF) rather than from the MIA. More than 59.2 percent of this funding is used to pay salaries and wages, and proportionately very little is used as direct support to research. The disbursement of funds to the research institutes is moreover sporadic owing in large part to the intermittent meetings of the Inter-Ministerial Committee that is the approving body of the STF. This situation has hampered the research institutes’ ability to undertake effective research for agricultural development.
4
Budget processes and performance
The basis for allocating budget to capital investment programs is hard to determine. It is difficult to ascertain the basis on which the allocations to capital investment programs are made in the investment budget, although most of the activities are sector priorities. Budgetary allocations are made on a historical basis rather than on realistic costing of all investment activities in the sector. Moreover, it is unclear whether the previous year’s investment activities are reviewed before the budget is prepared. MIA needs to adopt a Medium Term Expenditure Framework (MTEF) approach to help improve its planning and budgeting.
Need to develop financial management capacity in MIA. The staff of the Ministry’s Finance and Investment Division (FID) lack financial management and analytical skills and this has translated into substandard documentation, recording, and accounting for sector expenditures. Available expenditure data at FID show gaps with respect to planned and actual expenditures. Some years have virtually no figures. This situation makes tracking sector expenditures extremely difficult. For example, expenditure data on the important vaccination and animal care program are difficult to obtain despite increased level of allocations to the program.
Underspending of the annual budget despite overall high budget execution rates. MIA’s budget execution performance is quite good with an average of over 90 percent of the budget executed during the 2003-2011 period. However, a detailed analysis of budget outturns revealed widespread underspending in individual expenditure categories, which suggests the existence of financial management and analytical capacity constraints. FID does not carry out analysis of budget execution. The division lacks staff with the analytical skills to properly examine budget execution performance, including disaggregating the various components (obligations, commitments, and payments) of budget execution. There is a need to strengthen the financial management and analytical capacity of FID staff to enable them to effectively carry out activities related to documentation, reporting, and accounting for agricultural spending.
Budget outcomes monitoring
Limited capacity for monitoring and evaluation in MIA. Sector programs and projects are not effectively monitored and evaluated due to lack of
5

human resource capacity in the Monitoring and Evaluation and Internal Audit Department (MEIAD). The department has enormous responsibilities covering the whole country, but it does not have the required number of staff with the requisite skills. There are currently only 10 staff members, including the Director General. The situation does not allow for proper evaluation of projects based on internationally accepted evaluation criteria: relevance, effectiveness, efficiency, and sustainability. The department can only perform spot checks with little or no detailed performance assessment.
Lack of linkages between MEIAD and FID has had a significant impact on expenditure documentation, reporting, and analysis. The limited exchange of information between the FID and the MEIAD has resulted in poor documentation and accounting of sector expenditures. Improved interaction between the two departments is required to ensure effective information flow for budget execution performance analysis and impact evaluation. This will improve transparency, accountability, and budget outcomes.
Effectiveness and efficiency of public expenditures
Inadequate mechanisms for monitoring the vaccination program. A review of the vaccination program implementation showed that the program has helped increase livestock production through a significant reduction in livestock mortality in recent years. However, there is little evidence of a sound monitoring and supervision mechanism in place to track progress, and vaccination expenditures have not been properly accounted for. This makes it difficult to assess impacts of public expenditures on the disease control program.
Lack of coordination of various programs in MIA. Poor coordination, lack of local ownership of central government programs, and weak communication and coordination between the central ministry and its offices in the aimags and soums have contributed to poor implementation of programs at the local level. Budget formulation and payment are made by the central government, which has little or no information about the needs at the local level. This situation is due to top-down and vertical reporting structure of the intergovernmental fiscal systems. It is expected that the new Integrated Budget Law (IBL) will address most of these issues as the local governments are now given more fiscal responsibilities.
6
Technical efficiency of public expenditures is constrained. The slow procurement process has led to delays in the execution of infrastructural projects. In addition, technical staff at aimag and soum levels are unable to undertake effective supervision of projects owing to a lack of resources. Despite these challenges, significant progress has been made in the provision of infrastructure such as irrigation and wells, which have helped increase crop production. To sustain development outcomes resulting from increased investment in infrastructure, the MIA will need to improve management, supervision, and coordination, and establish simplified procurement procedures to reduce delays. It will also need to increase number of staff who is capable of performing quality appraisals.
CONCLUSIONS AND POLICY RECOMMENDATIONS
The outcome of the review reveals several constraints to effectiveness and efficiency of public expenditures in the Mongolia’s agriculture sector, despite improved performance in recent years. These issues include: (a) limited levels of funding for agriculture despite its significant contribution to the economy; (b) limited O&M expenditures which are not commensurate with the overall increase in investment and capital expenditures; (c) imbalance between allocations to subsidies and transfers relative to goods and services; (d) lack of funding for research and development and extensions services; (e) limited financial management and analytical capacity of staff of FID (f) inadequate staff with skills in program evaluation in the MEIAD, which inhibits the department’s ability to carry out effective monitoring and evaluation of sector programs; and (g) limited involvement of the local authorities in the planning and budgeting of sector programs. The following summarizes recommendations for policy consideration.
Increase the share of the national budget used to support agriculture. Increasing agriculture’s share of the national budget relative to other key economic sectors will enable it to contribute more to national output and to better fulfill its catalytic role as a driver of economic development.
Increase the operation and maintenance budget. Increasing budgetary allocations to operation and maintenance (O&M) budget relative to the overall capital budget will ensure the sustainability of capital investments in the sector. The current underfunding of the O&M budget threatens to undermine the sustainability of these investments.
7
Strike a balance between budgetary allocations to subsidies and transfers and goods and services, and develop a clear framework for subsidies, including an exit strategy and ongoing review of how efficient those subsidies are in correcting market failures and in achieving other goals.
Increase support to institutions responsible for agricultural research and extension. Increasing investment in these public goods will not only encourage the generation of new technologies and the adoption of new and existing technologies by producers, but can also help to create an enabling environment that encourages private sector investment in agriculture. This will require the GOM to address the bottlenecks that limit the flow of funds to the research institutes, by among other things, reforming the Science and Technology Fund (STF) committee, which is responsible for approving research funds in the country.
Strengthen financial management capabilities and analytical skills of the staff of FID and budget managers in order to address current weaknesses in recording, analyzing, and accounting for sector expenditures in the MIA.
Adequately resource the Department of Monitoring and Evaluation and Internal Audit with staff that possess skills and expertise in program monitoring and evaluation to improve monitoring of budget outcomes and performance. The staff will need the capacity to apply the widely-accepted standard monitoring and evaluation criteria of relevance, effectiveness, efficiency, and sustainability. This will entail sponsoring regular training and capacity building interventions to upgrade the skills of MEIAD staff in budget monitoring and evaluation.
Carry out a value-for-money analysis to extensively document program impacts and outcomes through Public Expenditure Tracking Surveys (PETS) or Benefit Incidence Analyses (BIA) to document detailed information on the movement of funds and program impacts on beneficiaries at all levels of the agricultural services delivery system.
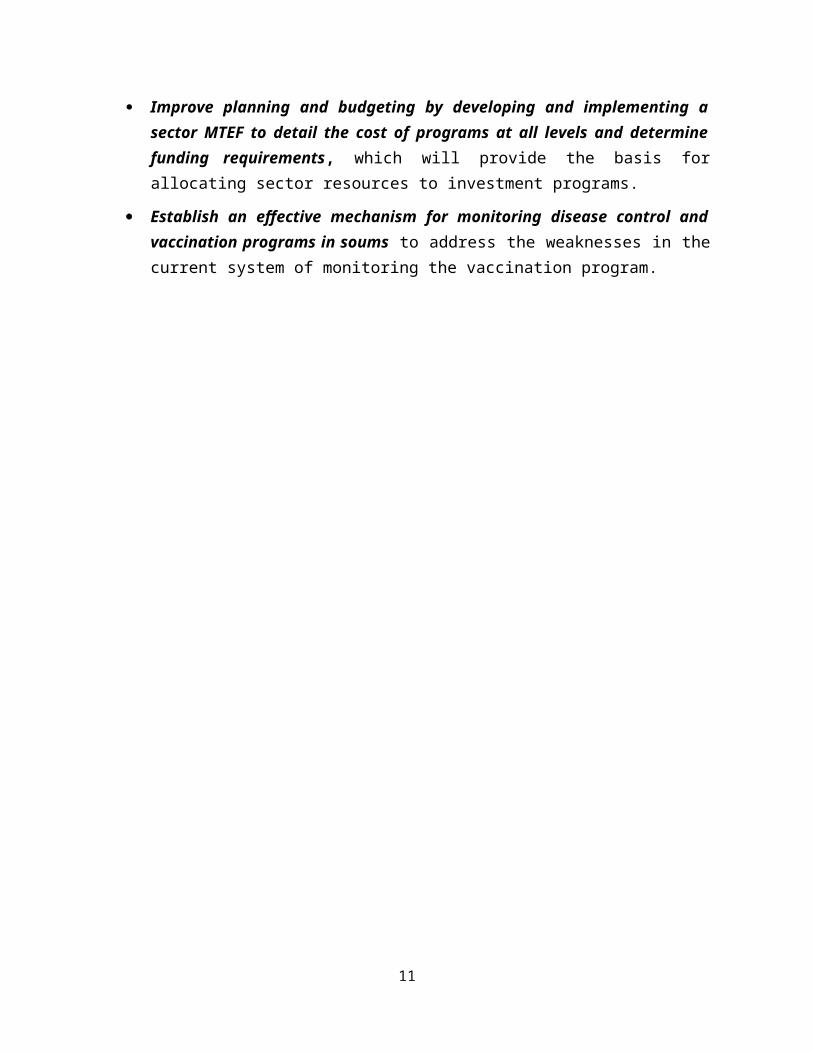
Improve planning and budgeting by developing and implementing a sector MTEF to detail the cost of programs at all levels and determine funding requirements, which will
8
provide the basis for allocating sector resources to investment programs.
Establish an effective mechanism for monitoring disease control and vaccination programs in soums to address the weaknesses in the current system of monitoring the vaccination program.
9

1 INTRODUCTION
1.1 Background, objective and rationale
1. This agricultural sector public expenditure review (AgPER) was carried out as part of the overall agricultural sector review under the auspices of the Department of Strategic Policy and Planning (DSPP) of the Ministry of Industry and Agriculture (MIA) and the World Bank (WB) in Mongolia. During the latter part of 2011, the Government of Mongolia (GoM) requested the World Bank to assist it in carrying out a study of the various agricultural subsidy programs to enable it to understand the impacts of the programs on agricultural development in the country. An initial literature review revealed other issues and knowledge gaps throughout the entire sector. For this purpose, the MIA and WB agreed to look beyond the subsidy issue and expand the scope of the review to other related areas which may also constrain the development of the agriculture sector in the country.
2. The AgPER was, therefore, conceived as one of the studies of the overall agriculture sector review. The WB collaborated with the Food and Agriculture Organization (FAO) of the United Nations in carrying out this AgPER study. The study was, therefore, a collaborative effort of DSPP of MIA, the WB, and FAO. It was undertaken under the overall direction and oversight of the Director General (DG) of the DSPP.
3. The AgPER2 study aims to provide policy makers with a better understanding of: (i) trends in the level and composition of public expenditures in agriculture over the past five to ten years; (ii) the economic and functional composition of agriculture expenditures; (iii) an overview of budget processes and performance in the agriculture sector; and (v) issues inhibiting the effectiveness and efficiency of public expenditures in 2 The AgPER was conducted in an exceptionally inflationary environment. Inflation pressures continue to build and have averaged around 12.5 percent reflecting expansionary fiscal policy. Consumer price increases remained in double digits during the early part of 2014. The national consumer price index in January 2014 increased by 1.7 percent compared to December 2013, and by 12.3 percent compared to the same period in the previous year the increases in CPI were mainly due to the price increase of food and non-alcoholic beverages by 3.4 percent, transport by 2.5 percent. (Source: National Statistics Office (NSO). Expenditures used throughout the report are in nominal values.
10

Mongolian agriculture in order to make recommendations for addressing them.
1.2 Approach, methodology and data limitations
4. A two-pronged approach, involving stakeholder consultations and desk review, was used in conducting the review. The study team engaged in consultations with public institutions within and outside MIA, macro level public institutions and Development Partners (DPs) active in the sector. Within MIA, the team interviewed departmental heads as well as two subnational (aimag) agricultural institutions. At the macro level, key frontline officials of the Ministry of Finance (MoF), National Statistics Office (NSO), Ministry of Economy and Development (MED), and National Procurement Agency (NPA) were extensively consulted. The team also engaged in discussions with stakeholders in the Ministry of Education and Science (MOES), particularly its Science and Technology Fund (STF)3 department. The aim was to capture agricultural research expenditures managed outside MIA. In Mongolia, all the agricultural research institutes are under the MOES, and therefore, receive a substantial proportion of their funds from the MOES budget managed through the Science and Technology Fund. They, however, work under MIA at the operational level.
5. The methodology used in the analysis hinges on identifying evidence of the relative size of the agriculture budget, levels of agricultural expenditures, the composition of agriculture expenditures, and the execution of sector expenditures in order to determine their effectiveness and efficiency. To this end, various key expenditure indicators were computed from different data sources, mainly from the MoF and MIA. The expenditure indicators that were estimated include agriculture expenditure as a share of Gross Domestic Product (GDP), agriculture expenditure as a share of agricultural GDP, spending on agriculture research and development (R&D) as a share of GDP and of agricultural GDP, share of current and capital expenditures in total sector budget, share of wages and nonwage recurrent expenditures to total sector budget, share of allocated funds to approved budget etc.
6. Against the backdrop of the above indicators, the analysis considered the efficiency of expenditures by taking into account spending allocations
3 The STF is a ring-fenced fund financing mainly from the national budget for the purposes of scientific research in several sectors, including agriculture.
11
across sectors through an examination of expenditures on agriculture relative to the major key sectors of the economy. Efficiency of government expenditure on agriculture was undertaken from two perspectives: (i) spending allocations and (ii) technical efficiency. The efficiency of spending allocations was considered through an analysis of the economic and functional composition of sector expenditures.
7. With regard to the economic classification of expenditures, a disaggregation of expenditure data was carried out to ascertain the important components of current and capital expenditures and their respective shares of the sector budget. A functional decomposition of expenditures was also undertaken to ascertain the extent of budgetary allocations to functions such as public goods and other matters. Functional allocations were also aligned with sector objectives and priorities. The approach to the analysis of technical efficiency was mainly based on discussions with the staff of the monitoring and evaluation department of MIA, a review of existing literature, and observations of the mechanism for the implementation of the disease control (livestock vaccination) program in two aimags (provinces) of the country. This entailed a discussion with the aimag agricultural officials, and the review of available documents on program impacts. Off-budget public expenditure on R&D and expenditures for major donors in the sector was also reviewed. MIA’s budget preparation process was reviewed in line with the GoM’s budget preparation guidelines and timelines. Finally, international comparison of public expenditures was undertaken to allow for a comparison of Mongolia’s public spending on agriculture with countries in the region and elsewhere in the world, particularly countries with similar climatic conditions as Mongolia such as Kazakhstan and the Kyrgyz Republic in order to draw practical lessons for Mongolia.
8. The review was limited by a paucity of expenditure data and related information, particularly at MIA level. At the Ministry level, available expenditure data was not only limited by period (2008-2013), but also by several gaps in the figures provided. In view of this situation, the review relied largely on expenditure figures obtained from the MoF and data from NSO official records, which cover a period of ten years, and blended them with those of MIA. It must be noted that the period of the analysis varies depending on whether data was obtained from MoF or MIA. Where data was obtained from MoF, a ten-year period was considered, and a three-year
12
period or a five-year period was used for data obtained from MIA. Data limitations, coupled with the short duration of the field work, also inhibited the team’s ability to undertake a thorough downstream analysis of budget execution performance and outcomes as well as of the technical efficiency of expenditures.
1.3 Structure of the report
9. The report is structured as follows. The Introduction followed by Section 2 provides an overview of government policies and priorities. Section 3 reviews agriculture sector performance by analyzing output by subsector, and the sector’s contribution to the national economy in terms of Gross Domestic Product (GDP), including a comparison of agriculture’s share of the national budget with those of other sectors of the Mongolian economy. Section 4 analyzes the level and composition of agriculture sector expenditures by looking at trends in budgetary allocations to the agricultural sector in terms of the national budget and GDP. The section also compares Mongolia’s spending on agriculture with countries of similar per capita income both in Asia and other regions of the world. Section 5 analyzes the economic composition of Mongolia’s agriculture sector expenditures by disaggregating spending into current and capital expenditures and also by comparing these two categories of expenditures to their share of the sector budget. Section 6 introduces the reader to an analysis of the functional composition of sector expenditures from two dimensions (a) the level of budgetary allocations by functional areas such R&D, extension services, and physical infrastructure; subsidies and (b) the alignment of budgetary allocations with sector development priorities. Section 7 provides an overview of the levels of spending on R&D and extension services. Section 8 describes MIA’s budget process and performance, which include budget preparation, budget execution, and budget outcomes monitoring. Section 9 provides an overview of the effectiveness and efficiency of public expenditures in agriculture. Section 10 outlines conclusions and policy recommendations drawn from the findings of the review. The annexes provide data sources for both program impacts and core expenditures use for the analysis.
13
2 OVERVIEW OF GOVERNMENT POLICIES AND PRIORITIES
10. The GoM has positioned agriculture as one of the key pillars of its poverty reduction strategy, as spelt out in the National Development Strategy (Millennium Development Goals (MDGs)-based Comprehensive National Development, Strategy (MCNDS) of Mongolia.4
11. The MCNDS aims to develop agriculture and the food industry into a modern agricultural and industrial complex by making the two sectors more competitive and productive, increasing overall production and ensuring a sufficient supply of food to meet the needs of the population. It also aims to improve their ability to manage and mitigate risks. Phase1 (2007-2015) of the Strategy outlines the following objectives for agriculture:
Strategic objective 1: Develop both nomadic and intensive animal husbandries taking into account regional peculiarities, outbreak and spread of contagious animal diseases; increase production, processing and export of animal products.
Strategic objective 2. Increase crop-farming production by improving land use, developing irrigation and introducing biotechnology.
Strategic objective 3. Introduce advanced technology in food processing and products’ competitiveness.
Strategic objective 4. Improve water supply for crop-farming and pastures; increase water reserves to meet the needs of the rural population:
Strategic objective 5. Revive and develop fodder production by improving fodder quality, nourishment, and increasing its supply and sufficiency:
Strategic objective 6. Introduce advanced technology to protect soil erosion, preserve soil fertility, and reduce the loss of humidity in crop-farming.
4 State Great Khural (Parliament) of Mongolia Resolution, RE: Endorsement of the Millennium Development Goals (MDGs)-based Comprehensive National Development Strategy of Mongolia, February 2008, Ulaanbaatar (Phase One; 2007-2015).
14

12. Phase 2 (2016-2021) builds upon the objectives of phase 1 with two main strategic objectives:
Strategic objective 1. Introduce biotechnology, improve livestock breeds, and increase the volume of crop yield; and
Strategic objective 2. Set proper sanitary and hygienic standards for food production and services at all levels of food consumption; and increase the population’s access to safe and sufficient amount of foodstuffs.
13. Based on these MCNDS objectives, the Agricultural Sector Development Strategy Paper (ASDSP) 2006-2016 was developed. The objective of the ASDSP is to (i) achieve competitiveness in changing markets, (ii) reduce vulnerability to risk, and (iii) ensure the sustainability of sector resources. It also outlines key strategic programs and activities to promote growth, increase productivity, and reduce vulnerability. The ASDSP classifies the programs and activities into three main initiatives: (i) livestock subsector initiatives; (ii) crop subsector initiatives; and (iii) sector-wide initiatives. 14. In addition to the MCNDS and ASDSP, the National Program for Food Safety (NPFS) was developed in 2011. The overall objective of this Program is to enable healthy livelihoods by ensuring a sustainable supply of nutritious, hygienically assured, and accessible food to the population by creating locally and internationally competitive food, and building new economic capacity through the creation of a national organic brand of food. The Program consists of four components: (i) create an enabling legal, economic, and organizational environment for ensuring food safety; (ii) ensure a stable supply of nutritious, hygienically assured, and accessible food to the population, and increase the proportion of processed food; (iii) improve the monitoring and information network to ensure the quality of food products and drinking water; and (iv) improve quality of nutritious food by supporting adequate healthy diets to reduce nutrition deficiency, and prevent non-communicable chronic diseases.
15. Finally, a Mongolia Livestock Program (MLP) was prepared recognizing the importance of the subsector to the livelihoods of the herder population and to the overall economy. The objectives of the NLP are to: (i) develop a livestock sector that is adaptable to changing climatic and social
15
conditions and create an environment where the subsector is economically viable and competitive in the market economy; (ii) provide a safe and healthy food supply to the population; (iii) deliver quality raw materials to processing industries; and (iv) increase exports.
16. The above policies and priorities provide the basis for government spending in the agriculture sector, which is the focus of this review.
16

3 REVIEW OF AGRICULTURAL SECTOR PERFORMANCE
3.1 Agriculture in the context of the national economy
17. The agriculture sector’s contribution to the economy compares favorably with other sectors of the Mongolian economy. Agriculture, including forestry and fisheries, has contributed an average 17.1 percent of GDP, compared to sectors such as mining and quarrying (19.6 percent), wholesale and retail (8.2 percent), manufacturing (6.2 percent), and construction (2.2 percent) over the past decade. In 2002, agriculture’s contribution to GDP (18.9 percent) was higher than wholesale and retail by 8.4 percentage points; mining and quarrying by 9.6 percent; manufacturing by 12.5 percent; and construction by 16.1 percent. Although fluctuating slightly between 2002 and 2005, the sector’s contribution increased steadily from 17.6 percent in 2006 and peaked at 19.2 percent in 2008 but fell consistently to 12.3 percent in 2011, driven by the effects of the dzud weather on livestock production (see annex 3 for details). Figure 1 reflects the contributions of the respective economic sectors to GDP over the decade from 2002 to 2012.Figure 1. Trends in sectoral contribution to GDP (%), 2002-2012
17
Agriculture has contributed an average 17.1 percent of Mongolia's GDP.
Source: Compiled by the authors from National Statistics Office (NSO) official figures, 2013.
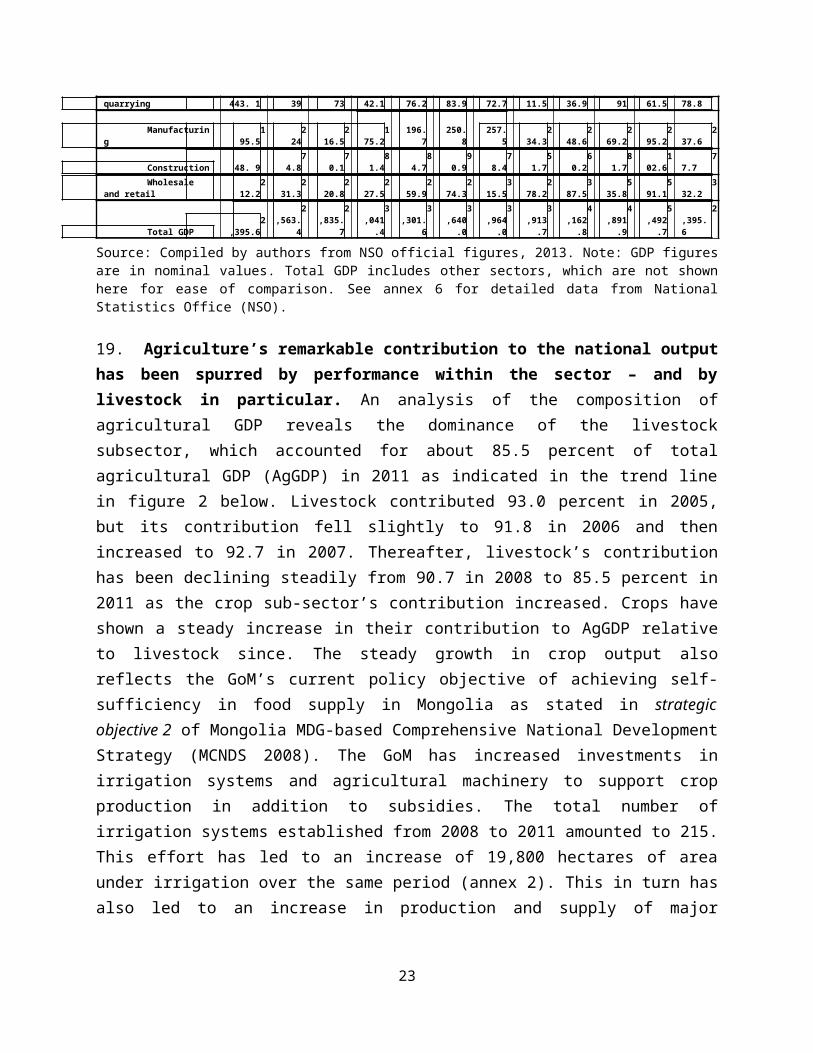
18. In absolute terms, agriculture, including forestry and fisheries, contributes an average MNT 674.8 billion to GDP compared with mining and quarrying (MNT678.8 billion) and manufacturing (MNT237.6 billion). Between 2007 and 2009, agriculture overtook these two sectors, but its contribution dropped significantly in 2010 as a result of the effects of the dzud, which severely hit the sector. In recent years, agriculture has picked up markedly contributing MNT 801.3 billion to GDP in 2012, compared with mining and quarrying (MNT861.5 billion) and manufacturing (MNT295.2 billion) in the same year. Table 1 shows trends in absolute value contributions, in nominal terms, to GDP by the five major economic sectors over the 2002-2012 period.
Table 1. Sectoral contribution to GDP, in billions of MNT, 2002-2012
Sector 2002 2003 2004 2005 2006 2007 2008 2009 2010 2011 2012Average
Agriculture, forestry and fishing
444. 3
465.6
541.1
602.
16
41.57
34.17
68.47
96.36
64.26
60.78
01.36
74.8
Mining and quarrying
443. 1
439
573
642.1
676.2
683.9
672.7
711.5
736.9
791
861.5
678.8
Manufacturing
195.5
224
216.5
175.2
196.
7
250.
8
257.
52
34.32
48.62
69.22
95.22
37.6
Construction
48. 97
4.87
0.18
1.48
4.79
0.97
8.45
1.76
0.28
1.71
02.67
7.7
18
Wholesale and retail
212.2
231.3
220.8
227.5
259.9
274.3
315.5
278.2
387.5
535.8
591.1
332.2
Total GDP2
,395.6
2,563.
4
2,835.
7
3,041.
4
3,301.
6
3,640.
0
3,964.
0
3,913.
7
4,162.
8
4,891.
9
5,492.
72
,395.6
Source: Compiled by authors from NSO official figures, 2013. Note: GDP figures are in nominal values. Total GDP includes other sectors, which are not shown here for ease of comparison. See annex 6 for detailed data from National Statistics Office (NSO).
19. Agriculture’s remarkable contribution to the national output has been spurred by performance within the sector – and by livestock in particular. An analysis of the composition of agricultural GDP reveals the dominance of the livestock subsector, which accounted for about 85.5 percent of total agricultural GDP (AgGDP) in 2011 as indicated in the trend line in figure 2 below. Livestock contributed 93.0 percent in 2005, but its contribution fell slightly to 91.8 in 2006 and then increased to 92.7 in 2007. Thereafter, livestock’s contribution has been declining steadily from 90.7 in 2008 to 85.5 percent in 2011 as the crop sub-sector’s contribution increased. Crops have shown a steady increase in their contribution to AgGDP relative to livestock since. The steady growth in crop output also reflects the GoM’s current policy objective of achieving self-sufficiency in food supply in Mongolia as stated in strategic objective 2 of Mongolia MDG-based Comprehensive National Development Strategy (MCNDS 2008). The GoM has increased investments in irrigation systems and agricultural machinery to support crop production in addition to subsidies. The total number of irrigation systems established from 2008 to 2011 amounted to 215. This effort has led to an increase of 19,800 hectares of area under irrigation over the same period (annex 2). This in turn has also led to an increase in production and supply of major agricultural crops (annex 1). Figure 2 shows recent trends in the composition of AgGDP.Figure 2. Composition of agriculture sector GDP (2005-2011)
19
2005 2006 2007 2008 2008 2010 2011.0
100.0
200.0
300.0
400.0
500.0
600.0
700.0
800.0
0
10
20
30
40
50
60
70
80
90
10093.0 91.8 92.7 91.7 90.7 88.3 85.5
Crops GDP Livestock GDP Fisheries & Forestry GDP % of Agricultural GDP
Agric
ultu
ral G
DP (i
n M
NT
trill
ion)
% o
f Agr
icul
tura
l GDP
Source: Compiled by authors from National Statistics Office (NSO) data. Note: Figures are in nominal values.
20. In absolute terms, the livestock subsector has historically contributed substantially to AgGDP compared with crops and fisheries subsectors. Livestock alone contributed MNT 557.8 billion in nominal values in 2005; thereafter, its contribution increased steadily to MNT 1,083.0 billion in 2008, but fell to MNT 999.7 billion and MNT955.7 billion in 2009 and 2010 respectively. The fall in the livestock’s contribution to AgGDP was attributable mainly to dzud weather, which killed an estimated 10.3 million animals in 2009 and 2010. Table 2 compares the composition of agriculture sector GDP over the period 2005-2011.
Table 2. Composition of agriculture GDP (2005-2011), in billions of MNT
Year
Total Agriculture, Forestry and Fisheries GDP (MNT billion)
Crops GDP (MNT billion)
Livestock GDP (MNT billion)
Forestry GDP (MNT billion)
Fisheries GDP (MNT billion)
Total Forestry & Fisheries
Agriculture GDP (excluding forestry & fisheries)
2005 602.1 42.1 557.8 2.1 0.12 2.2 599.9
2006 710.6 87.5 618.0 5.1 0.11 5.2 705.4
2007 913.4 92.0 0.816.1 5.3 0.73 5.3 908.1
2008 1,259.7 169.1 1,0830 7.6 0.18 7.6 1,252.1
2009 1,177.4 204.1 966.7 6.5 0.267 6.6 1,170.8
2010 1,202.2 237.1 955.6 9.4 0.23 9. 4 1.192.7
2011 1,365.1 263.3 1,090.5 11.3 0.15.90 11. 3 1.3,530.9
20

Source: NSO figures were only for the period 2005-2011. GDP figures are in nominal values.
21. The share of agriculture’s budget allocation is relatively low. Agriculture’s share of the national budget has been fairly stable over the period 2004-2013, and has averaged only 2.4 percent, 1.7 percentage points less than mining, manufacturing and construction (4.1 percent). It is higher or equal to energy and heating (2.4 percent), greater than transport and communication and housing and community amenities by 1.1 and 1.4 percentage points respectively. Table 3 shows percentage allocations of the national budget by sector.
Table 3. Sectoral comparison of the national budget (% of total government expenditure), 2004-2013
SECTORS200
4200
5200
6 2007 2008 2009 2010 2011201
2201
3Average
GENERAL PUBLIC SERVICES 7.8 7.7 9.4 8.0 6.4 8.9 11.2 7.917.
816.
3 10.1
DEFENSE 4.1 4.2 3.5 3.5 3.2 3.2 3.2 2.9 3.3 2.8 3.4
PUBLIC ORDER AND SAFETY 5.4 5.7 4.8 5.4 8.9 5.1 4.6 4.3 4.4 4.7 5.3
EDUCATION17.
617.
715.
1 13.6 12.5 15.8 14.8 12.214.
620.
0 15.4
HEALTH10.
010.
0 8.2 8.1 8.7 10.2 10.0 8.5 8.9 8.3 9.1 SOCIAL SECURITY AND SOCIAL WELFARE
18.3
21.0
19.7 20.1 24.6 27.3 30.7 31.6
31.2
19.5 24.4
HOUSING AND COMMUNITY AMENITIES 0.9 0.6 0.4 0.4 0.3 0.3 2.6 2.3 0.8 1.3 1.0 RECREATIONAL AND SPORTING, CULTURAL SERVICES 2.6 2.3 1.4 1.8 1.5 1.6 1.5 1.5 1.2 1.5 1.7
ENERGY, HEATING 3.1 2.4 3.0 1.7 2.0 1.5 2.7 3.4 2.6 1.9 2.4
AGRICULTURE, FORESTRY 1.6 1.6 1.4 1.8 2.8 2.5 3.4 4.5 2.1 2.0 2.4 MINING, MANUFACTURING AND CONSTRUCTION 3.3 3.7 3.5 2.7 3.0 3.8 6.4 11.9 1.2 1.2 4.1
TRANSPORT & COMMUNICATION 0.3 0.3 2.6 2.1 0.5 1.2 1.4 1.3 1.2 2.3 1.3
OTHER ECONOMIC ACTIVITY 1.4 1.3 9.4 19.8 17.2 10.6 3.2 3.6 2.6 3.6 7.3 OTHER UNCLASSIFIED EXPENDITURES
23.6
21.4
17.7 11.0 8.3 8.0 4.4 4.0 8.1
14.6 12.1
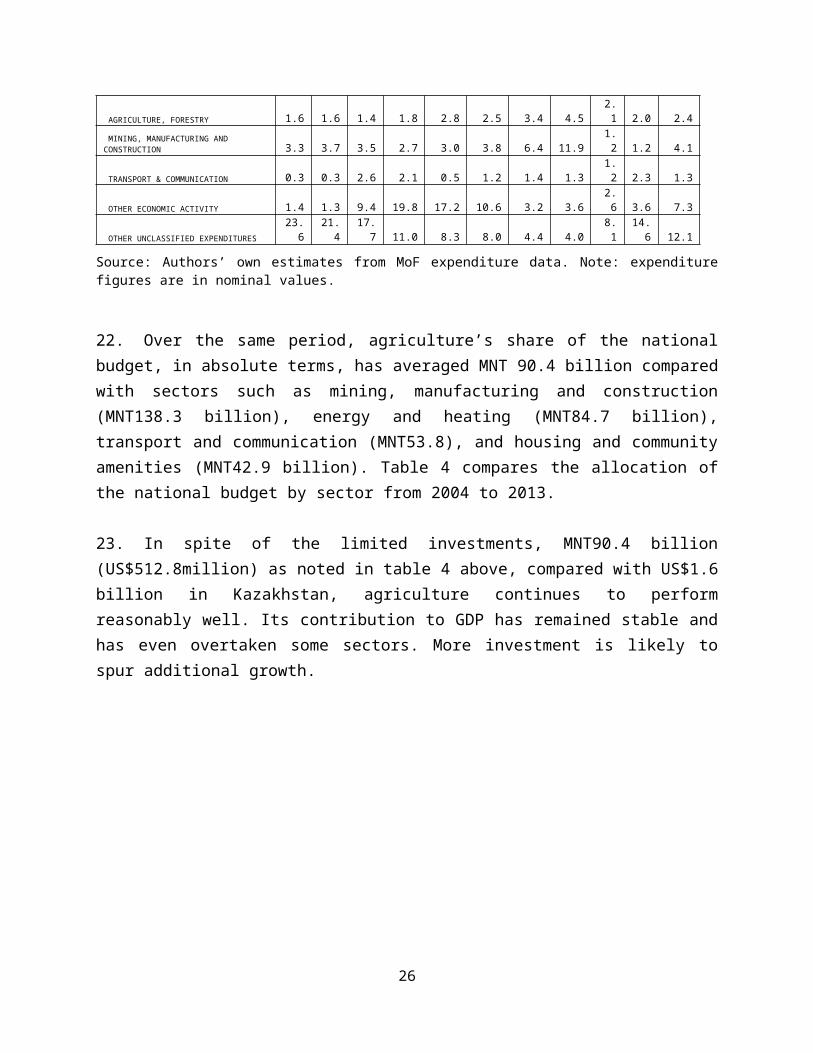
Source: Authors’ own estimates from MoF expenditure data. Note: expenditure figures are in nominal values.
22. Over the same period, agriculture’s share of the national budget, in absolute terms, has averaged MNT 90.4 billion compared with sectors such as mining, manufacturing and construction (MNT138.3 billion), energy and heating (MNT84.7 billion), transport and communication (MNT53.8), and housing and community amenities (MNT42.9 billion). Table 4 compares the allocation of the national budget by sector from 2004 to 2013.
21

23. In spite of the limited investments, MNT90.4 billion (US$512.8million) as noted in table 4 above, compared with US$1.6 billion in Kazakhstan, agriculture continues to perform reasonably well. Its contribution to GDP has remained stable and has even overtaken some sectors. More investment is likely to spur additional growth.
22
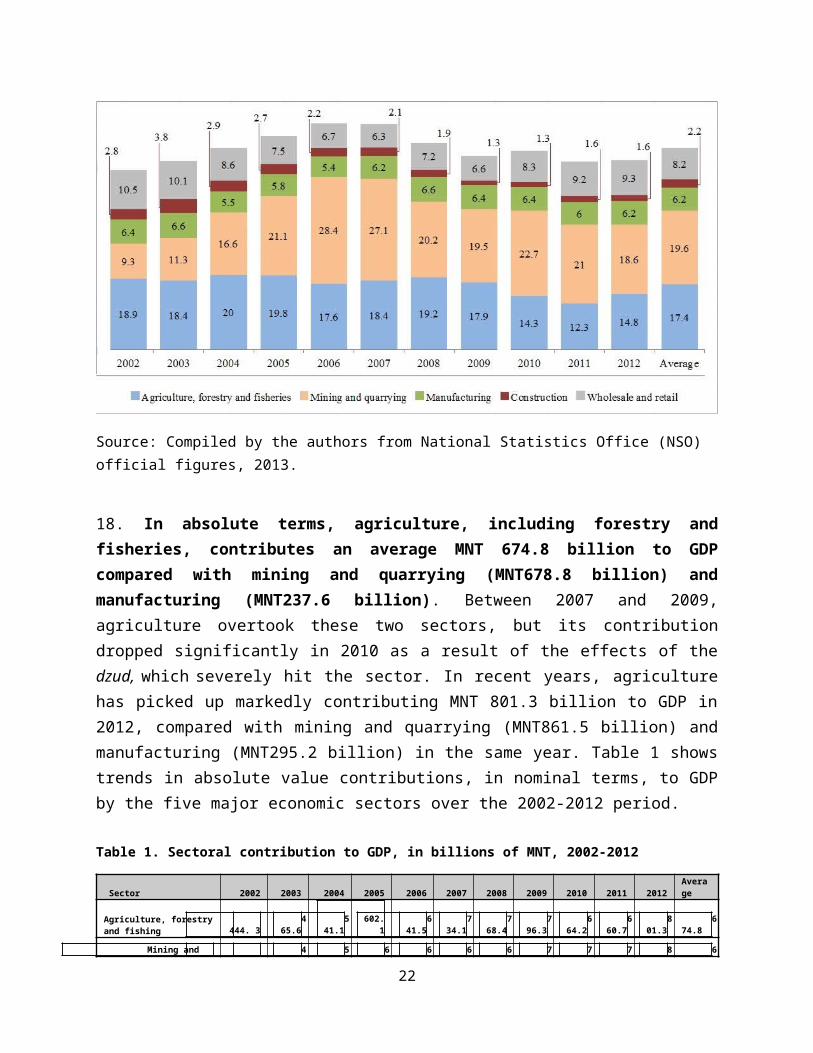
Table 4. Sectoral allocations of the national budget (2005-2013), in MNT billion
SECTORS 2004 2005 2006 2007 2008 2009 2010 2011 2012 2013Average
GENERAL PUBLIC SERVICES 62.1 66.0 120.2 153.2 179.3 231.0 383.2 418.3 1,243.4 1,498.5 435.5
DEFENSE 32.8 35.6 44.7 66.6 91.0 84.5 109.6 155.0 233.6 258.7 111.2
PUBLIC ORDER AND SAFETY 42.9 48.7 60.9 103.4 250.4 132.5 158.0 230.5 307.5 432.8 176.8
EDUCATION 140.2 150.9 192.7 260.8 354.2 409.9 507.2 647.2 1,020.1 1,836.7 552.0
HEALTH 79.3 85.4 104.8 155.5 245.9 266.5 342.5 452.8 623.1 765.3 312.1
SOCIAL SECURITY AND SOCIAL WELFARE 145.3 179.8 251.6 384.5 695.2 709.11,054.
31,677.
7 2,180.5 1,789.8 906.8
HOUSING AND COMMUNITY AMENITIES 7.1 5.3 5.5 7.0 9.1 9.1 90.1 123.8 56.4 115.7 42.9
RECREATIONAL AND SPORTING, CULTURAL SERVICES 20.6 19.4 17.8 34.6 43.6 41.8 51.2 80.6 81.9 141.1 53.3
ENERGY, HEATING 24.9 20.6 38.4 31.7 56.3 37.8 93.1 181.6 183.8 178.8 84.7
AGRICULTURE, FORESTRY 12.5 13.8 17.9 35.0 78.1 66.1 116.3 239.8 143.6 181.0 90.4 MINING, MANUFACTURING AND CONSTRUCTION 26.3 32.0 44.9 52.7 85.7 99.7 218.5 633.3 81.4 108.9 138.3
TRANSPORT & COMMUNICATION 2.7 2.8 33.6 41.2 14.5 30.1 46.4 71.6 82.6 212.7 53.8
OTHER ECONOMIC ACTIVITY 10.9 11.3 119.7 379.5 484.4 274.7 109.6 191.0 180.2 334.6 209.6
OTHER UNCLASSIFIED EXPENDITURES 187.3 182.8 227.1 211.6 235.0 208.5 152.4 214.0 568.4 1,342.7 353.0
TOTAL 794.9 854.41,279
.81,917.
3 2,822.72,601.
33,432
.45,317
.26,986.
59,197.
33,520.
4
Source: Compiled by authors from Ministry of Finance (MoF) expenditure data. Note: Expenditure figures in nominal values
3.2 Trends in gross agricultural output
24. The Mongolian agriculture sector has witnessed a remarkable performance in recent years after having been hit by the dzud weather in 2009/2010 (see annex 1 for detailed data on key agricultural outputs). As shown in figure 3, gross agricultural output increased by 30.4 percent from MNT 1,297.5 billion in 2007 to MNT 1,691.6 billion in 2008. Thereafter, growth in output slowed down by an average 1.8 percent between 2008 and 2010. But it picked up significantly by 17.2 percentage points from MNT 1,752.5 billion in 2010 to MNT 2,053.7 billion in 2011. Overall, there has been a steady growth in output although that growth was slow between 2009 and 2010 due to a drop in livestock production from MNT 1,307.7 in 2009 to MNT 1,290.7 in 2010. The livestock subsector revamped after the dzud as a result of the implementation of the
23
Mongolia's agriculture sector has witnessed a remarkable performance in recent years.
GoM’s policy measures through investments in animals and through the implementation of the MLP(see annex 3), and targeted subsidies and transfers managed mainly through the Livestock Conservation Fund (LCF).5 Gross livestock output rose from MNT 1,290.7 billion in 2010 to MNT 1,505.3 billion in 2011, representing an increase of about 16.6 per cent.
25. The positive trend in gross agricultural output has also been boosted by a sustained increase in crop production. Although crop production represents a smaller percentage of the gross agricultural output than livestock production, it has grown steadily over the same period. Crop output increased from MNT 172.7 in 2007 to MNT 548.4 in 2011 (figure 3). This performance of the crop sector is attributable to the GoM’s recent agriculture support policies mainly through subsidies and transfers to major crops such as wheat, managed through the Crop Protection Fund (CPF) at MIA.6 Over the period, the GoM dramatically increased subsidies expenditures (see section 5.1 for a detailed analysis of composition of current expenditures). The GoM has also provided technical support in the form of subsidized soft loans for the acquisition of machinery and inputs, including adoption of new technologies to increase agricultural productivity all in fulfillment of the Government’s objective of attaining food self-sufficiency (see Annex 1 for data on production and supply of major crops supported by the GoM). Overall, these policies seem to be working well, with positive trends in gross agricultural output of the two subsectors (figure 3).
Figure 3. Gross agricultural output in MNT billion, 2007-2011
5 See a separate report on subsidies for a detailed discussion of the LCF by Kisan Gunjal and Charles Annor-Frempong. 6 See a separate report on subsidies for a detailed discussion of the CPF by Kisan Gunjal and Charles Annor-Fremponp
24

2007 2008 2009 2010 20110
500
1000
1500
2000
2500
1297.5
1691.6 1737.4 1752.5
2053.7
1124.81377.1 1307.7 1290.7
1505.3
172.7314.6
429.7 461.8 548.4
Gross agricultural output Livestock production subsector Crop production subsector
Gro
ss A
gric
out
put/M
NT
bill
ion
Source: Compiled by authors from Statistical Data for Food, Agriculture and Light Industry Sector, MIA, 2012. Note: Expenditure figures in nominal values
25

4 LEVEL AND COMPOSITION OF AGRICULTURAL EXPENDITURES
4.1 Trends in Agriculture Sector Expenditures
26. A great number of government agencies and institutions benefit from public sector resource allocation. In Mongolia, MIA is responsible for managing agriculture sector expenditures. In addition, other autonomous and semi-autonomous agencies such as the State Property Committee (SPC), the Department of Veterinary and Animal Breeding (DVAB), the National Animal Gene Bank (NAGB), the Interprovincial Pastureland Management Authority (IPPMA), the National Agricultural Extension Center (NAEC), the Crop Production Support Fund (CPSF), the Livestock Conservation Fund (LCF), the State Central Laboratory for Veterinary and Sanitary Service (SCLVSS), the State Veterinary Laboratory for Certification of Veterinary Drugs and Vaccines (SLCVDV), and the Small and Medium Enterprises Agency (SMEA) received agriculture-related public expenditures. Expenditures on these institutions go to support agricultural policy development, management and coordination. Budgetary allocations to these activities, excluding donor funding, increased from MNT 6.2 billion in 2008 to MNT 12.0 billion in 2013. The 21 provincial (aimag) agricultural departments (PAD) and 330 soums benefit from public expenditures in agriculture (see section on paragraph 32 below). 27. The total allocations to agricultural policy development, management, and coordination are distributed among the agencies mentioned above. Of these agencies, the SMEA received an average of 58.8 percent of the total budget for agricultural policy development, management, and coordination over 2008-2013 period, followed by MIA (24.6 percent). These two agencies together received an average of 78.6 percent of the total budget over the same period. The rest of the agencies received an average less than 10 percent during the period under review.7 In 2013, the highest recipients of the sector budget were SMEA (52.1 percent) and MIA (24.6). The largest share of SMEA signifies the GoM’s policy direction of encouraging investments in small and medium enterprises in the agricultural sector as stated in the MCNDS. Table 5 shows trends in budgetary allocations to key agricultural institutions/agencies over the period from 2008 to 2013.7Expenditure data provided by Finance and Investment Division (FID) of MIA were over 2008-2013 period.
26
27

Table 5. Trends in budget allocations to departments/agencies, in MNT ‘000, and as a percentage of total budget, 2008-2013
Agency/Department 2008
Share of (%) 2009
Share of (%) 2010
Share of (%) 2011
Share of (%) 2012
Share of (%) 2013
Share of (%)
Average
SPC
-
-
-
-
-
-
-
-
1,302,
877
12.7
989,8
73
7.9
3.4
CVSL
284,000
4.6
284,646
4.4
304,90
3
4.6 3
76,079
4.9 4
47,970
4.4
546,7
87
4.4
4.5
SCTVVM
196,10
0
3.2
191,29
8
3.0 2
07,213
3.1
225,95
6
2.9
296,64
0
2.9
389,9
25
3.1
3.0
NCLG
102,40
0
1.7
95,548
1.5
117,89
3
1.8
140,87
0
1.8
177,48
7
1.7
188,3
98
1.5
1.7
AMP
97,800
1.6
77,096
1.2
93,832
1.4
128,23
8
1.7
211,89
4
2.1
215,5
98
1.7
1.6
NAEC
172,60
0
2.8
141,51
4
2.2
178,33
6
2.7
213,56
2
2.8
279,24
3
2.7
305,6
44
2.5
2.6
MIA
1,462,
500
23.8
1,933,
762
30.0
1,697,3
59
25.4
1,752,
586
22.7
2,283,
537
22.3
3,068,057
24.6
24.8
VBA
0-
-
163,31
5
2.5
166,52
3
2.5
204,25
5
2.6
282,73
3
2.8
330,3
11
2.7
2.2
CVC
368,00
0
6.0
300,16
9
4.7
318,37
4.8
362,26
8
4.7
443,52
5
4.3
488,6
61
3.9
4.7
SMEA
3,468,
600
56.4
3,266,
126
50.6
3,588,9
06
53.8
4,330,
879
56.0
5,527,
880
54.0
6,487,806
52.1
53.8
APSM
-
-
-
-
-
-
-
-
294,26
8
2.9
432,9
76
3.5
1.1
Total
6,152,0
00
100
6,453,4
75
100
6,673,3
42
100
7,734,6
97
100
10,245,
179
100
12,454,16
8
100
Source: Compiled by authors with expenditure date from FID, MIA. Note: expenditures are in nominal values.
Note: SPC =State Property Committee; DVAB= Department of Veterinary and Animal Breeding; NAGB=National Animal Gene Bank; IPPMA=Interprovincial Pastureland Management Authority, National Agricultural Extension Center (NAEC); CPSF=Crop Production Support Fund, LCF= Livestock Conservation Fund; SCLVSS =State Central Laboratory for Veterinary and Sanitary Service; SLCVDV=State Veterinary Laboratory for Certification of Veterinary Drugs and Vaccines, and SMEA=Small and Medium Enterprises Agency.
28. MIA budget statements do not reflect how budget is allocated to the different departments and divisions within the Ministry, which receives a single annual lump sum allocation. This makes it difficult to establish how much was allocated to the various administrative departments and divisions
28

that constitute MIA. For effective planning, budgeting and expenditure management, and to improve transparency and accountability of sector resources, MIA must show clearly in its annual budgets the amount of budgetary allocations to its own departments and divisions.
29. Over the past ten years (2004-2013)8 annual growth in budgetary allocations to MIA have been largely positive. Aside from fiscal year 2009 and 2012, when the Ministry’s approved budget decreased by 11.7 and 24.6 percent respectively, the annual growth rate of the approved budget has been consistently positive, albeit volatile, with the highest growth occurring in fiscal year 2008. In 2004, the agriculture budget grew by 11.7 percent. This rate of growth declined to 0.9 percent in 2005, increased to 36.4 percent in 2006, 112.6 percent in 2007, and 127.1 percent in 2008. In 2009, the rate of growth fell to 24.6 percent. Thereafter, it rose to 71.0 percent in 2010 and to 120.6 percent in 2011, fell to 24.6 percent in 2012, and rebounded to 56.6 percent in 2013. The AgPER team could not obtain reasons for the volatile trend of the annual growth rate of the budget, but recent increases in subsidies and transfers expenditures could be the key factor for this trend. An analysis of agricultural sector subsidies conducted as part of the overall sector review shows that subsidies to key subsectors averaged as follows: crops (15%), wheat (50%), and livestock (4%) over the period 2008-2012 (see annex 3 for analysis table).9 Figure 4 shows the annual growth rate of budgetary allocations to MIA.
Figure 4. Trend in annual rate of growth of MIA budget (2004-2013)
8 Most expenditure data from MoF spans over ten years.9 Gunjal K. and Annor-Frempong C “Mongolia Agriculture Sector Review: Review, Estimation and Analysis of Agricultural Subsidies in Mongolia, December 2013”
29

2002 2004 2006 2008 2010 2012 2014
-40.0
-20.0
0.0
20.0
40.0
60.0
80.0
100.0
120.0
140.0
11.90.9
36.4
112.6
127.1
-11.7
71.0
120.6
-24.6
56.6
Growth trend
Source: Compiled by authors from MoF expenditure database
30. Budgetary allocations to agriculture are small relative to the national budget and GDP. In 2012, the share of the national budget allocated to agriculture, excluding forestry and fisheries, was about 1.4 percent. Between 2003 and 2012, agriculture’s share of the national budget fluctuated, with the largest share (2.9 percent) occurring in 2011. Similarly, agriculture expenditure as a share of GDP has been relatively low over the same period. In 2012, agriculture expenditure as a percentage of GDP was only 1.7 percent, a decline from 3.2 percent in 2011. Figure 5 shows trends in agriculture expenditure as a share of the national budget and as a percentage of GDP.
30
Figure 5. Trends in agriculture expenditures as a share of the national budget and GDP (2003-2012)
2003 2004 2005 2006 2007 2008 2009 2010 2011 20120.0
0.5
1.0
1.5
2.0
2.5
3.0
3.5
0.3 0.3 0.2 0.30.5
1.0
1.41.6
3.2
1.71.4
1.1
0.70.8
1.0
1.4
2.11.9
2.9
1.4
Agric. expenditure as a share of GDP Agric. expenditure as a share of National Budget
Perc
enta
ge P
oint
s
Source: MOF and NSO. Note: GDP figures are up to 2012.
31. Public spending on agriculture is low relative to comparable middle income countries in Asia and elsewhere. To inform policy makers about the level and size of government spending on agriculture by international standards, the AgPER team estimated Mongolia’s key agricultural expenditure performance ratios and compared them with eight other countries in Asia and elsewhere: China, Philippines, Sri Lanka, Namibia, Cape Verde, and Paraguay. Each of them spends a higher percentage of their total GDP on agriculture than Mongolia. Also, Mongolia spends a lower percentage of its national budget on agriculture than India, China, Philippines, Sri Lanka and Thailand despite having relatively a higher agricultural value-added.10 In relation to AgGDP, Mongolia spends less on agriculture than all the countries. Table 6 provides Mongolia’s expenditure performance ratios with comparable countries around the world.
10 Value added is the net output of a sector after adding up all outputs and subtracting intermediate inputs.
31
Mongolia's public spending on agriculture is low relative to comparable middle income countries in Asia and elsewhere.

32

Table 6. International comparison of public expenditures on agricultureCountry Agriculture
expenditure (% of
national budget)
2007
Gov't expenditur
e on
Agriculture( % of GDP)
2007
Gov't expenditur
e on agricultur
e (% of
Agriculture
GDP)2008
Gov’t expenditure on R&D
% of Agricultur
al GDP
Agriculture GDP
% of GDP
Agriculture
Value added % of GDP
2003-2012
Income per
capital2012
India 5.0 1.0 205.9 0.3 2.5 17.6 1.530China 6.8 6.0 20.9 0.4 3.7 10.0 5,740Philippines
5.2 3.0 4.4 0.4 2.4 13.0 2,470
Mongolia
1.4 1.7 0.5 0.5 0.2 17.0 3,160
Sri Lanka
4.4 3.0 8.4 0.6 1.4 12.0 2,920
Thailand
6.6 3.0 12.9 0.0 1.8 12.0 5,210
Namibia
- 5.0 13.8 0.5 3.9 8.0 5,670
Cape Verde
- 2.0 12.6 2.7 2.6 10.0 3,810
Kazakhstan
4.4 16.4 - 4.7 5.0 9,780
Kyrgyz Republic
- 2.4- 1.9 - 20.0 6,691
Paraguay
- 2.0 6.8 0.0 2.9 17.0 3,290
Source: Comparable countries data from WDI, IFPRI (2011 figures). Note: figures for Mongolia are authors’ own estimates from National Statistics Office (NSO) and MoF data (2012).
32. Budgetary allocations are concentrated at the center. Total budgetary allocations to the 21 aimags and the city of Ulaanbaatar amounted to MNT 4.6 billion in 2013, representing 1.6 percent of the total agriculture sector budget, compared with MNT 13.4 billion for MIA and the autonomous agencies. Most of this budget will be executed by the aimags through the Local Development Fund (LDF) as stated in the new Integrated Budget Law (IBL).11 Table 7 shows the budgetary allocations to the 21 aimags and Ulaanbaatar in 2013.
11 The IBL was passed by parliament on December 23, 2011. Its main objective is to ensure fiscal stability, enhance efficiency and predictability of resource allocation, and increase citizens’ participation in the annual budgeting process (Lkhagvadorj A. “An Analysis of the New Budget Law of Mongolia, 2011”. National Academy of Governance, Ulaanbaatar, April 26 2012.
33

Table 7. Budgetary allocations to provincial governments (in MNT billion), 2013 NO. AIMAG 2013 % OF TOTAL
1 Arkhangai 209.5 4.6
2 Bayan-Ulgii 231.9 5.1
3 Byankhongor 193.0 4.2
4 Bulgan 243.,3 5.3
5 Gobi-Altai 230.2 5.0
6 Dorno-Gobi 161.3 3.5
7 Dornod 204.2 4.5
8 Dund-Gobi 227.8 5.0
9 Zavkhan 247.1 5.4
10 Uvurkhangai 180.4 3.9
11 Umnu-Gobi 179.6 3.9
12 Sukhbaatar 263.2 5.7
13 Selenge 205.2 4.5
14 Tuv 218.9 4.8
15 Uvs 244.5 5.3
16 Khovd 199.3 4.4
17 Khuvsugul 240.0 5.2
18 Khentii 236.1 5.2
19 Darkhan-Uul 139.0 3.0
20 Ulaanbaatar 344.7 7.5
21 Orkhon 98.8 2.2
22 Gobi-Sumber 82.9 1.8
TOTAL EXPENDITURE (AIMAG) 4,580.9 100.0
Source: FID, MIA. Note: Only 2013 provincial budget figures were available. Note: Expenditure figures are in nominal values.
33. Over the medium term, public spending on agriculture is projected to fall. According to the Medium-Term Fiscal Framework (MTFF)12 figures for 2014 provided by the MoF, overall government expenditure on agriculture in 2014 is expected to fall by 0.13 percent from 2013. The reasons for the expected fall in the agriculture budget were not readily known at the time of the review. But, several factors, including the current fiscal outlook of the Mongolian economy may have accounted for the projected decline in expenditures. According to the International Monetary Fund (IMF) staff report issued in November 2012, the GoM’s overall fiscal balance deteriorated by 5.3 percent of GDP in 2011, to a deficit of 4.4 percent of GDP.13 The World Bank Economic Update for
12 The GoM uses the term Medium-term Fiscal Framework, which is synonymous to Medium-term Expenditure Framework (MTEF).13 Mongolia, 2012 Article IV Consultation and Third Post-program Monitoring, IMF Country Report No. 12/320.
34

Mongolia in April 2013 affirmed this decline in the GoM’s fiscal balance. According to the report, the fiscal balance significantly worsened to a record deficit of 8.4 percent of GDP in 2012. Given the challenging fiscal outlook currently confronting Mongolia, it is important for MIA to improve its resource allocation and expenditure management to avoid further reductions of its budget by the MoF. MIA should also consider reducing subsidies in favor of investments that enhance agriculture productivity.
35
Given the challenging fiscal outlook confronting Mongolia, public spending on agriculture is projected to fall.

5 ECONOMIC COMPOSITION OF AGRICULTURAL EXPENDITURES
34. Resources are said to be efficiently allocated when spending is directed to priority programs, particularly those that spur pro-poor growth. The analysis of allocative efficiency is determined by the assessment of economic and functional composition of expenditures. To determine the economic composition of public expenditures in the agriculture sector, expenditures are classified into current and capital expenditures in line with standard classification of expenditures by Mongolian Ministry of Finance. The following two sections provide an analysis of economic composition (current and capital expenditures) of agricultural expenditures in Mongolia, including external support to agriculture in the country.
5.1 Analysis of current expenditures
35. The GoM’s nomenclature for expenditure disaggregates current expenditures into the wage bill (basic salaries, wages and supplementary, salaries for structural changes, wages for contracted out services, compensation for transportation and meals, and performance bonuses) and non-wage current expenditures (goods and services, employers social security contributions, other goods and services expenditures etc.). An in-depth analysis of current expenditures show that MIA’s wage bill increased steadily from MNT 0.55 billion in 2003 to MNT 9.29 billion in 2013, an increase of about 83 percent. This is fueled mainly by a steady increase in basic salary and salaries for contracted staff. These two components of the current expenditure alone accounted for over 94.4 percent of the wage bill in 2013. Table 8 provides trends in the composition of recurrent budget allocation over the period 2003-2013.
Table 8. Trends in MIA recurrent budget allocation (in MNT billion), 2003-2013
2003 2004 2005 2006 2007 2008 2009 2010 2011 2012 2013Goods and services expenditures 9.23 10.08 10.37 10.81 14.04 31.28
34.53 42.87 51.53 37.41 50.35
Salary, wages and supplementary 0.55 0.69 0.73 1.01 1.42 2.99 3.52 3.91 4.65 7.19 9.29
Employers' insurance contribution 0.14 0.18 0.19 0.27 0.38 0.29 0.39 0.43 0.52 0.80 1.03 Expenditure on other goods and services 8,.43 9.19 9.44 9.55 11.96 27.99
30.62 38,53 46.26 29.42 40.03
36
Payment for services provided by private sector - -
-
- 0.16 9.90
17.69 10.56 6.92 5.41 3.06
Subsidies and transfers 0.51 0.38 0.38 0.61 0.64 8.49
19.25 16.44 72.11 59.25 68.33
Total current Expenditures 9.29 10.12 10.41 10.88 14.10 39.76 53.7 59.30 123.64 96.66 118.68
Source: MoF and MIA. Note: Expenditure figures in nominal values
36. A closer examination of the major components of the current expenditures (salaries, goods and services, animal care services14 and subsidies and transfers) reveals that in recent years current expenditures have been geared more towards the provision of subsidies and transfers than for other important current expenditures such as goods and services that would otherwise support improvement in service delivery. In 2003, expenditures on goods and services constituted over 99.5 percent of total recurrent budget, compared with wages and salaries (5.8 percent) and subsidies and transfers (0.5 percent). Between 2003 and 2013, the share of spending on goods and services declined from 99.5 percent of total current expenditures to 42.4 percent. During that same decade, expenditures on subsidies and transfers increased from 0.5 percent to 57.6 percent of total current expenditures. Similarly, expenditures on subsidies and transfers for mainly wheat subsidies and output-based payments and technical assistance to wheat farmers through loans and grants far outweighs the wage bill, although the latter has been increasing consistently over the same period. Subsidies and transfers are also higher than animal care services in spite of the fact that the livestock subsector is the largest agricultural sub-sector, and disease prevalence is a major constraint to the export of livestock products –
14 Animal care services comprise outlays on vaccines, veterinary services, and private services providers.
37
Animal care services are essential, as the livestock subsector is the largest agricultural sub-sector in Mongolia.
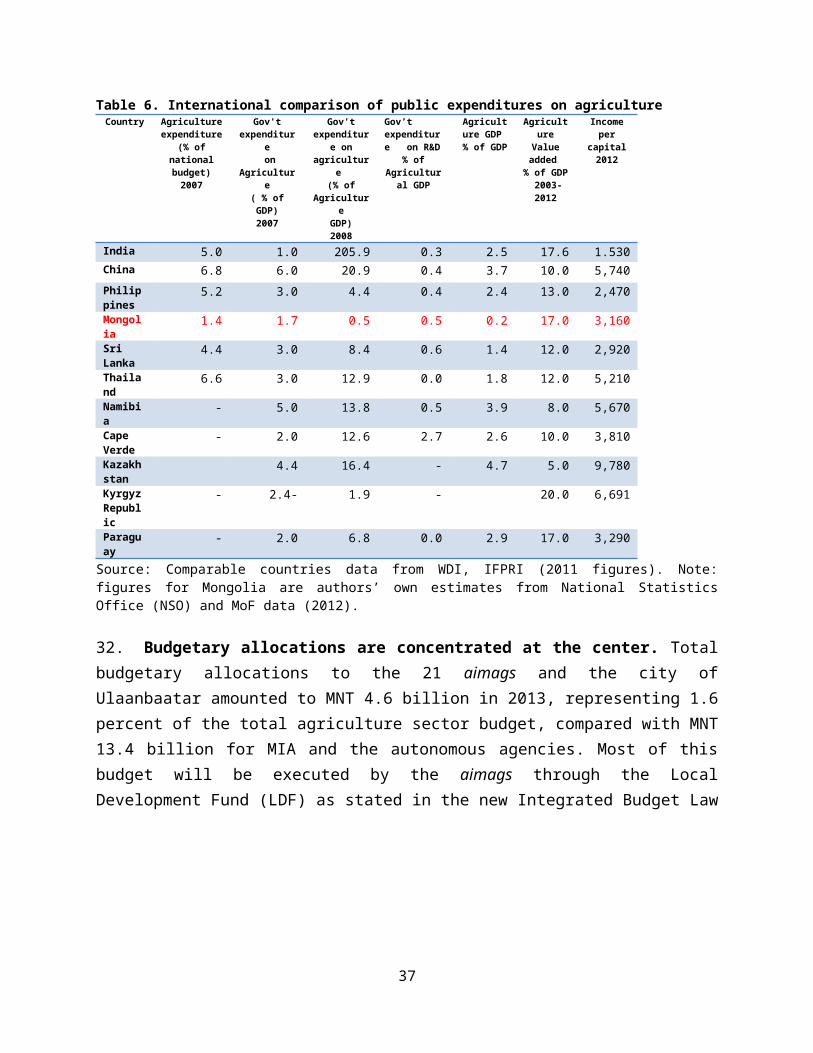
thereby limiting its potential contribution to the economy. Figure 6 shows trends in the four major components of the current expenditure.
Figure 6. Comparison of major components of the current expenditure (2003-2013)
2003 2004 2005 2006 2007 2008 2009 2010 2011 2012 2013.0
10.0
20.0
30.0
40.0
50.0
60.0
70.0
80.0
Goods and services expenditures
Salary, wages and supplementary
Subsidies and transfers
Animal Care Services
Cur
rent
exe
pn (M
NT
bill
ion)
Source: Compiled by authors from MoF expenditure database. Note that expenditures are in nominal values.
37. Figure 6 also shows that subsidies and transfers started rising in 2007, with the most dramatic rise occurring in 2011. The increased subsidies and transfers are mainly due to the government’s policy of supporting crop and livestock production, including providing support to agro-based enterprises and wheat farmers, following the all-time low production of major crops such as wheat between 2005 and 2007, and the impact of the global food crisis on Mongolia in 2008. Taking into consideration the performance of the crop and livestock sector as indicated in section 3 above, and relatively higher agricultural output, the subsidy program has made a positive difference (Figure 3 above). But, the GoM needs to strike a balance between spending on subsidies and transfers and other important current expenditures, in particular those that address market constraints and support the provision of public goods.
38. Disease control and eradication expenditures are difficult to track. The disaggregation of the three main expenditure categories for animal care services—vaccines, veterinary services, and private service providers—reveals that funding for vaccines was discontinued after 2008. In
38

fact, according to available expenditure data in MoF there is no record of budgetary allocations for vaccines between 2009 and 2013. The AgPER team uncovered no explanation regarding the gap in figures for vaccines. But, weaknesses in financial management analytical capacity of the Finance and Investment Division (FID) of MIA may account for the weaknesses in reporting expenditures to the MoF. The division lacks staff with the requisite capacity to undertake expenditure analysis, thereby impacting on documenting and accounting for sector expenditures.
39. The underreporting and lack of proper documentation of expenditures on vaccines is more pronounced when one compares trends in spending on vaccines with those of private veterinary service and other providers. As shown in figure 8 below, allocations for vaccines were only recorded from 2003 to 2008. Spending on veterinary services dominated animal care services expenditures over the period under review, with the exception of 2009, when there were no records on veterinary services expenditures. It was not clear whether there were allocations to private service providers between 2003 and 2004. But, spending on private service providers continued, thereafter, and in fact, was the only item whose expenditure (MNT17.7 billion) was recorded in 2009. In 2013, private service providers were allocated (MNT13.1 billion) compared to MNT 3.1 billion for public veterinary services. The AgPER team could not authenticate this pattern of expenditure at MIA due to the dearth of expenditure data in the FID of the DSPP, which is mainly due to the reasons stated above.
39

Figure 7. Trends in budgetary allocations to animal care services (2003-2013), MNT billion
2003 2004 2005 2006 2007 2008 2009 2010 2011 2012 2013.0
2000.0
4000.0
6000.0
8000.0
10000.0
12000.0
14000.0
16000.0
18000.0
20000.0
Vaccines Veterinary services Private service providers
Expe
nditu
re(in
MNT
bill
ion)
Sources: Authors’ own estimates based on expenditure data from MoF.
5.2 Analysis of capital expenditures
40. MIA has witnessed a steady growth in capital expenditures over the past ten years. The capital budget increased from MNT 560.0 million in 2003 to MNT 186.2 billion in 2013. Major components of capital expenditures are (i) domestic investment; (ii) state reserves; and (iii) capital transfers. In 2013 domestic investment alone amounted to MNT 76.2 billion (40.9 percent) of the total capital budget, a significant increase from only MNT 0.10 billion (1.8 percent) of the capital budget in 2003. State reserves, mainly wheat reserves, accounted for MNT 28.0 billion (15 percent) of the total capital budget while capital transfers constituted only MNT 1.5 billion (0.8 percent) of the capital budget in 2013. Figure 8 presents trends in the major components of the capital expenditures over the period 2003-2013.
40
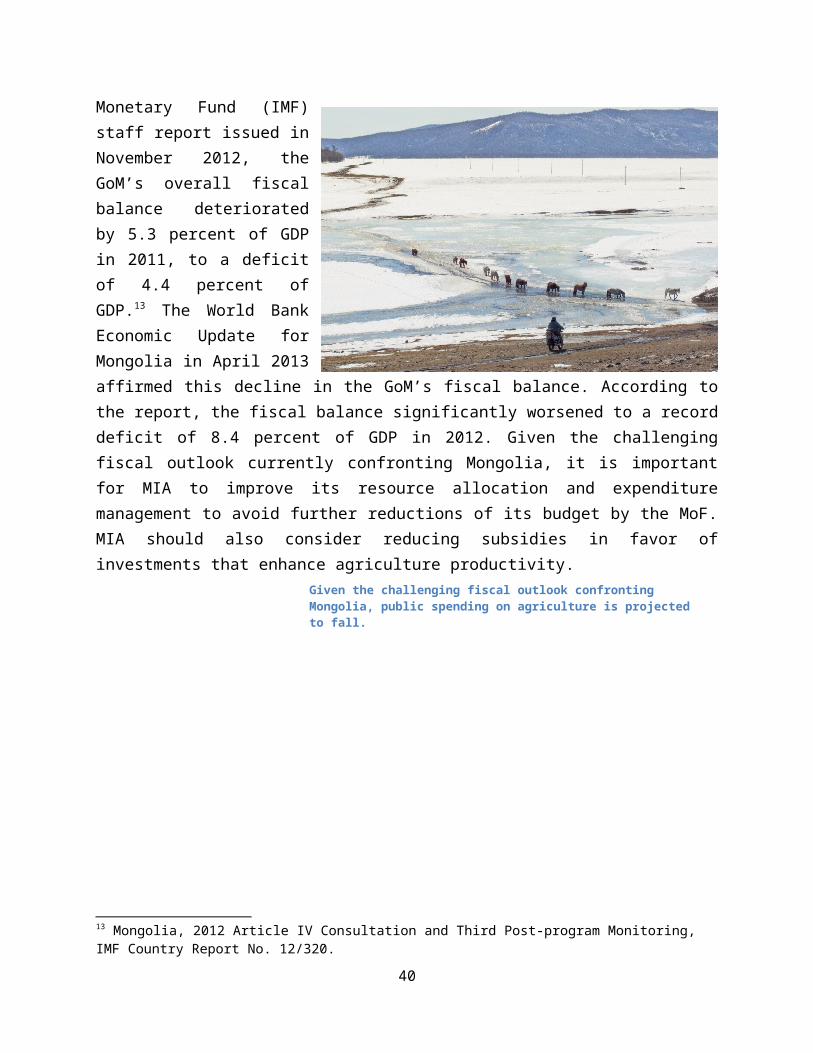
Figure 8. Trends in allocation of major components of MIA's capital budget, (in MNT billions), 2003-2013
2003 2004 2005 2006 2007 2008 2009 2010 2011 2012 2013
0.0
10.0
20.0
30.0
40.0
50.0
60.0
70.0
80.0
Domestic investment State reserves Capital transfer
Exp
endi
ture
(in
MN
T b
illio
ns)
Source: Compiled by authors from MoF expenditure data. Note: Expenditures are in nominal values
5.3 Capital expenditures vs. current expenditures
41. Over time, capital expenditures have more than doubled compared with current expenditures. A comparison of capital expenditures with current expenditures shows a steady and significant growth in capital expenditures over the past decade. In 2003, capital expenditures amounted to MNT 21.4 billion (43.3 percent of total expenditure) while MNT27.9 billion (56.7 percent of total expenditure) was allocated to current expenditures.15 From 2003 to 2013, and from 2009 to 2013 in particular, capital expenditures more than doubled. In 2013, 74.9 percent of the total expenditures went into financing
15 For the purposes of this analysis, total expenditure is defined as current expenditures (including salaries and wages) plus all capital expenditure items.
41
Since 2008 the Government scaled up investments for the construction and rehabilitation of wells.

capital expenditure items compared to only 25.1 percent for current expenditures. In absolute terms, capital expenditures amounted to MNT 1,079.9 billion compared to MNT 362.4 billion for current expenditures in 2013. The consistent increase in capital expenditures provides the justification for the GoM’s commitment to provide public goods to improve the future welfare of the society by investing now. Since 2008 the GoM has embarked on scaling up investments for the construction and rehabilitation of wells, including irrigation and other important capital investments. While these types of investments are justifiable, it is unclear whether they are sustainable given the slow growth in rate of current expenditures, and indeed in operation and maintenance (O&M)16 budget. Figure 9 compares trends in capital and current expenditures over the 2003-2013 period.
16 In MIA’s budget classification, O&M is referred to as capital repairs.
42
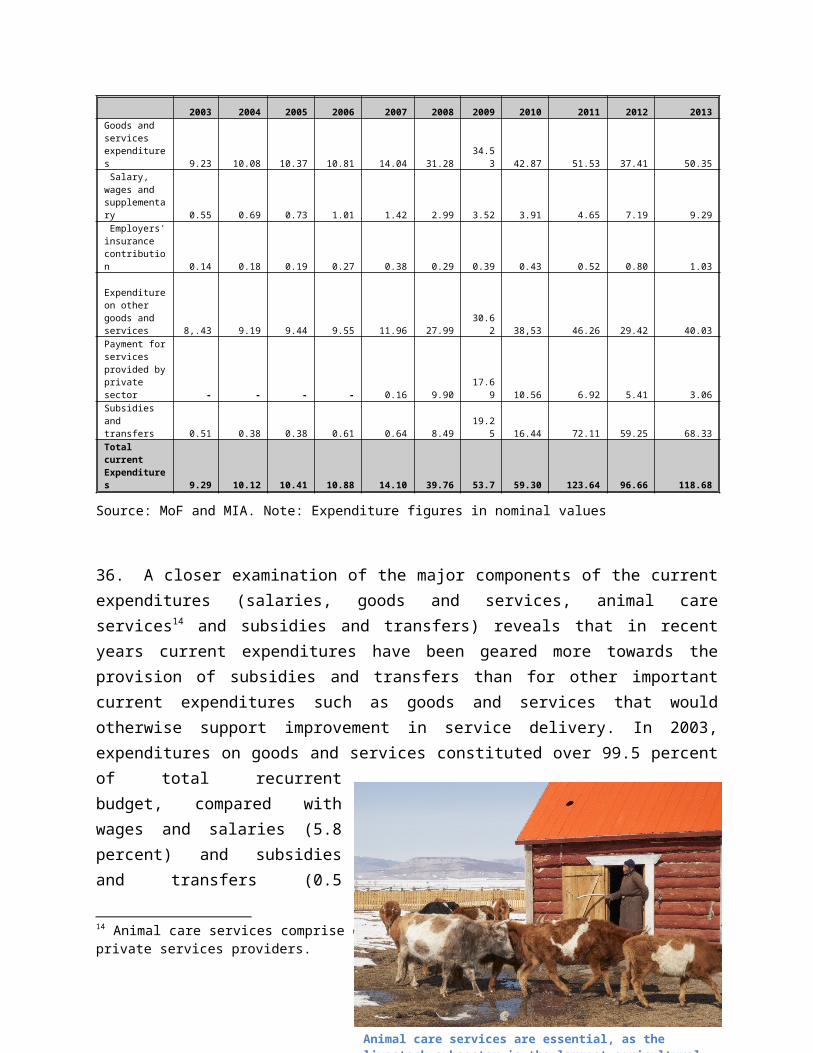
Figure 9. Trends in capital and current expenditures (in MNT billions), 2003-2013
2003 2004 2005 2006 2007 2008 2009 2010 2011 2012 20130.0
200.0
400.0
600.0
800.0
1000.0
1200.0
1400.0
1600.0
Total Expenditure Current Expenditure Capital Expenditure
Expe
ndit
ure
(in M
NT
bili
ion)
Source: Compiled by authors from MoF expenditure data
42. External support complements government efforts, but very limited information is available for donor spending on agriculture. Donor-off budget expenditures (expenditures that are not part of the sector budget, but managed solely through a donor’s procedures), mainly commitments, through implementation of investment projects at both national and local levels are a very important component of the sector expenditures.17 A variety of independent projects are implemented by various donors and NGOs in the sector. This analysis attempted to capture expenditures of the most important donors, as it was difficult to collect and gather expenditures from all donors in the sector. As shown in table 9 below, donors whose expenditures were readily available at the time of the review include: (i) the Swiss Development Cooperation (SDC); (ii) the European Union (EU); (iii) the Asian Development Bank (ADB); (iv) the Millennium Challenge Corporation (MCC); (v) the Japan International Cooperation Agency (JICA); (vi) the United Nations Food and Agriculture Organization (FAO); (vii) the International Fund for Agricultural Development (IFAD); (viii) the Korea International Cooperation Agency (KOICA); and the World Bank Group (WBG).
17 Trend analysis of donor budget expenditures was impossible due to the dearth of data for the period of review.
43

Table 9. Donor off-budget expenditure (commitments) on agriculture, in millions of US$, 2012-2016
Donor Project Name
Amount
(US$ million)
% of total
Swiss Development Cooperation Animal Health Project 20.5 27.3
European Union - 1.0 1.3
Asia Development Bank(ADB) - 2.5 3.3Millennium Challenge Corporation (MCC) Peri-urban Rangeland project 5.9 7.9
JICAEnhancing the Extension System for Comprehensive Crop-Livestock Management 2.0 2.7
UNImproving Food Security for Rural Disadvantaged Population of Mongolia 1.3 1.7
UNSouth-South Cooperation—Technical Assistance for Food Security Program 1.3 1.7
FAO Integrated Livestock-based Livelihoods support program 12.5 16.7
IFAD Market and Pasture Management Development Project 11.5 15.3
KOICAEstablishing an agricultural model enterprise in Khalkh gol soum 4.0 5.3
World Bank Livestock and Agricultural Marketing Project (LAMP) 12.5 16.7
Total 75.0 100
Sector budget (2013)287.1
Share of (%) 26.1 Source: Directorate of External Coordination, MIA.
43. As shown in table 9, four donors (SDC, FAO, IFAD, and WBG) are the major contributors to the sector with a combined funding of US$57.0 million, representing 76 percent of total donor expenditures (US$75 million) over the 2012-2016 period. The share of donor off-budget support in total sector budget was 26.1 percent in 2013. This shows that external funding is currently very important expenditure in the sector. None of the donors listed in table 9 channels its resources through the GoM Public Financial Management (PFM) system, and donor coordination is weak, although it is acknowledged that the Ministry has recently made some progress in bringing all donors on board for planning and prioritization of investment programs in the sector. In some instances, donors, particularly NGOs, operate with limited or no links to MIA. Improving donor coordination would obviously help in the planning and prioritization of sector investments and hence achievement of sector development goals. It would also eliminate duplication of efforts by ensuring that each donor focuses on areas where it enjoys a comparative advantage, and the GoM focuses on the provision of core public goods that are vital for agricultural development.
44
44. The growth in capital expenditures has been spurred by increases in investment activities in the provinces. The dramatic increase in capital expenditures is the result of the recent government policy of increasing investments in agriculture, particularly in the provinces (aimags). For example, MIA has earmarked about MNT 157.8 billion over the period 2012-2017 for targeted projects and activities in the aimags as well as the districts in Ulaanbaatar. Key activities to be financed under this program include construction of new wells, water systems, veterinary and sanitary laboratories, disinfection facilities, etc.), acquisition of equipment, feasibility studies, design and drawings and capital repairs (operation and maintenance). About 49.9 percent (MNT 78.8 billion) of the total budget has been allocated for capital investments in 2013. Among the activities currently receiving government funding are (i) construction of a food testing laboratory in Ulaanbaatar; (ii) construction of water supply points for livestock pasture land in all 21 aimags; (iii) construction of veterinary and sanitary laboratory in Khan-Uul district in Ulaanbaatar; (iv) construction of a national livestock genetic fund complex in Khongor in Darkhan Uul aimag; and (v) installation of wind pump for pasture watering in Domogobi and Gobisumber.
45. However, allocations for operation and maintenance are especially low relative to total capital investments. Although MIA has increased overall capital investments in the agriculture sector, the increase is not matched by adequate funding of O&M, which remains disproportionately small. Only 1.9 percent of the total capital/investment budget was allocated to O&M in 2013.18 The AgPER team was unable to obtain the rationale behind the small proportion of the capital budget being allocated for O&M. The GoM needs to consider increasing the budget for O&M to about 10 percent of the total sector budget because this underfunding could undermine the sustainability of investments in the sector.18 There is no fixed rule on ratio of capital spending in capital intensive expenditures (ARD-WB Practitioners’ Toolkit for Agricultural Public expenditure Analysis, p.12). But, it is important for GoM to maintain existing infrastructure versus investing in new infrastructure if it wants to sustain growth in agricultural output in the country.
45
A water supply point for livestock in Ulann Uul soum, Hovsgol aimag.
46
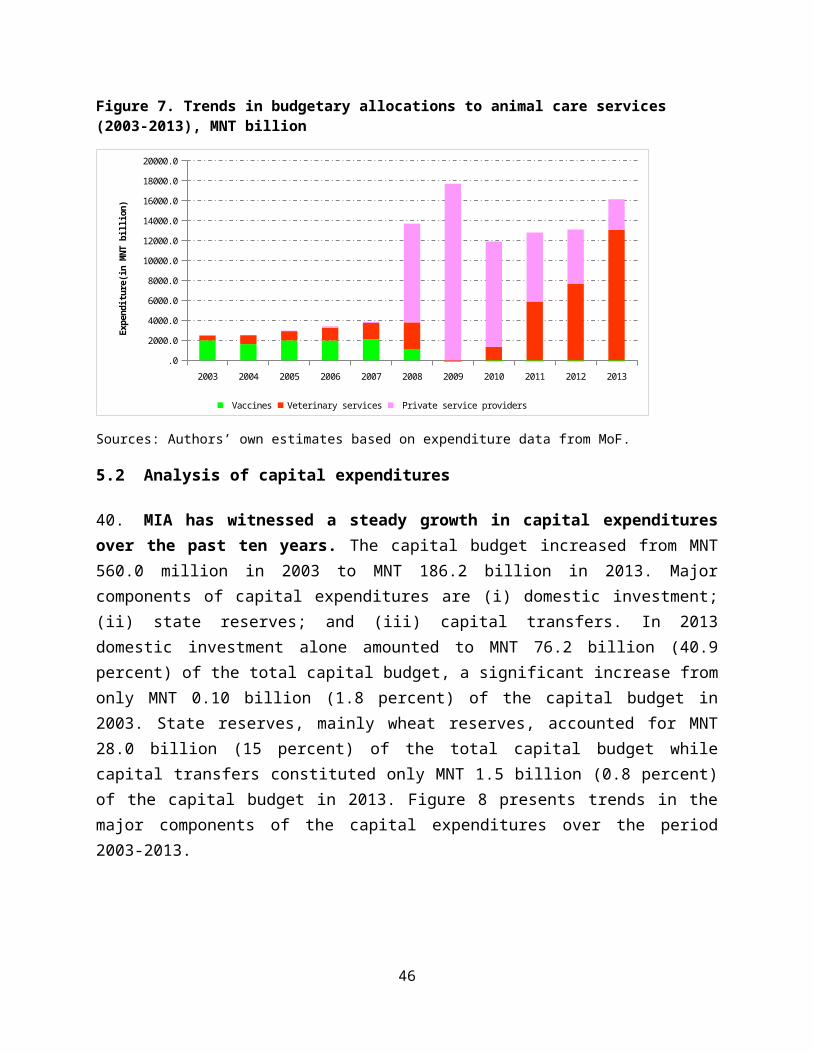
6 FUNCTIONAL COMPOSITION OF EXPENDITURES
46. In the previous section, we analyzed economic composition of sector expenditures as an important aspect of the analysis of allocative efficiency. This section delves into the functional composition of sector expenditures as a determinant of the allocative efficiency of sector resources. The analysis of functional composition of sector expenditures is based upon the premise that it is not only the magnitude and size of the resources that comes into a particular sector that matters, but the manner in which the resources are allocated to relevant sector programs and activities. The two key questions that this chapter seeks to address are: (i) Are resources allocated to the right programs and activities that provide significant social benefits and reduce poverty? And (ii) Are budgetary allocations in the sector aligned with priority sector objectives?
47. Empirical evidence has shown that public sector spending on productivity enhancing and targeted pro-poor programs such as R&D, irrigation, rural infrastructure, and rural development has impacted positively on rural poverty and agricultural productivity growth. Using an econometric model to estimate the impact of additional spending by the Government of India on R&D, irrigation, rural infrastructure and rural development, Fan, Hazell, and Throat (1998) found that additional public spending on roads had the greatest impact on poverty reduction as well as significant impact on productivity growth. They also found that additional government spending on R&D and extension services had the greatest impact on agricultural productivity growth and led to substantial benefits for the rural poor. Education had the third largest impact on rural poverty reduction owing mainly to its potential to induce an increase in non-farm employment and rural wages.19 Another, more recent study published by IFPRI in 2011, found that public investment in rural infrastructure and extension services have significant impacts on the well-being of rural households in Nepal, as measured by land values, consumption growth, poverty reduction, and growth in agricultural incomes (Dillon, Sharma, and Zhang (2011).20
48. Many countries, and industrialized countries in particular, invest a substantial proportion of their public agriculture sector budget in areas such as research and development, and advisory and extension services, which are seen as strategic priorities in increasing agricultural growth.
19 Shengen Fan, Peter Hazell, and Sukhadeo Thorat: “Government Spending, Growth and Poverty: An Analysis of Interlinkages in Rural India” IFPRI, Washington D.C., December 1998.20 Andrew Dillon, Manohar Sharma, and Xiaobo Zhang “Estimating the Impact of Access to Infrastructure and Extension Services in Rural Nepal.” IFPRI, Washington D.C. 2011
47

Mongolia in contrast allocates a disproportionately small percentage of its agriculture budget to these important core public goods (see chapter 7 for an overview of R&D expenditures). R & D and advisory services, including extension services, together received 4 percent of the functional budgetary allocations compared with planning and policy (11 percent) in 2013 (Figure 10). Pests and plant disease control received 13 percent of the functional budget, even though these functions are among the important activities that help increase agricultural productivity. The function that received the lion’s share of the functional budget is subsidies and transfers (62 percent), followed by livestock diseases (16 percent) control program.21 This is not surprising given that subsidies and transfers now account for a substantial proportion of the sector budget due to government policy towards increasing livestock and crop production.
Figure 10. Functional composition of expenditures, 2013
Planning and Policy
Plant Pest and Diseases
Livestock Diseases
Advisory Services
Research & De-velopment
Physical Infrastructure
Subsidies and Transfers
Source: Compiled by authors from MIA and MOF expenditure data.
49. It is evident in figure 10 that the core public goods (research and extension) are significantly underfunded by international standards. For example, while Mongolia spends 0.5 percent of its AgGDP, Kyrgyzstan spends 2.2 percent of its AgGDP on these public goods. Thailand spends 12.9 percent of its AgGDP on research and extension. The underfunding of the core public goods is a matter of concern because they are areas in which the private sector is reluctant to invest, even though they are necessary for private investments in the sector.
21 According to MIA’s program budget from the MoF, there are four main disease control programs: (i) preventive measures for contagious diseases, (ii) preventive measures for parasitic diseases; (iii) preventive measures for special contagious diseases; and (iv) treatment of chronic animal contagious diseases.
48
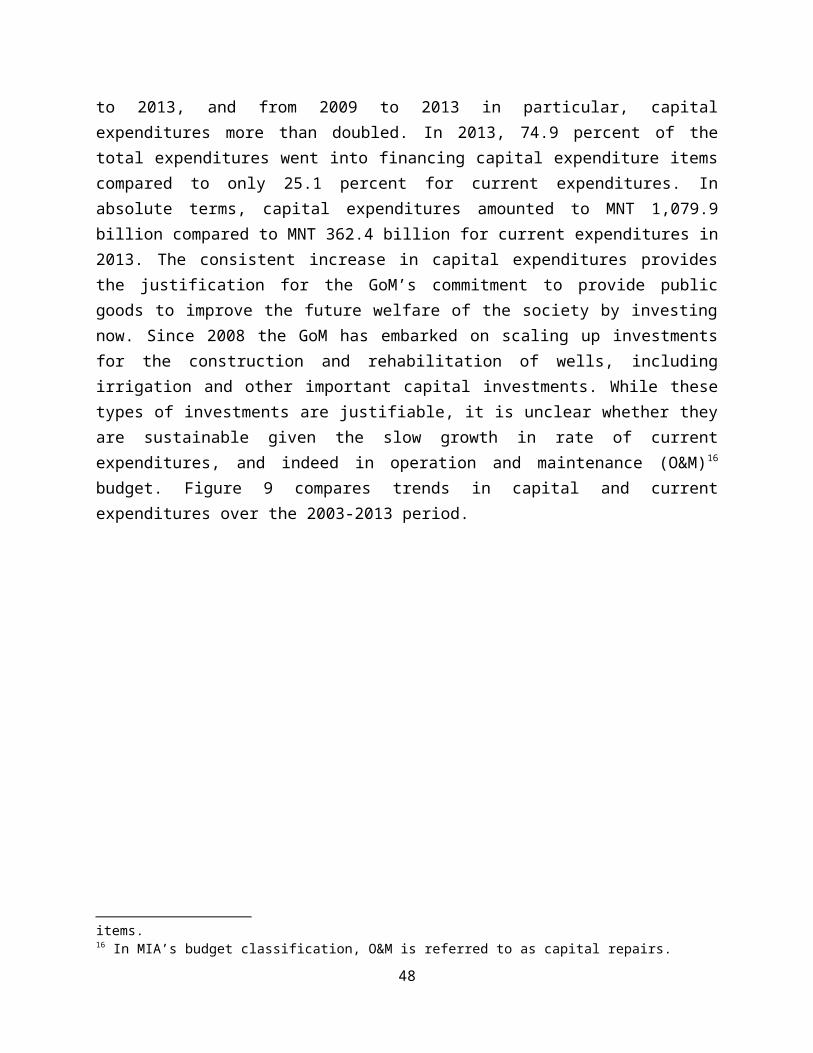
50. Another aspect of the functional analysis of allocative efficiency is to examine whether resources have been allocated in line with government priority programs and objectives. This section will focus on the extent to which the allocation of agricultural public expenditures is aligned with sector development priorities. As indicated earlier, the key question that the section seeks to address is as follows. Is the functional composition of expenditures aligned with the GoM’s development priorities?
51. The Agricultural Sector Development Strategy Paper (ASDSP) which outlines MIA’s agricultural development priorities, provides the basis for allocating sector resources (see section 2 above).22 Key activities and initiatives of the ASDSP have been costed to ascertain funding requirements for effective implementation of the activities. The AgPER team compared the costed programs in the ASDSP with MIA’s budgetary allocations to functional categories from 2008 to 2011 to ascertain the extent to which budgetary allocations to various programs have been aligned with the strategy objectives. However, it was difficult for the team to establish the alignment of all the costed programs with MIA’s budget for functional categories because the ASDSP provides broad areas of activities, which might include several other functions indicated in the MIA’s functional categories budget. The only discernible functions in the ASDSP that could be aligned with the functional categories budget are shown in table 10 below.
52. MIA allocated an average of 23.0 percent of its total budget to disease management program compared with ASDSP projections, followed by planning and policy (5.8 percent) in 2011. An average of 14.8 percent was allocated for livestock diseases, 3.1 percent for R&D, and 6.7 percent for physical infrastructure (irrigation wells, water systems, laboratory buildings, etc.) compared with ASDSP average of 5.9 percent, 1.6 percent, and 8.5 percent respectively over the period under review. Table 10 also compares MIA’s budgetary allocations to functional categories with ASDSP priority programs projections over the period 2008-2011.
Table 10. Percentage of MIA’s functional budget allocated to ASDSP priority programs compared with ASDSP projections (%) 2008-2013
Functional CategoriesAllocations Averag
e ASDSP
2008 2009 2010 2011 over the
periodAverag
e
Disease Management 21.9 25.3 21.2 23.4 23.0 5.9Planning and policy 12.7 13.9 10.4 12.8 12.5 25.0Research & development 3.9 3.0 3.2 2.0 3.0 1.6
22 Note that only ASDSP was analyzed and compared with the functional categories budget. The other policies and strategies in sector 2 were not costed.
49
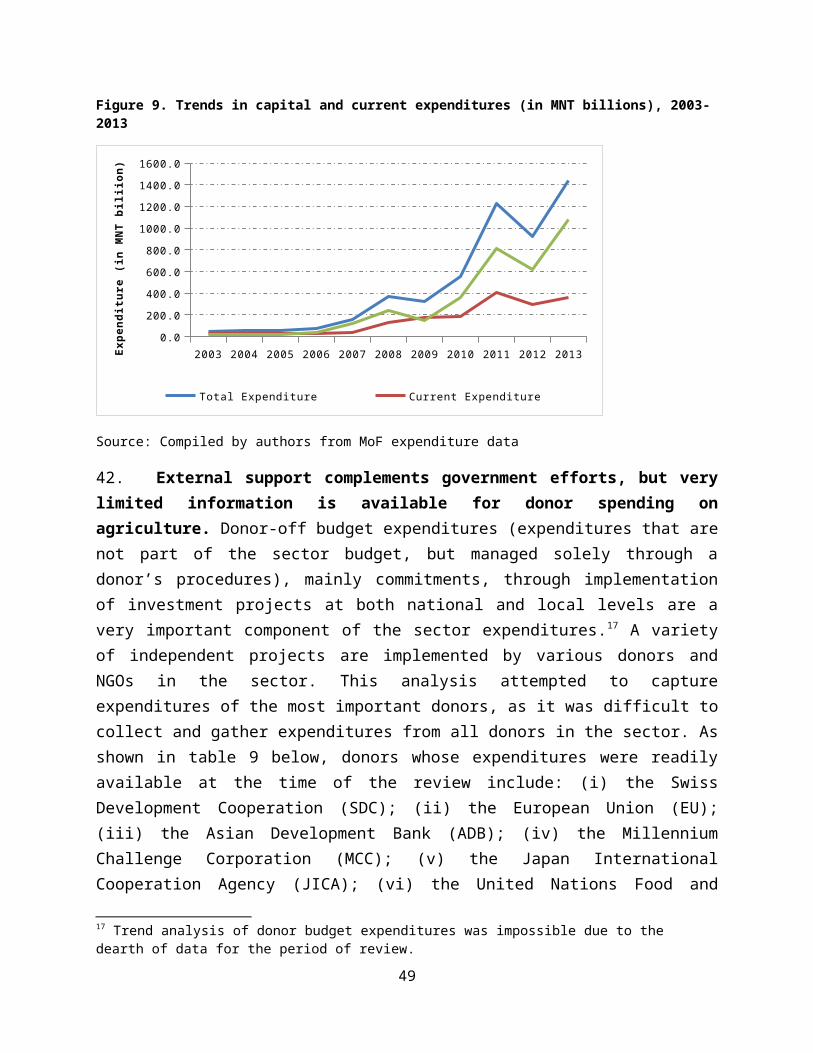
Physical infrastructure 17 15.2 16.8 12.5 15.1 8.5Advisory Services 9.4 9.7 8.8 10.3 9.6 26.0Market Linkages 8.5 7.2 12.9 11.5 10.0 3.1
Crop and horticulture 13.7 14.7 12.7 13 13.5 22.8Seed Capacity Development 12.9 11.9 14 14.5 13.3 7.1
Source: Authors’ own estimates from MIA’s budgetary allocations and MoF expenditure database. Note: Figures for functional allocations were obtained from MIA’s 2008-2013 budget proposal document and Statistical Data of Food, Agriculture and Light Industry Sector, Published in 2012. Advisory services include extensions services and training and all related activities.
53. A thorough examination of the ASDSP and the sector budget shows significant differences between activities and functional categories in the MIA’s budgets and those of ASDSP, which suggests that the ASDSP has not been fully utilized in the preparation of annual budgets. This implies that the government has not allocated its budget according to the priorities identified in the ASDP. There is, therefore, the need to utilize and align sector budget allocations to development priorities when assigning resources to functional programs.
50

7 AGRICULTURAL RESEARCH AND EXTENSION SERVICES
54. Public agricultural research financing in Mongolia is channeled through the Science and Technology Fund (STF), which is managed by an autonomous agency affiliated with the MoES. The STF employs government funds to research in all relevant sectors, including agriculture. The STF expenditures are outside MIA’s budget, but go to support the agricultural research institutions. The agricultural research institutes that benefit from the fund include: (i) the Animal Husbandry Research Institute (AHRI); (ii) the Plant Protection Research Institute (PPRI); (iv) the Veterinary Research Institute (VRI); and (v) the Plant Science Agricultural Research and Training Institute (PSARTI); and (vi) the Mongolia State University of Agriculture (MSUA).23
55. The STF funds research institutions using a grants-based approach. At the beginning of each calendar year, the fund publishes a Request for Proposal (RFP) in major newspapers. The research institutes develop and submit their proposals based on the content of the RFP through their respective operational ministries. There is an inter-ministerial committee headed by the Prime Minister which is the highest approving body for funds to all beneficiary institutions. Between 2008 and 2012, the STF financed a total of MNT 24.6 billion to the various field of research, including agriculture. As shown in table 12, over 50 percent of STF funding goes to technical and applied research fields per year followed by environment (20.0 percent). Agriculture has received an average of 5.4 percent of the total STF funding over the same period. Table 12 provides trends in the STF financing of research activities by sector from 2008 to 2012.
Table 11. Science and Technology Fund (STF) allocations by sector, MNT billion 2008-2012
Field of research /secto
r2008 % of
total 2009 % of total 2010 % of
total 2011 % of total 2012 % of
total Total Average Value
Average (%)
Technical 1,350,022 31.5 754,54
5 23.6 716,992 18.6 1,403,31
3 26.2 1,845,876 23.4 6,070,7
481,214,1
50 24.7
Social 418,253 9.8 339,393 10.6 268,90
2 7.0 345,593 6.5 832,935 10.6 2,205,0
76441,01
5 8.9
Environmental 588,880 13.7 773,223 24.2 881,85
1 22.9 976,383 18.2 1,669,8
90 21.2 4,890,227
978,045 20.0
Medical 260,399 6.1 136,650 4.3 125,08
5 3.2 613,143 11.5 829,049 10.5 1,964,3
26392,86
5 7.1
Agriculture 204,000 4.8 183,0
00 5.7 281,000 7.3 289,0
00 5.4 302,000 3.8 1,259,0
00251,80
0 5.4
23 All the agricultural research institutes are under the MOES, but implements their programs through MIA.
51
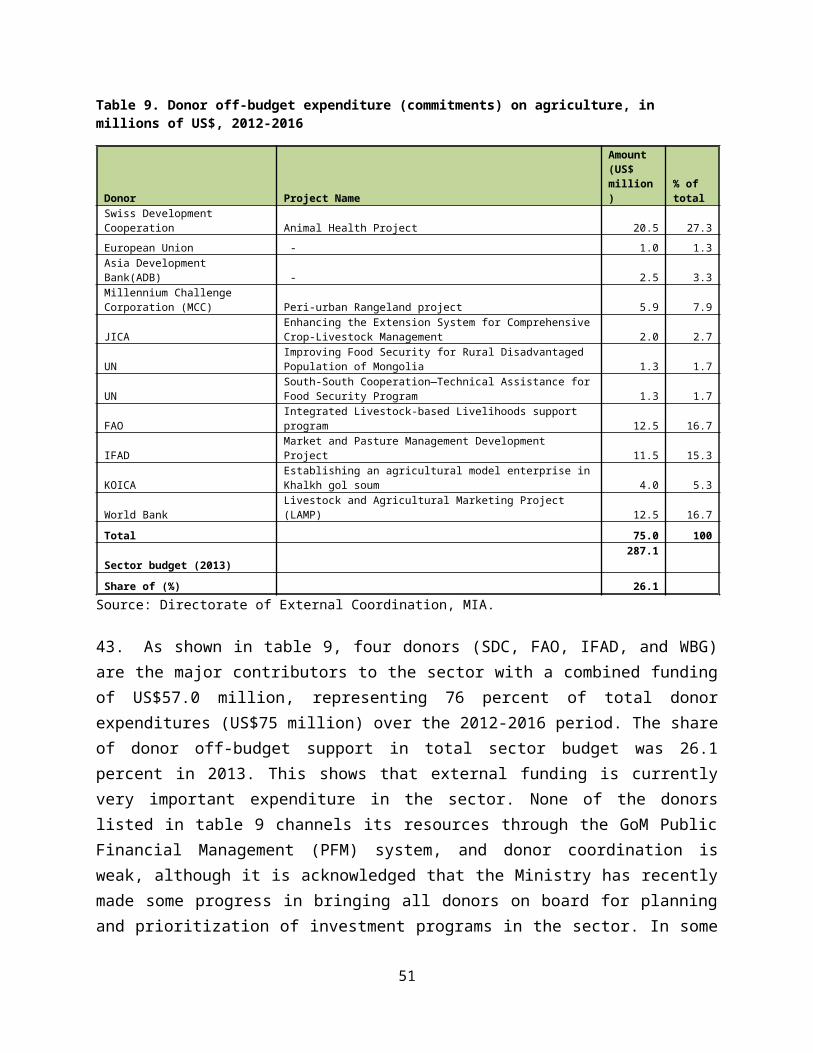
Applied Research
1,465,131 34.2 1,013,
712 31.7 1,584,138 41.1 1,726,
022 32.2 2,409,583 30.5 8,198,5
861,639,7
17 33.9
Total 4,286,685 100 3,200,5
23 100 3,857,968 100 5,353,4
54 100 7,889,332
100.0
24,587,962
4,917,592
Source: STF, MoES. Note: Expenditures are in nominal values
56. The selection and submission of agricultural research program of activities to STF is done in close collaboration with MIA. Internally, the agricultural research institutes are required to submit their draft project proposals to a committee headed by the Vice-Minister of MIA. The committee prioritizes and selects the activities to be carried out by each research institute. The selected activities/projects are then sent to STF at MoES for review and approval. Upon approval by the STF approving committee, the STF management releases funds to the research institutes.
57. An analysis of trends in funds received by the agricultural research institutes over the period 2003-2013 is shown in table 12 below. The table provides the cumulative expenditure of MNT 22.03 billion over the period under review. The table also shows that MSUA received the lion’s share (27.0 percent) of the total agricultural research funds, followed by AHRI (220.30 percent) and PSPARTI (20.1 percent), respectively. Together these three institutions received 69.4 percent of the total allocations from the STF.
Table 12. Budgetary allocations to agricultural research institutes, 2008-2012 (in MNT billion)
Institute 2008 2009 2010 2011 2012 Total
Average
Share of Total (%)
Animal Husbandry Research Institute 0.5
9 0.47 0.71 1.03 1.17 4.92 0.49 22.3
Plant Protection Research Institute 0.2
7 0.21 0.24 0.26 0.38 3.97 0.40 18.0
Mongolia State University of Agriculture 0.1
2 0.37 0.71 0.23 0.41 5.95 0.60 27.0
Veterinary Research Institute 0.48 0.42 0.54 0.64 1,13 2.98 0.33 13.5
PSPARTI 0.58 0.57 0.61 0.73 1.06 4.42 0.44 20.1
Total 2.04 1.83 2.81 2.89 3.02 22.03 2.20 100.0
Source: Department of STF, MOES. Note: Expenditures and in nominal values.
58. Research funding from STF is woefully inadequate to meet the growing needs for research. The allocation of research budgets among different categories of expenditure (salaries, operating costs, and capital
52

costs) has significant impact on the efficiency and effectiveness of agricultural research and development. To this end, the AgPER team collected information on expenditure categories from the finance departments of three research institutes (AHRI, PPRI, and VRI) for which data was available. The analysis of expenditure categories of these research institutes showed inadequate funding for research-specific activities. Worse still, most of this funding is used to pay salaries, leaving a very limited amount available to undertake research per se. For example, AHRI spent an average 55.2 percent on salaries compared to 16.5 percent on research-specific activities over the period 2009-2013. The breakdown of the spending structure of the three research institutes is given in table 13 below.
53
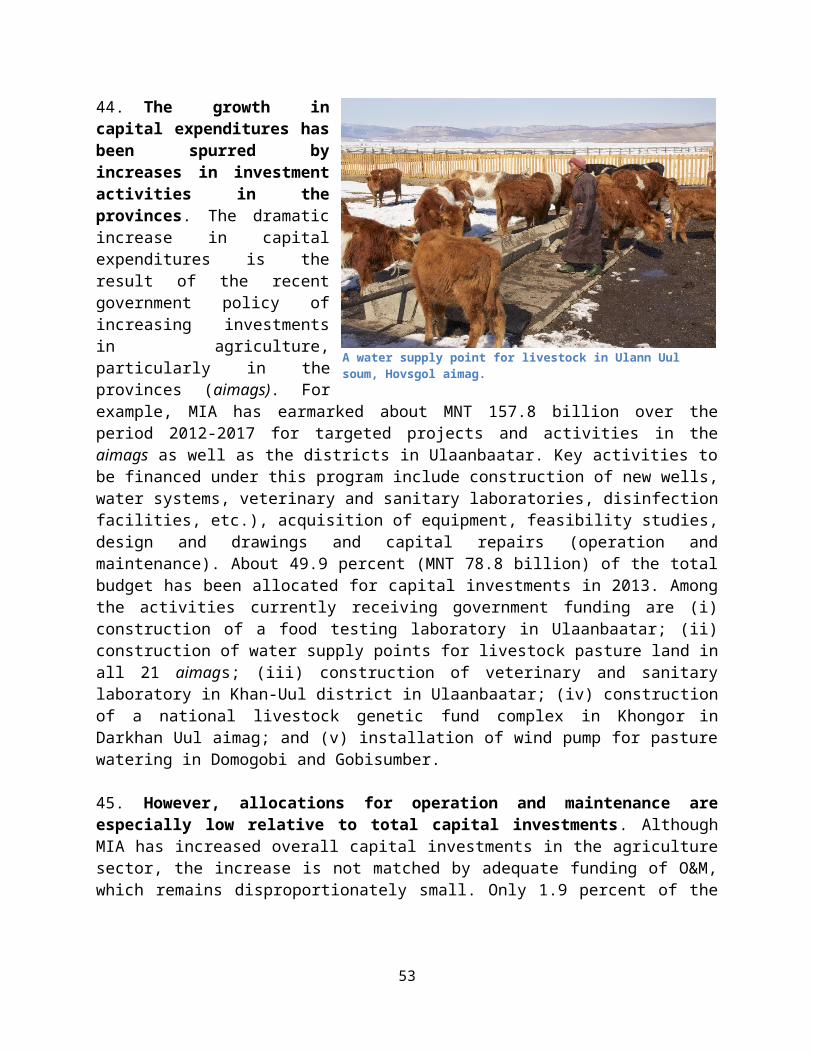
Table 13. Category of expenditure by institution (in MNT '000), 2008-2013
Animal Husbandry Research Institute
Item of Expenditure 2008 2009 2010 2011 2012 2013Average 2008-2013
Salaries - 373,929 397,599 453,299 676,740 807,604 451,528.50
Research activities - 24,300 72,520 450,901 380,118 61,060 164,816.50
Other Operational Expenses - 68,833 108,710 141,616 126,644 115,740 93,590.50
Total - 467,063 578,829 1,045,818 1,183,503 984,405
709,936.33 Salaries of total (%) - 80.1 68.7 43.3 57.2 82.0 55.22 Research activities share of total (%) - 5.2 12.5 43.1 32.1 6.2 16.53 Other Operational Expenses (%) 14.7 18.8 13.5 10.7 11.8 13.90
Plant Protection Research Institute
Item of Expenditure 2008 2009 2010 2011 2012 2013 Average 2008-2013
Salaries 191,061,596 186,675,000 203,230,800 224,529,100 335,540,80
0394,691,7
00 255,954,833
Research activities 106,034,674 25,971,800 35,115,700 37,678,800 49,046,400 34,698,30
0 48,090,946
Total 297,096,270 212,646,800 238,346,500 262,207,900 384,587,20
0429,390,0
00 304,045,778
Salaries share of total (%) 64.3 87.8 85.3 85.6 87.2 91.9 83.69 Research activities share of total (%) 35.7 12.2 14.7 14.4 12.8 8.1 16.31 Other Operational Expenses (%) - - - - - - -
Veterinary Research Institute
Item of Expenditure 2008 2009 2010 2011 2012 2013 Average 2008-2013
Salaries 319,131 308,931 334,108 382,059 576,189 - 320,070
Research activities 130,721 52,819 52,508 177,168 288,957 - 117,029
Other operational Expenses 85,542 158,180 375,440 624,679 704,372 - 324,702
Total 535,395 519,930 762,056 1,183,906 1,569,517 - 761,801
Salaries share of total (%) 59.6 59.4 43.8 32.3 36.7 - 38.6Research activities share of total (%) 24.4 10.2 6.9 15.0 18.4 - 12.5Other Operational Expenses (%) 16.0 30.4 49.3 52.8 44.9
38.7
Overall Average (%)
Salaries 62.0 75.8 65.9 53.7 60.4 87.0
59.2Research activities
30.1 9.2 11.4 24.2 21.1 7.215.1
Other Operational Expenses 8.0 22.6 34.1 33.2 27.8 11.8
26.3
Source: Authors’ calculation based on expenditure data from three agricultural research institutes. Note: expenditures are in nominal values.
59. The limited funding for research specific activities is aggravated by delays in the release of funds to the research
54
institutes. The inadequacy of funds is compounded by the delay in the release of funds from the STF. Less-than-timely release of funds is a challenge to all the research institutes. The STF approving committee does not meet regularly as required by law. For example by April 2013, none of the research institutes had received funds for the first quarter of 2013. The operations and structure of the approving committee need to be reformed in order to speed up the approval process and to ensure a regular and continuous flow of funds to the research institutes.
60. The current institutional arrangements also hamper the smooth operations of the research institutes. In addition to funding issues, senior managers interviewed at the research institutes described the disadvantages of operating under the aegis of the MoES instead of the MIA. They are not able to participate in and take advantage of many agricultural related capacity building interventions organized by MIA. The MoES does not organize agriculture-related capacity building and other operational activities that would help improve their skills and expertise.
61. MIA finances a number of research activities within the sector. In addition to research funded by the STF, MIA allocates part of its agricultural budget for R&D activities. This amount goes into the financing of investment activities, which include: (i) feasibility studies for construction of new buildings; (ii) feasibility studies for the establishment of plant nurseries; (iii) feasibility studies for the establishment of fish farms; and (iv) intensive research and testing of new quality seeds etc. Table 14 presents trends in total agricultural R&D expenditures from 2008 to 2013.
Table 14.Trends in agricultural research and development expenditures, (in MNT '000), 2008-2013
2008 2009 2010 2011 2012 2013
Agriculture 38,769,977 54,290,579 65,692,863 156,706,413 94,898,239 145,187,123
R&D Agriculture (MIA) 2,310,224 1,708,946 2,001,856 2,407,665 3,474,362 3,670,920
Total Agriculture 41,080,201 55,999,525 67,694,719 159,114,078 98,372,601 148,858,04
3
STF (MOES) 204,000 183,000 281,000 289,000 302,000 -
Total R&D (MIA & STF) 2,514,224 1,891,946 2,282,856 2,696,665 3,776,362 3,670,920
R&D MIA (% of Agric. Budget) 5.6 3.1 3.0 1.5 3.5 2.5
R&D, including STF (% of Agric. Budget) 6.1 3.4 3.4 1.7 3.8 2.5
Sources: MoF and MIA expenditures by sector, and STF (MoES)
55
62. Spending on research is exceptionally low compared to total spending on agriculture and agriculture GDP. Public spending on R&D, (MIA and STF combined) in 2008 amounted to MNT 2.50 billion, which represented 7.0 percent of total agriculture spending, excluding fisheries and forestry in 2008. In 2013, although spending on R&D increased to MNT 3.67 billion, it represented only 2.5 percent of total agriculture sector spending. As a share of agricultural GDP24, expenditure on R&D represented 0.4 percent in 2008, which is lower than 1.01 in Malaysia, but the same as the Asia-Pacific regional average of 0.42 in the same year.25 This figure fell slightly to 0.3 percent in 2009, but rose to 0.40 percent and 0.50 percent of agricultural GDP in 2010 and 2011 respectively.26 Mongolia fares relatively well when compared with Kyrgyzstan (0.09 percent), which has similar climatic conditions. Table 15 provides trends in agricultural research expenditures relative to the national budget and agricultural GDP.
Table 15.Agriultral research spending: share of total agriculture expenditure and agricultural GDP (2008-2013)
2008 2009 2010 2011 2012 2013Agriculture Expenditure (MNT billion) 41.08 55.10 67.69 159.11 98.37 148.86
Agricultural GDP (MNT billion) 768.40796.3
2 664.15 660. 68 801.27 -
Research expenditure (MNT billion) 2.50 1.90 2.28 2.70 3.78 3.67Share of Agricultural Expenditure (%) 7.00 3.90 3.80 2.30 5.10 2.50
Share of Agricultural GDP (%) 0.40 0.30 0.40 0.50 - - Source: Authors’ estimates based on data from NSO, MoF, and STF.Note: AgGDP figures are in nominal values. AgGDP figures for 2012 and 2013 were unavailable at the time of the study.
63. Inadequate funding for research has had significant impacts on the delivery of extension services. A discussion with the extension services policy unit of MIA revealed that delivery of extension services has been ineffective due to lack of concrete research results, particularly new technologies from the research institutes. The transfer of new technologies to farmers and herders is practically non-existent. Lack of funds has constrained the research institutes ability to conduct long-term research, which is essential for discovering and adapting new technologies.
24 Total public spending on R&D as a percentage of agricultural GDP (intensity ratio) is a commonly used and internationally accepted research investment indicator for spending on agricultural research and development (R&D). Thus this ratio helps place a country’s agriculture R&D spending in an internationally comparable context.25 Global Food policy report, IFPRI, 2013.26 GDP figures for 2013 were unavailable at the time of the review.
56

64. Extension services delivery is also hampered by inadequate funding. Limited funding affects extension services as well as extension activities. The National Agricultural Extension Center (NAEC) is located in Ulaanbaatar and is responsible for operating and managing all extension activities in the country mainly through MIA’s extension units in the aimags and soums. The NAEC has 16 technical experts, 21 extension officers located in the aimags, and 330 extension officers in all soums together, one per soum. NAEC is funded through budgetary allocations from MIA. In 2013, it received about MNT300 million from MIA’s budget. 70 percent of this amount was spent on administrative functions; 30 percent operational; and 10 percent for capacity building and field work. Like the research institutes, NAEC is not adequately funded. As a result, the implementation of its activities is significantly hampered by financial and logistic problems. As shown in table 16 below, budgetary allocations to NAEC has averaged MNT0.22 billion over the period 2008-2013. Agricultural extension expenditure as a percentage of AgGDP averaged 0.011 percent over this period.
Table 16. Trends in agricultural extension services expenditures and extension services expenditure as percentage of AgGDP (2008-2013)
2008 2009 2010 2011 2012 2013 Average(2008-2013)
Agriculture Expenditure (MNT billion) 41.08 55.1 67.69 159.11 98.37 148.86 95.04Agricultural GDP (MNT billion) 1,252.1 1,170.8 1,192.7 1,353.9 - - 993.89Extension expenditure (MNT billion) 0.17 0.14 0.18 0.21 0.28 0.31 0.215Share of Agricultural Expenditure (%) 0.41 3.9 3.8 2.3 5.1 2.5 3.002Share of Agricultural GDP (%) 0.014 0.012 0.015 0.016 - - 0.011
Source: Compiled by authors from NSO, NAEC, MIA expenditure data. Note: AgGDP and expenditure figures are in nominal terms.
57
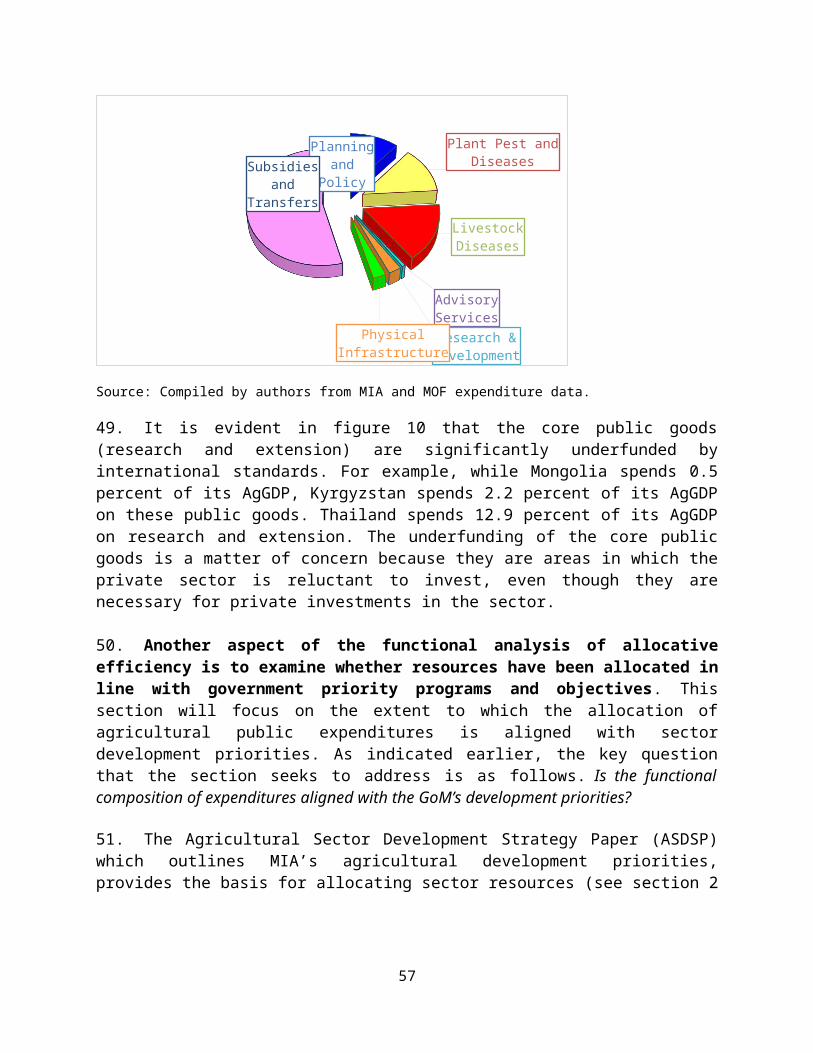
8 BUDGET PROCESSES AND PERFORMANCE
65. The timely preparation, approval, and execution of budgetary resources largely determine the effectiveness of public sector expenditures. Prompt approval and release of funds ensures that public sector institutions have the means to procure goods and services that would allow smooth implementation of their programs/activities. This section provides an overview of the budget preparation process in Mongolia. It also analyzes MIA’s budget execution performance by comparing the level of its actual and planned expenditures.
8.1 Budget preparation
66. Mongolia’s budget cycle begins in the first month of the second quarter of the fiscal year. Between April 15 and June 1 of each fiscal year, a Medium Term Fiscal Framework (MTFF) is developed and approved. Socioeconomic development priorities are developed in April.27 And from June 10 to July 5, annual budget ceilings for spending agencies are prepared and approved. Between July 25 and November 15 the national budget proposal, social insurance fund budget, and the human development fund budget are developed and approved. The remaining period of the fiscal year is devoted to the development and approval of local government budgets. Box 1 summarizes the budget preparation process and its timelines.
67. MIA’s budget preparation process follows national timelines. At the sector level the DSPP leads the budget preparation process through its Finance and Investment Division. At the beginning of the budget preparation period, the Division collects budget proposals from all relevant departments and agencies, including the aimags as soon as it receives the budget call circular from MoF. It also reviews and consolidates the departmental and agency proposals by ensuring that the proposals are consistent with the government’s agricultural development policy objectives. The Division then convenes a stakeholder-meeting, which is attended by local NGOs, scientific research institutions, and sector departments and agencies. At the meeting, participants discuss the consolidated budget proposal, and stakeholders provide feedback and 27 Socio-economic development priorities are developed by the Ministry of Economy and Development (MED).
58

comments. The Division finalizes the proposal by taking into account comments from stakeholders. It submits the proposal to the MoF by August 15. The proposal then goes through the cabinet, audit service and finally to parliament for parliamentary discussion and approval.
59
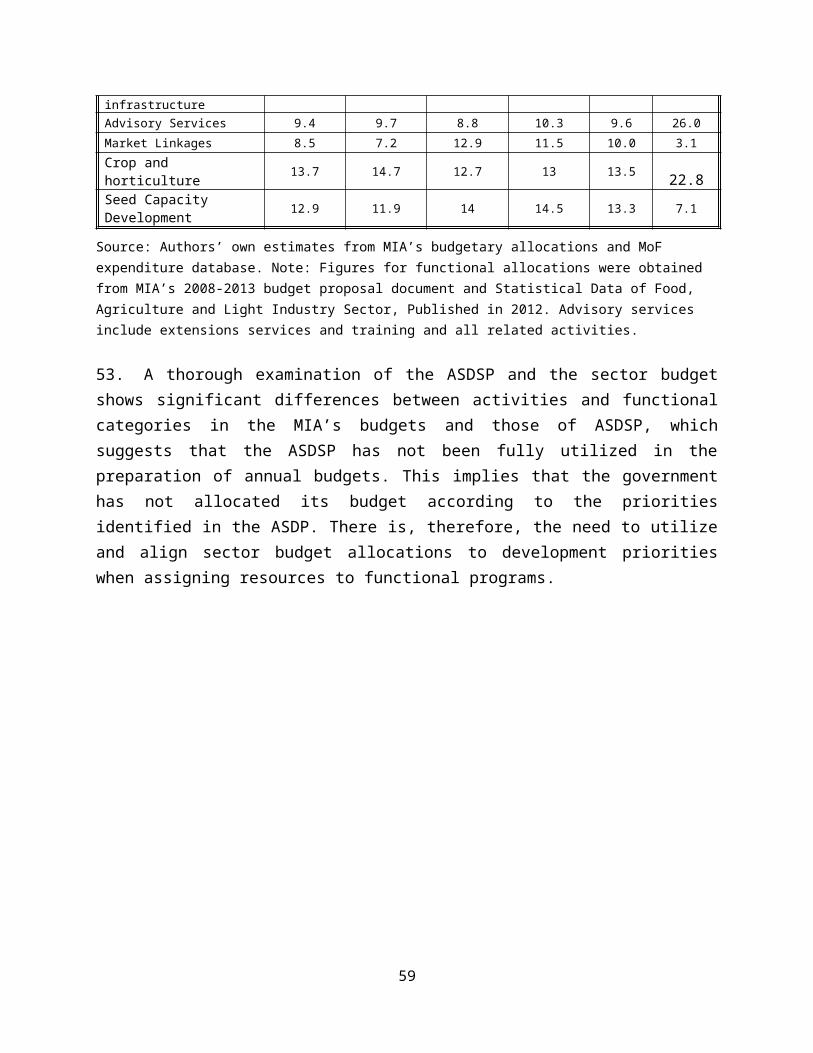
Box 1.The budget preparation process in MongoliaA. Development and approval of Medium-Term Fiscal(Expenditure) Framework
i. The Ministry of Finance (MoF) prepares and submits draft Medium-term Fiscal Framework Statement to Government by April 15th.
ii. The Government discusses and submits the Medium-term Fiscal Framework Statement to the State Great Khural (Parliament) by May 1st.
iii. The State Great Khural discusses and approves the Medium-term Fiscal Framework Statement by June 1st.
iv. The State Great Khural publishes the Medium-term Fiscal Framework Statement within 7 working days after its approval.
B. Development and approval of General Guidelines for Socio-Economic Development priorities
i. The Ministry of Economy and Development (MED) prepares and submits to the Government a proposal on the State General Guidelines for Socio Economic Development by April 1st.
ii. The Government reviews the proposal on the State General Guidelines for Socio Economic Development against the Medium Term Fiscal Framework Statement and submits it to the State Great Khural by May 1st;
iii. The State Great Khural approves the State General Guidelines for Socio Economic Development in its spring session.
C. Development and approval of annual budget ceilingsi. General budget governors (spending ministries) submit their proposal for a
budget ceiling based on the Medium-term Fiscal Framework Statement to MoF by June 10th.
ii. The MoF consolidates and prepares draft budget ceilings for spending ministries and submits them to the Government by June 20th.
iii. The Government discusses and approves spending ministries’ draft annual budget ceilings by July 1st.
iv. The MoF circulates the approved budget ceilings to spending ministries along with the budget call circular by July 5th.
D.Preparation and approval of the State Budget, Social Insurance Fund Budget, and Human Development Fund Budget
i. Direct budget governors (provinces/local agencies) submit their annual budget proposal to the respective central budget governors (spending departments/agencies) by July 25th.
ii. Spending departments/ agencies submit their budget proposals to the respective spending ministers by August 1st.
iii. Spending ministries submit their budget proposals to MoF by August 15th.iv. The MoF consolidates and prepares annual budget proposal and submits it to
the Government by September 15th.v. The Government reviews and submits the annual budget proposal to the State
Great Khural by October 1st.vi. The Government publishes the annual budget proposal within three working
days after its submission to the State Great Khural.vii. The State central audit body presents its opinion on the annual budget proposal
to the State Great Khural by October 15th.viii. The State Great Khural discusses and approves the annual budget proposal by
60

November 15th.
Source: MoF
68. While the process ensures a participatory approach, it is top-down with significantly limited involvement of subnational administrative units. A key problem with agriculture sector budget preparation is that the local administrative units in the aimags and soums are not actively involved in the process, although they submit their respective proposals to MIA. During a discussion with the aimags authorities, they complained that most of their needs are not taken into account in the overall sector budget, when the AgPER team visited the aimags of Tuv and Bulgan. A participatory approach with significant involvement of the heads of aimags would greatly strengthen planning and budgeting at MIA.
69. Development partners’ involvement in the budget process is non-existent. Another drawback of the sector budget preparation process is that major development partners are not involved – which appears to reflect the weak donor coordination noted above. Increasing their involvement and fully taking into consideration their contributions when budget proposals are being prepared will ensure that total sector expenditures are fully captured. It will also allow the government to focus its investments in areas where donor support is limited.
70. In addition to the budget process, the AgPER team examined the 2013 capital and investment budget proposal and noted that all planned programs and activities, including those that would be implemented thorough the LDF, had been allocated resources. However, the team did not ascertain the basis for allocating resources to the programs, although most of the programs are in sector priority areas. In order to ensure investment programs are well-resourced, all of the activities that go into implementation must be properly and realistically costed. Medium Term Expenditure Frameworks (MTEF) are widely used for this purpose, and help to capture the cost of all programs in the sector over the next three years. MTEFs are also used to determine the amount of public sector resources which are required to implement government programs over the medium term while taking into account the constraints
61
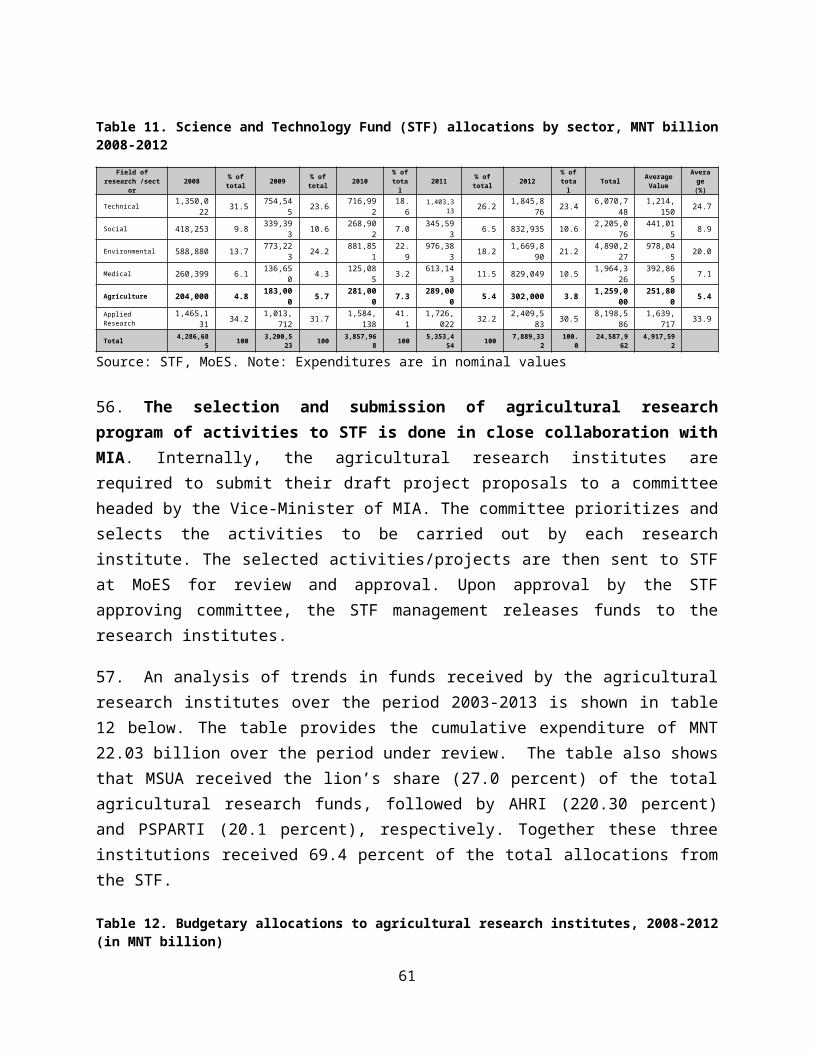
imposed by the fiscal space of a country. They will also help MIA to know its funding gaps, which could be an instrument for securing more donor resources to fill those gaps. At the moment, there is no sector specific MTEF in place and establishing one would greatly help improve resource allocation and expenditure management.
8.2 Budget Execution
71. Budget execution involves all actions required to effectively and efficiently accomplish programs/activities for which resources were requested and approved. The budget execution process, therefore, establishes the relationship between planned and actual expenditures, and provides a measure of effectiveness of public sector resources. The planned/budgeted expenditures provide the basis upon which all government agencies and institutions determine or develop the programs and activities they intend to implement. An analysis of budget execution performance is, therefore, critical to achieving a government’s development objectives.
72. Overall MIA’s budget execution performance is quite good, with most of its annual approved budgets executed. As shown in figure 11 below, trends in MIA’s budget outturns are generally good when actual expenditures of the two main categories of expenditures (current and capital) are compared with approved/budgeted expenditures, although there are predominately under-spending in most of the years, except fiscal years 2005 and 2008, when MIA recorded MNT3.3 billion and MNT23.9 billion overspending, respectively.
Figure 11. MIA's budget execution performance planned vs. actual expenditures, in MNT billion, 2003-2011
Bud
get
Act
ual
Bud
get
Act
ual
Bud
get
Act
ual
Bud
get
Act
ual
Bud
get
Act
ual
Bud
get
Act
ual
Bud
get
Act
ual
Bud
get
Act
ual
Bud
get
Act
ual
2003 2004 2005 2006 2007 2008 2009 2010 2011
0.0
200.0
400.0
600.0
800.0
1000.0
1200.0
Current Expenditure Capital Expenditure
Expe
nditu
re (i
n bi
llion
s MNT
)
62
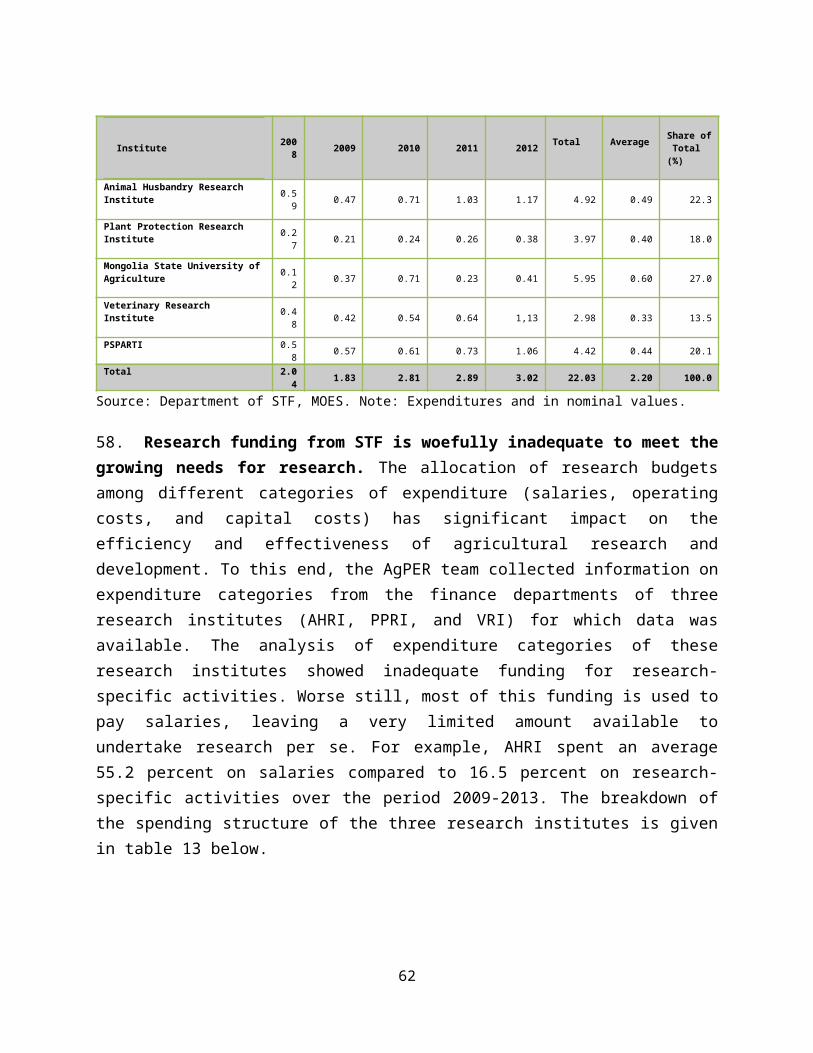
Source: Authors’ own estimates from MoF expenditure database. Note: Actual expenditure figures for 2012 and 2013 were not available at the time of the review.
73. Further breakdown of the two categories of expenditures provides a clearer picture of MIA’s budget execution performance. Current expenditures are split into salaries and operational expenditures, and are compared with capital expenditures over the period 2003-2011 (Table 17). Overall, the Ministry exhibited significant underspending of individual budget items. In terms of budget outturns, an average MNT31.07 billion was underspent in most of the years under review. However, the Ministry recorded high budget execution rates with an average of 94.5 percent of its total budget over the review period. The reasons for the causes of the underspending were not clear, but they could be attributed to weak capacity for accounting and reporting of expenditures at both MIA and aimag levels for current expenditures. For capital expenditures, delays in the procurement of goods and services coupled with weak capacity at the local level could be the underlying factor.28
28 According to MIA’s 2013 capital/investment budget proposal, procurement activities commence in March 2013.
63

Table 17. MIA's Budget execution performance, 2003-2011
Expenditure Category
Allocation/Approved budget(MNT billion)
Outturn(MNT billion)
Over spending/under spending
Budget Execution rate
(%) (Outturn/
Total approved budget)Amount
(MNT billion) % of Allocation2003
Salaries & Wages 546,743.7 486,692.0 (60,051.7) (0.12) 1.00
Operational 27,427,377.2 24,934,827.9 (2,492,549.3) (5.11) 51.12
Capital 20,800,482.6 19,364,695.2 (1,435,787.4) (2.94) 39.70
Total (MIA) 48,774,603.5 44,786,215.1 (3,988,388.4) (8.18) 91.82
GoM 612,069,485.3 650,970,690.3 38,901,205.0 6.36 106.362004
Salaries & wages 697,975.0 669,702.2 (28,272.8) (0.05) 1.23
Operational 29,809,618.0 29,523,454.0 (286,164.0) (0.53) 54.35
Capital 23,817,887.2 23,523,571.8 (294,315.4) (0.54) 43.30
Total (MIA) 54,325,480.2 53,716,728.0 (608,752.2) (1.12) 98.88
GoM 794,752,126.9 800,494,457.2 5,742,330.3 0.72 100.722005
Salaries & wages 733,669.2 699,500.4 (34,168.8) (0.06) 1.27
Operational 30,648,527.1 33,941,093.3 3,292,566.2 5.99 61.70
Capital 23,624,215.0 26,675,402.0 3,051,187.0 5.55 48.50
Total (MIA) 55,006,411.3 61,315,995.7 6,309,584.4 11.47 111.47
GOM 853,830,211.9 822,988,814.0 (30,841,397.9) (3.61) 96.392006
Salaries & wages 1,005,765.8 976,096.0 (29,669.8) (0.04) 1.36
Operational 31,848,738.1 31,251,517.6 (597,220.5) (0.83) 43.58
Capital 38,853,964.6 40,809,656.2 1,955,691.6 2.73 56.91
Total(MIA) 71,708,468.5 73,037,269.8 1,328,801.3 1.85 101.85
GoM 1,279,702,899.81,234,222,866.
9 (45,480,032.9) (3.55) 100.962007
Salaries & wages 1,421,184.2 1,371,133.1 (50,051.1) (0.03) 0.96
Operational 41,056,249.6 39,102,037.6 (1,954,212.0) (1.36) 27.27
Capital 100,918,216.0 86,273,718.0 (14,644,498.0) (10.21) 60.16
Total(MIA) 143,395,649.8126,746,888.
7 (16,648,761.1) (11.61) 88.39
GoM 1,917,346,914.41,844,388,641.
9 (72,958,272.5) (3.81) 96.192008
Salaries & wages 2,986,082.6 3,216,614.5 230,531.9 0.07 0.95
Operational 126,538,851.1 150,230,150.3 23,691,299.2 7.00 44.41
Capital 208,765,314.4 188,790,288.2 (19,975,026.2) (5.90) 55.81
Total (MIA) 338,290,248.1342,237,053.
0 3,946,804.9 1.17 101.17
GoM 2,822,714,359.21,919,414,544.
1(903,299,815.1
) (32.00) 68.002009
64

Expenditure Category
Allocation/Approved budget(MNT billion)
Outturn(MNT billion)
Over spending/under spending
Budget Execution rate
(%) (Outturn/
Total approved budget)
Amount(MNT billion) % of Allocation
Salaries & wages 3,522,881.1 3,415,714.3 (107,166.8) (0.03) 1.06
Operational 176,144,581.2 124,233,695.3 (51,910,885.9) (16.10) 38.53
Capital 142,771,527.0 119,800,803.0 (22,970,724.0) (7.12) 37.15
Total (MIA) 322,438,989.3247,450,212.
6 (74,988,776.7) (23.26) 76.74
GoM 2,601,263,565.82,020,531,552.
2(580,732,013.6
) (22.32) 77.682010
Salaries & wages 3,910,264.3 3,952,888.5 42,624.2 0.01 0.77
Operational 185,720,968.0 170,191,794.2 (15,529,173.8) (3.02) 33.08
Capital 324,808,675.4 308,400,650.6 (16,408,024.8) (3.19) 59.95
Total(MIA) 514,439,907.7482,545,333.
3 (31,894,574.4) (6.20) 93.80
GoM 3,432,195,554.32,590,863,526.
0(841,332,028.3
) (24.51) 75.492011
Salaries & wages 4,646,051.0 4,670,889.2 24,838.2 0.002 0.40
Operational 404,884,895.0 295,546,192.2 (109,338,702.8) (9.45) 25.54
Capital 747,653,031.4 693,877,601.3 (53,775,430.1) (4.65) 59.96
Total (MIA) 1,157,183,977.4994,094,682.
7(163,089,294.7
) (14.09) 85.91
GoM 5,316,996,616.13,955,720,117.
5(1361,276,498.
6) (25.60) 74.40AVERAGES
MIA (2003-2011)
300,618,192.87269,547,819.
88(31,070,372.99
) (5.55) 94.45
GOM (2003-2011)
2,181,207,970.41
1,759,955,023.34
(421,252,947.07) (12.04) 88.46
Authors’ own calculations based on expenditure data from MoF. Note: Actual expenditure figures for 2012 and 2013 were not available at the time of the review. Figures in parenthesis show under-spending. All figures are in nominal values. Note: AgPER team could not obtain reasons for sharp increases in some of the GoM expenditure.
74. As noted earlier, expenditures for the analysis of the above budget execution performance were aggregate figures obtained from the MoF. The FID of DSPP does not have detailed actual expenditure records by department and agency within MIA, or by program and subsector. This situation made it difficult for the AgPER team to undertake an in-depth analysis of budget execution performance by department, agency or subsector. No concrete explanation was given for the lack of actual spending figures by department or agency. There is a need to document and analyze sector expenditures by department, agency and subsector to allow for proper tracking and monitoring of budget outcomes at all levels.
65

75. New staff needs to be hired to work on day-to-day planning, budgeting, and expenditure management in order to improve financial management and analytical capacity. The inability of FID to carry out detailed analysis of budget execution performance is attributable to lack of analytical expertise in financial management among the staff of the Division. In addition to leading the sector budget preparation process, the FID is responsible for compiling, documenting, reporting, analyzing, and accounting for actual expenditures from departments, agencies and unit offices in the 21 aimags. However, it lacks staff with the requisite analytical skills mix to analyze budget execution performance that would provide useful information to senior management for decision-making. The lack of analysis of budget execution performance moreover means that no execution issues are taken into account in the following fiscal year’s budget preparation process. Evidently, the overall financial management capacity of the division is weak. Staff currently consists of six members, including the head of the division working on various tasks on planning, procurement, documenting, and otherwise accounting for actual expenditures. Interviews with the Division staff found that annual planning and budgeting is fairly good compared to documentation, accounting, and reporting of core sector expenditures. Linkages between the planning staff and the staff who work on actual expenditures are limited, making it difficult to carry out proper budget execution performance analysis (analysis of budget outturns and budget execution rates). The lack of detailed analysis on budget execution performance also precluded the AgPER team from obtaining information on key components of budget execution (obligation, commitment, and payment).
76. There is also limited information flow between the FID and various departments and agencies, including the aimag units in terms of budgeting and expenditure management. This situation has hampered reporting and accounting for actual expenditures resulting from implementation of programs and activities at the departmental and aimag levels. Available expenditure figures obtained from FID are not only limited by period (2008-2013), but also by several gaps relating to actual expenditures, with some years virtually unrepresented by any figures. Moreover, the Division documents most of its expenditures by economic classification. The reporting and accounting for expenditures by economic classification is useful, particularly for the purpose of reporting to the
66
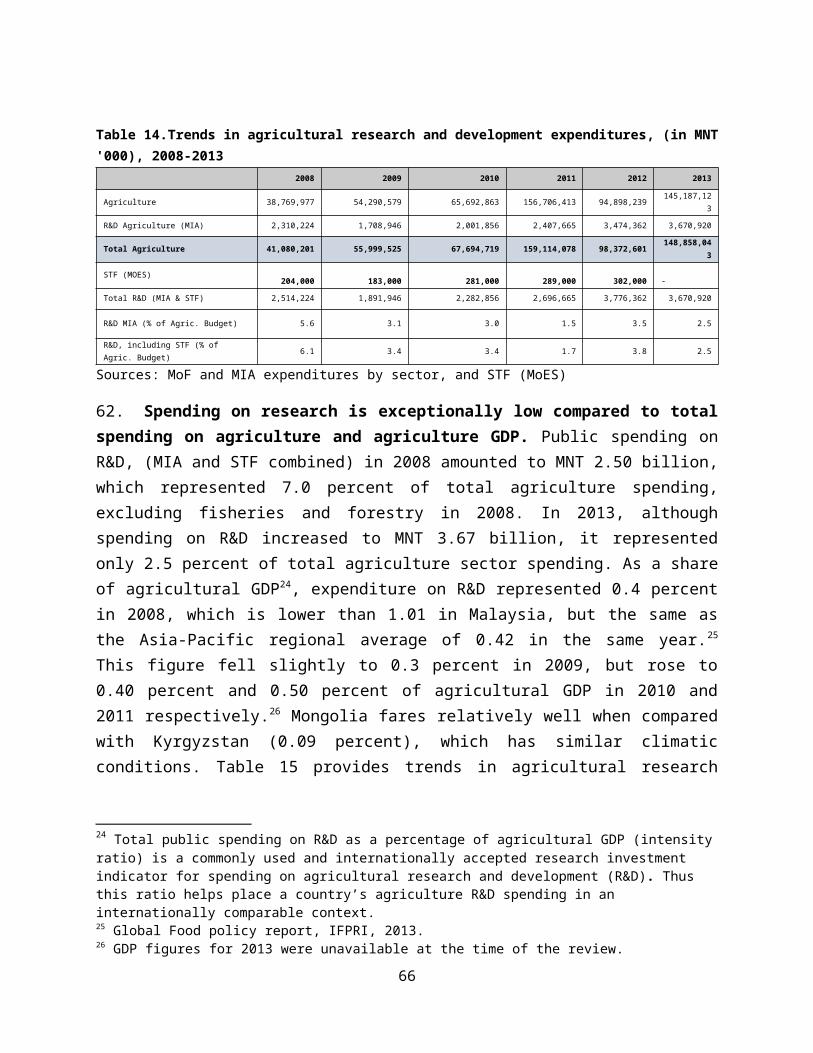
Treasury, but it does not provide incentives for ascertaining what has actually been spent by departments and agencies in the sector and on which programs. The need to include program budgets as well as departmental budgets in the annual budget proposals is of paramount importance. There is also the need to document actual expenditures by department and agencies in order to properly account for what has actually been spent by all departments and agencies in the sector, and measure the impacts of programs’ implementation.
77. Linkages between the FID and the Monitoring, Evaluation and Internal Audit Department (MEIAD) are weak. There is no indication of clear linkages between the MEIAD and FID in terms of sharing data on expenditures and on the physical progress of sector program. This situation undermines proper documentation and accounting for expenditures; and therefore, analysis of budget execution performance. The MEIAD should be in a position to provide the requisite information on physical progress of projects to FID staff who works on analysis of budget execution performance, and vice-versa. Ensuring that these two departments work in concert with each other will improve transparency, accountability, and ultimately MIA’s budget outcomes and performance.
8.3 Budget outcomes monitoring
78. Budget outcome and performance monitoring and evaluation is inadequate. International experience shows that the size of budgetary allocation (resource envelope) to a particular sector ministry depends not only on the macroeconomic fiscal situation of a country, but also on the spending levels and budget execution performance of the Ministry. Typically, if a sector ministry underspends its budget and does not provide evidence of achievements of its programs’ implementation, the MoF reduces its budget for the following fiscal year. Against this backdrop, the review sought to investigate MIA’s current budget outcome monitoring and evaluation situation by engaging in discussion with senior management of the MEIAD. The review noted that overall the implementation of programs and activities at all levels are not effectively monitored and evaluated.
79. In principle, monitoring and evaluation of budget outcomes is carried out by the MEIAD. The principal functions of the department are to: (i) conduct monitoring and evaluation of implementation of all programs and activities in the sector; (ii) review policy documents and report to the
67

government on the status of implementation of policies and programs; (iii) monitor the activities of all departments and agencies, the 21 aimags, and 335 veterinary units in the soums. In addition to these functions, the department has been handed budget execution performance monitoring as an additional function in 2013 following the implementation of the IBL.
80. The AgPER team’s investigation revealed no significant budget performance/ outcomes/impacts assessment done by the department over the past year. The department is constrained by the lack of the personnel required to effectively carry out the above-mentioned functions. Currently there are only ten staff members, including the Director General, working in the department. Field work is supposed to be carried out by the nine personnel, but given the increased workload resulting from their additional mandate of covering every part of the country, they are not able to effectively undertake the evaluation task. In this regard, they conduct what is known as “spot checks” by selectively evaluating a few programs. This approach does not really provide detailed and concrete evidence of budget outcomes and performance in the sector. Nor is this approach based on the widely acceptable norms for evaluating programs: relevance, effectiveness, efficiency, and sustainability. To enable the department to carry out its functions as required, additional staff who are endowed with the requisite skills and expertise in conducting program monitoring and evaluation is required. New divisions also need to be formed within the department in order for responsibilities to be distributed rationally, and where possible, place program monitoring and evaluation personnel in the aimags to carry out specific tasks in specific geographical areas to ensure effective monitoring and evaluation of sector programs/activities.
68

9 EFFECTIVENESS AND EFFICIENCY OF SECTOR EXPENDITURES
81. A detailed analysis of technical efficiency of sector expenditures was not undertaken due to the short duration of the field work, coupled with the dearth of data in MIA. To this end, the AgPER team depended basically on expert opinion through discussions with sector authorities, and a review of available literature on program outcomes, in particular those that pertain to livestock disease control program and infrastructure projects (e.g. irrigation and wells).
82. A visit to the aimags of Tuv and Bulgan clearly found that while the GoM’s spending on vaccinations and animal disease response is in the right direction, the extent of spending on these important interventions requires further assessment. The GoM uses a public-private partnerships (PPP) approach to carry out its vaccination and veterinary services program at the soum level. Government supplies the vaccines free of charge and the private veterinary units provide the services. The agricultural authorities in the aimags establish contracts with the private service providers in the soums (see annex 3). Upon successful completion of their services, the aimag authorities approve and authorize payment for the services rendered. A discussion with the aimag authorities to ascertain whether there is a proper monitoring mechanism in place yielded mixed results. While in Bulgan, a monitoring system, which tracks progress down to the herders, has been established, in Tuv aimag, there is no such a system in place.
83. The vaccination program has helped increase livestock production, but spending patterns have not been properly documented and accounted for. Available expenditure data show that outlays on vaccines, veterinary services, and contracted services together constituted a substantial proportion of current expenditures (about 11.2 percent in 2012 and 2013). The veterinary services budget pays for infectious, parasitic, Foot and Mouth Disease (FMD), and disinfection and sanitization. Vaccines, medicines, and service fees (payment to private service providers) are paid centrally for the services of private veterinarians who are responsible for treating infectious diseases, while herders pay for veterinary service fees for parasitic diseases. The increase in livestock
69

production in recent years suggests that this strategy seems to be working fairly well. For example, gross livestock output/MNT has increased to MNT 1,505.7 billion in 2011, after falling from MNT 1,307.7 billion in 2009 to MNT 1,290.7 billion in 2010 due mainly to the dzud weather effect. Average survival rates per 100 female breeding stocks have rebounded after falling from 376 per head in 2009 to 212 per head in 2010 (see annex 1).29 But the increased output has not been matched with proper documentation and accounting for vaccination program expenditures, making it difficult to measure the real impact of public expenditure on the program. As shown in section 5.1 above, vaccines expenditures, one of the components of animal care services, have not been properly documented since 2008. The team could not track where those expenditures were recorded at either MIA or MoF. This could be attributed to weaknesses in financial management and reporting systems at MIA. MIA must improve its accounting, recording, and reporting systems to ensure that expenditures of such important programs are well documented and accounted for.
84. Lack of central-local accountability and coordination is a significant constraint to technical efficiency. A review of available reports also unearthed the following issues: (i) lack of central-local accountability; (ii) poor local ownership of central government programs; and (iii) seemingly weak communication and coordination between the central ministry and its offices in the aimags and soums. These factors have contributed to poor implementation of programs at the local level. The budget is formulated and paid for by the central government, which usually do not have the best information about the needs at the local level. This situation does not create incentives for the local governments to be accountable for undertaking the tasks at minimal costs. This issue is crosscutting as it is common in other sectors as well, and is mainly due to top-down and vertical reporting structure of the intergovernmental fiscal systems (World Bank, 2009). It is expected that the new IBL will address most of these issues as the local governments are now given more fiscal responsibilities.
85. Another constraint to technical efficiency that must be addressed by MIA and the local governments is the delays in executing infrastructure projects. The execution of most of MIA’s infrastructure projects is characterized by considerable delays. The 29 Statistical Data of Food, Agriculture and Light Industry Sector, MIA, 2012
70

procurement process does not start early enough in the year and it takes some time before activities are accomplished. Delays are caused by a lack of quality appraisals and feasibility studies, including a lack of proper coordination between project design, preparation and implementation between MIA and the aimags authorities. Limited operational expenditure allocations to technical staff at aimag and soum levels also account for ineffective supervision of projects leading to low quality of work. In spite of these challenges, significant progress has been made in the provision of infrastructure such as irrigation and wells, which have helped increase crop production (see annexes 1 and 2 and section 3 above). To sustain development outcomes resulting from increased investment in infrastructure, MIA must take corrective measures to reduce delays and improve project implementation.
71
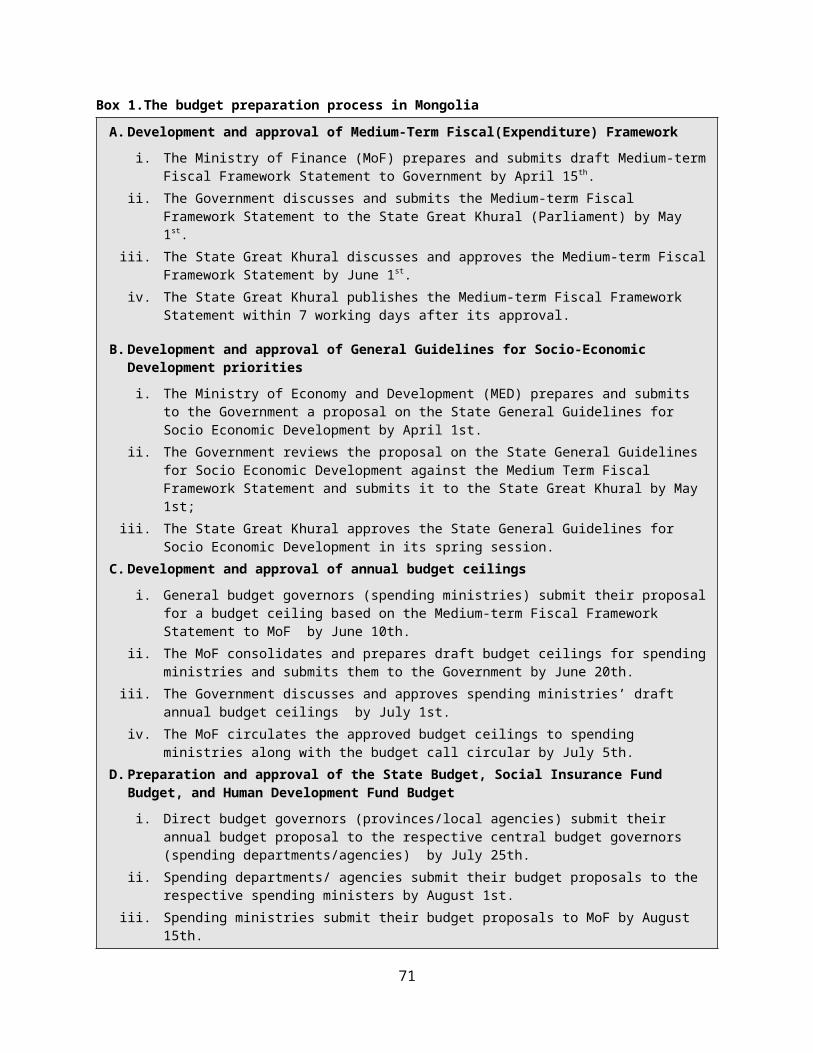
10 CONCLUSIONS AND POLICY RECOMMENDATIONS
86. This review summarizes the key issues constraining effectiveness and efficiency of public expenditures in Mongolia’s agriculture sector. These include, among others, limited levels of funding for agriculture despite its significant contribution to the economy; limited O&M expenditures, which does not match growth in capital/investment expenditures; lack of funding for R&D development and extension services; limited financial management capacity of staff of FID; inadequate staffing levels for the MEIAD, which has constrained the department’s ability to carry out effective monitoring and evaluation of sector programs; weak donor coordination; and limited involvement of the local authorities in the planning and budgeting of sector programs. Despites these weaknesses, there is evidence of the impacts of government spending on some key programs such as the livestock disease control program and investment in agriculture equipment and irrigation. Livestock mortality has declined and continues to fall. Production of major crops, which has been supported by government investment in irrigation and equipment, has increased consistently since 2008, and overall gross agricultural output continues to increase. MIA must urgently address the aforementioned issues and constraints to continuously increase output, and hence achieve its development objectives. Upon the basis of the above identified issues/constraints, we recommend the following.
Increase agriculture’s share of the national budget relative to other key sectors. The review showed that agriculture receives a disproportionately small percentage of the national budget relative to other key sectors, despite its huge contribution to the national output and GDP. The GoM needs to substantially increase agriculture’s share of the national budget to enable it to continue to play its catalytic role as a key contributor to national output.
Strike a balance between capital and recurrent budget by substantially increasing the O&M budget. The review showed that the GoM has increased investments in the sector by significantly increasing capital expenditures, but noted that O&M budget is inadequate to sustain the current investments in the sector. While there are no standard levels of allocation for O&M, the GoM needs to
72

consider increasing allocations to O&M because at current levels, the O&M budget could undermine the sustainability of investments in the sector.
Strike a balance between budgetary allocations to subsidies and transfers, on the one hand, and goods and services on the other. A review of the components of current expenditures shows that subsidies and transfers constitute the bulk of current expenditures compared to salaries, goods, and services. To improve services delivery, the GoM should increase allocations to goods and services, while having clear strategies for subsidies, and an exit strategy and a review of the efficiency of those subsidies in correcting market failures to achieve the desired goals.
Increase the budget for core public goods and improve funding flow to the agricultural research institutions and the extension agency. The review unearthed limited funding for R&D and extension services in Mongolia. Mongolia needs to substantially increase funding for these important public goods (R&D and extension services) because they are vital for new agricultural technologies, and they create the enabling environment for increased private sector investments in agriculture. The flow of funding to the research institutes also needs improvement by reviewing the composition of the STF approval committee members as well as its processes. The approval committee also needs to meet regularly and on time to ensure that research institutes are well-resourced to carry out their duties effectively.
Strengthen the financial management capabilities of FID staff and budget managers. The review identified weaknesses in recording, analyzing, and accounting for sector expenditures. This has led to a lack of financial data on past expenditures, in particular actual expenditures that are needed for the analysis of budget and program execution performance. Actual spending by departments, agencies, and provincial offices are, by and large, not properly documented. MIA needs to organize frequent training programs, including on-the-job training, in financial management and expenditure data analysis to help improve and upgrade financial management and analytical
73
skills and expertise of FID staff, including all budget managers and heads of aimag offices.
Improve budget outcome monitoring and performance. The review identified the important role played by the MEIAD. The department has been overwhelmed with a heavy workload, but it has very limited staff to carry out such a huge task bestowed on it. In order to improve budget outcome and performance, the department must be adequately resourced with staff that possess skills and expertise in program monitoring and evaluation both at MIA and aimag levels.
Sponsor regular training and capacity building interventions to upgrade the skills of MEIAD staffs. To improve budget monitoring and performance, MIA must build and maintain highly skilled staff able to conduct monitoring and evaluation of programs by using the widely-accepted standard monitoring and evaluation criteria: relevance, effectiveness, efficiency, and sustainability. This will require it to organize frequent training programs, including on-the-job training for the MEIAD staff to deepen their monitoring and evaluation skills that would enable them to effectively carry out their duties and inform decision-making.
Improve donor coordination and engagement in the sector. The review revealed that MIA has made significant progress in improving donor coordination and relations in recent years, but more efforts must be made on this front. This will require involving key donors in the planning and prioritization of sector investments, including the sector budget preparation process. An ideal approach is to establish a “Sector Working Group” chaired by the DG of Planning and Strategic Policy Directorate of MIA. It will consist of representatives of all stakeholders, including development partners and the heads and managers of the aimag offices. The working group could be tasked with the responsibility of conducting annual sector reviews as well as leading and undertaking the annual planning and budgeting process. The annual sector review will inform the planning and budgeting process.
Conduct a value-for-money analysis to extensively document
74

program impacts and outcomes. In order to obtain a clear picture of the quality of spending, and to inform decision-makers about program impacts, a detailed technical efficiency (value-for-money) analysis, either through a Public Expenditure Tracking Survey (PETS) or Benefit Incidence Analysis (BIA) needs to be conducted. This will provide senior management with information about where the money is going and about program impacts on beneficiaries at all levels.
Improve planning and budgeting by developing and implementing a sector MTEF that would detail the cost of programs at all levels and show funding requirements. The review found it difficult to determine the basis for allocating sector resources to investment programs. This problem will be resolved with the development and implementation of a sector MTEF that captures all funding sources and requirements. MIA, therefore, must develop a sector specific MTEF to enable it to improve its resource allocations.
Establish an effective mechanism for monitoring disease control and vaccination programs in soums. The review identified weaknesses in the current system of monitoring the vaccination program at soum level, based on discussion with the authorities in two aimags. While two out of 21 aimags cannot be said to be an adequate sample, MIA needs to review the current contracting and monitoring mechanism in place in all aimags. The review should aim at ascertaining the effectiveness of service delivery, including the extent of documentation, recoding and reporting of program expenditures, particularly outlays on vaccines.
75
REFERENCES
Agricultural Sector Development Strategy Paper, Volume I, Ministry of Industry and Agriculture, November 30th 2006
Budget Outturns, Ministry of Finance, Mongolia, 2012
Cambodia: More Efficient Government Spending for Strong and Inclusive GrowthIntegrated Fiduciary Assessment and Public Expenditure Review (IFAPER), Poverty Reduction and Economic Management Unit, East Asia and Pacific region, World Bank, November 30 2011
City Finances of Ulaanbaatar Mongolia, Report No. 72514-MN, Sustainable Development East Asia and Pacific Region
Dillon A., Shama M., and Zhang X. “Estimating the Impact of access of Infrastructure and Extension Services in Rural Nepal”2011
Draft Budget Proposals for the year 2011 and 2012, Ministry of Finance, Mongolia
Draft Medium Term Expenditure Framework 2014-2016, Ministry of Finance
Fan S., Hazell P., and Thorat S.: “Government Spending, Growth and Poverty: an Analysis of Interlinkages in Rural India” EPTD Discussion Paper No. 33, IFPRI, Washington D.C., December 1998.
Gert-Jan Stads, Mohammad H. Roozitalab, Nienke M. Beintema, and Minoo Aghajani, Agricultural Research in Iran policy, Investments, and Institutional Profile, ASTI Country Report, October 2008, IFPRI, Washington DC.
Lkhagvadorj A. An Analysis of the new Budget Law of Mongolia, 2011, National Academy of Governance, Ulaanbaatar, April 26 2012
Mongolia Economic Update, April 2013, World Bank, Ulaanbaatar
Mongolia: Consolidating the Gains, Managing Booms and Busts, and Moving to Better Service Delivery, A Public Expenditure and Financial
76
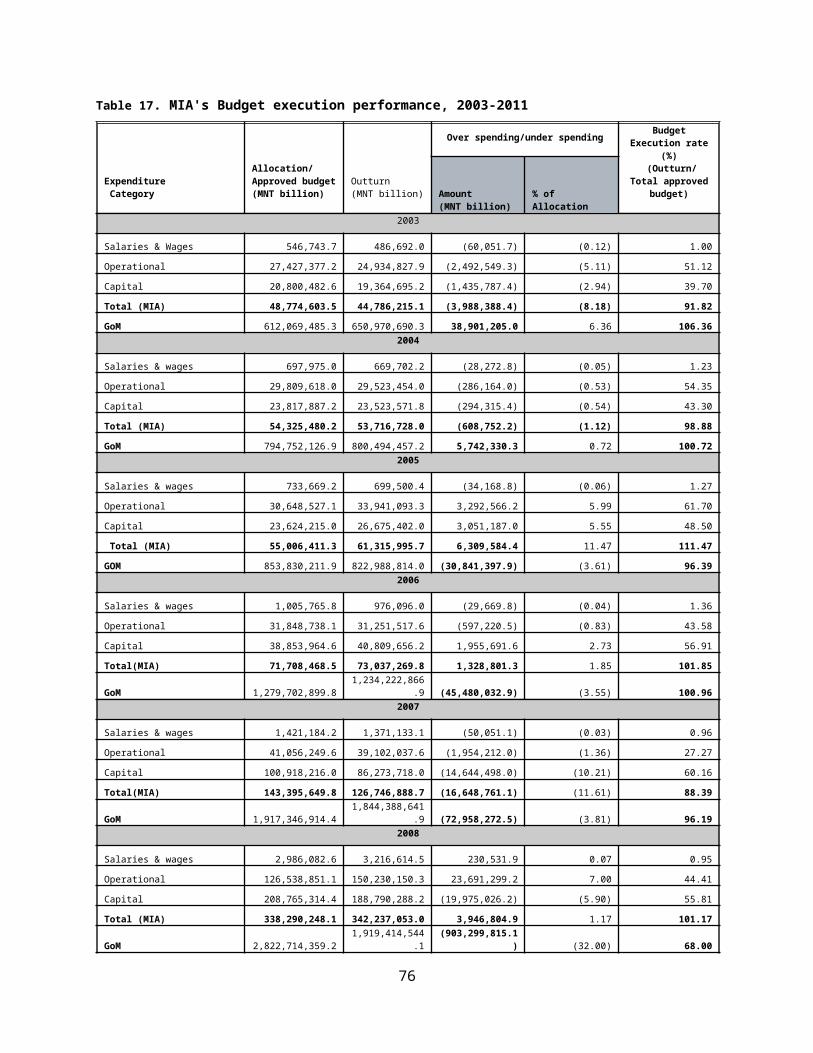
Management Review, Poverty Reduction and Economic Management Unit, East Asia and Pacific Region, World Bank, Volume 1 Core Report. January 2 2009.
Mongolia, 2012 Article IV Consultation and Third Post-program Monitoring, IMF Country Report No. 12/320.
Mongolia: International Monetary Fund (IMF) staff report, November 2012
Mozambique: Analysis of Public Expenditure in Agriculture, Volume I: Core Analysis, Agricultural and Rural Development Unit, Sustainable Development Department, Country Department AFCS2, Africa Region, World Bank, February 19, 2011
National Statistics Office, Monthly Bulletin of Statistics, December 2012, Ulaanbaatar
National Program for Food Safety, Ministry of Industry and Agriculture, 2011, Ulaanbaatar
State Great Hural (Parliament) of Mongolia Resolution, RE: Endorsement of the Millennium Development Goals (MDGs)-based Comprehensive National Development Strategy of Mongolia, February 2008, Ulaanbaatar
Fan S., Linkages Between Government Spending, Growth, and Poverty in India and China, 2007
Pluri-national State of Bolivia: “Agriculture Public Expenditure Review” March 15, 2011, World Bank, Washington DC
Socialist Republic of Vietnam: “VN-Agriculture Public Expenditure Review”, June 6, 2013, EASVS EAST ASIA, Report No: ACS4599
Statistical Data for Food, Agriculture and Light Industry Sector, Ulaanbaatar, 2012
Uganda: Agriculture Public Expenditure Review, February 28 2010, World Bank, Agriculture and Rural Development Unit (AFTAR) Sustainable Development Department, Country Department 1: Tanzania, Uganda and Burundi Africa Region
77

ANNEXES. SOURCE DATA AND PROGRAM IMPACTS
Annex 1. Main Agricultural Output Data
A. Livestock Production
Table 1. Number of livestock in thousands of heads, 2007-2011
Type of animal 2007 2008 2009 2010 2011Camel 260,600 266,400 277,100 269,600 28,000Horse 2,239,500 2,186,900 2,221,300 1,920,300 2,112,900Cattle 2,425,800 2,503,400 2,599,300 2,176,000 2,339,700
Sheep16,990,10
0 18,362,300 19,274,700 14,480,400 15,668,500
Goat18,347,80
0 9,969,400 19,651,500 13,883,200 5,934,600
Total40,263,80
0 33,288,400 44,023,900 32,729,50026,083,70
0Source: Statistical Data for Food, Agriculture and Light Industry Sector, MIA, 2012
Table 2. Loss of adult animals in thousands of heads, 2007-2011
Type of Animal 2007 2008 2009 2010 2011Camel 2 3.4 2.9 17 2.4Horse 24.6 122 62.9 369.7 27.6Cattle 27.9 132.9 107.1 581 52.9Sheep 119.9 652.8 681.4 4363.8 284Goat 119.8 729.4 878.5 4988.4 284.4
Total 294.2 1640.5 1732.810319.
9 651.3Source: Statistical Data for Food, Agriculture and Light Industry Sector, MIA, 2012
Table 3. Number of intensive farming, 2007-2011
Type of farm 2007 2008 2009 2010 2011Dairy farm 494 412 523 649 901Cattle farm 10 48 94 101 64Meat and wool sheep farm 15 57 107 128 200Pig farm 79 172 135 190 187Poultry farm 111 225 105 148 217Bee farm 40 56 58 68 81Total 749 970 1022 1284 1650
Source: Statistical Data for Food, Agriculture and Light Industry Sector, MIA, 2012
78
79
Table 4. Gross Agricultural output per MNT, 2007-2011
2007 2008 2009 2010 2011Gross agricultural output 1297.5 1691.6 1737.4 1752.5 2053.7Livestock 1124.8 1377.1 1307.7 1290.7 1505.3Crop Production Sector 172.7 314.6 429.7 461.8 548.4
Source: Statistical Data for Food, Agriculture and Light Industry Sector, MIA, 2012
B. Crop Production
Table 1. Sown area per hectare
Type of crop 2007 2008 2009 2010 2011
Cereals 121777153951.
3252389.
8259196.
7299927.
4
Potatoes 11461.5 12291.5 13524 13813.7 15375.6
Vegetables 6134.5 6409.9 6517.9 7032.2 779630
Fodder crops 4939.4 5549.6 3305.5 11133.2 10874
Technical crops 58368 14282 6258 23319.3 10877
Fresh fruit 376.6 888.3 1556 2401.7 4000
Total202729.
3192495.
7282176
8315295.
1 345935Source: Statistical Data for Food, Agriculture and Light Industry Sector, MIA, 2012
Table 2. Production and supply of main agricultural products, 2007-2011
2008 2009 2010 2011 2008 2009 2010 2011Production/t/ Supply/%/
Wheat 209829
.9388121
.9345457
.5435889
.2 55.1 77.5 83.9 98.3
Barley 1394.3 1844.2 4319.6 4362.9 55 62.8 7.7 96.7
Oats 1177.7 1511.5 4349 4339.2 33.8 44 56.5 64.2
Other wheat 492.2 181.1 934.7 1459.2 10.6 7 31.5 40
Potatoes134772
.8 151211167955
.7201638
.9 79.2 86.7 95.6 97.2
Tomatoes 2805.3 1432.1 1565.6 2350.1 32.9 34.6 28.1 48.3
Onion and garlic 4221.5 4084.6 5839.9 6088.7 22.8 26.7 28.6 28.7
Cabbage19327.
7 19034 17856208296
.8 48.5 49 41.5 38.2
Carrot and turnip39472.
141857.
746452.
553897.
9 87.3 73.5 82.1 72.5
Cucumber 2845 3075 3384.5 4373.9 40.1 76 70.6 79.6
Melon and pumpkin 6510 4942.1 3875.9 7471 59 75.2 79.7 83.1
Other vegetables 3360.5 3550.4 3325 3895.5 70.1 80.6 62.6 40.9
Source: Statistical Data for Food, Agriculture and Light Industry Sector, MIA, 2012
80

Annex 2. Government Support to Crop Production
Table 1. Number of irrigation systems established and restored with state budget
2008 2009 2010 2011Number of irrigation system 92 59 55 9Irrigated field/hectar/ 8819 5263.3 4276.3 1419Total investment/mln.tog/ 24,787.7 13,738.2 12,162.9 24,63.2State budget 6,404 5,470 5,927.9 2,463.2Investment made by the entities and citizens 18383.7 8268.2 6235 -
Source: Statistical Data for Food, Agriculture and Light Industry Sector, MIA, 2012
Table 2. Irrigated fields, 2011
Cereals PotatoVegetable
Fresh fruit
Fodder crop
Total
Irrigated land/thous.hectar/ 10.7 11.6 7.7 2.6 4.4 46.5Percentage in total crop production 4 78 100 100 41 12Total crops/thous.t/ 19.8 157 106.1 627.7 16.6
Source: Statistical Data for Food, Agriculture and Light Industry Sector, MIA, 2012
Figure 1. Number of tractors and combined harvesters, 2007-2011
486 527
721 732 758701 695
1,040 1,069 1,104
2007 2008 2009 2010 2011
Tractor Combine Harvester
81
Annex 3. Livestock Disease Control Program
1. A Government initiative to control livestock diseases has helped to improve livestock production in recent years. The GoM has invested substantially in the provision of animal care services through its nationwide livestock vaccination program. The Ministry of Industry and Agriculture (MIA) partners with the private sector to implement the program at the soum level. The Government supplies the vaccines free of charge and the private sector provides the services. The agricultural authorities in the aimags establish contracts with the private service providers in the soums. Upon successful completion of their services, the aimag authorities approve and authorize payment for the services rendered centrally at MIA.
2. The program is implemented through laboratory diagnosis and vaccination against contagious diseases. Available data for the period between 2007 and 2011 show that the number of animals that have undergone laboratory diagnosis increased from 5,816 in 2007 to 7,685 in 2008, but fell slightly to 6,718 in 2009. Thereafter, the number of animals covered by laboratory diagnosis increased steadily to 17,150 in 2011. Vaccinations against contagious diseases increased from 786 in 2007 to 1,018 in 2011.
Figure 1. Trends in number of animals covered by preventive activities (2007-2011)
2007 2008 2009 2010 2011
0
2000
4000
6000
8000
10000
12000
14000
16000
18000
20000
786.2 1133.5 922.1 1029 1018
5816
76856718.1
9245.7
17150.3
By laboartory diagnosis By vaccination anti-contagious
Num
ber
of li
vest
ock
per
thou
s. h
ead
Source: Statistical Data for Food, Agriculture and Light Industry Sector, MIA, 2012
3. The program is carried out by veterinarians, para-veterinarian and specialists throughout the country. Currently there is an average of 613 veterinarians, 695 para-veterinarians, and 169 specialists
82

involved in the implementation of the program. Trends in the number of veterinarians and specialists are shown in the figure 1 below.
83
Figure 1. Animal Care Services Workers
617 611 611686 708 690
166 175 167
2009 2010 2011
Veterinarians Para-Veteranarians Specialists
Source: Statistical Data for Food, Agriculture and Light Industry Sector, MIA, 2012Program impact
Figure 2. Trends in animal mortality (Per thousand), 2007-2011
2007 2008 2009 2010 2011
291.4
1640.61732.9
10319.9
651.3
Source: Statistical Data for Food, Agriculture and Light Industry Sector, MIA, 2012
84
Table 1. Average survival rate per 100 female breeding stocks per head. Percent, (2007-2011)
Young animal 2007 2008 2009 2010 2011
Young camels 45.0 50.0 47.0 41.0 47.0
Foals 73.0 60.0 67.0 42.0 72.0
Calves 82.0 72.0 74.0 53.0 73.0
Lambs 89.0 80.0 79.0 45.0 83.0
Kids 87.0 74.0 70.0 31.0 81.0
Total 376.0 336.0 337.0 212.0 356.0Source: Statistical Data for Food, Agriculture and Light Industry Sector, MIA, 2012
4. Government support to intensified farming to boost livestock production increased markedly with total number of intensified farms increasing from 749 in 2007 to 1,650 in 2011. Table 2 provides trends in the number of intensified farming established in the sector.
Table 2. Number of intensified farming (2007-2011)
Intensified farming 2007 2008 2009 2010 2011Dairy farm 494 412 523 649 901Cattle farm 10 48 94 101 64Meat and wool sheep farm 15 57 107 128 200Pig farm 79 172 135 190 187Poultry farm 111 225 105 148 217Bee farm 40 56 58 68 81Total 749 970 1022 1284 1650
Source: Statistical Data for Food, Agriculture and Light Industry Sector, MIA, 2012
85

Annex 4. Agriculture sector subsidies by subsector
Table 1. Trends in agriculture sector subsidies
2008 2009 2010 2011 2012 2008-12 Avg.
Subsidies: Total Ag Subsidies (crop and livestock) 4/
57,300 22,014 26,905 47,583 91,128 48,986
% Change year-on-year - -62% 22% 77% 92% 15%
Crop Sector13,566 16,119 18,359 24,485 40,665
22,639 % Change year-on-
year - 19% 14% 33% 66% 50%Wheat Price
subsidy 11,164 8,665 10,906 14,471 27,830 14,607
% Change year-on-year - -22% 26% 33% 92% 37%
Livestock Sector43,734 5,895 8,546 23,098 50,462
26,347 % Change year-on-
year - -87% 45% 170% 118% 4%Agro-processing
industry subsidies 4/ 2,432 2,460 1,462 21,150 27,406 10,982
% Change year-on-year - 1% -41% 1347% 30% 257%
Total Government subsidies 5/ 122,865 55,441 96,226 175,449 202,842 130,564 % Change year-on-year - -55% 74% 82% 16% 16%
Ag subsidies (crop and livestock) as percent of total subsidies 47% 40% 28% 27% 45% 38%Ag and agro-processing industry subsidies as percent of total subsidies 49% 44% 29% 39% 58% 46%Total Government subsidies 5/ 122,865 55,441 96,226 175,449 202,842 130,564
Total Ag Expenditures (MIA) 2/ (in mill.) 98,803 46,648
106,175 238,968
223,033
142,725
% Change year-on-year - -53% 128% 125% -7% 31% Total Ag Investment Budget (MIA) (in Mill.)
23,000 17,300 10,917 23,670 29,031 20,784
% Change year-on-year - -25% -37% 117% 23% 7% Agriculture R&D Expenditure 3/ (in Mill.)
4,639
4,851
4,189
6,192
7,636
5,502
% Change year-on-year - 5% -14% 48% 23% 16%Notes:1/ 2008 to 2011 are actual expenditures and 2012 is planned budget.2/ Ministry of Industry and Agriculture (MIA) expenditure plus livestock fund for wool and cashmere subsidies, and agriculture subsidy part of the SME loans. Wheat subsidies are already included in the normal MIA budget.
86

3/ This includes R&D budgets reported by MIA, plus the agricultural research expenditure through the Science and Technology Fund under the Ministry of Education and Science. 4/ Estimated subsidies in this study; These do not include the implicit subsidies calculated as the Market Price Support for wheat and wool, i.e. by comparing price received by farmers in relation to the international price.5/ Including Government estimates of energy, transport, enterprises, and other subsidies; however, ag and agro-processing industry subsidies are as estimated in this in this study. 6/ Inflation rate is 12.5%.
87

Annex 5. Sample Aimag Veterinary Services Contract
AGREEMENT WITH VETERINARY AND BREEDING SERVICE UNIT, ERDENEBULGAN CO.,LTD OF SERGELEN SOUM
One. General provision
1.1. Main purpose of this agreement is dedicated to organize veterinary service unit.
1.2. Parties of Agreement should obey the Civil Code, Mongolian law on Cooperative, Law on protection livestock genetic fund and health, Law on Disaster protection, Law on Medicine and medical equipment, Law on Food, Law on Quarantine and control for raw material or products of animal and plant, Law on Labor, Law on Combating livestock robbery and preventative, Regulation on veterinary, sanitation and certification and its usage, Mongolian standard MNS 5368-2:2011 and other regulations.
1.3. Agreement should enter into force since signed and valid for four years.
1.4. Amendment could be entered into agreement based on discussion and to abolish according to legal condition.
Two. Responsibilities of Veterinary unit
2.1. Implement activities “Mongol Livestock” national program and “State policy on herders” in soum level.
2.2. Veterinary unit should obey standard MNS 5368-2:2011 for its operation.
2.3. Note regarding its service on herder household’s livestock health notebook after deliver service.
2.4. Develop general proposal on veterinary preventative activities and treatment based on customer contract and disease condition; and should approve by Governor and deliver to Department of Food, Agriculture and Small, medium industry on time.
2.5. Calculate expenses which requiring to implement activities as described in provision 15.2.2 of Law on Protect livestock genetic fund and health and provision 26.1.4 of Law on Disaster protection; and to
88

present for Local assembly (People’s representatives Khural) for set up into soum budget.
2.6. Implement veterinary service which meets regulation and technology; and evaluate implementation quality by related officer and to deliver working papers to Department of FASMI.
2.7. According to Law on Disaster protection and Law on Protect Livestock genetic fund and health, to work on epicenter of disease in case of occurring livestock infectious or parasite diseases.
2.8. Make diagnosis for animal and its originated products and award origination certificate.
2.9. Cover health control for coming from abroad or transiting livestock for their area.
2.10. The unit should present report on veterinary service, disease, death, condition and other related situation for monitoring by Governor of soum and deliver to Department of FASMI on time.
2.11. Organize activities to earring for cattle, to install chip for horse and certification; and deliver action report to soum Veterinary and breeding service unit for merging into registration.
2.12. Cover to all livestock of nuclear herd, and pure livestock brands of herder households and to deliver report for soum veterinary and breeding service unit before every 1st October.
Three. Rights of Veterinary and breeding service unit
3.1. According to legislation and standard, the unit should implement and organize veterinary activities in its area.
3.2. The unit may operate other industries or services, which not conflicting main veterinary activity.
3.3. Develop proposal and claim relating to agreement responsibilities.
Four. Responsibilities of Soum Governor
4.1. Approve combined order on preventative activities for livestock infectious and parasite disease based on contract between veterinary service unit and herders, disease condition; and deliver to aimag Department of FASMI.
4.2. Set up expenses for activities, which described on provision 26.1.4 of Law on Disaster protection, into soum budget.
4.3. Support veterinary service by policy, to present report and deliver to aimag Department of FAMSI.
89
4.4. Quarantine, announce and implement combating actions in case of occurring animal infectious disease.
Five. Rights of Soum Governor
5.1. Approve combined order of veterinary service in his area.5.2. Organize combating actions in case of spreading infectious disease.5.3. According to the provision 15.4.2 of Law on Protect livestock genetic
fund and health, develop a proposal to give allowance to people, who worked in epicenter of disease, and deliver to related government body.
5.4. Control over activities of veterinary service units through state inspector for veterinary and agricultural specialist in soum area.
5.5. The Governor has a right to claim for agreement parts to discharge their duties.
Six. Responsibilities of Department of FASMI
6.1. Improve service on prevent animal infectious disease, livestock quality and breeding service; and to develop and combine activity expenses, which financing by state budget, for approving by aimag Governor and deliver to professional central organization.
6.2. Set up veterinary service expenses into aimag budget, according to the provision 15.2.1 of Law on Protect livestock genetic fund and health.
6.3. Monitor service report of veterinary units and distribute payments.6.4. Distribute medicine to veterinary service units, according the order, to
monitor spending; to present report and deliver to related organization.6.5. Provide professional methodology for veterinary service units.
Seven. Rights of Department of FASMI
7.1. The department has a right to demand for veterinary service units to operate as described in standard MNS 5368-2:2011.
7.2. Present report and survey on veterinary service and deliver to related organization.
7.3. The department has a right to claim for agreement parts to discharge their duties.
90

Eight. General responsibilities.
8.1. Present agreement implementation within 25th of December.8.2. Parts of agreement should solve arguments based on their discussion.
Nine. Binding effect
9.1. In the case of breach the contract, the guilty part should charge with responsibility.
9.2. In the case of breach the contract, the guilty part should discharge customer’s loss.
9.3. The agreement should enter into force since 1st January 2013.
PartsL.Davaasuren, Head, Department of FASMIT.Gansukh, Soum Governor, Sergelen SoumJargalsaikhan, Director, Veterinary service unit
91
Annex 6. GDP data, (‘000) 2003-2013, NSOSectors 2003 2004 2005 2006 2007 2008 2009 2010 2011 2012
GDP, mln.tog 1 829 072.2
2 361 156.9
3 041 405.7
4 027 558.6
4 956 647.2
6 555 569.4
6 590 637.1
8 414 504.6
11 087 723.8
13 944 238.1
GDP per capita, thous.tog 737.4 941.3 1 199.1 1 568.9 1 905.0 2 480.2 2 449.0 3 072.5 3 979.3 4 859.4
GDP per capita, by World Bank Atlas method, USD 609 747 904 1 128 1 443 1 847 1 855 2 065 2 562 GDP by sectors, mln. tog Agriculture, forestry and fishing 337
272.1 472
934.5 602
136.3 710
609.2 913 409.21 259 660.8
1 177 380.3
1 202 155.6
1 365 115.0
2 066 952.9
Mining and quarrying 206 557.8
391 597.6
642 089.0
1 145 733.9
1 340 854.4
1 324 247.7
1 285 899.7
1 913 040.1
2 329 330.6
2 600 202.9
Manufacturing 121 551.5
130 576.3
175 155.9
218 885.6 309 500.4
430 179.4
425 000.6
539 836.0 665 537.0 869 764.7
Electricity, gas, steam and air conditioning supply
53 680.6 65 426.1 75 928.2 92 897.2 97 309.1 119
968.0 157
422.9 190
211.6 211 955.5 239 747.4Water supply; sewerage, waste management and remediation activities
9 817.5 11 968.1 13 768.9 14 058.4 16 294.7 26 015.0 26 356.8 30 200.2 39 346.3 45 144.8Construction
69 683.8 69 429.0 81 408.4 86 792.3 106 421.1 122
051.0 86 238.7 107
201.6 173 272.4 226 110.7Wholesale and retail trade; repair of motor vehicles and motorcycles 185
210.8 202
639.9 227
478.2 271
511.6 313 204.4 472
226.5 432
646.2 696
502.61 020 944.4
1 298 687.7
Transportation and storage 166 101.2
198 897.0
256 726.4
287 501.5 322 307.0
419 323.2
546 745.5
645 747.5 785 475.4 905 268.4
Accommodation and food service activities
12 633.1 15 024.0 19 341.7 22 994.3 28 806.4 38 971.4 43 680.8 47 522.9 93 348.5 144 392.1Information and communication
62 869.2 75 269.9 96 261.1 100
502.0 166 189.0 221
339.0 215
504.0 245
884.3 295 315.0 369 089.5Financial and insurance activities
74 166.0 97 562.5 112
278.8 116
016.0 155 198.1 236
327.4 212
724.0 239
607.2 381 098.0 502 630.4Real estate activities 125
910.9 137
681.2 160
522.7 173
846.0 186 823.5 345
984.2 479
635.3 554
498.9 768 719.9 880 848.0Professional, scientific and technical activities
14 026.8 15 473.6 18 024.5 27 697.3 36 068.4 76 694.6 65 655.8 69 976.0 101 074.3 127 745.0Administrative and support service activities
23 884.6 27 507.9 34 071.1 33 805.6 51 218.0 98 499.8 88 804.4 88 090.4 128 534.2 163 769.5
92
Sectors 2003 2004 2005 2006 2007 2008 2009 2010 2011 2012Public administration and defence; compulsory social security
50 485.2 58 190.6 66 923.1 117
236.4 141 514.3 247
723.6 267
246.3 303
036.1 366 726.8 593 715.3Education
67 440.5 66 952.3 86 528.6 122
529.6 170 563.4 272
562.3 312
138.4 336
646.3 441 036.0 655 441.4Human health and social work activities
25 173.3 32 606.4 37 516.9 50 752.6 72 616.0 119
817.4 123
042.0 143
194.3 181 390.4 292 737.8Arts, entertainment and recreation 5 930.5 7 314.9 7 744.5 10 206.0 12 980.0 23 211.4 27 876.2 31 064.1 37 609.2 53 279.1Other service activities 12 073.1 14 887.4 15 763.7 18 729.2 23 503.6 27 950.0 24 871.5 26 473.7 38 798.6 48 756.5Net taxes on products 204
603.7 269
217.9 311
737.9 405
253.9 491 866.0 672
817.0 591
767.81 003 615.1
1 663 096.2
1 859 954.0
Source: NSO
93

Annex 7. Data on General Government Expenditure by Sector, 2003-2013, in MNT billions, MoF
Sector
FY 2003 FY 2004 FY 2005 FY 2006 FY 2007 FY 2008 FY 2009 FY 2010 FY 2011 FY 2012 FY 2013
plan actual plan actual plan actual plan actual plan actual plan actual plan actual plan actual plan actualplan plan
Total612,069
,485.3650,970
,690.3794,752
,126.9800,494
,457.2853,830
,211.9822,988
,814.01,279,702,899.8
1,234,222,866.9
1,917,346,914.4
1,844,388,641.9
2,822,714,359.2
1,919,414,544.1
2,601,263,565.8
2,020,531,552.2
3,432,195,554.3
2,590,863,526.0
5,316,996,616.1
3,955,720,117.5
6,991,495,561.8
9,199,752,008.8
GENERAL PUBLIC SERVICES 47,476,
827.858,099,
915.862,107,
052.869,995,
377.965,987,
136.376,570,
867.1120,219,
089.389,472,6
33.8153,219,
830.5196,023,
851.1179,336,
965.9229,719,
315.4231,025,
846.4190,916,
412.8383,237,
147.5378,829,
919.3418,267,
492.0407,073,
100.31,243,38
2,447.41,498,50
3,186.7
DEFENSE 27,795,896.0
27,815,262.3
32,862,789.6
32,798,912.2
35,566,649.2
35,800,090.8
44,709,386.2
45,532,252.9
66,618,097.5
65,979,419.4
90,957,304.2
101,601,095.1
84,487,837.8
84,612,270.0
109,544,322.2
109,128,660.8
154,968,904.8
151,108,512.1
233,627,919.8
258,658,617.9
PUBLIC ORDER AND SAFETY 35,000,
871.235,797,
258.542,903,
084.844,270,
930.948,727,
678.849,866,
248.360,876,7
84.464,387,6
49.2103,402,
965.692,153,7
72.5250,384,
259.7144,485,
749.2132,469,
138.6128,823,
273.3157,963,
214.5157,561,
437.8230,515,
398.9228,530,
273.1307,530,
791.6432,746,
279.4
EDUCATION 118,976
,796.0115,643
,847.3140,183
,650.3141,368
,201.7150,854
,402.0148,122
,840.7192,691,
064.4195,467,
183.9260,805,
158.3254,320,
978.9354,223,
908.7383,483,
844.2409,878,
728.1400,976,
975.6507,180,
231.1490,391,
952.0647,189,
344.4626,420,
076.81,020,07
4,674.01,836,72
9,524.9
HEALTH 62,908,457.9
62,984,338.6
79,278,406.1
78,099,641.1
85,344,479.2
85,008,284.4
104,837,798.9
104,544,772.4
155,526,106.6
163,166,597.4
245,900,733.1
211,707,033.1
266,525,543.1
216,811,499.1
342,474,621.0
250,426,574.2
452,759,192.4
335,745,255.2
623,134,026.3
765,254,021.8
SOCIAL SECURITY AND SOCIAL WELFARE 111,736
,385.4117,732
,918.4145,272
,399.1150,737
,521.8179,835
,262.8185,787
,633.0251,614,
587.9258,207,
536.9384,527,
220.3378,338,
921.6695,213,
748.1308,657,
586.5709,141,
149.6291,827,
896.71,054,33
8,894.3278,171,
546.91,677,68
5,307.7333,193,
578.62,180,52
4,763.81,789,81
5,794.9 HOUSING AND COMMUNITY AMENITIES 3,727,1
08.06,301,9
03.87,064,5
05.89,629,5
69.75,308,9
32.77,967,4
64.55,495,62
9.2978,393.
17,022,16
2.86,123,34
1.49,070,54
7.710,748,8
82.99,088,39
3.0 0.090,050,9
83.891,020,9
71.4123,795,
674.9182,664,
082.756,440,1
21.9115,690,
579.6
RECREATIONAL AND SPORTING, CULTURAL SERVICES 17,002,
204.317,953,
767.520,565,
593.121,120,
501.119,419,
531.720,484,
009.117,786,1
20.817,902,7
70.634,566,8
00.130,899,2
34.243,632,0
56.043,360,5
95.341,762,8
03.340,002,5
56.351,173,8
14.252,338,8
78.280,579,0
80.580,577,3
55.081,862,6
25.2141,064,
673.1 ENERGY, HEATING 16,308,
465.217,385,
014.624,843,
241.524,423,
308.820,586,
368.621,310,
487.338,407,6
91.435,427,5
50.131,740,5
16.134,175,8
20.756,306,8
37.352,124,5
88.137,829,0
80.234,863,3
07.993,117,0
64.387,969,0
18.5181,628,
939.3167,587,
284.0183,755,
753.3178,790,
523.4
AGRICULTURE, FORESTRY 11,244,
318.110,529,
836.812,449,
505.812,763,
701.113,375,
867.314,532,
021.817,857,2
01.517,634,5
50.935,049,4
57.530,032,0
15.278,128,4
80.176,801,3
72.566,077,9
17.763,770,8
80.0116,247,
482.7110,254,
242.0239,795,
314.7221,439,
319.0143,588,
999.8180,994,
482.3 MINING, MANUFACTURING AND CONSTRUCTION 22,149,
733.823,160,
577.026,316,
383.021,329,
109.532,006,
017.222,301,
120.244,885,3
68.937,468,9
91.252,715,0
98.250,141,3
01.085,685,8
01.249,126,1
04.499,706,7
86.981,365,3
15.1218,474,
563.1175,960,
419.4633,285,
429.5612,907,
271.381,380,2
71.8108,919,
529.3
TRANSPORT & COMMUNICATION 1,717,0
59.75,390,7
54.62,703,3
55.76,311,4
34.72,787,7
44.87,979,9
74.133,592,3
06.928,660,6
41.941,179,6
37.842,778,8
92.014,482,6
82.79,933,92
6.830,133,2
10.9197,573,
451.546,350,8
56.546,932,8
90.671,564,3
73.396,784,7
00.582,546,6
12.3212,717,
349.5 OTHER ECONOMIC ACTIVITY 8,763,6
67.410,275,
062.010,893,
228.613,811,
225.211,271,
691.611,630,
901.4119,669,
012.8211,418,
504.5379,415,
020.1340,809,
089.0484,369,
049.089,711,0
54.7274,693,
307.287,174,9
92.4109,617,
428.998,149,3
90.9190,959,
997.3210,953,
561.9180,208,
981.8334,584,
901.4 OTHER UNCLASSIFIED EXPENDITURES 127,261
,694.5141,900
,233.1187,308
,930.7173,835
,021.5182,758
,449.7135,626
,871.3227,060,
857.2127,119,
435.5211,558,
843.0159,445,
407.5235,021,
985.5207,953,
395.9208,443,
823.0201,812,
721.5152,424,
930.2263,727,
624.0214,002,
166.4300,735,
747.0568,437,
572.81,342,64
6,332.2
94
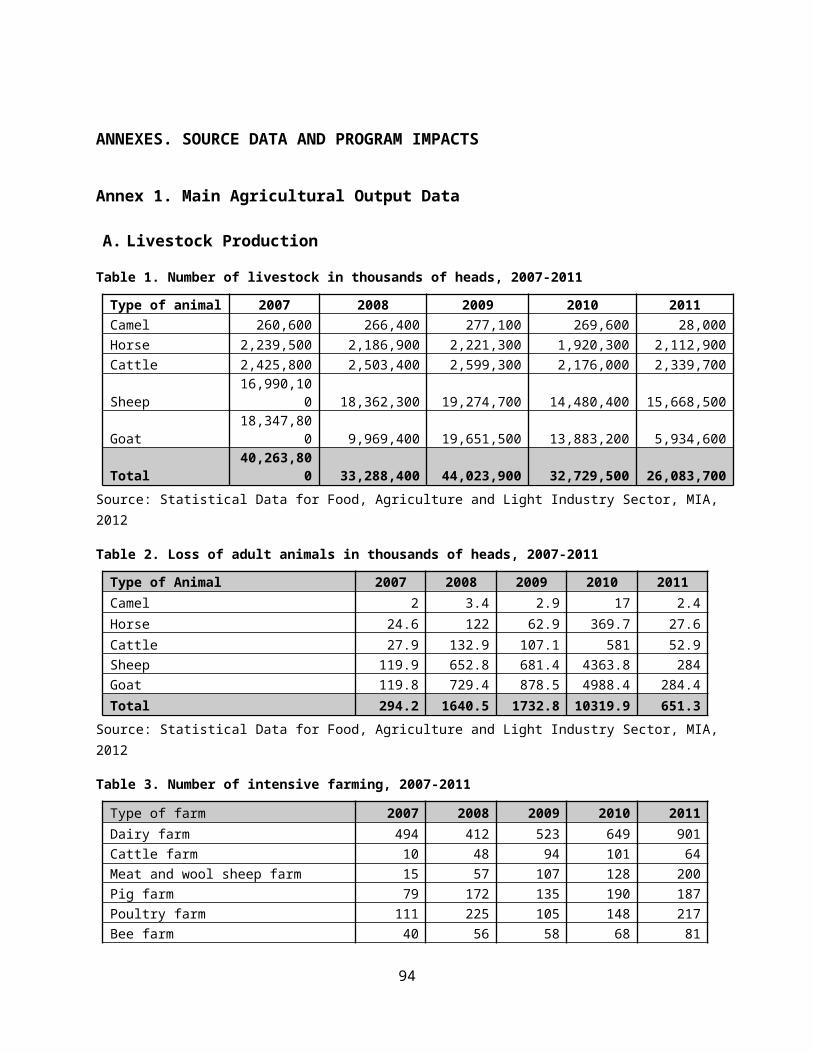
Annex 8. Data on MIA’s Expenditures by Economic Classification, MoF, 2003- 2013 FY 2003 FY 2004 FY 2005 FY 2006 FY 2007 FY 2008 FY 2009 FY 2010 FY 2011
FY 2012
FY 2013
plan actual plan actua
l plan actual plan actua
l plan actual plan actua
l plan actual plan actual plan actua
l plan plan
MINISTER OF INDUSTRY AND AGRICULTURE
9,845,341
9,043,13
3
10,998,9
44
10,940,3
89
11,110,0
08
12,189,2
05
15,152,9
82
14,934,3
09
32,280,0
08
27,331,3
09
71,353,1
57
68,175,7
75
61,046,8
30
44,255,4
89
108,443,63
8
102,614,32
5
236,722,85
9
219,358,22
6
182,005,85
3
287,173,23
4
II,TOTAL EXPENDITURE9,845,3
41
9,043,13
3
10,998,9
44
10,940,3
89
11,110,0
08
12,189,2
05
15,152,9
82
14,934,3
09
32,280,0
08
27,331,3
09
68,471,9
57
66,794,7
75
54,891,7
30
38,284,0
5998,793,638
90,082,727
188,686,35
9
172,713,01
9
212,848,61
2
304,876,75
7
IV, CURRENT EXPENDITURE9,285,3
41
8,437,73
4
10,118,9
44
10,015,0
60
10,407,9
08
11,460,3
81
10,878,9
82
10,667,6
14
14,100,9
08
13,388,7
85
39,764,2
57
48,000,2
19
53,785,4
46
37,460,1
6959,307,938
54,423,081
123,637,45
3
104,016,32
996,661,298
118,675,97
8
Goods and services expenditures9,234,4
06
8,394,64
8
10,080,8
57
9,858,30
4
10,369,3
84
11,405,9
66
10,817,9
53
10,534,7
01
14,037,2
80
12,645,3
29
31,275,7
06
37,576,8
28
34,534,6
92
29,866,7
0942,867,799
39,408,203
51,526,514
74,334,548
37,411,484
50,348,431
Salary, wages and supplementary 546,744486,692
697,975
669,702
733,669
699,500
1,005,76
6976,096
1,421,18
4
1,371,13
3
2,986,08
3
3,216,61
5
3,522,88
1
3,415,71
43,910
,2643,952
,8894,646
,0514,670
,8897,185
,0399,287
,262
Basic Salary 493,010463,823
693,341
669,702
648,792
699,500
1,005,76
6976,096
1,421,18
4
1,371,13
3
2,218,83
3
2,338,75
2
2,500,51
1
2,402,30
42,735
,3612,739
,2553,323
,9763,502
,4015,084
,4566,689
,064
Supplementary 0 04,63
5 084,8
78 0 0 0 0 0 068,1
87 0 0 0 0 01,135
,119 0 0
Salary for structure changes 53,73422,8
69 0 0 0 0 0 0 0 0 03,89
5 0 0 0 0 0 0 0 0
Wages for contracted out services 0 0 0 0 0 0 0 0 0 0569,723
709,669
804,615
835,989
952,551
1,008,052
1,072,615 0
1,697,731
2,078,680
Compensation for transportation and meal 0 0 0 0 0 0 0 0 0 0
197,527
95,845
217,756
177,421
222,352
204,857
249,461
33,369
402,852
519,517
Performance bonuses 0 0 0 0 0 0 0 0 0 0 0 267 0 0 0 724 0 0 0 0
Employers' insurance contribution 144,341131,131
184,265
179,774
193,690
185,932
265,399
260,936
375,191
361,177
298,607
337,560
392,237
366,097
430,130
437,761
519,658
528,887
804,796
1,025,842
Pension and benefit insurance contribution 118,097
108,319
150,762
147,977
158,474
155,719
217,557
224,012
306,979
316,086
238,885
279,077
321,784
296,948
351,925
362,047
426,849
456,348
659,870
840,097
Pension insurance 88,24999,5
45124,938
129,520
131,327
140,402
180,251
200,319
254,391
292,059
209,025
253,325
246,589
233,687
273,719
286,684
325,524
380,150
505,904
650,109
Benefit insurance 8,8743,63
112,5
638,82
513,2
067,34
418,1
2514,8
4225,5
8211,5
4114,9
3012,8
7617,6
2415,2
2119,55
218,96
723,20
217,99
936,14
946,43
7 Industrial accident and occupational disease insurance 4,931
2,215
6,980
5,222
7,337
4,267
10,096
4,651
14,214
6,774 0 0
39,946
32,945
39,102
37,490
54,921
40,933
81,670
97,116
Unemployment insurance 4,4371,83
86,28
24,41
06,60
33,70
79,08
64,20
012,7
925,71
314,9
3012,8
7617,6
2415,0
9519,55
218,90
623,20
217,26
636,14
846,43
7
Salary for structure changes 11,6061,09
0 0 0 0 0 0 0 0 0 0 0 0 0 0 0 0 0 0 0 Health insurance contributions from employers 23,665
22,607
33,503
31,797
35,217
30,213
47,842
36,924
68,212
45,090
59,722
58,483
70,454
69,150
78,205
75,714
92,809
72,539
144,926
185,745
Health insurance for structure changes 2,580 205 0 0 0 0 0 0 0 0 0 0 0 0 0 0 0 0 0 0
Expenditure on other goods and services8,543,3
21
7,776,82
5
9,198,61
7
9,008,82
8
9,442,02
4
10,520,5
34
9,546,78
8
9,297,66
9
11,958,2
21
10,624,1
21
27,991,0
16
33,996,1
41
30,619,5
73
26,084,8
9738,527,405
34,965,414
46,257,153
45,032,518
29,421,649
40,035,327
Stationery 26,01131,0
8540,8
0460,4
9840,1
6941,0
7437,6
9539,4
9340,2
3737,9
3262,4
1353,2
3244,7
4453,4
1353,13
460,97
4202,1
98180,6
7272,24
7120,3
78
Electricity 42,43635,6
8644,6
5334,0
4649,0
0534,9
6254,8
9646,0
2654,8
0146,9
20146,433
117,176
130,122
130,624
204,935
162,727
245,277
156,142
228,204
318,032
Heating 162,368155,543
177,313
169,028
198,697
189,354
221,094
209,014
233,338
217,630
356,458
296,489
342,893
311,744
520,344
412,264
500,481
439,701
485,155
669,998
Fuel and transportation expenses 114,018116,664
140,780
154,758
188,966
179,691
217,594
223,434
251,711
262,214
343,732
419,210
271,700
290,038
285,740
337,758
379,606
430,602
571,208
922,332
Postal and telecommunication 47,38259,3
0772,8
0275,4
2670,9
3974,9
2472,3
9373,5
5973,6
7974,2
41104,988
79,969
66,139
75,531
75,778
82,266
92,084
89,111
103,867
166,974
Water supply and treatment 9,6978,60
415,1
2511,3
8916,9
0212,0
6221,5
1216,9
4921,2
6019,4
4539,4
9427,5
8131,4
1422,0
6838,86
327,21
647,63
337,73
645,45
861,30
3
Domestic business trip 51,55754,9
8874,6
8076,2
8275,3
3865,8
85119,529
114,791
128,342
137,696
203,741
164,255
154,096
167,961
182,780
231,363
262,447
301,631
547,771
770,017
Foreign business trip 15,58011,7
0824,5
8614,2
6723,7
7723,4
2326,5
2830,3
3747,3
3543,3
67113,475
63,230
45,336
22,680
51,675
53,972
27,500
23,103
33,276
59,903
Books and periodicals 2,369 1,99 8,13 9,17 7,85 5,21 6,07 5,58 6,37 5,96 14,8 14,4 2,34 686 1,805 2,102 27,03 1,978 2,652 5,104
95
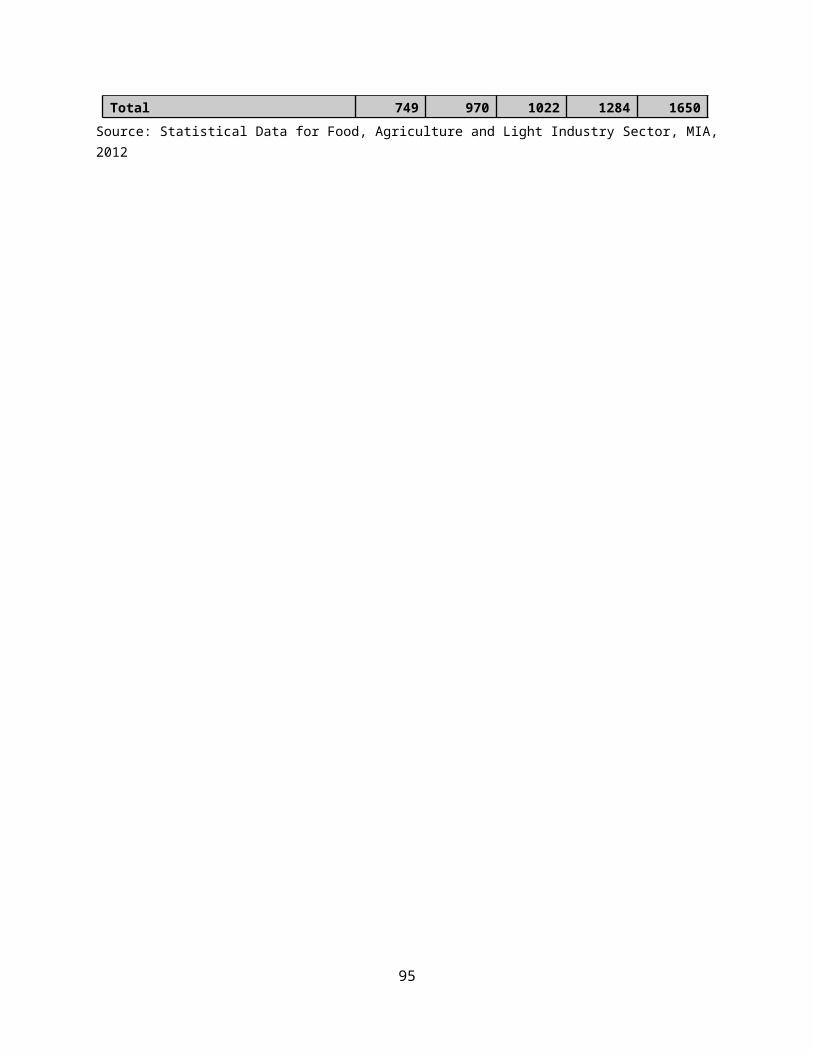
2 8 1 7 0 8 9 8 0 59 13 2 7
Expenses on training and practice 50 7510,0
5725,1
037,74
117,2
979,49
76,54
69,69
7 080,2
6754,0
66 0 0 0 0 0 0 0 2,500
Expenses on scientific research 250 250 0 0 0 0 0 0 0 0 0296,000 0 0 0 0 0 0 0 0
Inventories and materials 14,50029,7
8144,6
76121,657
41,304
58,239
34,965
507,785
25,187
34,263
86,404
135,531
46,371
79,194
49,770
61,591
5,610,146
5,755,442
3,857,563
832,858
Tools 0 0 0 0 0 0 0 0 0 0 02,71
522,1
5751,0
2323,33
421,52
95,087
,6985,236
,4213,528
,671751,6
96
Furniture 0 0 0 0 058,2
39 0 025,1
8734,2
6386,4
04132,816
12,326
17,584 3,675 7,446 0 955
22,600
25,950
Labor safety tools 0 0 0 0 0 0 0 0 0 0 0 01,94
0 864 4,407 3,491 6,500 3,470278,4
23 8,707
Low-cost, short-life things 0 0 0 0 0 0 0 0 0 0 0 09,94
99,72
218,35
329,12
526,00
628,61
227,87
043,00
5
Software 0 0 0 0 0 0 0 0 0 0 0 0 0 0 0 0489,9
42485,9
84 0 3,500
Clothing and bedding 7,6605,87
39,94
26,94
38,15
96,76
37,94
37,63
97,94
37,33
727,1
6436,8
4319,9
6615,5
6426,64
530,69
033,34
539,93
934,14
438,84
4
Food expenses 0 0 0 49 0 375 0 97 0 016,2
4323,2
02 0 0 0 0 0 0 0 0
Medicines & vaccines3,335,9
52
3,189,22
0
3,048,01
3
2,769,30
0
2,858,27
2
2,725,43
8
2,647,70
7
2,522,33
9
3,362,03
6
3,295,69
8
4,898,59
4
4,785,01
0
4,296,86
8
4,293,06
54,825
,3014,817
,84310,944,114
10,935,248
8,627,418
9,459,050
Current renovation 20,75036,9
0040,7
1447,4
5640,3
2066,2
9237,7
9945,1
4646,9
2946,6
63151,564
115,536
90,061
159,736
139,642
216,988
167,806
341,099
224,671
197,596
Charges, fees and other expenses 45,44788,5
25256,263
272,260
238,830
196,440
131,364
201,160
132,624
136,553
176,326
166,263
85,540
308,797
123,523
233,476
7,741,651
7,766,977
211,963
1,464,696
Expenses to organize wholesale network 0 0 0 0 0 0 0
101,439 0
99,950 0
100,020 0 0 0 0 0 0 0 0
Research on economic policy and strategy 0 0 0 0 0 0 0 0 0 0
55,000
55,000
88,480
88,480
88,480
63,140 0 0 0 0
Foreign guest expenses 3,4003,57
37,37
94,32
57,50
54,56
74,50
04,50
67,05
07,05
17,17
5 01,52
04,18
7 1,458 1,46522,72
022,23
9 8,26613,96
9
Sport competition expenses 0 0 0 0 0 0 0 0 0 0 0 0 0 0 0 0 0 0 0 6,900
Usage of telecommunication channel 0 0 0 0 0 0 0 0 0 0 0 0 0 0 0 70 0 0 0 0
Rent and leasing 8,3628,38
214,9
8315,2
122,54
22,15
63,94
23,94
26,59
26,94
610,1
2210,3
3818,7
6022,4
1642,46
247,37
747,21
854,95
043,29
162,28
8
Centralized measures1,078,0
00844,914
1,522,50
0
1,882,29
2
1,429,50
0
1,321,32
4
1,291,67
2
1,564,36
5
1,888,00
0
1,889,19
7
2,102,50
0
10,538,1
07
3,991,06
7
2,215,96
718,001,059
13,820,287
2,363,000
3,074,950
165,879
4,100,000
Measures to fiight crime 0 0 0 0 0 0 0 0 0247,940 0 0 0 0 0 0 0 0 0 0
Land map 0 0 0 0 0 0 0 20 0 50 0 50 0 0 0 0 0 0 0 0
Security Expenses 0 0 0 0 0 0 0 0 0 0 0 0 0 0 0 0 9,000 4,069 5,000 5,000
Service payment 0 0 0 0 0 0 0 0 0 0
1,698,59
8
1,087,84
9 0 0 0 0 0 0 0 0 Undistributed expenses of central budget 0 0 0 0 0 0 0 0 0 0 0
10,000 0
2,500 0 0 0 3,579 0 0
Undistributed other expenses of central budget 0 0 0 0 0 0 0 0 0 0 0
10,000 0
2,500 0 0 0 3,579 0 0
Undistributed local expenses 0 0 0 0 0 0 0 760 0 0 0 0 0 0 0 0 020,00
056,69
9 0
Renovation 0 0 0 0 0 0 0 760 0 0 0 0 0 0 0 0 0 0 0 0
Form printing 0 0 0 0 0 0 0 0 0 0 0 0 0 0 0 0 0 056,69
9 0
Other undistributed expenses 0 0 0 0 0 0 0 0 0 0 0 0 0 0 0 0 020,00
0 0 0
Bank charges 0 0 0 4 0 0 0 2 0 0 0 0 0 485 0 0 0 0 0 0
Arrears from previous year 0 0 0 0 0
1,560,53
8 0 0 0 0 0 0 09,03
4 0 8 0 0 0 0
Plant protection 750,000645,513
750,000
750,555
650,000
649,448
650,000
647,785
1,000,00
0999,996
2,000,00
0
2,000,00
0
1,629,56
1
1,629,56
11,820
,0001,790
,0001,820
,0001,813
,60078,40
01,786
,000
Green revolution program 70,000103,312
150,000
166,786
120,000
148,602
120,000
121,213
200,000
199,996
364,350
364,350
486,520
486,520
486,520
486,520
45,800
45,800 0
452,000
Animal husbandry breeding 41,00063,9
5440,1
2678,5
6940,5
00105,352
40,200
43,510
40,200
39,995
133,281
144,694
100,838
105,905
115,822
133,378
39,115
35,034
31,215
197,106
Operational expenses of program and 208,500 152, 153, 99,1 356, 289, 409, 311, 502, 474, 587, 433, 721, 671, 657,6 613,6 396,0 0 140,2 802,2
96

projects 285 400 95 000 719 700 287 800 041 600 027 117 997 51 13 80 50 83
Advertising the country abroad 0 0 0 0 0 0 0 0 0 010,0
0010,0
00 0 0 0 0 0 0 0 0
Land survey 0 0 0 0 0 0 0 100 0 292 0 0 0 0 0 0 0 0 0 0 Operating expenses of scientific research projects 0 0 0 0 0 0 0 0 0
8,920 0 0
21,484
15,232
85,706
35,199
1,530,060
1,556,321
386,170
963,294
Training and practice for vocational purposes 0 0 0 0 0 0 0 0 0
8,920 0 0
21,484
15,232
23,406
20,283
23,690
16,512
10,690
16,050
Organization of courses and seminars 0 0 0 0 0 0 0 0 0 0 0 0 0 062,30
014,91
61,506
,3701,539
,810375,4
80947,2
44
Vaccination of animals2,000,0
00
1,915,44
8
1,630,00
0
1,546,97
9
2,000,00
0
2,040,16
6
1,994,00
0
1,641,36
6
2,105,30
0
2,043,62
3
1,135,08
3
1,136,68
0 0 0 0 0 0 0 0 0
Veterinary services 488,033213,245
895,013
589,411
929,703
655,741
1,284,36
9720,367
1,637,20
03,76
1
2,664,55
8
1,389,32
4 0 0 01,351
,2165,896
,6996,789
,8057,696
,78813,089,458
Payment for services provided by private sector 0 0 0 0 0
45,493 0 0
125,229
236,446
9,904,23
3
9,043,07
1
17,698,5
49
14,672,4
9310,560,397
9,817,648
6,921,530
4,255,211
5,414,528
3,062,652
Payment for scientific R&D 0 0 0 0 0 0 0 0 0 50 0 029,6
0029,6
0019,30
020,00
01,136
,159780,9
45 025,00
0
Payment for general services 0 026,6
7027,8
7140,0
0145,4
9397,0
9886,1
33125,229
236,396
9,904,23
3
9,043,07
1
17,649,1
49
14,623,0
9310,521,747
9,778,298
5,767,646
3,457,220
5,410,603
2,924,895
Payment for auditing and credit ranking services (domestic) 0 0 0 0 0 0 0 0 0 0 0 0 0 0 0 0 0 0 150
21,300
Property insurance 0 0 0 0 0 0 0 0 0 0 0 0 0 0 0 0 0 0 054,01
0
Vehicles insurance 0 0 0 0 0 0 0 0 0 0 0 0 0 0 0 0 3,685 3,006 3,76536,23
4
Payment for security services 0 0 0 0 0 0 0 0 0 0 0 019,8
0019,8
0019,35
019,35
014,04
014,04
0 0 0
Vehicle inspection 0 0 0 0 0 0 0 0 0 0 0 0 0 0 0 0 0 0 10 1,214
Information & Advertisement 0 0 0 0 0 0 0 0 0 0290,410
209,607
234,088
228,750
87,917
74,266
874,500
855,027
315,023
356,000
Brochures and distribution materials 0 0 0 0 0 0 0 0 0 0 0 0 0 0 0 0 0 025,00
045,00
0
Land rent 0 0 0 0 0 04,71
5 9704,35
5 05,95
21,82
1 0 272 0 010,10
6 2,554 9,544 3,794
Fertilizer 0 0 0 0 0 0 0 0 0 0200,000
614,200 0 0 0 0 0 0 0 0
Transfer of remaining balance and savings from previous year's expenses to organizations 0 0 0 0 0 0 0 0
282,684
288,898 0
26,513 0 0 0
52,140
103,652
24,102,254 0 0
Interest payment 0 0 0 0 0 0 0 0 0 0 02,50
0 0 0 0 0 0 0 0 0
Interest payment of domestic loan 0 0 0 0 0 0 0 0 0 0 02,50
0 0 0 0 0 0 0 0 0
Interest payment of government bond 0 0 0 0 0 0 0 0 0 0 02,50
0 0 0 0 0 0 0 0 0
Subsidies and transfers 50,93543,0
8638,0
87156,756
38,524
54,415
61,029
132,913
63,628
743,456
8,488,55
1
10,420,8
91
19,250,7
54
7,593,45
916,440,138
15,014,878
72,110,939
29,681,781
59,249,814
68,327,547
Subsidies 0 0 0 0 0 0 0 0 0 0
8,000,00
0
9,795,09
7
14,890,8
28
6,090,36
211,360,000
12,643,725
43,272,430
27,402,064
52,950,000
67,200,000
Other subsidies and transfers 0 0 0 0 0 0 0 0 0 0 0 0 0 0 0 07,858
,4301,040
,53837,950,000
36,200,000
Wheat subsidies 0 0 0 0 0 0 0 0 0 0
8,000,00
0
9,795,09
7
11,360,0
00
4,959,53
511,360,000
12,643,725
15,000,000
16,165,436
15,000,000
31,000,000
Subsidies to private sector for production increase 0 0 0 0 0 0 0 0 0 0 0 0
3,530,82
8
1,130,82
8 0 020,414,000
10,196,090 0 0
Intergovernmental transfers 0 0 0 0 0 0 0 0 0 0 0 0 0 0 0 024,000,000 0 0 0
Intergovernmental current transfers 0 0 0 0 0 0 0 0 0 0 0 0 0 0 0 024,000,000 0 0 0
Transfer from State budget to other levels 0 0 0 0 0 0 0 0 0 0 0 0 0 0 0 0
24,000,000 0 0 0
Transfers to the households 15,82517,2
7523,1
44135,730
22,379
35,269
40,642
112,365
38,667
40,468
462,179
625,794
445,275
427,383
1,000,022
766,450
1,805,629
315,067
604,042
973,985
Pension and benefit 0 0 0 0 0 0 0 0 0 02,64
0 840 0 0 0 0 0 0 0 0 Training cost 0 0 0 0 0 0 0 0 0 0 2,64 840 0 0 0 0 0 0 0 0
97
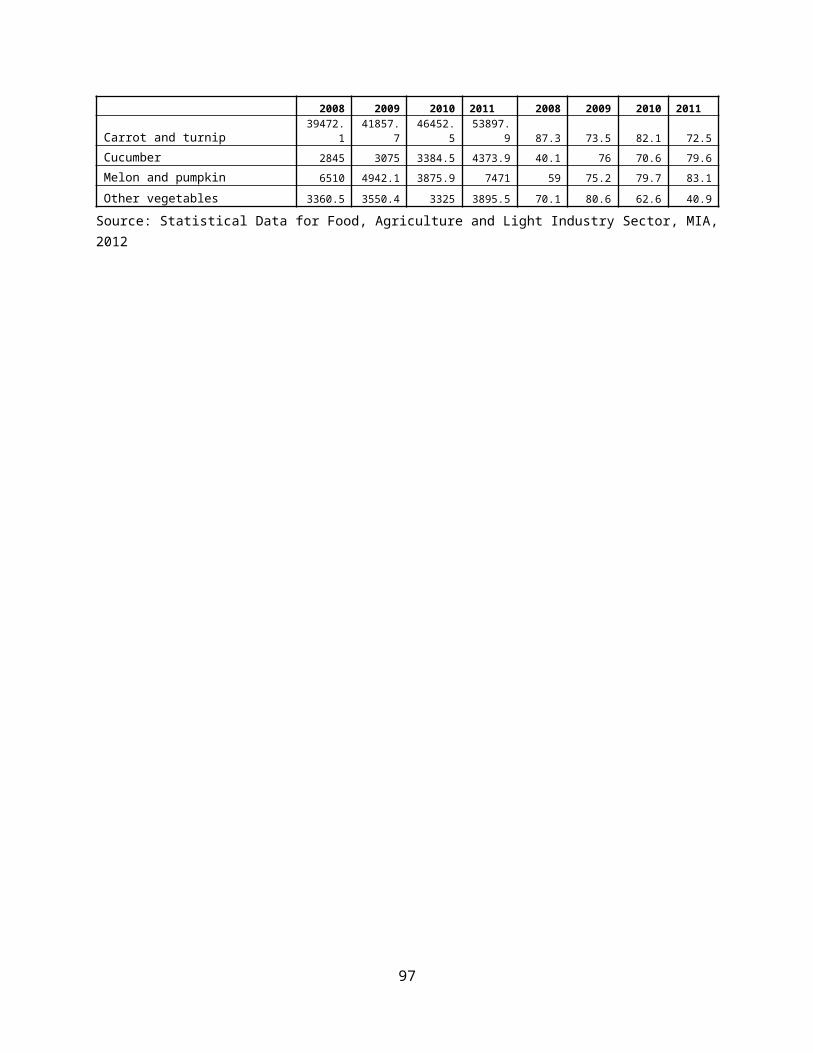
0
Social welfare expenses 0 0 0 0 0 0 0 0 0 0 0 0 0 0500,0
00499,0
50 0 0 0 0
Support for food and nutrition 0 0 0 0 0 0 0 0 0 0 0 0 0 0500,0
00499,0
50 0 0 0 0
Compensations 0 0 0 0 0 0 0 0 0 0332,887
332,887
191,039
191,039
294,100
69,060
1,491,975 0
29,145
64,527
One time benefit and bonus 15,82517,2
7523,1
44135,730
22,379
35,269
40,642
112,365
38,667
40,468
126,652
287,964
31,300
33,806
46,300
46,294
80,000
91,620 0
227,000
Non-continuous compensation by the employer 0 0 0 0 0 0 0 0 0 0 0
4,103
222,936
202,538
159,622
152,046
233,654
223,447
574,897
682,458
One-time cash compensation for retirement 0 0 0 0 0 0 0 0 0 0 0
4,103
134,840
116,406
86,870
84,763
153,203
144,122
324,912
512,992
One time grants 0 0 0 0 0 0 0 0 0 0 0 075,5
4781,3
2367,95
262,63
675,65
174,55
1241,1
85148,1
26 Transportation allowance for visit to motherland during holiday 0 0 0 0 0 0 0 0 0 0 0 0 0 0 0 0 0 0 500 0
Bonuses and compensation 0 0 0 0 0 0 0 0 0 0 0 04,80
94,80
8 4,800 4,648 4,800 4,775 8,30021,34
0 Compensation to public employees who got laid off due to restructuring 0 0 0 0 0 0 0 0 0 0 0 0
7,740 0 0 0 0 0 0 0
Payment and grants to specific group of citizens 0 0 0 0 0 0 0 0 0
676,581 0 0
3,909,16
3
1,073,85
84,073
,7901,602
,4733,032
,8801,964
,6005,694
,882 0
Herdstock vaccination 0 0 0 0 0 0 0 0 0676,581 0 0
3,659,16
3843,870
4,073,790
1,602,473
3,032,880
1,964,600
5,694,882 0
Fertilizers for farmers 0 0 0 0 0 0 0 0 0 0 0 0250,000
229,988 0 0 0 0 0 0
Other payments and fees 0 0 0 0 0 0 0 0 01,44
6 0 05,48
91,85
6 6,327 2,231 0 50 89027,22
2
Land fee 0 0 0 0 0 0 0 0 01,44
6 0 05,48
91,85
6 6,327 2,231 0 50 80018,05
5
Vehicles tax 0 0 0 0 0 0 0 0 0 0 0 0 0 0 0 0 0 0 90 9,168
Foreign transfers 35,11025,8
1114,9
4321,0
2616,1
4519,1
4620,3
8820,5
4924,9
6124,9
6226,3
72 0 0 0 0 0 0 0 0126,3
40 Membership fees to international organization 35,110
25,811
14,943
21,026
16,145
19,146
20,388
20,549
24,961
24,962
26,372 0 0 0 0 0 0 0 0
126,340
CAPITAL EXPENSES 560,000605,399
880,000
925,329
702,100
728,824
4,274,00
0
4,266,69
5
18,179,1
00
13,942,5
24
28,707,7
00
18,794,5
56
1,106,28
4823,890
39,485,700
35,659,646
65,048,907
68,696,690
116,187,31
4
186,200,77
9
Domestic investment 10,00014,2
60298,900
344,231
284,700
320,595
3,424,00
0
3,439,42
0
9,313,60
0
8,277,08
3
23,726,3
00
16,827,0
46
1,106,28
4823,890
36,844,100
35,420,951
57,441,800
56,770,282
48,886,700
76,217,000
Investment to be financed from budget 08,26
0250,000
249,245
284,700
267,004
3,374,00
0
3,362,62
5
9,113,60
0
8,128,92
3
17,396,8
00
13,543,4
29605,600
605,600
35,242,100
33,490,795
47,061,800
46,400,528
43,007,500
73,663,000
Plan and equipment to be financed from budget 10,000 0
48,900
48,818 0 0
50,000
72,000
200,000
148,160
5,609,50
0
1,472,58
6 0 0602,0
00599,9
8210,380,000
10,364,754
5,879,200
2,554,000
Investment to be financed from own resources 0 0 0 0 0 0 0
2,295 0 0
720,000
1,811,03
2500,684
218,290
1,000,000
1,317,175 0 0 0 0
Local government investment and capital renovation 0
6,000 0
2,000 0 0 0
2,500 0 0 0 0 0 0 0
13,000 0 5,000 0 0
Capital expenses to be financed from Local Road fund 0 0 0
44,169 0
53,591 0 0 0 0 0 0 0 0 0 0 0 0 0 0
Increase the State reserves 0 0 0 0 0 0700,000
700,000
7,200,00
0
3,945,42
7
3,000,00
0 0 0 02,400
,000 05,090
,00011,271,141
28,395,919
28,000,000
Food and goods reserves 0 0 0 0 0 0700,000
700,000
1,200,00
0
1,008,31
5
3,000,00
0 0 0 02,400
,000 0 06,049
,758 0 0
Grains reserves 0 0 0 0 0 0 0 0
6,000,00
0
2,937,11
3 0 0 0 0 0 0 0 0 0 0
Wheat reserves 0 0 0 0 0 0 0 0 0 0 0 0 0 0 0 05,090
,0005,221
,38328,395,919
28,000,000
Expenses of Land and intangible items 03,24
0 0 0 0 0 0 0 0 0 0 0 0 0 0 0 0 0 0 0
Foresting expenses 03,24
0 0 0 0 0 0 0 0 0 0 0 0 0 0 0 0 0 0 0
Capital transfers 550,000587,899
581,100
581,098
417,400
408,230
150,000
127,275
1,665,50
0
1,720,01
4
1,981,40
0
1,967,51
0 0 0241,6
00238,6
94658,7
00655,2
67983,0
001,520
,600 Capital renovation of Budget entities 550,000 587, 581, 581, 417, 408, 150, 127, 1,66 1,72 1,98 1,96 0 0 241,6 238,6 658,7 655,2 983,0 1,520
98
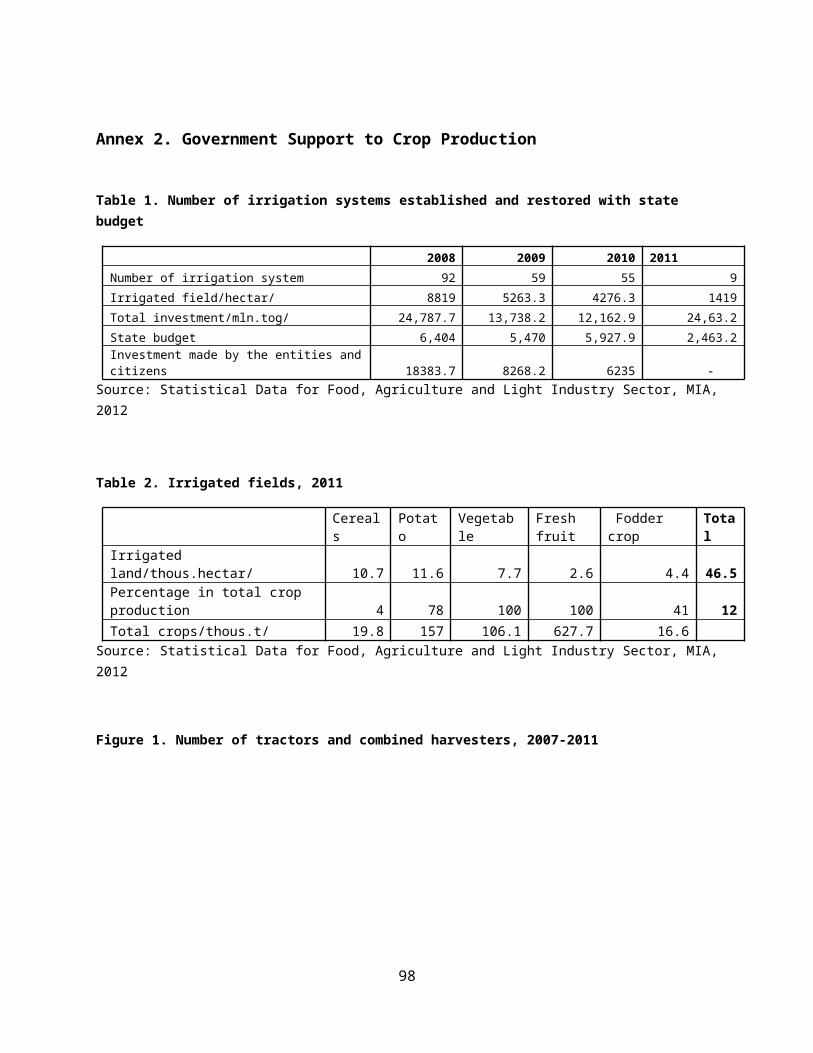
899 100 098 400 230 000 2755,50
00,01
41,40
07,51
0 00 94 00 67 00 ,600 Investment to be financed from foreign loans 0 0 0 0 0 0 0 0 0 0 0 0 0 0 0 0
1,858,407 0
37,921,696
80,463,179
0 0 0 0 0 0 0 0 0 0 0 0 0 0 0 0279,9
89 019,434,860
80,137,179
0 0 0 0 0 0 0 0 0 0 0 0 0 0 0 01,578
,418 018,486,836
326,000
NET LENDING (SUBTRACTED THE REPAYMENTS) 0 0 0 0 0 0 0 0 0 0
2,881,20
0
1,381,00
0
6,155,10
0
5,971,43
09,650
,00012,531,598
48,036,500
46,645,207
-30,842,759
-17,703,523
Repayable loan 0 0 0 0 0 0 0 0 0 0
2,881,20
0
1,381,00
0
6,155,10
0
5,971,43
09,650
,00012,531,598
48,036,500
46,645,207
-32,886,017
-27,379,543
Repayment from central budget lending 0 0 0 0 0 0 0 0 0 0
2,881,20
0
1,381,00
0
6,155,10
0
5,971,43
09,650
,00012,531,598
48,036,500
46,645,207
-32,886,017
-27,379,543
Financing from foreign project loan 0 0 0 0 0 0 0 0 0 0 0 0 0 0 0 0 0 02,043
,2589,676
,020 To be transferred lending from foreign loan 0 0 0 0 0 0 0 0 0 0 0 0 0 0 0 0 0 0
2,043,258
9,676,020
Financing resource to cover expenses:9,840,2
41
9,076,94
8
11,028,9
44
10,836,4
57
11,110,0
08
12,608,8
77
15,152,9
82
16,138,1
33
32,280,0
08
29,194,3
35
71,353,1
57
73,529,0
88
61,046,8
30
50,119,3
66
108,443,63
899,743,282
236,722,85
9
208,274,30
1
182,005,85
3
287,173,23
4
From financial loan 0 0 0 0 0 0 0 0 0 0 0 0 0 0 0 020,000,000
9,849,933 0 0
Foreign projects' loan 0 0 0 0 0 0 0 0 0 0 0 0 0 0 0 02,183
,565 034,324,184
92,357,624
From core activitie's revenue 48,300130,221
481,538
394,061
499,745
571,295
376,152
870,172
439,963
273,359
8,957,56
7
16,739,0
88
20,316,6
92
12,268,2
4117,085,099
19,023,712
18,107,302
16,667,222
3,787,930
5,053,042
From non-core activitie's revenue 73,46060,2
9860,2
65266,832
69,878
129,021
108,668
1,240,10
8116,768
79,468
1,632,55
3
2,774,26
2
1,918,19
0587,538
2,254,228
2,010,061
364,285
265,170
251,111
164,313
From grant funds 0 0 0 0 0 0 0 0 0 0
5,380,00
0 0
2,206,89
2 0 0 0 0 05,867
,897 0
From budget and repayment of loans 0 0 0 0 0 0 0 0 0 0 0 0 0 0 0 035,000,000
35,000,000 0
-29,550,000
Financed from beginning balance 0 0 0 0 0
1,591,39
2 0 0282,684 0 0 0 0 0 0 0
4,241,474 0 0 0
Mongolian development fund 0 0 0 0 0 0 0 0 0 0 0 0 0
6,394,63
2 0 0 0 0 0 0
0 0 0 0 0 0 0 0 0 0 0 0 0 0 0 0 0 028,395,919
28,000,000
0 0 0 0 0 0 0 0 0 0 0 0 0 0 0 0 0 0941,0
98 0
0 0 0 0 0 0 0 0 0 0 0 0 0 0 0 0 0 0
-35,000,000 0
Financed from budget9,718,4
81
8,886,43
0
10,487,1
41
10,175,5
65
10,540,3
84
10,317,1
69
14,668,1
63
14,027,8
53
31,440,5
93
28,841,5
08
55,383,0
38
54,015,7
38
36,605,0
56
30,868,9
5589,104,311
78,709,509
156,826,23
3
146,491,97
5
143,437,71
5
191,148,25
5
Revenue to be collected in budget 2009 0 0 0 0 0 0 0 0 0 0 0 0481,648 0 0 0 0 0 0 0
NUMBER OF ENTITIES 36 34 34 33 32 27 26 0 26 0 34 0 33 0 34 3 34 0 36 38
36 34 34 33 32 27 26 0 26 0 34 0 33 0 34 3 34 0 36 38
TOTAL EMPLOYEES 678 581 683 636 662 630 668 0 668 0 994 0 900 0 913 52 913 14 1,061 1,175
Management staff 63 53 58 64 53 44 55 0 54 0 56 0 45 0 47 3 47 2 59 66
Specialist staff 404 361 442 403 434 413 433 0 434 0 487 0 465 0 483 32 483 12 561 655
Support staff 211 167 183 169 175 173 180 0 180 0 207 0 187 0 188 9 188 0 207 193
Contractual employees 0 0 0 0 0 0 0 0 0 0 244 0 203 0 195 8 195 0 234 261
Net cash flow 033,8
16 0
-103,556 0
419,671 0 0 0 0 0 0 0 0 0 0 0 0 0 0
Beginning cash and cash equirament assets 0
22,570 0
394,830 0
5,729 0
422,386 0 0 0 0 0 0 0 0 0 0 0 0
Ending cash and cash equirament assets 0 56,3 0 5,72 0 425, 0 1,62 0 0 0 0 0 0 0 0 0 0 0 0
99
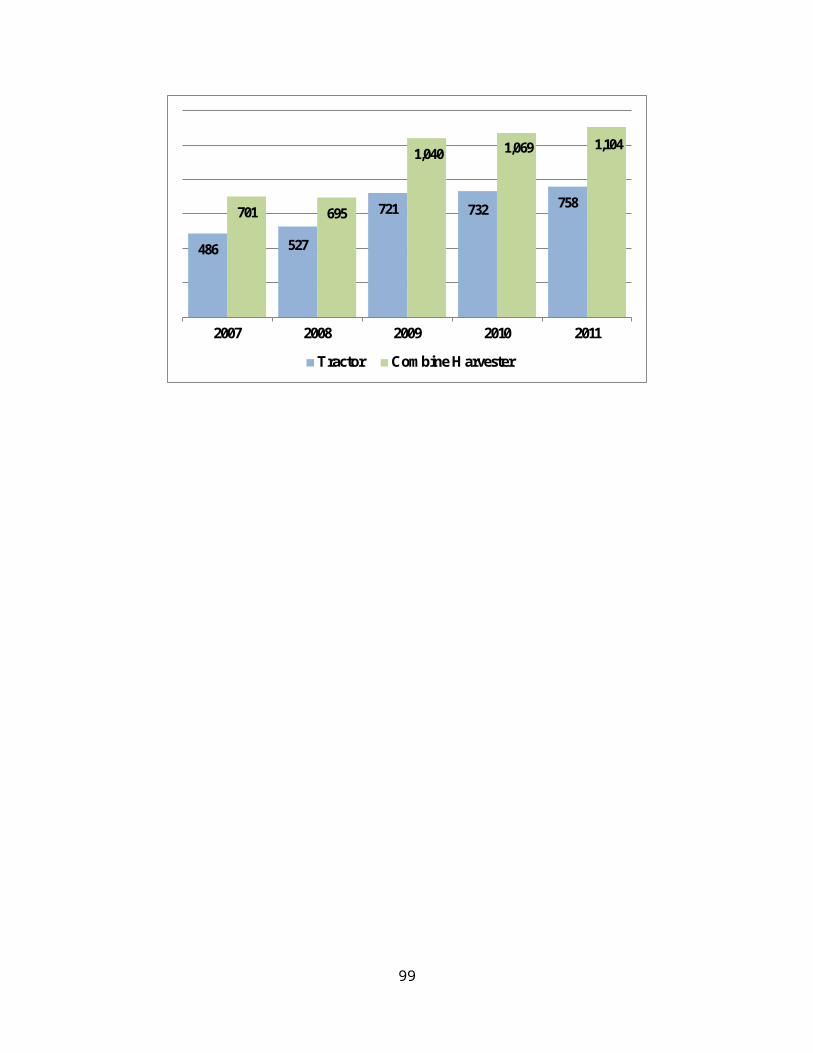
86 4 4016,21
1 Remaining deposit to be closed in the budget 0 0 0
285,174 0 0 0 0 0 0 0 0 0 0 0 0 0 0 0 0
Source: MoF
100

Annex 9. Agriculture Sector Development Strategy, Summary of Costed Programs, 2007-2016, MIA
2007 2008 2009 2010 2011 2012 2013 2014 2015 2016 Total
A. Livestock Subsector Initiatives
Land Utilization and Management 6,435.50 5,015.10
5,015.10 4,632.30 3,831.90 3,251.9
0 1,214.40 1,214.40 1,214.40 1,214.40 33,039.20
Risk Management 8,241.80 9,153.30
31,966.80 32,055.80 31,505.80 29,202.
0028,317.0
0 4,248.00 4,248.00 3,148.00 182,086.70
Disease Management 4,374.90 4,209.90
4,141.90 4,141.90 4,124.90 2,914.9
0 2,914.90 2,914.90 1,704.90 1,704.90 33,148.00
Market Linkages 2,458.00 5,348.00
8,413.00 8,392.00 8,362.00 8,062.0
0 8,062.00 8,062.00 8,061.00 8,061.00 73,281.00
Production Management and Breeding 3,383.90 3,047.90
3,047.90 2,796.80 2,696.80 462 459 459 459 459 17,271.3
0Total 24,894.1
026,774.
2052,584.
70 52,018.80 50,521.40 43,892.80
40,967.30
16,898.30 15,687.30 14,587.30 338,826.
20Subtotal Livestock Subsector Initiatives
24,894.10
26,774.20
52,584.70 52,018.80 50,521.40 43,892.
8040,967.3
016,898.3
0 15,687.30 14,587.30 338,826.20
B. Crop Subsector Initiatives
Irrigation 2,428.10 2,798.20
2,503.50 10,121.20 11,455.20 10,901.
7010,588.5
010,553.7
0 2,888.40 104.4 64,342.90
Feed Production 14,957.30
15,897.00
15,688.30 17,312.30 17,463.10 13,247.
7012,946.1
012,946.1
0 12,922.90 12,922.40 146,303.00
Horticulture Crops 513.9 774.9 653.1 455.9 616 126.4 103.2 85.8 80 74.2 3,483.50
Seed Production 174 408.3 484.9 466.3 249.4 251.7 66.1 80 63.8 63.8 2,308.40
Subtotal Crop Subsector Initiatives 18,073.30
19,878.30
19,329.70 28,355.70 29,783.70 24,527.
5023,703.9
023,665.6
0 15,955.10 13,164.80 216,437.80
C. Sector Wide InitiativesAgricultural Support Services - Research 1,189.00 933.8 1,450.0
0 1,183.20 1,136.80 1,354.30 1,354.30 1,331.10 1,331.10 1,331.10 12,594.7
0Credit - 736.6 4,011.6
0 4,011.60 4,000.00 4,000.00 4,000.00 - - - 20,759.8
0Food and Hygiene 266.8 1,200.6
0 852.6 580 452.4 214.6 203 174 174 174 4,292.00
Subtotal Sector Wide Initiatives 1,455.80 2,871.00
6,314.20 5,774.80 5,589.20 5,568.9
0 5,557.30 1,505.10 1,505.10 1,505.10 37,646.50
Total PROGRAM COSTS 44,423.20
49,523.60
78,228.60 86,149.30 85,894.30 73,989.
2070,228.5
042,069.0
0 33,147.50 29,257.20 592,910.50
Source: MIA
101
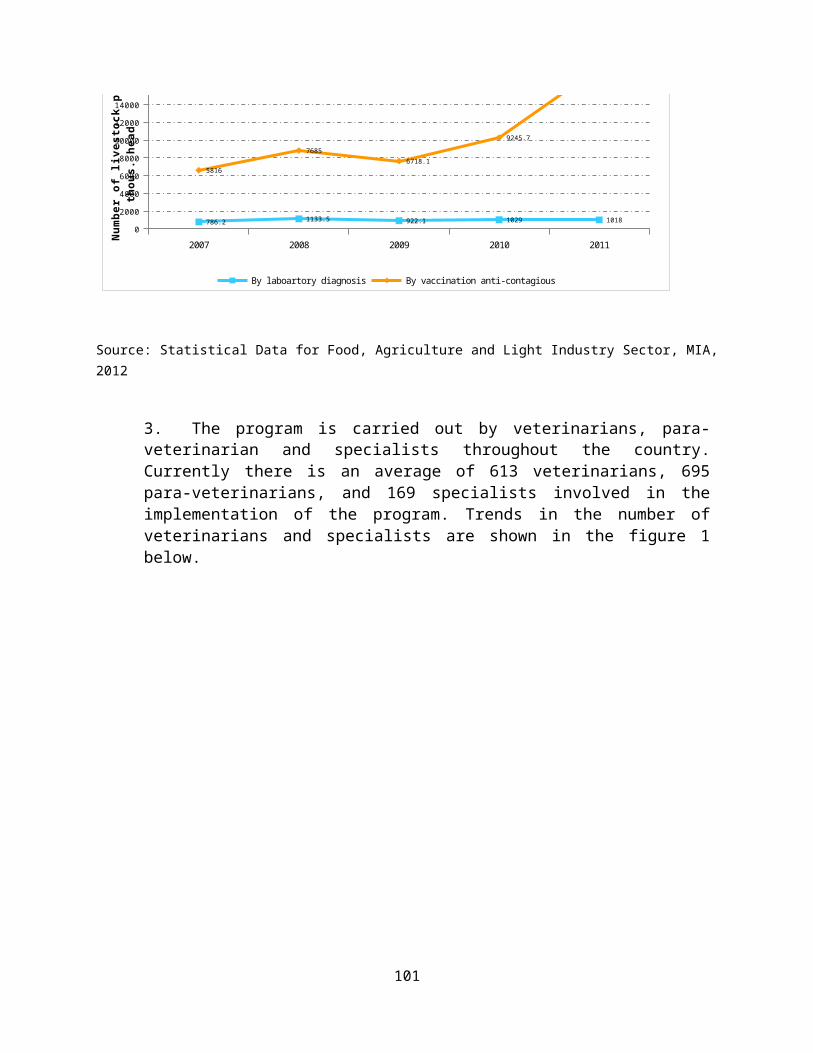
Annex 10. MIA Capital/ Investment Budget, in MNT billions,2013
№ Name of project and measures, capacity, locationStart, end date
Estimated cost
Budget projection for 2013
by government
decree
Budget proposal of the Minister of Industry and
agriculture
Budget limit
Approved
within the
Budget
Proposal
Total propo
sal
MINISTER OF INDUSTRY AND AGRICULTURE 257,98
4 66,33
6
66,336
57,450
123,786
1 Investment: 221,292
51,527.1
52,527
47,35
99,877
1.1
Storage for agricultural products /Selenge, Darkhan-Uul, Central, Bulgan,Ulaanbaatar, Uvs,Khuvsgul, Dornod/
2012-2013
21,000
10,500
10,500
-
10,500
1.2
Improve water supply for people, livestock and pasture in the rural area /In all provinces/
2011-2015
26,584
6,000
6,000
8,000
14,000
1.3
Reconstruction and construction of watering systems /Regions suitable for farming with watering and with ready design drawings/
2012-2013
6,600
4,80
4,80
4,050
8,8
1.4
Support establishing of farm for winter greenhouses /Darkhan-Uul, Orkhon, Ulaanbaatar/
2011-2013
3,000
1,000
1,000
1,000 1
.5
National complex of livestock genetic fund/Darkhan-Uul, Khongor/ 2012-2015
12,271
5,50
5,50
-
5,5
1.6
Establish inquiry laboratory for food /Ulaanbaatar/ 2012-2013
4,300
3,13
3,13
-
3,1
1.7
Establish exchange for raw materials and products, construct storage for raw materials / Ulaanbaatar, in all provinces/
2012-2015
5,000
5,00
1,80
3,200
5,0
1.8
Establish disinfection facilities in border points (National program "Mongolian livestock")
2012-2017
29,000
3,80
3,800
3,8
1.9
Building for veterinary and sanitary laboratory (Khan-Uul district, Ulaanbaatar)
2012-2013
1,225
485
485
-
485
1.10
Center for support of small and medium enterprises /Bayankhongor/ 2011-2013
2,970
304
712
-
712
1.11
Building for Division of small and medium enterprises in the food and agricultural sector in Khuvsgul province/Murun/
2013-2014
626.
500
626.
-
626
1.12
Building for Division of small and medium enterprises in the food and agricultural sector in Khentii province /Ondorkhaan/
2013-2014
650
500
650
-
650
1.13
Building for Division of small and medium enterprises in the food and agricultural sector in Sukhebaatar province /Baruun-Urt/
2013-2014
705.
500
705.
-
705
1.14
Building for Division of small and medium enterprises in the food and agricultural sector in Bayanulgii province/Ulgii/ 2013
500 500
500
500
1.15
Develop feasibility study for construction of new veterinary building in Bayankhongor province 2013
20
20 -
20
1.16
Survey and project design of Industry and technology park in the wool and cashmere sector 2013
20
20 -
20
1.17
Survey and project design of Industry and technology park in the wood sector 2013
50
50 -
50
1.18
Project design for complex service center in the rural area and in Industry and technology park 2013
80
80 -
80
1.19
Feasibility study and project design of laboratory for research, test and domestication of high technology of light industry to be established in the Industry and technology park
2013 120
120
-
120
1.20
Develop feasibility study to extend laboratory of scientific organization for leather and to increase capacity of bio-technological laboratory 2013
80
80 -
80
1.21
Survey and feasibility study of plants to be developed in connection with mining industry 2013
120
120 -
120
102

№ Name of project and measures, capacity, locationStart, end date
Estimated cost
Budget projection for 2013
by government
decree
Budget proposal of the Minister of Industry and
agriculture
Budget limit
Approved
within the
Budget
Proposal
Total propo
sal1.22
Develop feasibility study to establish centralized meat sale center 2013 20
20 -
20
1.23
Develop feasibility study to establish center and laboratory for nano-technology 2013 1
00 100
-
100
1.24
Develop feasibility study to establish baby nutrition plant with capacity to receive not less than 5 ton milk per day in Ulaanbaatar 2013
50 50
- 50
1.25
Develop feasibility study to establish fish farm in Zavkhan, Arkhangai, Gobo-Altai, Khovd and Khuvsgul provinces 2013
50 50
- 50
1.26
Breed elite seeds of plants, create new sorts, intensify research and test of new sorts, improve quality of seeds; 2013 3,
000 3,000
3,000
-
3,000 1
.27
Project for registration of rights of state and domestic property 2013-2014
3,850
200 -
200
1.28
Develop general plan to establish administration of industrial complex in Saishand, industry and technology park in Baganuur and Darkhan, /Dornogobi, Ulaanbaatar, Darkhan-Uul/
2013-2015
67,500
6,000
8,700
-
8,700 1
.29
Complete preparation to establish copper melting plant, develop feasibility study to establish plant for producing liquid fuel and gas from coal
2013 2,900 2,90
0 -
2,900 1
.30
Research to establish plant for processing of metal from deposits in eastern region 2013 1
00 100 -
100
1.31
Establish coal test laboratory and create united information database 2013 500 500
- 500
1.32
Support solving of social problems and providing apartments to civil servants serving under Minister of Industry and agriculture 2013 9
00 900
900
1.33
Support establishing of slaughtering shop within of several soums 2013 400 4
00 400
1.34
Infrastructure outside of industry and technology park in Saishand /Dornogobi/
2013-2015
13,500 13,
500 13,500 1
.35
Infrastructure inside of industry and technology park in Saishand /Dornogobi/
2013-2015
13,500 13,
500 13,500
2 Capital repair 1,84
1,58
1,58
-
1,5
2.1
Reconstruction of veterinary laboratory. Bulgan 2013 50
50
50 -
50
2.2
Reconstruction of building of the Division for small and medium enterprises in the food and agricultural sector /Gobi-Altai/ 2013
15 15
15 -
15
2.3
Reconstruction of building of the Division for small and medium enterprises in the food and agricultural sector/Dornod/ 2013
15.4 15.4
15.4
-
15.
2.4
Reconstruction of building of the Division for small and medium enterprises in the food and agricultural sector/Dornogobi/ 2013
54.8 54.8
54.8
-
54.
2.5
Reconstruction of veterinary laboratory. /Dundgobi/ 2013 170
170
170 -
170
2.6
Reconstruction of veterinary laboratory. /Zavkhan/ 2013 288.
288.
288.6
-
288
2.7
Reconstruction of veterinary laboratory. /Ovorkhangai/ 2013 5
5
5 -
5
2.8
Reconstruction of building of the Division for small and medium enterprises in the food and agricultural sector and of veterinary laboratory. /Omnogobi/
2013 157.
157.
157.9
-
157
2.9
Reconstruction of hall with 250 seats in the Ministry of Industry and agriculture. /Ulaanbaatar, Bayanzurkh district/ 2013
445 445
445
-
445
2.10
Reconstruction of veterinary laboratory./Sukhbaatar/ 2013 25
25
25 -
25
2.11
Reconstruction of building of the Division for small and medium enterprises in the food and agricultural sector /Central/ 2013
11.1 11.1
11.1
-
11.
103

№ Name of project and measures, capacity, locationStart, end date
Estimated cost
Budget projection for 2013
by government
decree
Budget proposal of the Minister of Industry and
agriculture
Budget limit
Approved
within the
Budget
Proposal
Total propo
sal2.12
Reconstruction of building of the Division for small and medium enterprises in the food and agricultural sector/Khuvsgul/
2013
60
60
60 -
60
2.13
Capital reconstruction of veterinary laboratory. /Khentii/ 2013
50
50
50 -
50
2.14
Capital reconstruction of building of the Division for small and medium enterprises in the food and agricultural sector/Darkhan-Uul/
2013
150
150
150
-
150
2.15
Capital reconstruction of building of the Division for small and medium enterprises in the food and agricultural sector/Gobisumber/
2013
2
2
2 -
2
2.16
State center for test and approval of veterinary drugs /Khan-Uul district/
2013
350
80.8
80.8
-
80.
3 Equipment: 34,842
13,22
8
12,227
10,100
22,328
3.1
Renovation of mechanisms for vegetable breeding /last funding for 2012/
2012-
2013
11,000
5,000
5,000
6,00
0 11,000
3.2
Establishing of greenhouse farm for vegetables2012-
2013
1,000
1,000
1,000 1,
000
3.3
Equipment for livestock fodder plant (In all provinces, cities and settlements with intensive livestock breeding)
2012-
201 13,749
2,500
1,500
1,00
0 2,500
3.4
Domestication of nano-technology in the light industry2012-
2013
500
250
250
-
250
3.5
Renovation of equipment of organizations in the Industry and agricultural sector
2012-
201 2,030
1,015
1,015
-
1,015
3.6
Equipment of state property committee 2013
89
89
89 -
89
3.7
Equipment for disinfection of livestock and slaughtering of sick livestock in order to prevent from infection (National program "Mongolian livestock")
2011-
201
1,200
1,200
1,200
-
1,200
3.8
High sensitive modern equipment for veterinary laboratory to improve biological safety, fence. /National program "Mongolian livestock"/
2012-
2013
2,173.9
2,173.9
2,173.9
-
2,173.
9
3.9
Establish plant for construction materials, equipment for laboratory of construction materials
2013
3,100
-
- 3,10
0
3,100
Source: FID, MIA
104

Annex 11. MIA’s Expenditure Classification by Program, in MNT billion, 2008-2013
ProgramFY 2008 FY 2009 FY 2010 FY 2011
plan plan plan plan
MINISTERY OF INDUSTRY AND AGRICULTURE93,515,10
5 121,587,000 146,409,625 386,726,673
Not elsewhere classified 320,000 2,139,920 2,720,025 86,591,992
General public services 0 431,499 526,839 8,124,702
Executive and legislative organs, financial and fiscal affairs, external affairs 0 431,499 526,839 8,124,702
Financial and fiscal affairs 0 431,499 526,839 8,124,702
Ownership rights implementation 0 431,499 526,839 8,124,702
Financial and fiscal operations 0 0 0 24,000,000
Special funds, unclassified reserve funds 0 0 0 24,000,000
General economic, commercial, and labor affairs 80,000 103,481 153,167 1,523,296
General economic and commercial affairs 0 63,481 113,167 1,523,296
Commerce and trade 0 63,481 113,167 1,523,296
Domestic trade 0 63,481 113,167 1,523,296
Labor and Employment Services 80,000 40,000 40,000 0
Public works employment services 80,000 40,000 40,000 0
Public works organized within the framework of state programs or policies 80,000 40,000 40,000 0
Agriculture 93,195,105 119,447,079 143,689,600 300,134,682
Livestock 37,128,770 30,502,911 66,346,755 128,695,205
Preventive measures by veternaries 10,034,176 9,449,198 26,501,486 25,333,701
Preventive measures from contagious disease 3,577,432 3,436,107 20,120,936 3,789,400
Preventive measures from parasitic disease 496,699 240,000 0 0
Preventive measures from special contagious disease 1,766,243 1,287,570 1,391,817 3,833,768
Treatment of chronic animal contagious disease 779,552 736,203 833,147 12,333,200
Diagnosis and analysis through laboratory 571,321 655,944 709,564 1,288,977
Drug test and certification in veterinary 170,387 191,298 207,214 225,750
Hygienic analysis and control in veterinary 240,981 284,646 304,903 368,401
Diagnosis and analysis through laboratory 159,954 180,000 197,447 694,826
Disinfection activities 155,700 177,601 174,941 954,100
Veterinary service fee 2,664,558 2,815,293 3,170,802 3,054,256
Training, advertisement and research works 22,671 100,480 100,280 80,000
Animal quality and breeding 2,806,392 1,714,578 1,816,024 20,851,997
Activities for improvement of animal quality 407,692 446,478 456,574 278,997
Restoration of animal origin source 167,692 95,548 117,894 140,497
105

Service for breeding of original animal group 50,000 110,000 107,000 49,500
Selection by animal benefits and nest quality 45,000 150,000 142,000 0
Protection, breeding and production support for rare animals 145,000 90,930 89,680 89,000
Development of intensified animal husbandry 2,340,000 1,268,100 1,253,100 20,543,000
Improvement in capacity for intensified animal husbandry 2,240,000 1,205,100 1,175,100 20,543,000
Breeding of high efficient animals 100,000 63,000 63,000 0
Training and promotion 0 0 15,000 0
Development of cooperative 58,700 0 106,350 30,000
Activities for pasture land and animal feed 2,709,540 1,934,946 2,430,833 2,422,278
Plant protection in pasture land 2,089,503 1,566,396 2,009,533 2,422,278
Struggle against field mouse 1,021,265 720,000 1,220,000 1,220,000
Struggle against destructive grasshopper 980,000 707,600 624,900 600,000
Establishment and protection of "Otor" zone 88,238 138,796 164,633 602,278
Pasture land irrigation 108,437 0 0 0
New establishment of well with engineering structure in grassland 108,437 0 0 0
Animal feed 511,600 368,550 421,300 0
Protection and improvement of pasture land and hay-field 190,000 64,950 100,000 0
Support of production for planted animal food 321,600 303,600 321,300 0
Preparation of animal feed-stuff and provision of small sized equipment 0 0 0 0
Program on Mongolian meat 0 0 0 6,946,000
Crop and cultivation 56,066,335 88,944,168 77,342,845 171,439,477
Cultivation supporting activities 21,847,793 37,248,775 30,326,041 71,950,648
Support for wheat production 19,467,793 34,905,412 23,939,041 71,650,648
Plantation of elite seeds 500,000 583,275 6,387,000 300,000
Supply of cultivation equipment 1,680,000 0 0 0
Productivity of farming soil 200,000 1,516,528 0 0
Protection of farming vegetables or plants 0 243,561 0 0
Support of household farming 381,129 1,975,105 1,990,680 610,000
Supply of small sized irrigation system and equipment 104,800 162,000 162,000 0
Farming activities of reserved area 132,870 704,385 719,960 75,000
Farming of fruits 72,350 1,054,000 1,054,000 65,000
Training, advertisement and exhibition 71,109 54,720 54,720 470,000
Harvesting activities 12,000 10,800 10,800 10,800
Harvesting commission, headquarter and management 12,000 10,800 10,800 10,800
Food 3,690,760 2,901,960 3,415,773 6,312,000
Food supply, safety and monitoring 34,736 12,990 529,050 210,000
Support for production of milk or milk products 505,247 450,000 450,000 42,000
Support and advertisement of pure ecological products 95,000 21,650 20,285 60,000
Struggle against iodine deficiency related ailment 55,778 17,320 16,438 0
106

Improvement in supply of strategical food products 3,000,000 2,400,000 2,400,000 6,000,000
Development, management and coordination of agriculture related policies 4,202,970 4,670,889 4,964,558 5,659,290
Scientific and research works on agriculture 0 0 0 1,858,430
Research and analysis on agriculture 0 0 0 1,858,430Scientific and technological projects to be implemented by the state budget in accordance with order by the Government
0 0 0 1,858,430
Mining, manufacturing, and construction 0 0 222,925 732,000
Manufacturing 0 0 222,925 732,000
Light industry 0 0 222,925 242,000
Printing house 0 0 19,950 20,000
Wood processing 0 0 32,600 25,000
Wool and cashmere 0 0 47,625 90,000
Leather 0 0 38,450 20,000
Domestic service 0 0 49,400 30,000
Sewn products 0 0 34,900 57,000
Control for industry and service 0 0 0 490,000
Heavy industry 0 0 0 0
Industrial area 0 0 0 0
Source: MoF
107

Annex 12. MIA’s Approved Capital (Investment) Budget, in MNT billion, 2013
No. Type of Project MNT
1Deep well with engineering construction 320,00
0
2 Overhaul of the well at the end of Bayan nuruu scree 26,587
3Deep well with engineering construction 320,00
0
4 Repair of animal feed reserve building 50,000
5 For implementation of pastureland management 50,000
6 To improve drinking water supply in Tugrug soum 6,000
7 To support corps plantation 50,000
8 Supply of livestock 47,500
9 To create meat reserve 60,00010 Overhaul of the well at the end of Bayan nuruu scree 26,58711 To establish hay stock in Urt bagh 19,00012 To establish hay stock in Badral bagh 19,00013 To establish hay stock in Bayantsagaan bagh 19,000
14
To provide yaks and sheep 102,000
15 Purchase of a field tent for rural baghs communal event 3,00016 Building of 2 new wells in otor grassland area 60,00017 Livestock breed improvement 15,00018 Dig wells in 6 baghs 18,00019 To create hay-field 10,00020 Animal washing tub for bagh no. 1 5,00021 Animal washing tub for bagh no. 2 5,00022 Animal washing tub for bagh no. 3 5,00023 Animal washing tub for bagh no. 4 5,00024 Animal washing tub for bagh no. 5 5,00025 Fence for washing big cattle 5,00026 Provide livestock to herders in bagh no. 1 4,00027 Provide livestock to herders in bagh no. 2 4,00028 Provide livestock to herders in bagh no. 3 4,00029 Provide livestock to herders in bagh no. 4 4,00030 Provide livestock to herders in bagh no. 5 4,00031 Livestock breed improvement /male camel/ 7,50032 Livestock breed improvement /bull/ 9,90033 Livestock breed improvement /male sheep/ 7,70034 Drill bore well in bagh no.1 19,00035 Drill bore well in bagh no.2 19,00036 Drinking water pump, stainless pipe 10,000
108

No. Type of Project MNT
37
Agricultural equipment /with mower and rake/ 4,00038
Grain seeder 1,00039
Grain separator 9,00040
Plough /to process soil/ 80041
Hand-scythe with motor 1,70042
Greenhouse plastic cover 60043
Repair of drinking water well 2,50044
Poun repair in 5th bagh 24,00045
Pound repair in 4th bagh 10,00046
Road repair in 3rd bagh 7,50047
Road repair in 4th bagh 7,50048
Set of technical insruments for hay-cutting 80,000
49
Fencing of bagh hay-field, building a hay storage 15,000
50
Breeding of high yield livestock 50,000
51
Building of hay and animal feed storage in soum center and Bijiin am 20,000
52
Repair of hillroad at Ulaan sair /Khujirt bagh/ 250,000
53
Garbage truck /Uildver bagh/ 15,00054
Repair of well /Ikhes bagh/ 20,000
55
Building of hay and animal feed fund /Khujirt bah/ 30,000
56
Repair of well in Ulaan bulag /Javkhlant bagh/ 18,500
57
Repair of well 75,00058
Fencing of hay field 30,00059
Dig a new well 36,000
60
Building of flood protection dam and water pool 25,000
61 Hay and Fodder Storage 10,000
62
Building of water dam at "Аjig lake", trenching of a canal 15,000
63
Fencing of hay fields 20,00064
Overhaul repair of drinking water well 15,00065
Renewal of wells 12,00066
Renewal and repair of water pound 6,00067
Hay storage /Khurimt bagh/ 50,0068
Hay storage/Galuut bagh/ 5,00069
Hay storage /Dalan bagh/ 10,00070
Poultry farm 10,00071
Animal washing tub /Khurimt/ 4,00072 Repair of well 1,000
109
No. Type of Project MNT73 Selected breed livestock 97,00074
Fencing of hay field in Alan soyombo bagh 25,00075
Well at Maanitiin hotol 23,80076
Provide livestock to 3rd bagh 10,00077
Pound in Hariin khamar 9,90078
Pound in Khar uzuur 8,90079
Animal washing tub 4th bagh 6,60080
Hay field in Ogoomriin gol 13,80081
Hay storage in Tungalag bagh 20,00082
Provide livestock to 2nd bagh 14,00083
Animal washing tub 2nd bagh 6,00084
Hay and animal feed storage 30,00085
Repair of Toliin well 3,800
86
Improvement of drinking water supply for soum center 50,000
87
Program on re-stocking with cattle 70,000
88
Create forage reserve in hay and animal feed storage /soum center/20,000
89
Transfer of drinking water at soum center 2,000
90
Build a animal slaughtering place / soum center/1,800
91
Fencing of hay field 12,000
Program on re-stocking with sheep 40,000
Drill a bore well /Tataal/ 20,000
Newly dig 2 hand well / at Ar khokh tolgoi and Suvene hudag/2,000
Build a construction for mine wells -Delgeriin haya, shirengiin khudag, khotol, zangiin ders, zamiin ereg, khokh tolgoi, khujriin khudag, tashaa, khoyor khudag, dersen khudag, namiin khudag, suvene khudag, oold, khairkhan, tovgor, naranbulag
19,000
Build big cattle fenes in 4 baghs 4,000
Fence for livestock transfer 2,000
Animal washing tub /Tsoohor nuurt bagh / 10,000
Build a new standard well for drinking water 38,800
Cultivation and hay-cutting technical equipment / purchase of tractor/20,000
Selected breed sire / improve livestock quality/20,000
Build animal washing facility 20,000
Dig and repair hand wells in baghs 33,500
Build drinking water purifying system in Bayantooroi village 13,200
Fencing of hay field 20,000Building of bagh centers 10,000Build a fence for hay fund /Khurkhree gol/ 20,000
110
No. Type of Project MNT
Order drawings of water pool to be built in Botgono gol 15,000
Purchase of hay-cutting equipment 20,000Repair of hand wells / 10 wells/ 8,000Repair of hay and animal feed storage 5,000Hay storage 20,000Dig a well 25,000Fencing of seabuckthorn field 7,500Wells 10,000Slaughter point 10,000Deep drilled wells 8 200,00
0Repair of hand well 4 50,700Building of water well points in baghs /4/ 40,000
Total 3,319,174
Source: FID, MIA
111