acidity and alkalinity in mine drainage: …acidity and alkalinity in mine drainage: practical ......
TRANSCRIPT
334
ACIDITY AND ALKALINITY IN MINE DRAINAGE: PRACTICAL CONSIDERATIONS1
Charles A. Cravotta III2 and Carl S. Kirby2
Abstract. In this paper, we emphasize that the Standard Method hot peroxide treatment procedure for acidity determination (hot acidity) directly measures net acidity or net alkalinity, but that more than one water-quality measure can be useful as a measure of the severity of acid mine drainage. We demonstrate that the hot acidity is related to the pH, alkalinity, and dissolved concentrations of Fe, Mn, and Al in fresh mine drainage. We show that the hot acidity accurately indicates the potential for pH to decrease to acidic values after complete oxidation of Fe and Mn, and it indicates the excess alkalinity or that required for neutralization of the sample. We show that the hot acidity method gives consistent, interpretable results on fresh or aged samples.
Regional data for mine-drainage quality in Pennsylvania indicated the pH of fresh samples was predominantly acidic (pH 2.5 to 4) or near neutral (pH 6 to 7); approximately 25 percent of the samples had intermediate pH values. This bimodal frequency distribution of pH was distinctive for fully oxidized samples; oxidized samples had acidic or near-neutral pH, only. Samples that had near-neutral pH after oxidation had negative hot acidity; samples that had acidic pH after oxidation had positive hot acidity. Samples with comparable pH values had variable hot acidities owing to variations in their alkalinities and dissolved Fe, Mn, and Al concentrations. The hot acidity was comparable to net acidity computed on the basis of initial pH and concentrations of Fe, Mn, and Al minus the initial alkalinity. Acidity computed from the pH and dissolved metals concentrations, assuming equivalents of 2 per mole of Fe and Mn and 3 per mole of Al, was comparable to that computed on the basis of aqueous species and FeII/FeIII. Despite changes in the pH, alkalinity, and metals concentrations, the hot acidities were comparable for fresh and aged samples. Thus, meaningful “net” acidity can be determined from a measured hot acidity or by calculation from the pH, alkalinity, and dissolved metals concentrations. Together, these water-quality data can be useful for evaluating the potential for toxicity, corrosion, or encrustation and can be helpful for determining the appropriate remediation. By demonstrating the measurements on fresh and aged samples, we hope to encourage (1) consistent use of the hot peroxide treatment procedure for acidity determination and (2) consistent reporting of negative acidity values.
1Paper was presented at the 2004 National Meeting of the American Society of Mining and
Reclamation and the 25th West Virginia Surface Mine Drainage Task Force, April 18-24, 2004. Published by ASMR, 3134 Montavesta Rd., Lexington, KY 40502.
2Charles A. Cravotta III is Research Hydrologist, U.S. Geological Survey, New Cumberland, PA 17070. Carl S. Kirby is Associate Professor, Department of Geology, Bucknell University, Lewisburg PA 17837.
335
Introduction
Acidic, abandoned mine drainage (AMD) affects the quality and potential uses of water
supplies in coal and metal mining regions worldwide (Herlihy et al., 1990; Nordstrom, 2000).
AMD ranges widely in quality from mildly alkaline to strongly acidic and corrosive, with
dissolved solids ranging from about 200 to 10,000 mg/L (Hyman and Watzlaf, 1997; Rose and
Cravotta, 1998; Nordstrom and Alpers, 1999). AMD characteristically has elevated
concentrations of dissolved sulfate, iron, and other metals. Dissolved metals and other
constituents in AMD can be toxic to aquatic organisms and ultimately can precipitate forming
ochreous encrustations that degrade the aquatic habitat (Winland et al., 1991; Bigham and
Nordstrom, 2000).
The pH and concentrations and loadings of alkalinity, acidity, and metals such as iron (Fe),
aluminum (Al), and manganese (Mn) in mine effluent and receiving water bodies commonly are
measured to identify potential for environmental effects (Commonwealth of Pennsylvania,
1998a, 1998b, 2002; U.S. Environmental Protection Agency, 2000, 2002a, 2002b). These
parameters also are measured to identify appropriate treatment methods to remove the metals
and maintain neutral pH (Hedin et al., 1994; Skousen et al., 1998). The pH of AMD is an
important measure for evaluating chemical equilibrium, corrosiveness, and aquatic toxicity. The
severity of toxicity or corrosion tends to be greater under low-pH conditions than under near-
neutral conditions. For example, Al is soluble at low pH, and compared to Fe and Mn, relatively
low concentrations of dissolved Al can be toxic (Elder, 1988). Accordingly, the U.S.
Environmental Protection Agency (2000, 2002a, 2002b) recommends pH 6.5 to 8.5 for public
drinking supplies and pH 6.5 to 9.0 for protection of freshwater aquatic life. Furthermore, the
Commonwealth of Pennsylvania (1998a, 1998b, 2002) stipulates that effluent discharged from
active mines must have pH 6.0 to 9.0 and alkalinity greater than acidity.
Different alternatives for treatment of AMD could be appropriate depending on the volume
of the mine discharge, its alkalinity and acidity balance, and the available resources for
construction and maintenance of a treatment system (Hedin et al., 1994; Skousen et al., 1998).
if the effluent is “net alkaline,” the alkalinity exceeds the acidity and the pH will remain near
neutral after complete oxidation of the effluent. Systems that facilitate aeration of the effluent
and retention of precipitated solids are indicated. On the other hand, if the effluent is “net
336
acidic,” the acidity exceeds the alkalinity and the pH will decline to acidic values after complete
oxidation and precipitation of the dissolved metals. Systems that add alkalinity and that
maintain or increase pH are indicated.
Although the correct determination of the alkalinity and acidity balance is critical for
selecting appropriate treatment alternatives or for predicting the outcome if mixing acidic and
alkaline solutions, different methods of analysis and reporting of acidity are practiced (Ott,
1988; Fishman and Friedman, 1989; U.S. Environmental Protection Agency, 1979a; American
Public Health Association, 1998a; Desmier et al., in press). Furthermore, criteria for
determination of net-acidic or net-alkaline solutions have been poorly defined by regulatory
authorities and misapplied by many practitioners. Typically, the net acidity of AMD is
computed by subtracting the alkalinity from the measured “hot” acidity, and vice versa for net
alkalinity (e.g. Brady et al., 1990, 1994; Hedin et al., 1994; Skousen et al., 1998;
Commonwealth of Pennsylvania, 1998a, 1998b). However, as argued by Kirby (2002), the
difference between measured hot acidity and alkalinity can underestimate the alkalinity
requirement and, consequently, result in incorrect identification of treatment alternatives and/or
inadequate treatment. Recently, others have agreed with Kirby (2002) that hot acidity results
should be interpreted as “net acidity.” As will be shown in this paper, the correct interpretation
of hot-acidity data is critical for solutions containing alkalinity and acidity in the form of
dissolved metals. However, the hot acidity may not be analyzed or may be reported incorrectly
as zero for such samples.
Purpose and Scope
This report examines the calculation and interpretation of the “net acidity” or “net alkalinity”
on the basis of commonly measured water-quality data; it complements a companion report by
Kirby and Cravotta (this volume) that explains the theoretical basis for the measurement and
interpretation of acidity and alkalinity. First, background information on the geochemistry of
AMD is presented. Second, field and laboratory data that were acquired during 1999-2003 for a
wide variety of AMD sources in the Anthracite and Bituminous Coalfields in Pennsylvania are
used to illustrate relations among the pH, alkalinity, acidity, and dissolved solute concentrations
and to develop guidelines for their measurement and interpretation.
337
Background
AMD is characterized by elevated concentrations of dissolved sulfate (SO42-), ferrous iron
(Fe2+), and ferric iron (Fe3+) and colloidal or particulate FeIII compounds that are produced by
the microbial oxidation of reduced forms of sulfur and iron in pyrite (FeS2):
FeS2 + 3.5 O2 + H2O Fe2+ + 2 SO42- + 2 H+ (1)
Fe2+ + 0.25 O2 + 2.5 H2O Fe(OH)3 (s) + 2 H+ (2)
The complete, stoichiometric oxidation of pyrite by oxygen (O2) is indicated by combining
Equations 1 and 2. Half the protons (H+), or acid, produced by the complete oxidation of pyrite
results from the oxidation of pyritic sulfur to SO42- (Eqn. 1) and the other half results from the
oxidation of FeII to FeIII and its consequent precipitation as Fe(OH)3 (Eqn. 2).
To avoid confusion between the identity of the aqueous ions and complexes shown in
reactions and the analytical concentrations of chemical constituents, symbols for the total
analytical concentration of chemical constituents are indicated without regard to valence, such
as Fe and SO4. Symbols with superscripted roman numerals are used to indicate the sum of
aqueous species with a specific redox state, for example FeII, FeIII, and MnII.
The “Fe(OH)3” shown in Equation 2 is symbolic for the hydrous FeIII oxide and sulfate
minerals that together form ochres in AMD environments, including goethite (α−FeOOH),
ferrihydrite (nominally Fe5HO8·4H2O), and schwertmannite (Fe8O8(OH)6SO4) (Bigham et al.,
1996; Bigham and Nordstrom, 2000; Yu et al., 1999; Williams et al., 2002). Generally,
ferrihydrite is the predominant precipitate from near-neutral AMD, whereas schwertmannite is
predominant for low-pH AMD; however, both these minerals are metastable, ultimately
recrystallizing to form goethite (Bigham et al., 1996; Yu et al., 1999; Williams et al., 2002). The
transformation of schwertmannite to goethite can cause the associated solution pH to decrease
and concentration of SO4 to increase (Miller, 1980; Bigham et al., 1996).
Near-neutral AMD can form from rock that contains little pyrite or can originate as acidic
AMD that has been neutralized by reaction with calcite (CaCO3) and other minerals containing
Ca, Mg, K, and Na. For example, dissolution of CaCO3 neutralizes acid and can increase the pH
and alkalinity of AMD:
CaCO3 + H+ Ca2+ + HCO3- (3)
338
The alkalinity of near-neutral AMD can be attributed almost entirely to bicarbonate (HCO3-)
derived from the dissolution of carbonate minerals (Eqn. 3) and, to a lesser extent, the microbial
reduction of SO4 (Hedin et al., 1994; Rose and Cravotta, 1998). As the pH of initially acidic
AMD increases to near-neutral values, concentrations of dissolved FeIII, Al, and other metals can
decline as FeIII and Al hydroxides precipitate; concentrations of SO4, FeII, and MnII generally
will not be controlled by the precipitation of hydroxides (Cravotta and Trahan, 1999; Cravotta et
al., 1999). However, under SO4-reducing conditions, the formation of sulfide and carbonate
minerals can limit concentrations of SO4, FeII, and MnII (Drever, 1997; Langmuir, 1997).
As reported previously (Wood, 1976; Wood, 1996) and indicated with data presented later in
this paper, the pH and alkalinity of AMD and other ground-water samples can be unstable. The
pH, alkalinity, and associated properties potentially can change as the sample equilibrates to
atmospheric conditions because of the exsolution of dissolved carbon dioxide (CO2) and
hydrogen sulfide (H2S), the dissolution of O2, and the consequent oxidation of FeII and MnII and
the hydrolysis of FeIII and MnIV. Sample instability results because the chemical reactions that
establish equilibrium between the gaseous, aqueous, and solid phases in a system are not
instantaneous but proceed at different rates. For example, aeration of AMD can rapidly saturate
AMD with O2 and promote the exsolution of CO2 and H2S. Although, the pH ultimately may
decrease to acidic values because of the oxidation of FeII and the consequent precipitation of
Fe(OH)3 (Eqn. 2), initially, the FeII may persist in solution as dissolved CO2 exsolves and pH
increases:
HCO3- CO2 (g) + OH- (4)
H2CO3* CO2 (g) + H2O (5)
where [H2CO3*] = [CO2 (aq)] + [H2CO3o] (Stumm and Morgan, 1996). Ground water and coal-
mine drainage commonly contain elevated concentrations of dissolved CO2 in association with
elevated partial pressure of gaseous CO2 (Pco2) of 10-1.5 to 10-0.5 atm in the vadose zone and/or
underlying saturated zone (Cravotta et al., 1994; Langmuir, 1997; Rose and Cravotta, 1998).
After the AMD emerges or has been sampled, the CO2 eventually will exsolve until
concentrations of dissolved CO2 equilibrate with atmospheric Pco2 of 10-3.5 atm. The exsolution
of CO2 from the AMD (Eqns. 4 and 5 go to the right) can be accelerated by aggressive aeration
(Jageman et al., 1988) or heating of the solution (Langmuir, 1997; American Society for Testing
339
and Materials, 2000). Note that if solids are not dissolved or precipitated as CO2 exsolves, the
acidity due to H2CO3* will decrease and the pH will increase while the alkalinity is conserved
(Cravotta and Hilgar, 2000). In some cases, the increased pH could result in saturation with
CaCO3 (calcite or aragonite) and its precipitation by the reverse of Equation 3. The precipitation
of Fe(OH)3 and other solids, including CaCO3, along flowpaths or while samples are in storage
will consume some of the alkalinity in solution.
The potential for consumption of alkalinity, or the release of H+ as a product of oxidation,
hydrolysis, and precipitation processes, can be measured or computed as the “acidity” of a
solution. The acidity of AMD results mainly from the potential for hydrolysis of dissolved FeII,
FeIII, Al, and MnII and the precipitation of associated solid hydroxide compounds. Generally,
except for extremely low-pH solutions, dissolved Fe in AMD is predominantly FeII. Because
dissolved CO2 tends to be minimized by aeration of water under atmospheric conditions, its
acidity contribution is considered temporary and thus is not counted by methods used to measure
or compute the acidity of AMD (Rose and Cravotta, 1998; Kirby and Cravotta, this volume). if
a sample has acidity in excess of alkalinity (net acidic), the pH ultimately can decline to acidic
values (pH < 4.5). For example, during 1999-2001, the streamwater in Shamokin Creek near
Shamokin, Pa., as it exited the coal-mined part of the watershed was consistently near-neutral
with pH 5.9 to 6.4, but it was net acidic with elevated concentrations of dissolved SO4 and FeII
ranging from 260 to 370 mg/L and 10 to 15 mg/L, respectively (Cravotta and Kirby, 2003).
Despite dilution by “clean” tributaries that more than doubled the streamflow of Shamokin
Creek at Sunbury, 32 km downstream from Shamokin, during 1999-2001, the streamwater at
Sunbury had pH as low as 4.0 and dissolved SO4 and FeII concentrations as high as 280 mg/L
and 1.7 mg/L, respectively. Cravotta and Kirby (2003) attributed the decline in pH to the
oxidation and hydrolysis of dissolved FeII and a corresponding deficiency of alkalinity necessary
to buffer the acid generated by this process.
The rate of oxidation of dissolved FeII can be slow under environmental conditions,
depending on the temperature, pH, concentrations of dissolved O2 and FeII, and activities of
biological and/or abiological catalysts (Nordstrom, 1985; Stumm and Morgan, 1996; Kirby et
al., 1999). Although dissolved CO2 may equilibrate with the atmosphere and FeII can be
oxidized in a timeframe of minutes to days, transformations of initially formed solids to more
stable phases, such as the conversion of ferrihydrite or schwertmannite to goethite (Miller, 1980;
340
Bigham et al., 1996), can require months or years. These kinetic factors are minimized with the
standard “hot peroxide treatment” acidity method (U.S. Environmental Protection Agency,
1979a; American Public Health Association, 1998a; American Society for Testing and Materials,
2000) in which the sample is initially titrated with sulfuric acid (H2SO4) to pH ~ 4.0, unbuffered
hydrogen peroxide (H2O2) is added, and then the sample is boiled and cooled prior to titration
with sodium hydroxide (NaOH) to the endpoint pH of 8.2 or 8.3. The first two steps promote
the exsolution of CO2 and the oxidation of dissolved FeII and MnII. Except for the endpoint pH
of 8.2 for the U.S. Environmental Protection Agency (1979a) and the endpoint pH of 8.3 for the
American Public Health Association (1998a) and American Society for Testing and Materials
(2000), these “hot peroxide treatment” procedures for measuring acidity are equivalent.
Hereinafter, acidity measured by these methods is referred to as the “hot” acidity.
Methods of Data Collection and Analysis
Sample Site Selection
Field and laboratory data were acquired for the chemistry of nearly 200 abandoned coal-
mine drainage sites in Pennsylvania that represented a wide range of solution compositions. In
all these samples, dissolved iron, manganese, and/or aluminum were the predominant sources of
acidity due to metals.
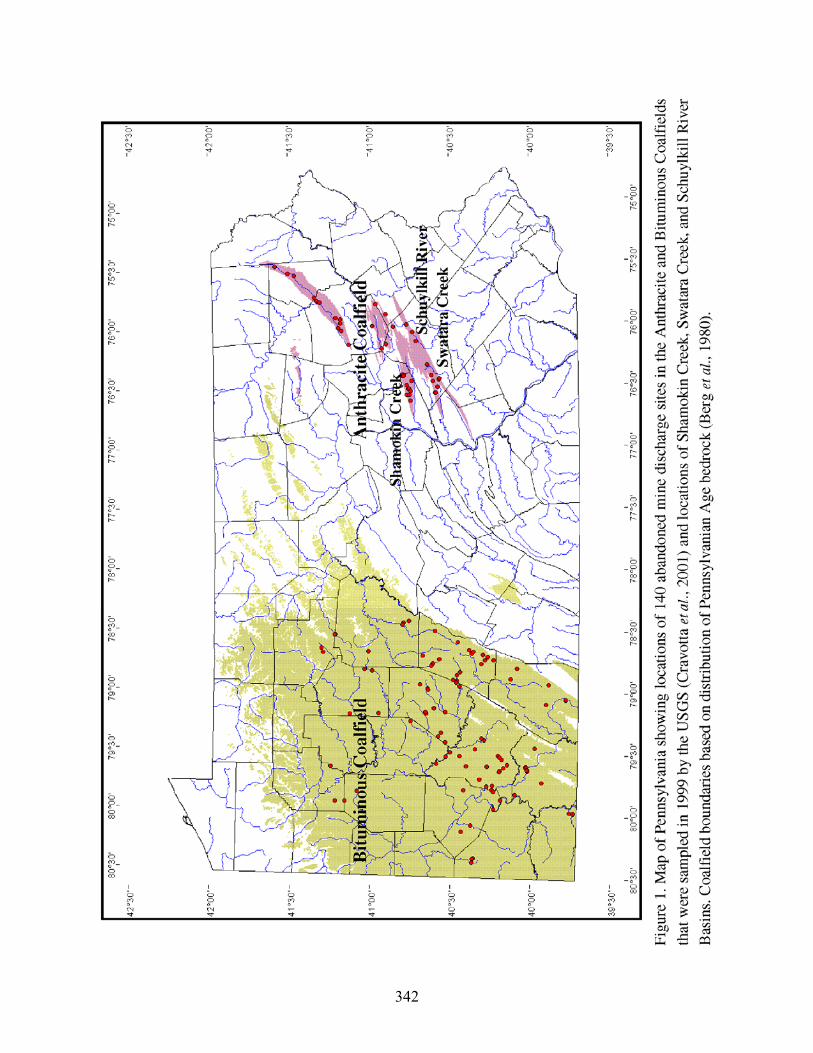
In 1999, discharges from 140 abandoned underground coal mines in the bituminous and
anthracite coalfields of Pennsylvania (Fig. 1) were sampled for analysis of chemical
concentrations and loading (Cravotta et al., 2001). The 99 bituminous discharges previously had
been studied by the Southern Alleghenies Conservancy (1998). The 41 anthracite discharges
previously had been studied by the U.S. Geological Survey (USGS) (Growitz et al., 1985;
Wood, 1996). Nevertheless, these prior reports did not include data on the “hot” acidity or the
pH of oxidized samples.
In March 2000, discharges from 45 abandoned anthracite mines in the Shamokin Creek
Basin, Western Middle Anthracite Field, Pa., were sampled to assess the effects of AMD on the
streamwater quality (Cravotta and Kirby, 2003). Most of these discharges were from
underground mines, but seepage from spoil also was sampled. These data included values for
“hot” acidities and dissolved metals, but they did not include the pH of oxidized samples.
341
Lastly, in June 2003, discharges from eight abandoned, underground anthracite mines in the
Wiconisco Creek, Swatara Creek and Schuylkill River Basins, Southern Anthracite Field, Pa.,
were sampled and analyzed by various methods for this study to evaluate differences among the
methods for acidity determination, effects of sample storage, and associated relations among the
acidities, pH, alkalinity, and metals concentrations.
Water-Quality Sampling and Analysis
In accordance with standard methods, field data for flow rate, temperature, specific
conductance (SC), dissolved O2, pH, and redox potential (Eh) were measured at each site when
samples were collected (Rantz et al., 1982a, 1982b; Wood, 1976; U.S. Geological Survey, 1997
to present; Ficklin and Mosier, 1999). All meters were calibrated in the field using electrodes
and standards that had been thermally equilibrated to sample temperatures. Field pH and Eh
were determined using a combination Pt and Ag/AgCl electrode with a pH sensor. The electrode
was calibrated in pH 2.0, 4.0, and 7.0 buffer solutions and in Zobell’s solution (Wood, 1976;
U.S. Geological Survey, 1997 to present). Values for Eh were corrected to 25 °C relative to the
standard hydrogen electrode in accordance with methods of Nordstrom (1977). Water samples
were collected into sample-rinsed 3-L Teflon bottles and then split into sample-rinsed
polyethylene bottles. An unfiltered subsample for analysis of acidity and alkalinity was capped
leaving no head space and stored on ice. Two subsamples for analysis of “dissolved” anions and
cations plus silica were filtered through a 0.45-µm pore-size nitrocellulose capsule filter. The
subsample for cation analysis was preserved with nitric acid to pH < 2.
342
343
All samples were processed using consistent, standard methods for analysis of alkalinity,
anions, and cations. The unfiltered subsamples were analyzed for alkalinity in the laboratory
within 48 hours of sampling by titration with H2SO4 to the endpoint pH of 4.5 (U.S.
Environmental Protection Agency, 1979b; American Public Health Association, 1998b;
American Society for Testing and Materials, 2000). The pH before and during titrations was
measured using a liquid-filled combination Ag/AgCl pH electrode calibrated in pH 4.0, 7.0, and
10.0 buffer solution. Sulfate and chloride in the filtered, unpreserved samples were analyzed by
ion chromatography (IC) (Fishman and Friedman, 1989; Crock et al., 1999). Concentrations of
major cations, silica, and trace elements in the filtered, acidified samples were determined using
inductively coupled plasma atomic emission spectroscopy (ICP-AES) and inductively coupled
plasma emission mass spectrometry (ICP-MS) (Fishman and Friedman, 1989; Crock et al.,
1999). All samples collected in 1999 were analyzed in replicate by one or more of the methods
and at two or more laboratories. Results for replicate analyses were averaged. Charge
imbalances routinely were less than 5% relative to the mean of cation and anion equivalents.
Initially, for the 140 AMD samples collected in 1999, only the “cold” acidity was measured
based on the first author’s judgment that the “hot” acidity would be redundant with other
available data for the computed acidity and alkalinity. The “cold” acidity was measured in the
laboratory within 48 hours of sampling by titration at ambient temperature with NaOH to the
endpoint pH of 8.3 after the addition of H2O2; samples containing alkalinity were not initially
titrated with H2SO4, and samples were not boiled. In 2003, after discussion with A. W. Rose
(2003, written commun.) and the second author about potential for the “hot” acidity of stored
samples to be stable, all available unpreserved subsamples (126 of 140) that had been collected
in 1999 and archived at room temperature were analyzed for pH, alkalinity, and “hot” acidity in
accordance with standard methods (American Public Health Association, 1998a, 1998b). These
data were considered necessary to evaluate measured and computed acidity and the ultimate
potential for pH to be acidic or neutral. In figures illustrating the data, these measurements on
“aged” samples are identified accordingly.
For the Shamokin AMD samples collected in March 2000 and the Wiconisco-Swatara-
Schuylkill AMD samples collected in June 2003, the standard method “hot” acidity (American
Public Health Association, 1998a) was measured on unfiltered samples in the laboratory within
48 hours of sampling. For Shamokin AMD samples that had pH > 6.5, the “hot” acidity values
344
were reported as “zero” when, if fact, titrations were not actually performed on these samples.
As discussed later, some of these samples would have reported positive hot acidity titration
values and others negative values.
To evaluate differences among the methods for acidity determination, effects of sample
storage, and associated relations among the acidities, pH, alkalinity, and metals concentrations,
various measurements of pH, alkalinity, and acidity were performed for the Swatara-Schuylkill
AMD samples. In addition to its measurement in the field, the pH was measured on stored
samples, with and without H2O2 added, within 24 hours of sampling, after 7 days, and after 5
months. Alkalinity, “hot” acidity, and “cold” acidity also were measured on the fresh and 5-
month old samples by methods described above.
Aqueous Speciation Computations
Activities of aqueous species were calculated using the WATEQ4F data base with the
WATEQ4F (Ball and Nordstrom, 1991; Drever, 1997) and PHREEQC (Parkhurst and Appelo,
1999) computer programs. The concentrations and activities of FeII and FeIII species were
computed on the basis of the Eh, temperature, and ionic strength of fresh samples. Nordstrom
(1977) and Nordstrom et al. (1979) have shown there is good agreement between the measured
Eh and that predicted by the FeII/FeIII couple in acidic mine waters. Results expressed as
molalities for selected species were used to compute the acidity due to H+ and dissolved metals.
PHREEQC (Parkhurst and Appelo, 1999) also was used to simulate the acidimetric titration
of the Swatara-Schuylkill samples with NaOH. Modeled solutions were oxidized by O2 and
equilibrated with atmospheric CO2. The pH was decreased from the initial values by fixing pH
to 4.0 with H2SO4, and then the pH was increased by adding aliquots of NaOH. Specific solid
phases, including ferrihydrite and amorphous Al(OH)3, were allowed to precipitate to maintain
solubility equilibrium. Charge balance was established by adjusting sulfate concentration prior
to speciation computations.
Computation of Acidity and Net alkalinity
The acidity due to metals was computed from pH and dissolved metals concentrations in
milligrams per liter:
Aciditycomputed (mg/L CaCO3) = 50.(10(3-pH) + 2.CFe/55.8 + 2.CMn/54.9 + 3.CAl/27.0) (6)
345
Hedin et al. (1994) and Rose and Cravotta (1998) described a similar computation in which
separate contributions from dissolved FeII and FeIII are considered; this method also was
evaluated. Nevertheless, owing to its relatively low solubility and tendency to hydrolyze at low
pH, FeIII will not contribute much acidity over a pH range from 2.5 to 8.3 as explained below. In
Equation 6, acid equivalents as H+ (OH- neutralizing capacity) of 2 per mole of Fe and Mn and 3
per mole of Al were assumed based on the relevant hydrolysis constants, pK1 and pK2, at 25 °C
from Ball and Nordstrom (1991) and the potential for the dissolved metals to hydrolyze over a
pH range from 2.5 to 8.3. Uncomplexed Fe2+ and Mn2+ ions have 2 equivalents per mole and
tend to predominate over FeII and MnII hydroxyl species in AMD with pH < 8.3 (pK1 = 9.5, Fe2+
Fe(OH)+; pK1 = 10.6, Mn2+ Mn(OH)+). In contrast, the acid equivalence of FeIII varies
over the relevant pH range. At pH > 2.2, dissolved FeIII has less than 3 equivalents per mole
because of the tendency for Fe3+ to form hydroxyl complexes (pK1 = 2.2, Fe3+ Fe(OH)2+;
pK2 = 3.5, Fe(OH)2+ Fe(OH)2+). At pH < 5, uncomplexed Al3+ ions, with 3 equivalents per
mole, tend to be dominant (pK1 = 5.0, Al3+ Al(OH)2+; pK2 = 5.2, Al(OH)2+ Al(OH)2+).
Because SO42- is a principal component and is not involved in hydrolysis reactions at pH 8.3, the
formation of metal-sulfate complexes does not affect the equivalent acidities of the dissolved
metals.
Considering the different tendencies for metal hydrolysis and corresponding differences in
the OH- neutralizing capacities for various aqueous species, a more precise estimate of the
acidity can be computed
Acidityspeciated (mg/L CaCO3) = 50.Σ (ei . mMi) (7)
where the concentration for each species (mMi) in millimoles is multiplied by its acid
equivalents per millimole (ei). Kirby and Cravotta (this volume) provide a detailed explanation
of the acidity contributions due to different aqueous species. The acid equivalent values ranged
from -1 to +4 on the basis of the principal aqueous components at the titration endpoint pH of
8.3. Because the titrated acidity measures base consumption by all hydrolyzable species, the
acidity computed on the basis of aqueous speciation considered contributions from FeII, FeIII,
MnII, and Al species, plus bisulfate (HSO4-) and associated complexes. For example, values
were assigned for equivalent acidity of -1 for Al(OH)4-, 0 for Al(OH)3
0, 1 for Al(OH)2+, 2 for
346
Al(OH)2+, 3 for Al3+ and AlSO4+, and 4 for AlHSO4
2+, with consistent values for other metal
species (Kirby and Cravotta, this volume).
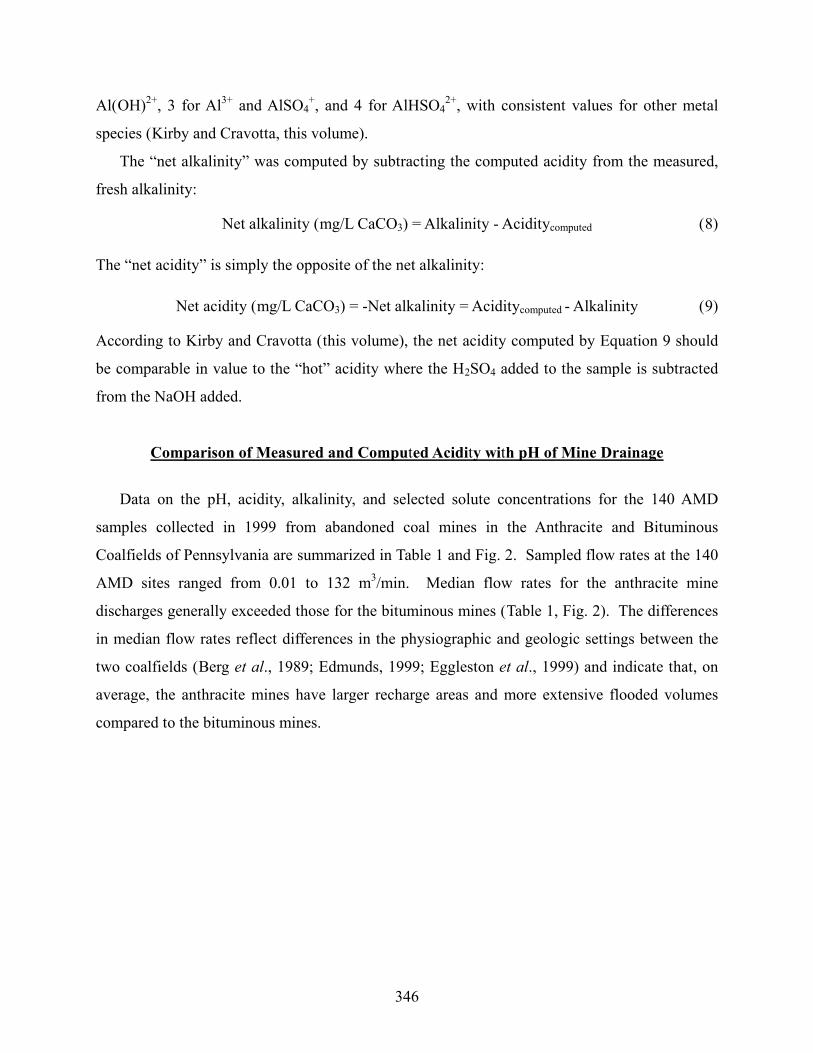
The “net alkalinity” was computed by subtracting the computed acidity from the measured,
fresh alkalinity:
Net alkalinity (mg/L CaCO3) = Alkalinity - Aciditycomputed (8)
The “net acidity” is simply the opposite of the net alkalinity:
Net acidity (mg/L CaCO3) = -Net alkalinity = Aciditycomputed - Alkalinity (9)
According to Kirby and Cravotta (this volume), the net acidity computed by Equation 9 should
be comparable in value to the “hot” acidity where the H2SO4 added to the sample is subtracted
from the NaOH added.
Comparison of Measured and Computed Acidity with pH of Mine Drainage
Data on the pH, acidity, alkalinity, and selected solute concentrations for the 140 AMD
samples collected in 1999 from abandoned coal mines in the Anthracite and Bituminous
Coalfields of Pennsylvania are summarized in Table 1 and Fig. 2. Sampled flow rates at the 140
AMD sites ranged from 0.01 to 132 m3/min. Median flow rates for the anthracite mine
discharges generally exceeded those for the bituminous mines (Table 1, Fig. 2). The differences
in median flow rates reflect differences in the physiographic and geologic settings between the
two coalfields (Berg et al., 1989; Edmunds, 1999; Eggleston et al., 1999) and indicate that, on
average, the anthracite mines have larger recharge areas and more extensive flooded volumes
compared to the bituminous mines.

347
348
349
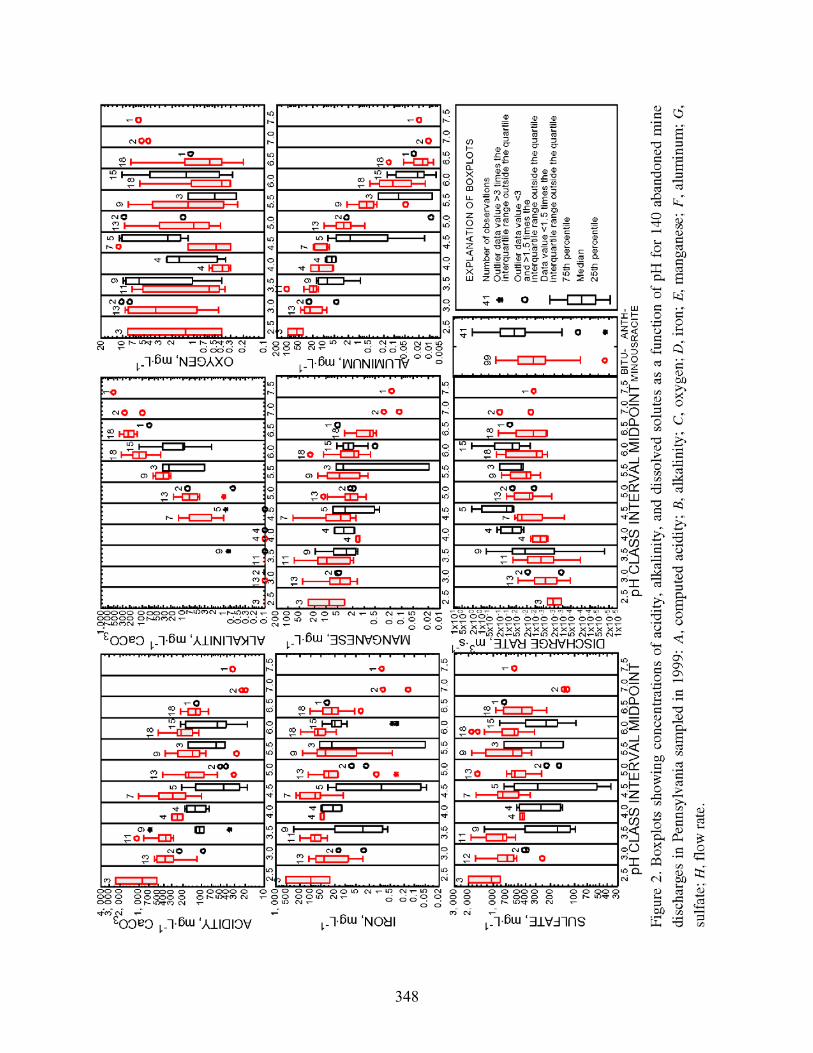
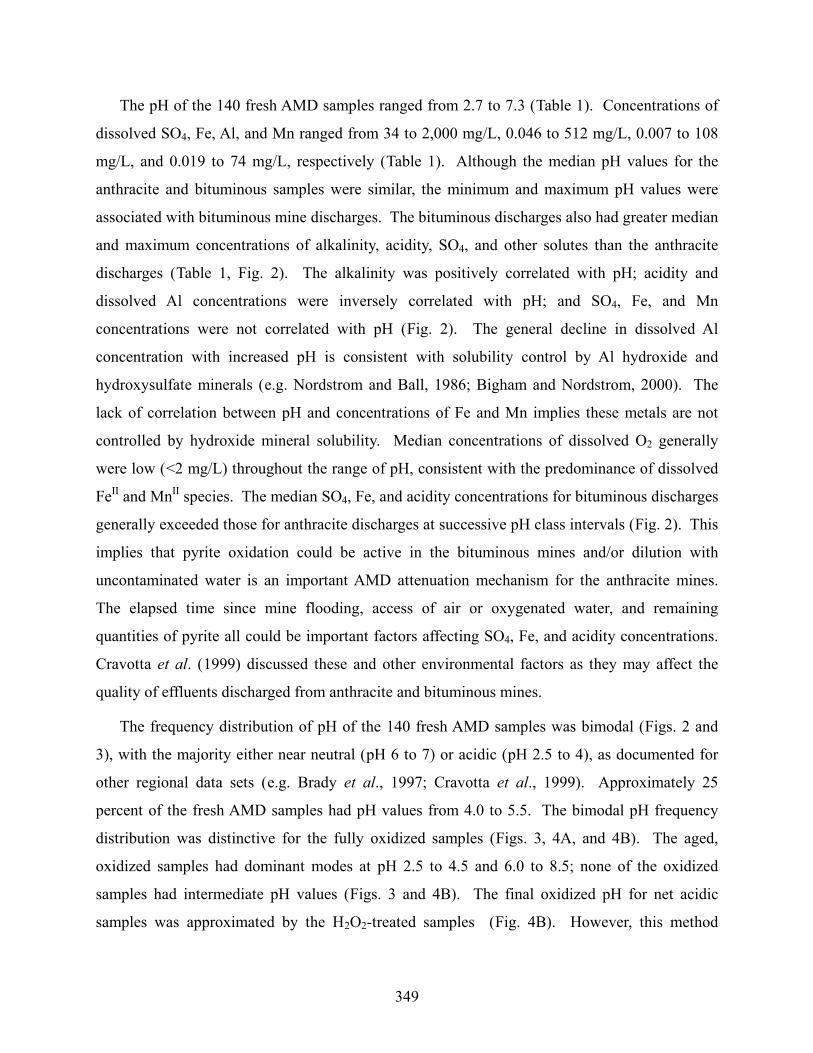
The pH of the 140 fresh AMD samples ranged from 2.7 to 7.3 (Table 1). Concentrations of
dissolved SO4, Fe, Al, and Mn ranged from 34 to 2,000 mg/L, 0.046 to 512 mg/L, 0.007 to 108
mg/L, and 0.019 to 74 mg/L, respectively (Table 1). Although the median pH values for the
anthracite and bituminous samples were similar, the minimum and maximum pH values were
associated with bituminous mine discharges. The bituminous discharges also had greater median
and maximum concentrations of alkalinity, acidity, SO4, and other solutes than the anthracite
discharges (Table 1, Fig. 2). The alkalinity was positively correlated with pH; acidity and
dissolved Al concentrations were inversely correlated with pH; and SO4, Fe, and Mn
concentrations were not correlated with pH (Fig. 2). The general decline in dissolved Al
concentration with increased pH is consistent with solubility control by Al hydroxide and
hydroxysulfate minerals (e.g. Nordstrom and Ball, 1986; Bigham and Nordstrom, 2000). The
lack of correlation between pH and concentrations of Fe and Mn implies these metals are not
controlled by hydroxide mineral solubility. Median concentrations of dissolved O2 generally
were low (<2 mg/L) throughout the range of pH, consistent with the predominance of dissolved
FeII and MnII species. The median SO4, Fe, and acidity concentrations for bituminous discharges
generally exceeded those for anthracite discharges at successive pH class intervals (Fig. 2). This
implies that pyrite oxidation could be active in the bituminous mines and/or dilution with
uncontaminated water is an important AMD attenuation mechanism for the anthracite mines.
The elapsed time since mine flooding, access of air or oxygenated water, and remaining
quantities of pyrite all could be important factors affecting SO4, Fe, and acidity concentrations.
Cravotta et al. (1999) discussed these and other environmental factors as they may affect the
quality of effluents discharged from anthracite and bituminous mines.
The frequency distribution of pH of the 140 fresh AMD samples was bimodal (Figs. 2 and
3), with the majority either near neutral (pH 6 to 7) or acidic (pH 2.5 to 4), as documented for
other regional data sets (e.g. Brady et al., 1997; Cravotta et al., 1999). Approximately 25
percent of the fresh AMD samples had pH values from 4.0 to 5.5. The bimodal pH frequency
distribution was distinctive for the fully oxidized samples (Figs. 3, 4A, and 4B). The aged,
oxidized samples had dominant modes at pH 2.5 to 4.5 and 6.0 to 8.5; none of the oxidized
samples had intermediate pH values (Figs. 3 and 4B). The final oxidized pH for net acidic
samples was approximated by the H2O2-treated samples (Fig. 4B). However, this method
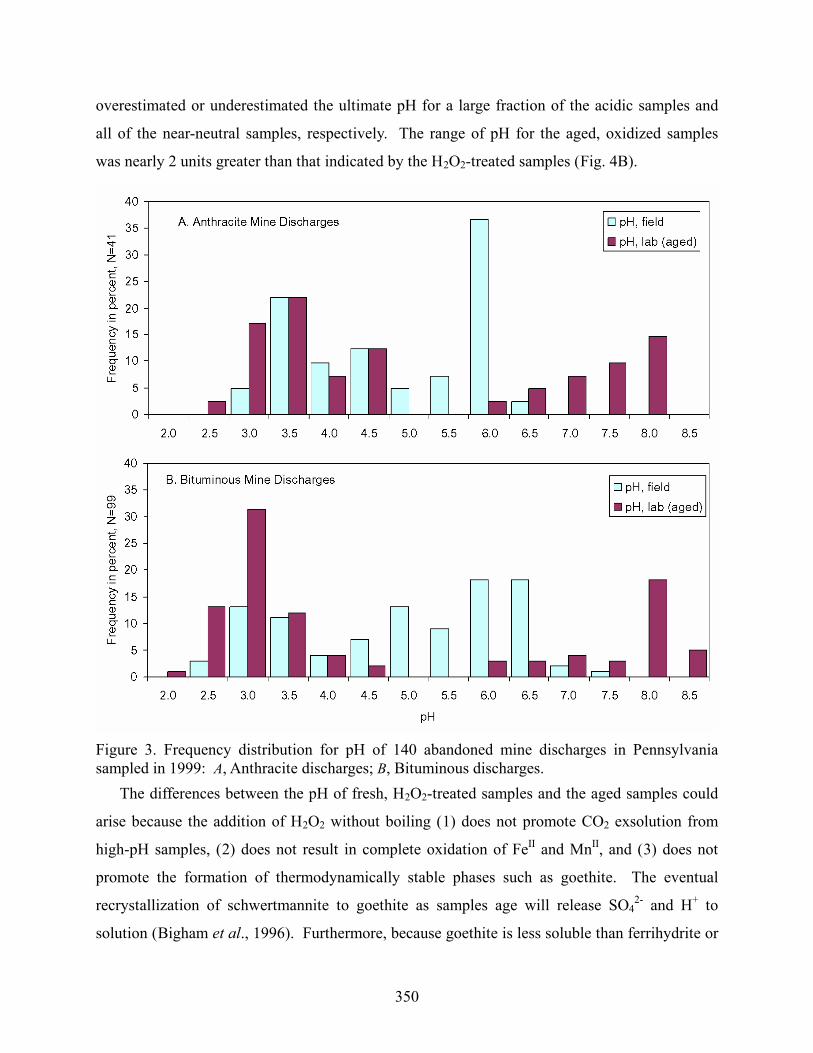
350
overestimated or underestimated the ultimate pH for a large fraction of the acidic samples and
all of the near-neutral samples, respectively. The range of pH for the aged, oxidized samples
was nearly 2 units greater than that indicated by the H2O2-treated samples (Fig. 4B).
Figure 3. Frequency distribution for pH of 140 abandoned mine discharges in Pennsylvania sampled in 1999: A, Anthracite discharges; B, Bituminous discharges. The differences between the pH of fresh, H2O2-treated samples and the aged samples could
arise because the addition of H2O2 without boiling (1) does not promote CO2 exsolution from
high-pH samples, (2) does not result in complete oxidation of FeII and MnII, and (3) does not
promote the formation of thermodynamically stable phases such as goethite. The eventual
recrystallization of schwertmannite to goethite as samples age will release SO42- and H+ to
solution (Bigham et al., 1996). Furthermore, because goethite is less soluble than ferrihydrite or
351
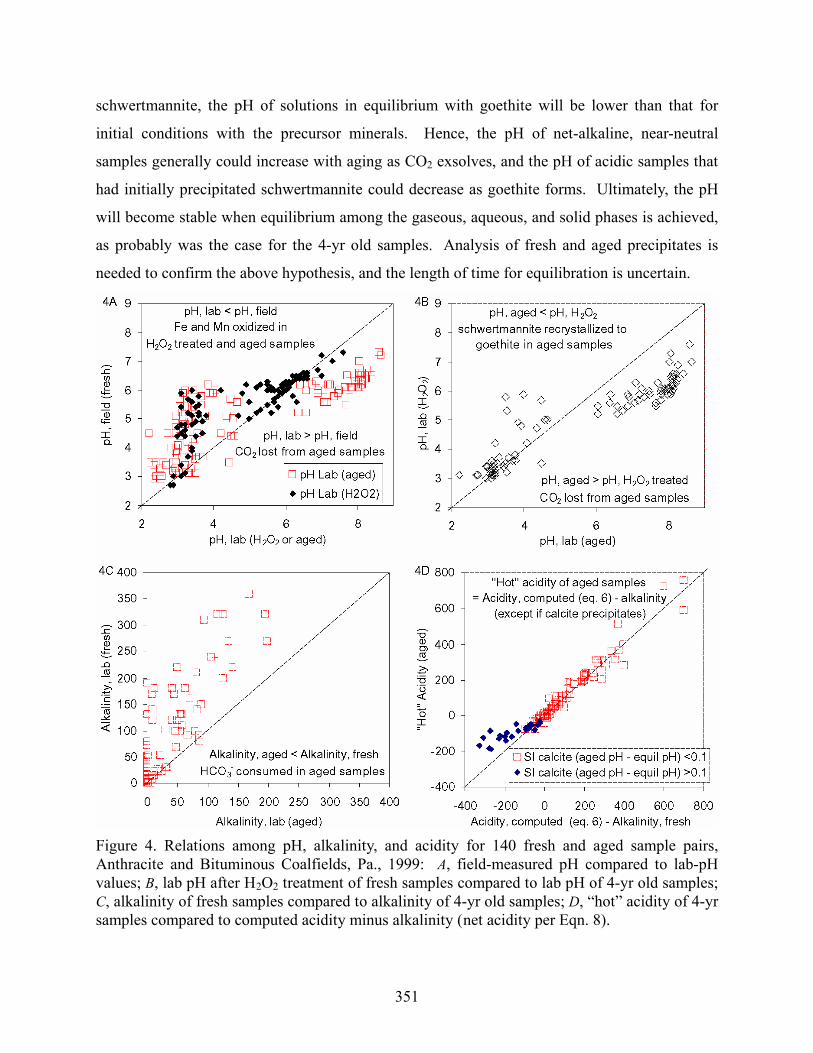
schwertmannite, the pH of solutions in equilibrium with goethite will be lower than that for
initial conditions with the precursor minerals. Hence, the pH of net-alkaline, near-neutral
samples generally could increase with aging as CO2 exsolves, and the pH of acidic samples that
had initially precipitated schwertmannite could decrease as goethite forms. Ultimately, the pH
will become stable when equilibrium among the gaseous, aqueous, and solid phases is achieved,
as probably was the case for the 4-yr old samples. Analysis of fresh and aged precipitates is
needed to confirm the above hypothesis, and the length of time for equilibration is uncertain.
Figure 4. Relations among pH, alkalinity, and acidity for 140 fresh and aged sample pairs, Anthracite and Bituminous Coalfields, Pa., 1999: A, field-measured pH compared to lab-pH values; B, lab pH after H2O2 treatment of fresh samples compared to lab pH of 4-yr old samples; C, alkalinity of fresh samples compared to alkalinity of 4-yr old samples; D, “hot” acidity of 4-yr samples compared to computed acidity minus alkalinity (net acidity per Eqn. 8).
352
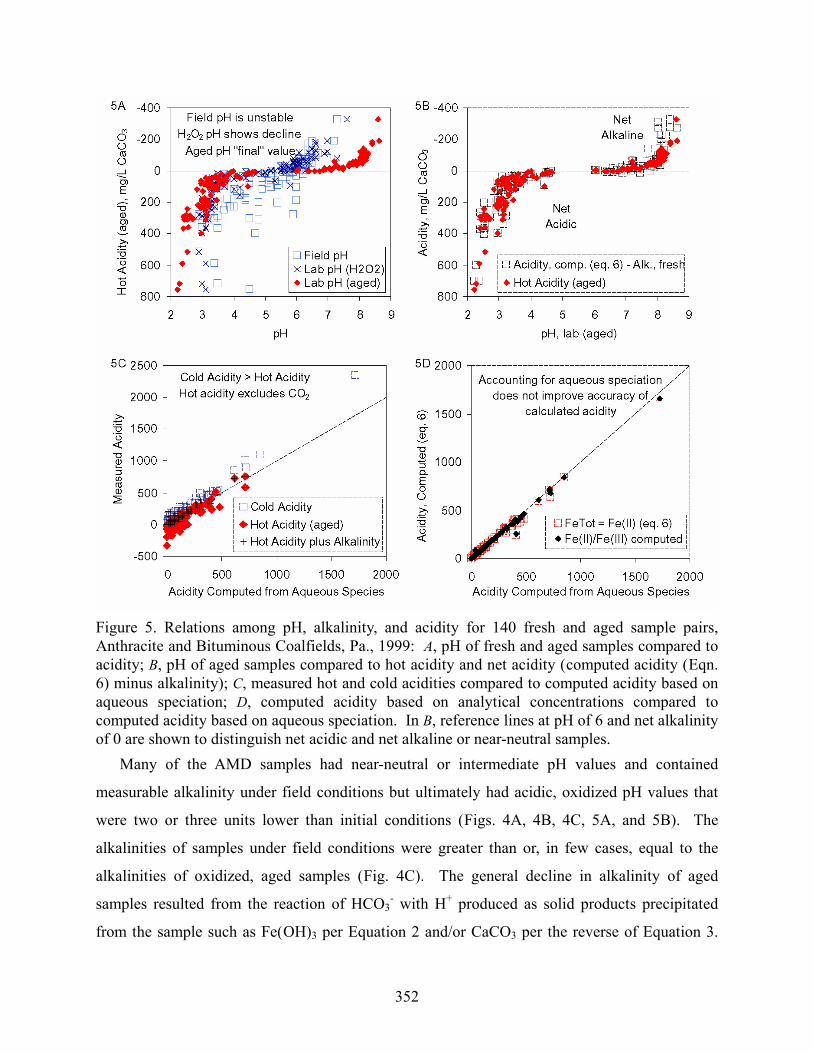
Figure 5. Relations among pH, alkalinity, and acidity for 140 fresh and aged sample pairs, Anthracite and Bituminous Coalfields, Pa., 1999: A, pH of fresh and aged samples compared to acidity; B, pH of aged samples compared to hot acidity and net acidity (computed acidity (Eqn. 6) minus alkalinity); C, measured hot and cold acidities compared to computed acidity based on aqueous speciation; D, computed acidity based on analytical concentrations compared to computed acidity based on aqueous speciation. In B, reference lines at pH of 6 and net alkalinity of 0 are shown to distinguish net acidic and net alkaline or near-neutral samples. Many of the AMD samples had near-neutral or intermediate pH values and contained
measurable alkalinity under field conditions but ultimately had acidic, oxidized pH values that
were two or three units lower than initial conditions (Figs. 4A, 4B, 4C, 5A, and 5B). The
alkalinities of samples under field conditions were greater than or, in few cases, equal to the
alkalinities of oxidized, aged samples (Fig. 4C). The general decline in alkalinity of aged
samples resulted from the reaction of HCO3- with H+ produced as solid products precipitated
from the sample such as Fe(OH)3 per Equation 2 and/or CaCO3 per the reverse of Equation 3.
353
The oxidized pH values were consistent with the measured “hot” acidity and the net acidity
computed as the acidity due to dissolved metals (Eqn. 6) minus the fresh alkalinity (Eqn. 9).
Samples that had near-neutral pH after oxidation had negative values for hot acidity; samples
that had acidic pH after oxidation had positive hot acidity (Figs. 4A, 4B, 5A, and 5B).
Calculated net acidity generally was the same as the measured hot acidity, with the exception
of high-pH samples that may have precipitated calcite (Figs. 4D and 5D). Assuming equivalents
of 2 per mole of dissolved Fe and Mn and 3 per mole of dissolved Al per Equation 6, computed
acidity and corresponding values of net acidity or net alkalinity generally compared well with
the “hot” acidity measured for fresh or aged samples (Figs. 4D, 5B, 5D).
The data on pH, hot acidity, and net acidity for the Wiconisco-Swatara-Schuylkill AMD
samples from the Southern Anthracite Field (Fig. 6) and the Shamokin AMD samples from the
Western Middle Anthracite Field (Fig. 7) illustrated consistent relations as those described
above. The pH of the Wiconisco-Swatara-Schuylkill AMD samples ranged from 3.4 to 6.0, and
concentrations of dissolved SO4, Fe, Al, and Mn ranged from 75 to 1,090 mg/ L, 0.16 to 200
mg/L, 0.005 to 11.4 mg/L, and 1.0 to 8.2 mg/L, respectively (Table 2). The pH of the Shamokin
AMD samples ranged from 2.6 to 6.7, and concentrations of dissolved SO4, Fe, Al, and Mn
ranged from 8.4 to 802 mg/L, 0.04 to 57.4 mg/L, <0.20 to 35.8 mg/L, and 0.01 to 7.1 mg/L,
respectively (Table 2).
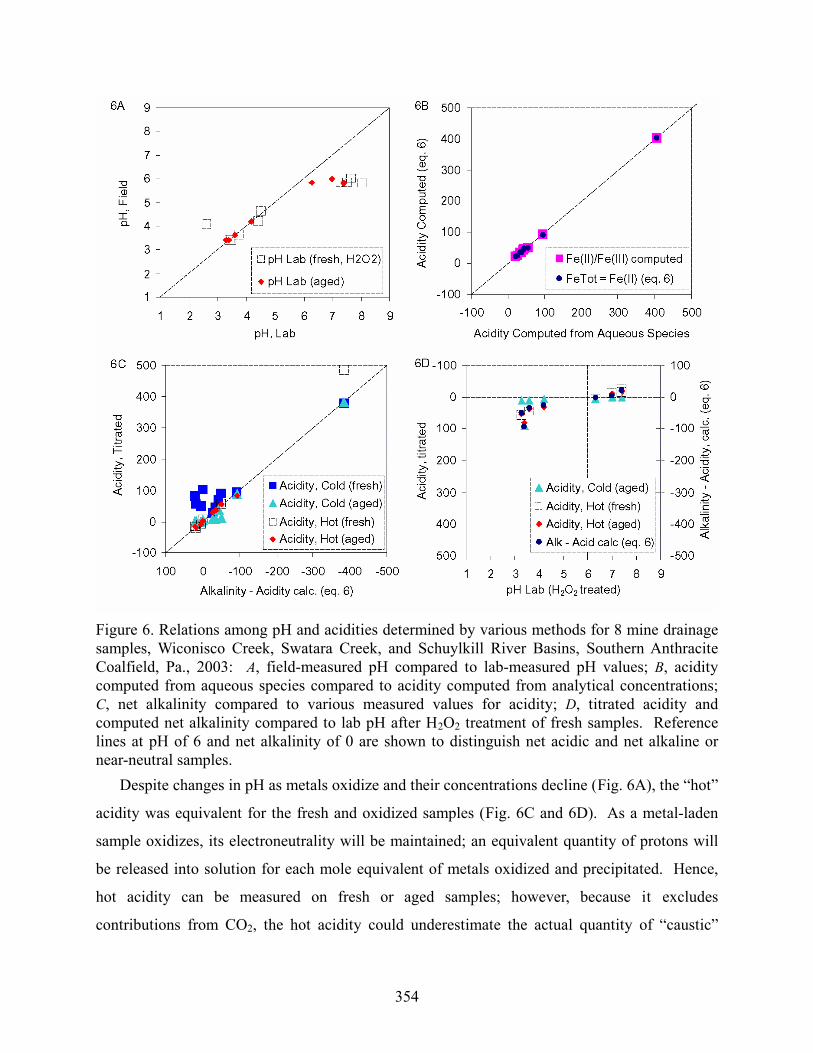
Acidities measured on the fresh and 5-month aged Wiconisco-Swatara-Schuylkill AMD
samples indicated that the hot acidity was stable, whereas the cold acidity was not (Fig. 6C).
The cold acidity on fresh samples was greater than that for aged samples, and it was greater than
or equal to the hot acidity (Figs. 5C and 6C). Larger values of cold acidity on fresh samples
compared to aged samples and compared to the hot or computed acidity result from CO2 and
H2S that is included in the cold acidity measurement but that largely will be eliminated by
aeration and exsolution of these dissolved gases during hot acidity titration or under atmospheric
conditions as samples aged.
354
Figure 6. Relations among pH and acidities determined by various methods for 8 mine drainage samples, Wiconisco Creek, Swatara Creek, and Schuylkill River Basins, Southern Anthracite Coalfield, Pa., 2003: A, field-measured pH compared to lab-measured pH values; B, acidity computed from aqueous species compared to acidity computed from analytical concentrations; C, net alkalinity compared to various measured values for acidity; D, titrated acidity and computed net alkalinity compared to lab pH after H2O2 treatment of fresh samples. Reference lines at pH of 6 and net alkalinity of 0 are shown to distinguish net acidic and net alkaline or near-neutral samples. Despite changes in pH as metals oxidize and their concentrations decline (Fig. 6A), the “hot”
acidity was equivalent for the fresh and oxidized samples (Fig. 6C and 6D). As a metal-laden
sample oxidizes, its electroneutrality will be maintained; an equivalent quantity of protons will
be released into solution for each mole equivalent of metals oxidized and precipitated. Hence,
hot acidity can be measured on fresh or aged samples; however, because it excludes
contributions from CO2, the hot acidity could underestimate the actual quantity of “caustic”
355
chemicals, such as NaOH or lime, needed to neutralize AMD without preaeration (e.g. Jageman
et al., 1988; Means and Hilton, this volume). An evaluation of the difference between the cold
acidity on fresh samples and the hot acidity could be useful to indicate the potential benefit of
aeration before adding base chemicals to AMD.
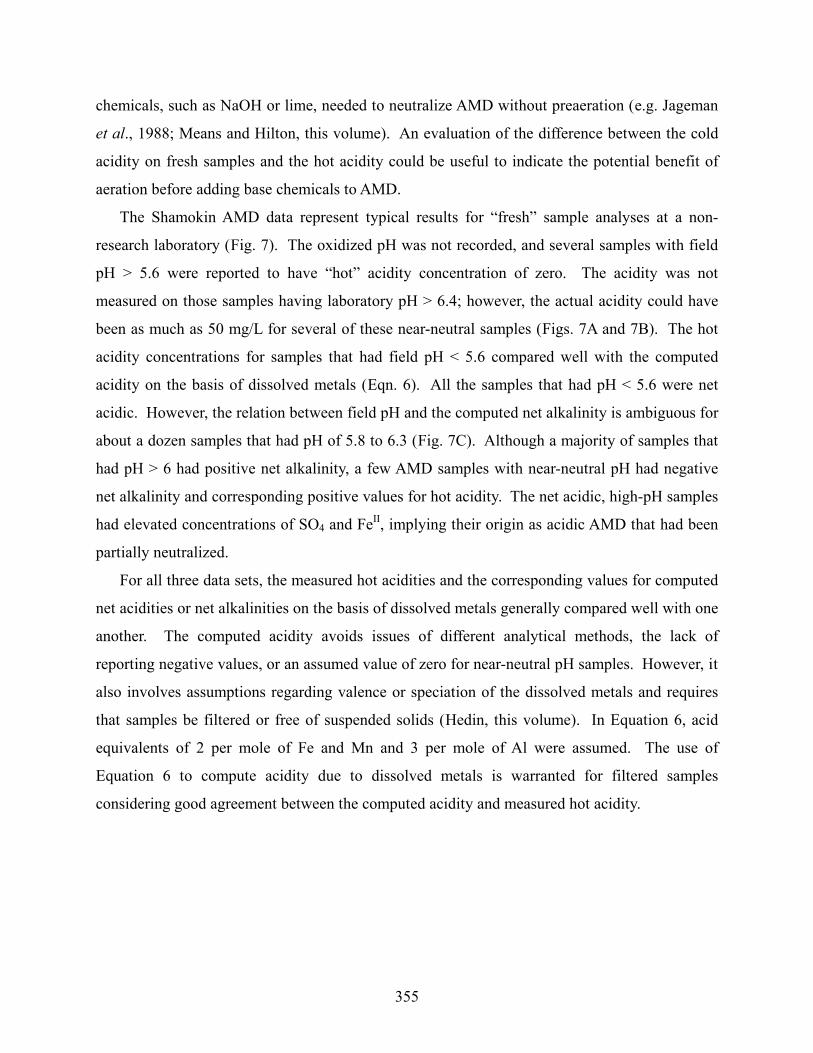
The Shamokin AMD data represent typical results for “fresh” sample analyses at a non-
research laboratory (Fig. 7). The oxidized pH was not recorded, and several samples with field
pH > 5.6 were reported to have “hot” acidity concentration of zero. The acidity was not
measured on those samples having laboratory pH > 6.4; however, the actual acidity could have
been as much as 50 mg/L for several of these near-neutral samples (Figs. 7A and 7B). The hot
acidity concentrations for samples that had field pH < 5.6 compared well with the computed
acidity on the basis of dissolved metals (Eqn. 6). All the samples that had pH < 5.6 were net
acidic. However, the relation between field pH and the computed net alkalinity is ambiguous for
about a dozen samples that had pH of 5.8 to 6.3 (Fig. 7C). Although a majority of samples that
had pH > 6 had positive net alkalinity, a few AMD samples with near-neutral pH had negative
net alkalinity and corresponding positive values for hot acidity. The net acidic, high-pH samples
had elevated concentrations of SO4 and FeII, implying their origin as acidic AMD that had been
partially neutralized.
For all three data sets, the measured hot acidities and the corresponding values for computed
net acidities or net alkalinities on the basis of dissolved metals generally compared well with one
another. The computed acidity avoids issues of different analytical methods, the lack of
reporting negative values, or an assumed value of zero for near-neutral pH samples. However, it
also involves assumptions regarding valence or speciation of the dissolved metals and requires
that samples be filtered or free of suspended solids (Hedin, this volume). In Equation 6, acid
equivalents of 2 per mole of Fe and Mn and 3 per mole of Al were assumed. The use of
Equation 6 to compute acidity due to dissolved metals is warranted for filtered samples
considering good agreement between the computed acidity and measured hot acidity.
356
Practical Considerations and Conclusions
Regional data for mine-drainage quality in Pennsylvania indicate that: (1) The pH of
oxidized mine drainage has a distinctive bimodal frequency distribution, with modes at pH 2.5 to
4 (acidic) and pH 6 to 8.5 (near neutral); oxidized samples have acidic or near-neutral pH, only.
(2) Samples that have near-neutral pH after oxidation have negative values for hot acidity
indicating surplus alkalinity; samples that have acidic pH after oxidation have positive values for
hot acidity indicating a deficiency of alkalinity. (3) Samples with comparable pH values could
have substantially different concentrations of “hot acidity” owing to differences in their
357
concentrations of alkalinity and/or dissolved Fe and Mn. (4) The hot acidity is comparable to
“net acidity” computed on the basis of initial pH and concentrations of Fe, Mn, and Al minus the
initial alkalinity. (5) Acidity computed from the pH and dissolved metals concentrations,
assuming a valence of 2 for iron and manganese and 3 for aluminum, is closely equivalent to that
computed considering the FeII/FeIII distribution or on the basis of aqueous species. (6) Despite
changes in the pH, alkalinity, and metals concentrations, the hot acidities were comparable for
fresh and oxidized samples. (7) The addition of H2O2 to a fresh sample will indicate if the
ultimate pH after exposure to the atmosphere will be acidic; however, this method can
overestimate or underestimate the ultimate pH for aged, acidic or near-neutral samples,
respectively.
In conclusion, meaningful net acidity can be determined from a measured hot acidity or by
calculation from the pH, alkalinity, and dissolved metals concentrations. Together, these water-
quality data can be useful for evaluating the potential for toxicity, corrosion, or encrustation and
can be helpful for determining the appropriate remediation. if the standard method hot acidity,
using initial titration with H2SO4, addition of H2O2, and boiling prior to titration with NaOH to
the endpoint pH of 8.3 (American Public Health Association, 1998a; American Society for
Testing and Materials, 2000), is applied rigorously, consistent and interpretable results are
obtained. Generally, the hot acidity is stable and gives consistent results for fresh and aged
samples, whereas pH and alkalinity can be unstable as the sample ages. Thus, the hot acidity is a
better overall measure than pH, alkalinity, or derivative terms for the severity of acid mine
drainage. The hot acidity indicates both the required quantities of base needed for neutralization
of aerated AMD and the potential for pH to decrease owing to the oxidation and hydrolysis of
dissolved Fe and Mn. The measurement of hot acidity on fresh or aged samples will indicate a
comparable “net acidity” result; therefore, sample refrigeration and immediate measurement
should not be considered necessary unless measurements of pH, alkalinity, or other unstable
constituents also are needed on the same sample. The hot acidity is not ambiguous compared to
cold acidity or computed net acidity, where contributions from CO2 and differences in sample
preservation can affect the outcome. Nevertheless, the hot acidity could underestimate the
quantity of “caustic” chemicals needed to neutralize AMD containing dissolved CO2. In such
cases, the cold acidity titration with addition of H2O2 prior to titration with NaOH to the
358
selected endpoint pH could be a useful measure and, compared with the hot acidity, could
indicate potential benefits of aeration before the addition of chemicals to neutralize the AMD.
The results and conclusions of this report are consistent with the following paraphrased
comments from Arthur W. Rose (2003, written commun.) sent as E-mail to the authors prior to
our measurement of pH and hot acidity on aged samples: The standard method hot acidity
involving initial titration with H2SO4 and addition of H2O2 is the preferable way to determine
net acidity. The titration method alleviates a number of problems associated with sample
collection and preservation. Also, it is widely used in industry and is a relatively accurate
measurement, except for the inconsistent reporting of negative values. Obviously we need to get
labs to report negative acidities. it gives the correct answer without filtration and without a
determination of FeII/FeIII, and it does not require refrigeration or immediate titration of samples.
Despite internal changes in pH and consumption of alkalinity during sample storage, the “net”
value measured by hot acidity is unchanged. In addition to determining if the solution
ultimately will have acidic pH (positive net acidity) or near-neutral pH (positive net alkalinity),
the hot acidity measurement is useful for sizing of passive systems, or for evaluating mixing of
acidic and alkaline solutions.
Acknowledgments
This work evolved following discussions with Arthur W. Rose, Robert S. Hedin, Keith B. C.
Brady, and Brent P. Means. The authors wish to acknowledge their input. The authors also wish
to thank Donald R. Williams, Jeffrey B. Weitzel, James E. Welch, and Suzanne J. Ward of the
USGS, and Harold Wilson of Wilson Testing Laboratories, Shamokin, Pa., for providing field or
laboratory assistance with sampling and alkalinity and acidity measurements. The manuscript
benefitted from reviews by Kevin J. Breen, Arthur W. Rose, and Eric F. Perry.
Literature Cited
American Public Health Association, 1998a, Acidity (2310)/Titration method, In Clesceri, L. S.,
Greenberg, A. E., and Eaton, A. D. (eds), Standard Methods for the Examination of Water
and Wastewater (20th): Washington, D.C., American Public Health Association, p. 2.24-
2.26.
359
———, 1998b, Alkalinity (2320)/Titration method, In Clesceri, L. S., Greenberg, A. E., and
Eaton, A. D. (eds), Standard Methods for the Examination of Water and Wastewater (20th):
Washington, D.C., American Public Health Association, p. 2.26-2.29.
American Society for Testing and Materials, 2000, Standard test methods for acidity or alkalinity
of water: D 1067-92, In Annual Book of ASTM Standards, Water and Environmental
Technology: West Conshocken, Pa. ASTM, Sect. 11.01, p. 65-71.
Ball, J. W., and Nordstrom, D. K., 1991, User's manual for WATEQ4F with revised data base:
U.S. Geological Survey Open-File Report 91-183, 189 p.
Berg, T. M., Barnes, J. H., Seven, W. D., Skema, V. K., Wilshusen, J. P., and Yannaci, D. S.,
1989, Physiographic provinces of Pennsylvania: Pennsylvania Geological Survey, 4th
Series, Map 13, scale 1:2,000,000.
———, et al., 1980, Geologic map of Pennsylvania: Pennsylvania Geological Survey, Fourth
Series, Map # 1, scale 1:2,500,000, 3 sheets.
Bigham, J. M., and Nordstrom, D. K., 2000, Iron and aluminum hydroxysulfate minerals from
acid sulfate waters, In Jambor, J. L., Alpers, C. N., and Nordstrom, D. K., (eds.), Sulfate
minerals, crystallography, geochemistry and environmental significance: Mineralogical
Society of America Reviews in Mineralogy and Geochemistry, v. 40, p. 351-403.
———, Schwertmann, U., Traina, S. J., Winland, R. L., and Wolf, M., 1996, Schwertmannite
and the chemical modeling of iron in acid sulfate waters: Geochimica et Cosmochimica
Acta, v. 60, p. 2111-2121.
Brady, K. B. C., Rose, A. W., Cravotta, C. A., III, and Hellier, W. W., 1997, Bimodal distribution
of pH in coal-mine drainage (abs.): Geological Society of America, GSA Abstracts with
Programs, v. 29, no. 1, p. 32.
———, Hornberger, R. J., and Fleeger, G., 1998, Influence of geology on post-mining water
quality-Northern Appalachian Basin, In Brady, K. B. C., Smith, M. W., and Schueck, J. H.,
(eds.), The prediction and prevention of acid drainage from surface coal mines in
Pennsylvania: Harrisburg, Pa., Pennsylvania Department of Environmental Protection,
5600-BK-DEP2256, p. 8.1-8.92.
360
———, Smith, M. W., Beam, R. L., and Cravotta, C. A., III, 1990, Effectiveness of the addition
of alkaline materials at surface coal mines in preventing or abating acid mine drainage--Part
2. Mine site case studies, In Proceedings of the 1990 Mining and Reclamation Conference
and Exhibition, Charleston, West Virginia, April 23-26, 1990: Morgantown, W.Va., West
Virginia University, v. 1, p. 226-241.
———, Perry, E. F., Beam, R. L., Bisko, D. C., Gardner, M. D., and Tarantino, J. M., 1994,
Evaluation of acid-base accounting to predict the quality of drainage at surface coal mines in
Pennsylvania, U.S. A.: U.S. Bureau of Mines Special Publication SP 06A, p. 138-147.
Commonwealth of Pennsylvania, 1998a. Chapter 87. Surface mining of coal. Pennsylvania
Code, Title 25. Environmental Protection: Harrisburg, Pa., Commonwealth of Pennsylvania,
p. 87.1-87.122.
——— 1998b, Chapter 89. Underground mining of coal and coal preparation facilities.
Pennsylvania Code, Title 25. Environmental Protection: Harrisburg, Pa., Commonwealth of
Pennsylvania, p. 89.1-89.96.
——— 2002, Chapter 93. Water Quality Standards. Pennsylvania Code, Title 25. Environmental
Protection: Harrisburg, Pa., Commonwealth of Pennsylvania, p. 93.1-93.226.
Cravotta, C. A., III, and Hilgar, G. M., 2000, Considerations for chemical monitoring at coal
mines, In Kleinmann, R. L. P., (ed.), Prediction of water quality at surface coal mines: Acid
Drainage Technology Initiative, Morgantown, W.Va., National Mine Land Reclamation
Center, p. 195-218.
———, and Kirby, C. S., 2003, Effects of abandoned coal-mine drainage on streamflow and
water quality in the Shamokin Creek Basin, Northumberland and Columbia Counties,
Pennsylvania, 1999-2001: U.S. Geological Survey Water-Resources Investigations Report
03-4311.
———, and Trahan, M. K., 1999, Limestone drains to increase pH and remove dissolved metals
from acidic mine drainage: Applied Geochemistry, v. 14, no. 5, p 581-606.
———, Dugas, D. L., Brady, K. B. C., and Kovalchuk, T. E., 1994, Effects of selective handling
of pyritic, acid-forming materials on the chemistry of pore gas and ground water at a
reclaimed surface coal mine in Clarion County, PA, USA: U.S. Bureau of Mines Special
Publication SP 06A, p. 365-374.
361
———, Brady, K. B. C., Rose, A. W., and Douds, J. B., 1999, Frequency distribution of the pH
of coal-mine drainage in Pennsylvania, In Morganwalp, D. W., and Buxton, H., (eds.), U.S.
Geological Survey Toxic Substances Hydrology Program--Proceedings of the technical
meeting: U.S. Geological Survey Water-Resources Investigations Report 99-4018A, p. 313-
324.
———, Breen, K. J., and Seal, R., 2001, Arsenic is ubiquitous but not elevated in abandoned
coal-mine discharges in Pennsylvania (abs.), In U.S. Geological Survey Appalachian Region
Integrated Science Workshop Proceedings, Gatlinburg, Tennessee, October 22-26, 2001:
U.S. Geological Survey Open-File Report 01-406, p. 105.
Crock, J. G., Arbogast, B. F., and Lamothe, P. J., 1999, Laboratory methods for the analysis of
environmental samples, In Plumlee G. S., and Logsdon, M. J., (eds.), The Environmental
Geochemistry of Mineral Deposits--Part A. Processes, techniques, and health issues:
Society of Economic Geologists, Reviews in Economic Geology, v. 6A, p. 265-287.
Desmier, R., Waite, T. D., Macdonald, B. C. T., and Melvillle, M. D., in press, Characteristics of
the acidity in acid sulfate soil surface waters: Applied Geochemistry.
Drever, J. I., 1997, The geochemistry of natural waters--Surface and groundwater environments
(3rd): Englewood Cliffs, N.J., Prentice-Hall, Inc., 436 p.
Edmunds, W. E., 1999, Bituminous coal, In Schultz, C. H., (ed.), The geology of Pennsylvania:
Pennsylvania Geological Survey, 4th series, Special Publication 1, p. 470-481.
Eggleston, J. R., Kehn, T. M., and Wood, G. H., Jr., 1999, Anthracite, In Schultz, C. H., (ed.), The
geology of Pennsylvania: Pennsylvania Geological Survey, 4th series, Special Publication 1,
p. 458-469.
Elder, J. F., 1988, Metal biogeochemistry in surface-water systems--a review of principles and
concepts: U.S. Geological Survey Circular 1013, 43 p.
Ficklin, W. H., and Mosier, E. L., 1999, Field methods for sampling and analysis of
environmental samples for unstable and selected stable constituents, In Plumlee G.S., and
Logsdon, M.J., (eds.), The Environmental Geochemistry of Mineral Deposits--Part A.
Processes, techniques, and health issues: Society of Economic Geologists, Reviews in
Economic Geology, v. 6A, p. 249-264.
362
Fishman, M. J., and Friedman, L. C., (eds.), 1989, Methods for determination of inorganic
substances in water and fluvial sediments: U.S. Geological Survey Techniques of Water-
Resources Investigations, Book 5, Chapter A1, 545 p.
Growitz, D. J., Reed, L. A., and Beard, M. M., 1985, Reconnaissance of mine drainage in the
coal fields of eastern Pennsylvanian: U.S. Geological Survey Water Resources
Investigations Report 83-4274, 54 p.
Hedin, R. S., this volume, The use of measured and calculated values to improve the quality of
mine drainage data sets, In Proceedings of the 2004 National Meeting of American Society of
Mining & Reclamation and the 25th West Virginia Surface Mine Drainage Task Force, April
18-24, 2004: American Society of Mining & Reclamation.
———, Nairn, R. W., and Kleinmann, R. L. P., 1994, Passive treatment of coal mine drainage:
U.S. Bureau of Mines Information Circular IC 9389, 35 p.
Herlihy, A. T., Kaufmann, P. R., Mitch, M. E., and Brown, D. D., 1990, Regional estimates of
acid mine drainage impact on streams in the mid-Atlantic and southeastern United States:
Water, Air, and Soil Pollution, v. 50, p. 91-107.
Hyman, D. M., and Watzlaf, G. R., 1997, Metals and other components of coal mine drainage as
related to aquatic life standards, In Proceedings of the 1997 National Meeting of the
American Society for Surface Mining and Reclamation, May 10-15, 1997, Austin, Texas:
American Society for Surface Mining and Reclamation, p. 531-545.
Jageman, T. C., Yokley, R. A., and Heunisch, H. E., 1988, The use of preaeration to reduce the
cost of neutralizing acid mine drainage: U.S. Bureau of Mines Information Circular IC 9183,
p. 131-135.
Kirby, C. S, 2002, Problems in alkalinity and acidity measurements in mine drainage, In
Proceedings of the 19th Annual Meeting of American Society of Mining & Reclamation,
Lexington, Kentucky, June 9-13, 2002: American Society of Mining & Reclamation, p 1068-
1072.
———, and Cravotta, C. A., III, this volume, Acidity and alkalinity in mine drainage--
Theoretical considerations, In Proceedings of the 2004 National Meeting of American
Society of Mining & Reclamation and the 25th West Virginia Surface Mine Drainage Task
Force, April 18-24, 2004: American Society of Mining & Reclamation.
363
———, Thomas, H. M., Southam, G., and Donald, R., 1999, Relative contributions of abiotic
and biological factors in Fe(II) oxidation in mine drainage: Applied Geochemistry, v. 14, p.
511-530.
Langmuir, Donald, 1997, Aqueous environmental geochemistry: New Jersey, Prentice-Hall, 600
p.
Means, B. P., and Hilton, T., this volume, Comparison of three methods to measure acidity of
coal-mine drainage, In Proceedings of the 2004 National Meeting of American Society of
Mining & Reclamation and the 25th West Virginia Surface Mine Drainage Task Force, April
18-24, 2004: American Society of Mining & Reclamation.
Miller, S. D., 1980, Sulfur and hydrogen ion buffering in pyritic strip mine spoil, In Trudinger, P.
A., and Walter, M. R., (eds.), Biogeochemistry of ancient and modern environments: New
York, Springer-Verlag, p. 537-543.
Nordstrom, D. K., 1977, Thermochemical redox equilibria of Zobell’s solution: Geochimica et
Cosmochimica Acta, v. 41, p. 1835-1841.
———, 1985, The rate of ferrous iron oxidation in a stream receiving acid mine effluent, In
Subitzky, Seymour, (ed.), Selected papers in the hydrologic sciences 1985: U.S. Geological
Survey Water-Supply Paper 2270, p. 113-119.
———, 2000, Advances in the hydrochemistry and microbiology of acid mine waters:
International Geology Review, v. 42, p. 499-515.
———, and Alpers, C. N., 1999, Geochemistry of acid mine waters, In Plumlee, G. S., and
Logsdon, M. J., (eds.), The Environmental Geochemistry of Mineral Deposits--Part A.
Processes, methods, and health issues: Reviews in Economic Geology, v. 6A, p. 133-160.
———, and Ball, J. W., 1986, The geochemical behavior of aluminum in acidified surface
waters: Science, v. 232, p. 54-58.
———, Jenne, E. A., and Ball, J. W., 1979, Redox equilibria of iron in acid mine waters, In
Jenne, E. A., (ed.), Chemical modeling in aqueous systems--Speciation, sorption, solubility,
and kinetics: American Chemical Society Symposium Series 93, p. 51-79.
Ott, A. N., 1988, Dual acidity titration curves – Fingerprint, indicator of redox state, and
estimator of iron and aluminum content of acid mine drainage and related waters: U.S.
Geological Survey Water Supply Paper 2330, p. 19-33.
364
Parkhurst, D. L., and Appelo, C. A. J., 1999, User's guide to PHREEQC (Version 2)--A computer
program for speciation, batch-reaction, one-dimensional transport, and inverse geochemical
calculations: U.S. Geological Survey Water-Resources Investigations Report 99-4259, 312
p.
Rantz, S. E., and others, 1982a, Measurement and computation of streamflow--1. Measurement
of stage and discharge: U.S. Geological Survey Water-Supply Paper 2175, 284 p.
———, 1982b, Measurement and computation of streamflow--2. Computation of discharge:
U.S. Geological Survey Water-Supply Paper 2175, 631 p.
Rose, A. W., and Cravotta, C. A., III, 1998, Geochemistry of coal-mine drainage, In Brady, K. B.
C., Smith, M. W., and Schueck., J., (eds.), Coal Mine Drainage Prediction and Pollution
Prevention in Pennsylvania: Harrisburg, Pa., Pennsylvania Department of Environmental
Protection, 5600-BK-DEP2256, p. 1.1-1.22
Skousen, J. G., Rose, A. W., Geidel, G., Foreman, J., Evans, R., Hellier, W., and others, 1998,
Handbook of technologies for avoidance and remediation of acid mine drainage:
Morgantown, W.Va., National Mine Land Reclamation Center, 131 p.
Southern Alleghenies Conservancy, 1998, Findings for the inventory and monitoring phase of
the resource recovery program: Bedford, Pa., Southern Alleghenies Conservancy,
unpublished report, 74 p.
Stumm, Werner, and Morgan, J. J., 1996, Aquatic chemistry--Chemical equilibria and rates in
natural waters (3rd): New York, John Wiley and Sons, 1022 p.
U.S. Environmental Protection Agency, 1979a, Method 305.1, Acidity (Titrimetric) , In Methods
for chemical analysis of water and wastes: U.S. Environmental Protection Agency
EPA/600/4-79-020, n.p. (http://www.nemi.gov).
———, 1979b, Method 310.1, Alkalinity (Titrimetric, pH 4.5), In Methods for chemical analysis
of water and wastes: U.S. Environmental Protection Agency EPA/600/4-79-020, n.p.
(http://www.nemi.gov).
———, 2000, Drinking water standards and health advisories (summer 2000): U.S.
Environmental Protection Agency, 12 p. (http://www.epa.gov/OST).
———, 2002a, National primary drinking water standards: U.S. Environmental Protection
Agency EPA/816-F-02-013, July 2002, 7 p. (http://www.epa.gov/safewater).
365
———, 2002b, National recommended water quality criteria--2002: U.S. Environmental
Protection Agency EPA/822-R-02-047, 33 p.
U.S. Geological Survey, 1997 to present, National field manual for the collection of water-
quality data: U.S. Geological Survey Techniques of Water-Resources Investigations, book 9,
chaps. A1-A9, 2 vols., variously paged (http://pubs. water. usgs. gov/twri9A).
Williams, D. J., Bigham, J. M., Cravotta, C. A., III, Traina, S. J., Anderson, J. E., and Lyon, G.,
2002, Assessing mine drainage pH from the color and spectral reflectance of chemical
precipitates: Applied Geochemistry, v. 17, p. 1273-1286.
Winland, R. L., Traina, S. J., and Bigham, J. M., 1991, Chemical composition of ochreous
precipitates from Ohio coal mine drainage: Journal of Environmental Quality, v. 20, p. 452-
460.
Wood, C. R., 1996, Water quality of large discharges from mines in the anthracite region of
eastern Pennsylvania: U.S. Geological Survey Water-Resources Investigations Report 95-
4243, 68 p.
Wood, W. W., 1976, Guidelines for the collection and field analysis of ground-water samples for
selected unstable constituents: U.S. Geological Survey Techniques of Water Resources
Investigations, Book 1, Chapter D2, 24 p.
Yu, J. -Y., Heo, B., Choi, I. -K., Cho, J. -P., and Change, H. -W., 1999, Apparent solubilities of
schwertmannite and ferrihydrite in natural stream waters polluted by mine drainage:
Geochimica et Cosmochimica Acta, v. 63, p. 3407-3416.