chapter 3file/3-4.pdf · an extracting solution. these results form the basis for fertilizer...
TRANSCRIPT
99
Chapter3.4Practical Use of Soil Analysis Results
Identify analytical results from nutrients, organic matter, pH, EC and CEC from the lab report.
Interpret soil analysis results for pH and salinity.
Describe the significance of soil CEC, soil organic matter content and soil texture.
Describe the importance of soil available moisture and how it is characterized.
Understand why laboratories differ in their analytical results and recommendations.
•
•
•
•
•
learning objectives

100
Practical Use of Soil Analysis Results
Important TermsTable 3.4.1 Key Terms and Definitions
Term Definition
Atoms Thesmallestparticleofanelementthatcanexistasastableentity,eitheraloneorincombination.
AtomicWeight Theaveragemassofanatomofanelementasitoccursinnature.Thisismadeupoftheweightedsumofthemassesoftheprotonsandneutronscomposingtheatom.
Labile Readilyorcontinuallyundergoingchemical,physicalorbiologicalchangeorbreakdown.Asubstancereadilytransformedbymicro-organismsorreadilyavailabletoplants.
more info
Refer to Chapter 3.3 for more information on how to collect
a quality, representative soil sample from a site.
Thesoilanalysisreportprovidestheinformationnecessarytosetnutrientapplicationtargets,whichareusedtocalculatemanureandfertilizerapplicationrates.Test results from regular field sampling (particularly frombenchmarksites)allowmonitoringanddetectionof changes in soil parameters (e.g., nutrients, pH, and salinity)withtime.
Soilanalysisresultsmustbeinterpretedwithinthecontextofexpectedyieldresponseforthecroptobe
grown under specific environmental and management conditions.Theinterpretationsdiscussedinthischapterare specific to Alberta soils and are based on extensive field and laboratory research. The results of a lab analysis areonlyasgoodasthequalityofthesamplescollectedandthesamplingstrategyused.Poorsamplesthatarenotrepresentative of field conditions will lead to inaccurate nutrientrecommendations.

101
Chapter 3.4
Figure 3.4.1 General Appearance of a Soil Analysis Report
102
Practical Use of Soil Analysis Results
Reading Soil Analysis Reports Alllaboratoriesgeneratereportsforeachsamplesubmittedforanalysis.Allreportswillcontainthesamebasicinformationalthoughindividuallabsmaypresentthisinformationintheirownuniqueformat.Figure3.4.1isanexampleofthegenerallayoutofinformationonasoilanalysisreport.
The report will identify the client (# 1 in Figure 3.4.1) as well as the unique sample identification (#2 in Figure 3.4.1).Whenreviewingsoilanalysisreports,verifythatthe sample identification is correct. Although it may seem of minor significance, the legal land location is often usedtoidentifyagro-climaticregionsthataffectyieldexpectationsandfertilizerrecommendations.
Thereportwillusuallyindicatewhenthesamplewasreceived and when it was processed (#3 in Figure 3.4.1). Reviewthesehandlingdatestoseeiftherewereanyunusualdelaysinshippingthatmightaffecttheaccuracyoftheresults.Takenoteofthelengthoftimethesamplewill be retained (#3 in Figure 3.4.1). Additional analysis orrepeatedteststoverifyunusualresultsmustbeperformedwhilethesampleisstillavailable.
The nutrient analysis (#4 in Figure 3.4.1) is the heart ofthereportbutitisoftenoverlookedcomparedtothefertilizerrecommendation.Thenutrientanalysisisameasurementofthenutrientsremovedfromsoilusinganextractingsolution.Theseresultsformthebasisforfertilizerrecommendations.
Labsusediverseextractionmethodssothenutrientanalysisofonelabisnotdirectlycomparabletoanotherlabunlessbothareusingthesameprocedures.Anindividuallabmayusevariousextractsfordifferentnutrientsinordertogetthemostreliableresults.FindoutwhatmethodsalabfollowssincesomeextractionmethodsmaynotbesuitedtowesternCanadiansoils.
Fornutrientmanagementpurposes,itisusefultousethesamelabeveryyearortouselabsthatfollowthesameextractionprocessestotracknutrientlevelchangeswithtime.
Nutrient levels are reported in parts per million (ppm or mg/kg). For each 15 cm (6 in) sample depth, these values canbedoubledtoapproximatethenutrientlevelsonakilograms per hectare (kg/ha) or pounds per acre (lb/ac) basis (#5 in Figure 3.4.1).
Nutrient (kg/ha) = Nutrient (ppm) x 2 x sample depth (cm) ÷ 15 cm
Nutrient (lb/ac) = Nutrient (ppm) x 2 x sample depth (in) ÷ 6 in
Asoilanalysisreportindicatesthereis10 ppm N in a 0 to 6 in soil sample. This corresponds to 20 lb N/ac:
Nutrient (lb/ac)
= nutrient (ppm) x 2 x sample depth (in) ÷ 6 in
= 10 ppm x 2 x 6 in ÷ 6 in
= 20 lb N/ac
There is 10 ppm N in a 0 to 12 in sample. This corresponds to 40 lb N/ac:
Nutrient (lb/ac)
= Nutrient (ppm) x 2 x sample depth (in) ÷ 6 in
= 10 ppm x 2 x 12 in ÷ 6 in
= 40 lb N/ac
Examinereportednutrientlevelsforanyunusualvalues.SoilNlevelsfollowingaverageoraboveaveragecropsshould be low (i.e., below 15 ppm and often less than 10 ppm for 0 to 15 cm (6 in) depths). Phosphorus levels for fields that have not received manure should not vary
Nutrient levels are converted from ppm to lb/ac by multiplying by two because a one acre slice of soil, six inches deep weighs approximately two million pounds. In other words, lb/ac is essentially parts per two million. For a soil sample 12 inch deep, multiply ppm by 4.
s i d e b a r
Soil test P and K levels are reported on an elemental basis (i.e., P or K) rather than oxide basis (i.e., P
2O
5 or K
2O).
s i d e b a r

103
Chapter 3.4
tip
Contact the soil testing laboratory with specific questions about the
analytical techniques used to measure individual soil.
muchfromyeartoyearandaretypicallyquitelow(less than 15 ppm for 0 to 15 cm depth). On fields with ahistoryofmanureapplication,theNandPlevelsmaybeconsiderablyhigher.PotassiumlevelsofAlbertasoilsare relatively stable, often quite high (more than 150 ppmin0to15cmdepth)andmayexceed500ppmonBrownandDarkBrownsoils,evenwithoutahistoryofmanureapplication.Sulphurlevelsarevariableandcanrangefromlessthan5ppmtomorethan50ppmfor0to15cmdepth.Largeyear-to-yearchangesinsoilnutrientlevels should be investigated to determine the cause (e.g., managementchanges,changeinanalyticalmethod,ormishandlingofsamples).
Excessnutrientlevelsmaybesuggestedonasoilanalysisreportwhennutrientlevelsarereportedasbeinggreaterthan a lab threshold (e.g., K is more than 600 ppm). Unlessadilutionisperformed,thelabwillnotbeabletoprovideanexactnutrientlevel.Whilethishasminimalinfluence on crop production, it can suggest nutrient levelsthatposepotentialenvironmentalrisk.Ifhighlevels of nitrate (NO3
-) or P are suspected in a field, ask the lab to dilute the extract to get exact NO3
-andPlevels.
Soilanalysisreportsoftenincludeasubjectiveratingof nutrient levels (#6 in Figure 3.4.1) based on the probabilitythataparticularnutrientwilllimitplantgrowth and production. Often these ratings are depicted asbargraphsforeachnutrient.Thesesubjectiveratingsmayalsohelpidentifypotentialenvironmentalrisk.
Formostsoils,micronutrientlevelsareusuallyinthemarginal range but are occasionally adequate or deficient. Theprobabilityofcropresponsetomicronutrientapplicationisnotclearinmanyinstances.
Soil quality factors including pH, salinity, organic matter, and texture (#7 in Figure 3.4.1) provide information useful for the site assessment and crop selection. Often soilqualityfactorswillhavearatingsystemthatmayflag potential problems.
Often kg/ha and lb/ac are interchanged and considered to be equal. However, the actual conversion is kg/ha x 0.8924 = lb/ac.
s i d e b a r
LabsbasedinwesternCanadadonotemphasizethetotalcationexchangecapacityorthecompositionofexchangeable cations (#8 in Figure 3.4.1). These analyses are usually included at additional costs. Other labs may recommendnutrientadditionsto“balance”exchangeableionsbutthereislittleresearchevidencetosupportthispractice.
Fertilizerrecommendationsareusuallybasedonyieldresponse curves or yield expectations (#9 in Figure 3.4.1)foracropbasedonsoilmoistureandgrowingseasonprecipitation.Somelabswillprovidemorethanonesetofrecommendationstoaccountfordifferentrainfall conditions (e.g., average and excellent). Fertilizer applicationratescanthenbeadjustedorselectedbasedonexpectedrainfall.
Crop Nutrients One of the basic principles behind formulating fertility requirementsrelatestotheprobabilityofacropresponseto nutrient application (Figure 3.4.2).
From Beegle, 2006Figure 3.4.2 Yield Response in Relation to Soil Nutrient Levels
104
Practical Use of Soil Analysis Results
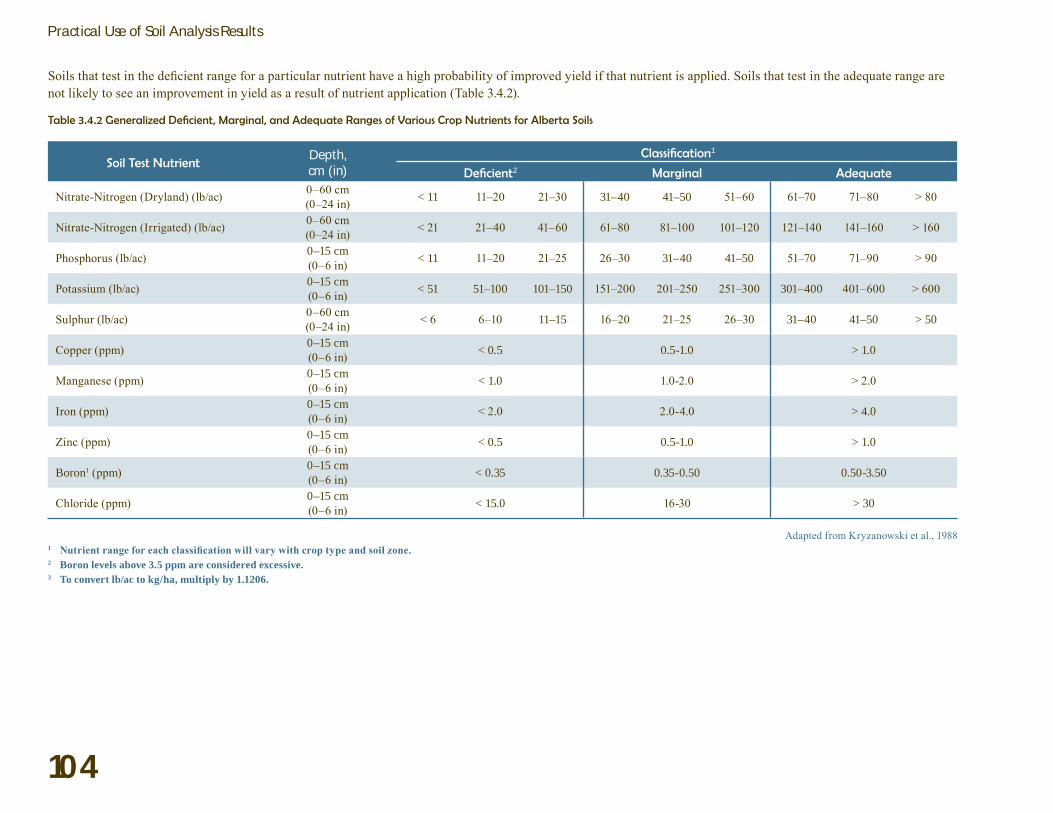
Soils that test in the deficient range for a particular nutrient have a high probability of improved yield if that nutrient is applied. Soils that test in the adequate range are not likely to see an improvement in yield as a result of nutrient application (Table 3.4.2).
Table 3.4.2 Generalized Deficient, Marginal, and Adequate Ranges of Various Crop Nutrients for Alberta Soils
Soil Test NutrientDepth,cm (in)
Classification1
Deficient2 Marginal Adequate
Nitrate-Nitrogen (Dryland) (lb/ac) 0–60 cm(0–24 in) <11 11–20 21–30 31–40 41–50 51–60 61–70 71–80 > 80
Nitrate-Nitrogen (Irrigated) (lb/ac) 0–60 cm(0–24 in) < 21 21–40 41–60 61–80 81–100 101–120 121–140 141–160 > 160
Phosphorus (lb/ac) 0–15cm(0–6 in) <11 11–20 21–25 26–30 31–40 41–50 51–70 71–90 > 90
Potassium (lb/ac) 0–15cm(0–6 in) <51 51–100 101–150 151–200 201–250 251–300 301–400 401–600 > 600
Sulphur (lb/ac) 0–60 cm(0–24 in) < 6 6–10 11–15 16–20 21–25 26–30 31–40 41–50 >50
Copper (ppm) 0–15cm(0–6 in) <0.5 0.5-1.0 >1.0
Manganese (ppm) 0–15cm(0–6 in) <1.0 1.0-2.0 > 2.0
Iron (ppm) 0–15cm(0–6 in) < 2.0 2.0-4.0 >4.0
Zinc (ppm) 0–15cm(0–6 in) <0.5 0.5-1.0 >1.0
Boron1 (ppm) 0–15cm(0–6 in) <0.35 0.35-0.50 0.50-3.50
Chloride (ppm) 0–15cm(0–6 in) <15.0 16-30 >30
Adapted from Kryzanowski et al., 19881 Nutrient range for each classification will vary with crop type and soil zone. 2 Boron levels above 3.5 ppm are considered excessive. 3 To convert lb/ac to kg/ha, multiply by 1.1206.
105
Chapter 3.4
pH Soil pH (or reaction) indicates acidity or alkalinity of the soil. Soils below pH 6.7 are acidic and soils above pH 7.3 are alkaline. A pH near 7.0 is considered neutral. A more descriptive classification of soil pH is based on the ranges describedinTable3.4.3.
Table 3.4.3 Qualitative and Quantitative Descriptions of pH for Alberta Soils
3.0–5.6 5.6–6.2 6.2–6.7 6.7–7.3 7.3–7.9 7.9–8.5 >8.5
StronglyAcidic ModeratelyAcidic SlightlyAcidic Neutral Slightly
AlkalineModeratelyAlkaline
StronglyAlkaline
Source: Kryzanowski et al., 1988
Under low pH conditions, some nutrients bind tightly tosoilparticlesandasaresultareunavailabletoplants.Inaddition,chemicalstructuresofsomenutrients,particularly P, can change under low pH making them less available to crops. Low pH conditions also impact thegrowthandsurvivalofsoilmicroorganisms,someofwhichareinstrumentalinreleasingnutrientsboundinorganicmatterforcropuse.
Crops vary in their acidity tolerance (Figure 2.2.5) which is strongly influenced by the sensitivity of crops to various levels of soluble aluminum (Al3+).Aluminumsolubilityincreasessubstantiallyunderstronglyacidicconditions.Cropsproducedinsoilsmoreacidicthantheirtolerancelevelwillresultinreducedyields.Fertilizerrecommendationsshouldbeadjustedforreducedyieldpotential on the basis of crop type and pH.
Tocontendwithsoilacidity,selectacidtolerantcroptypesorconsiderlimingthesoiltocorrectthehighpH condition. Before applying lime, request a lime requirementtestwhichwillprovidearecommendationforanappropriaterate.Limingacidsoilscanbeanextremelycostlyproceduresothepotentialreturnoninvestmentshouldbecarefullyassessed.Moreinformation about soil pH and acid soil conditions can be found in Chapter 2.2.
SalinityTherearetwosoilparametersusedtocharacterizesoilsassaline,sodicorsaline-sodic.Theseareelectricalconductivity (EC) and sodium adsorption ratio (SAR). Only EC is part of routine agricultural soil analysis.
EC
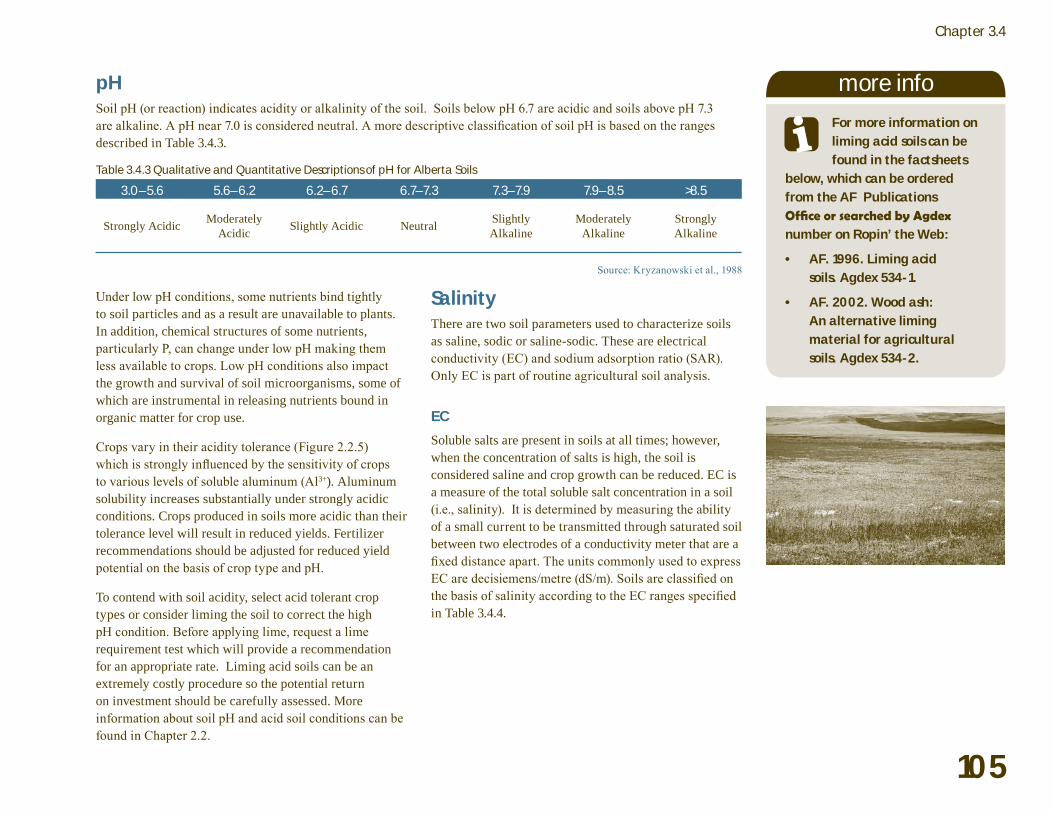
Solublesaltsarepresentinsoilsatalltimes;however,whentheconcentrationofsaltsishigh,thesoilisconsideredsalineandcropgrowthcanbereduced.ECisameasureofthetotalsolublesaltconcentrationinasoil(i.e., salinity). It is determined by measuring the ability ofasmallcurrenttobetransmittedthroughsaturatedsoilbetweentwoelectrodesofaconductivitymeterthatareafixed distance apart. The units commonly used to express EC are decisiemens/metre (dS/m). Soils are classified on the basis of salinity according to the EC ranges specified inTable3.4.4.
more info
For more information on liming acid soils can be found in the factsheets
below, which can be ordered from the AF Publications Office or searched by Agdex number on Ropin’ the Web:
AF. 1996. Liming acid soils. Agdex 534-1.
AF. 2002. Wood ash: An alternative liming material for agricultural soils. Agdex 534-2.
•
•

106
Practical Use of Soil Analysis Results
Table 3.4.4 Salinity Ratings for Alberta soils in Relation to Electrical Conductivity Measurements
Soil DepthSalinity Classifications and EC Measurements (dS/m)
Non-SalineWeakly Saline
Moderately Saline
Strongly Saline
Very Strongly Saline
0–60 cm (0–2 ft) < 2 2–4 4–8 8–16 > 16
60–120 cm (2–4 ft) <4 4–8 8–16 16–24 > 24
Source: Kryzanowski et al. 1988Crops exhibit a range of tolerance to salt levels in the soil (Table 3.4.5). In general, grass forages tend to have a higher salinity tolerance than field crops.
Table 3.4.5 Salt Tolerance of Selected Crops
EC (dS/m)(Salt Tolerance)
Field Crops Forages Vegetables
20(Very high)
Beardlesswildrye,Fulksaltaigrass,Levonnsalkaligrass,Alkalisucatan
16(High)
KochiaSugarbeet
Altaiwildrye,Tallwheatgrass,Russianwildrye,Slenderwheatgrass
86-row barley, Safflower, Sunflower,
2-row barley, Fall rye, Winter wheat,Springwheat
BirdsfoottrefoilSweetclover
AlfalfaBromegrass
Gardenbeets,Asparagus,Spinach
Moderate Oats, Yellow mustard Crestedwheatgrass,Intermediatewheatgrass Tomatoes,Broccoli
Meadowfescue,Flax,Canola Reedcanarygrass Cabbage4 Corn Sweetcorn,Potatoes
Low Timothy,Peas,Fieldbeans Whitedutchclover,Alsikeclover,Redclover
Carrots, Onions, Strawberries, Peas,Beans

107
Chapter 3.4
[Na+]
[Ca2+]+[Mg2+]
2
Sodium Adsorption Ratio =
Excesssoilsalinitycausespoorandspottycropstands,unevenandstuntedgrowthandpooryields.Salinityrestrictsplantwateruptake,interfereswithnutrientavailabilityandcanimpairgerminationandrootgrowthbecauseofcausticsalteffects.Salineareasalsotendtohavepoorsoilstructureandaresubjecttowaterlogging,bothofwhichareharmfultocropgrowth.
Sodium Adsorption Ratio (SAR)
SARisalesscommonlyrequestedanalysisthatexpresses the proportion of exchangeable sodium (Na+)toexchangeable calcium (Ca2+) and magnesium (Mg2+)ions.
SoilswithSARvaluesat13orhigherareconsideredsodic.Cropgrowthonsodicsoilsisverypoor.Excesssodiumcausessoilparticlestorepeleachother,preventingtheformationofsoilaggregates.Thisresultsin a very tight soil structure with poor water infiltration andsurfacecrusting.
Asstatedpreviously,SARisnotpartofstandardsoilanalysispackagesforagriculturalapplicationsbutisroutinelydoneaspartofmosttestingpackagesforenvironmentalapplications.CharacterizingtheproportionofexchangeableNacanbeusefulinidentifyingsolonetzicsoils.
ThesodiumhazardofasoilisdeterminedbyfactoringintheECandSARofasoil.Thisresultsinasoilbeingclassified as non-saline, non-sodic, saline, sodic or saline-sodic (Table 3.4.6).

108
Practical Use of Soil Analysis Results
Table 3.4.6 Sodium Hazard Classifications Based on Sodium Adsorption Ratio and Electrical Conductivity
ClassificationSodium Adsorption Ratio
(SAR)Electrical Conductivity
(dS/m)1 Soil pH Soil Physical Condition
Sodic >13 <4.0 > 8.5 PoorSaline-Sodic >13 >4.0 < 8.5 Normal
High pH <13 <4.0 > 7.8 Varies
Saline <13 >4.0 < 8.5 Normal1dS/m = mS/cm
Source: Kryzanowski et al. 1988
Cation Exchange Capacity (CEC)Ion exchange in soils is one of the most important processes influencing crop nutrition. CEC is an estimate of the capacity of soil to hold (or adsorb) positively charged (cation) nutrients. The major soil cations include: calcium (Ca2+),magnesium (Mg2+), potassium (K+), sodium (Na+), hydrogen (H+) and aluminum (Al3+).
TheunitofmeasurementusedtocommonlyexpressCECiscentimolesofpositivechargeperkilogramofsoil(cmol/kg) and is equivalent to the units formerly used to express CEC; milliequivalents per 100 grams (meq/100g).
How Much is a Mole?A mole is a quantity used in chemistry to describe 6 x 10²³atomsofaparticularelement.Anelement’satomicweight,foundinaperiodictableoftheelements,istheequivalentmass,ingrams,ofonemoleofthatsubstance.For instance, the atomic weight for sodium is 22.989770 grams per mole.
One mole of positive charge refers to the equivalent positive charge on 6 x 10²³ monovalent (+1 charge) cations.
Basing CEC on centimoles (0.01 moles) of positive charge rather than mass (as the older milliequivalent measure did) makesmoresensesincethemassandchargeofthevariousexchangeablecationsinasoilsamplechanges,whilethenumberofnegativelychargedexchangesitesdonot.Cationexchangecapacityincmol/kgremainsthesameregardlessofwhichionsoccupytheexchangesitesinasoilsample.

109
Chapter 3.4
The CEC of a soil is primarily influenced by soil textureandorganicmattercontent.Amongthemineralcomponentsofsoil,clayparticlesgenerallyhavethehighestcationexchangecapacityfollowedbysiltandsand (Table 3.4.7).
Table 3.4.7 General Relationship Between Soil Texture and Cation Exchange Capacity
Soil TextureCEC, Normal Ranges
(cmol/kg of soil)Sand 1–5Finesandyloam 5–10Loamsandsiltloam 5–15Clayloam 15–30Clay 30+
Source: Hausenbuiller 1985Consequently,CECincreaseswithincreasedclaycontentofsoils.Thetypeofclayinsoilalsohasanimportantimpact (Table 3.4.8).
Table 3.4.8 Range of Cation Exchange Capacities of Different Types of Clay
Type of ClayCEC, Normal Ranges
(cmol/kg of soil)Allophane 100–150Montmorillonite 60–100Chlorite 20–40Illite 20–40Kaolinite 2–16
Source: Hausenbuiller 1985
Organic matter content of soils also has an important influence on the CEC of soils since it has a CEC range of 100to300cmol/kgofsoil.ThereispotentialtoincreasesoilCECbyadoptingpracticesandcroprotationsthatfocusonbuildingsoilorganicmattercontent.
Estimating CEC from Soil TextureDirectmeasurementofCECistimeconsumingandisnotpartofmostbasiccommercialsoilanalysispackages.Clayandorganicmatterarethemajorsoilcomponentsthatcontributetocationexchange;therefore,itispossibletoestimatetotalCECofagivensoilsamplebasedonthepercentageoforganicmatterandclaycontentandtheCECestimatesofeach.
Most soils in Alberta have clays similar to montmorillonite. The contribution of the clay fraction of soils towards CEC would be in the 60 to 100 cmol/kg range.
s i d e b a r

110
Practical Use of Soil Analysis Results
Estimating CEC from Soil TextureAtheoreticalsoilfromtheAlbertaPeaceregioncontains40percentclayandtwopercentorganicmatter.Using average values of 80 cmol/kg for clay (i.e., montmorillonite; Table 3.4.8) and 200 cmol/kg fororganic matter (Tables 3.4.7 and 3.4.8), the estimated CEC for this soil would be:
CEC contribution by clay = percent clay ÷ 100 x CEC of clay (cmol/kg)
= 40 ÷ 100 x 80 cmol/kg
= 32 cmol/kg
CEC contribution by organic matter (OM) = percent OM ÷ 100 x CEC of OM (cmol/kg)
= 2 ÷ 100 x 200 cmol/kg
= 4 cmol/kg
Total CEC = CEC contribution by clay + CEC contribution by OM
= 32 cmol/kg + 4 cmol/kg
= 36 cmol/kg
Base saturation (BS) is a measure of the proportion ofthetotalCECinsoiloccupiedbyNa+, K+,Ca2+,andMg2+expressedinpercent.WhilethereisnoidealpercentBS,thesevaluesaresometimesusedtomakerecommendations for K, Ca, or Mg amendments to soils. Thisapproachfailstoconsiderthecostandeconomicsofsuchanapplication,nordoesittakeintoaccountexcessivelyhighlevelsofcations.
Soil Organic Matter Soilorganicmatterisameasurementoftheamountofplantandanimalresidueinthesoil.Ithasseveralimportant implications for soil fertility. Organic matter actsasarevolvingnutrientbankaccount,whichreleases
cropavailablenutrientsoveranextendedperiod.Asdiscussedintheprevioussection,italsohasanimportantimpact,togetherwithclaycontent,onCECofthesoil.Soil structure, tilth, and water infiltration are also improvedbybuildingsoilorganicmatter.
Organic matter content is the distinguishing characteristic of Alberta’s soil zones (Figure 3.4.3). The Brownsoilzonehastheleastorganicmatterhavingdevelopedbeneathadrier,shortgrassprairie.

111
Chapter 3.4
FromAFFigure 3.4.3 Alberta’s Soil Zones

112
Practical Use of Soil Analysis Results
Incontrast,theBlacksoilsdevelopedunderacooler,moisteraspenparklandconditionresultingingreaterproductionofvegetationandorganicmatteraccumulation.DarkBrownsoilsdevelopedinthetransitionzonebetweentheBlackandBrownzonesandhasanintermediateorganicmattercontent.
Inpartsoftheprovincewheretreeshavebeenthenatural,dominantvegetation,DarkGrayortransitionalsoilsdeveloped.Inregionswhereforestcoverdominatedfor longer periods, Luvisolic (forest) soils developed.
Organic or peat soils are found in low-lying areas throughouttheBlack,DarkGrayandGraysoilzones.Thesesoilsformedwhereorganicresiduesaccumulatedatagreaterratethantheydecomposed.Theseareasarecharacterizedbywaterloggedconditionsformuchoftheyear.
TypicalsoilorganicmatterlevelsforAlbertacultivatedsoils range from two to 10 percent (Table 2.2.2, Chapter 2.2). Specific soil organic matter levels will vary based onmanagementhistoryandlandscapeposition.
Themostcommonlaboratoryprocedurefordeterminingorganicmattercontentisthroughlossonignitionwherebyorganicmatterisincineratedandonlytheashresidue remains. Organic matter content is the difference inweightbeforeandaftertheprocedure.
Moreprecisemethodsareusedtodetermineorganiccarboncontent.Thisinvolvescorrectingtotalcarboncontentinasampleforthepresencesofnon-organiccarbon (e.g., carbonate). Organic carbon is then used to calculateCtoNratiosinthesample.
Estimated Nitrogen Release
Organic matter content is an important source of several keycropnutrientsincludingN.EstimatedNrelease(ENR) is an estimate of the amount of N expected to
become available from organic matter (i.e., mineralized) overthegrowingseason.Thisestimatetakesintoaccountsoilorganicmatterlevel,soilmoisture,andtemperatureduringthegrowingseason.Thesearethemajor factors influencing the rate of mineralization from organic matter (refer to the discussion of organic matter in Chapter 2.2).
TypicalENRvaluesforcultivatedAlbertasoilsareprovided in Table 3.4.9 and are based on typical soil organicmatterlevelsforeacharea.TestinglabsuseENRwhendevelopingNfertilizerrecommendations.Consequently,labsmayrecommendlowerNfertilizationratesforindividualsituationswheresoilanalysisENRishigherthantheexpectedtypicalrangeforthatsoilzone.
Table 3.4.9 Expected ENR Values for Alberta Soil Groups.
Soil Group
Cultivated Soil
kg/ha lb/ac
Mean Range Mean Range Brown 31 30–33 28 27–29DarkBrown 38 34–47 34 30–42Black 56 39–81 50 35–72 DarkGray 45 43–47 40 38–42DarkGray(Peace River Region)
41 34–54 37 30–48
Source: AF Field Research, Kryzanowski & Kelbert (2005)Variability in growing season nitrogen release (mineralization) will exist from field to field depending onmanagementhistory.Managementpracticessuchasdirectseeding,rotationwithforagesorlivestockmanure application tend to build the more labile (easily decomposable)fractionofsoilorganicmatter.Thishelpsto improve the nutrient supplying power for a specific field situation. The average ENR’s in Table 3.4.9 may underestimate the actual field values.
113
Chapter 3.4
Soiltestinglabsmayalsomakeanadjustmentforpulsecropstubbleormanureapplicationinthepreviousoneortwoyears.Dependingonyield,residuesfromprevious pulse crops can release between 20 to 30 kg/ha ofavailableNtothefollowingcrop.Likewise,releasefromtheorganicportionofthemanurewillincreasethesoil’snitrogensupplyingpowerforoneortwoyearsafterapplication.Thisunderscorestheimportanceofprovidingcompleteinformationaboutmanagementandmanure application history for a field when submitting samplesforanalysis.
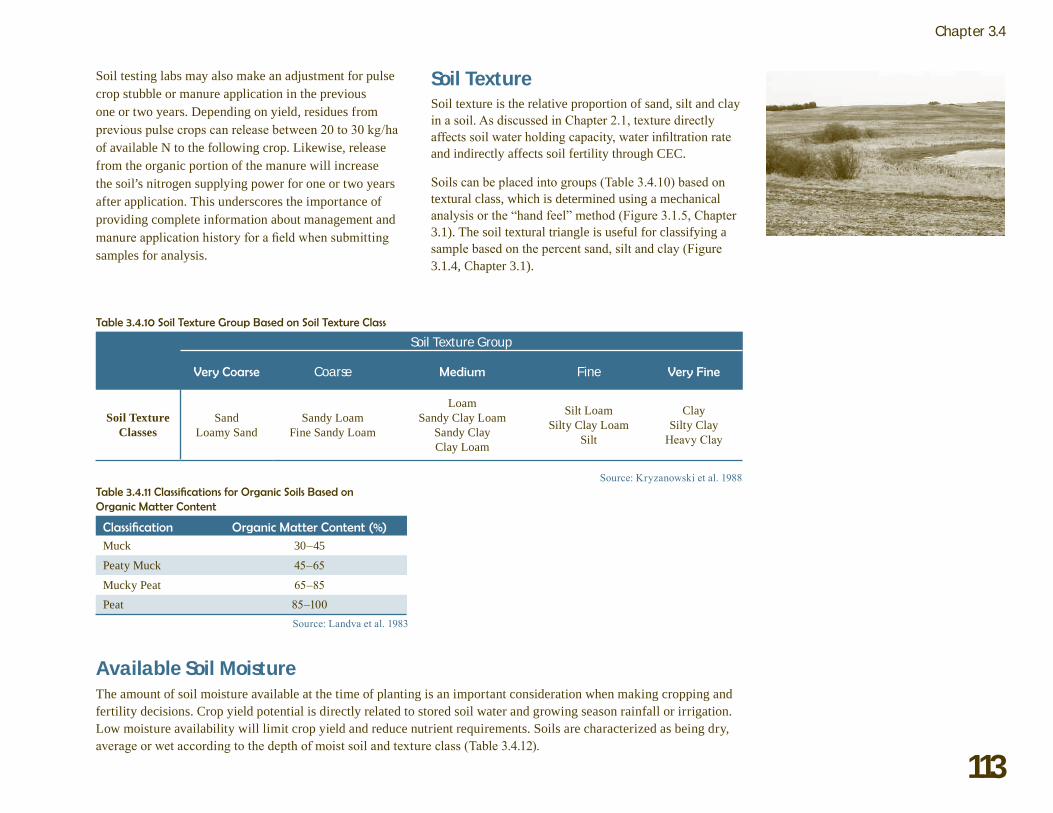
Soil Texture Soiltextureistherelativeproportionofsand,siltandclayin a soil. As discussed in Chapter 2.1, texture directly affects soil water holding capacity, water infiltration rate andindirectlyaffectssoilfertilitythroughCEC.
Soils can be placed into groups (Table 3.4.10) based on texturalclass,whichisdeterminedusingamechanicalanalysis or the “hand feel” method (Figure 3.1.5, Chapter 3.1).Thesoiltexturaltriangleisusefulforclassifyingasample based on the percent sand, silt and clay (Figure 3.1.4,Chapter3.1).
Table 3.4.10 Soil Texture Group Based on Soil Texture Class
Soil Texture Group
Very Coarse Coarse Medium Fine Very Fine
Soil Texture Classes
SandLoamySand
SandyLoamFineSandyLoam
LoamSandyClayLoam
SandyClayClayLoam
SiltLoamSiltyClayLoam
Silt
ClaySiltyClay
Heavy Clay
Source: Kryzanowski et al. 1988Table 3.4.11 Classifications for Organic Soils Based on Organic Matter Content
Classification Organic Matter Content (%)Muck 30–45
PeatyMuck 45–65
MuckyPeat 65–85 Peat 85–100
Source: Landva et al. 1983
Available Soil Moisture Theamountofsoilmoistureavailableatthetimeofplantingisanimportantconsiderationwhenmakingcroppingandfertilitydecisions.Cropyieldpotentialisdirectlyrelatedtostoredsoilwaterandgrowingseasonrainfallorirrigation.Lowmoistureavailabilitywilllimitcropyieldandreducenutrientrequirements.Soilsarecharacterizedasbeingdry,average or wet according to the depth of moist soil and texture class (Table 3.4.12).
114
Practical Use of Soil Analysis Results
Table 3.4.12 Qualitative Interpretation of Available Soil Moisture
Soil Texture Group
Depth of Moist Soil (cm)
Dry Average WetVery Coarse 30–60 60–120 120+Coarse 30–50 50–100 100+Medium 15–30 30–60 60+Fine & Very Fine 15–30 30–60 60+
Adapted from Brady and Buckman 1969
Determining Soil Available MoistureSoilmoisturecanbeassessedatthesametimethat fields are being soil sampled. The same rulesregardingrepresentativesamplingapplytoassessingsoilmoisture.Areassuchasdepressions,slopes,andknollscanbeassessedseparatelyforsite-specific crop planning. Sample a minimum of 15 to 20 sites per field and record the average depth ofmoistsoil.Springsamplingmayrequiremoresites within a field because of increased variability causedbysnowtrapping,snowdrifting,waterrunoff,moisturemigrationwithinthesoilandvariationsingroundfrost,etc.
Soil moisture can be determined by:
using the “feel test” (Figure 3.1.5, Chapter 3.1)
subjectivevisualevaluation
measuringthedepthofmoistsoilinacollectedsoilcore
brown soil probe (Figure 3.4.4)
•
•
•
•
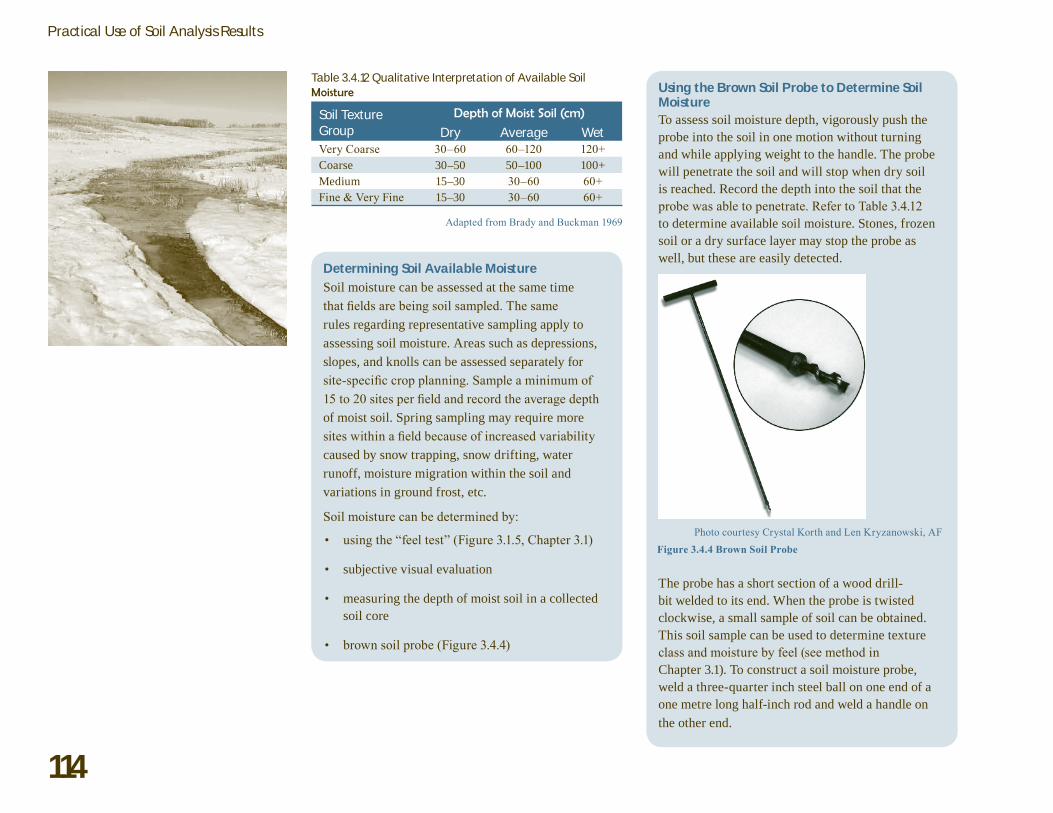
Using the Brown Soil Probe to Determine Soil MoistureToassesssoilmoisturedepth,vigorouslypushtheprobeintothesoilinonemotionwithoutturningandwhileapplyingweighttothehandle.Theprobewillpenetratethesoilandwillstopwhendrysoilisreached.Recordthedepthintothesoilthattheprobe was able to penetrate. Refer to Table 3.4.12 todetermineavailablesoilmoisture.Stones,frozensoiloradrysurfacelayermaystoptheprobeaswell,buttheseareeasilydetected.
Photo courtesy Crystal Korth and Len Kryzanowski, AFFigure 3.4.4 Brown Soil Probe
Theprobehasashortsectionofawooddrill-bitweldedtoitsend.Whentheprobeistwistedclockwise,asmallsampleofsoilcanbeobtained.Thissoilsamplecanbeusedtodeterminetextureclass and moisture by feel (see method in Chapter3.1).Toconstructasoilmoistureprobe,weldathree-quarterinchsteelballononeendofaonemetrelonghalf-inchrodandweldahandleontheotherend.

115
Chapter 3.4
Fertilizer RecommendationsFertilizerrecommendationsareusuallybasedonyieldresponsecurvesoryieldexpectationsforacropbasedonsoilmoistureandgrowingseasonprecipitation.Recommendationsmayvaryconsiderablybetweenlabsbecauseofdifferentanalyticalmethods,yieldresponsemodels,yieldpredictions,expectedprecipitationandfertilizer use efficiency.
Agoodsoilsampleandanaccuratesoilanalysisinterpretationarenottheonlyconsiderationsforgoodyields and maximum profit in crop production. Even if therecommendedfertilizerrateisapplied,otherfactorsmayoverridethefertilizereffectsbylimitingcropyieldpotential. These factors include:
soiltypeandstoredsoilwaterattimeofplanting.
pestcontrol.
irrigationwaterqualityandmanagement.
otheragronomicandcroppingsystemfactors(e.g., seeding date, rate, planting system, fertilizer applicationmethod,croprotation,varietyselection,etc.).
•
•
•
•
Manyofthesefactorsareunderdirectcontroloftheproducer;therefore,afavourablefertilizerresponseisusuallyrelatedtocropmanagement.Criticallyexaminefertilizerrecommendations,yieldpredictionsandgrowingseasonprecipitationtoensuretheyarerealisticforthearea.
Figure3.4.5illustrateshowalloftheseconsiderationsareassembledintoadecision-makingmodelusedtodevelopafertilizerrecommendation.ThismodelisusedbytheAFFIRMsoftwarepackage.Formoreinformation,seeChapter 7.2.
tip
If a recommendation on a lab analysis does not appear reasonable,
request an explanation from the testing lab, seek advice from a qualified agronomic consultant (e.g., Certified Crop Advisor), or contact AF’s Ag-Information Centre, toll-free at 310-FARM (3276).

116
Practical Use of Soil Analysis Results
Figure 3.4.5 Decision Making Model Used by AFFIRM to Develop Fertilizer Recommendations

117
Chapter 3.4
Key information in a soil analysis report includes: client information, sample identification, date sample was received and processed, nutrient analyses, soil quality parameters (e.g., pH, organic matter, EC) and fertilizer recommendations.
Soils with pH near 7.0 are considered neutral. Extremes in pH will affect crop productivity. Fertilizer recommendations are adjusted for reduced yields.
High soil salinity causes poor and spotty crop stands, uneven and stunted growth, and poor yields. Fertilizer recommendations are adjusted for reduced yields.
Cation exchange capacity indicates the ability of a soil to retain nutrients in the root zone. It can be estimated from the clay and organic matter content of soil.
•
•
•
•
Organic matter acts as a revolving nutrient bank account by releasing crop available nutrients over an extended period.
Soil texture directly affects soil water holding capacity and water infiltration rate, and indirectly affects soil fertility through CEC.
Crop yield potential is directly related to stored soil water plus growing season rainfall or irrigation.
Fertilizer recommendations may vary considerably among labs because of different analytical methods, yield response models, yield predictions, expected precipitation and fertilizer use efficiency.
•
•
•
•
summary