achievements of shale gas development in · pdf fileachievements of shale gas development 3....
TRANSCRIPT

1
Research Institute of Petroleum Exploration & Development, CNPC
May, 2017
Achievements of Shale Gas Development in CNPC
Ailin Jia

2
China owns the second largest shale gas resources in the world,only less than USA, and becomes another most successful countryin shale gas development. Especially in the last two years, we havegot our resources potential into rapid production increase.
CNPC is the earliest domestic enterprise engaged in shale gasexploration and development in China. Through internationalcooperation, technology & management innovation, fielddevelopment tests and large-scale practical application, CNPC hasbuilt 5 technology series, 4 operation modes and 8 main operators.
These achievements provide valuable technology & managementexperiences to speed up shale gas development, and shale gas hasbecome one of the most important parts in China gas industry.
Introduction

3
Outlines
1. Situation of Shale Gas Development
2. Achievements of Shale Gas Development
3. Discussion

4
Resources
Up to now, shale gas resources of China located in two main areas
According to EIA(2013) ,recoverable resources of shalegas in China is 31.6 tcm and74% in marine shale.
Shale gas resource distribution in China
CNPCSinopecYanchangMLR
Beijing
Xi’an
ChengduChongqing
FulingChangning-Weiyuan
Yanchang
Zhaotong
• Marine resources in southern China
• Continental resources in middle China

5
Resources
• Three marine shale gas pilots (Changning-Weiyuan in Sichuan,Zhaotong in north Yunnan and Guizhou, and Fuling in Chongqing)
•One continental shale gas pilot (Yanchang in Shaanxi)
Shale gas productivity in China
Block name Productivity in 2014(bcm) Productivity in 2016(bcm)
Fuling 2.50 7.00
Changning-Weiyuan 0.55 4.09
Zhaotong 0.15 1.21
Yanchang 0.02 0.20
Total 3.22 12.50
Productivity of three marine pilots increased rapidly

6Changning and Zhaotong pilots
In the three marine pilots, by the end of 2016, 500 horizontalwells have been drilled, and 400 wells have put into production.The production is 7.9 bcm in 2016 In Yanchang continental pilot, nearly 100 evaluation wells havebeen drilled. But still didn’t get commercial production
Jiaoshiba pilot
Wells being drilled
Drilled wells
Production

7
Cooperative evaluation stage (2007-2011)Explored the technologies for shale gas development, and built out shale
gas development strategies.
Development test stage (2012-2015)Developed, tested and determined the major technologies for shale gas
development, and single well production & EUR increased rapidly.
Scale development stage (2016-)Single well production & EUR increased steadily, and development
technologies are optimized continuously. Annual production increased
rapidly.
Development stages

8
2012 2013 2014 2015 2016 2017 2018 2019 20200
5
10
15
20
25
30
35
Shal
e ga
s pr
oduc
tion
(bcm
) Shale gas
Shale gas production has increased rapidly in Chinasince 2013, similar to the historic period of tight gasfrom 2005 to 2008.
• Recoverable resources have been proved• Daily production of single well almost doubled• The development costs declined
Annual production and forecast of shale gas in China
Annual production of tight gas in China
2005 2006 2007 2008 2009 2010 2011 2012 2013 2014 2015 20160
5
10
15
20
25
30
35
Tight gas
Tigh
t gas
pro
duct
ion
(bcm
)

9Burial depth of Longmaxi Fm.in Sichuan Basin
ZhaotongChangning
Weiyuan
Fushun-Yongchuan
Favorable areas buried less than 4500m is about 50,000km2, andthe total resources 20 tcm
The operational areas are 30,000km2 with total resources of 15 tcm
Resources in CNPC

10
Production blocks are mainly buried less than 3500m
Annual production of shale gas is 2.8 bcm, being themain contributor to the growth of natural gas production
Production in CNPC
0.02 0.06 0.16
1.3
2.8
0
1
2
3
4
2012 2013 2014 2015 2016
Annual production of shale gas in CNPC
(bcm)
Annual production of CNPC in 2020 is estimated to be over 10 bcm.

11
More horizontal wells were drilled in the past four years
Lateral length of horizontal well increases with the
technical improvements of horizontal drilling
0
50
100
150
1000
1400
1800
2014 2015 2016 2017
wel
l num
ber
horiz
onta
l wel
l len
gth
(m)
horizontal well length
number of horizontal well
Horizontal well parameters in CNPC
Well length & number

12
Technology improvements in hydraulic fracturing through
increasing of pumping rate, proppant and fluid volume
0
1500
3000
0
25000
50000
2014 2015 2016 2017
prop
pant
vol
ume(
t)
frac
turi
ng fl
uid
volu
me(
m3 )
fracturing fluid volume
Proppant volume
Fracturing fluid & proppant volume

13
0
5
10
15
20
0
4000
8000
12000
2014 2015 2016 2017
test
ing
prod
ucti
oin
rate
(10
4 m3 /
d)
EUR(
104 m
3 )
EUR
Testing production rate
Single well testing production increases rapidly
Single well EUR have been improved obviously
EUR & Testing rate

14
0
10
20
2014 2015 2016 2017
IRR(
%)
Com
preh
ensi
vve
inve
stm
ent o
f si
ngle
wel
l(m
illio
n)
Integrate cost per well
IRR
Comprehensive costs have been obviously reduced
Economic benefits of shale gas well have been
significantly improved
Low economic High economic
Cost & IRR

15
Partnership
CNPC has built 4 operation modes, involving 8 operators,speeding up the shale gas development process in China
International Co-operation
DomesticCo-operation
Risk Operation
Proprietary Development4
Ope
ratio
n M
odes
BP
Changning Co.
Sichuan Co.
Chongqing Co.
Chuanqing Drilling Co.
Great Wall Drilling Co.
Southwest Oil&Gas Field
Zhejiang Oil Field
8 O
pera
tors

16
Outlines
1. Situation of Shale Gas Development
2. Achievements of Shale Gas Development
3. Discussion

17
Five development technology series for shale gasburied less than 3500m have been developed.
1
5 2
34
Shale gas development technologies
Technologies

18
inline1950
Geological map Inline1950 seismic migration
3D stratigraphic surface Natural fracture prediction
Seismic survey
A integrated technique of 3D seismic acquisition, process andinterpretation• 2D seismic for structure evaluation and reservoir parameters prediction• 3D seismic for well trajectory design of horizontal drilling• The consistency of parameters prediction is up to 80% in 3D seismic
acquisition areas

19
Reservoir Evaluation
Stratigraphy structure and OGIP evaluation for producing layers in Changning area
Lower unit
Wufeng Fm,
4
3
1
2
Baota Fm.
15~20m
27%
15%
17%
8%
9%
PercentageUnit reserve factor
66m
0.5
0.8
0.6
1
0.8
0.2 24%upper unit
Geological evaluation on basis of flow unit appraisal
• The gas bearing layer is the lower part of the Longmaxi Formation with thicknessof 30m. The development target has been optimization to the lower unit withthickness of 15m. The drilling target is the first zone with thickness of 2m
• Reserve abundance is reevaluated: the development zone has averageabundance of 0.45 bcm/km2, the lower unit is 1.2 bcm/km2

20
Horizontal wells drilling
• Through optimization on casing program and PDC bitsbased on factory drilling management, drilling cycle ofsingle well shortened from 140 days to 70 days
• Water-based drilling fluid being tested, much cheaper andmore environment friendly
Drilling cycle of different period Drilling cycle using different drilling fluid
150
70
196
67.5 55.583.5
0
50
100
150
200
250
Well block N201
Aver
age
drilli
ngcy
cle/
day
Evaluation Period Productivity Construction Period
Well block W202 Well block W2040
5
10
15
20
Oil-based Water-based
18.7
12.3
Hor
izon
tal s
ectio
n dr
illing
cyc
le/d
ay
21
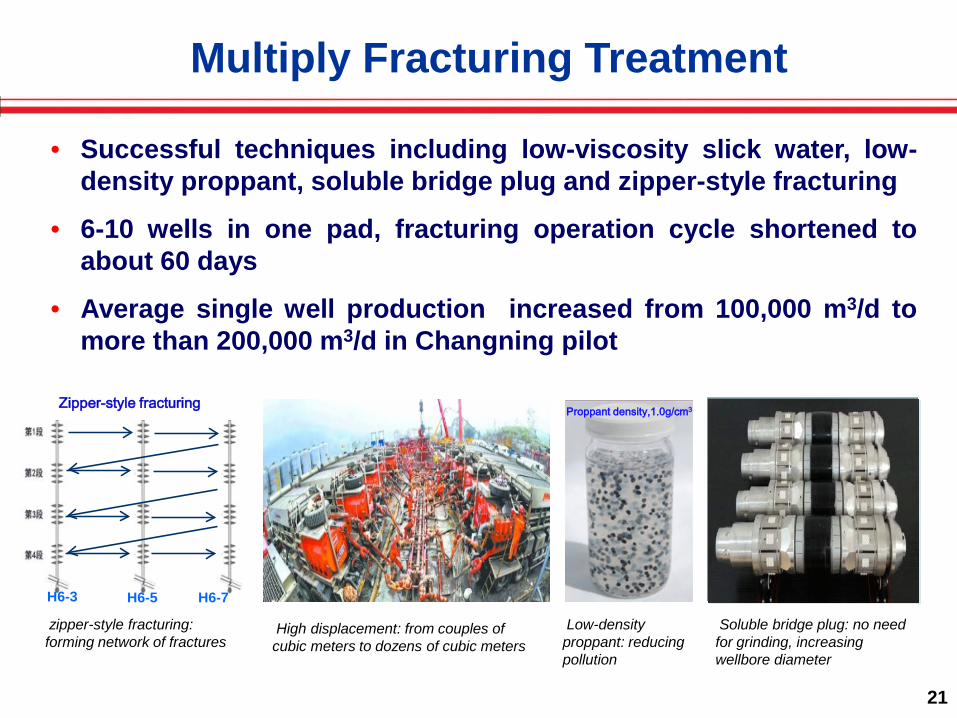
Multiply Fracturing Treatment
Proppant density,1.0g/cm3
H6-3 H6-5 H6-7
Zipper-style fracturing
zipper-style fracturing: forming network of fractures
• Successful techniques including low-viscosity slick water, low-density proppant, soluble bridge plug and zipper-style fracturing
• 6-10 wells in one pad, fracturing operation cycle shortened toabout 60 days
• Average single well production increased from 100,000 m3/d tomore than 200,000 m3/d in Changning pilot
High displacement: from couples of cubic meters to dozens of cubic meters
Low-density proppant: reducing pollution
Soluble bridge plug: no need for grinding, increasing wellbore diameter

22
• Probabilistic method was developed to evaluate EUR
• Average single well EUR(P50) amounts to 81 MMcm, the largestover 100 MMcm
• Average single well production rate in the 1st year reaches 70~110Mcm/d, annual decline rate is 40%-60% for the 1st year and about25% for the 3rd year
Horizontal well model with multi-scale fractures based on fractal geometry
(a)
(c)
(b)
Productivity Evaluation
EUR risk quantification
0
0.1
0.2
0.3
0.4
0.5
0.6
0.7
0.8
0.9
1
1.1
0
0.01
0.02
0.03
0.04
0.05
0.06
0.07
累积
概率
概率
密度
EUR 106m3
概率密度
累积概率
置信域(80%):1.42~1.65亿方confidence interval(80%):142~165 MMcm
prob
abilit
y de
nsity
Cum
ulat
ive
prob
abilit
y
probability densitycumulative probability

23
Well spacing optimization
• In 2012-2015, Well spacing is 400-500m
• In 2016-2017, Well spacing reduced to 300-400m
• Recovery factor enhanced by 10%
427m213m
213m

24
• Compared with tight sands, Stress sensitivity inshale is much serious
Stress sensitivity
Shale gas reservoir model
Thin bedded shale layer
Fracture
Formation deformation
Pressure drop
Tight gas sand reservoir
Non-permeable layer
Lenticular sands
fracture
Pressure drop

25
• According to stress sensitivity, drawdownmanagement helps enhancing EUR by more than 30%
Production management
Optimal production management:
• Initial rate: 1/4~1/5 QAOF drawdown or ½ test production rate
• Pressure drawdown: drawdown rate less than 0.15MPa/d for the
first 3 months, and less than 0.05MPa/d for the first year
• Ground boosting: 1~1.5 year(s) after producing
• Annual decline rate : about 40%~45% for the 1st year

26
Outlines
1. Situation of Shale Gas Development
2. Achievements of Shale Gas Development
3. Discussion

27
1. Uncertainty of shale gas resource evaluation?
Discussion
Total reserves= Free gas reserve + Adsorbed gas reserve= f( thickness, porosity, gas saturation, 𝐞𝐞tc.)+ f ( TOC,
etc.)• Adsorbed gas portion: 20%~80%?
• Effective porosity: 2%~8%?
• Gas saturation: 50%~60%
ChangNing Barnett Marcellus Cutbank
Gas saturation(%)
56.8% 75% 70% 95%
Comparison of gas saturation
28
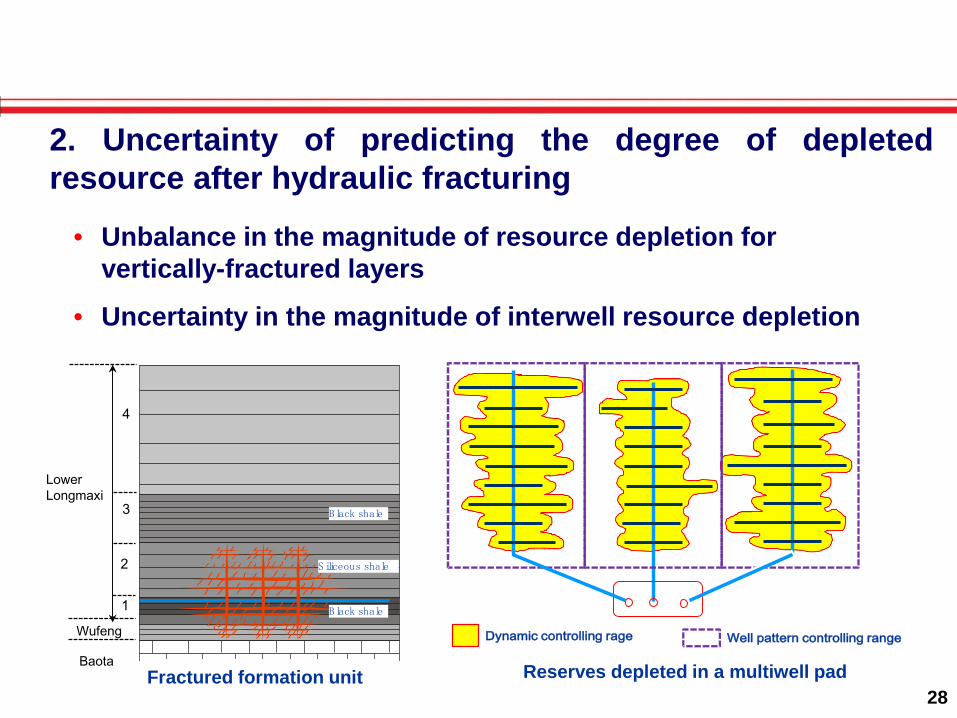
2. Uncertainty of predicting the degree of depletedresource after hydraulic fracturing
Wufeng
4
3
1
2
Baota
B lack shale
B lack shale
S iliceous shale
LowerLongmaxi
平台Dynamic controlling rage Well pattern controlling range
• Unbalance in the magnitude of resource depletion for vertically-fractured layers
• Uncertainty in the magnitude of interwell resource depletion
Fractured formation unit Reserves depleted in a multiwell pad

29
• Uncertainty in the magnitude of matrix resource depletion within fracture network
H o r iz o n ta l w e llb o r e
M ainfracture
pf
pi
rmax?
Schematic diagram showing matrix in SRV

30
Thanks for your attention!