accurate stress analysis on steel box girder of long span
TRANSCRIPT

1. INTRODUCTIONFinite element method (FEM) has been extensivelyused in modern structural engineering arena. Anaccurate and reliable FE model plays a critical role inthe studies on structural health monitoring and conditionassessment, wind-resistance and earthquake-resistanceanalysis, vibration control, etc. Therefore, manyresearch studies have been focused on the FE modelupdating technique based on experimental data in orderto achieve a FE benchmark model which is suitable fordifferent analysis objectives (Mottershead et al. 1993;Ou 2003; Zhang and Sun 2002; Jaishi and Ren 2005;Wang et al. 2005).
Accurate Stress Analysis on Steel Box Girder
of Long Span Suspension Bridges Based on
Multi-Scale Submodeling Method
Hao Wang1,2,*, Aiqun Li1, Ruomei Hu1 and Jian Li2
1College of Civil Engineering, Southeast University, Nanjing 210096, P.R. China2Department of Civil and Environmental Engineering, University of Illinois at Urbana-Champaign, Urbana, IL 61801, U.S.A.
(Received: 2 January 2009; Received revised form: 16 November 2009; Accepted: 17 November 2009)
Abstract: The streamline flat steel box girder is broadly used in long span cable-supported bridges all over the world. As one of the most important part of the bridges,its stress level and distribution under various dynamic loads are especially concerned.However, it is difficult to obtain the accurate stress of the steel box girder by commonfinite element (FE) calculation. The Runyang Suspension Bridge (RSB) is taken as anexample. To increase the accuracy of results, a 3-dimensional FE full model for theRSB is created by ANSYS and a spatial submodel of the steel box girder is particularlybuilt with greater detail. Submodeling method is then employed as a connectiontechnique to link different scale models. After the global analysis and connectingprocess, the local stress of the steel box girder under various vehicle loads is obtainedby submodel analysis. The composite action between the full model and the submodelis analyzed, and the reasonable mesh size for the submodel is specially investigated.The numerical results are proved to be accurate by the field test results. This studydemonstrates the reliability and efficiency of the submodeling method; and canprovide references for accurately analyzing and designing the steel box girders of otherlong span bridges.
Key words: suspension bridge, multi-scale, finite element (FE) modeling, steel box girder, submodeling method.
*Corresponding author. Email address: [email protected]; Fax: + 86-25-83790921; Tel: +86-25-83269996.Editor. K.F. Chung.
Advances in Structural Engineering Vol. 13 No. 4 2010 727
Although all of the structural analyses results shouldbe accurate, there are different degrees of accuracyneeded at different locations in a bridge under differentloading conditions. The streamline flat steel box girder isone of the examples. The streamline flat steel box, owingto its distinguished performance, has been broadlyemployed in long span bridges since it was firstly used inSevern Bridge in England in 1996. A common way to simulate the steel box girder is employing thesimplified spine FE model; however, due to the lack ofdetail, its coarse FE mesh fails to fulfill the requirementsfor analyzing the stress level and assessing the fatiguecondition of the real steel box girder.

Accurate Stress Analysis on Steel Box Girder of Long Span Suspension Bridges Based on Multi-Scale Submodeling Method
728 Advances in Structural Engineering Vol. 13 No. 4 2010
In order to obtain more accurate results in the stressanalysis of certain region like the steel box girder, twooptions are available. One is reanalyzing the entire modelwith greater mesh refinement. However, it might becomputationally too expensive to perform the stressanalysis on the full model of such a super-long spansuspension bridge, due to the fact that too many elementsand nodes are modeled. Furthermore, building a largescale finite element model with too much detail willintroduce more uncertainties hence will increase thepossibility of errors in analysis. Another option is usingmulti-scale FE modeling technique which refines themodel only within the region of our interest. In the multi-scale modeling, models of different scale are linkedtogether by using connection technique. Considering itsadvantages and great potential to give more accurateresult while maintaining relatively low computationaldemand, study on multi-scale FE modeling technique, aswell as its connection technique, is of great significance(Cormier et al. 1999; Chan et al. 2003).
In this paper, the steel box girder of the Runyangsuspension bridge (RSB) with a main span of 1490 m isselected as an engineering background. According todifferent objectives during the structural healthmonitoring and safety assessment, the RSB is analyzedby multi-scale FE modeling technique and its steel boxgirder is particularly studied by submodeling method.Then the numerical results are validated by experimentalresults of the field test, which provides theoreticreferences for analyzing and designing steel box girderof long span bridges.
2. THE SUBMODELING METHODThe submodeling method is an effective way ofanalyzing the local stress of large complex structures,and it has been successfully applied in a few existingengineering projects around the world. For example, thesubmodeling method has been used for the analysis oforifice of stress concentrations (Cormier et al. 1999;Sinclair et al. 2000), high arch dam (Che and Song2003), the deck structure of long span cable-stayedbridge (Xu et al. 2004), the double-lap compositeadhesive bonded joint (Bogdanovich and Kizhakkethara1999), the bonded joints for ship structures (Wang et al.2004) and other complex structures (De Langhe et al.1997; Rabinovich and Sarin 1996). However, theapplication of the submodeling method on engineeringstructures is still at the beginning stage. Morespecifically, the examples of large scale bridges are rare.On the other hand, the world has been witnessing the mushrooming of super large and complex structures,along with the rapid progress in design methodologyand construction technologies. This will inevitably raise
challenges to the stress analysis of complex structures.Therefore, the submodeling method is a promisingtechnique in solving such demanding engineeringproblems.
The basic steps of the submodeling method are as follows:
(1) Perform global analysis. The full model ismeshed with coarse grids, excluding the localstructural details, and then the displacements onthe cut boundary can be calculated.
(2) Create the submodel. The submodel should be created according to the dimensions andconstructions of the substructure, as well as therequirements of the analysis objective. Properelements should be selected for the submodel. Itis obvious that the grid density of the submodelshould be increased to a higher level than theglobal model.
(3) Perform cut boundary interpolation. Not all thenodes along the cut boundaries are one-to-onemapped between the full model and the submodel.For those mapped nodes, apply displacementsfrom the global model directly on the submodelcounterparts; for non-mapped nodes, calculate thedisplacements at these nodes by interpolatingbetween adjacent nodes from the full model. Thisis a key step in submodeling.
(4) Duplicate on submodel any other boundaryconditions and loads on the full model, andapply interpolated boundary displacements on itat the same time.
As mentioned above, the submodeling method ismore advanced than the traditional method on stressanalysis of the steel box girder of long span bridges(Hsu and Fu 2002; Sennah and Kennedy 2002).Submodeling, however, is based on St. Venant’sprinciple which assumes the cut boundaries are farenough away from the stress concentration region. Thisassumption should be adequately satisfied to achievereasonable accurate results.
3. STRUCTURAL FINITE ELEMENT (FE)MODELING
3.1. Overview of RSB
The RSB is a single-span hinged and simply supportedsuspension bridge with a main span of 1490 m, as shownin Figure 1. By the time of this study, it is the longestsuspension bridge in China and the third in the world.
In the RSB, there are three spans, two towers andcables. The main span contains suspenders at an intervalof 16.1 m and rigid central buckles which is firstly usedin suspension bridge in China. The two side spans, withthe length of 470 m, include no suspender. With the

Hao Wang, Aiqun Li, Ruomei Hu and Jian Li
Advances in Structural Engineering Vol. 13 No. 4 2010 729
height of 218.905 m, the two towers employ the multi-story structure with two columns and three crossbeams.In the tower column, the single-box single-room cross-section is used. The main cable is made up of 184 prefabparallel subsection cables and each subsection cablecontains 127 high-strength steel wires.
The welded streamline flat steel box girder isemployed as the main girder of the RSB. The length ofthe main girder is 1485.16 m which is divided into foursegments, including the end-span segment, mid-spansegment, near-mid-span segment and standard segment.The standard segment includes 84 parts, with the lengthof 1352.40 m for the entire segment and 16.1 m for eachpart. The width of the main girder, including wind mouthand road for examining and repair, is 38.7 m and the
height of the main girder at the middle is 3.0 m. Q345-Dsteel is mainly used in the main girder. The thickness ofthe steel deck on the main girder is 14 mm, and thethickness of the top “U” girder under the top plate and thebottom “U” girder above the bottom plate is 6 mm.The distance between the transverse clapboards is 3.22 m.
The stress of 1/2, 1/4 and 1/8 section of the maingirder of RSB are analyzed by submodeling method,using ANSYS program (Swanson Analysis Systems Inc2004). The numerical results are compared withexperimental results from the field test. The accuracyand reliability of the method are validated by fieldmeasurements. Considering the similarity of the analysisprocedure, only the 1/4 section is taken as an example inthe study.
Yangzhou Zhenjiang
470 20.5 20.590×16.1 470
218.905
8.00 3.0
69.300
218.905
5.303.0
4×50 4×504×77+52 4×77+521490
−53.70 (mean)
Center line of the main cable Center line of the main cableCenter line of the bridge
1200
1.5%
4500
2%
450
300 680
1700 1200
600 200
4500
1.5%
1765
906
3000
2%
27300/2 = 13650
32900/2 = 16450
34300/2 = 17150
27300/2 = 13650
32900/2 = 16450
25×600 = 15000
14×900 = 126009×420=3780
34300/2 = 17150
1700
−55.13 (mean)
(b) Elevation and plan (Unit: m)
(a) Two photos of RSB
(c) Cross-section of the steel box girder (Unit: mm)
Figure 1. Configuration of RSB

Accurate Stress Analysis on Steel Box Girder of Long Span Suspension Bridges Based on Multi-Scale Submodeling Method
730 Advances in Structural Engineering Vol. 13 No. 4 2010
3.2. Full Model
A 3-dimensional full model for the RSB, shown inFigure 2, is built in ANSYS program according to thedesign. In this model, the central buckle (the first timeemployed in the suspension bridge in China) and the towers are simulated by spatial beam elements withsix degrees of freedom for each node. The main girderis simulated by four-node shell element, and thestandard segment is meshed according to the nodes ofthe suspenders and midpoints of the adjacent suspendersin the longitudinal direction. The transverse clapboard,the top and bottom plates are meshed according to thedistance of the “U” girder in the transverse direction.
The main cables and the suspenders are simulated by3-dimensional linear elastic truss element with threedegrees of freedom for each node (Chan et al. 2003). Themain cables and the deck are meshed according tothe nodes of the suspenders. The pavement and therailings on the steel box girder are simulated by lumpedmass element which provides no rigidity. The material
properties and real constants of the structure are strictlycalculated according to the design and assigned to thesimulated elements. The nonlinear stiffness characteristicof the back cables due to gravity effect is approximatelysimulated by linearizing the cable stiffness using theErnst equation of equivalent modulus of elasticity (Ernst1965). All of the corresponding material properties andthe real constants of the elements are listed in detail in Liet al. (2006).
The deck and the corresponding crossbeams of thetowers are coupled in three degrees of freedomincluding the vertical displacement, the transversedisplacement and the rotation around the longitudinaldirection. As the first time application in China, thecentral buckle is precisely simulated and coupled withthe deck and the main cables according to the design.Considering the significance of the connection betweenthe main cables and the two towers, the configuration ofthe main cable saddle is given in Figure 3.
According to the design of the main cable saddle inRSB as shown in Figure 3, the main cable could bestably clamped by the main cable saddle installed onthe top of the tower, hence there is no relativedisplacement between the main cable and the maintower after the bridge is finished and open to thetraffic. Therefore, the main cables are fixed on the topof the towers in the full model.
Because the two main towers of RSB are made ofreinforced concrete and are supported by rigidfoundations, the bottoms of both towers are fixed at the
x
y
z
Figure 2. The full model
Elevation
3654.9
710
3654.9720
A
A–A
1269969
3300
ACenter line of the main tower
218.905 m
215.600 m
3740
435
6000
Main spanSide span
Plan
3710
+ +
7420
9500
Side span Main span
Figure 3. Configuration of the main cable saddle in RSB (Unit: mm)

Hao Wang, Aiqun Li, Ruomei Hu and Jian Li
Advances in Structural Engineering Vol. 13 No. 4 2010 731
bases. There is no displacement permitted at the bottomof the back cable, so the two back cables at the end ofthe side spans are also are fixed at the bases.
Since the distance between two adjacent suspendersis 16.1 m, the length of each shell element of onestandard part is 8.05 m in the longitudinal direction.Because the deck is meshed according to the distance ofthe “U” girder, the width of each shell element is 0.30 mon the top plate and 0.45 m on the bottom plate in thetransverse direction, respectively. It is obvious that themesh on the full model is too coarse in the longitudinaldirection to achieve accurate stress analysis results.However, the increase in the grid density will result inhuge number of elements, since the total elementnumber of the full model is already 18660. Therefore, itis necessary to employ the submodeling method foraccurate stress analysis.
3.3. Submodel
The steel box girder of the standard segment issubmodeled 3-dimensionally, strictly based on theoriginal design. The length of the submodel (includingtwo parts) is 32.2 m, as shown in Figure 4.
In the submodel of the steel box girder, the top andbottom plates, the “U” girder, the wind mouth and thetransverse clapboard are all numerically modeled by four-node shell element. The material properties and realconstants are also validated by comparing with the
corresponding design values. The total element numberof the submodel is 42241. It is obvious that the griddensity increases greatly compared to that of the fullmodel, and the density of the stress concentration regionin submodel is higher than that of common parts (Li et al.2007). The length and the grid density of the submodelare proved to be adequate in Section 5.1.
3.4. Submodel Analysis
After creating the full model and the submodel of thesteel box girder of RSB, cut boundary interpolationprocess is programmed by using APDL (ANSYSParametric Design Language) in ANSYS, and theconnection of the submodel and the full model is shownin Figure 5. Then the stress analysis results are achievedas follows.
Firstly, the structural displacements of the full modelunder all kinds of load cases are analyzed. Then, thenodes on the cut boundary of the submodel areidentified and their displacements from the full modelare automatically applied on these nodes. Moreover, thetemperature loads, the tension forces of the suspenderand the vehicle loads are also applied on the submodelafter the analysis type and option are defined. In details,the tension force of the suspender is simulated byconcentrated force, and the vehicle loads are simplifiedas concentrated forces in the full model analysis whileas equivalent surface loads in the submodel. Finally, the
Figure 4. The submodel of the steel box girder
1/4 section of themain girder
x
y
z
x
y
z
Figure 5. The connection of the submodel and the full model
Accurate Stress Analysis on Steel Box Girder of Long Span Suspension Bridges Based on Multi-Scale Submodeling Method
732 Advances in Structural Engineering Vol. 13 No. 4 2010
January 4–6, 2005, prior to the official opening of thebridge. Because of the significance of the steel boxgirder, the stress measurements on key sections of thesteel box girder under various vehicle loads is one of themain tasks in the field load test (Li et al. 2005).
4.1. Overview of Vehicle Loads
Considering the design moment values of the steel boxgirder, the load efficiency and the turning round of thevehicles, 300 kN weight vehicles were selected as thevehicle loads of the field test, the effect of which wasequivalent to the vehicle-20 level in the highway designcode. Figure 7 shows the vehicle loads in the field testof RSB and Table 1 shows the technical parameters ofthe vehicle loads.
The total number of the needed vehicles in the fieldtest was obtained through the calculation of the mostunfavorable vehicle load cases according to the designstandard live loads and the load efficiency coefficients.52 vehicles were used as load in the field test based onthe calculation. Before the load test, each vehicle werecarefully examined and weighed according to the testrequirements.
4.2. Vehicle Load Cases
There are eight kinds of vehicle load cases in the fieldtest. Among these load cases, case two and three aremore unfavorable for the 1/4 span section of the steelbox girder. For this reason, they are chosen as twoexamples in this paper. Table 2 shows the longitudinalvehicle location of load case two and three in the fieldtest of RSB. The transverse vehicle location of the twoload cases is shown in Figure 8. The unit is cm and onlythe left front wheel of the vehicle is marked in Figure 8.As can be seen from Figure 8, the vehicle location issymmetric in the transverse direction.
4.3. Measured Points Layout on the Steel
Box Girder
Figure 9 shows the layout of the stress measured pointson the 1/4 span steel box girder of RSB. For the sake ofmeasurement convenience, the measured points on the“U” girder, the top and bottom plates were all locatedbetween the two adjacent transverse clapboards whichcontain the 1/4 span section in the longitudinal direction.
In the number of the measured points in Figure 9, “R”represents the right driveway (downstream), “L”represents the left driveway (upstream). “U” representsthe top plate, “D” represents the bottom plate and “M”represents the middle of the box girder. As shown inFigure 9, some measured points were located on the top“U” girder, the top and bottom plates in order to obtainthe transverse distribution of bending stress of the steel
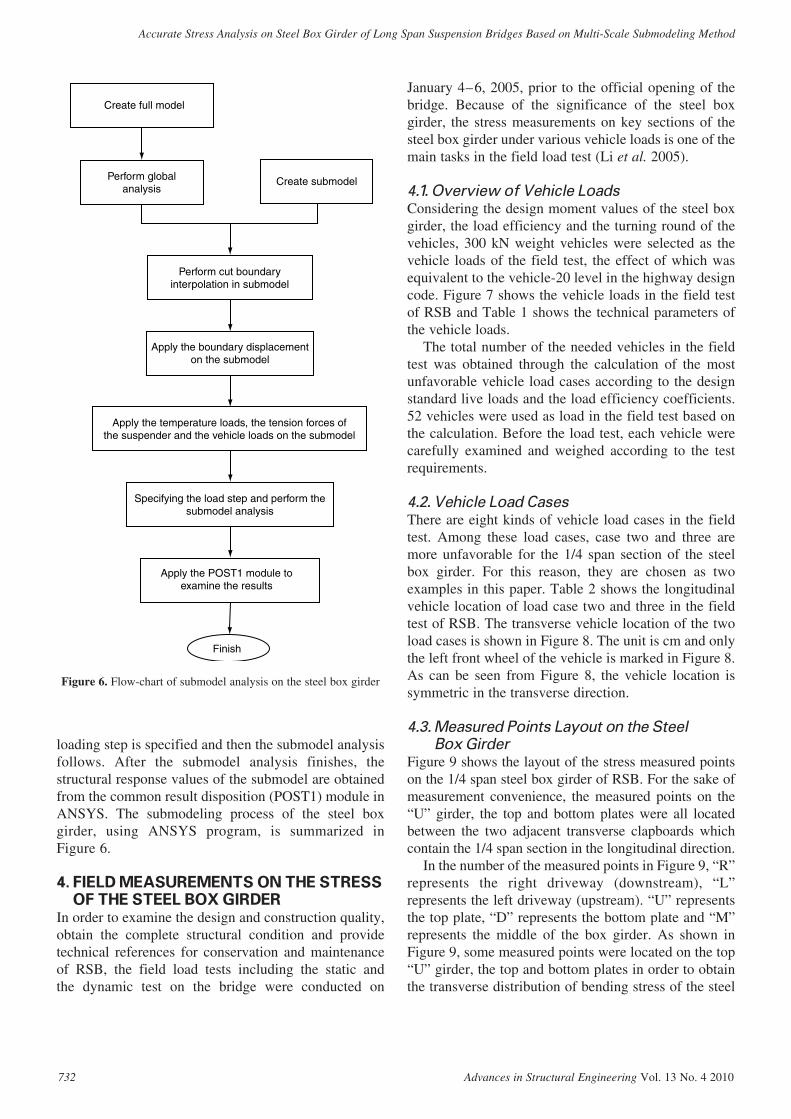
Create full model
Create submodel
Perform cut boundaryinterpolation in submodel
Apply the boundary displacementon the submodel
Apply the temperature loads, the tension forces ofthe suspender and the vehicle loads on the submodel
Specifying the load step and perform thesubmodel analysis
Apply the POST1 module toexamine the results
Finish
Perform globalanalysis
Figure 6. Flow-chart of submodel analysis on the steel box girder
loading step is specified and then the submodel analysisfollows. After the submodel analysis finishes, thestructural response values of the submodel are obtainedfrom the common result disposition (POST1) module inANSYS. The submodeling process of the steel boxgirder, using ANSYS program, is summarized inFigure 6.
4. FIELD MEASUREMENTS ON THE STRESSOF THE STEEL BOX GIRDER
In order to examine the design and construction quality,obtain the complete structural condition and providetechnical references for conservation and maintenanceof RSB, the field load tests including the static and the dynamic test on the bridge were conducted on

Hao Wang, Aiqun Li, Ruomei Hu and Jian Li
Advances in Structural Engineering Vol. 13 No. 4 2010 733
box girder. The points located on top of the transverseclapboards were used to measure the bendingdeformation of the transverse clapboards.
5. COMPARISON BETWEEN THEEXPERIMENTAL AND NUMERICALRESULTS
5.1. Choosing the Mesh Size for the Submodel
Directly relative to the accuracy of results and thecomputation time, choosing the mesh size for thesubmodel is of great significance when conductingsubmodeling analysis. To choose a reasonable mesh sizefor the submodel of the steel box girder, three submodelswith different mesh size were established. They arenamed as Submodel 1, Submodel 2 and Submodel 3,respectively. The Submodel 2 with 42241 elements wasdescribed in Section 3.3. During the submodel meshing,the grid density of the Submodel 1 is set half of the
Figure 7. The vehicle loads in the field test of RSB
Table 1. Technical parameters of vehicle loads in the field test of RSB
Axle distance (mm) Wheel distance (mm) Weight (kN)
Mid and front axle Mid and rear axle Front wheel Rear wheel Front axle Mid and rear axle Whole weight3500 1350 1914 1847 60 240 300
Table 2. Vehicle load cases in the field test of Runyang Suspension Bridge
Load case Vehicle load locations
2The 1/2 span section of the steel box girder. (40–52)*. 52 vehicles were arrayed in 13 rows and 4 columns.The distance between two adjacent vehicles is 16.1m.
3The 1/4 span section of the steel box girder. (17–29)*. 52 vehicles were arrayed in 13 rows and 4 columns.The distance between two adjacent vehicles is 16.1m.
*The numbers in the brackets represent the corresponding number of the suspenders. The central buckle is No. 46 and the maximum number is 91.
Upstream
400 400 400 400150
Downstream
Figure 8. Transverse location of the vehicle loads (Unit: cm)
Main cableStrain gauge
Center line ofthe bridge
Strain rosetteCenter line of themain cable
UL9 UL7 UL5 UL3 UL1
UL10UL20UL21
UL23UL22DL6 DL5 DL4 DL3 DL2 DL1
UL8 UL6 UL4 UL2 UL12 UL11
M-1
M-2
UL13UL14UL15UL16UL17UL18UL19
Figure 9. Measured points of L/4 section of the steel box girder

Accurate Stress Analysis on Steel Box Girder of Long Span Suspension Bridges Based on Multi-Scale Submodeling Method
734 Advances in Structural Engineering Vol. 13 No. 4 2010
Submodel 2, and the grid density of Submodel 3 is settwice of Submodel 2. Consequently, Submodel 1 with24768 elements is coarser than Submodel 2, whileSubmodel 3 with 79953 elements has the highest griddensity among the three submodels. All of the threetypes of analysis results are compared with theexperimental results, and some of the comparisons are shown in Figure 10.
In Figure 10, the origin of the x-axis represents thecenter of 1/4 span section. Considering the distanceequivalency of every measured point, only two values at
the end of the section are shown in the x-axis. The y-axisrepresents the longitudinal bending stress of the girderdistributed along the transverse direction. As shown inFigure 10, in each part of the L/4 section of the steel boxgirder, the analytical stress values from Submodel 1 isdifferent to those from Submodel 2, but the differencebetween Submodels 2 and 3 is much smaller. For thebottom plate under load case 2, the largest difference is2.65%. For the top “U” girder and the top plate underload case 3, the largest differences are 3.70% and2.94%, respectively. Therefore, the mesh size of
−5
−10
−15000 15000
Distance to the section center (mm)
(a) The stress of the top plate under load case 3
Measurement
Submodel 2Submodel 3
Submodel 1Str
ess
(Mpa
) −15
−20
−25
−30
−35
−12
−14−14000 14000
Distance to the section center (mm)
(b) The stress of the top "U" girder under load case 3
Measurement
Submodel 2Submodel 3
Submodel 1
Str
ess
(Mpa
) −16
−20
−18
−22
−24
−26
−6−12000 12000
Distance to the section center (mm)
(c) The stress of the bottom plate under load case 2
Measurement
Submodel 2Submodel 3
Submodel 1
Str
ess
valu
e (M
pa)
−8
−10
−12
−14
Figure 10. The stress comparison of L/4 section of the steel box girder using different-scale submodels

Hao Wang, Aiqun Li, Ruomei Hu and Jian Li
Advances in Structural Engineering Vol. 13 No. 4 2010 735
Submodel 2 with 42241 elements is sufficient foryielding accurate analytical stress results of the steel boxgirder of the RSB, and further increasing of the meshsize will not result in great change in the analysisresults. It is necessary to point out that the run time ofSubmodel 2 is about four and a half hours, whileSubmodel 3 is about eleven hours, which deserves seriousconsideration in choosing the mesh size for the submodelof the steel box girder.
5.2. Transverse Stress Analysis
Figures 8 to 10 shows the numerical and experimentaltransverse distribution of bending stress of the top plate,
the top “U” girder and the bottom plate of the steel boxgirder, respectively. In Figures 11 to 13, the x-axis andy-axis have the same meaning in Figure 10.
5.2.1. Transverse stress analysis on the
top plate
Figure 11 shows the transverse distribution of bendingstress of the top plate of L/4 section of the steel boxgirder under the load case 2 and 3, respectively.
As can be seen from Figure 11, the numerical resultsfrom submodel analysis agree with the experimentalresults well, and the absolute stress values on the endand middle of the measured section are larger than
7
6
5
4
3Distance to the section center (mm)
Distance to the section center (mm)
(a) Load case 2
(b) Load case 3
Measurement
Calculation
Measurement
Calculation
15000
15000
−15000
−5
−10
−15
−20
−25
−30
−15000
Str
ess
valu
e (M
pa)
Str
ess
valu
e (M
pa)
Figure 11. Transverse distribution of bending stress of the top plate of L/4 section
6
5
4
3
2Distance to the section center (mm)
Distance to the section center (mm)
(a) Load case 2
(b) Load case 3
Measurement
Calculation
Measurement
Calculation
14000
14000
−14000
−16
−19
−22
−25
−14000
Str
ess
valu
e (M
pa)
Str
ess
valu
e (M
pa)
Figure 12. Transverse distribution of bending stress of the top “U” girder of L/4 section

Accurate Stress Analysis on Steel Box Girder of Long Span Suspension Bridges Based on Multi-Scale Submodeling Method
736 Advances in Structural Engineering Vol. 13 No. 4 2010
those on the quarter. Therefore, the transversedistribution of bending stress has an “M” shape underthe load case 2 and a “W” shape under the load case 3.The similar “M” or “W” shapes are also found underother load cases which are caused mainly by tworeasons. One is the shear lag effect which makes the topplate stress near the ventro-board greatly larger thanthat far from the ventro-board. The other is the effect ofthe transverse slope, which makes the neutral axisdistance of the top plate center larger than otherlocations. According to the assumption of planesection, the stress on the middle of the measuredsection is much larger. The effect of the local stresseffect caused by the vehicle loads is also phenomenal asshown in Figure 11.
5.2.2. Transverse stress analysis on the top
“U” girder
Figure 12 shows the transverse distribution of bendingstress of the top “U” girder under the load case 2 and 3,respectively.
Similarly, the numerical results from submodelanalysis and the experimental results greatly consistwith each other as shown in Figure 12. The shear lag andthe transverse slope effects are again reflected in thetransverse distribution of bending stress of the top “U”girder by the “M” and “W” shapes.
The local stress effect caused by the vehicle loads isnoticeable for the same reason. The stress distribution ofthe top plate differs from that of the top “U” girder. Thereason is that the vehicle loads act directly on the former
one while indirectly on the latter one because of thetransfer of the top plate. Consequently, the stressdistribution of the top “U” girder has some obvioussharp angle near the quarter section.
5.2.3. Transverse stress analysis on the
bottom plate
Figure 13 shows the transverse distribution of bendingstress of the bottom plate of the steel box girder underthe load case 2 and 3, respectively.
As can be seen from Figure 13, most numerical andexperimental results match well; however, a fewcomputed values do not match the experimental results.One possible cause for this difference is themanufacturing defects in the steel box girder. Thisdiscrepancy could also be potentially introducedduring bridge construction. Another cause could bemeasurement error during the field test. Because boththe vehicle loads and the bridge are symmetric, thestress distribution of the steel box girder should also besymmetric while this is not the case in the measurementresults, as shown in Figure 13.
The transverse distribution of bending stress showsthat the effect of the shear lag on the bottom plate alsoexists. Since the bottom plate is flat and it does notdirectly bear the vehicle loads, the transversedistribution of bending stress of the bottom plate isrelatively smoother and the absolute stress values onthe middle of the measured section are not larger thanthose on the other sections. The distribution of thebottom plate differs from that of the top plate.
−10−12000
−12000
−11
Str
ess
valu
e (M
pa)
Str
ess
valu
e (M
pa)
−12
−35
−37
−39
−41
Distance to the section center (mm)
Distance to the section center (mm)
Measurement
Calculation
Measurement
Calculation
(a) Load case 2
(b) Load case 3
12000
12000
Figure 13. Transvrse stress distribution of the bottom plate of L/4 section

Hao Wang, Aiqun Li, Ruomei Hu and Jian Li
Advances in Structural Engineering Vol. 13 No. 4 2010 737
Figure 13 also shows that when the vehicle loads acton the measured section directly, the stress level of thebottom plate is much larger than that of the other locationsof the steel box girder, and the minimum of theexperimental values reaches 35.9 MPa (correspondingto the DR4 measured point). Therefore, special attentionshould be paid to the high stress level of the bottomplate under the vehicle loads.
5.3. Longitudinal Stress Analysis
As introduced in Section 2, the submodeling method isbased on St. Venant’s principle, so the submodel of the steel box girder selected for stress analysis should haveenough length in the longitudinal direction to achievereasonable accurate results. In order to explain whathappens to the bridge deck in the sub-model, thecomposite action between the full model and thesubmodel, and whether the length of the submodel of the steel box girder is enough or not, Figures 14 to 16shows the numerical longitudinal distribution of bendingstress of the top plate, the top “U” girder and the bottomplate of the steel box girder, respectively. In Figures 14 to 16, the origin of the x-axis represents the location ofthe 1/4 span section of the bridge, and D represents thedistance to the 1/4 span section. According to Figure 8, the
distances of 4.75 m and 8.75 m are selected for plottingbecause the vehicle loads directly act on the top “U” girderand the top plate at these locations. The bottom plate is notmeshed at the exact distances of 4.75 m and 8.75 m, sothey are substituted by 4.85 m and 8.65 m, respectively.Because of the distance equivalency of every node in thesubmodel, only two values at the end of the sectionare shown in the x-axis. The y-axis represents the bendingstress of the girder distributed along the longitudinaldirection.
As shown in Figures 14 to 16: (1) The stresses nearthe two boundaries of the submodel are greatlyinfluenced by the exerted displacements from the fullmodel, and the influence length is about 3.0 m in each ofthe two boundaries, which proves that the submodel withthe length of 32.2 m is enough to get the accurate stressresults at the 1/4 span section. It must be pointed out thatthe vehicle loads applied near the boundary are anotherreason that causes the stress disturbing of the twoboundaries. (2) The vehicle loads of the field test includethe front axle loads and the rear axle loads. The weightof the rear axle loads is 4 times that of the front axleloads, so the influence length of the rear axle loads islarger. As can be clearly seen from Figures 14 to 16,there is a vehicle load exactly on the 1/4 span section of
−5
−10
−16100
−15
−20
−25
−30
0
Zhenjiang Yangzhou
D = 4.75 mmD = 8.75 mm
16100
Distance to the 1/4 span section (mm)
Str
ess
valu
e (M
pa)
Figure 14. Longitudinal distribution of bending stress of the top plate under load case 3
−5
−10
−16100
−15
−20
−25
−30
0
Zhenjiang Yangzhou
D = 4.75 mmD = 8.75 mm
16100
Distance to the 1/4 span section (mm)
Str
ess
valu
e (M
pa)
Figure 15. Longitudinal distribution of bending stress of the top “U” girder under load case 3

Accurate Stress Analysis on Steel Box Girder of Long Span Suspension Bridges Based on Multi-Scale Submodeling Method
738 Advances in Structural Engineering Vol. 13 No. 4 2010
the bridge with the rear axle loads on the Zhenjiang sideand the front axle loads on the Yangzhou side, while thelongitudinal distribution of bending stress of the bottomplate is relatively smooth because the bottom plate is flatand it does not directly bear the vehicle loads. Accordingto the longitudinal distribution of bending stress above,the influence lengths of the front axle loads and the rearaxle loads are about 2 m and 4 m, respectively. (3) Bothon the top plate and on the bottom plate, the longitudinaldistributions of bending stress of different distancesare very similar, while the longitudinal distributiontrends of top “U” girder have some dissimilarities whenthe distances change. In addition, the longitudinaldistribution of bending stress of the bottom plate isrelatively smooth, as proved before.
5.4. Summary of the Stress Distribution on the
L/4 Section
As can be seen from the transverse distribution ofbending stress of the steel box girder in Figrues 11 to 13,most of the numerical results agree with theexperimental ones. Under two unfavorable load cases oftwo and three, the stress level is relatively low and muchless than the ultimate strength of the structural material.Because the stress level of the transverse clapboardunder the above mentioned two load cases is relativelylow (only 1/10 ~ 1/15 that of the bottom plate), it is notspecifically analyzed.
Since the steel box girder is a welded structure, one ofits major failure modes is structural fatigue caused mainlyby tremendous tension-compression cycling. Althoughthe stress level of the bottom plate is larger than that of the other parts, stress alternating exists in the top plateand the top “U” girder of the L/4 section of the steel boxgirder, as can be seen from Figures 11 and 12. Comparedwith that of the top plate, the stress alternating of the top“U” girder is more phenomenal, and the minimum of itsamplitude is already 20.1 MPa (corresponding to themeasured point UL17). The cause of that is the combined
action of vehicle loads on various locations and the elasticrestriction of the transverse clapboard. As a consequence,special attention should be given to the top “U” girder inthe study of fatigue failure of the steel box girder of RSB.
It is found from Figurs 14 to 16 that the stresses nearthe two submodel boundaries are greatly disturbed andthe influence length is about 3.0 m in each boundary,and the influence lengths of the front axle and the rearaxle of the vehicle loads in longitudinal direction areabout 4 m and 2 m, respectively. The above results canprovide theoretical reference for choosing the length ofthe submodel when carrying out accurate stress analysison the steel box girder of long span suspension bridges.
6. CONCLUSIONS(1) Single-scale FE model fails to satisfy the
requirements of different analysis on the steelbox girders of long-span suspension bridges. It isnecessary to perform multi-scale FE modelingtechniques. As long as the length and the griddensity of the submodel are properly selectedwith adequate level, the submodeling method hashigh efficiency and accuracy on steel box girderstress analysis, which has been validated by theexperimental results from the field test. As aresult, the submodeling method can be broadlyperformed in similar analysis of long span cable-supported bridges.
(2) Choosing proper mesh size for the submodel ofthe steel box girder is one of the most importantissues when carrying out a submodelinganalysis. Comparison using submodels withdifferent mesh size should be conducted firstlyto obtain an accurate and efficient submodel. As for the steel box girder of RSB, 42241elements are sufficient for conducting accuratestress analysis on the steel box girder with 32.2 m length, while maintaining a reasonablecomputational cost.
−30
−25−16100
−35
−40
−45
−50
Zhenjiang Yangzhou
D = 4.85 mmD = 8.65 mm
16100
Distance to the 1/4 span section (mm)
Str
ess
valu
e (M
pa)
Figure 16. Longitudinal distribution of bending stress of the bottom plate under load case 3

Hao Wang, Aiqun Li, Ruomei Hu and Jian Li
Advances in Structural Engineering Vol. 13 No. 4 2010 739
(3) Another key issue during the submodelinganalysis on the steel box girder is to determinethe length of the submodel. Results show thatthe composite action phenomenon near the twoboundaries of the submodel is very clear, andthe influence length is about 3.0 m in each of thetwo boundaries. Therefore, the stress locatesmore than 3 meters to the submodel boundarycan be utilized, and the submodel of the steelbox girder with the length of 32.2 m is enoughto get accurate stress results.
(4) The shear lag and transverse slope greatly affectthe transverse distribution of bending stress of the steel box girder of long span suspensionbridges, which make the distribution of the topplate and the top “U” girder in “M” and “W”shapes. On the other hand, the transversedistribution of bending stress of the bottom plateis relatively smoother, for it is flat and does notdirectly bears the vehicle loads.
(5) The stress level of all parts of the steel boxgirder under all kinds of unfavorable load casesis relatively low and it is much less than theultimate strength of the structural material,which proves that the safety coefficient of theRSB under vehicle loads is adequate. Comparedwith the other parts, the stress in the bottomplate is the largest one under the vehicle loads.
(6) Results show that special attention should begiven to the stress alternating existing in boththe top plate and the top “U” girder, and thestress alternating in the latter one is morephenomenal than that in the former one. As aresult, the top “U” girder should be the focusduring the study on the structural healthmonitoring and the fatigue failure of the steelbox girder of long span suspension bridges.
ACKNOWLEDGEMENTSThe work described in this paper is supported by grantsfrom the Key Project of the National Science Foundationof China (NSFC) (Grant No. 50538020), the OutstandingYouth Fund of NSFC (Grant No. 50725828), the NSFCfor Young Scholars (No. 50908046) and the Ph.D. Programs Foundation of Ministry of Education ofChina (Grant No. 200802861012)
At the same time, the authors would like to expresstheir sincere gratitude to their colleagues in StructuralHealth Monitoring Institute and the Structural TestCenter of Southeast University for their great support tothe contribution.
REFERENCESBogdanovich, A.E. and Kizhakkethara, I. (1999). “Three-dimensional
finite element analysis of double-lap composite adhesive bonded
joint using submodeling approach”, Composites: Part B, Vol. 30,
No. 6, pp. 537–551.
Chan, T.H.T., Guo, L. and Li, Z.X. (2003). “Finite element
modeling for fatigue stress analysis of large suspension
bridges”, Journal of Sound and Vibration, Vol. 261, No. 3,
pp. 443–464.
Che, Y. and Song, Y.P. (2003). “Three-dimensional nonlinear
analysis of orifice of high arch dam”, Journal of Dalian University
of Technology, Vol. 43, No. 2, pp. 218–222. (in Chinese)
Cormier, N.G., Smallwood, B.S., Sinclair, G.B. and Meda G. (1999).
“Aggressive submodelling of stress concentrations”, International
Journal for Numerical Methods in Engineering, Vol. 46, No. 6,
pp. 889–909.
De Langhe, K., Vandepitte, D. and Sas, P. (1997). “A combined
dynamic-static finite element model for the calculation of
dynamic stresses at critical locations”, Computer and Structures,
Vol. 65, No. 2, pp. 241–254.
Ernst, J.H. (1965). “Der E-modul von seilen unter berücksichtigung
des durchhanges”, Der Bauingenieur, Vol. 40, No. 2, pp. 52–55.
(in Germany)
Hsu, Y.T. and Fu, C.C. (2002). “Application of EBEF method for the
distortional analysis of steel box girder bridge superstructures
during construction”, Advances in Structural Engineering, Vol. 5,
No. 4, pp. 211–221.
Jaishi, B. and Ren, W.X. (2005). “Structural finite element model
updating using ambient vibration test results”, Journal of
Structural Engineering, ASCE, Vol. 131, No. 4, pp. 617–628.
Li, A.Q. (2005). Report on Field Test of Runyang Yangtse River
Bridge, Technical Report, College of Civil Engineering, Southest
University, Nanjing, China. (in Chinese)
Li, A.Q. and Wang, H. (2006). Report on Finite Element Analysis
of Runyang Yangtse River Bridge, Technical Report, College
of Civil Engineering, Southest University, Nanjing, China.
(in Chinese)
Li, A.Q. and Wang, H. (2007). “Stress analysis on steel box girders
of super-long-span suspension bridges with submodel method”,
Engineering Mechanics, Vol. 24, No. 2, pp. 80–84.
Mottershead, J.E. and Friswell, M.I. (1993). “Model updating in
structural dynamics: A survey”, Journal of Sound and Vibration,
Vol. 167, No. 2, pp. 347–375.
Ou, J.P. (2003). “Some recent advances of intelligent health
monitoring systems for civil infrastructures in Mainland China”,
Proceedings of the 1st International Conference on Structural
Health Monitoring and Intelligent Infrastructure, Tokyo, Japan,
pp. 131–144.
Rabinovich, V.L. and Sarin, V.K. (1996). “Modelling of interfacial
fracture”, Materials Science and Engineering: A, Vol. 209, No. 1,
pp. 82–90.

Accurate Stress Analysis on Steel Box Girder of Long Span Suspension Bridges Based on Multi-Scale Submodeling Method
740 Advances in Structural Engineering Vol. 13 No. 4 2010
Sennah, K.M. and Kennedy, J.B. (2002). “Literature review in
analysis of box-girder bridges”, Journal of Bridge Engineering,
ASCE, Vol. 7, No. 2, pp. 134–143.
Sinclair, G.B., Beisheim, J.R., Epps, B.P. and Pollice, S.L. (2000).
“Towards improved submodeling of stress concentrations”,
Proceedings of the 9th International ANSYS Conference, Pittsburgh,
Pennsylvania, USA.
Swanson Analysis Systems Inc (SASI) (2004). ANSYS User’s
Manual, Version 8.0, Houston, Pennsylvania, USA.
Wang, H., Li, A.Q. and Miao, C.Q. (2005). “FE model updating
and validating of Runyang Suspension Bridge based on
SHMS”, Journal of Southeast University (English Edition),
Vol. 21, No. 4, pp. 474–479.
Wang, X., Mieth, U. and Cappelletti, A.M. (2004). “Numerical
methods for design of bonded joints for ship structures”,
Proceedings of the Institution of Mechanical Engineers, Part M:
Journal of Engineering for the Maritime Environment, Vol. 218,
No. 4, pp. 247–258.
Xu, W., Li, Z. and Zhang, X.N. (2004). “Application of submodeling
method for analysis of deck structure of diagonal cable-stayed
bridge with long span”, China Civil Engineering Journal,
Vol. 37, No. 6, pp. 30–34. (in Chinese)
Zhang, Q.W. and Sun, L.M. (2002). “FE model updating of
suspension bridge based on vibration measurements”, Proceedings
of the 7th International Symposium on Structural Engineering for
Young Experts, Beijing, China, pp. 793–800.

Copyright of Advances in Structural Engineering is the property of Multi-Science Publishing Co Ltd and its
content may not be copied or emailed to multiple sites or posted to a listserv without the copyright holder's
express written permission. However, users may print, download, or email articles for individual use.