accucore - thermo fisher...
TRANSCRIPT

Accucore Ultimate Core Performance LC Column Technology to Maximize Your Investment
Dave Jarzinski Thermo Fisher Scientific Account Manager – Greater Boston/Cambridge & North Phone: 978-408-1576 Email: [email protected]
October 2011

2
Fast Chromatography - Understanding the Drivers
• Analytical Scientist want
FAST CHROMATOGRAPHY
Speed 62%
Resolution 23%
Sensitivity 7%
Other 8%
3
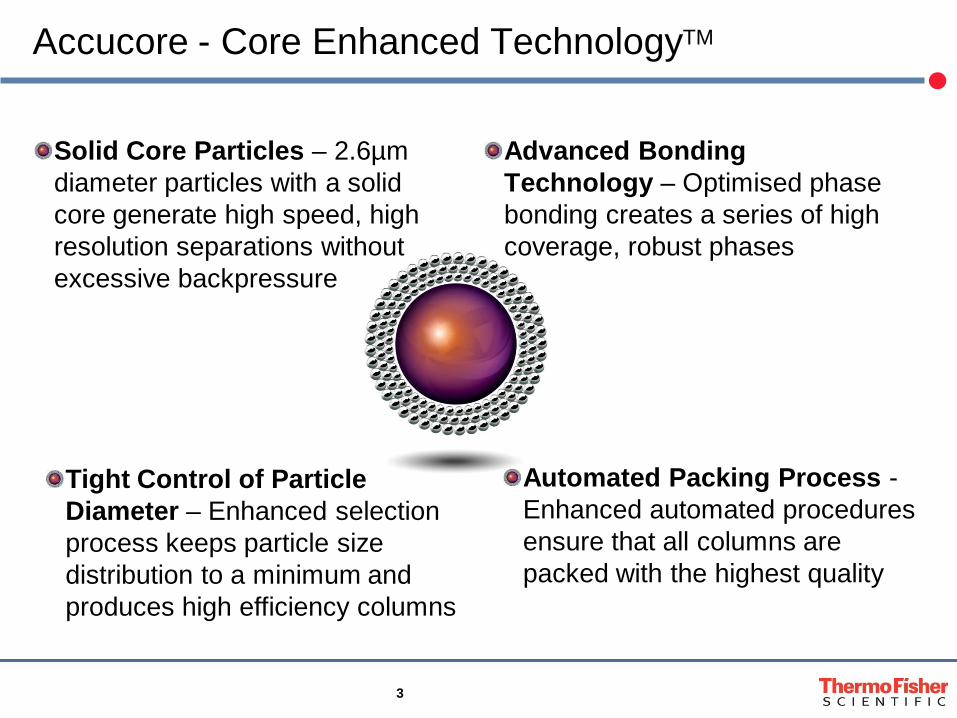
Accucore - Core Enhanced TechnologyTM
Solid Core Particles – 2.6µm diameter particles with a solid core generate high speed, high resolution separations without excessive backpressure
Advanced Bonding Technology – Optimised phase bonding creates a series of high coverage, robust phases
Tight Control of Particle Diameter – Enhanced selection process keeps particle size distribution to a minimum and produces high efficiency columns
Automated Packing Process - Enhanced automated procedures ensure that all columns are packed with the highest quality
4
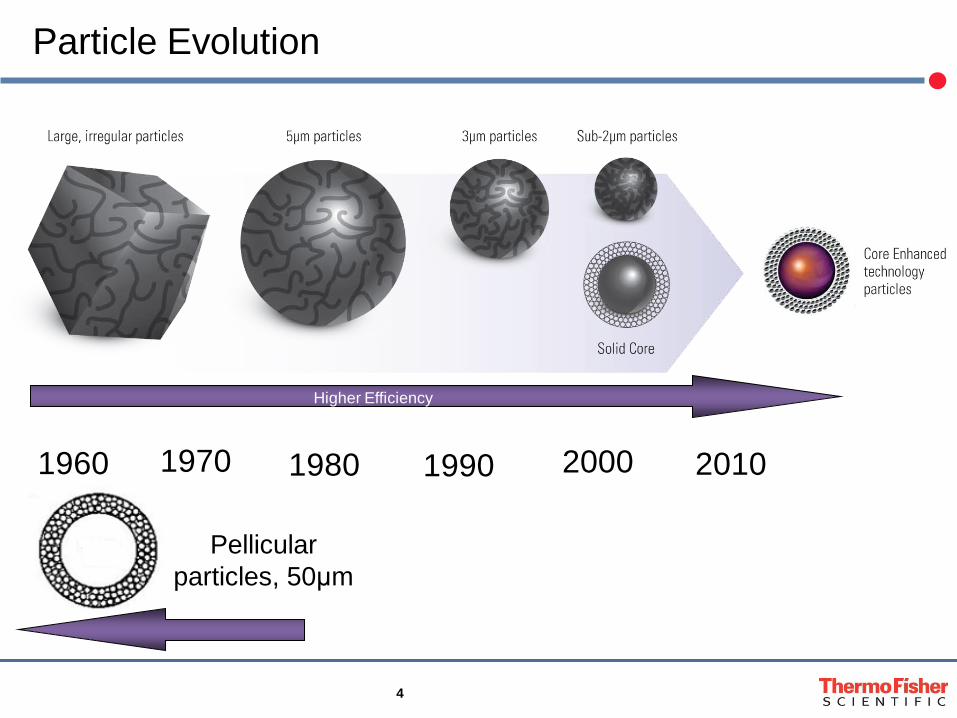
Particle Evolution
Pellicular particles, 50μm
1970 2000 1990 1980 2010 1960
Higher Efficiency

5
Resolution Equation
+
−
=
'1'1
41 5.0
kkNRs α
α
Efficiency Particle size / packing
Selectivity (Chemistry)
Retention Factor
(Surface area)

6
The Theory … Van Deemter Equation
uCuCuBAHETP sm +++=
Eddy Diffusion
Longitudinal Diffusion

7
A Term - Eddy Diffusion or Multiple Paths
• The A term depends on; • Quality of the packing (better packing smaller A term) • Particle size (smaller the particle the smaller is the A term)

8
Core Enhanced Technology – Eddy Diffusion
Fully Porous Particles D90/10 ~ 1.5
Core Enhanced Technology D90/10 ~ 1.1

9
C Term - Resistance to Mass Transfer (s)
Fully Porous Particle Core Enhanced Technology Particle
• The C term depends on: • Differences in diffusion
path in the silica pores

10
Core Enhanced Technology – Packed Bed
Core Enhanced Technology
Porous Silica

11
0.0
5.0
10.0
15.0
20.0
0.0 1.0 2.0 3.0 4.0 5.0 6.0 7.0 8.0 9.0 10.0 Hei
ght E
quiv
alen
t The
oret
ical
Pl
ate
Linear velocity of mobile phase (mm/s) Accucore 2.6µm 5µm 3µm <2µm
Core Enhanced Technology - Efficiency
Highest efficiency and lowest rate of efficiency loss with flow rate with Core Enhanced Technology

12
Core Enhanced Technology – Low Pressure
0
100
200
300
400
500
600
700
800
900
1000
0 200 400 600 800 1000
Pres
sure
(bar
)
Flow rate (µL/min)
Accucore RP-MS 2.6µm <2µm 3µm 5µm
Columns: 100 x 2.1 mm Mobile phase: H2O / ACN (1:1) Temperature: 30 °C
600 bar limit
HPLC pressure limit
Pressures below 600 bar over optimum flow rate range with Core Enhanced Technology

13
Kinetic Plots
• Allows for fairer comparisons of analytical systems • Van Deemter just compares pure separation ability
• Incorporates time of analysis
• Analysts want FASTER chromatography • Van Deemter plots do not specify the time of analysis
• Incorporates pressure limitations of systems
• Van Deemter does not account for a pressure limitation on system

14
0.0003
0.0030
0.0300
1,000.00 10,000.00 100,000.00 1,000,000.00
Accucore RP-MS 2.6um 5um 3um <2um N (/)
Nopt
t0/N (s)
Nopt Tim
e re
quire
d to
obt
ain
a se
t effi
cien
cy
Kinetic Plot – Efficiency & Speed
Efficiency increasing
Highest plate generation rate with Core Enhanced Technology

15
Impedance
• Devised by Knox and Bristow in 1977 • Defines the resistance a compound has to moving
down a column relative to the performance of that column
• Allows for pressure to be incorporated
• Often plotted with a reverse axis • Mimics van Deemter plot • Minimum value optimum conditions
• Often plotted as a dimensional form
• t/N2
• t0 or tr both used
η2N
PtE ∆=

16
Core Enhanced Technology – Low Impedance
Lowest impedance (best combination speed, efficiency and low pressure) of with Core Enhanced Technology
1,000
10,000
100,000
0.10 1.00 10.00
Accucore RP-MS 2.6µm 5µm 3µm <2µm
Impe
danc
e
Linear velocity of mobile phase (mm/s)

17
Core Enhanced Technology – Features & Benefits
• Features • More uniform particle sizing • Better packing of particles • Reduced pore depth • Reduced mass transfer effects in mobile phase
• Benefits
• More Efficient Chromatography • Allows the use of low pressure systems
• Competitive Edge
• Bar for bar gives better separations than porous materials
18
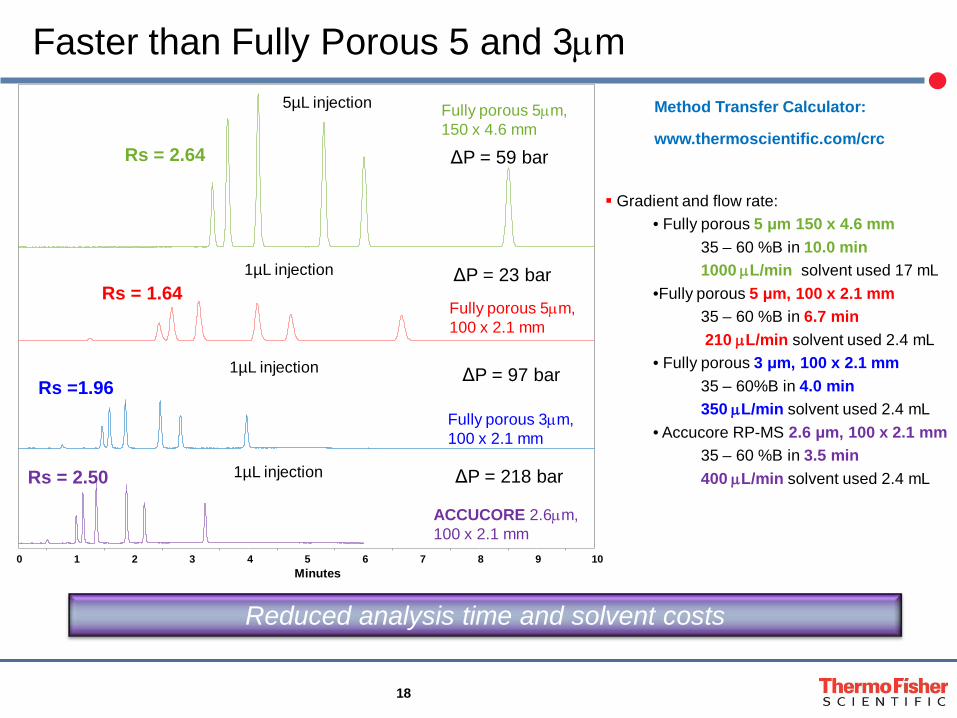
Faster than Fully Porous 5 and 3µm
Gradient and flow rate: • Fully porous 5 μm 150 x 4.6 mm
35 – 60 %B in 10.0 min 1000 µL/min solvent used 17 mL
•Fully porous 5 μm, 100 x 2.1 mm 35 – 60 %B in 6.7 min 210 µL/min solvent used 2.4 mL
• Fully porous 3 μm, 100 x 2.1 mm 35 – 60%B in 4.0 min 350 µL/min solvent used 2.4 mL
• Accucore RP-MS 2.6 μm, 100 x 2.1 mm 35 – 60 %B in 3.5 min 400 µL/min solvent used 2.4 mL
Method Transfer Calculator: www.thermoscientific.com/crc
Minutes 0 1 2 3 4 5 6 7 8 9 10
-100
Fully porous 3µm, 100 x 2.1 mm
Fully porous 5µm, 100 x 2.1 mm
ACCUCORE 2.6µm, 100 x 2.1 mm
Fully porous 5µm, 150 x 4.6 mm
Rs = 2.64
Rs = 1.64
Rs =1.96
Rs = 2.50
5µL injection
1µL injection
1µL injection
1µL injection
ΔP = 59 bar
ΔP = 23 bar
ΔP = 218 bar
ΔP = 97 bar
Reduced analysis time and solvent costs
19
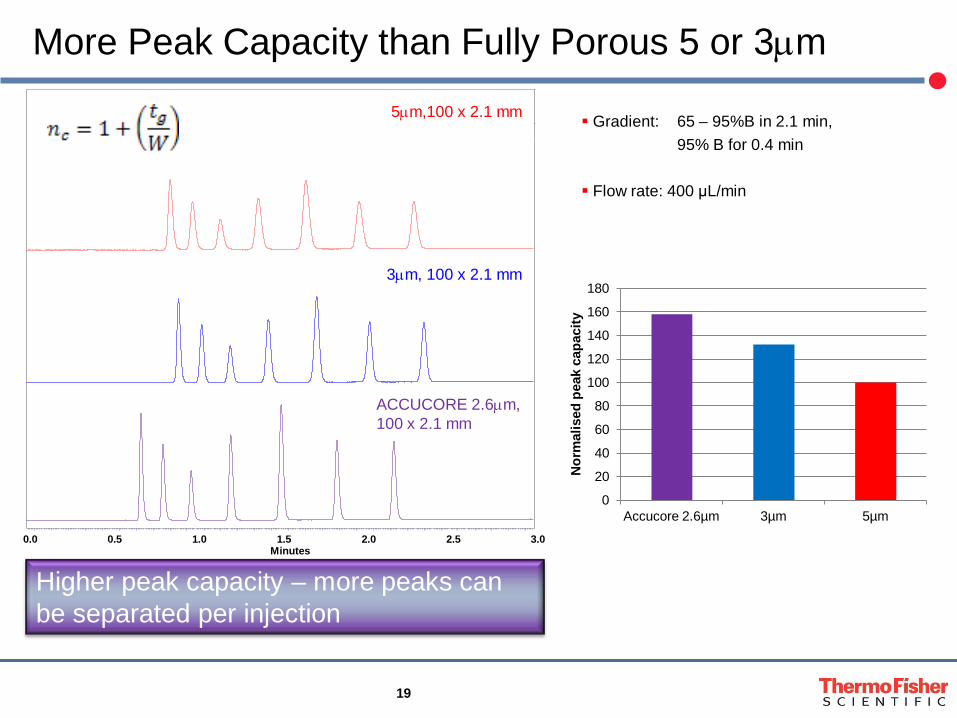
More Peak Capacity than Fully Porous 5 or 3µm
Minutes 0.0 0.5 1.0 1.5 2.0 2.5 3.0
220
240
3µm, 100 x 2.1 mm
ACCUCORE 2.6µm, 100 x 2.1 mm
5µm,100 x 2.1 mm Gradient: 65 – 95%B in 2.1 min, 95% B for 0.4 min Flow rate: 400 μL/min
0
20
40
60
80
100
120
140
160
180
Accucore 2.6µm 3µm 5µm
Nor
mal
ised
pea
k ca
paci
ty
Higher peak capacity – more peaks can be separated per injection
20
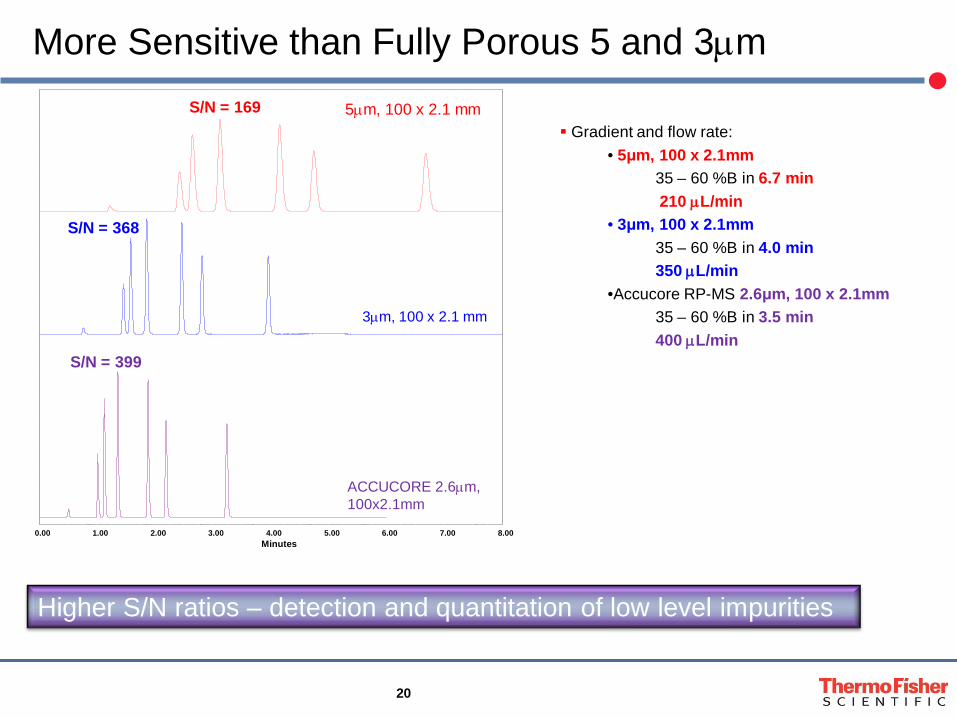
More Sensitive than Fully Porous 5 and 3µm Gradient and flow rate:
• 5μm, 100 x 2.1mm 35 – 60 %B in 6.7 min 210 µL/min
• 3μm, 100 x 2.1mm 35 – 60 %B in 4.0 min 350 µL/min
•Accucore RP-MS 2.6μm, 100 x 2.1mm 35 – 60 %B in 3.5 min 400 µL/min
Minutes 0.00 1.00 2.00 3.00 4.00 5.00 6.00 7.00 8.00
mAU
S/N = 169
S/N = 368
S/N = 399
3µm, 100 x 2.1 mm
ACCUCORE 2.6µm, 100x2.1mm
5µm, 100 x 2.1 mm
Higher S/N ratios – detection and quantitation of low level impurities

21
Lower Backpressure than Fully Porous sub-2µm
• Flow rate: 500 μL/min • Mobile phase: A - Water; B – Acetonitrile
Minutes 0.0 0.5 1.0 1.5 2.0 2.5
Sub 2µm, 100 x 2.1 mm
Accucore RP-MS 2.6µm, 100 x 2.1 mm
Accucore RP-MS 2.6 µm, 100 x 2.1 mm
Sub 2 µm, 100x2.1mm
Maximum pressure (bar)
171 338
Equivalent performance, lower pressure (50% lower)

22
UHPLC Systems Not Required • Column: Accucore RP-MS 2.6µm, 100 x 2.1 mm
• Gradient: 65 – 95 % B in 2.1 min
95 % B for 0.4 min
• Flow rate: 400 µL/min
Accela 1250
Surveyor
min 0 0.5 1 1.5 2 2.5 3 3.5
Minutes 0.00 1.00 2.00 3.00 4.00
Agilent 1100
Accela 1250
Surveyor Agilent 1100
Run time (min)
2.5 3.0 3.5
Average PW (1/2 Height)
0.02 0.02 0.04
Dwell volume: 100 µL
Dwell volume: 800 µL
Dwell volume: 1000 µL
Accucore can deliver performance on a number of different systems

23
Equivalent Loading Capacity to Fully Porous sub-2µm
Columns:
• Accucore RP-MS 2.6µm,100 x 2.1mm
• <2µm,100 x 2.1mm
0
0.2
0.4
0.6
0.8
1
1.2
Nor
mal
ised
Val
ue
Load on Column (µg)
Effect of Loading - Accucore
As
N
Tr
As
N Tr
R² = 0.9998
R² = 0.9993
R² = 0.9721
0
500,000
1,000,000
1,500,000
2,000,000
2,500,000
0 0.5 1 1.5 2 2.5
Peak
are
a
Load on column (µg) <2µm Accucore 2.6μm Competitor
No loss in performance with 2µg loaded on a 2.1mm ID Accucore column
Accucore Evaluation for Metabolite Profiles
Courtesy of: Anila Desai - Scientist

25
ESI+ LC-MS Profile of a Drug / Hypersil Gold, 50 x 2.1, 1.9 micron
TIC (RT 5.22)
M1 – Oxidation (RT 4.55)
M2 – Hydrolysis of X (RT 4.36)
M3 – Glucuronidation (RT 4.61)
M4 – O+Glucuronidation (RT 4.52)
M5 – O+SO3H (RT 4.39)
ESI+ LC-MS Profile of a Drug / Hypersil Gold, 50 x 2.1, 1.9 micron ESI+ LC-MS Profile of a Drug
Hypersil Gold, 50 x 2.1, 1.9 micron RT: 0.06 - 6.97
1 2 3 4 5 6Time (min)
0
50
1000
50
1000
50
1000
50
100
Relat
ive A
bund
ance
0
50
1000
50
1005.22
2.582.402.15 2.95 3.401.77 4.13 4.884.58 6.936.075.541.030.255.322.40 4.55
2.58 2.92
4.663.506.244.13 4.882.29 6.613.32 5.542.131.420.880.64
4.36
3.033.81 5.254.773.322.92 6.582.451.51 5.932.101.030.44
4.61
4.133.892.58 3.74 5.735.222.66 5.902.45 6.440.595.40
4.52
2.92 3.715.22
3.58 3.922.61 4.952.53 6.022.01 6.906.411.770.44 0.644.39
2.212.77
3.683.423.76 6.613.292.55 5.274.63 5.40 5.991.791.57

26
ESI+ LC-MS Profile of a Drug Accucore – RP-MS, 50 x 2.1, 2.6 micron
TIC (RT 4.64)
M1 – Oxidation (RT 4.02)
M2 – Hydrolysis of X (RT 3.69)
M3 – Glucuronidation (RT 4.15)
M4 – O+Glucuronidation (RT 4.18)
Decrease in retention time while keeping same resolution
M5 – O+SO3H (RT 4.05)
RT: 0.02 - 7.33
1 2 3 4 5 6 7Time (min)
0
50
1000
50
1000
50
1000
50
100
Relat
ive A
bund
ance
0
50
1000
50
1004.64
2.272.08 2.63 2.93 3.56 7.074.414.13 4.97 6.931.59 5.880.10 0.494.97
4.022.27
4.132.63 3.562.08 5.862.98 7.026.931.87 5.484.411.370.790.25
3.69
2.707.18
6.773.13 4.232.19 6.655.13 5.534.821.891.510.98 5.970.054.15
6.774.33 4.713.97 5.212.16 3.64 6.633.082.29 5.291.89 5.94 7.120.830.25
4.954.18
2.70 3.23 4.313.95 5.08 5.48 6.795.832.452.061.471.234.05
2.47
1.65 3.842.86 3.59 4.67 7.072.27 5.944.71 6.085.510.10 0.88

27
ESI+ LC-MS Profile of a Drug Accucore – C18, 50 x 2.1, 2.6 micron
TIC (RT 4.44)
M1 – Oxidation (RT 3.84)
M2 – Hydrolysis of X (RT 3.48)
M3 – Glucuronidation (RT 4.02)
M4 – O+Glucuronidation (RT 4.05)
Decrease in retention time while keeping same resolution
M5 – O+SO3H (RT 3.95)
RT: 0.04 - 6.93
1 2 3 4 5 6Time (min)
0
50
1000
50
1000
50
1000
50
100
Relat
ive A
bund
ance
0
50
1000
50
1004.44
2.472.212.00 2.68 3.06 4.28 4.661.59 3.82 4.82 6.335.38 5.970.05 0.494.82
3.84
2.213.95
2.55 5.702.912.00 4.053.41 6.876.081.70 5.111.370.34 0.833.48
2.686.76
6.646.314.46 5.921.781.59 2.47 3.11 5.434.410.05 0.69
4.02
6.763.61 5.144.53 6.622.11 3.132.42 5.431.97 5.76
4.844.05
3.16
2.68 4.483.23 3.892.47 5.002.26 6.766.005.54 6.421.810.44 0.793.95
2.42
4.442.21 3.06 3.331.54 5.97 6.284.53 5.894.950.980.15

28
Retention Time Comparison – Metabolite Profiles
3
3.5
4
4.5
5
5.5
HypersilGOLD 50x2.1; 1.9um Accucore RP-MS 50x2.1; 2.6um Accucore C18 50x2.1; 2.6um
Ret
entio
n Ti
me

29
Long Column Lifetime
• Stability at extremes of pH
• Stability at elevated temperature
• Packed bed ruggedness

30
Reproducible Chromatography - Batch-to-Batch
Accucore C18 Test 1 - Hydrophobic Interactions HS SS HBC
EV419 1.76 1.41 0.18 EV422 1.77 1.41 0.19 EV435 1.75 1.40 0.18 EV442 1.77 1.40 0.18 EV436 1.77 1.41 0.19 EV446 1.76 1.40 0.18
Average 1.76 1.41 0.18 %RSD 0.32 0.36 2.98
Fully characterised primary and secondary interactions

31
Reproducible Chromatography – Run-to-Run
~2,400 injections on Accucore column with TLX system – no change in retention
3.5000
3.6000
3.7000
3.8000
3.9000
4.0000
4.1000
4.2000
4.3000
4.4000
0 500 1000 1500 2000 2500
Minutes
Injection
Rosuvastatin Retention

32
Accucore Column Stability – Low pH
0
5
10
15
20
25
30
35
40
0 5000 10000 15000 20000 25000 30000 35000
Ret
entio
n Fa
ctor
Column Volumes
Column Stability at pH < 2
Acetaminophen p-HBA o-HBA Amitriptyline Nortriptyline DIPP DNPP
Accucore columns are stable at low pH
pH ≅ 1.8 (0.1% TFA)
30,000 column volumes (5.5 days)

33
Accucore Column Stability – High pH
pH ≅ 10.5 (0.1% ammonia)
30,000 column volumes (5.5 days) R
eten
tion
Fact
or
Accucore columns are stable at high pH

34
Accucore Column Stability – Elevated Temperature
0
1
2
3
4
5
6
7
8
9
0 2000 4000 6000 8000 10000
Ret
entio
n Fa
ctor
Column Volumes
Column Stability at 70°C
Phenol
Butylbenzene
o-Terphenyl
Pentylbenzene
Mobile phase: MeOH/H2O (65:35) Flow rate: 0.4 mL/min
Column temperature: 70 °C Run time: 5 min
9,000 column volumes
(400 injections)
Accucore columns are stable at high temperature

35
Accucore Column Stability – Ruggedness
Efficiency (o-Xylene)
Asymmetry (o-Xylene)
Accucore RP-MS 2.6µm 100x 2.1mm ID Mobile Phase: 60/40 ACN/H2O Flow Rate: 400 µL/min Injection Volume: 1 µL Column Temp: 30°C
Accucore RP-MS 2.6µm 100x 2.1mm ID Mobile Phase A: Water (0.05% TFA) Mobile Phase B: Acetonitrile (0.05% TFA) Wash: H2O (0.05% TFA) Injection Volume: 1 µL Column Temperature: 30°C
4,000 + isocratic test injections with no decrease in performance
6,000 + fast gradient injections with no change in retention

36
Accucore HPLC Columns Proof of Concept
Ultimate Core Performance Maximize Your Investment
Fast Separations Increase sample throughput and decrease solvent costs
High Peak Capacity Separate and identify more peaks
Increased Sensitivity Detect trace amounts
Lower Pressure Use existing HPLC instruments or prolong the life of UHPLC instruments
Loading Capacity Analyze a wide range of concentrations
Wide Selectivity Use the right column for your analysis
Reproducible Chromatography Have confidence in your separations
Long Lifetime Use columns for longer

37
• Ultimate Core Performance to Maximize Your Investment
• Rugged and reproducible solid core particles • Fast separations with superb resolution • Low backpressures
Theory & Practice Conclusion
Core Enhanced Technology


39
Outline
• Isocratic and gradient evaluation on C18
• Multiple analyte evaluation on aQ
• Temperature effect on aQ separations
• Selectivity comparison between columns

40
TIC of +MRM (3 pairs): from Sample 1 (isocratic_accucore_01) of AccuCore eval FINAL.wiff (Turbo Spray) Max. 7.3e5 cps.
0.00 0.05 0.10 0.15 0.20 0.25 0.30 0.35 0.40 0.45 0.50 0.55 0.60 0.65 0.70 0.75 0.80 0.85 Time, min
0.0
5.0e4
1.0e5
1.5e5
2.0e5
2.5e5
3.0e5
3.5e5
4.0e5
4.5e5
5.0e5
5.5e5
6.0e5
6.5e5
7.0e5
7.3e5
Intensity, cps
0.66
0.54
0.48
Accucore C18, 2.1mm*50mm A: 20mM ammonium formate +0.1% formic acid B: Acetonitrile +0.1% formic acid
Mebendazole
Dibucaine Protryptyline
45 seconds
0.65ml/min 1µL injection Shimadzu HPLC MS/MS detection

41
TIC of +MRM (5 pairs): from Sample 2 (gradient_accucore_21) of AccuCore eval FINAL.wiff (Turbo Spray) Max. 2.9e5 cps.
0.90 0.95 1.00 1.05 1.10 1.15 1.20 1.25 1.30 1.35 1.40 1.45 Time, min
0.0
2.0e4
4.0e4
6.0e4
8.0e4
1.0e5
1.2e5
1.4e5
1.6e5
1.8e5
2.0e5
2.2e5
2.4e5
2.6e5
2.8e5 2.9e5
Intensity, cps
1.18
1.00
1.28
1.37
Accucore C18, 2.1mm*50mm
1 min 27 sec
0.65ml/min
1µL injection
Shimadzu HPLC
MS/MS detect
30°C
Time %B 0.1 15 1.1 95 1.8 95 1.85 15 2.4 15
Chlorpheniramine Mebendazole Amitryptyline Loperamide
DPCPX
Same mobile phases as previous slide

42
Outline
• Isocratic and gradient evaluation on C18
• Multiple analyte evaluation on aQ
• Temperature effect on aQ separations
• Selectivity comparison between columns

43
TIC of +MRM (6 pairs): from Sample 3 (gradient_accucore_AQ_30C_01) of AccuCore eval FINAL.wiff (Turbo Spray) Max. 1.1e6 cps.
0.85 0.90 0.95 1.00 1.05 1.10 1.15 1.20 1.25 1.30 1.35 1.40 1.45 1.50 1.55 Time, min
0.00
5.00e4
1.00e5
1.50e5
2.00e5
2.50e5
3.00e5
3.50e5
4.00e5
4.50e5
5.00e5
5.50e5
6.00e5
6.50e5
7.00e5
7.50e5
8.00e5
8.50e5
9.00e5
9.50e5
1.00e6
1.05e6 1.09e6
Intensity, cps
1.21
1.42
1.12
1.27
0.98
1.36
Accucore aQ, 2.1mm*50mm
0.65ml/min
1µL injection
Shimadzu HPLC
MS/MS detect
30°C
Time %B 0.1 20 1.20 90 1.8 90 1.85 20 2.4 20
Same mobile phases as previous slide
Amitryptyline Protryptyline
DPCPX
Loperamide
Mebendazole
Chlorpheni-ramine

44
Outline
• Isocratic and gradient evaluation on C18
• Multiple analyte evaluation on aQ
• Temperature effect on aQ separations
• Selectivity comparison between columns
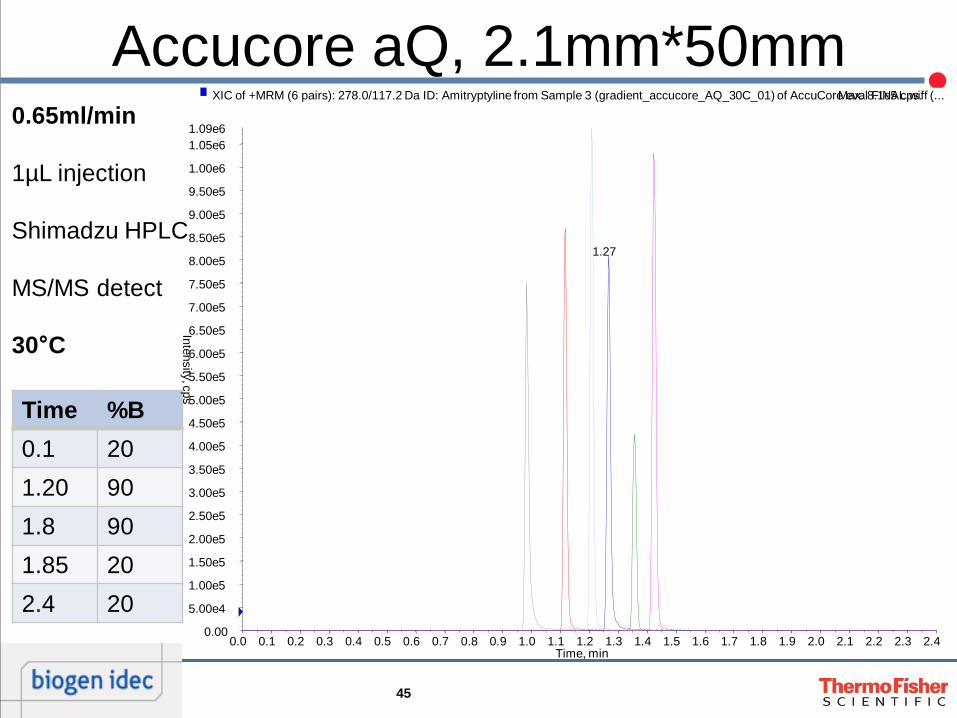
45
0.65ml/min 1µL injection Shimadzu HPLC MS/MS detect 30°C
Time %B 0.1 20 1.20 90 1.8 90 1.85 20 2.4 20
Accucore aQ, 2.1mm*50mm XIC of +MRM (6 pairs): 278.0/117.2 Da ID: Amitryptyline from Sample 3 (gradient_accucore_AQ_30C_01) of AccuCore eval FINAL.wiff (... Max. 8.1e5 cps.
0.0 0.1 0.2 0.3 0.4 0.5 0.6 0.7 0.8 0.9 1.0 1.1 1.2 1.3 1.4 1.5 1.6 1.7 1.8 1.9 2.0 2.1 2.2 2.3 2.4 Time, min
0.00
5.00e4
1.00e5
1.50e5
2.00e5
2.50e5
3.00e5
3.50e5
4.00e5
4.50e5
5.00e5
5.50e5
6.00e5
6.50e5
7.00e5
7.50e5
8.00e5
8.50e5
9.00e5
9.50e5
1.00e6
1.05e6 1.09e6
Intensity, cps
1.27

46
0.65ml/min 1µL injection Shimadzu HPLC MS/MS detect 35 °C
Time %B 0.1 20 1.20 90 1.8 90 1.85 20 2.4 20
Accucore aQ, 2.1mm*50mm XIC of +MRM (6 pairs): 278.0/117.2 Da ID: Amitryptyline from Sample 4 (gradient_accucore_AQ_35C_01) of AccuCore eval FINAL.wiff (... Max. 8.3e5 cps.
0.0 0.1 0.2 0.3 0.4 0.5 0.6 0.7 0.8 0.9 1.0 1.1 1.2 1.3 1.4 1.5 1.6 1.7 1.8 1.9 2.0 2.1 2.2 2.3 2.4 Time, min
0.00
5.00e4
1.00e5
1.50e5
2.00e5
2.50e5
3.00e5
3.50e5
4.00e5
4.50e5
5.00e5
5.50e5
6.00e5
6.50e5
7.00e5
7.50e5
8.00e5
8.50e5
9.00e5
9.50e5
1.00e6
1.05e6
1.10e6
Intensity, cps
1.25

47
0.65ml/min 1µL injection Shimadzu HPLC MS/MS detect 40 °C
Time %B 0.1 20 1.20 90 1.8 90 1.85 20 2.4 20
Accucore aQ, 2.1mm*50mm XIC of +MRM (6 pairs): 278.0/117.2 Da ID: Amitryptyline from Sample 5 (gradient_accucore_AQ_40C_01) of AccuCore eval FINAL.wiff (... Max. 8.4e5 cps.
0.0 0.1 0.2 0.3 0.4 0.5 0.6 0.7 0.8 0.9 1.0 1.1 1.2 1.3 1.4 1.5 1.6 1.7 1.8 1.9 2.0 2.1 2.2 2.3 2.4 Time, min
0.00
5.00e4
1.00e5
1.50e5
2.00e5
2.50e5
3.00e5
3.50e5
4.00e5
4.50e5
5.00e5
5.50e5
6.00e5
6.50e5
7.00e5
7.50e5
8.00e5
8.50e5
9.00e5
9.50e5
1.00e6
1.05e6
1.10e6
1.15e6
1.20e6
Intensity, cps
1.24

48
0.65ml/min 1µL injection Shimadzu HPLC MS/MS detect 45 °C
Time %B 0.1 20 1.20 90 1.8 90 1.85 20 2.4 20
Accucore aQ, 2.1mm*50mm XIC of +MRM (6 pairs): 278.0/117.2 Da ID: Amitryptyline from Sample 6 (gradient_accucore_AQ_45C_01) of AccuCore eval FINAL.wiff (... Max. 9.4e5 cps.
0.0 0.1 0.2 0.3 0.4 0.5 0.6 0.7 0.8 0.9 1.0 1.1 1.2 1.3 1.4 1.5 1.6 1.7 1.8 1.9 2.0 2.1 2.2 2.3 2.4 Time, min
0.00 5.00e4 1.00e5 1.50e5 2.00e5 2.50e5 3.00e5 3.50e5 4.00e5 4.50e5 5.00e5 5.50e5 6.00e5 6.50e5 7.00e5 7.50e5 8.00e5 8.50e5 9.00e5 9.50e5 1.00e6 1.05e6 1.10e6 1.15e6 1.20e6 1.25e6 1.28e6
Intensity, cps
1.24

49
0.65ml/min 1µL injection Shimadzu HPLC MS/MS detect 50 °C
Time %B 0.1 20 1.20 90 1.8 90 1.85 20 2.4 20
Accucore aQ, 2.1mm*50mm XIC of +MRM (6 pairs): 278.0/117.2 Da ID: Amitryptyline from Sample 7 (gradient_accucore_AQ_50C_01) of AccuCore eval FINAL.wiff (... Max. 9.0e5 cps.
0.0 0.1 0.2 0.3 0.4 0.5 0.6 0.7 0.8 0.9 1.0 1.1 1.2 1.3 1.4 1.5 1.6 1.7 1.8 1.9 2.0 2.1 2.2 2.3 2.4 Time, min
0.00 5.00e4 1.00e5 1.50e5 2.00e5 2.50e5 3.00e5 3.50e5 4.00e5 4.50e5 5.00e5 5.50e5 6.00e5 6.50e5 7.00e5 7.50e5 8.00e5 8.50e5 9.00e5 9.50e5 1.00e6 1.05e6 1.10e6 1.15e6 1.20e6 1.25e6 1.28e6
Intensity, cps
1.23

50
0.65ml/min 1µL injection Shimadzu HPLC MS/MS detect 55 °C
Time %B 0.1 20 1.20 90 1.8 90 1.85 20 2.4 20
Accucore aQ, 2.1mm*50mm XIC of +MRM (6 pairs): 278.0/117.2 Da ID: Amitryptyline from Sample 8 (gradient_accucore_AQ_55C_01) of AccuCore eval FINAL.wiff (... Max. 9.6e5 cps.
0.0 0.1 0.2 0.3 0.4 0.5 0.6 0.7 0.8 0.9 1.0 1.1 1.2 1.3 1.4 1.5 1.6 1.7 1.8 1.9 2.0 2.1 2.2 2.3 2.4 Time, min
0.0
1.0e5
2.0e5
3.0e5
4.0e5
5.0e5
6.0e5
7.0e5
8.0e5
9.0e5
1.0e6
1.1e6
1.2e6
1.3e6
1.4e6
Intensity, cps
1.22

51
0.65ml/min 1µL injection Shimadzu HPLC MS/MS detect 60 °C
Time %B 0.1 20 1.20 90 1.8 90 1.85 20 2.4 20
Accucore aQ, 2.1mm*50mm XIC of +MRM (6 pairs): 278.0/117.2 Da ID: Amitryptyline from Sample 9 (gradient_accucore_AQ_60C_01) of AccuCore eval FINAL.wiff (... Max. 9.4e5 cps.
0.0 0.1 0.2 0.3 0.4 0.5 0.6 0.7 0.8 0.9 1.0 1.1 1.2 1.3 1.4 1.5 1.6 1.7 1.8 1.9 2.0 2.1 2.2 2.3 2.4 Time, min
0.0
1.0e5
2.0e5
3.0e5
4.0e5
5.0e5
6.0e5
7.0e5
8.0e5
9.0e5
1.0e6
1.1e6
1.2e6
1.3e6
1.4e6
1.5e6
Intensity, cps
1.22

52
1ml/min 1µL injection Shimadzu HPLC MS/MS detect 60 °C
Time %B 0.1 20 1.20 90 1.8 90 1.85 20 2.4 20
Accucore aQ, 2.1mm*50mm XIC of +MRM (6 pairs): 278.0/117.2 Da ID: Amitryptyline from Sample 11 (gradient_accucore_AQ_60C_1mL-min_01) of AccuCore eval F... Max. 8.6e5 cps.
0.0 0.1 0.2 0.3 0.4 0.5 0.6 0.7 0.8 0.9 1.0 1.1 1.2 1.3 1.4 1.5 1.6 1.7 1.8 1.9 2.0 2.1 2.2 2.3 2.4 Time, min
0.00 5.00e4
1.00e5
1.50e5
2.00e5
2.50e5
3.00e5
3.50e5
4.00e5
4.50e5
5.00e5
5.50e5
6.00e5
6.50e5
7.00e5
7.50e5
8.00e5
8.50e5
9.00e5
9.50e5
1.00e6
1.05e6
1.10e6
1.15e6
1.20e6 1.25e6
Intensity, cps
0.96

53
XIC of +MRM (6 pairs): 305.0/221.1 Da ID: CPDPX from Sample 11 (gradient_accucore_AQ_60C_1mL-min_01) of AccuCore eval FINAL... Max. 4.2e5 cps.
0.0 0.1 0.2 0.3 0.4 0.5 0.6 0.7 0.8 0.9 1.0 1.1 1.2 1.3 1.4 1.5 1.6 1.7 1.8 1.9 2.0 2.1 2.2 2.3 2.4 Time, min
0.0
2.0e4
4.0e4
6.0e4
8.0e4
1.0e5
1.2e5
1.4e5
1.6e5
1.8e5
2.0e5
2.2e5
2.4e5
2.6e5
2.8e5
3.0e5
3.2e5
3.4e5
3.6e5
3.8e5
4.0e5
4.2e5
Intensity, cps
1.06 1ml/min
1µL injection
Shimadzu HPLC
MS/MS detect 60 °C
XIC 305.0/221.1
Time %B 0.1 20 1.20 90 1.8 90 1.85 20 2.4 20
Accucore aQ, 2.1mm*50mm
1.8 second peak width at baseline

54
Outline
• Isocratic and gradient evaluation on C18
• Multiple analyte evaluation on aQ
• Temperature effect on aQ separations
• Selectivity comparison between columns

55
Typical bonded phases for Reversed-Phase LC
• Alkyl chain: C18, C8, C4, C1 • same selectivity, decreasing degree of
hydrophobicity/retention • Dispersive interactions
• Aromatic groups
• Phenyl, Phenyl-Hexyl, perfluorinated • Dipole-dipole, π-π, hydrogen-bonding
interactions
• Other • Cyanos, aminos, polar embedded • Dipole-dipole, hydrogen-bonding
interactions
Perfluorinated

56
Phase Characteristics
Hydrophobic Interactions
Secondary Interactions
Acidic Interactions
Hydrophobic retention
Base activity Acid interaction
HR BA AI Hydrophobic selectivity
Chelation
Ion exchange capacity pH 2.7
HS C IEX (2.7) Steric selectivity Ion exchange
capacity (pH 7.6)
SS IEX (7.6) Hydrogen bonding capacity
HBC
HR K’ Pentylbenzene
HS α Butylbenzene / Pentylbenzene
SS α Triphenylene / o-Terphenyl
HBC α Caffeine / Phenol
BA tf Amitripyline
C tf Quinizarin
IEX(7.6) α Benzylamine / Phenol
AI tf 4-Chlorocinnamic acid
IEX(2.7) α Benzylamine / Phenol

57
Accucore HPLC Columns – Phase Details
RP-MS Optimized for MS detection, excellent combination of speed and quality of separation
Phenyl-Hexyl Unique selectivity for aromatic and moderately polar
analytes
C18 Optimum retention for non-polar analytes
PFP Alternative
selectivity to C18, particularly for
halogenated analytes
aQ Compatible with 100% aqueous mobile phases, special selectivity for polar analytes
HILIC Enhanced
Retention of polar and hydrophilic
analytes
L11
Guard Columns Available !

58
XIC of +MRM (7 pairs): 278.0/117.2 Da ID: Amitryptyline from Sample 2 (Accucore_phenyl-hexyl_001) of Accurcore_selectivity.wiff (Turb... Max. 2.7e5 cps.
1.00 1.05 1.10 1.15 1.20 1.25 1.30 1.35 1.40 1.45 1.50 1.55 1.60 Time, min
0.0
1.0e5
2.0e5
3.0e5
4.0e5
5.0e5
6.0e5
7.0e5
8.0e5
9.0e5
1.0e6
1.1e6
1.2e6
1.3e6
1.4e6
1.5e6
1.6e6
1.7e6
Intensity, cps
1.15
0.65ml/min 4µL injection Shimadzu HPLC MS/MS detect 30 °C
Time %B 0.15 20 1.20 90 2.0 90 2.05 20 2.70 20
Accucore Phenyl-Hexyl, 2.1mm*50mm
Mebendazole
Protryptyline
Amitryptyline
DPCPX
Loperamide

59
XIC of +MRM (7 pairs): 278.0/117.2 Da ID: Amitryptyline from Sample 4 (Accucore_PFP_001) of Accurcore_selectivity.wiff (Turbo Spray... Max. 200.0 cps.
1.05 1.10 1.15 1.20 1.25 1.30 1.35 1.40 1.45 1.50 1.55 1.60 Time, min
0.0
1.0e5
2.0e5
3.0e5
4.0e5
5.0e5
6.0e5
7.0e5
8.0e5
9.0e5
1.0e6
1.1e6
1.2e6
1.3e6
1.4e6
1.5e6
1.6e6
1.7e6 1.7e6
Intensity, cps
1.33
0.65ml/min 4µL injection Shimadzu HPLC MS/MS detect 30 °C
Time %B 0.15 20 1.20 90 2.0 90 2.05 20 2.70 20
Accucore PFP, 2.1mm*50mm Mebendazole
DPCPX
Protryptyline, amitryptyline and loperamide are highly retained and elute in subsequent injections

60
XIC of +MRM (7 pairs): 278.0/117.2 Da ID: Amitryptyline from Sample 6 (Accucore_C18_001) of Accurcore_selectivity.wiff (Turbo Spray) Max. 2.7e5 cps.
1.05 1.10 1.15 1.20 1.25 1.30 1.35 1.40 1.45 1.50 1.55 1.60 Time, min
0.0
1.0e5
2.0e5
3.0e5
4.0e5
5.0e5
6.0e5
7.0e5
8.0e5
9.0e5
1.0e6
1.1e6
1.2e6
1.3e6
1.4e6
1.5e6
1.6e6
1.7e6
1.8e6
1.9e6
Intensity, cps
1.24
1.45
0.65ml/min 4µL injection Shimadzu HPLC MS/MS detect 30 °C
Time %B 0.15 20 1.20 90 2.0 90 2.05 20 2.70 20
Accucore C18, 2.1mm*50mm
Mebendazole
Protryptyline
Amitryptyline
DPCPX
Loperamide

61
XIC of +MRM (7 pairs): 278.0/117.2 Da ID: Amitryptyline from Sample 8 (Accucore_aQ_001) of Accurcore_selectivity.wiff (Turbo Spray) Max. 4.3e5 cps.
1.05 1.10 1.15 1.20 1.25 1.30 1.35 1.40 1.45 1.50 1.55 1.60 Time, min
0.0
1.0e5
2.0e5
3.0e5
4.0e5
5.0e5
6.0e5
7.0e5
8.0e5
9.0e5
1.0e6
1.1e6
1.2e6
1.3e6
1.4e6
1.5e6
1.6e6
1.7e6
1.8e6
1.9e6
Intensity, cps
1.53
0.65ml/min 4µL injection Shimadzu HPLC MS/MS detect 30 °C
Time %B 0.15 20 1.20 90 2.0 90 2.05 20 2.70 20
Accucore aQ, 2.1mm*50mm Mebendazole
Protryptyline Amitryptyline
DPCPX
Loperamide is a late eluter and elutes well after the gradient

62
Quest i ons