accesscc e s s less frequent and more intense rainfall
TRANSCRIPT

CLIMATE RESEARCHClim Res
Vol. 76: 191–201, 2018https://doi.org/10.3354/cr01537
Published online October 25
1. INTRODUCTION
With a cumulative annual rainfall of about 1500 mmyr−1, the Gulf of Guinea represents the wettest regionof West Africa. Although globally wet, the regionreceives most of its rainfall over the western coasts(from Liberia to Guinea and from Nigeria to Gabon),as a result of the orientation of the coastline andinland mountains. Being governed by the WestAfrican monsoon, rainfall is not evenly distributedacross the year. A first rainy season occurs during themonths of April, May, and June (AMJ) when themonsoon is moving northward, and a second rainyseason occurs during the months of September, Octo-ber, and November (SON) when the monsoon is mov-ing southward. The rest of the year is relatively dry.
Over the 20th century, precipitation in this area alsoshowed strong interannual variability (Diatta & Fink2014) and a weaker decadal variability (Sanogo et al.2015). Although less pronounced than in the Sahel,the latter follows a similar evolution: The dry decadesof 1920−1949 precede the wet decades of 1950−1969(the 2 wettest decades in the 20th century) and thevery dry decades of 1970−1989. Since the 1990s, pre-cipitation has been reported to increase again (e.g.Nicholson 2000, Ofori-Sarpong & Annor 2001), andthis period has been qualified as a ‘rainfall recovery’period (Sanogo et al. 2015).
In this region, such variations in precipitationgreatly affect society, in particular though necessaryadaptations to cropping strategies and shortfalls inhydropower provisions in drier years. Associated
© The authors 2018. Open Access under Creative Commons byAttribution Licence. Use, distribution and reproduction are un -restricted. Authors and original publication must be credited.
Publisher: Inter-Research · www.int-res.com
*Corresponding author: [email protected]
Less frequent and more intense rainfall along the coast of the Gulf of Guinea in
West and Central Africa (1981−2014)
Adeline Bichet*, Arona Diedhiou
University Grenoble Alpes, Institute for Geo-Sciences and Environment, 38 058 Grenoble, France
ABSTRACT: Since the 1990s, rainfall has been reported to increase over the Gulf of Guinea. Inlight of the devastating floods that have occurred since then over the coastal areas of this region,this study aims to better characterize the recent trends in precipitation there. We used the ClimateHazards Group InfraRed Precipitation with Station (CHIRPS) product, a new observational rainfalldataset that covers the period 1981−2014 at high resolution and daily time steps. During the firstrainy season (April−June), we find that the lack of significant trend observed in mean precipita-tion hides a trend towards less frequent but more intense rainfall along the coast of the Gulf ofGuinea, which is expected to increase the likelihood of flooding and droughts, and fits with therecent increase in devastating floods. Over the north however (be tween 7° and 12.5° N), rainfallhas become more frequent and less intense, which is expected to decrease the likelihood of flood-ing and droughts. During the second rainy season (September − November), we find that the clearincrease in mean precipitation observed between 5° and 12.5°N results from an increase in pre-cipitation intensity and frequency, while over southern Cameroon, the decrease in mean precipi-tation hides a trend towards less frequent but more intense rainfall. In both seasons, the averageduration of wet spells has greatly decreased along the coast, in favor of more numerous and moreintense isolated wet days.
KEY WORDS: CHIRPS · Dry spell · Guinea Coast · Precipitation intensity · Wet spell ·AMMA-CATCH · Trend · Flood
OPENPEN ACCESSCCESS
Clim Res 76: 191–201, 2018
changes in the frequency and intensity of extremeevents such as floods also constitute an importantthreat for the region, as they are often associatedwith human and infrastructure damages, as well asperturbations in the water and electricity manage-ment. Between 1998 and 2016, recurrent flood cases(number of floods in brackets) were also reported bythe Office for the Coordination of HumanitarianAffairs (OCHA) and the Emergency Events Database(EM-DAT) along the coastal areas of the Gulf ofGuinea, where the main cities and capitals arelocated, with high damage to the infrastructure andthe resident populations: Nigeria (23), Benin (9),Togo (5), Ghana (11), Côte d’Ivoire (4), Liberia (3),and Sierra Leone (5).
Despite such conditions, the current context ofglobal climate change, and the rapid growth in de -mography and development of this region, very littleis known about the ‘rainfall recovery,’ and the associ-ated changes in hydro-climate characteristics are stillunclear and poorly documented. This is partly due tothe lack of continuous, high-resolution ground obser-vations (e.g. no data are available over Liberia, SierraLeone, and northern Ivory Coast, and there is poorcoverage of the Global Telecommunication System ofthe World Meteorological Organization data overGuinea, Ghana, and Nigeria). In contrast to the Sahelregion, for which long-term observations with the re -cent international program African Monsoon Multi -disciplinary Analysis (AMMA) have improved the un-derstanding of changes in precipitation extremes(Panthou et al. 2018), no field campaign has been ded-icated to the understanding of climate variability onthe coast of Guinea since the Convection ProfondeTropicale 1981 (COPT81, northern part of Ivory Coastin Korhogo, see Sommeria & Testud 1984). Therefore,open key questions remain when dealing with the na-ture of climate change in this subregion (Roux 1988,Redelsperger et al. 2006, Christensen et al. 2007). Inaddition, precipitation over this region is generallypoorly simulated by climate models; global climatemodels (GCMs) poorly reproduce the convectivecloud systems in this subregion, and in particular thelow layer convective systems (Hannack et al. 2017).This bias is usually explained by the difficulty to prop-erly reproduce the processes of the atmosphericboundary layer above the ocean and the continentalsurface as well as the land−ocean flux gradients thatdrive the triggering and variability of the cloud sys-tems. Whereas regional climate models (RCMs) maybe part of the solution thanks to their better represen-tation of land surface characteristics, they are alsoweak in representing surface−atmo sphere interac-
tions in these coastal areas where the dynamics of theatmosphere and the convection are partly controlledby the influence of the land−ocean surface meridionalgradient (Diallo et al. 2013, Klutse et al. 2016).
Therefore in this study, we propose to take advan-tage of a high-resolution, gridded, daily rainfall data-set (Climate Hazards Group InfraRed Precipitationwith Station, CHIRPS; see Funk et al. 2015) that cov-ers Africa over the period 1981−2014, to characterizethe trends in rainfall distribution over the Gulf ofGuinea for the past 35 yr. After describing the datasetand the methods in Section 2, a brief evaluation ofsome of the trends discussed in this study is per-formed against rain gauges in Section 3.1. Trends inprecipitation and precipitation intensity are investi-gated in Section 3.2, and trends in the distribution ofwet and dry events are analyzed in Section 3.3. Dis-cussion and conclusions are presented in Section 4.
2. DATASET AND METHODS
2.1. Dataset
We used the CHIRPS rainfall dataset (Funk et al.2015), which is de signed for monitoring global envi-ronmental change over the land surfaces. CHIRPScombines infrared satellite data with ground-basedobservations and corresponds to a gridded, quasi-global (50°S to 50°N), high resolution (0.05°), dailyrainfall dataset that covers the time period 1981−2014. CHIRPS was validated using various rainfallobservation data, and the results indicate good per-formance for drought monitoring. Annual trends overAfrica also fall in general agreement with otherobservational data (Maidment et al. 2015, Bichet &Diedhiou 2018).
Although a comprehensive validation of the CHIRPSdataset is beyond the scope of this study, we never-theless perform a brief assessment of some of thetrends discussed in this study, comparing them withthe corresponding trends from near-surface dailyrain gauges. As in Bichet & Diedhiou (2018), 18 sta-tions were selected from the updated BADOPLUdatabase described by Panthou et al. (2012), basedon the availability of data over the period of interest(1981−2014) and the homogeneous distribution of thestations across the region. Fig. 1 shows the locationsof these 18 stations: Cap Skirring (12.39°N, 16.75°W),Kangaba (11.93°N, 8.39°W), Sikasso (11.35°N,5.67°W), Bole (9.03°N, 2.48°W), Accra Kotoka Inter-national Airport (5.6°N, 0.17°W), Cotonou Airport(6.35°N, 2.38°E), Lome Airport (6.15°N, 1.25°E),
192

Bichet & Diedhiou: Intensifying rainfall over the Guinea coast
Save (8.02°N, 2.48°E), Ilorin (8.47°N, 4.59°E), Cal-abar (4.97°N, 8.35°E), Maiduguri (11.85°N, 13.06°E),Sunyani (7.20°N, 2.30°W), Diapaga (12.06°N, 1.75°E),Banikoara (11.30°N, 2.43°E), Lokoja (7.80°N, 6.73°E),Gusau (12.14°N, 6.69°E), Navrongo (10.90°N, 1.10°W),and Jos (9.85°N, 8.89°E). Note that no data are avail-able from the BADOPLU database for Guinea- Bissau, Guinea, Sierra Leone, and Liberia.
2.2. Methodology
We consider the Gulf of Guinea as the region cov-ering 18°W to 20°E, and 0−12.5°N (Fig. 1). We focuson the 2 rainy seasons of the region, defined as AMJfor the first rainy season, and SON for the secondrainy season. Fig. 2 shows the mean precipitationaveraged over 1981−2014 (mm d−1) for AMJ andSON. As shown in Fig. 2, the amount of precipitationincreases towards the south of the region, going fromabout 5 mm d−1 in the north to 10 mm d−1 in the south.Higher values are observed along the coast, reachingup to 15 mm d−1 along the coasts spanning fromSierra Leone to Ivory Coast and from Nigeria toGabon during AMJ, and from Guinea-Bissau to Libe -ria and from Nigeria to Gabon during SON.
Following previous studies (Sivakumar 1992, Froi -durot & Diedhiou 2017, Bichet & Diedhiou 2018), wedefine a wet (dry) day using the threshold of 1 mmd−1. We split the wet (dry) events into 2 categories: (1)isolated wet (dry) days (or single-day events), whichcorrespond to a single wet (dry) day preceded andfollowed by a dry (wet) day, and (2) wet (dry) spells,which correspond to a sequence of 2 or more consec-utive wet (dry) days preceded and followed by a dry(wet) day. Hence, the duration of a wet (dry) spell, as
defined in our study, spans from 2 to 91 d. Note thatunlike other studies, we do not distinguish betweenshort and long spells, but only separate the isolatedwet (dry) days from the wet (dry) spells. FollowingGiorgi et al. (2011), we computed the average dura-tion of dry spells as follows:
DSL = NDDDS / NDS (1)
where DSL corresponds to the average dry spelllength during the season of interest, NDDDS corre-sponds to the total number of dry days during thatseason but excluding the isolated dry days, and NDScorresponds to the total number of dry spells duringthat season. This definition allows us to be consistentwith Giorgi et al. (2011), who quantified the hydro-logical cycle intensity from the average dry spelllength (and precipitation intensity). The identicalcomputation is applied to wet spells. We also com-puted the precipitation intensity (SDII) and the totalnumber of wet days (RR1) following the definition bythe Expert Team of Climate Change Detection andIndices (ETCCDI; Zhang et al. 2011). Precipitationintensity (SDII) is computed as follows:
SDII = PP / RR1 (2)
where PP corresponds to the total amount of precipi-tation accumulated during the wet days (>1 mm d−1)of the season (mm d−1), and RR1 corresponds to thetotal number of wet days (>1 mm d−1) during the season. Hence, precipitation intensity (SDII) corres -ponds to the precipitation averaged over wet days,which implies that a change in its value directlytranslates into a change in the intensity of wet events,regardless of the number of wet events. The totalnumber of dry days is directly derived from the totalnumber of wet days (RR1).
193
Cap Skirring
Kangaba
SikassoBole
LomeCotonou
Calabar
Maiduguri
Sunyani
Banikoara
Gusau
Jos
Lokoja
Ilorin
0° 30°E0°
15°N
Diapaga
Accra
Save
Navrongo
Fig. 1. West Africa, showing the ‘Gulf of Guinea’ region considered in this study (18°W–20°E, 0°−12.5°N), outlined by the black rectangle. The locations of the 18 daily rain gauge stations used for comparison are represented by red crosses

Clim Res 76: 191–201, 2018
3. RESULTS
3.1. Comparison with daily rain gauges
Here we compare the seasonal (AMJ and SON)time series (1981−2014) for mean precipitation, num-ber of rainy days (RR1), precipitation intensity (SDII),and average dry spell length (DSL), as computed inthe 18 daily rain gauges and the 18 correspondingnearest grid-point in the CHIRPS dataset. The com-parison is performed in terms of statistical distribu-tion (quantile-quantile analyses, not shown), fit oftemporal variability (Taylor diagrams; see Fig. 3for mean precipitation only) and trend values (seeFigs. 4 & 5).
The quantile–quantile analysis for mean precipita-tion (not shown) indicates that in both seasons, the 2datasets come from a very similar statistical distribu-tion. The Taylor diagrams show that in AMJ, theCHIRPS dataset generally (1) correlates better withthe rain gauges for mean precipitation (between 0.25
and 0.85, Fig. 3a) and the number of wet days (be-tween 0 and 0.6) than for precipitation intensity (be-tween −0.4 and 0.6) and DSL (between −0.2 and 0.7),(2) exhibits a temporal variability that is larger thanthe rain gauges for mean precipitation (standard devi-ation [SD] between 1 and 3.5, Fig. 3a) and the numberof wet days (SD between 1.5 and 3) but smaller forprecipitation intensity and DSL (SD <1 in both cases),and (3) shows larger biases for mean precipitation(Fig. 3a) and the number of wet days (centralizer rootmean squared error [CRMSE] around 2 in both cases)than for precipitation intensity and DSL (CRMSEaround 1 in both cases). In SON, the CHIRPS datasetgenerally (1) correlates better with the rain gauges formean precipitation (between 0.4 and 0.9, Fig. 3b) andthe number of wet days (be tween 0.1 and 0.8) than forprecipitation intensity and DSL (between 0 and 0.6),(2) exhibits a temporal variability that is smaller thanthe rain gauges for all 4 variables (SD <1 in all 4cases), and (3) shows relatively low biases for all 4variables (CRMSE <1 in all 4 cases). We conclude that
194
Fig. 2. (a) AMJ and (b) SON mean precipitation (mm d−1) averaged over 1981−2014

Bichet & Diedhiou: Intensifying rainfall over the Guinea coast
for the 18 locations and 4 variables tested, the CHIRPSdataset shows results similar to the rain gauges interms of distribution and to some extent of temporalvariability. According to our results, the fit is better inSON than in AMJ, and generally better for mean pre-cipitation and the number of wet days.
Fig. 4 shows the AMJ trends (1981−2014) for meanprecipitation (mm d−1), number of rainy days (d yr−1),precipitation intensity (mm d−1 yr−1), and DSL (d yr−1),as computed in the 18 daily rain gauges (x-axis) andin the 18 corresponding nearest grid-points in theCHIRPS data (y-axis). As shown in Fig. 4a, bothdatasets show a positive trend in mean precipitationover 10 locations, with the CHIRPS dataset slightlyunderestimating the trends of the rain gauge data. Inthe 4 remaining locations, the CHIRPS dataset showsa negative trend and the rain gauges a positive trend.Fig. 4b shows that both datasets exhibit a positivetrend in the total number of wet days in 6 locations. Inmost of the remaining locations (except for Accra,Cotonou, and Lome), the CHIRPS dataset shows apositive trend and the rain gauges a negative trend.As shown in Fig. 4c, both datasets show a positivetrend in precipitation intensity in 3 locations, and anegative trend in 2 locations. In most of the remaininglocations (except for Save, Cotonou, and Lome), theCHIRPS dataset shows a negative trend and the raingauges a positive trend. Fig. 4d shows that both data -sets exhibit a negative trend in DSL in 12 locationsand a positive trend in 1 location. Hence, our resultsshow that during the first rainy seasons, both datasetsshow a general tendency towards wetter conditionsin the 18 locations tested, that is associated with an
increase in the total number of wet days and shorterDSL. However, the 2 datasets strongly disagree onthe sign of the trend for precipitation intensity.
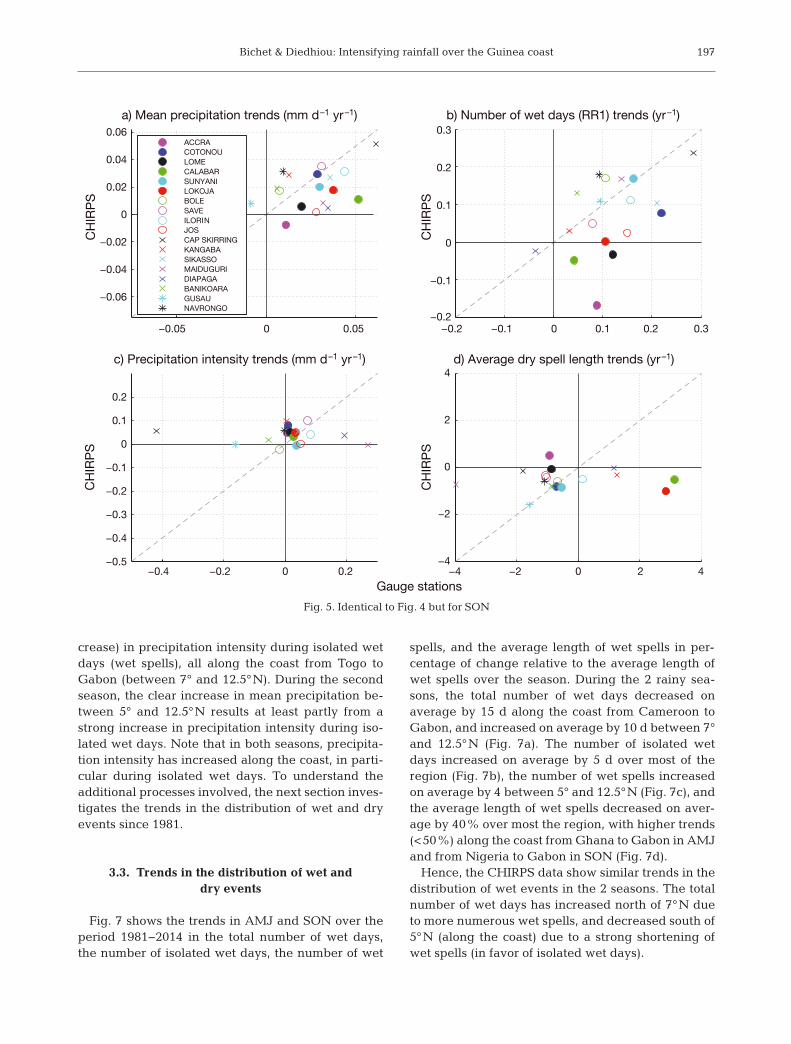
Fig. 5 is identical to Fig. 4 but for SON. As shown inFig. 5a, both datasets show a positive trend in meanprecipitation in 16 locations, with the CHIRPS data-set slightly underestimating the trends of the raingauge data. Fig. 5b shows that both datasets exhibita positive trend in the total number of wet days in 13locations and a negative trend in 1 location. Asshown in Fig. 5c, both datasets show a positive trendin precipitation intensity in 11 locations and a nega-tive trend in 1 location. Fig. 5d shows that bothdatasets exhibit a negative trend in the average DSLin 12 locations. Hence, our results show that duringthe second rainy season, both datasets show a ten-dency towards wetter conditions in the 18 locationstested, that is associated with an increase in the totalnumber of wet days, an increase in precipitationintensity, and shorter average DSL.
During the second rainy season, both datasets gen-erally agree on the sign and to some extent on themagnitude of the trends of mean precipitation, pre-cipitation intensity, total number of wet days, andDSL. During the first season, we find stronger dis-agreements.
3.2. Trends in precipitation
Fig. 6 shows the trends (1981−2014) in mean pre-cipitation, precipitation intensity, precipitation inten-sity during isolated wet days, and precipitation inten-
195
0
1
2
3
40 0.2
0.4
0.6
0.8
0.9
0.95
1
a) AMJ
r
SD
r
SD
0.5
1
0
0.5
10 0.2
0.4
0.6
0.8
0.9
0.95
1
b) SON
Fig. 3. Normalized Taylor diagram comparing the mean precipitation time series over 1981−2014 for (a) AMJ and (b) SON, ascomputed for the 18 daily rain gauge stations (black diamond) with the corresponding nearest grid point in the CHIRPS dataset(colored markers). See Fig. 4 for the interpretation of the color markers. Normalized standard de viation (SD) is on the radial axis;correlation coefficient (r) is on the angular axis; green dashed lines indicate centralized root mean squared error (CRMSE)

Clim Res 76: 191–201, 2018
sity during wet spells, averaged over the first (AMJ)and second rainy season (SON) in mm d−1. During thefirst rainy season, only a few, small, regions show sta-tistically significant trends in mean precipitation, ofabout +1 mm d−1 (Fig. 6a). During the second rainyseason, however, mean precipitation increased onaverage by 1.5 mm d−1 between 5° and 12.5°N, withhigher trends (>2 mm d−1) over Liberia, Togo/Benin/southwestern Nigeria, and the eastern Central Afri -can Republic, and decreased by about 1.5 mm d−1
over southern Cameroon/northern Gabon (Fig. 6a).As shown in Fig. 6b, precipitation intensity during
the first rainy season has increased on average by2 mm d−1 along the coast from Togo to Gabon, anddecreased on average by 2 mm d−1 between 7° and12.5°N, with higher trends (<5 mm d−1) over SierraLeone/western Guinea. During the second rainy sea-son, precipitation intensity increased on average by
3 mm d−1 over most of the region, with higher trends(>5 mm d−1) along the coasts of southern Liberia,western Ivory Coast, southern Nigeria, and westernGabon, as well as over central Togo and central Benin.
As shown in Fig. 6c, precipitation intensity duringisolated wet days has decreased by more than 5 mmd−1 over Sierra Leone/western Guinea, and increasedby more than 5 mm d−1 along the coast from Togo toGabon. During the second rainy season, precipitationintensity during isolated wet days has increased bymore than 5 mm d−1 over most of the region. For bothseasons, the trends in precipitation intensity duringwet spells (Fig. 6d) are similar to the trends in precip-itation intensity (Fig. 6b).
Therefore, the CHIRPS dataset shows differenttrends in mean precipitation for the 2 rainy seasons.During the first season, the lack of significant trend inmean precipitation hides a strong increase (de -
196
−0.05 0 0.05−0.05
0
0.05
CH
IRPS
a) Mean precipitation trends (mm d–1 yr–1)
ACCRACOTONOULOMECALABARSUNYANILOKOJABOLESAVEILORINJOSCAP SKIRRINGKANGABASIKASSOMAIDUGURIDIAPAGABANIKOARAGUSAUNAVRONGO
−0.4 −0.2 0 0.2 0.4−0.4
−0.2
0
0.2
0.4
CH
IRPS
b) Number of wet days (RR1) trends (yr–1)
−0.1 0 0.1 0.2
−0.1
−0.05
0
0.05
0.1
0.15
0.2
0.25
Gauge stations
CH
IRPS
c) Precipitation intensity trends (mm d–1 yr–1)
−6 −4 −2 0 2 4 6−6
−4
−2
0
2
4
6
CH
IRPS
d) Average dry spell length trends (yr–1)
Fig. 4. Comparison of the AMJ trends (1981−2014) for (a) mean precipitation (mm d−1 yr−1), (b) number of rainy days (d yr−1), (c)precipitation intensity (mm d−1 yr−1), and (d) average dry spell length (d yr−1), as computed in the 18 daily rain gauge stations
(x-axis) and in the corresponding nearest grid point in the CHIRPS dataset (y-axis)
Bichet & Diedhiou: Intensifying rainfall over the Guinea coast
crease) in precipitation intensity during isolated wetdays (wet spells), all along the coast from Togo toGabon (between 7° and 12.5°N). During the secondseason, the clear increase in mean precipitation be -tween 5° and 12.5°N results at least partly from astrong increase in precipitation intensity during iso-lated wet days. Note that in both seasons, precipita-tion intensity has increased along the coast, in parti -cular during isolated wet days. To understand theadditional processes involved, the next section inves-tigates the trends in the distribution of wet and dryevents since 1981.
3.3. Trends in the distribution of wet anddry events
Fig. 7 shows the trends in AMJ and SON over theperiod 1981−2014 in the total number of wet days,the number of isolated wet days, the number of wet
spells, and the average length of wet spells in per-centage of change relative to the average length ofwet spells over the season. During the 2 rainy sea-sons, the total number of wet days decreased onaverage by 15 d along the coast from Cameroon toGabon, and increased on average by 10 d between 7°and 12.5°N (Fig. 7a). The number of isolated wetdays increased on average by 5 d over most of theregion (Fig. 7b), the number of wet spells increasedon average by 4 between 5° and 12.5°N (Fig. 7c), andthe average length of wet spells decreased on aver-age by 40% over most the region, with higher trends(<50%) along the coast from Ghana to Gabon in AMJand from Nigeria to Gabon in SON (Fig. 7d).
Hence, the CHIRPS data show similar trends in thedistribution of wet events in the 2 seasons. The totalnumber of wet days has increased north of 7°N dueto more numerous wet spells, and decreased south of5°N (along the coast) due to a strong shortening ofwet spells (in favor of isolated wet days).
197
−0.05 0 0.05
−0.06
−0.04
−0.02
0
0.02
0.04
0.06
CH
IRPS
a) Mean precipitation trends (mm d–1 yr–1)
ACCRACOTONOULOMECALABARSUNYANILOKOJABOLESAVEILORINJOSCAP SKIRRINGKANGABASIKASSOMAIDUGURIDIAPAGABANIKOARAGUSAUNAVRONGO
−0.2 −0.1 0 0.1 0.2 0.3−0.2
−0.1
0
0.1
0.2
0.3
CH
IRPS
b) Number of wet days (RR1) trends (yr–1)
−0.4 −0.2 0 0.2−0.5
−0.4
−0.3
−0.2
−0.1
0
0.1
0.2
Gauge stations
CH
IRPS
c) Precipitation intensity trends (mm d–1 yr–1)
−4 −2 0 2 4−4
−2
0
2
4
CH
IRPS
d) Average dry spell length trends (yr–1)
Fig. 5. Identical to Fig. 4 but for SON

Clim Res 76: 191–201, 2018
Fig. 8 is identical to Fig. 7 but for dry events. Dur-ing the 2 seasons, the total number of dry days in -creased on average by 15 d along the coast fromCameroon to Gabon, and decreased on average by10 d between 7° and 12.5°N (Fig. 8a). The number ofisolated dry days increased on average by 5 d overthe entire region (Fig. 8b), and the number of dryspells increased on average by 4 over most of theregion (Fig. 8c), and the average length of dry spellsdecreased on average by 30% over most of theregion, with higher trends (<50%) over the northernpart of the region (Fig. 8d). Hence, the CHIRPS datashow similar trends in the distribution of dry eventsfor the 2 seasons. The total number of dry days hasincreased along the coast due to more numerous iso-lated dry days and more numerous dry spells, anddecreased north of 7°N due to a strong shortening ofdry spells (in favor of isolated wet days).
4. DISCUSSION AND CONCLUSION
To summarize, our study shows that during the second rainy season, the CHIRPS dataset generallyagrees with a selection of 18 rain gauges, both in thesign and to some extent in the magnitude of thetrends in mean precipitation, number of wet days,precipitation intensity, and average DSL. Strongerdisagreements are observed during the first season,in particular for precipitation intensity. Note that nodata are available from the BADOPLU database forSierra Leone and Guinea, where the CHIRPS datasetshows the strongest decrease in precipitation inten-sity. In addition, the comparison of the correspondingtime series between the 2 datasets indicates that thedistribution, and to some extent the temporal vari-ability, of the 2 datasets agree in both seasons, gener-ally showing a better fit for (1) mean precipitation
198
Fig. 6. Trend maps (1981−2014) for (a) precipitation, (b) precipitation intensity, (c) precipitation intensity during isolated wetdays, and (d) precipitation intensity during wet spells, as averaged over AMJ and SON, in mm d−1 since 1981. Trends that are
not significant according to Student’s t-test at 95% are shaded in gray

Bichet & Diedhiou: Intensifying rainfall over the Guinea coast
and the number of wet days and (2) the second rainyseason (SON). Hence, despite a few biases, our eval-uation indicates good confidence in the use of theCHIRPS data for our study.
Over the past 35 yr, we find that the CHIRPS data-set depicts different trends in mean precipitation forthe 2 rainy seasons. In agreement with other obser-vational datasets (Maidment et al. 2015, Sanogo et al.2015, Sylla et al. 2016), we find a clear precipitationincrease during the second rainy season (between 5°and 10°N) that is not observed during the first sea-son. We also find that the CHIRPS dataset shows astrong reorganization of rainfall, that is different forthe 2 seasons (especially for precipitation intensity)and not spatially homogeneous (north/south).
During the first rainy season, we find that the lackof significant trend in mean precipitation hides astrong trend towards less frequent but more intense
rainfall (shorter but stronger rainfall events) along thecoast, which is expected to increase the likelihood offlooding and droughts in this region. This result is ingood agreement with the high occurrence of devas-tating floods along the coast in the recent years(OCHA and EM-DAT). Opposite trends are foundover the northern part of the region. During the sec-ond rainy season, we find, in agreement with Sanogoet al. (2015), that the clear increase in mean precipita-tion observed between 5° and 12.5°N results frommore intense (in particular during isolated wet days)and more frequent precipitation, overall in creasingthe likelihood for flooding. Over southern Cameroon/northern Gabon, the trend towards more intense andless frequent rainfall is expected to in crease the like-lihood for floods and droughts.
In such circumstances, and in the light of poor doc-umentation on this issue, our results raise the need
199
Fig. 7. Trend maps (1981−2014) for (a) total number of wet days, (b) total number of isolated wet days, (c) total number of wetspells, and (d) average length of wet spells (%), for AMJ and SON. Trends that are not significant according to Student’s t-test
at 95% are shaded in gray

Clim Res 76: 191–201, 2018
for a more in-depth investigation of the recent trendsin the Gulf of Guinea. The biases found across the 2observational datasets used in our study also raisethe need for a more comprehensive comparison ofsuch trends across the different observational prod-ucts available for daily precipitation in this region, aswell as the need for the acquisition of new data incountries where such data are currently missing,such as Liberia, Sierra Leone, Guinea, and Guinea-Bissau.
Furthermore, the mechanisms behind these trendsshould also be investigated in order to better appre-hend the future evolution of these trends and betteranticipate their implications for society. Although theexploration of such mechanisms is beyond the scopeof this study, our results suggest that they may be dif-ferent in the 2 seasons. As previously mentioned,precipitation in this region is governed by the WestAfrican Monsoon. However, it has been shown (Le -
bel et al. 2003) that the 2 rainy seasons belong to dif-ferent phases of the monsoon, being ‘oceanic’ fromApril to June, and ‘continental’ from July to Novem-ber. Therefore, whereas the changes in AMJ rainfallcan be linked to changes in the Atlantic sea surfacetemperatures (e.g. Nguyen et al. 2011, Nnamchi & Li2016), the changes in SON rainfall can be linked toland changes, and may even be related to the pre-ceding summer monsoon over the Sahel (e.g. Bichet& Diedhiou 2018). According to Sanogo et al. (2015),the SON ‘rainfall recovery’ over the Gulf of Guineacan even be considered as a reminiscence of theSahel recovery during the summer months, therebyincluding potential drivers such as changes in Saha-ran temperatures (Taylor et al. 2012). Finally, an ad -ditional possible driver for these trends includes thepotential intensification of the hydrological cycle thatis expected to result from global warming (e.g. Allen& Ingram 2002, Giorgi et al. 2011).
200
Fig. 8. Identical to Fig. 7, but for dry days

Bichet & Diedhiou: Intensifying rainfall over the Guinea coast
Acknowledgements. The research leading to this publicationhas received funding from the NERC/DFID ‘Future Climatefor Africa’ program under the AMMA-2050 project, grantnumber NE/M019969/1. We acknowledge the Climate Haz-ards Group for CHIRPS data (http://chg.geog.ucsb.edu/ data/chirps). Our research has benefited from the access to rainfalldata sets provided by the AMMA-CATCH observatory, theAMMA international program, DMN Burkina, ANACIM,and DMN Niger; we greatly thank all of them, as well as thepeople at the IGE computation center (Guillaume Quantin,Véronique Chaffard, Patrick Juen, and Wajdi Nechba) fortheir technical support, and Geremy Panthou for his role inaccessing the data and insights into the dataset.
LITERATURE CITED
Allen MR, Ingram WJ (2002) Constraints on future changesin climate and the hydrologic cycle. Nature 419: 224−232
Bichet A, Diedhiou A (2018) West African Sahel has becomewetter during the last 30 years, but dry spells are shorterand more frequent. Clim Res 75: 155−162
Christensen JH, Hewitson B, Busuioc A, Chen A and others(2007) Regional climate projections. In: Solomon S, QinD, Manning M, Chen Z and others (eds) Contributionof Working Group I to the Fourth Assessment Report ofthe Intergovernmental Panel on Climate Change. Cam-bridge University Press, Cambridge, p 847–940
Diallo I, Sylla MB, Camara M, Gaye AT (2013) Interannualvariability of rainfall over the Sahel based on multipleregional climate models simulations. Theor Appl Clima-tol 113: 351−362
Diatta S, Fink AH (2014) Statistical relationship betweenremote climate indices and West African monsoon vari-ability. Int J Climatol 34: 3348−3367
Froidurot S, Diedhiou A (2017) Characteristics of wet anddry spells in the West African monsoon system. AtmosSci Lett 18: 125−131
Funk C, Peterson P, Landsfeld M, Pedreros D and others(2015) The climate hazards infrared precipitation withstations — a new environmental record for monitoringextremes. Sci Data 2: 150066
Giorgi F, Im ES, Coppola E (2011) Higher hydroclimaticintensity with global warming. J Clim 24: 5309−5324
Hannak L, Knippertz P, Fink AH, Kniffka A, Pante G (2017)Why do global climate models struggle to represent low-level clouds in the West African summer monsoon?J Clim 30: 1665−1687
Klutse NAB, Sylla MB, Diallo I, Sarr A and others (2016)Daily characteristics of West African summer monsoonprecipitation in CORDEX simulations. Theor Appl Cli-matol 123: 369−386
Lebel T, Diedhiou A, Laurent H (2003) Seasonal cycle and
interannual variability of the Sahelian rainfall at hydro-logical scales. J Geophys Res 108: 8389
Maidment RI, Allan RP, Black E (2015) Recent observed andsimulated changes in precipitation over Africa. GeophysRes Lett 42: 8155−8164
Nguyen H, Thorncroft CD, Zhang C (2011) Guinean coastalrainfall of the West African Monsoon. Q J R Meteorol Soc137: 1828−1840
Nicholson SE (2000) The nature of rainfall variability overAfrica on time scales of decades to millenia. GlobalPlanet Change 26: 137−158
Nnamchi HC, Li J (2016) Floods and droughts along theGuinea Coast in connection with the South AtlanticDipole. In: Li J, Swinbank R, Grotjahn R, Volkert H (eds)Dynamics and predictability of large-scale, high-impactweather and climate events. Cambridge UniversityPress, Cambridge, p 271–279
Ofori-Sarpong E, Annor J (2001) Rainfall over Accra, 1901−90. Weather 56: 55−62
Panthou G, Vischel T, Lebel T, Blanchet J, Quantin G, Ali A(2012) Extreme rainfall in West Africa: a regional model-ing. Water Resour Res 48:W08501
Panthou G, Lebel T, Vischel T, Quantin G and others (2018)Rainfall intensification in tropical semi-arid regions: theSahelian case. Environ Res Lett 13:064013
Redelsperger JL, Thorncroft CD, Diedhiou A, Lebel T, Par -ker DJ, Polcher J (2006) African Monsoon Multidiscipli-nary Analysis (AMMA): an international research projectand field campaign. Bull Am Meteorol Soc 87: 1739−1746
Roux F (1988) The West African squall line observed on 23June 1981 during COPT 81: kinematics and thermody-namics of the convective region. J Atmos Sci 45: 406−426
Sanogo S, Fink AH, Omotosho JA, Ba A, Redl R, Ermert V(2015) Spatio-temporal characteristics of the recent rain-fall recovery in West Africa. Int J Climatol 35: 4589−4605
Sivakumar MVK (1992) Empirical analysis of dry spells foragricultural applications in West Africa. J Clim 5: 532−539
Sommeria G, Testud J (1984) COPT 81: a field experimentdesigned for the study of dynamics and electrical activityof deep convection in continental tropical regions. BullAm Meteorol Soc 65:4–10
Sylla MB, Nikiema PM, Gibba P, Kebe I, Klutse NAB (2016)Climate change over West Africa: recent trends andfuture projections. In: Yaro JA, Hesselberg J (eds) Adap-tation to climate change and variability in rural WestAfrica. Springer International Publishing, Basel, p 25−40
Taylor CM, Belušić D, Guichard F, Parker DJ and others(2017) Frequency of extreme Sahelian storms tripledsince 1982 in satellite observations. Nature 544:475–478
Zhang X, Alexander L, Hegerl GC, Jones P and others(2011) Indices for monitoring changes in extremes basedon daily temperature and precipitation data. Wiley Inter-discip Rev Clim Change 2: 851−870
201
Editorial responsibility: Filippo Giorgi, Trieste, Italy
Submitted: April 17, 2018; Accepted: September 3, 2018Proofs received from author(s): October 9, 2018