accepted manuscript doi:...
TRANSCRIPT

Accepted manuscript doi: 10.1680/jgere.17.00009
1
Accepted manuscript
As a service to our authors and readers, we are putting peer-reviewed accepted manuscripts
(AM) online, in the Ahead of Print section of each journal web page, shortly after acceptance.
Disclaimer
The AM is yet to be copyedited and formatted in journal house style but can still be read and
referenced by quoting its unique reference number, the digital object identifier (DOI). Once the
AM has been typeset, an ‘uncorrected proof’ PDF will replace the ‘accepted manuscript’ PDF.
These formatted articles may still be corrected by the authors. During the Production process,
errors may be discovered which could affect the content, and all legal disclaimers that apply to
the journal relate to these versions also.
Version of record
The final edited article will be published in PDF and HTML and will contain all author
corrections and is considered the version of record. Authors wishing to reference an article
published Ahead of Print should quote its DOI. When an issue becomes available, queuing
Ahead of Print articles will move to that issue’s Table of Contents. When the article is
published in a journal issue, the full reference should be cited in addition to the DOI.
Downloaded by [] on [15/11/17]. Published with permission by the ICE under the CC-BY license

Accepted manuscript doi: 10.1680/jgere.17.00009
2
Submitted: 23 June 2017
Published online in ‘accepted manuscript’ format: 15 November 2017
Manuscript title: Seismic Analysis of Pile in Liquefiable Soil and Plastic Hinge
Authors: Rohollah Rostami1, Nicholas Hytiris2, Subhamoy Bhattacharya3, Martin Giblin4
Affiliations: 1Glasgow Caledonian University, UK. 2School of the Built and Natural
Environment, Glasgow Caledonian University, UK. 3SAGE Laboratory, University of Surrey,
UK. 4Tony Gee and Partners, London, UK.
Corresponding author: Rohollah Rostami, Department of Construction & Surveying,
Glasgow Caledonian University, Glasgow, UK. Tel.: +44(0)7476895361
E-mail: [email protected]
Downloaded by [] on [15/11/17]. Published with permission by the ICE under the CC-BY license

Accepted manuscript doi: 10.1680/jgere.17.00009
3
Abstract
Liquefaction is one of the leading seismic actions to cause extensive damage to buildings and
infrastructure during earthquakes. In many historic cases, plastic hinge formations in piles were
observed at inexplicable locations. This project investigates the behaviour of piled foundations
within soils susceptible to liquefaction using numerical analysis carried out in Abaqus in terms
of plastic hinge development. Three different soil profiles were considered in this project by
varying the thickness of both the liquefiable and non-liquefiable layers, pile length, free and
fixed head pile conditions. Modelling a single pile as a beam-column element carrying both
axial and El-Centro record earthquake loading produced results of the seismic behaviour of
piles that could be assessed by Force-Based Seismic Design (FBSD) approaches. The
displacements and deformations induced by dynamic loads were analysed for piles affected by
liquefaction and the results used to demonstrate the pile capacity and discuss the damage
patterns and location of plastic hinges. Parametric studies generally demonstrate that plastic
hinge formation occurs at the boundaries of the liquefiable and non-liquefiable layers; however,
the location can be affected by a variety of factors such as material properties, pile length and
thickness of liquefying soil layer.
Downloaded by [] on [15/11/17]. Published with permission by the ICE under the CC-BY license

Accepted manuscript doi: 10.1680/jgere.17.00009
4
Notation
Es Soil modulus
cf Compressive strength of unconfined concrete
y Lateral deflection of the pile
γdry Effective unit weight
c Concrete strain
μδ Curvature ductility
δmax Maximum displacement
δy Yield displacement
υ Poisson’s ration
ζ Viscous damping ratio
Plastic hinge length
θp Plastic rotation in the pile
φp Plastic curvature
Downloaded by [] on [15/11/17]. Published with permission by the ICE under the CC-BY license

Accepted manuscript doi: 10.1680/jgere.17.00009
5
1. Introduction
The seismic risk assessment of pile-supported structures in liquefiable soils during an
earthquake is an important issue. Pile foundations are commonly installed to support heavy
loads when near-surface soils are too weak or too compressible to support the loads without
excessive settlement or lateral deflection (Kramer, 2014). Liquefaction happens when during
earthquake shaking, the pore water pressure of loosely deposited sandy soil layers increases
rapidly and sufficiently and the effective stress in the soil can decrease to zero (ed. Booth 1994,
P277). Collapse and damage of pile-supported structures due to liquefaction is still observed
in many major earthquakes (Lombardi, Bhattacharya, 2016). The pile-supported structures
response to liquefiable soils during a major earthquake depends on the stiffness of the pile
foundation, response of soil surrounding the pile and soil-pile interaction effects. The
interactions are classified as inertial loading exerted by the superstructure and kinematic
loading induced by the soil surrounding the pile. The Japanese Highway Code of Practice
(JRA) (2002) advises practising engineers to consider both loading conditions, however,
suggests checking against bending failure due to kinematic and inertial forces separately.
Similarly, Eurocode 8 (2004) advises engineers to design piles against bending due to inertial
and kinematic forces arising from the deformation of the surrounding soil. In the event of
liquefaction, EC8 also suggests, “the side resistance of soil layers that are susceptible to
liquefaction or to substantial strength degradation shall be ignored”. The NEHRP (2000) also
focuses on the bending strength of the piles by treating them as laterally loaded beams and
assuming that the lateral load due to inertia and soil movement causes bending failure. Current
Downloaded by [] on [15/11/17]. Published with permission by the ICE under the CC-BY license

Accepted manuscript doi: 10.1680/jgere.17.00009
6
research has indicated that there are two different mechanisms of pile failure in liquefiable
soils: failure via bending or via buckling instability (Hamada 1992, Ishihara 1997, Tokimatsu
et al. 1998, Goh and O’Rourke 1999, Abdoun and Dobry 2002, Finn and Fujita, 2002, Dash et
al. 2010, Bhattacharya, 2003, Bhattacharya et al. 2004, Bhattacharya and Madabhushi, 2008,
Bhattacharya and Goda 2013). The first mechanism is the bending failure that can occur when
soil liquefies and loses much of its stiffness, causing the piles to act as unsupported slender
columns. The second mechanism is the buckling instability of the piles when acting as
beam-columns under both axial and lateral loading. Despite the extensive research in this field,
these mechanisms cannot explain the damage patterns and location of plastic hinges in the
piles. In many historic cases, plastic hinge formation occurred at inexplicable locations. For
example, Bhattacharya and Madabhushi (2008) reported that investigations have found the
failure pattern of the piles described by Yoshida & Hamada (1990), and BTL Committee
(2000) (see Fig.1). They mentioned that the cracks observed were near the bottom and top
boundaries between liquefied and non-liquefied layers and often at the pile head. Additionally,
they found plastic hinges had also formed at the boundaries of the liquefiable and
non-liquefiable layers and at various depths between. Therefore, the main aims of this study
are to present the analysis of liquefaction and explain the damage patterns and location of
plastic hinges. A numerical approach (with consideration to a comprehensive modelling
framework of different soils profiles) is presented. In this paper, the seismic behaviour of the
piles can be assessed by FBSD approaches.
Downloaded by [] on [15/11/17]. Published with permission by the ICE under the CC-BY license

Accepted manuscript doi: 10.1680/jgere.17.00009
7
2. Methodology
This study investigates the development of 3D FE models for the behaviour of pile-supported
structures in liquefaction soils in terms of plastic hinge development. The work scope initially
describes the 3D model for three different soil profiles with the pile modelled as a
beam-column element carrying both axial and (El-Centro earthquake record) earthquake. The
FBSD is used in this research to assess the seismic behaviour of pile-supported structures in
liquefiable soils. The displacement and deformation demands induced by dynamic loads are
analysed for piles affected by liquefaction by using a nonlinear spring stiffness (p-y curves) to
performance of pile bending moments. The results of the seismic behaviour will be used to
demonstrate a capacity of the pile and discuss the damage patterns and location of plastic
hinges.
2.1 P–Y curves for modelling liquefiable soils
The nonlinear spring stiffness (p-y curves) of the liquefied soil used in the modelling of
soil-pile-structure interaction is based on the Beam on Elastic Foundation approach (Hetenyi,
1946). The p-y curves have been used to model the reaction of the foundation with
consideration of inertial effects and seismic soil-pile interaction. Numerous research has been
carried out to evaluate p–y curves for piles in liquefiable soils because the soil stiffness may
change due to pore water pressure generation. Such as Dobry et al. (1995), Yasuda et al.
(1998), RTRI (1999), AIJ (2001), Takahashi et al. (2002), Rollins et al. (2005). Bhattacharya et
al. (2005) suggested an S-curve shape of the ‘‘p–y’’ curve for liquefied soil. Maheshwari &
Sarkar (2011) and Sarkar & Maheshwari (2012) used the soil model of work hardening
Downloaded by [] on [15/11/17]. Published with permission by the ICE under the CC-BY license

Accepted manuscript doi: 10.1680/jgere.17.00009
8
Drucker-Prager to investigate the three-dimensional behaviour of single piles and pile groups.
Lombardi and Bhattacharya (2016) and Dash et al (2017) adopted a new set of p–y curves that
can be obtained by modifying the conventional p–y curves (for non-liquefied soils) in such a
way that replicates the strain hardening behaviour aforementioned. In this research the
nonlinear spring stiffness (p-y curves) of the liquefied soil are used to evaluate
soil-pile-interaction analysis performed pile bending moments.
2.2 Overview of models
The models vary between one, two and, three distinct layers of soil. The soil layers consisted of
two thick layers of non-liquefiable soil and one liquefiable soil. A reinforced concrete pile was
located in the middle of the soil system, with the soil layers in the models varying in thickness,
articulation and soil type. Due to its symmetry, half of the pile and surrounding soil is modelled.
The different soil profiles surrounding the pile are considered to be wide enough to identify the
effectiveness of the free-field kinematic demand imposed upon the soil system. Additionally,
these models are deemed sufficiently comprehensive enough in order to understand behaviour
of the pile from any effects induced by liquefaction on the soil-structure interaction.
2.3 Boundary conditions
For the FE model to effectively simulate the pile-soil interaction, it was important to
appropriately define the boundary conditions. The dynamically load model requires boundary
conditions that offer support to the elements whilst restricting unnecessary motions. For
dynamic cases the ability of the infinite elements to transmit energy out of the finite element
Downloaded by [] on [15/11/17]. Published with permission by the ICE under the CC-BY license
Accepted manuscript doi: 10.1680/jgere.17.00009
9
mesh, without trapping or reflecting it, is optimized by making the boundary between meshes
as close as possible to being orthogonal to the direction from which the waves will impinge on
the boundary. Close to a free surface, where Rayleigh or Love waves may be important, the
finite elements are most effective if they are orthogonal to the surface (Abaqus, 2012). This is
illustrated in figure 2.
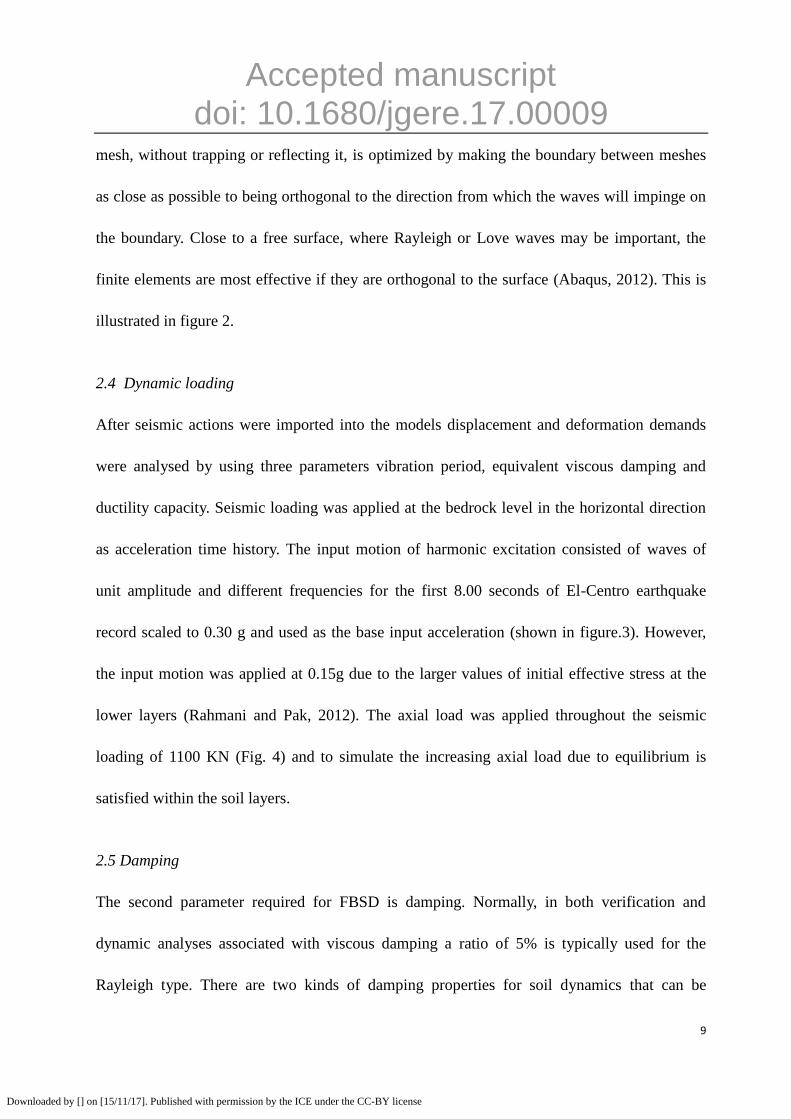
2.4 Dynamic loading
After seismic actions were imported into the models displacement and deformation demands
were analysed by using three parameters vibration period, equivalent viscous damping and
ductility capacity. Seismic loading was applied at the bedrock level in the horizontal direction
as acceleration time history. The input motion of harmonic excitation consisted of waves of
unit amplitude and different frequencies for the first 8.00 seconds of El-Centro earthquake
record scaled to 0.30 g and used as the base input acceleration (shown in figure.3). However,
the input motion was applied at 0.15g due to the larger values of initial effective stress at the
lower layers (Rahmani and Pak, 2012). The axial load was applied throughout the seismic
loading of 1100 KN (Fig. 4) and to simulate the increasing axial load due to equilibrium is
satisfied within the soil layers.
2.5 Damping
The second parameter required for FBSD is damping. Normally, in both verification and
dynamic analyses associated with viscous damping a ratio of 5% is typically used for the
Rayleigh type. There are two kinds of damping properties for soil dynamics that can be
Downloaded by [] on [15/11/17]. Published with permission by the ICE under the CC-BY license

Accepted manuscript doi: 10.1680/jgere.17.00009
10
considered, namely material damping and geometrical damping. Rayleigh damping is a
material damping that mass and stiffness are expressed by C, M and K respectively which are
represented by Eq.1.
C= αM+βK (1)
To determine the values for the Rayleigh damping ratio in Abaqus, the natural
frequencies of the soil structure system were modelled and then solved for constants α and β to
gives a viscous damping ratio ζ. The effects induced by soil liquefaction increase the damping
ratio, which can reach values as high as 20% (Lombardi, Bhattacharya, 2014).
2.6 Ductility
Ductility is defined as the ratio of the maximum displacement to the yield displacement (Eq.2).
μδ = δmax/δy (2)
Ductility in the FBSD is based on the inelastic response spectrum of a
single-degree-of-freedom system with elastic-perfectly plastic force-displacement curve
(Fardis, 2009). Ductility may be significantly lower in liquefaction conditions (Lombardi,
Bhattacharya, 2014). Displacement ductility demand is defined as the ratio of global frame
displacement demand to the yield displacement.
2.7 Material modelling
To accurately model a pile that is pushed through a soil profile containing a liquefied layer, it is
important to use a comprehensive constitutive model with a relatively high degree of resolution
Downloaded by [] on [15/11/17]. Published with permission by the ICE under the CC-BY license

Accepted manuscript doi: 10.1680/jgere.17.00009
11
to capture the interaction between the pile and the soil. Accordingly, the meshes of regions near
the liquefiable soils of the pile are comparatively more important. The vertical size mesh of the
soil and pile elements is of a somewhat larger scale at the boundaries, gradually decreasing into
the liquefied layer, with the smallest elements existing in the middle of that layer. Similarly, the
horizontal size of the soils elements is large at the boundaries of the model and becomes
smaller as the radial distance to the Centre of the pile decreases.
2.7.1 Modelling the pile
The piles in this study include one deep foundation reinforced concrete pile modelled using
beam-column elements. The pile model is based upon a template of a reinforced concrete pile.
The piles were selected such that they represent a reasonable variation in size and stiffness;
thus providing data that is relevant to the range of size and stiffness where most practical pile
designs fail. Precast piles typical in construction consisting of a 0.6 m2 in section, with lengths
of 9 and 12m, were modelled. Figures 5 and 6 show the scale model and scale section view of
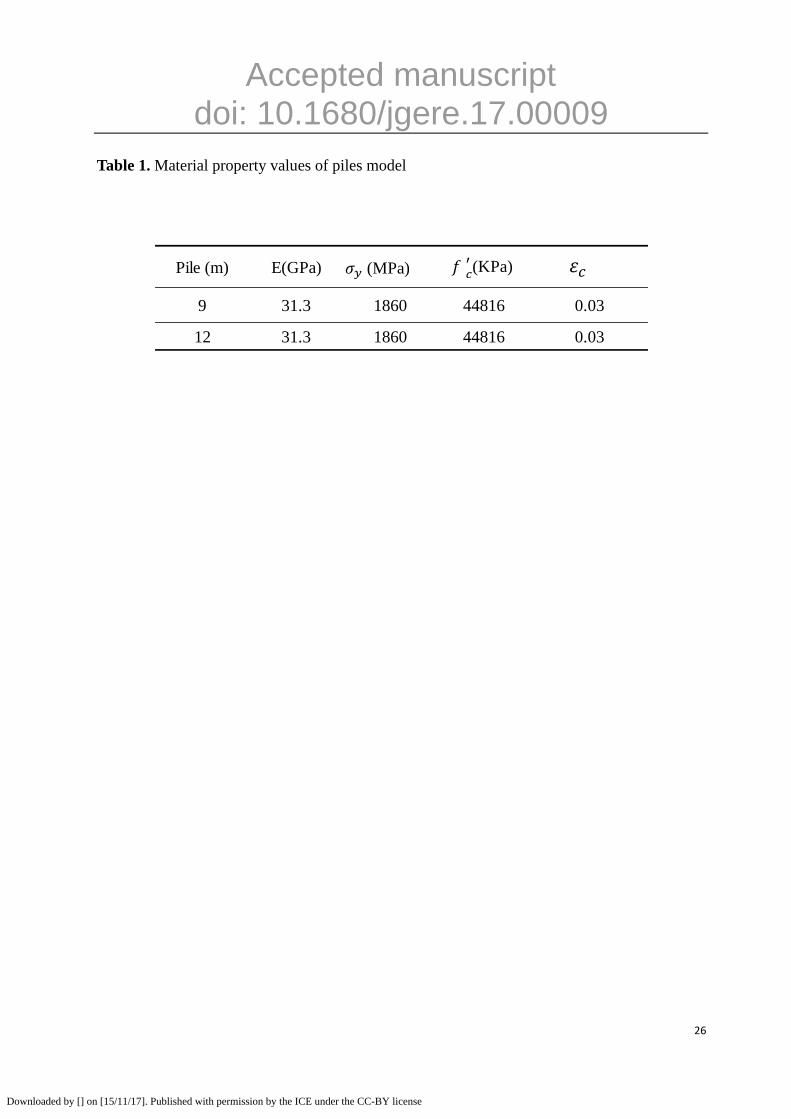
pile. The material property values of piles and raft models are provided in Tables 1 and 2
(Banerjee and Shirole, 2014).
2.7.2 Modelling the soil
In this study, three typical 3D models of soils surrounding the piles are considered, varying the
thicknesses of liquefied and non-liquefied layers and material properties to define how a pile
experiences a liquefaction phenomenon event. Appropriate values for the soil parameters were
Downloaded by [] on [15/11/17]. Published with permission by the ICE under the CC-BY license

Accepted manuscript doi: 10.1680/jgere.17.00009
12
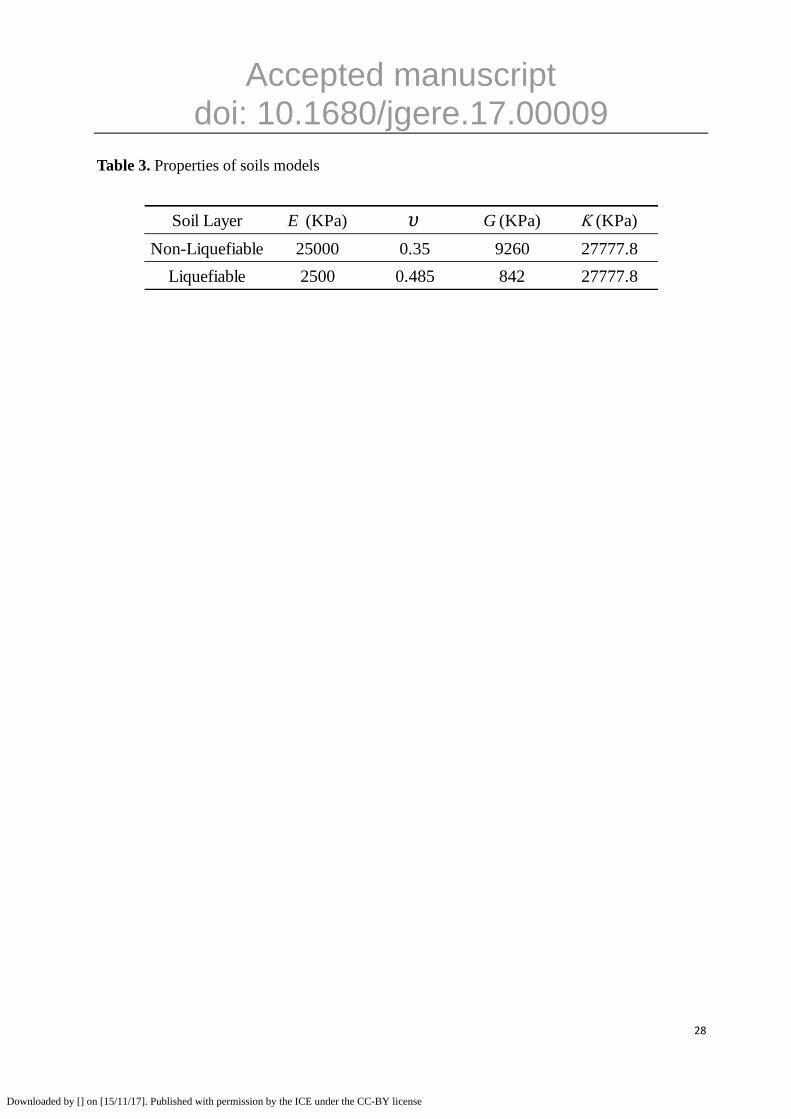
chosen from previous case histories (Sarkar, et al., 2014) to ensure valid result. The soil
parameters selected for the FE model are summarized in Tables 3 and 4.
During earthquakes, the pore water pressure increases in the liquefiable layer, thus
reducing the effective stress in the layer and subsequently the shear strength becomes
significantly smaller. As a result, the compressibility of the layer cannot change quite as
drastically. Therefore, the soil material parameters are selected based upon an assumption that
the bulk modulus, Ƙ, remains consistent throughout the soil mass and the Poisson’s ratio of
liquefiable soils is selected as υ = 0.485 (McGann, et al., 2012). Additionally, the
Mohr–Coulomb failure criterion is used to simulate the behaviour of soils (Helwany, 2007).
2.7.3 Modelling the soil-pile system
To model the interaction between the soils and pile the “surface-to-surface” contact method
was used. This system is called a “master-slave” surface, where the more deformable and more
rigid surfaces are defined as the “slave” and “master” surfaces respectively. This is well
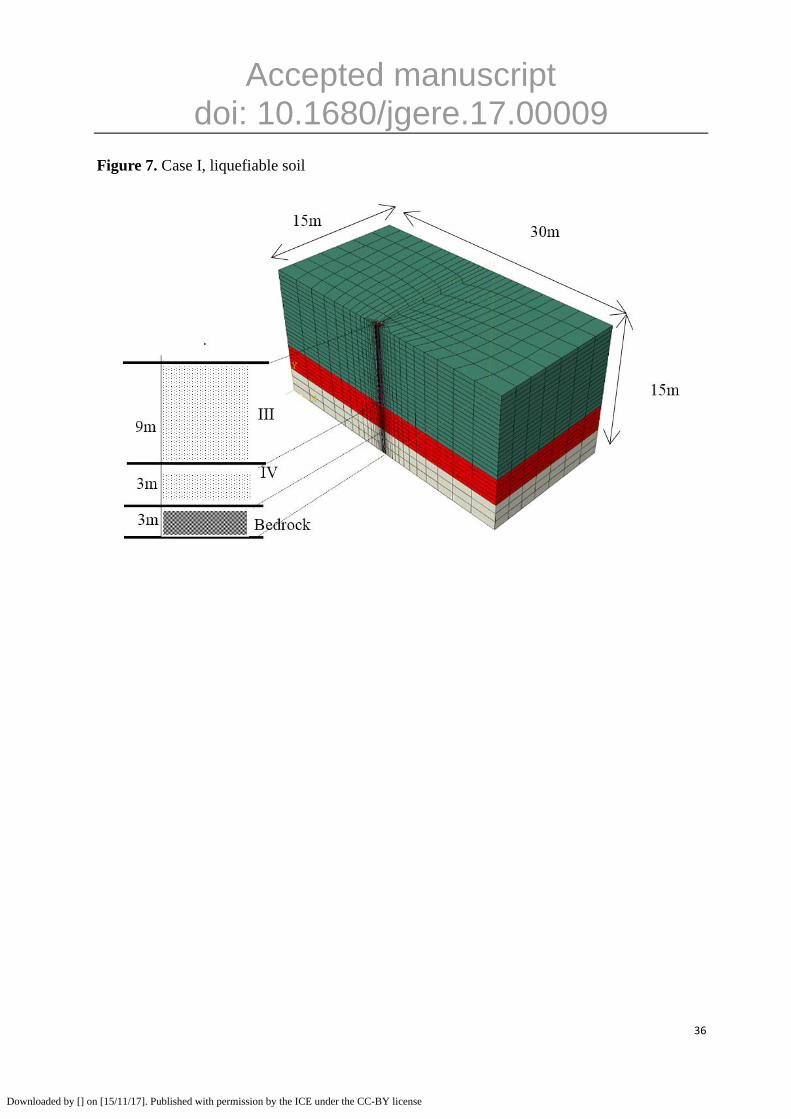
explained in Abaqus (Abaqus 6.12, 2012). The three models of soil profiles are shown in
figures 7 to 9.
2.8 Validation of models
In computer simulations, it is important to create validation models that behave in response to
verifiable loading conditions. In the first step, the validations for kinematic loading interaction
are carried out by using the study by Fan et al., (1991). This study has been conducted on the
3m
Downloaded by [] on [15/11/17]. Published with permission by the ICE under the CC-BY license

Accepted manuscript doi: 10.1680/jgere.17.00009
13
kinematic soil-pile interaction in the frequency domain. They defined two factors kinematic
displacement (Iu) and dimensionless frequency (a0), given by Eq. (3) and (4).
p
u
ff
UI
U (3)
Where Up = response of the top of the pile and Uff = amplitude of free field motion.
0
S
Da
V
(4)
Where ω=circular frequency of loading, D=pile diameter and vs=shear wave velocity of
soil.
The Fig. 10 show the result (at lower frequency) of the model was subjected to (a0=0.3g).
It can be seen that the result of 3D model is in good agreement with Fan et al. (1991).
In this study, for validation of combined kinematic and inertial interaction, the amplitude
of input bedrock motion was inputted at different frequencies compared with the frequency
response function (FRF) of Lombardi and Bhattacharya (2014). The FRF is a function which
describes the relationship between input (motion) and output (response) of structure and it is
considered in Abaqus by using frequency analysis. Figure 11 verifies that the results from the
3D model correlates with the empirical model.
In the next step, results of Blandon’s model pile response (Blandon, C.A, 2007) and
Winkler approach are used to demonstrate the capability of the model for reliable analysis of
piles. Blandon modeled 9m pile in soil layers same as case ІІ, and 0.60 m layer is assumed to
liquefy due to the seismic event. Also, Winkler method, as a standard and common method of
analysis is widely used in practice. Alp (Analysis of Laterally Loaded Piles) software which is
Downloaded by [] on [15/11/17]. Published with permission by the ICE under the CC-BY license

Accepted manuscript doi: 10.1680/jgere.17.00009
14
based on Winkler approach is used for modelling. As shown in Fig. 12, the result obtained from
the 3D FE model agrees reasonably well with the values recorded of Blandon’s model pile
response and Winkler approach.
3. Analysis of 3D FEM
In order to analyse seismic risk of pile-supported structures in liquefiable soils layers and
discuss the plastic hinges, a parametric study has been carried out on three different soil
profiles, varying boundary conditions of pile head, length and location of liquefying soil layer
along the pile. The seismic displacement method adopted in this research to evaluate the
soil-pile interaction of the liquefied soil analysis is normally performed in terms of pile
bending moments the use of nonlinear spring stiffness (p-y curves). However, the bending
moments could not be directly obtained from the ABAQUS output as the pile was modelled as
a solid element. This restriction may be overcome by adding a very flexible beam element
along the pile axis (Banerjee and Shirole, 2014).
3.1 Pile response
The pile response was governed by the respective material properties, length, free or fixed head
condition and the surrounding soil. The behaviour at each incremental point along the pile
length was observed. The deformed shape of the systems and the interaction between the soil
and the pile are shown in fig. 13, and also illustrates maximum bending moment in the pile in
all of the cases. From the deformed shape of the systems, it can be observed that the imposed
displacement profile puts the pile in bending. It can also shows that the non-liquefiable layers
Downloaded by [] on [15/11/17]. Published with permission by the ICE under the CC-BY license

Accepted manuscript doi: 10.1680/jgere.17.00009
15
of soil begins to displace laterally with respect to the liquefiable layer. However, the pile
provides resistance to this motion as the upper portion is pushed along with the flow of soil.
This behaviour was illustrated by the deformed shape of the systems. For Case І, the deformed
shape illustrates that the lateral stress distribution and the locations of the maximum bending
moment is likely to occur at middle of the pile at the depth of liquefiable soil, for both free and
fixed head piles. In Case ІІ, it can clearly be seen that in the lower solid layer, the pile pushed
into the soil at the interface with the liquefied soil layer. In the upper soil layer, it was observed
that the pile resists the ground motion at the interface with the liquefied layer and was pushed
into the soil at the pile head. Therefore, the locations of large bending moment are attained in
the soil layers at the boundaries of models. For Case ІІІ, the maximum of bending moment
invariably develops at the boundaries of liquefiable and non-liquefiable soil layer, similarly to
that of Case II. It is also can be concluded that the pile length has not effect on the location of
the maximum bending moment. According to the assumptions of soil parameters mentioned in
section 2.7.2, Fig.14 shows the excess pore water pressure generated near pile 5m deep of the
surface for Cases І, ІІ and ІІІ. It can be seen the different time history in each case.
3.2 Effects of pile head condition
Both free and fixed head pile condition were considered in this study, with the fixed head pile
simulating a rigid pile cap preventing the pile head from rotating. It is observed for all cases in
fig. 13, that the maximum moment demands of fixed piles head are greater than, or
approximately equal to, the demands resulting from the corresponding free-head cases.
Downloaded by [] on [15/11/17]. Published with permission by the ICE under the CC-BY license

Accepted manuscript doi: 10.1680/jgere.17.00009
16
3.3 Effects of pile length
Two different pile lengths (9 m and 12 m) were modelled. From Fig. 15 it can be seen that
longer piles experience larger displacements, as greater amounts of the longer pile is in contact
with the liquefiable soil. This affect, however, has relatively little effect. Another interesting
observation is that maximum lateral displacement decreases for the fixed head condition.
4. Results
The data obtained from the FE models performed in this research is used in this section to
demonstrate a capacity of the pile founded in liquefiable soils in terms of plastic hinge
development.
4.1 Plastic hinges
The FBSD for ductility is based on the inelastic response of spectral acceleration and the
maximum displacement demand expressed as a ratio to the yield displacement (Eq.2). Each
member is entrusted through “capacity design” for inelastic deformations and ability to
undergo dependable deformation in plastic hinge regions without experiencing brittle failure.
The minimum local displacement ductility capacity of μΔ = 3 was used, based on suggestions
of ATC-32 (1996) to ensure dependable rotational capacity in the plastic hinge regions
regardless of the displacement demand imparted to that member.
The analytical plastic hinge length is assumed constant for estimating Eq. 5 (Priestley et
al., 1996).
Downloaded by [] on [15/11/17]. Published with permission by the ICE under the CC-BY license

Accepted manuscript doi: 10.1680/jgere.17.00009
17
0.08 0.022 0.044y bl y blLp L f d f d (5)
Where L= distance from the critical section to the point contra flexure, fy = yield strength
and dbl = diameter of longitudinal reinforcing steel. Budek and Priestley (2000) suggested the
Eq 6. Where the *pL as function of above ground height and maximum of * 1.6pL m .
* * *
max0.1 1p a pL L L (6)
Where * /p pL L D and * /a aL L D .
The Caltrans (2006) also suggests the plastic hinge length can be calculated by following
Eq.7:
* *max0.08 1.0p oL H (7)
Where *max max/o oH H D , D=Diameter for circular shafts or the least cross section dimension
for oblong shafts and H0-max = Length of pile shaft/column from the point of maximum moment
to point of contra flexure above ground.
For the FE analyses, maximum curvature demand was determined as Eq.8:
max 1p y p
y y
(8)
Therefore, the plastic hinge length can be determined as Eq.9:
p pp
p m y
L
(9)
Downloaded by [] on [15/11/17]. Published with permission by the ICE under the CC-BY license
Accepted manuscript doi: 10.1680/jgere.17.00009
18
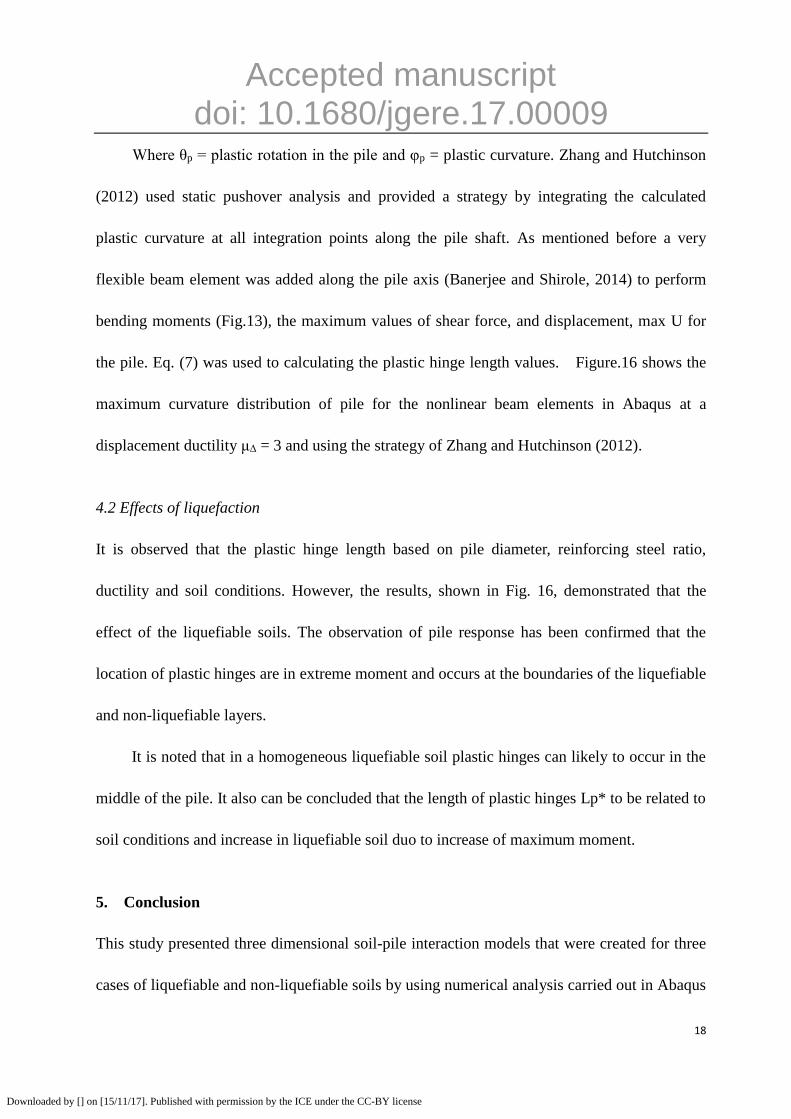
Where θp = plastic rotation in the pile and φp = plastic curvature. Zhang and Hutchinson
(2012) used static pushover analysis and provided a strategy by integrating the calculated
plastic curvature at all integration points along the pile shaft. As mentioned before a very
flexible beam element was added along the pile axis (Banerjee and Shirole, 2014) to perform
bending moments (Fig.13), the maximum values of shear force, and displacement, max U for
the pile. Eq. (7) was used to calculating the plastic hinge length values. Figure.16 shows the
maximum curvature distribution of pile for the nonlinear beam elements in Abaqus at a
displacement ductility μΔ = 3 and using the strategy of Zhang and Hutchinson (2012).
4.2 Effects of liquefaction
It is observed that the plastic hinge length based on pile diameter, reinforcing steel ratio,
ductility and soil conditions. However, the results, shown in Fig. 16, demonstrated that the
effect of the liquefiable soils. The observation of pile response has been confirmed that the
location of plastic hinges are in extreme moment and occurs at the boundaries of the liquefiable
and non-liquefiable layers.
It is noted that in a homogeneous liquefiable soil plastic hinges can likely to occur in the
middle of the pile. It also can be concluded that the length of plastic hinges Lp* to be related to
soil conditions and increase in liquefiable soil duo to increase of maximum moment.
5. Conclusion
This study presented three dimensional soil-pile interaction models that were created for three
cases of liquefiable and non-liquefiable soils by using numerical analysis carried out in Abaqus
Downloaded by [] on [15/11/17]. Published with permission by the ICE under the CC-BY license

Accepted manuscript doi: 10.1680/jgere.17.00009
19
in terms of plastic hinge development. A reinforced concrete pile was located in the middle of
the soil system carrying both axial and (El-Centro earthquake record) earthquake loading. In
each case, the effect of pile length, fixity of the pile head, the thickness and location of the
liquefying soil layer were investigated. The result of this study were purely based on numerical
simulation, therefore to ensure appropriate values both pile and soil parameters were chosen
from previous case histories. The soil response obtained from the soil-pile interaction models
was performed through the (p - y) curves and described. A summary of the work and
conclusions of this research are presented below.
For Case II and III the locations of large bending moment were attained at the interface of
liquefiable and non-liquefiable layers.
It as shown that in Case І the maximum bending moment was likely to occur at middle of
the pile on the depth of liquefiable soil for both free and fixed head piles. For all three cases, it
was concluded that pile length and the thickness of liquefiable layer had little influence on the
maximum lateral displacements. It was also shown that the pile length has no effect on the
location of the maximum bending moment.
Soil conditions determine the location of plastic hinges, usually at the location of
maximum moment or at the boundaries between liquefiable and non-liquefiable layers.
However, the location of plastic hinges can be affected by a variety of factors such as material
properties, pile length and thickness of the liquefying soil layer. It was also found that the
length of plastic hinges Lp* were related to soil conditions and increase in liquefiable soil
depth duo to increase of maximum moment.
Downloaded by [] on [15/11/17]. Published with permission by the ICE under the CC-BY license

Accepted manuscript doi: 10.1680/jgere.17.00009
20
References
ABAQUS (2012). User’s Manual – Standard version 6.12, Inc.
Abdoun, T. H and Dobry, R. (2002). Evaluation of pile foundation response to lateral
spreading. Soil Dynamics and Earthquake Engineering, No 22, pp 1051-1058.
AIJ. (2001). Recommendations for design of building foundations. Architectural Institute of
Japan, (in Japanese).
Applied Technology Council (ATC) (1996). Improved seismic design criteria for California
bridges: provisional recommendations, Reportno.ATC-32, Redwood City, CA; 1996.
Banerjee S and Shirole O (2014), Numerical analysis of piles under cyclic lateral load. Indian
Geotech J (October–December 2014) 44(4):436–448.
Blandon, C.A. (2007), Seismic Analysis and Design of Pile Supported Wharves, A Thesis
Submitted in partial fulfillment of the requirements for the Degree of Doctor of
Philosophy in Earthquake Engineering, University of California San Diego.
Budek AM, Priestley MJN, Benzoni G. (2000). Inelastic seismic response of bridge
drilled-shaft RC pile/columns. Journal of Structural Engineering 2000; 126(4):510–7.
Bhattacharya S (2003), Pile instability during earthquake liquefaction. PhD thesis, University
of Cambridge, UK.
Bhattacharya S, Madabhushi SPG, Bolton MD (2004). An alternative mechanism of pile failure
in liquefiable deposits during earthquakes. Geotechnique 54(3):203–213.
Bhattacharya, S., Bolton, M. D., & Madabhushi, S. P. G. (2005). A reconsideration of the safety
of the piled bridge foundations in liquefiable soils. Soils and Foundations, 45(4), 13–26.
Downloaded by [] on [15/11/17]. Published with permission by the ICE under the CC-BY license

Accepted manuscript doi: 10.1680/jgere.17.00009
21
Bhattacharya S, Madabhushi SPG (2008). A critical review of methods for pile design in
seismically liquefiable soils. Bull Earthq Eng 6:407–446.
Bhattacharya S, Goda K (2013). Probabilistic buckling analysis of axially loaded piles in
liquefiable soils. Soil Dyn Earthq Eng 45:13–24.
Booth, E, (1994). Concrete Structures in Earthquake Regions, 1th edn, Longman Scientific,
Harlow, UK.
BTL Committee (2000) Study on liquefaction and lateral spreading in the 1995
Hyogoken-Nambu earthquake, Building Research Report No 138. Building Research
Institute, Ministry of Construction, Japan (in Japanese).
California Department of Transportation (Caltrans) (2006). Seismic Design Criteria,
Sacramento, CA.
Dash S, Bhattacharya S, Blakeborough A., (2010) Bending buckling interaction as a failure
mechanism of piles in liquefiable soils. Soil Dyn Earthq Eng 30:32–39.
Dash S, Rouholamin M, Lombardi D, Bhattacharya S, (2017). A practical method for
construction of p-y curves for liquefiable soils. Soil Dyn Earthq Eng 97 (2017) 478–481.
Dobry, R., Taboada, V. & Liu, L. (1995). Centrifuge modelling of liquefaction effects during
earthquakes, in `Proc. 1st Intl. Conf. On Earthquake Geotechnical Engineering, IS Tokyo',
14-16.
Eurocode 8 (2004). Design of structures for earthquake resistance—Part 1: General rules,
seismic actions and rules for buildings. CEN: Brussels, Belgium.
Fan, K., Gazetas, G., Kaynia, K., Kausel, E., Ahmad, S., (1991). Kinematic Seismic Response
Downloaded by [] on [15/11/17]. Published with permission by the ICE under the CC-BY license

Accepted manuscript doi: 10.1680/jgere.17.00009
22
of Single Piles and Pile Groups. Journal of Geotechnical Engineering, 117(12): p.
1860-1879.
Finn WDL, Fujita N (2002) Seismic Design, Assessment and Retrofitting of Concrete Buildings.
Soil Dyn Earthq Eng 22:731–742.
Faridis, MN., (2009). WDL, Fujita N (2002) Piles in liquefiable soils: seismic analysis and
design issues. Springer. DOI 10.1007/978-1-4020-9842-0.
Goh, S., O’Rourke, T. (1999). Limit state model for soil–pile interaction during lateral spread.
Proc. of 7th US Japan workshop on earthquake resistant design of lifeline facilities and
countermeasures against soil liquefaction. Seattle, WA.
Hamada M. (1992). Large ground deformations and their effects on lifelines in M. Hamada
and T.D. O’Rourke (eds), Case studies of liquefaction and lifeline performance during
past earthquakes, Japanese Case Studies, Technical Report NCEER-92-0001, Vol.1.
Hetényi M. (1946). Beams on Elastic Foundation. Theory with Applications in the Fields of
Civil and Mechanical Engineering. The University of Michigan Press: Ann Arbor, 1946.
Helwany S, (2007). Applied soil mechanics with ABAQUS applications John Wiley & Sons,
Inc.; Canada, 2007.
Han JT, Kim SR, Hwang JI and Kim MM, (2007), Evaluation of the dynamic characteristic of
soil pile system in liquefiable ground by shaking table tests. 4th International Conference
on Earthquake Geotechnical Engineering; No. 1340.
Ishihara K (1997) Terzaghi oration: geotechnical aspects of the 1995 Kobe earthquake. In:
Proceedings of ICSMFE. Hamburg, pp 2047–2073.
Downloaded by [] on [15/11/17]. Published with permission by the ICE under the CC-BY license

Accepted manuscript doi: 10.1680/jgere.17.00009
23
JRA (2002) Japanese Road Association, Specification for highway bridges, part V, seismic
design.
Kramer, S.L., (2014), Performance-Based Design Factors for Pile Foundations. WSDOT
Research Report; WA-RD 827.1.
Lombardi D, Bhattacharya S, (2014), Modal analysis of pile-supported structures during
seismic liquefaction. Earthquake Engineering & Structural Dynamics 2014;
43(1):119–138.
Lombardi, D, Bhattacharya, S, (2016), Evaluation of seismic performance of pile-supported
models in liquefiable soils, Engineering & Structural Dynamics 2016; 45:1019–1038.
McGann CR, Arduino P, Helnwein PM, (2012). Development of Simplified Analysis Procedure
for Piles in Laterally Spreading Layered Soils, Pacific Earthquake Engineering Research
Center, PEER Report 2012/05.
Maheshwari, B. K., & Sarkar, R. (2011). Seismic behaviour of soilpile- structure interaction in
liquefiable soils: A parametric study. International Journal of Geomechanics, ASCE,
11(4), 335–347.
National Earthquake Hazards Reduction Program (NEHRP) (2000). Commentary (Federal
Emergency Management Agency, USA, 369) for seismic regulations for new buildings
and other structures.
Priestley MJN, Seible F, Calvi G. (1996). Seismic Design and Retrofit of bridges. New York:
Wiley.
Rahmani, A, Pak, A, (2012). Dynamic behaviour of pile foundations under cyclic loading in
Downloaded by [] on [15/11/17]. Published with permission by the ICE under the CC-BY license
Accepted manuscript doi: 10.1680/jgere.17.00009
24
liquefiable soils, Computers and Geotechnics 40 (2012) 114–126.
Sarkar, R, Bhattacharya, S, Maheshwari, B. K., (2014). Seismic Requalification of Pile
Foundations in Liquefiable Soils, Indian Geotech J. 44(2):183–195.
RTRI. (1999). Design standard for railway facilities-seismic design. Tokyo: Railway Technical
Research Institute.
Rollins, K. M., Gerber, T. M., Lane, J. D., & Ashford, S. A. (2005). Lateral resistance of a
full-scale pile group in liquefied sand. Journal of Geotechnical and Geoenvironmental
Engineering, ASCE, 131, 115–125.
Sarkar, R., & Maheshwari, B. K. (2012). Effects of separation on the behaviour of soil-pile
interaction in liquefiable soils. International Journal of Geomechanics, ASCE, 12(1),
1–13.
Sarkar, R., Bhattacharya S, Maheshwari, B. K. (2014). Seismic requalification of pile
foundations in liquefiable soils. Indian Geotech J (April–June 2014) 44(2):183–195.
Takahashi, A., Kuwano, Y., & Yano, A. (2002). Lateral resistance of buried cylinder in
liquefied sand. Proceedings of the International Conference on physical modelling in
geotechnics, ICPMG-02, St. John’s, Newfoundland, Canada.
Tokimatsu K, Asaka Y (1998) Effects of liquefaction-induced ground displacements on pile
performance in the 1995 Hyogeken-Nambu earthquake. Special issue of soils and
foundations, pp 163–177, Sep 1998.
Yoshida N, Hamada M. (1990), Damage to foundation piles and deformation pattern of ground
due to liquefaction induced permanent ground deformation. Proc. 3rd Japan-US
Downloaded by [] on [15/11/17]. Published with permission by the ICE under the CC-BY license

Accepted manuscript doi: 10.1680/jgere.17.00009
25
Workshop on Earthquake Resistant design of lifeline facilities and countermeasures for
soil liquefaction 1990; 147–161.
Yasuda, S., Terauchi, T., Morimoto, H., Erken, A. & Yoshida, N. (1998). Post liquefaction
behaviour of several sand, 11th European Conference on Earthquake Engineering,
Balkema, Rotterdam.
Zhang J., Hutchinson TC. (2012). Inelastic pile behaviour with and without liquefaction effects.
Soil Dynamics and Earthquake Engineering; 128(5):595–602.
Downloaded by [] on [15/11/17]. Published with permission by the ICE under the CC-BY license
Accepted manuscript doi: 10.1680/jgere.17.00009
26
Table 1. Material property values of piles model
Pile (m) E(GPa)
9 31.3 1860 44816 0.03
12 31.3 1860 44816 0.03
(KPa) (MPa)
Downloaded by [] on [15/11/17]. Published with permission by the ICE under the CC-BY license

Accepted manuscript doi: 10.1680/jgere.17.00009
27
Table 2. Properties of Piles and Raft Models
Pile (m) Pile Poisson’s ratio Modulus of elasticity (kN/m2) Unit weight (kN/m
3)
9 0.15 30 × 106 24
12 0.15 30 × 106 24
Raft 0.2 25 × 106 23.5
Steel material 0.3 200 × 106 78.5
Downloaded by [] on [15/11/17]. Published with permission by the ICE under the CC-BY license
Accepted manuscript doi: 10.1680/jgere.17.00009
28
Table 3. Properties of soils models
Soil Layer E (KPa) G (KPa) Ƙ (KPa)
Non-Liquefiable 25000 0.35 9260 27777.8
Liquefiable 2500 0.485 842 27777.8
Downloaded by [] on [15/11/17]. Published with permission by the ICE under the CC-BY license

Accepted manuscript doi: 10.1680/jgere.17.00009
29
Table 4. Soils parameters
Layer no. Basic description γ (kN/m3) Cohesion, cu (kPa) Friction angle, Φ (°)
I Soft silty clay 19.1 40.0
II Soft clayey silt 18.2 23.0
III Loose sandy silt 18.0 28.0
IV Medium dense silty sand 19.0 30.0
V Stiff clayey silt 18.4 49.0
VI Medium dense silty sand 19.0 32.0
Zo
ne
Liq
uef
aib
le
Downloaded by [] on [15/11/17]. Published with permission by the ICE under the CC-BY license

Accepted manuscript doi: 10.1680/jgere.17.00009
30
Figure 1. Pile damage of a building in Niigata City (Yoshida and Hamada, 1990, Bhattacharya
and Madabhushi, 2008)
Downloaded by [] on [15/11/17]. Published with permission by the ICE under the CC-BY license

Accepted manuscript doi: 10.1680/jgere.17.00009
31
Figure 2. Deformed shape for fixed head of case ΙΙ
Downloaded by [] on [15/11/17]. Published with permission by the ICE under the CC-BY license

Accepted manuscript doi: 10.1680/jgere.17.00009
32
Figure 3. Acceleration record of El-Centro (1940) earthquake
Downloaded by [] on [15/11/17]. Published with permission by the ICE under the CC-BY license

Accepted manuscript doi: 10.1680/jgere.17.00009
33
Figure 4. Increase axial load, P, over time
Downloaded by [] on [15/11/17]. Published with permission by the ICE under the CC-BY license

Accepted manuscript doi: 10.1680/jgere.17.00009
34
Figure 5. Details of the pile
Downloaded by [] on [15/11/17]. Published with permission by the ICE under the CC-BY license

Accepted manuscript doi: 10.1680/jgere.17.00009
35
Figure 6. Cross sections of concrete piles
Downloaded by [] on [15/11/17]. Published with permission by the ICE under the CC-BY license
Accepted manuscript doi: 10.1680/jgere.17.00009
36
Figure 7. Case І, liquefiable soil
Downloaded by [] on [15/11/17]. Published with permission by the ICE under the CC-BY license

Accepted manuscript doi: 10.1680/jgere.17.00009
37
Figure 8. Case ІІ, liquefiable layer between non –liquefiable layers
Downloaded by [] on [15/11/17]. Published with permission by the ICE under the CC-BY license

Accepted manuscript doi: 10.1680/jgere.17.00009
38
Figure 9. Case ІІІ, upper layer is liquefiable soil
Downloaded by [] on [15/11/17]. Published with permission by the ICE under the CC-BY license

Accepted manuscript doi: 10.1680/jgere.17.00009
39
Figure 10. Verification of kinematic loading
Downloaded by [] on [15/11/17]. Published with permission by the ICE under the CC-BY license

Accepted manuscript doi: 10.1680/jgere.17.00009
40
Figure 11. Dynamic verification for pile-head response
Downloaded by [] on [15/11/17]. Published with permission by the ICE under the CC-BY license

Accepted manuscript doi: 10.1680/jgere.17.00009
41
Figure 12. Verification for results
Downloaded by [] on [15/11/17]. Published with permission by the ICE under the CC-BY license

Accepted manuscript doi: 10.1680/jgere.17.00009
42
Figure 13. Deformed shape and maximum bending moment (kN.m) for both free and fixed
head pile in cases 1 to 3
Downloaded by [] on [15/11/17]. Published with permission by the ICE under the CC-BY license

Accepted manuscript doi: 10.1680/jgere.17.00009
43
Figure 14. Pressure generated near pile (Cases І, ІI and ІІІ of pile fixed head)
Downloaded by [] on [15/11/17]. Published with permission by the ICE under the CC-BY license

Accepted manuscript doi: 10.1680/jgere.17.00009
44
Figure 15. Maximum displacement cm (Cases І)
Downloaded by [] on [15/11/17]. Published with permission by the ICE under the CC-BY license

Accepted manuscript doi: 10.1680/jgere.17.00009
45
Figure 16. Pile maximum curvature distribution (1/m)
Downloaded by [] on [15/11/17]. Published with permission by the ICE under the CC-BY license