accelerating profitable growth singh svp – chief information officer kathryn caulfield vp –...
TRANSCRIPT
Accelerating Profitable Growth

Benno Dorer Chief Executive Officer

Key Messages
• Staying on Strategy 2020 as it is producing strong shareholder returns
• Investments in profitable growth are beginning to show positive
results
• Strategy 2020 Accelerators and continued strong execution to
make accelerated growth sustainable

Agenda for the Day
Strategy 2020 Update & Accelerators………………….. 9:00am - 10:30am
Break……………………………………………………... 10:30am - 10:50am
Profitable Growth Execution……………………………….. 10:50am - Noon
Lunch/Q&A……………………………………………………. Noon - 1:00pm

Clorox Presenters
• Strategy 2020 Update Benno Dorer
• Portfolio Momentum Nick Vlahos
• 3D Innovation Denise Garner
• 3D Technology Transformation Eric Reynolds
• Growth Culture Benno Dorer
• Winning With Retailers Matt Laszlo
• Innovation Behind Value Dawn Willoughby & Nick Vlahos
• Creating Value in International Dawn Willoughby
• Financial Update Steve Robb
• Closing Benno Dorer
Acce
lera
tion
Exe
cu
tio
n

Other Clorox Management in Attendance
James Foster EVP – Product Supply, Enterprise Performance, & IT
Jacqueline Kane EVP – Human Resources & Corporate Affairs
Laura Stein EVP – General Counsel
Jon Balousek SVP & General Manager – Household & Lifestyle
Manjit Singh SVP – Chief Information Officer

Kathryn Caulfield VP – Corporate Communications & Responsibility
Chip Conradi VP – Tax & Treasury
Kevin Jacobsen VP – Financial Planning and Analysis
Steve Austenfeld VP – Investor Relations
Landon Dunn Sr. Manager – Investor Relations
Other Clorox Management in Attendance

Clorox Board of Directors in Attendance
Dr. Richard Carmona Vice Chairman, Canyon Ranch and 17th Surgeon General of the United States
Jeffrey Noddle Retired Executive Chairman, SuperValu Inc.
Pamela Thomas-Graham Chief Marketing & Talent Officer – Head of Banking and Wealth Management New Markets, Credit Suisse

Safe Harbor
Except for historical information, matters discussed in this presentation, including statements about the success of the Company’s future
volume, sales, costs, cost savings, earnings, foreign currencies, and foreign currency exchange rates, cash flows, plans, objectives, expectations,
growth or profitability, are forward-looking statements based on management’s estimates, assumptions and projections. Important factors
that could affect performance and cause results to differ materially from management’s expectations are described in the Company’s most
recent Form 10-K filed with the SEC, as updated from time to time in the Company's SEC filings. Those factors include, but are not limited to,
risks related to competition in the Company’s markets; economic conditions and financial market volatility; the Company’s ability to drive sales
growth and increase market share; international operations, including price controls, foreign currency fluctuations, labor claims and labor
unrest, potential harm and liabilities from use, storage and transportation of chlorine in certain markets and discontinuation of operations in
Venezuela; volatility and increases in commodity, energy and other costs; supply disruptions; dependence on key customers; government
regulations; political, legal and tax risks; information technology security breaches or cyber attacks; risks relating to acquisitions, new ventures
and divestitures; the success of the Company’s business strategies and products; product liability claims, labor claims and other legal
proceedings; the Company’s business reputation; environmental matters; the Company’s ability to assert and defend its intellectual property
rights; and the impacts of potential stockholder activism.
The Company may also use non-GAAP financial measures, which could differ from reported results using Generally Accepted Accounting
Principles (GAAP). The most directly comparable GAAP financial measures and reconciliation to non-GAAP financial measures are set forth in
the Appendix hereto, the Supplemental Schedules of the Company’s quarterly financial results and in the Company’s SEC filings, including its
Form 10-K and its exhibits furnished to the SEC, which are posted at www.TheCloroxCompany.com in the Investors/Financial
Information/Financial Results and SEC Filings sections, respectively.

International : 19% Cleaning : 32%
Household : 32% Lifestyle : 17%
Home Care 17%
Laundry 10%
PPD 5%
Glad 15%
Litter 6%
Charcoal 11%
Food 9%
Brita 4%
Burt's Bees 4%
International 19%
Over 80% of Sales Are Generated From Brands
With a #1 or #2 Share Position (FY15 Sales: $5.7B)
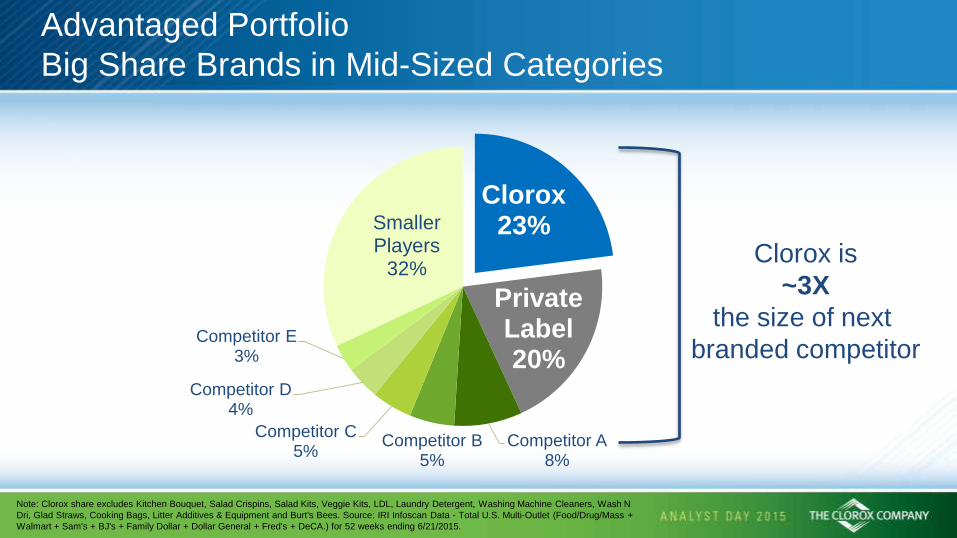
Advantaged Portfolio
Big Share Brands in Mid-Sized Categories
Clorox 23%
Private Label 20%
Competitor A 8%
Competitor B 5%
Competitor C 5%
Competitor D 4%
Competitor E 3%
Smaller Players
32% Clorox is
~3X
the size of next
branded competitor
Note: Clorox share excludes Kitchen Bouquet, Salad Crispins, Salad Kits, Veggie Kits, LDL, Laundry Detergent, Washing Machine Cleaners, Wash N
Dri, Glad Straws, Cooking Bags, Litter Additives & Equipment and Burt's Bees. Source: IRI Infoscan Data - Total U.S. Multi-Outlet (Food/Drug/Mass +
Walmart + Sam's + BJ's + Family Dollar + Dollar General + Fred's + DeCA.) for 52 weeks ending 6/21/2015.

Portfolio with Significant Synergies
Over 80% of our portfolio has #1 or #2 share
Lower SG&A as a % of Sales vs. Peers(1)
Top tertile ROIC
Strong cash flow
Customer
Scaled teams,
capabilities, and
broker network
Supply Chain
Scale across Buy,
Make, Ship
Brand Building
Common consumer
trends, insights, 3D
demand creation
Health & Wellness Sustainability Fragmentation Affordability
(1) As of June 30th, 2015, Clorox’s S&A/Sales was ~14% vs. peer average of 21% . This number does not include R&D or marketing expenses and excludes peers that do
not disclose S&A separately from SG&A in their reported financial statements (Kimberly-Clark, Reckitt-Benckiser). Peer group consists of CHD, CL, PG, ENR, CPB, GIS,
HSY, K, KRFT, KO, PEP, TAP, AVP, EL, KMB, RB-GB. See Slide 184 for details.
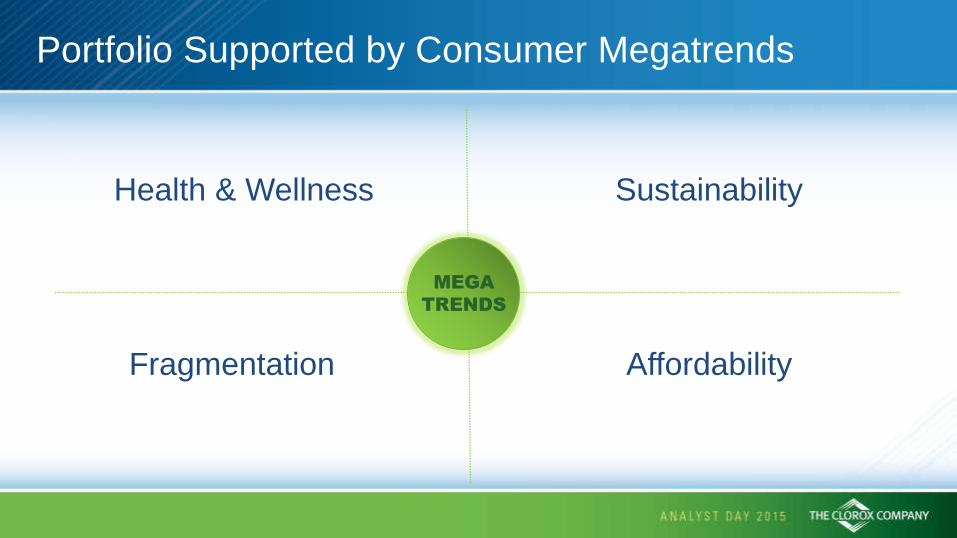
Portfolio Supported by Consumer Megatrends
Health & Wellness Sustainability
Affordability Fragmentation
MEGA
TRENDS

Source: Nielsen Ad Intel as of May, 2015. Data range is Jan 1, 2014 through Dec 31, 2014
#1 Share of Voice Across Most Categories
100% 100%
51%
81%
100%
53%
24% 26%
19% 21%
31% 30%
0%
20%
40%
60%
80%
100%
Bleach Wipes Bottled SaladDressing
Trash Charcoal Brita Pour-Thru
Cat Litter
Clorox Competitor #1 Competitor #2

+954%
+451%
+734%
0
200
400
600
800
1,000
Jun95
Jun97
Jun99
Jun01
Jun03
Jun05
Jun07
Jun09
Jun11
Jun13
Jun15
CLX S&P 500 Peer Companies Average
Total Shareholder Return 20 Year Ending 6/30/2015
TSR %
Over 2x the S&P 500!
Strong Shareholder Return

We Have Delivered a Strong FY15
$5,533 $5,514
$5,655
FY13 FY14 FY15
FY15
+3% Sales Growth (+5% Currency Neutral)
$4.31
$4.39
$4.57
FY15 FY14 FY13
FY15
+4% EPS Growth

FY15 Success Factors
Focus on Core
Increased Demand
Investment
Investments in
Innovation

Market Share is Responding
Last 24 Months
-0.4pts
Last 12 Months
Flat
Last 3 Months
+0.3pts
Note: Clorox share excludes Kitchen Bouquet, Salad Crispins, Salad Kits, Veggie Kits, LDL, Laundry Detergent, Washing Machine Cleaners, Wash N
Dri, Glad Straws, Cooking Bags, Litter Additives & Equipment and Burt's Bees. Source: IRI Infoscan Data - Total U.S. Multi-Outlet (Food/Drug/Mass +
Walmart + Sam's + BJ's + Family Dollar + Dollar General + Fred's + DeCA.) for 13 wk, 52 wk, and 24 mo ending 6/21/2015.
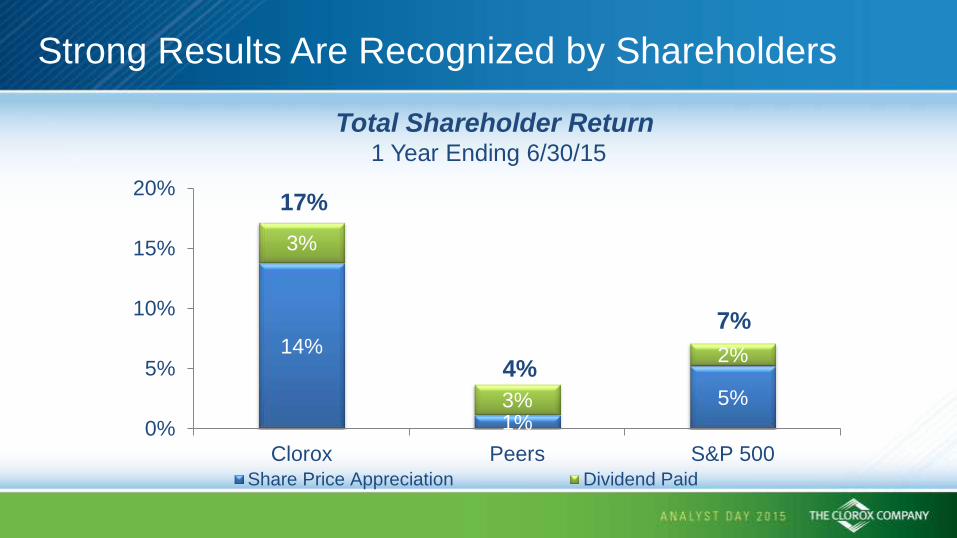
14%
1% 5%
3%
3%
2%
0%
5%
10%
15%
20%
Clorox Peers S&P 500Share Price Appreciation Dividend Paid
17%
7%
4%
Total Shareholder Return 1 Year Ending 6/30/15
Strong Results Are Recognized by Shareholders
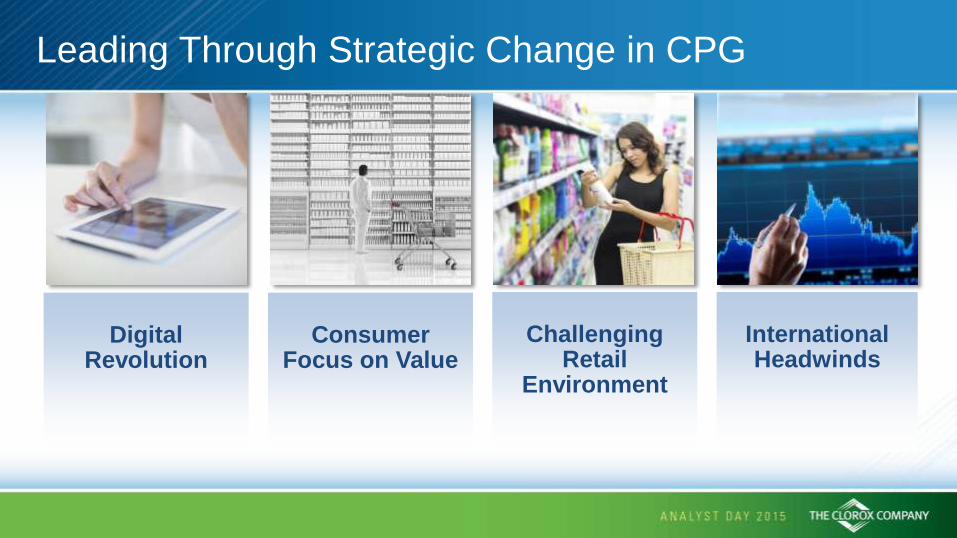
Leading Through Strategic Change in CPG
Digital
Revolution
Consumer
Focus on Value
Challenging
Retail Environment
International Headwinds

2020 Strategy
• We make everyday life better, every day
Objectives • Maximize economic profit
• Big-share brands in midsized categories and countries
• Engage our people as business owners
• Increase brand investment behind superior value and more targeted
3D plans
• Keep the core healthy and grow into new categories, channels, and
existing countries
• Reduce waste in work, products, and supply chain to fund growth
Mission
Strategy

Long-Term Growth Algorithm Remains Unchanged
~80% of Clorox Sales
+2-4% annual growth
1.5 - 3.0 pts
company growth
U.S. Domestic
~20% of Clorox Sales
+5-7% annual growth
1.0 - 1.5 pts
company growth
International
= 3 - 5 pts company growth
Annual EBIT Margin Improvement: +25 to 50 bps
Annual Free Cash Flow: 10% - 12% of Sales

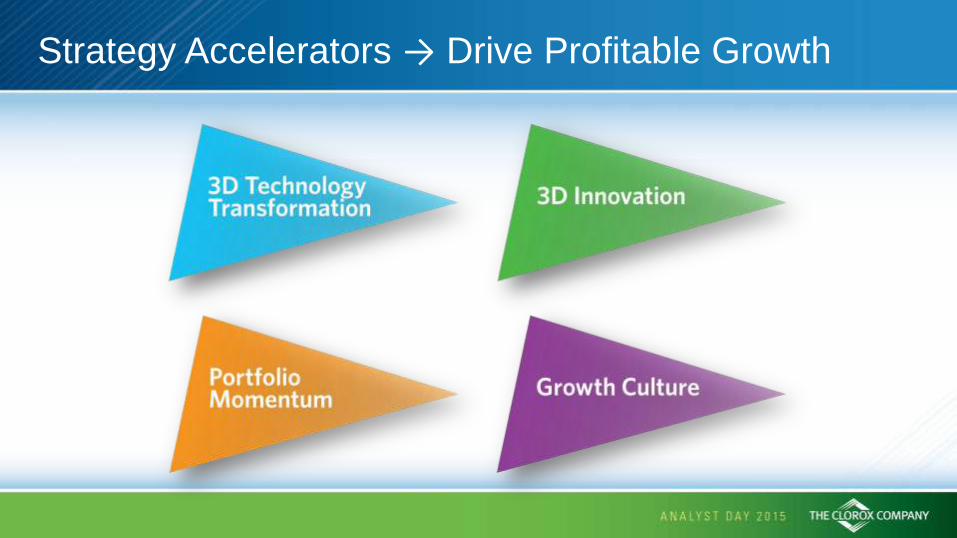
Strategy Accelerators → Drive Profitable Growth
2020 Goals
(Annual)

Accelerators in Action
Accelerate Investment Behind Digital
Consumer Value Measure
Innovation: Bigger, Faster, Longer
Growth & Fuel Brands

Nick Vlahos Chief Operating Officer Household, Lifestyle & Core Global Functions

Investing Behind Growth Tailwinds
Strategy
Strategy
Accelerators
• Portfolio Momentum
• 3D Innovation
• 3D Technology Transformation
• Growth Culture
• Engage our people as business owners
• Increase brand investment behind superior value and more targeted
3D plans
• Keep the core healthy and grow into new categories, channels, and
existing countries
• Reduce waste in work, products, and supply chain to fund growth

Key Messages
• Clorox will invest differentially behind our Growth Brands
• Fuel Brands will grow more profitably to support growth
• Increase demand investment to grow Household Penetration
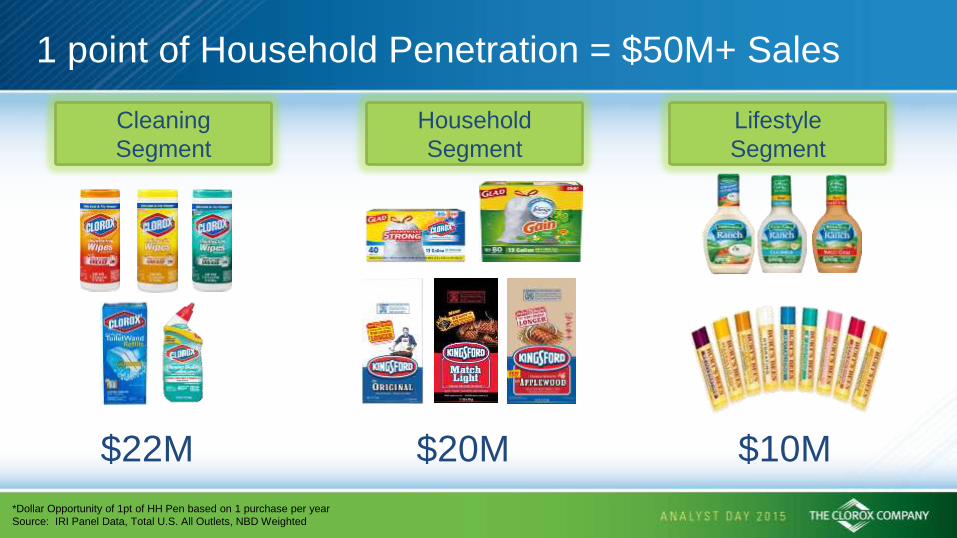
$22M $20M $10M
*Dollar Opportunity of 1pt of HH Pen based on 1 purchase per year
Source: IRI Panel Data, Total U.S. All Outlets, NBD Weighted
Cleaning
Segment
Household
Segment
Lifestyle
Segment
1 point of Household Penetration = $50M+ Sales
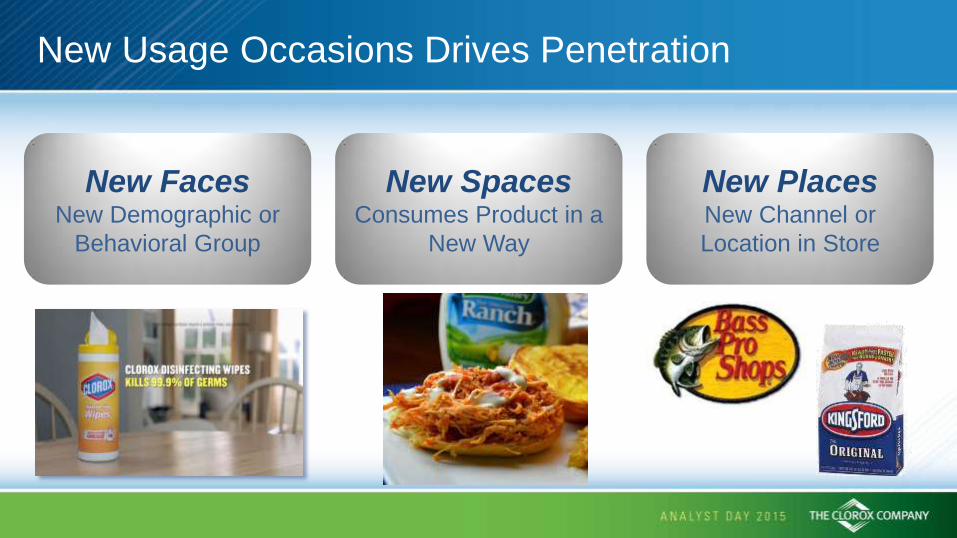
New Usage Occasions Drives Penetration
New Faces New Demographic or
Behavioral Group
New Spaces Consumes Product in a
New Way
New Places New Channel or
Location in Store
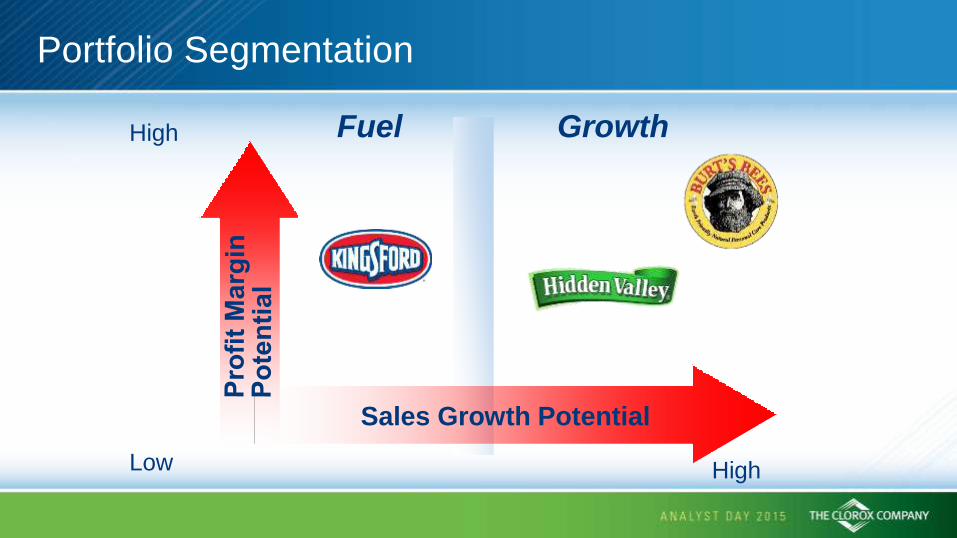
Portfolio Segmentation
Sales Growth Potential
High
Low High
Fuel Growth

Fuel Brand: Kingsford Charcoal
International : 19% Cleaning : 32%
Household : 32% Lifestyle : 17%
Home Care 17%
Laundry 10%
PPD 5%
Glad 15%
Litter 6%
Charcoal 11%
Food 9%
Brita 4%
Burt's Bees 4%
International 19%
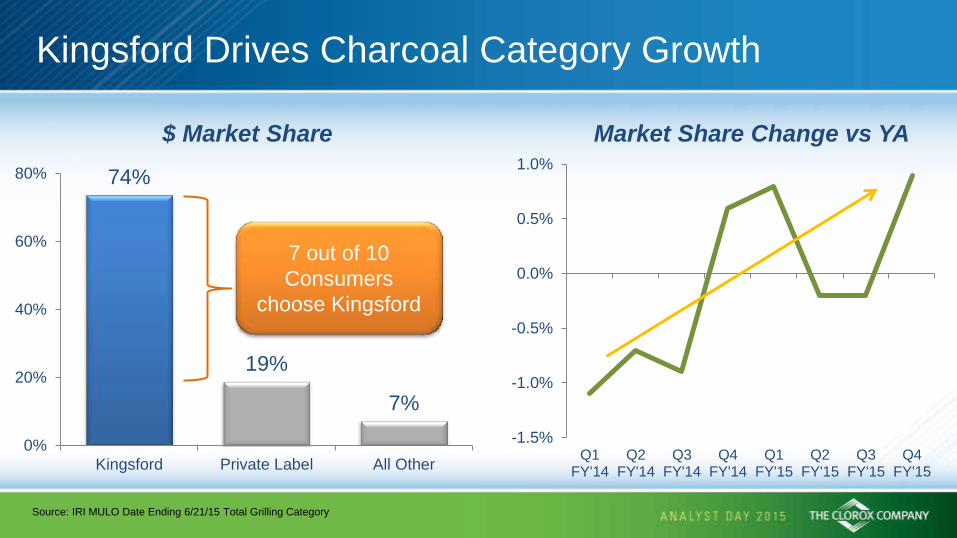
74%
19%
7%
0%
20%
40%
60%
80%
Kingsford Private Label All Other
$ Market Share
7 out of 10
Consumers
choose Kingsford
Source: IRI MULO Date Ending 6/21/15 Total Grilling Category
-1.5%
-1.0%
-0.5%
0.0%
0.5%
1.0%
Q1FY'14
Q2FY'14
Q3FY'14
Q4FY'14
Q1FY'15
Q2FY'15
Q3FY'15
Q4FY'15
Market Share Change vs YA
Kingsford Drives Charcoal Category Growth

Targeted
Demand Spend
Drive New
Usage Occasions
Expand Retail Distribution
Margin Enhancement through Operational Excellence
Profitable Growth With New Faces, Spaces & Places

Digital Execution Behind Seasonal Grilling Occasions

Growth Brand: Burt’s Bees
International : 19% Cleaning : 32%
Household : 32% Lifestyle : 17%
Home Care 17%
Laundry 10%
PPD 5%
Glad 15%
Litter 6%
Charcoal 11%
Food 9%
Brita 4%
Burt's Bees 4%
International 19%

Strong Foundation of Leadership
+8%
5 Year CAGR
120+
Items launched over past 3 yrs
Nearly 1/2
of new NPC sales over last
3 yrs
#1 Natural brand
26%
NPC Market Share
20%
of NPC Category Growth
Source: IRI MULO 52we 8-9-15; CAGR represents Domestic POS data including IRI + SPINS + WF; Brand Health Tracking 2014

Drive
Trial & Awareness on Core
Expand into Adjacencies
International Expansion
Growth With New Faces, Spaces & Places

Focus on Core → Fastest Growing Lip Balm
17%
7%
3%
-2%
-10%
0%
10%
20%
Burt's Bees Chapstick Blistex EOS
Retail Dollars vs Year Ago Latest 6 months
Source: IRI MULO 26wk Ending 6/21/15

Expanding Into Lip Color & Face Care
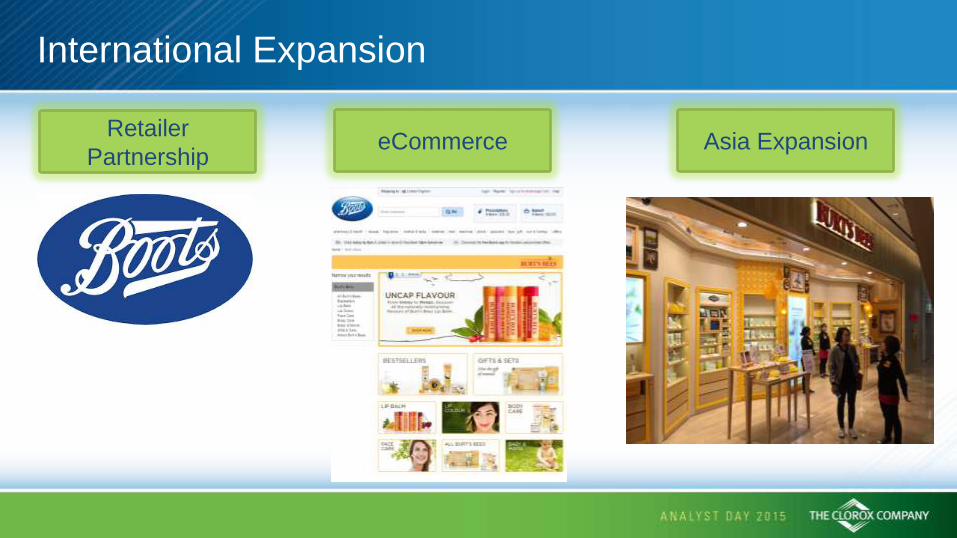
International Expansion
Retailer
Partnership eCommerce Asia Expansion

Growth Brand: Food
International : 19% Cleaning : 32%
Household : 32% Lifestyle : 17%
Home Care 17%
Laundry 10%
PPD 5%
Glad 15%
Litter 6%
Charcoal 11%
Food 9%
Brita 4%
Burt's Bees 4%
International 19%

22%
15% 13%
0%
10%
20%
30%
Hidden Valley Kraft Private Label
$ Market Share
Source: IRI MULO Date Ending 6/21/15 Total Salad Dressing
-0.5%
0.0%
0.5%
1.0%
Q1FY'14
Q2FY'14
Q3FY'14
Q4FY'14
Q1FY'15
Q2FY'15
Q3FY'15
Q4FY'15
Share Change vs YA
Hidden Valley Is the #1 Salad Dressing and Growing…
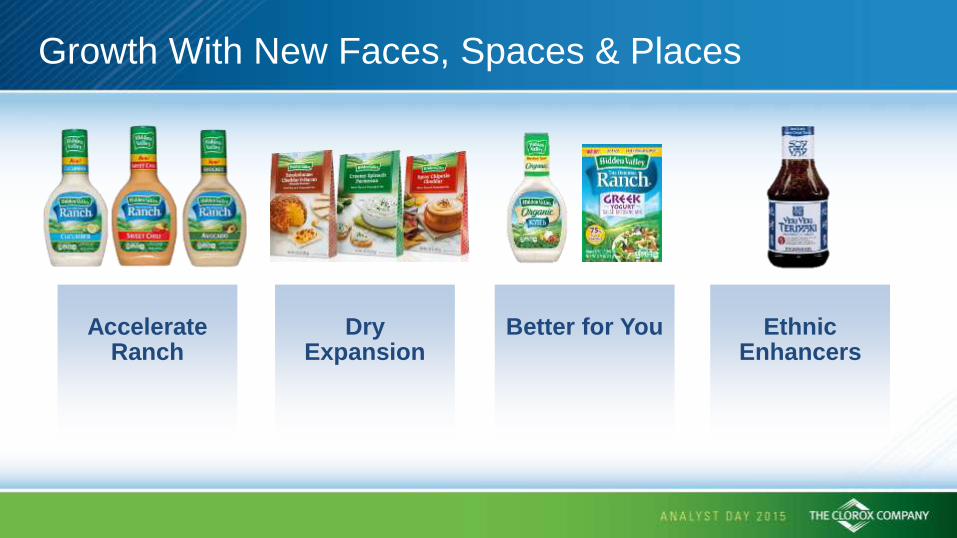
Accelerate
Ranch
Dry
Expansion
Better for You
Ethnic
Enhancers
Growth With New Faces, Spaces & Places

Food Innovation Pillars
Accelerate
Ranch
Dry
Expansion
Better for You
Ethnic
Enhancers

Accelerate Ranch
Shipped: Feb 2015 Shipped: Sept 2015
• Strong early results: Hidden Valley +1pt of Market Share in Q4 FY15
• Hidden Valley Share of “Ranch Flavors" increased +11 share points
Source: IRI MULO Date Ending 6/21/15 Bottled Salad Dressing
Early 2016

Accelerating Profitable Growth
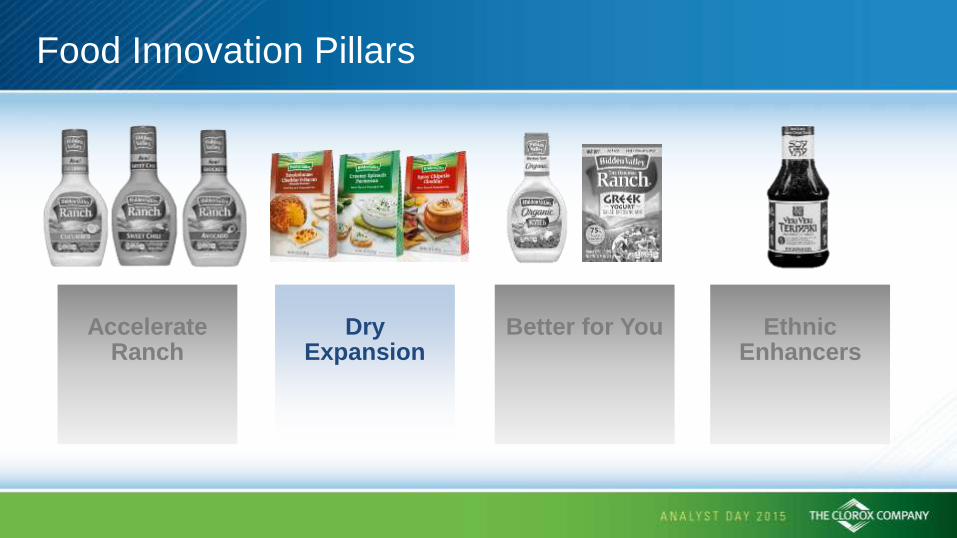
Food Innovation Pillars
Dry
Expansion
Accelerate
Ranch
Better for You
Ethnic
Enhancers

Source: IRI MULO Date Ending 6/21/15 Dry Salad Dressing
-2.0%
0.0%
2.0%
4.0%
Q1FY'14
Q2FY'14
Q3FY'14
Q4FY'14
Q1FY'15
Q2FY'15
Q3FY'15
Q4FY'15
Share Change vs YA
Expanding Dry into High Margin Adjacencies
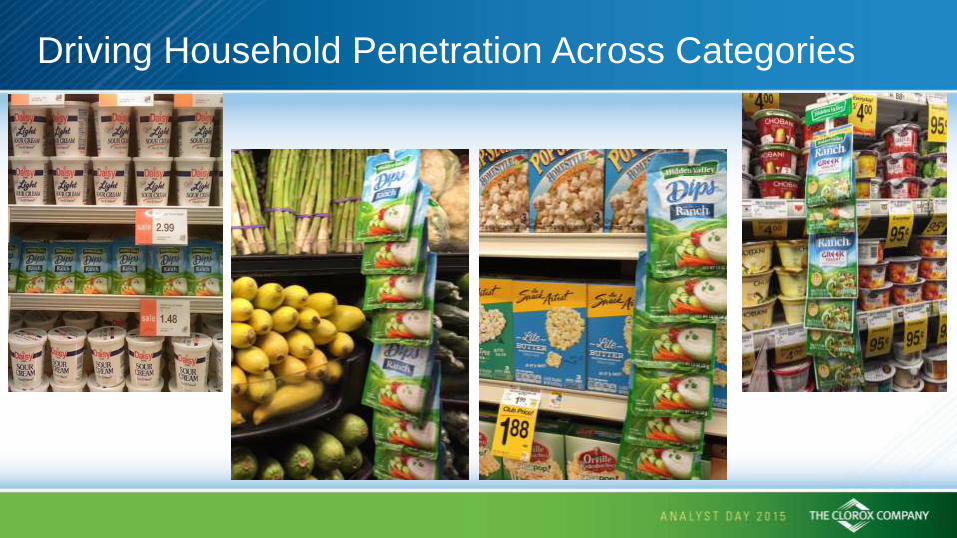
Driving Household Penetration Across Categories

Food Innovation Pillars
Better for You
Dry
Expansion
Ethnic
Enhancers
Accelerate
Ranch

Better For You Platform
There is a gap between healthier products
consumers want and what is available Opportunity
Solution
Fresh & Real Simple & Wholesome

Food Innovation Pillars
Accelerate
Ranch
Dry
Expansion
Better for You
Ethnic
Enhancers

Key Messages
• Clorox will invest differentially behind our Growth Brands
• Fuel Brands will grow more profitably to support growth
• Increase demand investment to grow Household Penetration

Denise Garner Chief Innovation Officer

Innovation is a Key Component of the Strategy
Strategy
Strategy
Accelerators
• Portfolio Momentum
• 3D Innovation
• 3D Technology Transformation
• Growth Culture
• Engage our people as business owners
• Increase brand investment behind superior value and more targeted
3D plans
• Keep the core healthy and grow into new categories, channels, and
existing countries
• Reduce waste in work, products, and supply chain to fund growth

Key Messages
• Strong commitment to innovation is working
• Strategy 2020 will drive greater value from innovation
• Improved processes will result in faster speed to market and “real-
time” measurement of the “value” of our products

Broad-based Approach to Innovation
Product & Marketing
Product Superiority
Cost-o-vation
New Product
Platforms &
Adjacency Expansion
GROW MARKET SHARE
ACCELERATE GROWTH EXPAND MARGIN
KEEP THE CORE HEALTHY
*Cost-o-vation is a term used at Clorox that describes innovation that improves product performance at a
reduced cost.

Innovation is Delivering Growth
2.8%
3.3% 3.4%
2.9% 3.0%
0%
1%
2%
3%
4%
5%
FY11 FY12 FY13 FY14 FY15 FY16Outlook
*FY16 Outlook based on Aug 3rd Earnings Release
3.0%
Incremental Sales Growth from Innovation (Last 12 months)

Strong Innovation Across Portfolio in FY15
Clorox Cleaning Utensils (International)
Fresh Step Extreme Lightweight
Burt’s Natural Lip Crayon Clorox Power Gel (International)
Clorox Scrub Singles Clorox Dust Wipes
Glad Odorshield with Gain
Hidden Valley Ranch Withs

Faster Time to Market
Goal: Reduce time to market by 50%
- Accelerate decision making
- Right-sized testing Plans
- Faster, more efficient development
process

Platforms Provide Bigger Value
• Glad “Stretchable Strength Platform” has many sequels
• Meeting unmet consumer needs has allowed for premium differentiation

Generating Long-Term Value From Innovation
Increase Demand
Investment
Optimize the
3Ds
Internal
3-Year Metric

3-Year Metric to Improve Innovation “Stickiness”
Internal
3-Year Metric
• Increase year 2 & 3 spending on successful
innovation
• Leverage platforms to allow for “Blockbuster”
introductions, followed by “Sequels”
• More “Adjust & Nurture” post-launch for
slower building innovations

Building Upon 60:40
7%
35%
48% 56%
0%
20%
40%
60%
80%
FY04 FY08 FY12 FY15
> 50% of portfolio has a 60:40
blind preference win vs next
strongest competitor
Source: Clorox Internal
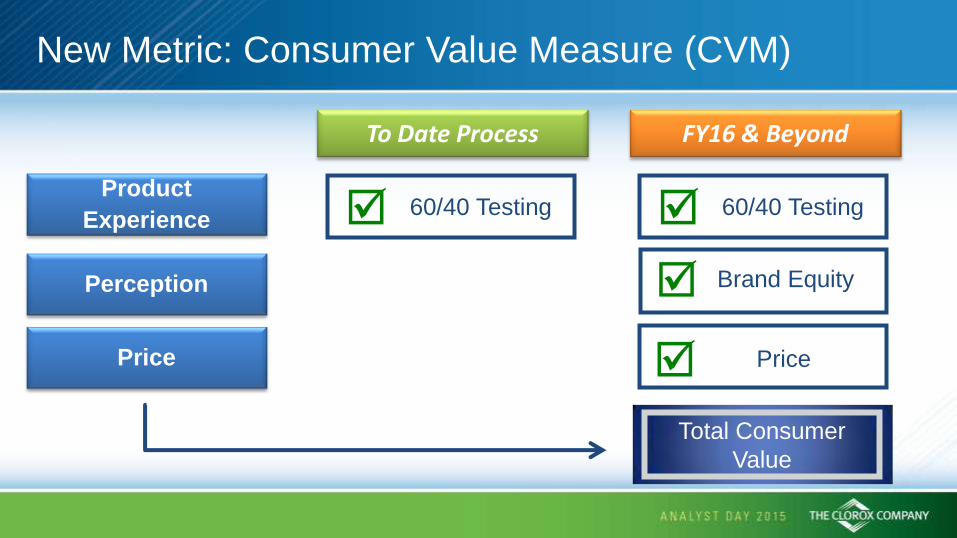
New Metric: Consumer Value Measure (CVM)
Product
Experience
Perception
Price
To Date Process
60/40 Testing
FY16 & Beyond
60/40 Testing
Brand Equity
Price
Total Consumer
Value

Consumer Value Measure
Total
Consumer
Value
Product Experience x Perception
Price
Superior Value
Parity Value
Inferior Value
• Proprietary real-time data
• Correlates to change in market share
• Captures all value drivers

CVM: How Do We Use It?
Price Index
Pro
duct
& P
erc
eption
In
de
x
Above 450 line,
Benefit > Price
Superior
Value
Below 450 line
Price > Benefit
Inferior
Value
Product x Perception
Price
Category Average
Based on Marn, Roegner, Zawada (McKinsey) pricing work published in “The Pricing Advantage” (April 2004)

CVM: Clorox Disinfecting Wipes Example
Price Index
Pro
duct
& P
erc
eption
In
de
x
Product x Perception
Price
Category Average
Based on Marn, Roegner, Zawada (McKinsey) pricing work published in “The Pricing Advantage” (April 2004)

44%
46%
48%
50%
Q2 FY14 Q4 FY15
Superior CVM Drives Market Share Gain
CDW Market Share
Source: IRI MULO Week Ending 6/21/15 Latest 13 Weeks

Accelerating Profitable Growth

Key Messages
• Strong commitment to innovation is working
• Strategy 2020 will drive greater value from innovation
• Improved processes will result in faster speed to market and “real-
time” measurement of the “value” of our products

Eric Reynolds Chief Marketing Officer
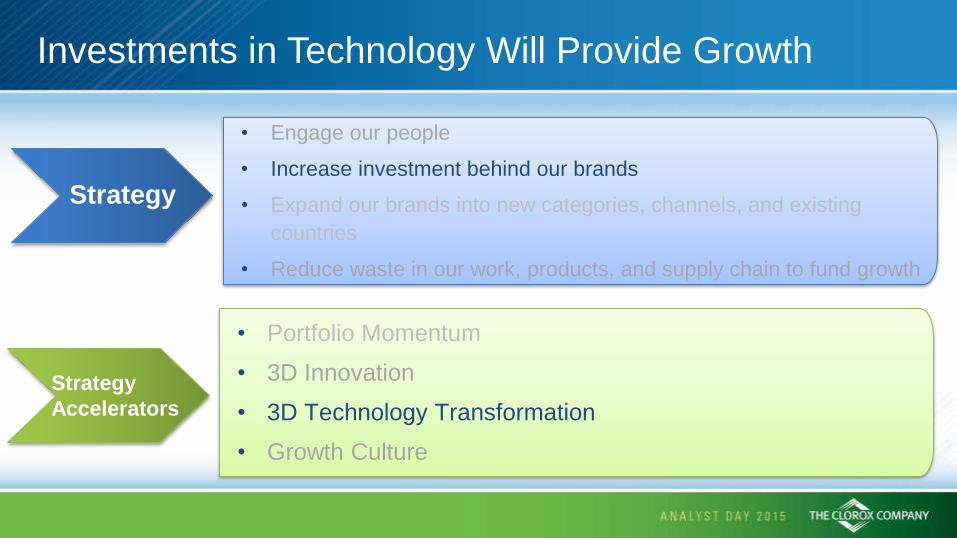
Investments in Technology Will Provide Growth
• Engage our people
• Increase investment behind our brands
• Expand our brands into new categories, channels, and existing
countries
• Reduce waste in our work, products, and supply chain to fund growth
Strategy
Strategy
Accelerators
• Portfolio Momentum
• 3D Innovation
• 3D Technology Transformation
• Growth Culture

• Accelerating investment in Digital, including media
• Analytics confirm a strong ROI on digital investments
• Leveraging Bay Area partnerships is a competitive advantage
Key Messages

Today’s Big Disruptors
People Technology
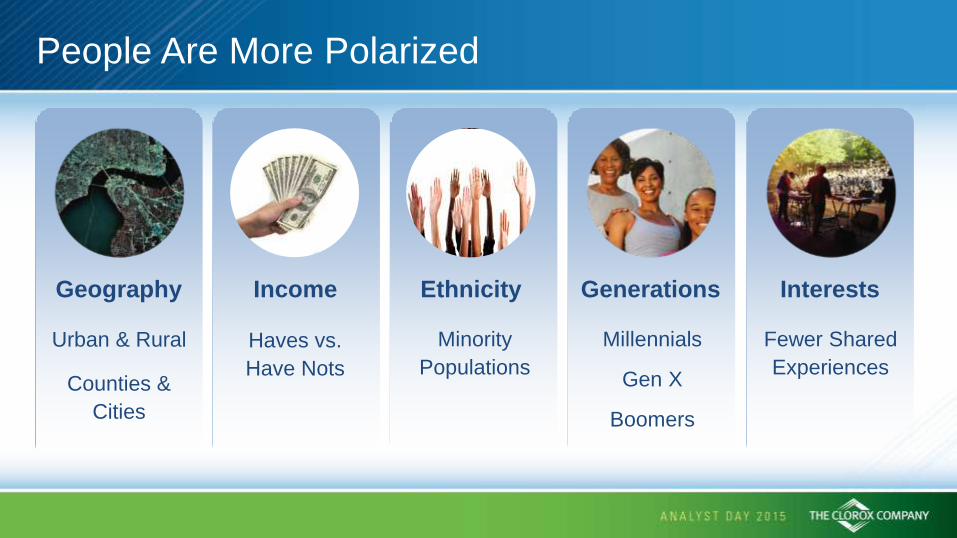
People Are More Polarized
Geography Income Ethnicity Generations Interests
Urban & Rural
Counties &
Cities
Haves vs.
Have Nots
Minority
Populations
Millennials
Gen X
Boomers
Fewer Shared
Experiences

Technology Brings Connectivity, Immediacy
Hello, Eric.
Welcome back.
Look what we
found just for you.
“Always On” consumers expect
personalization and authenticity
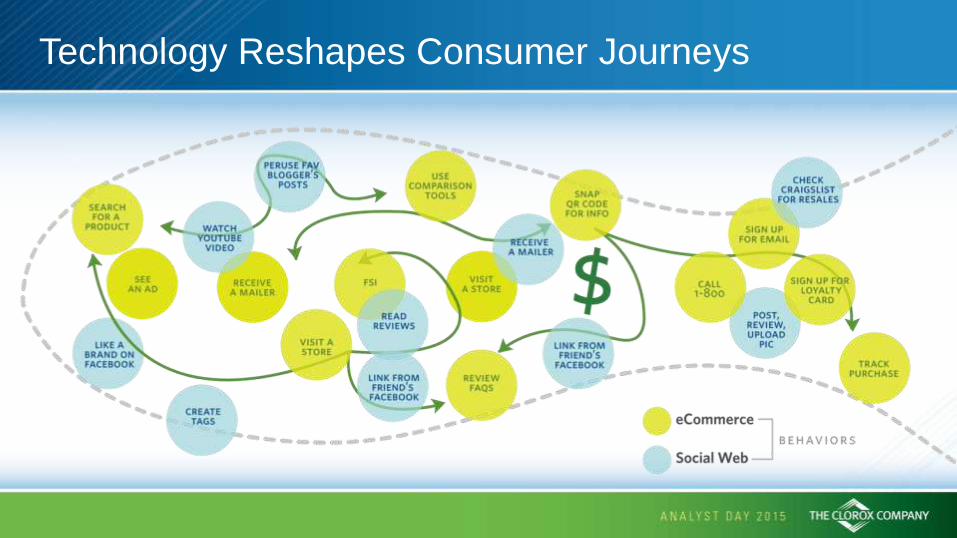
Technology Reshapes Consumer Journeys

Our Response
More Targeted
More Personal
More Real-Time
Driving Consumer Engagement

Clorox now
invests over 40%
of our media in
digital
22% 25%
34%
41% % of Working Media on Digital
FY16
Proj.
FY15 FY14 FY13
We Are Accelerating Investment in Digital Media
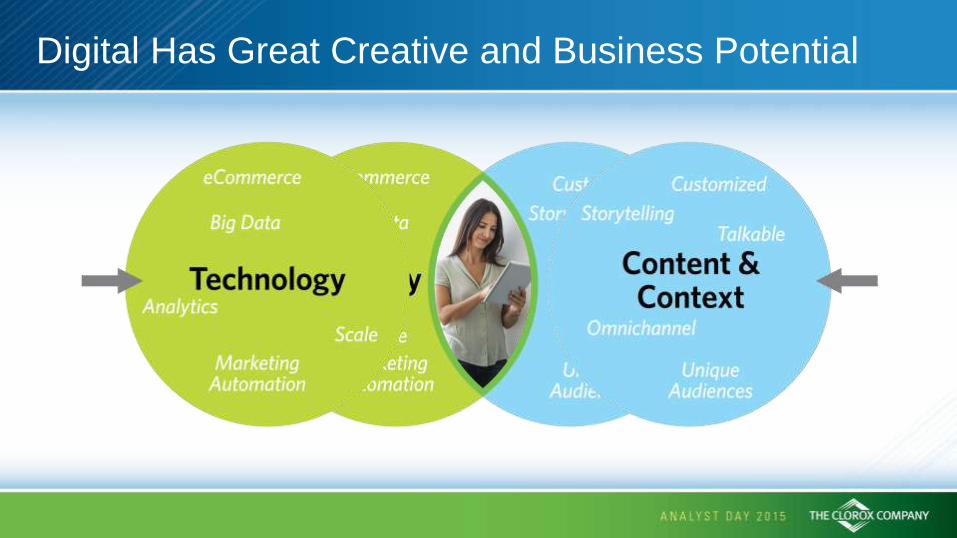
Digital Has Great Creative and Business Potential

Technology Enables One-to-One Communication
R E C I P E S
Right Message,
Right Context,
Right Medium

Technology Enables One-to-One Communication

Digital Improves ROI
Enhanced
Targeting
More
Personalized
More
Real Time Across
Channels

Hidden Valley | Campaign ROI Comparison
X
1.6X
2.1X
TV
TV
TV
+
+ + + +
Enhanced Targeting
More Personalized
More Real Time Across
Channels
ROI per Marketing Dollar Spent

We Leverage Our Location for Innovative Partnerships
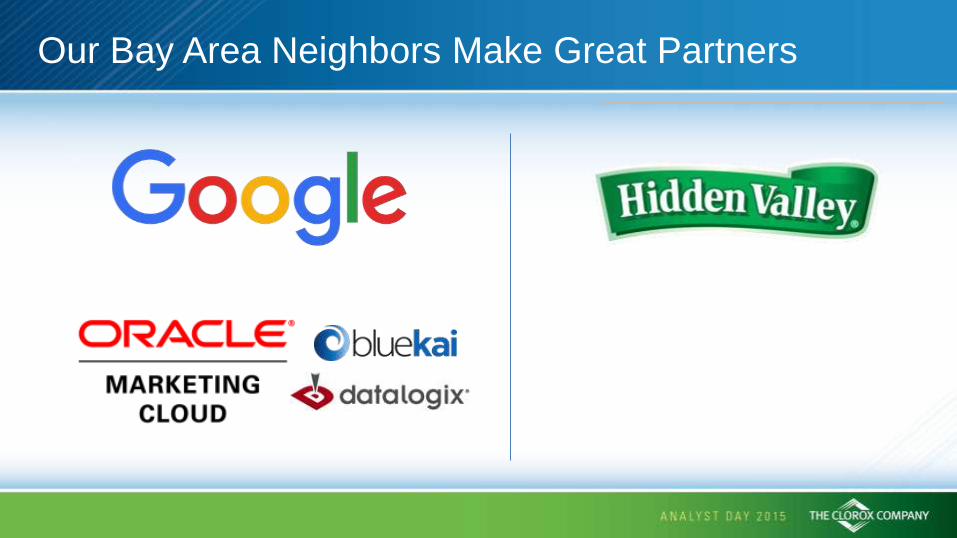
Our Bay Area Neighbors Make Great Partners

We Have Momentum in eCommerce
FY13 FY14 FY15
~50% Sales Growth (FY15 vs FY13)
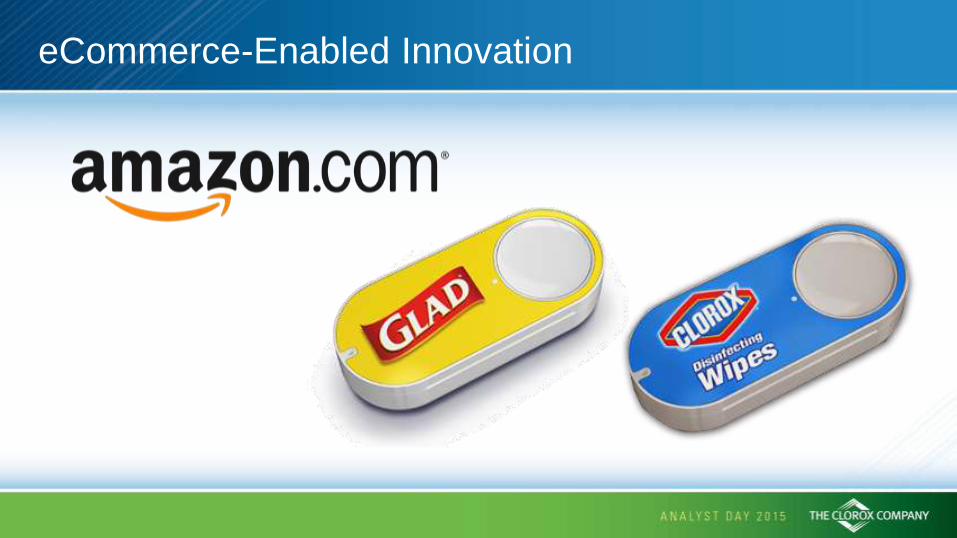
eCommerce-Enabled Innovation

eCommerce-Enabled Innovation
Intelligent Pitcher

FY15 FY20Prior
FY20Current
Momentum in eCommerce
$300M
Strong Momentum
Professional Products
+86%
+24%
+18%
+65%
YoY Growth 2020 Aspirational Sales Goal
$500M

• Accelerating investment in Digital, including media
• Analytics confirm a strong ROI on digital investments
• Leveraging Bay Area partnerships is a competitive advantage
Key Messages

Leading Change With Consumers Is in Our DNA

We've Been Doing it for 102 Years
Top-10 Most Trusted
CPG Brand
Based on Women in the United States, Harris Poll EquiTrend study 2015
We’re Preparing for the Next 100

Benno Dorer Chief Executive Officer

Building a Stronger Growth Culture
Strategy
Strategy
Accelerators
• Portfolio Momentum
• 3D Innovation
• 3D Technology Transformation
• Growth Culture
• Engage our people as business owners
• Increase brand investment behind superior value and more targeted
3D plans
• Keep the core healthy and grow into new categories, channels, and
existing countries
• Reduce waste in work, products, and supply chain to fund growth

Key Messages
• Strong organizational culture is a solid foundation
• High employee engagement versus global benchmarks
• Focus on growth culture in support of Strategy 2020
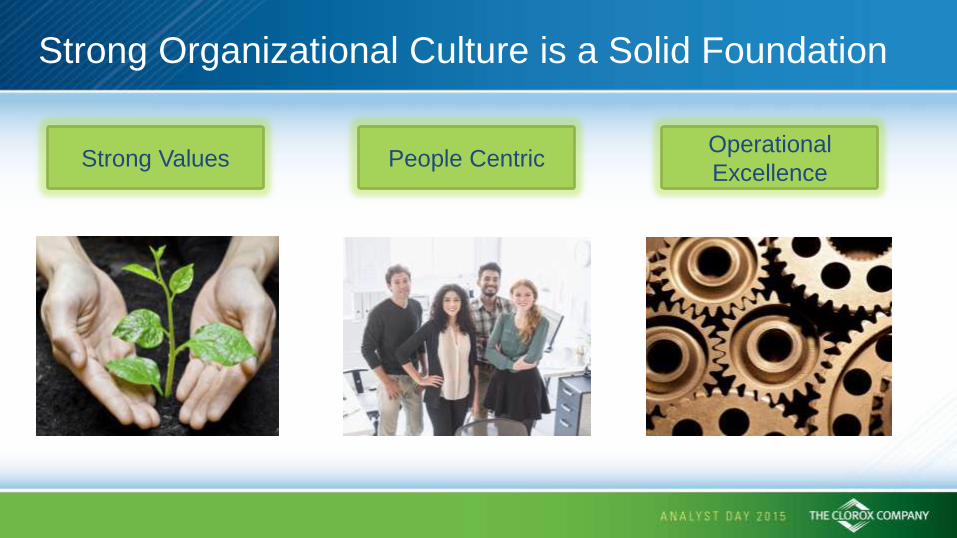
Strong Organizational Culture is a Solid Foundation
Strong Values People Centric Operational
Excellence
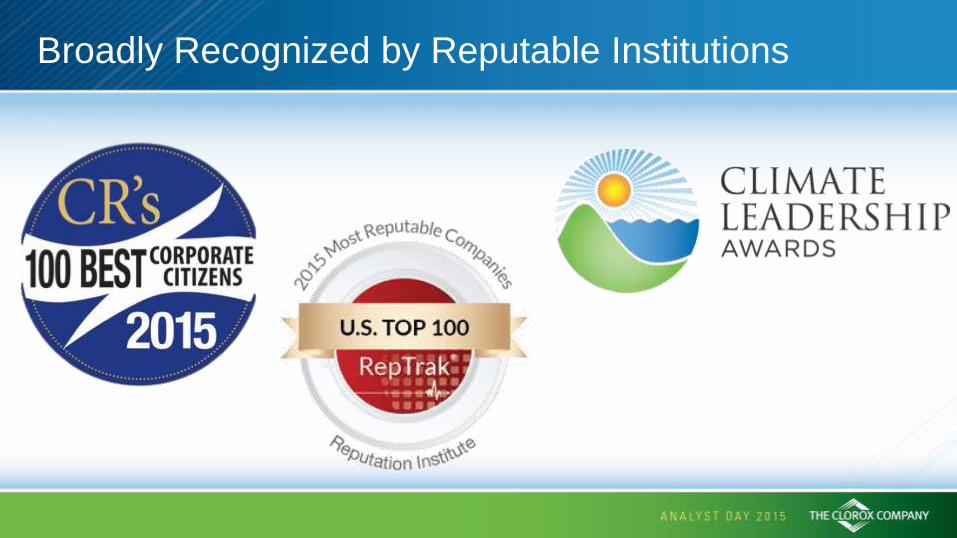
Broadly Recognized by Reputable Institutions

Clorox Engagement Exceeds Global Benchmarks
86%
77%
85%
70%
75%
80%
85%
90%
2015Clorox
CPG Norm Global HighPerforming Co.
Top 5%
CPG Norm: The Towers Watson global fast-moving consumer goods norm is based on responses from more than 126,346 employees from 61 global organizations.
Global High Performing Companies: The Towers Watson Global High Performance Norm is comprised of a weighted average of employee survey results. Companies qualify for
the norm by meeting two criteria: (a) superior financial performance, defined by a net profit margin and/or return on invested capital that exceeds industry averages; and (b) superior
human resource practices, defined by employee opinion scores near the top among the most financially successful companies surveyed by Towers Watson. This norm includes
responses from over 145,000 employees at 28 global organizations.

Key Engagement Strengths
I understand how my work contributes to Clorox's strategy.
I am empowered to make the decisions needed to do my job well.
Clorox has established a climate where one can
challenge our traditional ways of doing things.
I believe leaders at Clorox make decisions that are consistent
with our company values.

Building a Stronger Growth Culture
Decisive
Consumer-centric Responsible
I D E A C O M P A N Y
Engaged
Demand-building
Empowered
Invest in growth
Accountable
3D innovation 3D Technology Portfolio momentum

Accelerating Profitable Growth

Key Messages
• Strong organizational culture is a solid foundation
• High employee engagement versus global benchmarks
• Focus on growth culture in support of Strategy 2020

Break
Benno Dorer Chief Executive Officer
Continued Strong Commitment to Operational Excellence
Superior Value to Consumers
Retail
Execution
Margin
Enhancement

Matt Laszlo Chief Customer Officer
Key Messages – Winning With Retailers
• Long history of winning with retailers is a signature Clorox competency
• Shifting consumer dynamics will continue to change the retail
landscape
• Clorox capabilities will continue to position us as thought and growth
leaders at the physical and digital shelf
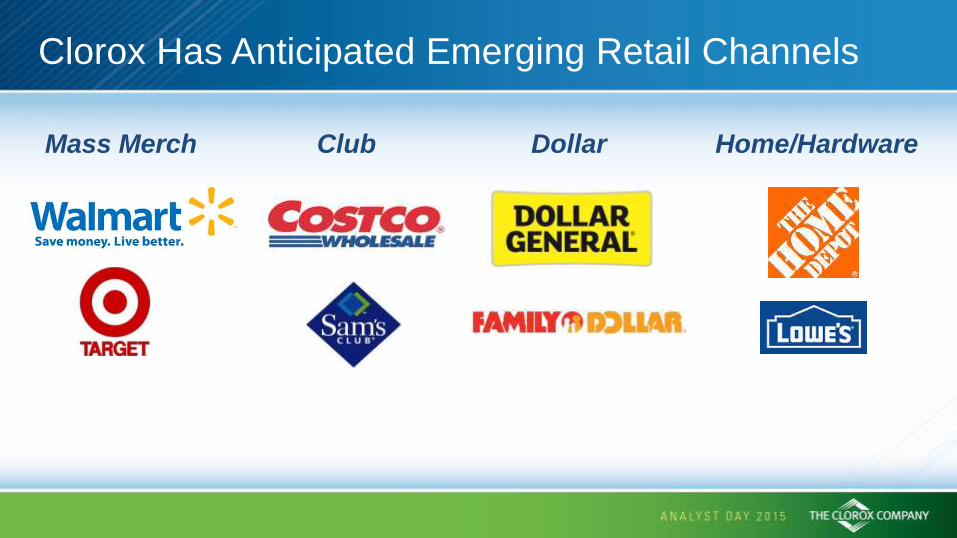
Clorox Has Anticipated Emerging Retail Channels
Mass Merch Club Dollar Home/Hardware

Insight to Execution
Retail Operations
Shopper Marketing
Insights
Supply Chain
Category Management

Maintain Momentum Accelerate Growth Maximize Profit
65% U.S. Volume 10% U.S. Volume 20% U.S. Volume
Customer Segmentation & Capability Deployment
Professional
5% U.S. Volume

Current Emerging Retail Channels
Big Box
Urban
Delivery
Click & Collect
Fragmentation

• Walmart + Clorox: Strong partnership
- Category Captain in 11 categories
• Target: Clorox named Vendor of the Year in 3 categories in 2015
- Cleaning, Trash & Food
Continuing to Win With Big Box Stores
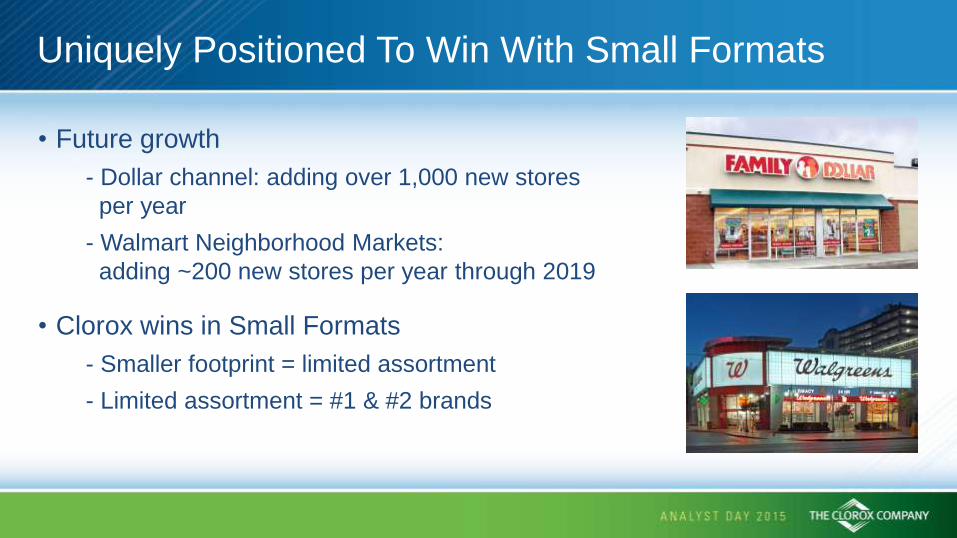
Uniquely Positioned To Win With Small Formats
• Future growth
- Dollar channel: adding over 1,000 new stores
per year
- Walmart Neighborhood Markets:
adding ~200 new stores per year through 2019
• Clorox wins in Small Formats
- Smaller footprint = limited assortment
- Limited assortment = #1 & #2 brands
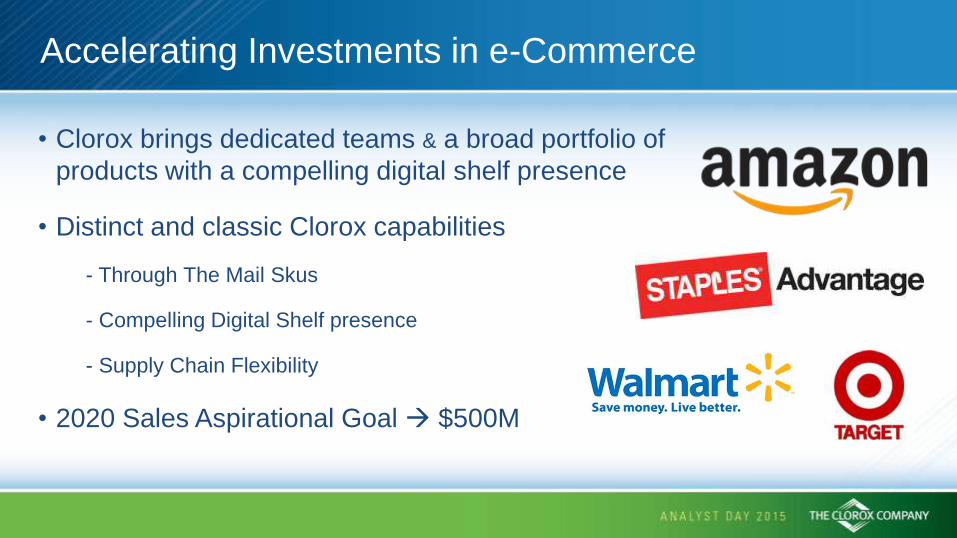
Accelerating Investments in e-Commerce
• Clorox brings dedicated teams & a broad portfolio of
products with a compelling digital shelf presence
• Distinct and classic Clorox capabilities
- Through The Mail Skus
- Compelling Digital Shelf presence
- Supply Chain Flexibility
• 2020 Sales Aspirational Goal $500M

Continued Strong Growth In Professional Channel
• Cleaning & Foodservice – recognizable
brands and consumer-facing penetration
- 18% sales growth over last 2 years
• Healthcare – superior clinical knowledge
and hospital penetration
Source: GHX data and Clorox internal data

Key Messages – Winning With Retailers
• Long history of winning with retailers is a signature Clorox competency
• Shifting consumer dynamics will continue to change the retail
landscape
• Clorox capabilities will continue to position us as thought and growth
leaders at the physical and digital shelf

Dawn Willoughby & Nick Vlahos Chief Operating Officers

Key Messages – Innovation Behind Value
• Innovation behind value drives profitable growth
• Value is a function of Product, Perception and Price
• We innovate for improved value at all price points

Why Value Matters
Improved Value Share & HH Pen
Growth Profitable Growth

Low Out Of Pocket (LOOP) Innovation
16oz Bleach
9ct Wipes
22ct Snack Bag
22ct Sandwich Bag 2ct S.O.S

Value Is More Than Price
Product Experience x Perception
Price
Total
Consumer
Value

Clorox Bleach: Improving Value Through Perception
International : 19% Cleaning : 32%
Household : 32% Lifestyle : 17%
Home Care 17%
Laundry 10%
PPD 5%
Glad 15%
Litter 6%
Charcoal 11%
Food 9%
Brita 4%
Burt's Bees 4%
International 19%

Consumer Need
Increased Control

Solution: Clorox Splash-Less Bleach
9% price
premium
x 10X Thicker
Does Not
Splash
Drive
Awareness of
Benefit
TM

Product Innovation to Drive Value
Distinctive benefits Awareness of benefits Better shelf presence

Accelerating Profitable Growth

Decide: Improved Package with Stronger Claims
Old Bottle New Bottle
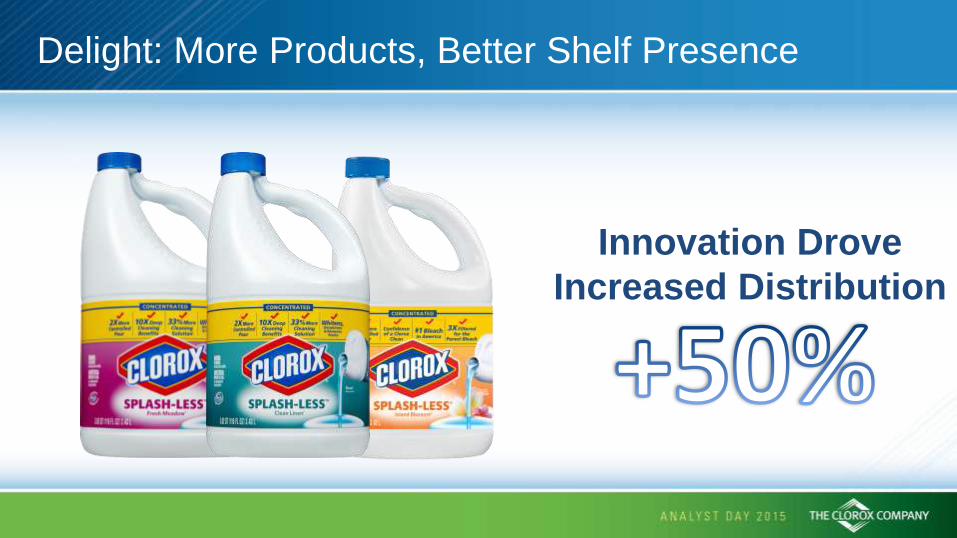
Delight: More Products, Better Shelf Presence
Innovation Drove
Increased Distribution
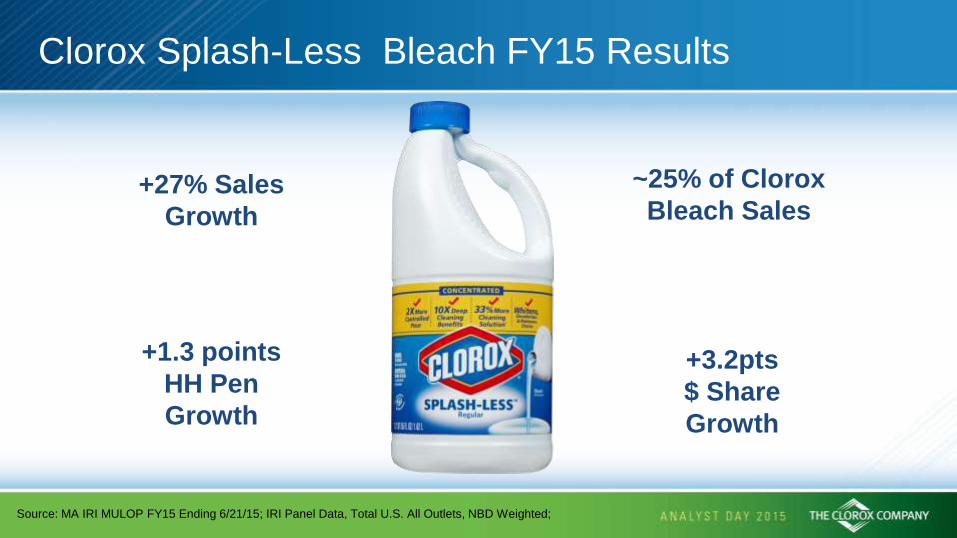
Clorox Splash-Less Bleach FY15 Results
~25% of Clorox
Bleach Sales
+3.2pts
$ Share
Growth
+27% Sales
Growth
+1.3 points
HH Pen
Growth
Source: MA IRI MULOP FY15 Ending 6/21/15; IRI Panel Data, Total U.S. All Outlets, NBD Weighted;

+0.8 pts
$ Share
Growth
Source: MA IRI MULOP FY15 Ending 6/21/15
Splash-Less Driving Total Clorox Bleach Share Gains

Glad: Improving Value Through Product Experience
International : 19% Cleaning : 32%
Household : 32% Lifestyle : 17%
Home Care 17%
Laundry 10%
PPD 5%
Glad 15%
Litter 6%
Charcoal 11%
Food 9%
Brita 4%
Burt's Bees 4%
International 19%

Old Glad – Past Perceptions
Stagnant
Category
Commoditized
Business
Low Margin
for Retailers
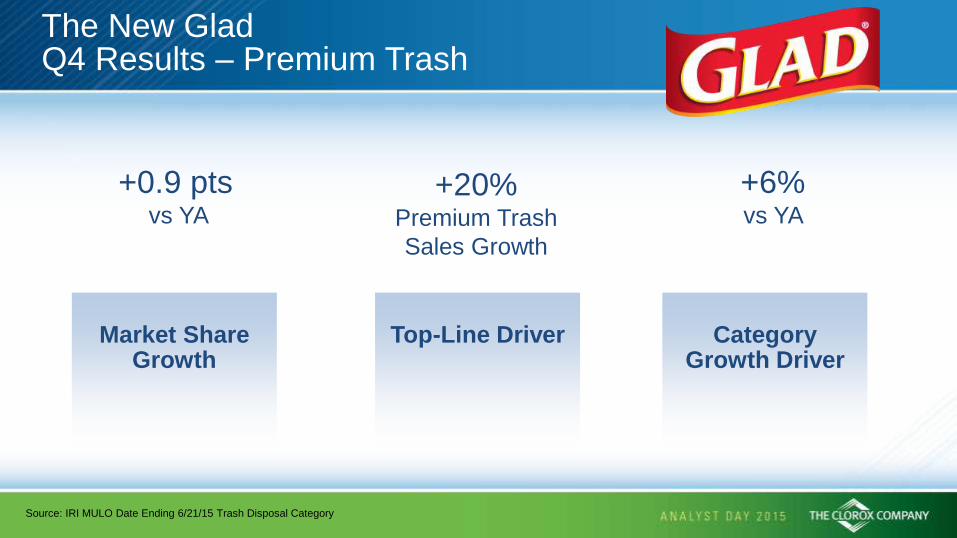
The New Glad Q4 Results – Premium Trash
Market Share
Growth
Top-Line Driver
Category
Growth Driver
+0.9 pts vs YA
+20% Premium Trash
Sales Growth
+6%
vs YA
Source: IRI MULO Date Ending 6/21/15 Trash Disposal Category
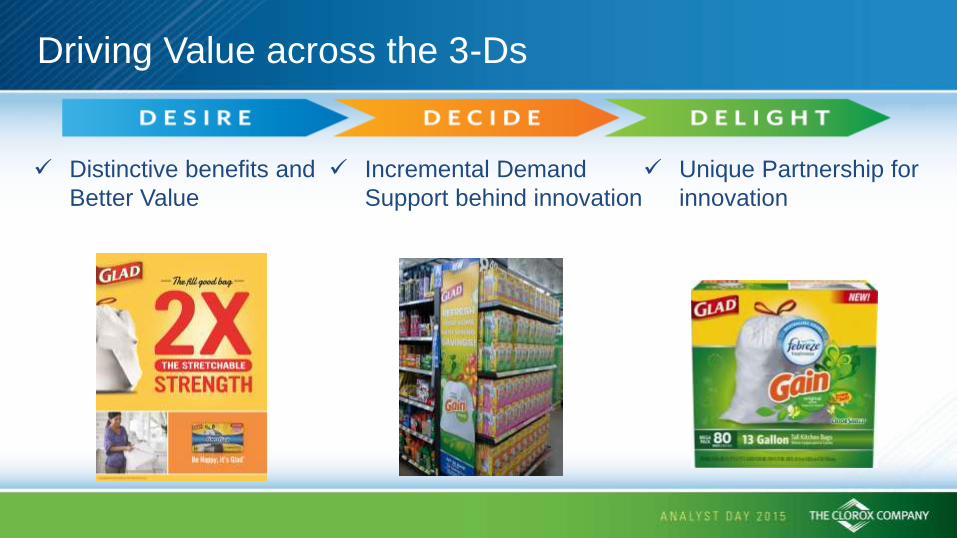
Distinctive benefits and
Better Value
Incremental Demand
Support behind innovation
Unique Partnership for
innovation
Driving Value across the 3-Ds

Accelerating Profitable Growth

Decide: More Merchandising Behind Innovation

Delight: Sustaining Success of Innovation Platform
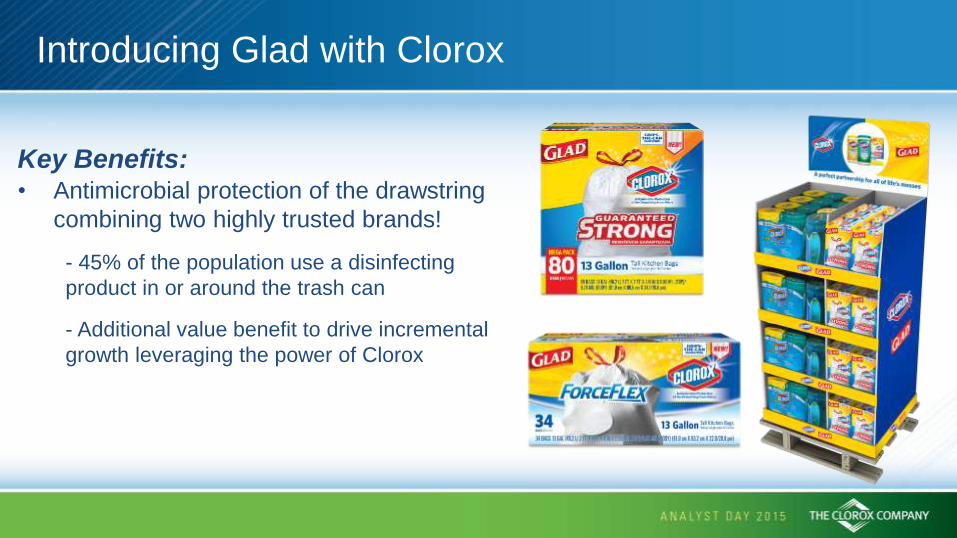
Introducing Glad with Clorox
Key Benefits: • Antimicrobial protection of the drawstring
combining two highly trusted brands!
- 45% of the population use a disinfecting
product in or around the trash can
- Additional value benefit to drive incremental
growth leveraging the power of Clorox

FY15: Strong Year for Glad
+6%
$ Category
Growth
+0.3pts
$ Share
Growth
+7%
Trash
Sales Growth
Source: IRI MULO Date Ending 6/21/15 Trash Disposal Category; IRI Panel Data, Total U.S. All Outlets, NBD Weighted
Premium Trash
+0.8pts
HH Pen
Growth

Future Runway For Growth
Base 44%
Premium 56%
2012 % of Share
Base 31%
Premium 69%
2015 % of Share
Want Odor Neutralization
91%
Currently Purchase Odor Neutralization
39%
Opportunity
52%
Source: IRI Infoscan Data - Total U.S. Multi-Outlet (Food/Drug/Mass + Walmart + Sam's + BJ's + Family Dollar + Dollar General + Fred's + DeCA.)
Ending June 24, 2012 & March 22, 2015
Foundational Waste Management Shopper Studies, 2013, IRI Custom Panel All Outlet Kitchen Odor Buyers 52W ending June 2015
Premium Segment 2/3 Volume & 3/4 Profit

Improved Consumer Value Measure
+25% since 2013
+18% since 2013

Key Messages – Innovation Behind Value
• Innovation behind value drives profitable growth
• Value is a function of Product, Perception and Price
• We innovate for improved value at all price points

Dawn Willoughby Chief Operating Officer
Cleaning, International & Professional Products

Key Messages – Creating Value in International
• International continues to play an important role in the Clorox portfolio
• Challenges exist due to FX headwinds and slowing economies
• Our “Go Lean” approach will mitigate current challenges and position
the business for long-term profitable growth

International is a Key Component of our Portfolio
Home Care 17%
Laundry 10%
PPD 5%
Glad 15%
Litter 6%
Charcoal 11%
Food 9%
Brita 4%
Burt's Bees 4%
International 19%
International : 19% Cleaning : 32%
Household : 32% Lifestyle : 17%

Why We Like International
Leading Brands
Midsized Countries
Faster
Category Growth Rates
Strong
Operational Performance
Peru

Strong Growth in Local Currency, However FX is Real
4%
7%
10%
2%
-3%
-1%
-5%
0%
5%
10%
FY 2013 FY 2014 FY 2015
Sales Growth
Currency Neutral As Reported
Exchange Rate
vs YAGO
Canada -17%
Argentina -10%
Australia -22%
Chile -13%
Colombia -35%
Mexico -21%
Source: Foreign Exchange Rates based on Spot Market 9/15/2015 vs. Avg. Sept 2014 Rate.
Sales % based on FY15 Actual Performance

“Go Lean” Approach
Pricing
Maximization
Focus on
Cost Savings
Right-Size
Infrastructure
Optimize Demand Creation
4 Pillars of Profitability
Pillar 1: Pricing Maximization
Pricing
Maximization

Ayudin Argentina: Price Behind Innovation
Value Message Strong Claims Innovate on Strong Equity

Accelerating Profitable Growth

Pillar 2: Focus on Cost Savings
Focus on
Cost Savings

Increased Cost Savings and Value Extraction
11 LATAM Countries
Right-Size
Infrastructure
Pillar 3: Right-Size Infrastructure

“Go Lean” to Improve Profitability
• Our “Go Lean” approach right-sizes our infrastructure to our current
business environment
• Reduced 8% of International workforce through:
- Process improvements
- Work simplification
- Centralization of work

Pillar 4: Optimizing Demand Creation
Optimize Demand Creation

Investing in Higher ROI Opportunities
10%
7%
4%
0%
5%
10%
15%
Fast Growth Stable Challenging
A&SP % Sales
4%
7%
17%
0%
10%
20%
FY14 FY15 FY16 (est)
% Spend on Digital Media (Latin America)

“Go Lean” Approach
Pricing
Maximization
Focus on
Cost Savings
Right-Size
Infrastructure
Optimize Demand Creation
4 Pillars of Profitability

Future Growth Ahead
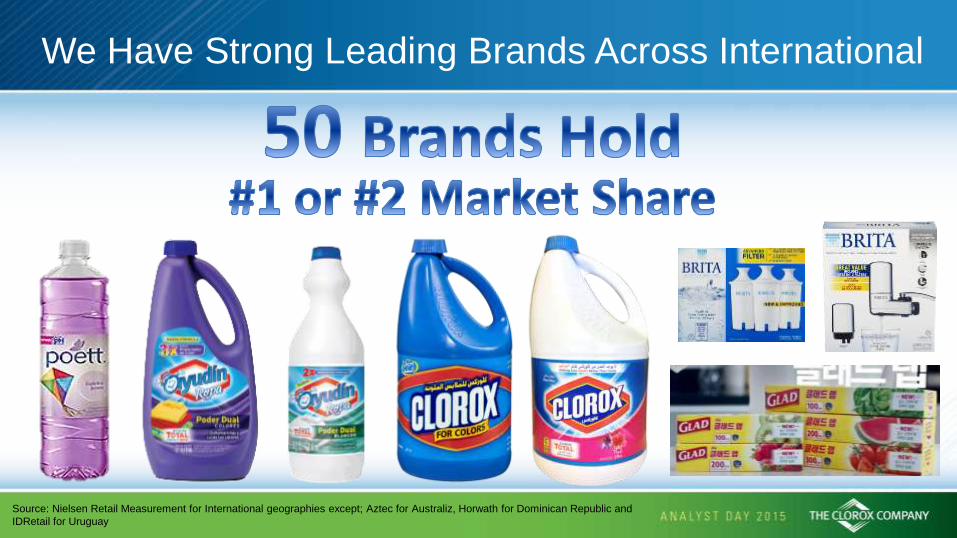
We Have Strong Leading Brands Across International
Source: Nielsen Retail Measurement for International geographies except; Aztec for Australiz, Horwath for Dominican Republic and
IDRetail for Uruguay

We Have a Highly Engaged International Organization
86%
77%
85%
70%
75%
80%
85%
90%
Clorox International2015
CPG Norm Global HighPerforming Co.
CPG Norm: The Towers Watson global fast-moving consumer goods norm is based on responses from more than 126,346 employees from 61 global organizations. Global High Performing Companies: The Towers Watson Global High Performance Norm is comprised of a weighted average of employee survey results. Companies qualify for the norm by meeting two criteria: (a) superior financial performance, defined by a net profit margin and/or return on invested capital that exceeds industry averages; and (b) superior human resource practices, defined by employee opinion scores near the top among the most financially successful companies surveyed by Towers Watson. This norm includes responses from over 145,000 employees at 28 global organizations.
Key Messages – Creating Value in International
• International continues to play an important role in the Clorox portfolio
• Challenges exist due to FX headwinds and slowing economies
• Our “Go Lean” approach will mitigate current challenges and position
the business for long-term profitable growth

Steve Robb Chief Financial Officer

Key Messages
• Investments in the U.S. in profitable growth are producing positive
results
• Strong cash flow has benefited shareholders over the long-term
• Focus on expanding margins via cost savings will continue to be a
core competency

FY16 Outlook Based on August 3rd Earnings Call
• Categories: +1% to +2%
• Innovation: +3pts
• FX: about -3pts
• Trade/Other: -1pt
• Gross Margin: Flat
• Selling & Admin: < 14% of Sales
• Advertising & Sales Promotion: > 9% of Sales
• Tax rate: 34% to 35%
Sales 0% to +1%
EBIT Margin +25bps to +50bps
Diluted EPS $4.68 to $4.83
(+2% to +6%)
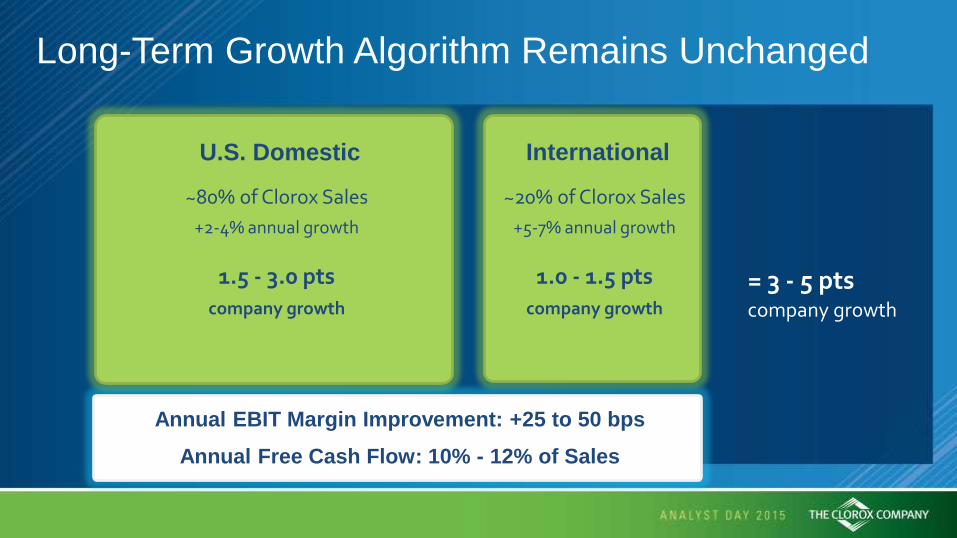
Long-Term Growth Algorithm Remains Unchanged
~80% of Clorox Sales
+2-4% annual growth
1.5 - 3.0 pts
company growth
U.S. Domestic
~20% of Clorox Sales
+5-7% annual growth
1.0 - 1.5 pts
company growth
International
= 3 - 5 pts company growth
Annual EBIT Margin Improvement: +25 to 50 bps
Annual Free Cash Flow: 10% - 12% of Sales

FY15 → Strong Free Cash Flow
$622
$780 $786
$858
$433
$590 $649
$733
$300
$400
$500
$600
$700
$800
$900
FY12 FY13 FY14 FY15 Goal
$ M
Operating Cash Flow Free Cash Flow
Projected
10% - 12%
of Sales
Free Cash Flow = Operating Cash Flow from Continuing Operations – Capital Expenditures

Use of Cash Priorities
Business Growth (includes targeted M&A)
Support Dividend
Share Repurchases Debt Leverage1
(Target: 2.0 – 2.5x)
Free
Cash
Flow
1. Debt Leverage = Gross Debt / EBITDA

Nearly $2 Billion Returned To Shareholders
in Last 4 Years
$433
$590 $649
$733
$454 $330
$532 $568
$0
$200
$400
$600
$800
FY12 FY13 FY14 FY15
$ M
FCF Cash Returned to Shareholders
FY15 Payout Ratio
64%

Healthy Dividend Growth…
Dividends Have Increased Each Year Since 1977
0%
2%
4%
AVP PG KMB KO K GIS PEP CLX CPB RB-GB KHC HSY TAP CL CHD EPC EL
2.8% 2.8% Peer Average: 2.6%
Dividend Yield as of June 30th, 2015

$40
$60
$80
$100
CY04 CY05 CY06 CY07 CY08 CY09 CY10 CY11 CY12 CY13 CY14 CY15
Shares Outstanding 214M 133M
Repurchased Nearly 40% of Shares over last 10 Years
…and Long Track Record of Share Repurchases
Shares Outstanding are as of June 30th, 2015

Top-Tier ROIC
27%
0%
10%
20%
30%
40%
CL CLX EL RB-GB HSY CPB PEP CHD KO GIS PG KMB K KHC TAP EPC AVP
Peer Average: 14%
Return on invested capital (ROIC), a non-GAAP measure, is calculated as earnings from continuing operations before income taxes and interest expense,
computed on an after-tax basis as a percentage of average invested capital. Average invested capital represents a five quarter average of total assets less
non-interest bearing liabilities. ROIC is a measure of how effectively the company allocates capital. Information on the Peer ROIC is based on publicly
available Fiscal-end data (FactSet) as of 6/30/2015.

Cost Savings Continue to Deliver
0 bps
50 bps
100 bps
150 bps
200 bps
250 bps
300 bps
FY06 FY07 FY08 FY09 FY10 FY11 FY12 FY13 FY14 FY15 FY16+
EBIT Margin Benefit from Cost Savings
+150bps Annual Goal

Strong Pipeline of Cost Savings
Bleach Concentration
World Class Manufacturing
Improved Product Performance
Reduce weight of charcoal briquette
Resin
Reduction
Packaging
Reduction
Plant Consolidation
~2% Efficiency
Every Year

Bleach Network Optimization
1990s (9 Plants)

Bleach Network Optimization
Today (6 Plants → 5)

Cost Savings That Deliver Improved Performance
Clorox Disinfecting Wipes Improvement
• Addresses consumer dissatisfaction with
improved functionality of closure
• $2M of savings reinvested to drive growth
Brita Pitcher Margin Improvement
• Pitcher redesign improves consumer
experience with entry level offering
• Premium extension improved pitcher profitability
by over 4pts of margin

Opportunities Exist Within SG&A
14.1%
5%
15%
25%
35%
45%
55%
CHD KHC KMB GIS CLX TAP K PG EPC HSY RB-GB
CL KO PEP EL AVP
% o
f S
ale
s
Goal: < 14% Sales
SG&A % of Sales as of Latest Fiscal Year End
CLX as of June 30th, 2015
Long-Term Investment Case Remains Solid
• FX headwinds likely to lessen over the long-term
• Investing behind our brands to grow categories and share
• Solid pipeline of innovation and cost savings, including SG&A
• Free cash flow: 10% to 12% of Sales

Near-Term Priorities
• Invest in our categories by supporting innovation
• Continue executing with operational excellence by driving
EBIT margin expansion
• Prioritize profitability of our International segment, while
managing FX

+954%
+451%
+734%
0
200
400
600
800
1,000
Jun95
Jun97
Jun99
Jun01
Jun03
Jun05
Jun07
Jun09
Jun11
Jun13
Jun15
CLX S&P 500 Peer Companies Average
Total Shareholder Return 20 Year Ending 6/30/2015
TSR %
Over 2x the S&P 500!
Strong Shareholder Return

Key Messages
• Investments in the U.S. in profitable growth are producing positive
results
• Strong Cash Flow has benefited shareholders over the long-term
• Focus on expanding margins via cost savings will continue to be a
core competency
Benno Dorer Chief Executive Officer

• We make everyday life better, every day
Objectives • Maximize economic profit
• Big-share brands in midsized categories and countries
• Engage our people as business owners
• Increase brand investment behind superior value and more targeted
3D plans
• Keep the core healthy and grow into new categories, channels, and
existing countries
• Reduce waste in work, products, and supply chain to fund growth
Mission
Strategy
2020 Strategy → Constancy of Purpose

14%
1% 5%
3%
3%
2%
0%
5%
10%
15%
20%
Clorox Peers S&P 500Share Price Appreciation Dividend Paid
17%
7%
4%
Total Shareholder Return 1 Year Ending 6/30/15
Strong Results Are Recognized by Shareholders
Strategy Accelerators → Drive Profitable Growth
2020 Goals
(Annual)

Market Share is Responding
Last 24 Months
-0.4pts
Last 12 Months
Flat
Last 3 Months
+0.3pts
Note: Clorox share excludes Kitchen Bouquet, Salad Crispins, Salad Kits, Veggie Kits, LDL, Laundry Detergent, Washing Machine Cleaners, Wash N
Dri, Glad Straws, Cooking Bags, Litter Additives & Equipment and Burt's Bees. Source: IRI Infoscan Data - Total U.S. Multi-Outlet (Food/Drug/Mass +
Walmart + Sam's + BJ's + Family Dollar + Dollar General + Fred's + DeCA.) for 13 wk, 52 wk, and 24 mo ending 6/21/2015.
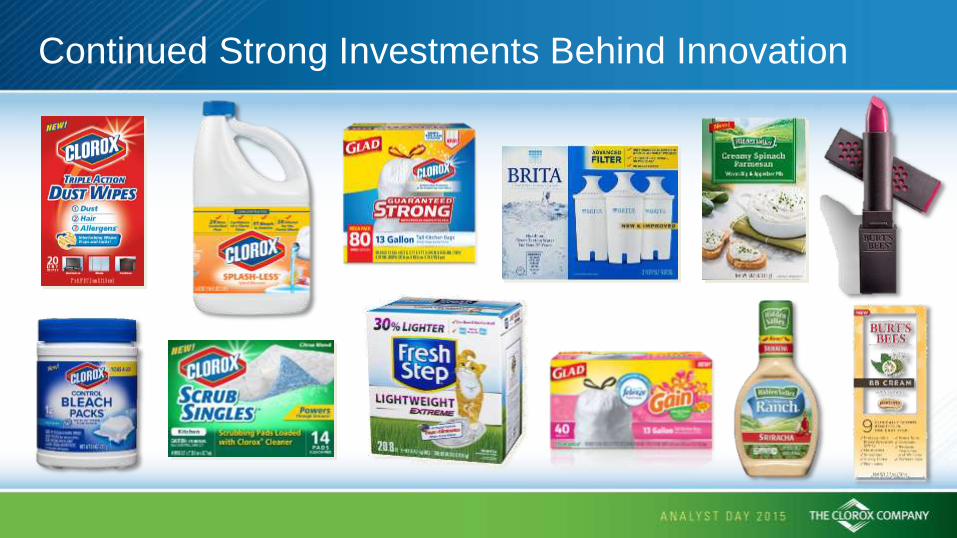
Continued Strong Investments Behind Innovation
And Continue into 2016

Key Messages
• Staying on Strategy 2020 as it is producing strong shareholder returns
• Investments in profitable growth are beginning to show positive
results
• Strategy 2020 Accelerators and continued strong execution to
make accelerated growth sustainable
Lunch/Q&A In the Café