accelerating into the curve
TRANSCRIPT
8/15/2019 Accelerating Into the Curve
http://slidepdf.com/reader/full/accelerating-into-the-curve 1/20
AcceleratingInto the Curve
Achieving Success in a
Challenging Market
Findings of the 2003
McKinsey/U.S. Institute
Asset Management
Benchmarking Survey

8/15/2019 Accelerating Into the Curve
http://slidepdf.com/reader/full/accelerating-into-the-curve 2/20
Introduction 2
A Difficult Environment 3
Keys to Future Growth and Profitability 6
Growing and Retaining Assets 6
Achieving Market-Leading Profitability 9
Appendix – Survey Participants 17
Contents1
8/15/2019 Accelerating Into the Curve
http://slidepdf.com/reader/full/accelerating-into-the-curve 3/20

8/15/2019 Accelerating Into the Curve
http://slidepdf.com/reader/full/accelerating-into-the-curve 4/20
It is not news to any active participant that the asset management industry has
faced a difficult operating environment for several years, coupled with double-
digit equity market declines. What is news is that, in the face of these chal-
lenges, a minority of leading firms achieved strong profits and/or maintained
significant asset growth while, industrywide, margins and assets fell.
As a whole in 2002, the U.S. asset management industry delivered average prof-
it margins of 25 percent, down 2 percent from the previous year. This reduced
profitability for the industry was caused by average asset declines of 9 percent,
offset in part by average cost reductions of 8 percent (Exhibit 1). However, theindustry’s increasing challenges are separating the winners from the rest of the
pack, creating a dramatic gap with bottom performers. Indeed, while the top
third of all firms had average profit margins of 46 percent, the bottom third aver-
aged only 3 percent. However, it was not only large fixed-income or money mar-
ket firms that excelled. There are firms of all sizes, client segments and asset-
class focuses that delivered outstanding profitability (Exhibit 2).
A Difficult Environment3

8/15/2019 Accelerating Into the Curve
http://slidepdf.com/reader/full/accelerating-into-the-curve 5/20
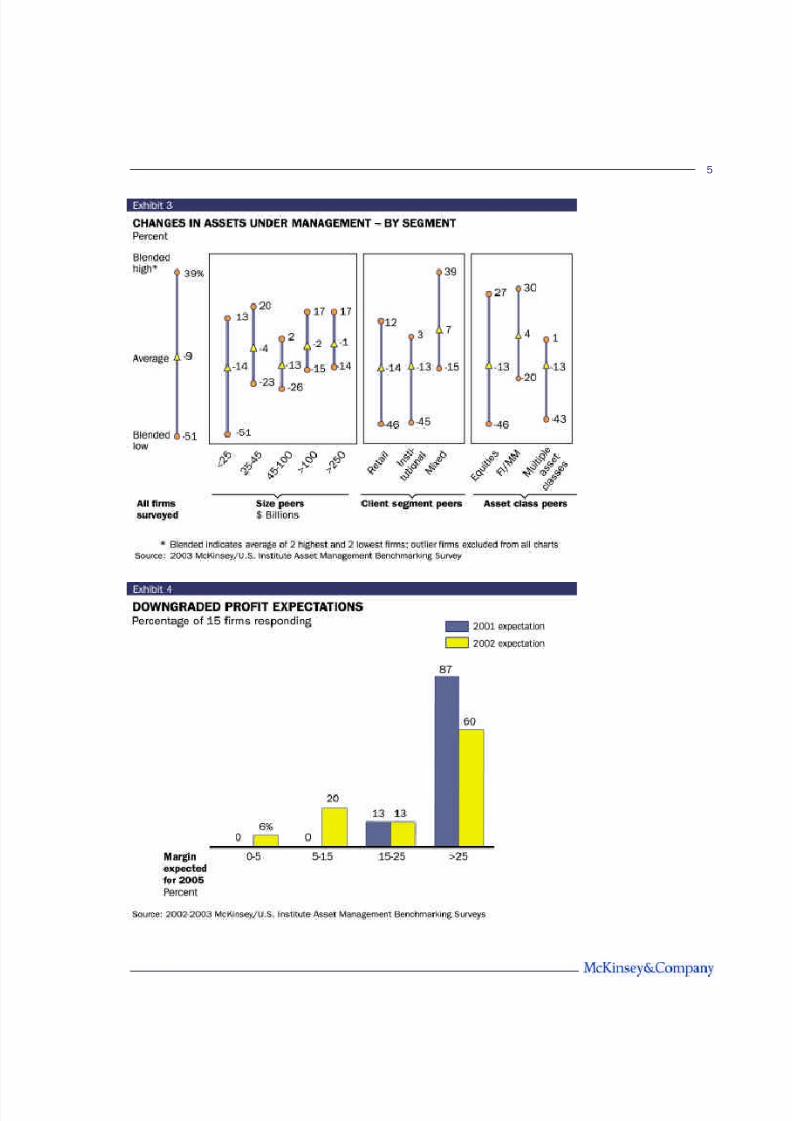
Just as with profits, the gap in asset growth between winners and losers was
also stark. While the top 10 percent grew assets by greater than 10 percent,
fully 20 percent had asset declines in excess of 20 percent. Broken down by
segment, fixed-income firms, on average, clearly grew more than others in
2002. However, there were a number of firms in each segment that delivered
market-leading growth (Exhibit 3).
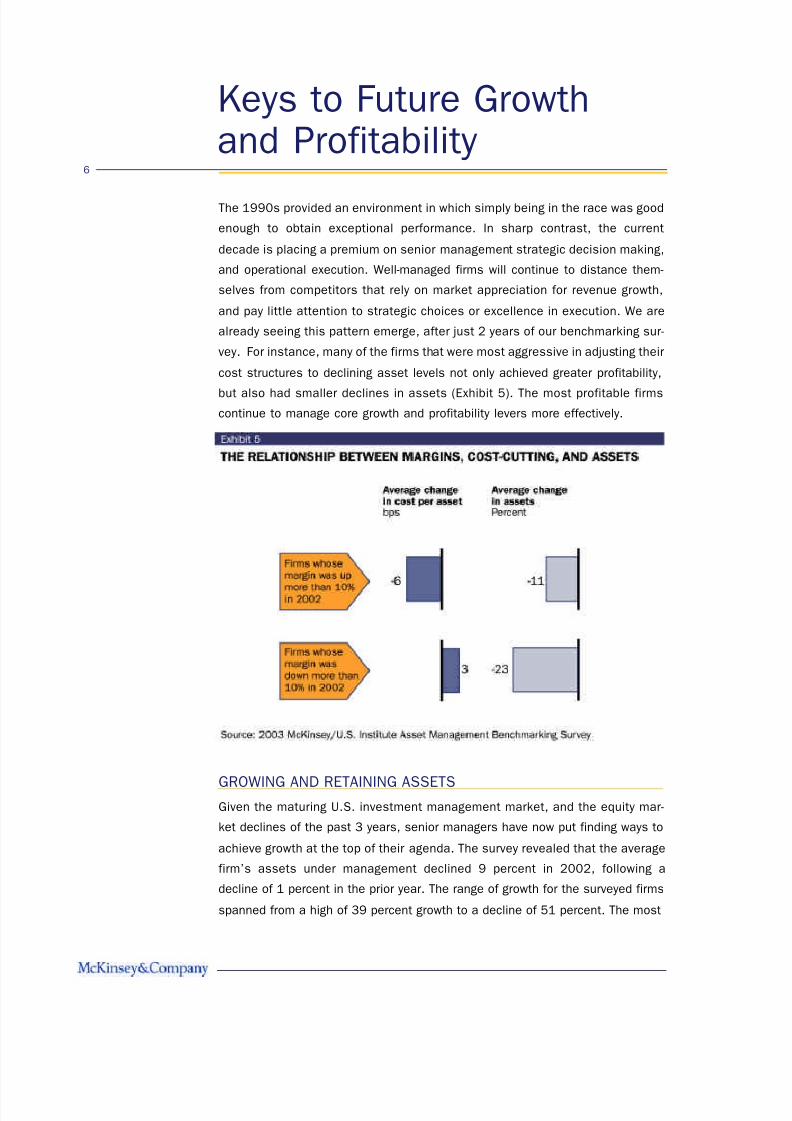
Looking forward, the challenges of the industry will likely continue to increase the
performance gap, with a minority of firms achieving distinctive growth and prof-
itability, while the majority work hard just to maintain assets and their currentprofit margins. Most firms believe that achieving the profitability levels of the late
1990s will be challenging. Therefore, many have lowered their forward-looking
profitability targets (Exhibit 4). However, we believe the future should not be about
lowered expectations. Rather, we feel firms should place an increased focus on
developing the skills and capabilities required to achieve market-leading prof-
itability and growth levels.
4
8/15/2019 Accelerating Into the Curve
http://slidepdf.com/reader/full/accelerating-into-the-curve 6/20
5
8/15/2019 Accelerating Into the Curve
http://slidepdf.com/reader/full/accelerating-into-the-curve 7/20

8/15/2019 Accelerating Into the Curve
http://slidepdf.com/reader/full/accelerating-into-the-curve 8/20
successful firms understand that, in the future, organic growth in most U.S.
markets will continue to be modest. As a result, they are focusing on growing
through three alternative levers:
Leverage core strengths. The most successful firms continuously leverage their
core strengths and aggressively extend into new markets and products that will
augment growth and profitability. For example, over the past few years, many
successful institutional firms have focused on the sub-advisory market, achiev-
ing double-digit growth rates. Many of these winners have also launched prod-
ucts that satisfied investors’ current needs, such as high-yield bond funds.However, careful assessment of new growth opportunities is critical, not only to
drive growth, but also to maintain and enhance profitability, as the evidence
shows that dabbling is a major drag on profits (Exhibit 6).
Improve sales skills to steal share. There is little doubt that institutional and
retail clients are continuing to become more sophisticated, and are demanding
new and improved sales and service capabilities from their asset managers. On
the institutional side, leading firms are discovering ways to provide better serv-
ice across DB and DC plans, by segmenting their servicing and client relation-
7
8/15/2019 Accelerating Into the Curve
http://slidepdf.com/reader/full/accelerating-into-the-curve 9/20
ship management approaches, improving reporting, broadening their participant
servicing and education, and other steps. In retail, the bar for distinctive whole-
saling is rising, as is the cost, due to a number of factors. These include the
proliferation of new products, such as 529s and separate account wraps, and
the addition of new channels for many of these products, such as independent
broker dealers, coupled with rising advisor expectations for service. Advisory
firms and their advisors want investment solutions linked to holistic advice, not
“the product of the day.”
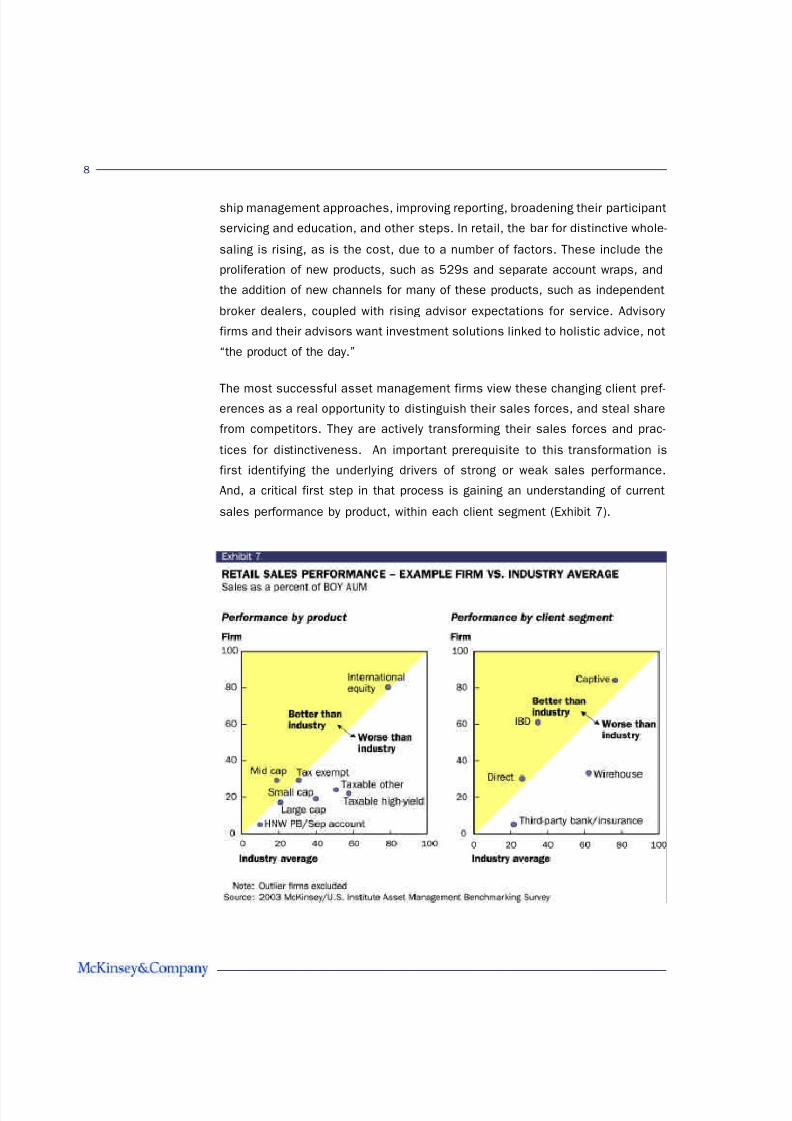
The most successful asset management firms view these changing client pref-erences as a real opportunity to distinguish their sales forces, and steal share
from competitors. They are actively transforming their sales forces and prac-
tices for distinctiveness. An important prerequisite to this transformation is
first identifying the underlying drivers of strong or weak sales performance.
And, a critical first step in that process is gaining an understanding of current
sales performance by product, within each client segment (Exhibit 7).
8

8/15/2019 Accelerating Into the Curve
http://slidepdf.com/reader/full/accelerating-into-the-curve 10/20
Focus on existing asset base to boost retention. Many in the industry have
long believed that investment performance is the only thing that influences
retention. While it is clearly a major driver, our survey reveals that there are
other important levers that can have real impact on reducing outflows. For
example, firms that invest in client servicing also realized substantially lower
outflow levels (Exhibit 8). In addition to investing wisely in client servicing, firms
with strong retention also pay their sales people (at least in part) on net sales
rather than purely gross sales, and have a deliberate retention management
approach tailored to each client segment.
ACHIEVING MARKET-LEADING PROFITABILITY
As we have discussed, many firms appear to have given up hope, for the
foreseeable future, of achieving profit margins that were common in the last
decade (i.e., in the mid-40 percent range). While our belief is that such profit
levels will no longer be the industry average, we believe that this level of prof-
9
8/15/2019 Accelerating Into the Curve
http://slidepdf.com/reader/full/accelerating-into-the-curve 11/20
itability, and even higher, is achievable for the best-run firms. The most prof-
itable firms will be those that excel at seven major revenue and cost levers:
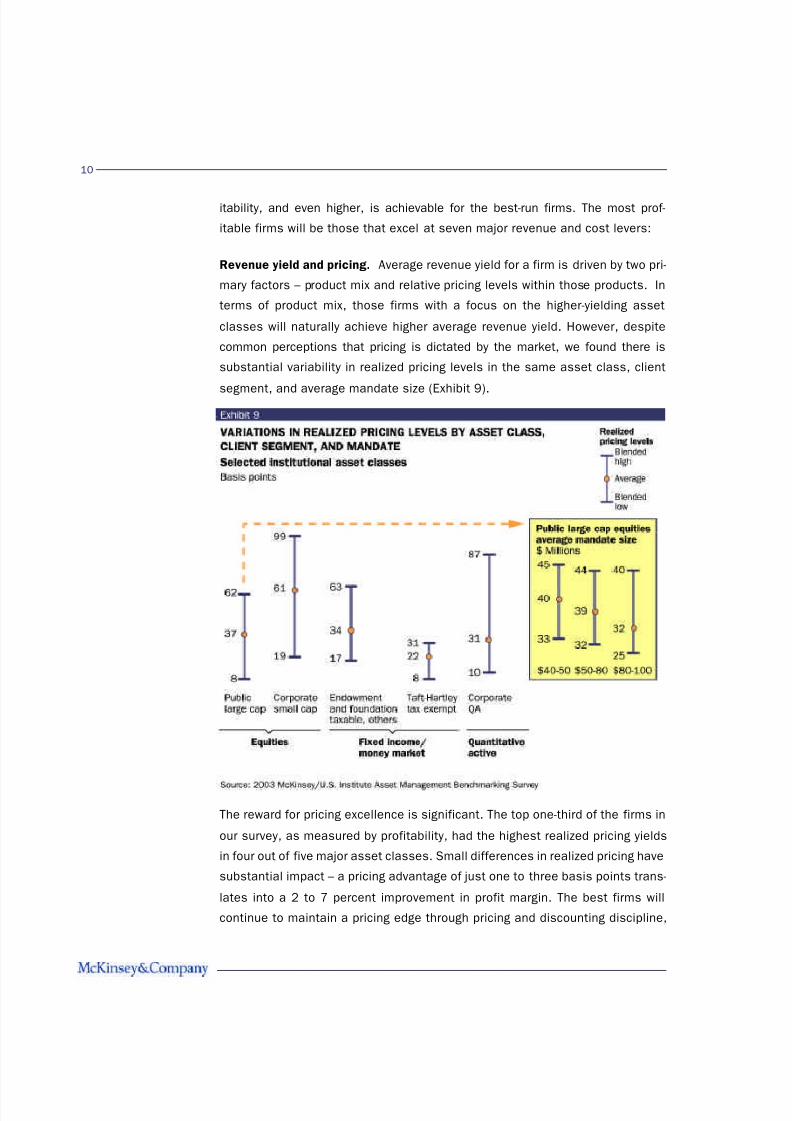
Revenue yield and pricing. Average revenue yield for a firm is driven by two pri-
mary factors – product mix and relative pricing levels within those products. In
terms of product mix, those firms with a focus on the higher-yielding asset
classes will naturally achieve higher average revenue yield. However, despite
common perceptions that pricing is dictated by the market, we found there is
substantial variability in realized pricing levels in the same asset class, client
segment, and average mandate size (Exhibit 9).
The reward for pricing excellence is significant. The top one-third of the firms in
our survey, as measured by profitability, had the highest realized pricing yields
in four out of five major asset classes. Small differences in realized pricing have
substantial impact – a pricing advantage of just one to three basis points trans-
lates into a 2 to 7 percent improvement in profit margin. The best firms will
continue to maintain a pricing edge through pricing and discounting discipline,
10

8/15/2019 Accelerating Into the Curve
http://slidepdf.com/reader/full/accelerating-into-the-curve 12/20
8/15/2019 Accelerating Into the Curve
http://slidepdf.com/reader/full/accelerating-into-the-curve 13/20
can result in closing or merging products when necessary. These processes
involve both manufacturing and distribution professionals, who are increasingly
adopting best practices from other industries, where many of these capabilities
are well-advanced.
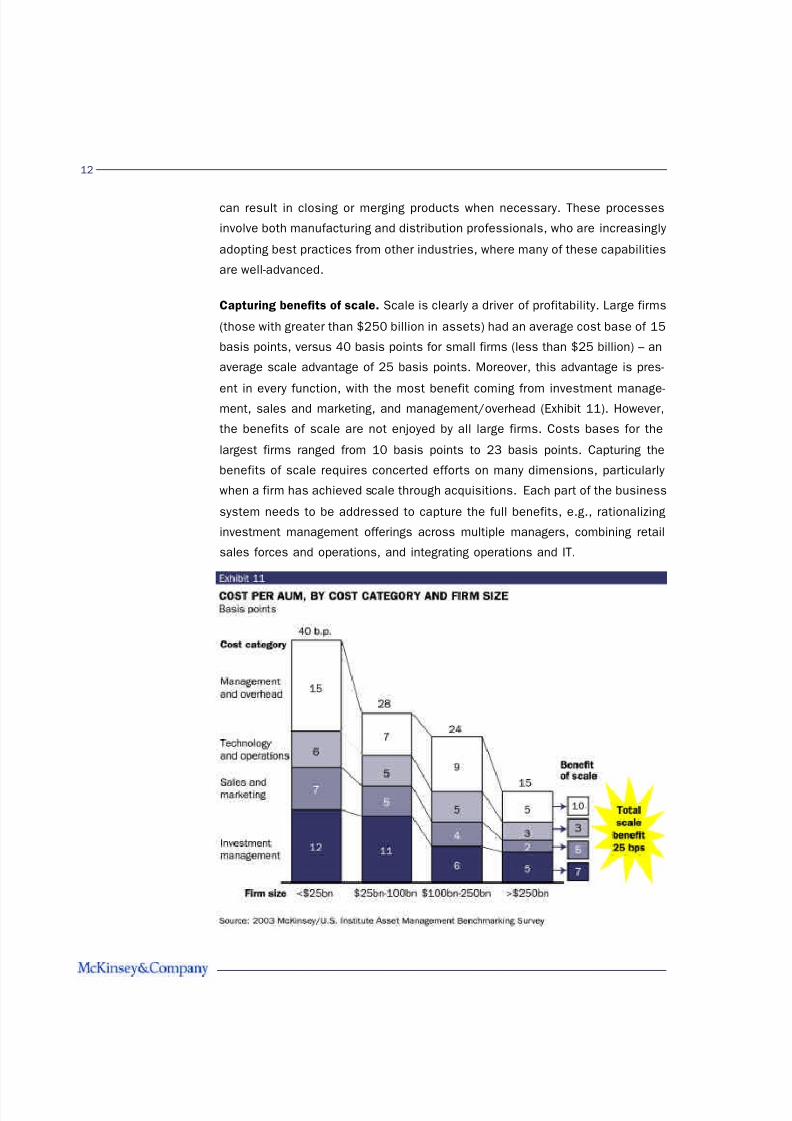
Capturing benefits of scale. Scale is clearly a driver of profitability. Large firms
(those with greater than $250 billion in assets) had an average cost base of 15
basis points, versus 40 basis points for small firms (less than $25 billion) – an
average scale advantage of 25 basis points. Moreover, this advantage is pres-
ent in every function, with the most benefit coming from investment manage-ment, sales and marketing, and management/overhead (Exhibit 11). However,
the benefits of scale are not enjoyed by all large firms. Costs bases for the
largest firms ranged from 10 basis points to 23 basis points. Capturing the
benefits of scale requires concerted efforts on many dimensions, particularly
when a firm has achieved scale through acquisitions. Each part of the business
system needs to be addressed to capture the full benefits, e.g., rationalizing
investment management offerings across multiple managers, combining retail
sales forces and operations, and integrating operations and IT.
12

8/15/2019 Accelerating Into the Curve
http://slidepdf.com/reader/full/accelerating-into-the-curve 14/20
Investment management productivity. The most successful firms are beginning
to focus on managing themselves as professional services firms, and paying
particular attention to their talent management approach. We believe that
investment professionals can be managed for productivity, as well as invest -
ment performance. However, currently the productivity of investment profes-
sionals varies considerably across firms – even when controlling for the asset
classes managed (Exhibit 12). Those firms that have the most productive
investment management professionals have total investment management
costs of five to seven basis points, considerably below the average of 10. Firms
that manage investment management costs most successfully did it through acombination of actions, including appropriate use of junior portfolio managers,
routine product rationalization, and use of commingled vehicles for smaller
accounts.
Sales and marketing productivity. With sales levels down for most asset man-
agers in both retail and institutional markets, many asset managers still need
13

8/15/2019 Accelerating Into the Curve
http://slidepdf.com/reader/full/accelerating-into-the-curve 15/20
to determine what is the sustainable size and composition of their sales and
marketing forces. Just as in investment management, the productivity gaps
between average and distinctive performers are high (Exhibit 13). Sales forces
need to be managed for the long term, not dramatically restructured simply
because of short-term product performance or market-related issues. Still,
many firms have substantial room for improvement in sales productivity, with
the cost of sales and marketing for institutional firms varying from 1 to 10 basis
points, and for retail firms varying from 3 to 20 basis points. In the institution-
al market, leading players are optimizing their sales force roles across asset
classes as well as major functions (e.g. specialized roles for client servicing).Success in retail wholesaling is primarily contingent on skilled external and
internal wholesalers who concentrate on three things: maintaining a few distri-
bution partners, as opposed to covering the waterfront; developing true part-
nerships with the distribution gatekeepers; and smartly targeting the most
productive advisors.
14

8/15/2019 Accelerating Into the Curve
http://slidepdf.com/reader/full/accelerating-into-the-curve 16/20
Technology and operations. Aggressive management of technology and oper-
ations spending has traditionally taken a distant back seat to meeting the
needs of investment and sales professionals for the latest applications.
However, this has come at a cost, with technology and operations spending cur-
rently accounting for an average of five basis points of assets under manage-
ment, and up to 20 basis points for some players (Exhibit 14). Leading firms
are taking a hard look at all of their operations, determining which functions are
strategic, and using multiple approaches to reducing costs, including process
redesign, outsourcing, and early forays into offshoring.
Management and overhead. Despite significant belt-tightening over the past 2
years, management and overhead currently accounts for almost 10 percent of
a typical firm’s cost base. The best firms have eliminated all non-essential cor -
porate services and consistently deliver high-quality, low-cost support to the
15
8/15/2019 Accelerating Into the Curve
http://slidepdf.com/reader/full/accelerating-into-the-curve 17/20
organization. The right approach for capturing potential savings in these areas
varies by type of firm. For firms that have grown organically (versus by acquisi-
tion) substantial cost reduction in the overhead functions typically requires a
clean sheet approach, in which the specific activities of each overhead function
are assessed to determine if their value exceeds their costs, and whether they
should be in-sourced or outsourced. For firms that have been built up via merg-
er, there are often substantial savings to be realized by combining duplicative
support activities across managers and business areas.
* * *
The U.S. asset management industry is maturing, and the competitive intensi-
ty is continuing to rise, leaving no doubt that strong growth and profitability will
be increasingly difficult to capture. However, the best firms are using this as an
opportunity to pull away from the pack, and are accelerating their investments
in managerial talent and capabilities. Now more than ever, we believe there are
real opportunities for senior managers to greatly influence the future of their
firms. Those who combine strategic and operational excellence will be best
positioned to achieve the outstanding returns this industry has to offer.
16

8/15/2019 Accelerating Into the Curve
http://slidepdf.com/reader/full/accelerating-into-the-curve 18/20

8/15/2019 Accelerating Into the Curve
http://slidepdf.com/reader/full/accelerating-into-the-curve 19/20

8/15/2019 Accelerating Into the Curve
http://slidepdf.com/reader/full/accelerating-into-the-curve 20/20
North American Asset Management Practice
September 2003
Designed by the New York Design Center
Copyright © McKinsey & Company
http://retail.mckinsey.com