academic registry research thesis submission
TRANSCRIPT

ACADEMIC REGISTRY Research Thesis Submission
Name: Yushi Noguchi
School/PGI: School of Engineering and Physical Sciences
Version: (i.e. First,
Resubmission, Final)
Final Degree Sought
(Award and
Subject area)
Doctor of Philosophy
Declaration
In accordance with the appropriate regulations I hereby submit my thesis and I declare that:
1) the thesis embodies the results of my own work and has been composed by myself
2) where appropriate, I have made acknowledgement of the work of others and have made
reference to work carried out in collaboration with other persons
3) the thesis is the correct version of the thesis for submission and is the same version as
any electronic versions submitted*.
4) my thesis for the award referred to, deposited in the Heriot-Watt University Library, should
be made available for loan or photocopying and be available via the Institutional
Repository, subject to such conditions as the Librarian may require
5) I understand that as a student of the University I am required to abide by the Regulations
of the University and to conform to its discipline.
* Please note that it is the responsibility of the candidate to ensure that the correct version
of the thesis is submitted.
Signature of
Candidate:
Date:

Submission
Submitted By (name in capitals):
Signature of Individual Submitting:
Date Submitted:
For Completion in the Student Service Centre (SSC)
Received in the SSC by (name in
capitals):
1
ethod of Submission
(Handed in to SSC; posted through
internal/external mail):
2
-thesis Submitted (mandatory for
final theses)
Signature:
Date:

The influence of wood species of casks
on matured whisky aroma
Identification of unique character imparted to Whisky
by casks constructed of Japanese oak
YUSHI NOGUCHI
Master of Engineering
(Tokyo Institute of Technology)
Thesis for the Degree of Doctor of Philosophy
International Centre for Brewing and Distilling
School of Engineering and Physical Sciences
Heriot-Watt University
Riccarton
Edinburgh
December 2016
The copyright in this thesis is owned by the author. Any quotation from the thesis or
use any of the information contained in it must acknowledge this thesis as the source of
the quotation or information

Abstract
Traditionally, whisky is matured in casks made of oak and the aroma is greatly influenced
by wood species. Currently, the predominant cask types used are those of either
American or European oak. In Japan, in addition to these types of cask, a small number
of Japanese oak casks have also been used. Maturation in Japanese oak is known to give
unique coconut aromas.
The aim of this research was to identify the unique coconut aromas imparted by Japanese
oak. The sensory properties of Japanese oak whiskies were investigated in comparison
with whisky matured in American and European oak casks with particular attention to
lactone isomers known to have a coconut aroma. Whiskies matured in Japanese oak
casks were found to develop substantially higher levels of trans-lactone relative to
whiskies matured in either American or Spanish oak. This research focused on the
influence of lactone isomers and found the possibility of a synergistic effect between the
isomers on coconut aroma. Further investigation on the impact of heat treatment on
regeneration of casks determined that colour and aromatics were generated, while
lactones were not regenerated once the levels had been depleted by a period of maturation.

Acknowledgements
I wish to thank Professor Alex Speers, Dr. Fergus Priest, Dr. Paul Hughes, Dr. John
Conner, Dr. Frances Jack, Dr. Dawn Maskell, and Dr. Annie Hill my supervisors for their
advice and encouragement throughout the course of this project. I would like to thank
SWRI members for their cooperation on my sensory analysis. I would like to express
my thanks the ICBD staff at Heriot-Watt University for their support during my
experimental work. Thanks are also due to Ms. Minako Koike and other colleagues at
Suntory Spirits Limited for their analytical help.
Suntory Spirit Limited is thanked for its financial support.

Table of Contents
Chapter 1: Introduction ............................................................................. 1
1.1 Whisky production .................................................................................................. 1
1.1.1 Whisky making process ....................................................................................... 1
1.1.2 Whisky maturation .............................................................................................. 2
1.1.2.1 Decomposition and extraction of wood components .................................... 3
1.1.2.2 Oxidation of components in new make spirits .............................................. 4
1.1.2.3 Generation of aromatic compounds by acetalization and esterification ...... 4
1.1.2.4 Association of water molecules and alcohol molecules ................................ 5
1.1.2.5 Evaporation of alcohol and water, concentration of un-volatile
compounds ...................................................................................................... 5
1.2 Whisky cask ............................................................................................................. 7
1.3 Cask regeneration ................................................................................................... 9
1.4 Japanese oak cask ................................................................................................... 9
1.5 Objectives ............................................................................................................... 10
Chapter 2: Materials and methods .......................................................... 11
2.1 Samples .................................................................................................................. 11
2.1.1 Whisky samples ................................................................................................. 11
2.1.2 Wood samples .................................................................................................... 12
2.1.3 Whisky lactones ................................................................................................. 13
2.1.4 Ethanol solutions .............................................................................................. 13
2.1.5 Model ethanol solutions .................................................................................... 14
2.1.6 Whisky samples with additional lactones ......................................................... 14

2.2 Experiments ........................................................................................................... 14
2.2.1 Extraction from wood chip ............................................................................... 14
2.2.2 Heat treatment of wood chips ........................................................................... 15
2.2.3 Heat treatment of the stave ............................................................................... 15
2.2.4 Colour measurement of extracted solution ...................................................... 15
2.2.5 Separation of whisky lactone isomers .............................................................. 15
2.3 Chemical Analysis ................................................................................................. 16
2.3.1 Fatty acids .......................................................................................................... 16
2.3.2 Fatty acid esters ................................................................................................. 17
2.3.3 Fusel alcohols .................................................................................................... 17
2.3.4 Aromatic compounds ........................................................................................ 18
2.3.5 Whisky lactones ................................................................................................. 18
2.4 Sensory analysis ..................................................................................................... 19
2.4.1 Sensory panellists .............................................................................................. 19
2.4.2 Sample preparation and presentation............................................................... 19
2.4.3 Quantitative descriptive analysis ...................................................................... 19
2.4.4 Threshold measurement .................................................................................... 20
2.5 Statistical analysis ................................................................................................. 21
Chapter 3: The influence of wood species of cask on matured whisky
aroma .......................................................................................................... 22
3.1 Introduction ........................................................................................................... 22
3.2 Results .................................................................................................................... 25
3.2.1 Sensory analysis using standard aroma descriptors for the whisky industry . 25
3.2.2 Chemical analysis of general volatile compounds and wood extractives ....... 29
3.3 Discussion ............................................................................................................... 34
Chapter 4: The identification of a unique character imparted by casks
of Japanese oak .......................................................................................... 38
4.1 Introduction ........................................................................................................... 38
4.2 Results .................................................................................................................... 39
4.2.1 Sensory analysis using special aroma descriptions ......................................... 39
4.2.2 Chemical analysis of whisky lactone ................................................................ 46
4.3 Discussion ............................................................................................................... 53
Chapter 5: The behaviour of whisky lactone isomers in Japanese oak
casks ............................................................................................................ 55
5.1 Introduction ........................................................................................................... 55
5.2 Results .................................................................................................................... 56
5.2.1 Wood extracts analysis ...................................................................................... 56
5.2.1.1 Extraction period .......................................................................................... 57
5.2.1.2 Extraction strength ....................................................................................... 59
5.2.1.3 Stave position ................................................................................................ 61
5.2.1.4 Different depths within the stave of Japanese oak...................................... 66
5.2.2 Effect of heating conditions .............................................................................. 72
5.2.2.1 Heat treatment of wood chips ...................................................................... 73
5.2.2.2 Regeneration in different depth of a stave .................................................. 76
5.2.3 Whisky matured in re-charred cask ................................................................. 87
5.3 Discussion ............................................................................................................... 91

Chapter 6: Synergy between whisky lactone isomers on coconut
aroma .......................................................................................................... 95
6.1 Introduction ........................................................................................................... 95
6.2 Results .................................................................................................................... 96
6.2.1 Determination of odour thresholds of lactones ................................................ 96
6.2.2 Synergistic effects on aroma between whisky lactones .................................. 100
6.2.2.1 Addition of lactones to whisky ................................................................... 100
6.2.2.2 Study of coconut aromas in model ethanol solutions ............................... 102
6.2.2.3 Coconut aroma intensity ............................................................................ 105
6.2.2.4 Possibility of a synergistic effect between whisky lactones ....................... 108
6.2.2.5 Numerical analysis for synergistic effects ................................................. 109
6.2.2.5.1 Sensory analysis of individual lactone isomers .................................... 109
6.2.2.5.2 Sensory analysis of various ratio mixtures of isomers ........................ 115
6.2.3 Distinct aroma of whisky lactones .................................................................. 123
6.2.3.1 Study of coconut aromas in whiskies ........................................................ 124
6.2.3.2 Study of coconut aromas in model ethanol solutions ............................... 125
6.2.3.3 Lactone addition experiments .................................................................... 127
6.3 Discussion ............................................................................................................. 131
Chapter 7: Conclusions & Future work ............................................... 135
Appendix .................................................................................................. 138
Abbreviations ........................................................................................... 155

References ................................................................................................ 156
1
Chapter 1: Introduction
1.1 Whisky production
1.1.1 The whisky making process
Whisky is categorised by both its production location and process into five types:
Scotch whisky, Irish whiskey, Bourbon whiskey, Canadian whiskey, and Japanese
whisky. Within each category the grain of malted barley, maize, wheat, or a mixture of
these is used as a raw material.
As a typical example of the whisky making process, the production of Scotch, Irish, or
Japanese malt and grain whisky is described in Figure 1.1 (Noguchi, 2009). Firstly in
the case of malt whisky, barley is malted in a three-step process (steeping, germination
and drying) to activate enzymes present in the barley grain and breakdown starch reserves.
Next, malted barley is milled into grist and mixed with hot water in order to obtain wort.
Yeast is added to the wort and fermentation is processed. After fermentation, about
seven to nine % abv wash is obtained. Typically wash is distilled twice or three times
(especially in Irish whisky) by pot stills made of copper and new make spirit, which is
clear and colourless, and has strength of about 70 - 80% abv. On the other hand, for
grain whisky, maize or wheat are mainly used, and distillation is carried out by continuous
stills in order to obtain clearer new make spirits. The distillates are diluted by water
down to approximately 60% abv, and filled in casks made of oak. The spirit develops
colour during maturation or by use of caramel.

2
Figure 1.1 Whisky making processes (Noguchi, 2009)
1.1.2 Whisky maturation
During maturation both alcoholic and harsh tastes reduce and woody and sweet aroma
increases. This process is one of the most important processes required to form whisky
aroma. Maturation period depends on target quality, but is generally at least three years
(the minimum maturation period required for Scotch whisky (Scotch Whisky Regulations,
2009)). A cask is not an airtight container, but lets through air, alcohol, or water gently,
so that oxidation by air or evaporation of alcohol takes place during this process. This
process is very complicated and scientific explanation of the maturation is not enough,
but the mechanism is broadly understood as five primal points that influence aroma
formation.
1. Decomposition and extraction of wood components.
2. Oxidation of components in new make spirit.
Peat
Malt WhiskyBarley
Steeping
GerminationKilning Malt
Milling
Saccharification
Fermentation
Wash distillationSpirit distillation Filling
MaturationYeast
Distillates
Water
Yeast
Distillates
Saccharification
Cooking
Milling
Malt
Maize
Continuous distillation
Maturation
Grain Whisky
Wheat

3
3. Generation of aromatic compounds by acetalization and esterification.
4. Association of water and alcohol molecules.
5. Evaporation of alcohol and water: concentration of non-volatile compounds.
These five points are described below.
1.1.2.1 Decomposition and extraction of wood components
Wood components mainly consist of cellulose, hemi-cellulose, and lignin, and
hydrolyzed or pyrolized decompositions formed by charring the inside of the cask are
extracted to whisky. Many of the decompositions derived from lignin are aroma active
compounds such as vanillin, which imparts a sweet aroma. In addition to vanillin,
syringaldehyde, and coniferaldehyde are also extracted. These compounds are
generated by charring (Table 1.1; Nishimura et al., 1989; Baldwin et al., 1967).
Table 1.1 Aromatic aldehydes during maturation reported by Nishimura et al.,
(1989)
Newuncharred
UsedNew
charred
Barrel proof 136.7 137.0 140.8
Age, years 6 6 1.5
Aromatic aldehyde, g/100 °proof
Coniferaldehyde 0.03 0.03 0.12
Sinapaldehyde 0.02 0.04 0.13
Syringaldehyde 0.12 0.14 0.45
Vanillin 0.12 0.06 0.07
Total 0.29 0.27 0.77
200 °proof = 100% abv
Barrel type

4
In addition to these compounds, many compounds derived from the cask have been
identified. One of the well-known compounds is whisky lactone, which has a significant
influence on whisky aroma (Masuda et al., 1971; Suomalainen et al., 1970).
1.1.2.2 Oxidation of components in new make spirits
Cask breathe through the wood stave and air comes into the cask. Therefore,
components of spirits are gently oxidized. Since the surface of casks are normally
charred, oxidation reactions on the char surface are promoted and adsorption to char also
occurs. Ethanol is oxidized into acetaldehyde or acetic acid. This oxidation reaction
was observed by an experiment using ethanol marked by labelled carbon (14C; Reazin et
al., 1976). Dimethyl sulphide, which is a compound of unpleasant seaweed aroma, is
oxidized into Dimethyl sulphoxide. This reaction is promoted by char (Fujii et al., 1992).
1.1.2.3 Generation of aromatic compounds by acetalization and esterification
Aldehydes and esters are groups of flavour compounds contained in whisky. They have
a low aroma threshold and are one of the prime aroma compounds in whisky. Aldehydes
generally have stimulative aroma, but acetals have pleasant fruity aroma (Perry et al.,
1986). Many aldehydes change into acetals by static reactions during maturation
(Figure 1.2). When the level of aldehydes and acetals before maturation are compared
with after four or five years maturation, the observed trend is that aldehydes, such as
diacetyl, decrease and acetals increase (Masuda et al., 1980; Reazin et al., 1981). On
the other hand, esters have fragrant fruity aromas and they are increased during
maturation because carboxylic acids esterify with ethanol. Most of this esterification is
ethyl acetate from acetic acids (Reazin et al., 1981).

5
C2H5OH + CH3CHO → CH3CHOC2H5 + C2H5OH
↓
CH3CH(OC2H5)2 + H2O
Figure 1.2 Acetal formation from ethanol and acetaldehyde (Koga, 2009)
1.1.2.4 Association of water molecules and alcohol molecules
In addition to various chemical reactions, physical changes also occur during maturation.
A representative example is the change of the association of water molecules and alcohol
molecules. The association has been measured by various methods including
thermodynamic calculation of hydrogen bonding, mass spectrometry of liquid cluster,
and small angle X-ray scattering (Nishimura et al., 1983; Aishima et al., 1992; Furusawa
et al., 1990). It is thought that alcohol harshness generally weakens due to these changes
and they contribute to a smooth taste (Nishimura et al., 1989).
1.1.2.5 Evaporation of alcohol and water: concentration of non-volatile compounds
Volatile compounds including ethanol and water evaporate little by little through wood
during maturation. The evaporation ratio of various compounds was measured in
laboratory scale experiments by Hasuo et al. (1986) using ethanol model solutions (Table
1.2). Acetaldehyde has a high ratio, but acetic acid low (Hasuo et al., 1986). The
evaporation ratio is normally influenced by a compound’s boiling point, but also
influenced by both the degree of penetration into the cask and volatility. Since acetic
acid is generated from the decomposition of wood, the calculation of evaporation needs
consideration of wood extraction. In the case of ethyl caproate, this is a low volatile
compound and the loss is less than one percent of total liquid, even excluding evaporation.

6
Low volatile or non-volatile compounds are concentrated as a result. When the volume
is decreased and headspace in the cask increased through maturation, air comes into the
cask and oxidation reactions are promoted (Conner et al., 2003).
Evaporation ratio =
Amount of the substances evaporated from barrel of whisky
Amount of the added substances × 100
Table 1.2 Volatile ratio of compounds in ethanol model solution reported by Hasuo
et al. (1986)
As described above, changes during maturation are influenced by the balance of chemical
reactions and physical reactions. Therefore, even if one factor is changed, significant
changes on aroma or quality can occur; there are many factors, chemical components in
spirit, condition of maturation, oak species, cask size, charring condition, etc. In whisky
production, whisky is made with great attention to various factors in order to control its
aroma and quality (Nishimura et al., 1989).
3 months 6 months 12 months
4.21 10.82 31.98
1.68 4.26 12.66
1.47 3.45 10.59
1.34 2.76 10.49
1.07 2.54 8.66
0.67 1.74 5.35
0.62 1.65 5.15
0.20 0.58 1.28
0.25 0.28 0.96
1.71 7.76 7.59
1.69 3.52 10.17
Evaporation ratio
Acetaldehyde
Ethyl alcohol
n-Propyl alcohol
Ethyl acetate
Isobutyl alcohol
Isoamyl acetate
Isoamyl alcohol
Ethyl caproate
Acetic acid
Water
Total

7
1.2 Whisky casks
Traditionally whisky is matured in casks made of oak. In the scientific classification,
oak belongs to the family Fagaceae in the order Fagales, and the Genus is Quercus. The
aroma of the maturing spirit is influenced by both wood species and previous cask history
(Conner et al., 2003). Currently, bourbon casks made of American oak (Quercus alba)
which has been previously used for bourbon whiskey are mainly used. These casks
impart a light and floral aroma to a whisky (Conner et al., 2003). Alternatively, sherry,
brandy, or French wine casks, made of European oak (Quercus robur or Quercus sesslilis)
that have been previously used for sherry, brandy, or French wine maturation are used.
These are quite different from American oak, with spirit matured in these casks containing
higher levels of colour and cask extractives (Conner et al., 2003). Sherry casks, made
from European oak, produce whiskies with typical ‘sherry wood whisky’ characteristics,
combining vanilla, fruity and sweet aromas (Conner et al., 2003). Both types of cask
are used in Japan to mature malt and grain spirits. However, for more than 50 years, a
small number of casks made from Japanese oak (Quercus mongolica) have also been used.
Maturation in Japanese oak casks is known to give unique aromas, ‘Japanese shrine and
temple’, or ‘heavy oriental smell’ which has never seen in other kinds of oak (Koshimizu,
2011).
Oak wood is normally used to construct casks for whisky maturation; indeed, the Scotch
Whisky Regulations strictly stipulate its use (Scotch Whisky Regulations, 2009).
However, other wood varieties are used for other alcohol beverages. Chestnut (Catanea
aiva) had historically been used for wine maturation as a good substitute for oak
(DeRosso et al., 2009). In addition to chestnut, cherry (Prunus avium), acacia (Robinia
pseudoacacia), and mulberry (Morus alba and Morus nigra) are known as a wood for

8
casks and the wines matured in these casks were reported to have different aroma profiles
(Fernández de Simón et al., 2014). In the case of cherry, this was most oxidative
environment in these varieties, and therefore the least suitable for long term maturation
(DeRosso et al., 2009).
Casks are made by a combination of staves. In the case of barrels, around 30 staves are
required (Figure 1.3), and in the case of butts, around 50 staves (Conner et al., 2003).
When spirits are charged in the cask, maturation is started and various changes occur
(Section 1.1). Whisky is evaporated and its volume decreases during maturation. As
a result, it is assumed that the top stave would become dry over time as it has reduced
contact with the liquid, the bottom stave would be wet, with some staves in the top third
of the cask having shortened contact as evaporation reduces the liquid level.
Figure 1.3 Example of the combination of staves for barrel.

9
1.3 Cask regeneration
Whisky casks are normally used for a couple of decades. When the whisky is discharged
after a maturation period, the casks are reused until the cask is exhausted and fail to add
a aroma or colour to whisky. These casks can be regenerated by de-charring the inner
face and re-charring using a gas burner. When casks are re-charred, thermal degradation
of lignin yields aroma compounds similar to those produced in a new charred cask.
However, the balance of wood extractives in regenerated casks is very different from that
of a new charred cask (Conner et al., 2014).
1.4 Japanese oak casks
Japanese oak is called ‘Mizunara’ in Japanese, which means water oak. The habitat of
Japanese oak is East Asia, including Japan, the Korean Peninsula, north east of China,
and south Sakhalin, and its formal scientific name is Quercus mongolica Fischer ex
Turczaninow varietas grosseerrata (Blume) Rehder et Wilson. The characteristics of
this oak are that it is softer and has fewer tyloses than American oak (Kato, 1985).
Japanese oak casks, of 500 litre capacity, are generally seasoned with oloroso sherry type
wine for one year. After seasoning, the cask is used for whisky maturation. At a
younger age the Japanese oak matured whisky has fresh and light characteristics, similar
to those obtained using a bourbon cask. However, over twenty years, the aroma changes
into a unique one, which is different from that produced by other oak casks. In Japan
these aromas are described as ‘well ripened pineapple’, ‘melted butter and cinnamon’,
‘Japanese shrine and temple’, and ‘heavy oriental smell’ (Koshimizu, 2011; Noguchi et
al., 2008).

10
1.5 Objectives
As described above, since the whisky matured in Japanese oak cask has unique aromas,
the aim of this research was to identify the unique aromas imparted by casks of Japanese
oak. Here, the sensory properties of these Japanese oak whiskies, relative to the other
whisky types was studied. In addition to this, observations regarding the impact of oak
species on the isomeric ratio of whisky lactones were studied, which are known to make
an important contribution to mature character (Masuda and Nishimura, 1971). Whiskies
matured in Japanese oak casks for up to forty years develop substantially higher levels of
trans-whisky lactone, relative to whiskies matured in either American or Spanish oak.
This raises the possibility that the whiskies matured in Japanese oak can be distinguished
analytically, by the determination of the whisky lactone ratio and content.

11
Chapter 2: Materials and methods
2.1 Samples
2.1.1 Whisky samples
Whiskies (Table 2.1) were used for the sensory analysis (Section 2.4) and the chemical
analysis (Section 2.3).
Table 2.1 Whisky samples
These were selected as examples of typical matured whiskies of each age. Throughout
this thesis, the whiskies are referred to as;
SampleName
WhiskyType
Spirit Distilled
Year Strength[% abv]
CaskTreatment
JPN-9yo Malt Yamazaki 2000 56.0 - 59.8 No treatment
JPN-10yo Malt Yamazaki 1999 56.3 - 59.8 Re-charred
JPN-20yo Grain Chita 1987 47.6
JPN-27yo Malt Yamazaki 1980 63.0
JPN-40yo Malt Yamazaki 1960 58.2
USA-20yo Grain Chita 1988 52.9
USA-27yo Malt Yamazaki 1980 53.7
USA-40yo Malt Yamazaki 1968 63.7
Spanish oakwhisky
SPN-20yo Grain Chita 1988 54.5
Japanese oakwhisky
American oakwhisky
Youngwhisky
Oldwhisky

12
• ‘JPN whisky’ referring to whisky matured in casks made of Japanese oak,
Quercus mongolica Fischer ex Turczaninow varietas grosseerrata (Blume)
Rehder et Wilson
• ‘USA whisky’, that is whisky matured in casks made of American oak, Quercus
alba
• ‘SPN whisky’, whisky matured in casks made of Spanish oak, Quercus robur or
Quercus petraea
It was assumed that old whiskies (20 - 40 years) of USA and SPN origin would
approximately correspond in age to JPN whiskies for comparison purpose. Young JPN
whiskies from the same malt distillery, but different cask treatments, were selected were
also used in this study.
2.1.2 Wood samples
Staves were collected from casks in which whisky (as described in Table 2.1) was
matured or supplied from a cooperage (Omi Cooperage Limited, Japan), were cut into
slices using a wood slicer (Electric planer, MAKITA, Japan) in the cooperage. A series
of 1 mm slices were collected and these slices were then cut into chips by the cooperage
(Figure 2.1).
Figure 2.1 Wood sample collection

13
2.1.3 Whisky lactones
The whisky lactone used in this study was obtained from Sigma Aldrich (Dorset, UK),
this was reported to contain the same ratio of the four isomers subsequently listed
(Guichard et al., 1995). The isomers of this reagent were separated to both cis-lactones,
3S,4S (cis) and 3R,4R (cis), and both trans-lactones, 3S,4R (trans) and 3R,4S (trans), by
silica-gel chromatography (Section 2.2.5). The purities of these separated lactones were
quantified by GC-MS (Section 2.3.5). No cis-lactones were detected in the separated
trans-lactones but the cis-lactones contained 1.1% of trans-lactones. This
contamination level is thought to be low enough to disregard. When the separated cis-
lactones and trans-lactones, which include the natural and unnatural lactones, were
compared with the natural lactones in whisky using GC-Olfactometry (Section 2.3.5), the
separated lactones showed almost the similar aroma to the natural lactones which
described ‘heavy & oily’ as cis-lactone and ‘light & fresh’ as trans-lactone refer to
sensory panels. Thereby, these separated lactones were used respectively as cis or trans-
lactone for the duration of this study.
2.1.4 Ethanol solutions
Ethanol solutions (20, 40, 60, 80% abv) were prepared by dilution of 99.5%+ ethanol
obtained from Kanto Chemical (Tokyo, Japan) with pure water obtained from a Milli-Q
integral system (Millipore, Tokyo, Japan).

14
2.1.5 Model ethanol solutions
The model solutions were prepared, each contained one of the lactones (cis or trans)
which was prepared using the separation method described in Section 2.2.5. Lactones
were added to give final concentrations of 0.25, 0.50, 0.75, 1.00 mg/L respectively or
other concentrations in a 20% abv ethanol solution (Section 2.1.4).
2.1.6 Whisky samples with additional lactones
Whisky samples of 10 mL volume (Table 2.1) were prepared, to these 0.1 mL of 100
mg/L lactone ethanol solution (Section 2.2.5) was added. The two lactone isomers (cis
and trans) were added individually.
2.2 Experiments
2.2.1 Extraction from wood chip
For the chemical analysis of woods, wood components were extracted from wood chips
by stirring these with 20 mL of a 60% abv ethanol solution (Section 2.1.4). The quantity
of wood chips used was 2.0 g (Section 2.1.2) and extractions occurred for one day (24
hours) at room temperature (approximately 20°C).
15
2.2.2 Heat treatment of wood chips
Samples of wood chips (4.0 g) were placed on a petri dish and heated in a gas
chromatography oven (HP 5890 series, Agilent, UK), for two, four, and six minutes at
130, 150, 180, 210, 250, and 300°C respectively. After heating, these chips were cooled
naturally and stored in plastic bags in order not to be affected by heat again.
2.2.3 Heat treatment of the stave
The charring of staves was carried out using the handy burner of GB-2001 (Prince, Japan).
The heating strength of light or heavy charring was determined by visual observation.
The toasting of staves was carried out by placing on the hot plate of PC-420D (Titec,
Japan) at 250°C for 30 minutes.
2.2.4. Colour measurement of extracted solution
The colour of the extracted solution was measured by the attenuation of light at 430
nanometres using a UV-Visible Spectrophotometer (Shimadzu, Japan) using the
European Brewery Convention method (EBC Method 9.6, 2000).
2.2.5. Separation of whisky lactone isomers
The reported method (Otsuka et al 1974) was used for the separation of lactone isomers.
Using 40 mL of silica-gel 70 - 230 mesh (Sigma Aldrich, Dorset, UK) the cylinder column
(ϕ = 1 cm) was filled. The mixture solvent of diethyl ether - pentane (1:6) obtained
respectively from Fisher Scientific (Hull, UK) was passed through the column until

16
remained air was removed. Following this 200 mg of whisky lactone mixture (Sigma
Aldrich, Dorset, UK) was added to the column and the solvent of ether - pentane (1:6)
was flown. The flown solvent was collected as 32 fractions of 10 mL. The 12 - 14
fractions for trans-lactone and the 25 - 29 fraction for cis-lactone fraction were
concentrated in about 40°C hot water on an individual basis. To these concentrated
fractions 99.5%+ ethanol (Fisher Scientific, Hull, UK) was producing a 100 mg/L of
lactone ethanol solution.
2.3 Chemical Analysis
The analysis of general volatile compounds in whisky (Piggott et al., 1993), specifically
to determine the concentration of fatty acids (Section 2.3.1), fatty acid esters (Section
2.3.2), and fusel alcohols (Section 2.3.3) was carried out by gas chromatography. The
concentrations of these components were calculated as 100% abv, this was because these
compounds are derived from the original spirit (metabolites of fermentation) and were
evaporated during maturation. The analysis of general wood extractives of aromatic
compounds in whisky were carried out with HPLC (Section 2.3.4). The analysis of
whisky lactones were carried out with GC-MS (Section 2.3.5). The concentrations of
aromatics and lactones were calculated on an ‘as is’ basis.
2.3.1 Fatty acids
Analysis was carried out on a GC-FID, Shimadzu 2010 (Shimadzu, Japan). The column
was a 50 m x 0.32 mm HP-FFAP capillary column with a film thickness of 0.5 μm
(Agilent, Japan). The initial oven temperature was 100˚C, increasing to 210˚C at

17
5˚C/min with a final hold time of 28 min. The injector temperature was maintained at
250˚C. The fatty acids compounds which were analysed for were acetic acid, propionic
acid, iso-butyric acid, iso-valeric acid, hexanoic acid, octanoic acid, decanoic acid, and
dodecanoic acid. Data were collected using the GC solution (Shimadzu, Japan).
2.3.2 Fatty acid esters
Analysis was carried out using a GC-FID, 6890N (Agilent, Japan). The column was a
50 m x 0.32 mm HP-ULTRA2 capillary column with a film thickness of 0.52 μm (Agilent,
Japan). The initial oven temperature was 42˚C with a hold time of 8 min, increasing to
230˚C at 10˚C/min with a final hold time of 23 min. The injector temperature was
maintained at 250˚C. The fatty acid ester compounds which were analysed for were
ethyl acetate, ethyl hexanoate, ethyl octanoate, ethyl decanoate, ethyl dodecanoate, ethyl
tetradecanoate, ethyl hexadecanoate, and ethyl hexadecenoate. Data were collected
using the Chemstation (Agilent, Japan).
2.3.3 Fusel alcohols
Analysis was carried out on a GC-FID, 6890N (Agilent, Japan). The column was a 50
m x 0.32 mm HP-ULTRA2 capillary column with a film thickness of 0.52 μm (Agilent,
Japan). The initial oven temperature was 42˚C with a hold time of 8 min, increasing to
230˚C at 10˚C/min with a final hold time of 23 min. The injector temperature was
maintained at 250˚C. The compounds of fusel alcohols compounds which were
analysed for were n-propyl alcohol, iso-butanol, iso-amyl alcohol, active-amyl alcohol,
and β-phenylethyl alcohol. Data were collected using the Chemstation (Agilent, Japan).

18
2.3.4 Aromatic compounds
Analysis was carried out using a HPLC, LC-10AD (Shimadzu, Japan) with the UV
detector, SPD-10A (Shimadzu, Japan). The column was a Shim-pack CLC-ODS 0.15
m x 6.0 ϕ column (Shimadzu, Japan). The oven temperature was 50˚C. Aromatics
analysed for were vanillic acid, syringic acid, vanillin, syringaldehyde, and sinapaldehyde.
Data were collected using the LC solution (Shimadzu, Japan).
2.3.5 Whisky lactones
Analysis was carried out using a GC, Hewlett-Packard 5890 series II (Agilent, UK).
The flow from the GC was split in the approximate ratio 6:1 between a Gerstel ODP2
olfactory detection port fitted with a glass sniffing cone (GERSTEL, Germany) and a
5971 mass spectrometer (Agilent, UK). The column was a 60 m x 0.32 mm ZB-Wax
capillary column with a film thickness of 0.5 μm (Phenomenex, UK). The initial oven
temperature was 80˚C, increasing to 250˚C at 3˚C/min with a final hold time of 5 min.
The injector temperature was maintained at 250˚C. The mass spectrometer was
operated in the electron impact (EI) mode and ions from 99 amu were scanned. Data
were collected using the Chemstation (Agilent, Japan).

19
2.4 Sensory analysis
2.4.1 Sensory panellists
Sensory experiments were carried out by the Scotch Whisky Research Institute’s internal
sensory panel. This panel compromised of 20 highly trained members of staff who had
undergone extensive sensory training and with substantial experience in the assessment
of alcohol beverages. A minimum of seven panelists participated in each sensory
session. Assessments were carried out in individual booths.
2.4.2 Sample preparation and presentation
Whisky samples as described in Table 2.1 were reduced to 20% abv using well run tap
water. A total sample size of 20 mL was presented for assessment in clear colourless
130 mL nosing glass, and were covered with 50 mm watch glasses in order to retain any
headspace volatile compounds. Samples were identified using three random codes and
presentation order was randomized. Sensory panelists performed the assessment in
individual booths, under red light, to overcome any bias relating to sample colour or
turbidity. All assessments were based on nosing (aroma) only, with no tasting being
carried out as part of this work. Data were collected using Compusense V.5, sensory
data collection software (Compusense Inc., Canada)
2.4.3 Quantitative descriptive analysis
All sensory analysis was carried out using Quantitative Descriptive Analysis, which was
used to provide a measure of the relative intensity of a range of pre-determined sensory

20
attributes. This test was set-up in accordance with British Standard BS 13299:2003 (BS
2003). Attributes were scored using a scale of 0.0 to 3.0 with intervals of 0.1. Data
were collated and exported to Excel and examined for significant differences (Section
2.5).
2.4.4 Threshold measurement
The threshold measurement was determined by following the method described in ISO
13301 which is classified as ‘general guidance for measuring odour, aroma, and taste
detection thresholds by a three-alternative forces-choice (3-AFC) procedure’. The
samples were prepared in 20% abv ethanol solution, which included each concentration
of lactone or lactones, cis-lactone (Table 2.2).
Table 2.2 Lactone concentrations for threshold measurement in 20% abv ethanol
solution
If an aroma could not be detected by any of the panellists the data point was removed
before carrying out the statistical analysis. The total number of panellist against log
concentration was plotted, and a straight line was fitted to the graph following the
standard methodology described in ISO 13301. The formula of this line, � = A� + B,
cis-lactone 0.00 0.05 0.10 0.15 0.20 0.25
trans-lactone 0.00 0.40 0.80 1.20 1.60 2.00
Mixture(cis:trans = 1:1)
0.00 0.05 0.10 0.15 0.20 0.25
Concentration [mg/L]

21
was calculated by the least squares method. The Log concentration at which half of the
panel can detect the aroma was calculated;
Log concentration = (H − B)
A
H = half the total number of panellists
The log concentration was converted back to standard concentration of mg/L.
2.5 Statistical analysis
Sensory and chemical analysis data were analysed by determining whether or not the
number was significantly greater than the number likely to be obtained. This analysis
was carried out using a tool of Microsoft Excel software (Washington, USA). A
probability value (p value) of <0.05 for repeated data by t-test which is generally used for
comparison of two samples or ANOVA (Analysis of variance) which is generally used
for more than 3 samples were interpreted as significant difference.

22
Chapter 3: The influence of wood species of cask on matured whisky
aroma
3.1 Introduction
Whisky which has been matured in Japanese oak casks for more than 20 years, has often
been described by consumers as having a unique aroma, which is not found in whisky
that has been matured in casks constructed from other types of oak. These aromas have
been described by Japanese consumers as, ‘Japanese shrine and temple’, ‘heavy oriental
smell’, it has been suggested that these terms describe the Japanese taste (Koshimizu,
2011; Noguchi et al., 2008).
Whiskies matured in Japanese oak cask have recently drawn attention from the whisky
industry (Shimatani et al., 2013) and these whiskies have won awards in worldwide
competitions. Recently, in the International Spirits Challenge, Yamazaki Mizunara cask
whisky was awarded the Gold Medal three times between 2013 and 2015 (it should be
noted that Mizunara means Japanese oak in Japanese). Therefore, whiskies matured in
Japanese oak casks have the potential to be in greater consumer demand in the future.
However, the terminology used to describe the aromas of Japanese whisky are quite ‘local’
terms which would be familiar to Japanese consumers, but not yet included in worldwide
whisky lexicon.
The starting point for this study, as it was working with European whisky researchers,
was to develop a translation of these descriptions in order to adequately share the aromas
experienced. The typical aroma compounds of this whisky and associated characteristic

23
compounds have not previously been identified, which may be because the interest in
Japanese oak whisky has only increased in recent years.
Using spirit exposed to American and European oak as a comparison, this research was
designed to determine the characteristics and chemical composition of whisky matured in
Japanese oak. Whiskies matured in European and American oak are those most
recognised by whisky consumers around the world and the accepted terminology used in
sensory analysis is often based around these (Figure 3.1). Finally, Japanese whisky
matured in American, Spanish (European), and Japanese oak were compared by a trained
sensory panellists (Section 2.4.1).

24
Figure 3.1 The Scotch Whisky Research Institute’s Aroma Wheel

25
3.2 Results
3.2.1 Sensory analysis using standard aroma descriptors for the whisky industry
Sensory analysis (Section 2.4) was carried out by the Scotch Whisky Research Institute’s
internal sensory panel on a range of whiskies, those chosen for sensory analysis were a
27 year old matured in Japanese oak, and a 27 year old matured in American oak (Section
2.1.1). This age of matured whisky was chosen as this is estimated to demonstrate the
typical aromas extracted by the spirit from each type of cask by Suntory blenders. The
aroma descriptors employed are those frequently used by the whisky industry in both the
United Kingdom and Japan, and which can be found on the Scotch whisky aroma wheel
(Figure 3.1).
The individual responses generated by the sensory panel are presented in Table 3.1.
Interestingly not all descriptors were picked up by all panel members. This is likely to
represent the consumer experience, where individuals will experience whisky differently
and due to differencing sensory threshold levels (Lee et al., 2000). Panellists could give
scores on an increasing scale from 0.0 (low) to 3.0 (high) (Section 2.4.3), scores, mean
scores, and standard deviations are given in Table 3.1, and indicate the variation which
was observed between individual results.
The mean scores were compared between USA whisky and JPN whisky, and all
descriptors’ values were found to be similar. Since the p value (Section 2.5) of all
descriptors with the exception of ‘feinty’ and ‘sulphury’ were more than 0.05, significant
differences were not observed in the most of descriptors.
26
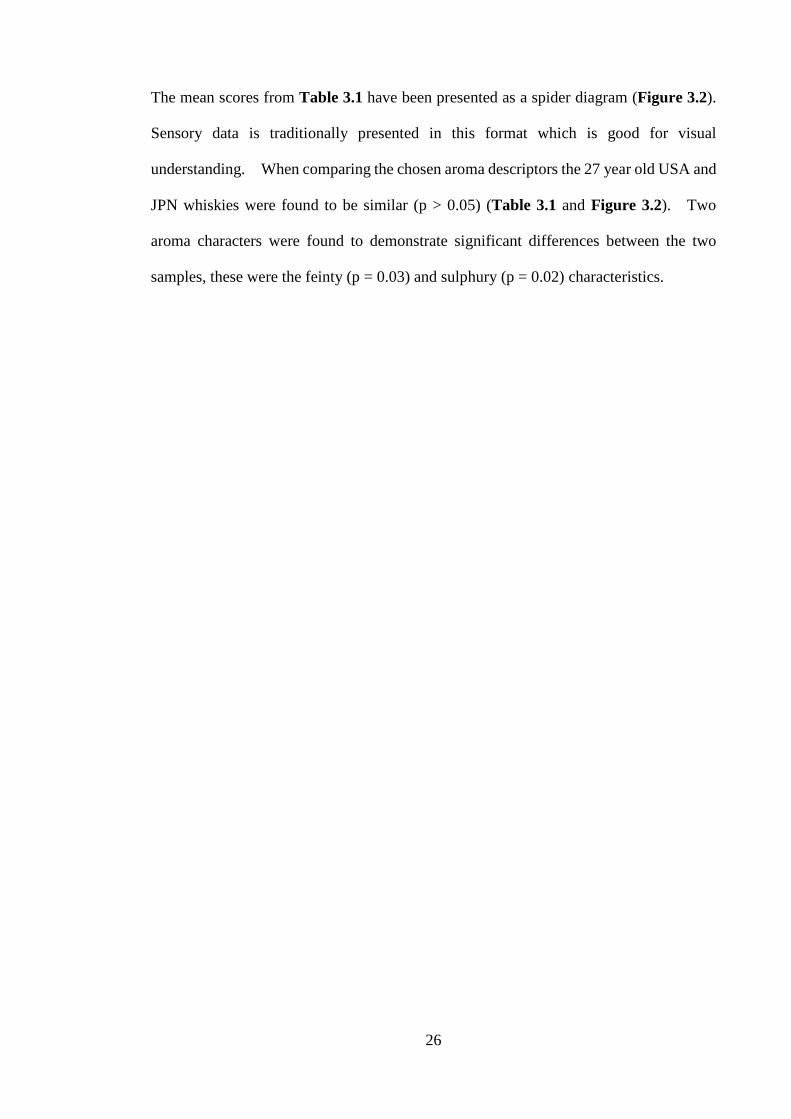
The mean scores from Table 3.1 have been presented as a spider diagram (Figure 3.2).
Sensory data is traditionally presented in this format which is good for visual
understanding. When comparing the chosen aroma descriptors the 27 year old USA and
JPN whiskies were found to be similar (p > 0.05) (Table 3.1 and Figure 3.2). Two
aroma characters were found to demonstrate significant differences between the two
samples, these were the feinty (p = 0.03) and sulphury (p = 0.02) characteristics.

27
Table 3.1 Sensory analysis results for 27 year old JPN and USA whiskies using
standard aroma descriptors
Pu
ngen
t
Cereal
Green
grassy
Flo
ral
Fresh
fruit
So
lventy
Fein
ty
Dried fru
it
Sw
eet
Wo
ody
Sp
icy
Oily
Stru
ck match
Sulfu
ry
1.1 0.4 0.2 0.1 0.7 0.4 0.2 0.9 0.3 0.5 0.5 0.2 0.4 0.1
1.4 1.8 2.0 2.0 2.3 1.7 2.0 2.0 1.9 1.6 2.0 0.7 0.8 0.7
1.5 0.5 0.0 0.2 0.5 0.2 0.7 2.0 1.6 1.3 0.8 0.6 0.0 0.0
1.3 0.2 0.8 0.5 0.7 1.2 0.8 1.3 0.7 1.3 1.1 0.5 1.2 0.3
1.9 0.5 0.9 1.2 1.1 1.4 1.4 0.5 1.2 1.7 0.9 1.0 0.2 1.0
0.7 0.2 0.6 0.2 0.2 1.0 0.9 1.0 0.3 1.1 0.8 1.1 0.2 0.2
2.0 0.0 0.0 1.5 1.0 1.0 1.0 - - - - - - -
1.0 0.0 0.0 0.0 0.0 0.5 0.5 0.5 0.5 0.5 0.0 0.0 0.5 1.5
0.5 0.2 0.4 0.5 0.6 0.2 0.1 0.6 0.5 1.1 0.4 0.4 0.0 0.0
0.1 0.0 0.2 0.5 0.0 0.0 0.0 - - - - - - -
0.2 0.0 0.4 0.0 0.0 0.2 0.4 0.1 0.3 0.2 0.2 0.0 0.2 0.2
0.0 0.0 0.0 0.0 0.0 0.0 0.0 - - - - - - -
1.7 1.5 1.5 1.5 0.5 0.9 0.8 - - - - - - -
1.7 1.0 0.8 2.0 2.0 0.6 0.5 2.3 1.5 2.5 0.5 2.0 0.8 0.4
Mean 1.1 0.5 0.6 0.7 0.7 0.7 0.7 1.1 0.9 1.2 0.7 0.7 0.4 0.4
St. Dev. 0.7 0.6 0.6 0.7 0.7 0.5 0.5 0.7 0.6 0.6 0.5 0.6 0.4 0.5
1.0 0.2 0.1 0.2 0.5 0.2 0.1 0.9 0.2 0.5 0.5 0.2 0.1 0.1
1.1 1.7 1.7 1.8 2.1 1.7 1.5 2.2 1.6 1.6 1.7 0.8 0.5 0.5
1.6 0.8 0.2 0.2 0.8 0.2 0.2 1.4 1.1 1.0 0.7 0.4 0.0 0.0
1.3 0.4 1.2 1.0 1.5 0.8 0.5 1.0 1.1 1.0 0.7 0.5 0.2 0.0
1.9 0.7 1.5 1.7 1.0 1.4 1.0 0.5 1.0 1.5 0.5 1.0 0.2 0.5
0.7 0.2 0.6 0.2 0.2 0.7 0.5 0.7 0.3 1.0 0.5 1.1 0.4 0.2
1.5 0.0 0.5 1.0 0.5 1.5 0.0 - - - - - - -
1.5 0.5 0.0 0.0 0.5 0.0 0.5 0.5 0.5 1.0 0.0 0.0 0.5 0.5
0.5 0.2 0.7 1.1 1.5 0.2 0.1 1.1 1.0 0.7 0.9 0.2 0.0 0.0
0.0 0.4 0.5 0.4 0.0 0.0 0.0 - - - - - - -
0.2 0.0 0.4 0.0 0.0 0.1 0.4 0.1 0.1 0.1 0.0 0.0 0.0 0.0
1.1 0.9 1.0 0.5 1.4 1.5 1.0 - - - - - - -
1.0 0.5 0.8 1.8 1.8 0.7 0.5 2.0 2.0 2.5 0.7 2.0 0.8 0.4
Mean 1.0 0.5 0.7 0.8 0.9 0.7 0.5 1.0 0.9 1.1 0.6 0.6 0.3 0.2
St. Dev. 0.5 0.4 0.5 0.7 0.7 0.6 0.4 0.6 0.6 0.6 0.5 0.6 0.3 0.2
0.17 0.87 0.24 0.85 0.22 0.79 0.03 0.47 0.74 0.23 0.18 0.79 0.14 0.02
JPN27yo
USA27yo
p valueby t-test(N = 7-14)

28
Figure 3.2 Spider diagram of sensory analysis results for 27 year old JPN and USA
whiskies using standard aroma descriptors
The similarity in the patterns demonstrated in Figure 3.2 suggest that this sensory
evaluation did not accurately reflect the differences experienced when tasting the USA
and JPN whiskies side by side. Therefore, it was suggested that a further in depth
sensory analysis could be undertaken by developing new terminology which could be
added to the whisky aroma wheel when working with Japanese whisky.
0.0
0.5
1.0
1.5
2.0
2.5
3.0Pungent
Cereal
Greengrassy
Floral
Freshfruit
Solventy
Feinty
Driedfruit
Sweet
Woody
Spicy
Oily
Struckmatch
Sulfury
JPN-27yo
USA-27yo
(N = 7-14)

29
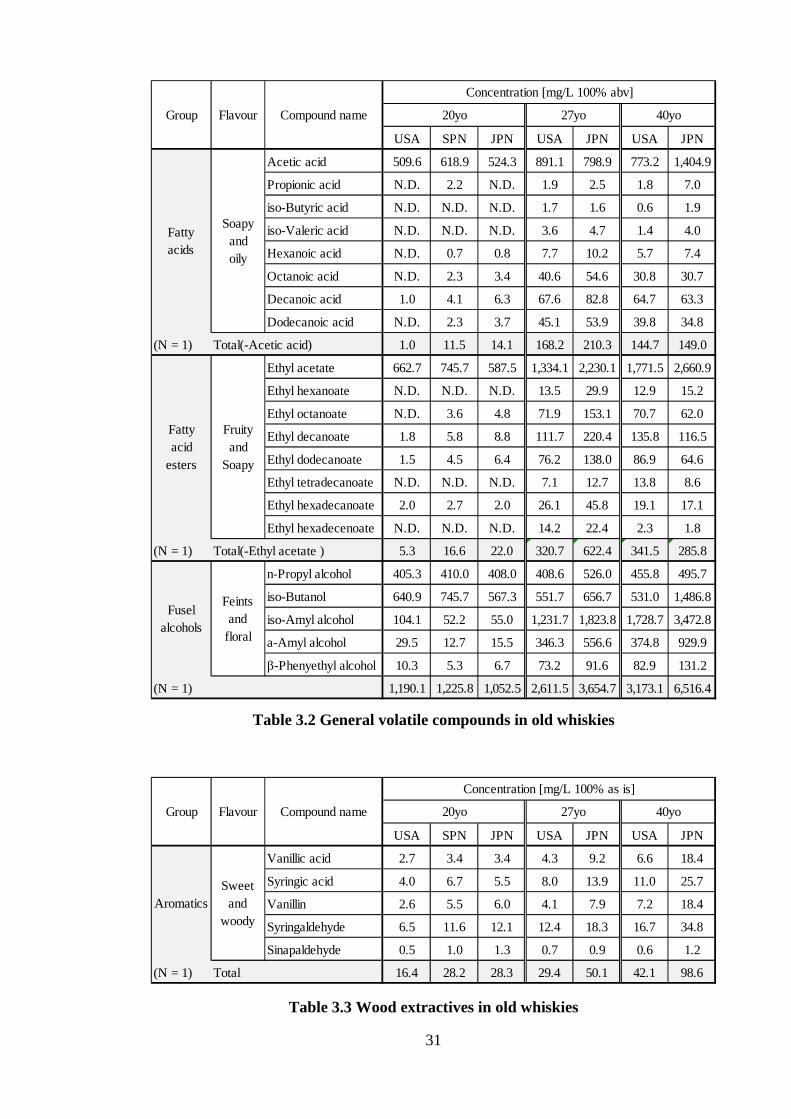
3.2.2 Chemical analysis of general volatile compounds and wood extractives
A range of JPN and USA whiskies (20, 27, and 40 years old) were subjected to chemical
analysis for general volatile compounds and wood extractives which reflect some of
descriptors in the aroma wheel (Figure 3.1). The focus of this study was on fatty acids
(Section 2.3.1) which are associated with soapy and oily aromas, fatty acid esters
(Section 2.3.2) linked with fruity and soapy aromas, as well as fusel alcohols (Section
2.3.3) described as feints and floral aromas and aromatics (Section 2.3.4) which
contribute sweet and woody aromas (Table 3.2-3; Lee et al., 2001). These families of
compounds were chosen because these compounds are quite general and common in
whisky industry to compare whisky aromas and tastes.
A Spanish 20 year old grain whisky (SPN) was subjected to the same analysis, this was
chosen because SPN whisky is reported to have a different type of aroma from USA
whisky (Koshimizu, 2011) and JPN whiskies. In addition to this, grain whisky distilled
by continuous still and purified more than pot still (Section 1.1.1) has fewer compounds
of fatty acids and fatty acid esters in the new make spirit which makes it easier to compare
the influence of the cask itself with other kinds of wood (Koshimizu, 2011).
Comparison of the 20 year old grain whiskies found that the JPN and SPN whiskies
showed higher levels fatty acids, fatty acid esters, and aromatics than the USA whisky
(Table 3.2 and Table 3.3). Comparison between JPN and SPN whiskies found that they
contained 14.1 mg/L and 11.5 mg/L respectively of total fatty acids, but in USA whisky
this was lower at 1.0 mg/L (Table 3.2). Examination of the total fatty acid esters content
determined that JPN and SPN whiskies contained 22.0 mg/L and 16.6 mg/L respectively,
but in the USA whisky these compounds were found at a concentration of 5.3 mg/L

30
(Table 3.2). Analysis of the total aromatics established that JPN and SPN whisky
contained 28.3 mg/L and 28.2 mg/L respectively, but in the USA whisky this was 16.4
mg/L (Table 3.3). In contrast to this the levels of total fusel alcohols were similar,
around 1,100 mg/L in all whiskies analysed (Table 3.2).
When considering the 27 year old malt whiskies, the JPN whisky demonstrated higher
levels all of fatty acids, fatty acid esters, fusel alcohols, and aromatics than USA whisky.
The differences observed were not consistent and determined to be greater by a factor of
125%, 194%, 140%, and 170% respectively.
Analysis of the 40 year old malt whiskies determined that the JPN whisky was found to
have higher levels of fusel alcohols and aromatics, but fewer fatty acids and fatty acid
esters than were found in the USA whisky.
Fatty acids (except acetic acid) and fatty acid esters (except ethyl acetate) were only
detected at very low levels (1.0, 11.5, 14.1 mg/L, and 5.3, 16.6, 22.0 mg/L respectively)
in the 20 year old whiskies (Figure 3.3), but were detected at greater concentrations in
the 27 and 40 year old samples (Figure 3.3). In contrast to this, the concentrations of
acetic acid and ethyl acetate in the 20 year old whiskies were clearly detected (509.6,
618.9, 524.3 mg/L, and 662.7, 745.7, 587.5 mg/L respectively). Evaluation of the older
27 and 40 year old spirits found that when JPN whiskies were compared with USA
whiskies, the concentrations of fatty acid esters are much higher in the 27 year old whisky
(622.4 mg/L) than in the 40 year old whisky (285.8 mg/L).
31
Table 3.2 General volatile compounds in old whiskies
Table 3.3 Wood extractives in old whiskies
USA SPN JPN USA JPN USA JPN
Acetic acid 509.6 618.9 524.3 891.1 798.9 773.2 1,404.9
Propionic acid N.D. 2.2 N.D. 1.9 2.5 1.8 7.0
iso-Butyric acid N.D. N.D. N.D. 1.7 1.6 0.6 1.9
iso-Valeric acid N.D. N.D. N.D. 3.6 4.7 1.4 4.0
Hexanoic acid N.D. 0.7 0.8 7.7 10.2 5.7 7.4
Octanoic acid N.D. 2.3 3.4 40.6 54.6 30.8 30.7
Decanoic acid 1.0 4.1 6.3 67.6 82.8 64.7 63.3
Dodecanoic acid N.D. 2.3 3.7 45.1 53.9 39.8 34.8
(N = 1) Total(-Acetic acid) 1.0 11.5 14.1 168.2 210.3 144.7 149.0
Ethyl acetate 662.7 745.7 587.5 1,334.1 2,230.1 1,771.5 2,660.9
Ethyl hexanoate N.D. N.D. N.D. 13.5 29.9 12.9 15.2
Ethyl octanoate N.D. 3.6 4.8 71.9 153.1 70.7 62.0
Ethyl decanoate 1.8 5.8 8.8 111.7 220.4 135.8 116.5
Ethyl dodecanoate 1.5 4.5 6.4 76.2 138.0 86.9 64.6
Ethyl tetradecanoate N.D. N.D. N.D. 7.1 12.7 13.8 8.6
Ethyl hexadecanoate 2.0 2.7 2.0 26.1 45.8 19.1 17.1
Ethyl hexadecenoate N.D. N.D. N.D. 14.2 22.4 2.3 1.8
(N = 1) Total(-Ethyl acetate ) 5.3 16.6 22.0 320.7 622.4 341.5 285.8
n-Propyl alcohol 405.3 410.0 408.0 408.6 526.0 455.8 495.7
iso-Butanol 640.9 745.7 567.3 551.7 656.7 531.0 1,486.8
iso-Amyl alcohol 104.1 52.2 55.0 1,231.7 1,823.8 1,728.7 3,472.8
a-Amyl alcohol 29.5 12.7 15.5 346.3 556.6 374.8 929.9
β-Phenyethyl alcohol 10.3 5.3 6.7 73.2 91.6 82.9 131.2
(N = 1) 1,190.1 1,225.8 1,052.5 2,611.5 3,654.7 3,173.1 6,516.4
Fusel alcohols
Fattyacids
Concentration [mg/L 100% abv]
Group
Fattyacid
esters
20yo 27yo 40yoCompound nameFlavour
Soapyandoily
Fruityand
Soapy
Feintsand
floral
USA SPN JPN USA JPN USA JPN
Vanillic acid 2.7 3.4 3.4 4.3 9.2 6.6 18.4
Syringic acid 4.0 6.7 5.5 8.0 13.9 11.0 25.7
Vanillin 2.6 5.5 6.0 4.1 7.9 7.2 18.4
Syringaldehyde 6.5 11.6 12.1 12.4 18.3 16.7 34.8
Sinapaldehyde 0.5 1.0 1.3 0.7 0.9 0.6 1.2
(N = 1) Total 16.4 28.2 28.3 29.4 50.1 42.1 98.6
Concentration [mg/L 100% as is]
20yo 27yo 40yo
Sweetand
woodyAromatics
Group Flavour Compound name

32
Greater variation was observed between concentrations of fatty acid esters than the fatty
acids in the 27 and 40 year old whiskies. In the case of malt whiskies of 27 year and 40
year old, highest levels of fatty acid esters were in the 27 year old JPN whisky (622.4
mg/L) and lowest levels was found in the 40 year old JPN whisky (285.8 mg/L). The
highest levels of fatty acids was 27 year old JPN whisky (210.3 mg/L) and lowest was 40
year old USA whisky (144.7 mg/L). This pattern was not found to be consistent between
the whisky samples, although the highest levels of fatty acids (210.3 mg/L) and fatty acid
esters (622.4 mg/L) were observed in the same 27 year old JPN whisky.
Figure 3.3 Fatty acids & fatty acid esters in old whiskies
Determination of the levels of fusel alcohols found that the 40 year old Japanese oak
whisky had a much higher concentration of these compounds (6,516.4 mg/L) than all
other whiskies (Figure 3.4). When the JPN whiskies were compared with USA
whiskies and SPN whisky (20 year old), the concentrations of fusel alcohols were found
to be in the range 1,052.5 to 1,225.8 mg/L, and did not show the previously observed
0
100
200
300
400
500
600
700
USA SPN JPN USA JPN USA JPN
20yo 27yo 40yo
Co
nce
ntra
tion
of fa
tty a
cids
& f
atty
aci
d e
ster
s [m
g/L]
Fatty acids
Fatty acid esters
(N = 1)

33
tendency to be higher than others, which was found to be the case for fatty acids and fatty
acid esters. This observation was not reflected in the older whiskies, where the 27 and
40 year old whiskies were found to have between 2,611.5 and 6,516.4 mg/L of fusel
alcohols. This pattern repeated that previously discerned in these samples for the
concentration of fatty acid and fatty acid esters.
Figure 3.4 Fusel alcohols in old whiskies
Finally when considering the aromatic compounds (Figure 3.5), only the 40 year old JPN
whisky demonstrated considerably higher concentration (98.6 mg/L) than found in all of
other whiskies (concentrations ranged from 16.4 to 50.1 mg/L). The comparison of JPN
and USA whiskies found that the concentrations of all the aromatics in JPN samples were
greater than USA whiskies. However, when the 20 year old JPN whisky was compared
with a 20 year old SPN whisky, these concentrations of aromatics were found to be similar.
This suggests that JPN whisky contains more aromatics than USA whisky but this cannot
0
1,000
2,000
3,000
4,000
5,000
6,000
7,000
USA SPN JPN USA JPN USA JPN
20yo 27yo 40yo
Co
nce
ntra
tion
of fu
sel a
lcoh
ols
[mg/
L]
(N = 1)

34
be said to only be characteristic of JPN whisky as SPN whisky also contains similar high
levels of aromatic compounds.
Figure 3.5 Aromatics in old whiskies
3.3 Discussion
This work began by determining if the Scotch whisky aroma wheel (Figure 3.1) was a
suitable tool for the sensory assessment of Japanese whisky. The aroma wheel
descriptors used in this study were found to not adequately express the differences
between Japanese whiskies and those from the rest of the world. This was most
noticeably demonstrated in the comparison of JPN and USA whisky (Figure 3.2).
Following on from this discovery, work was carried out to look for suitable descriptors
which could be used in addition to those used in the Scotch whisky industry. This would
expand the terminology available and enable sensory scientists to describe whiskies in a
0
20
40
60
80
100
120
USA SPN JPN USA JPN USA JPN
20yo 27yo 40yo
Con
cen
tra
tion
of a
rom
atic
s [m
g/L]
(N = 1)

35
more global context. The aroma of JPN whisky had up to this point only ever been
expressed using Japanese domestic descriptors. In order to look for a suitable descriptor
which sensory panel can understand, new descriptor was needed meet this need.
Further identification of the uniqueness of JPN whisky was achieved by carrying out
analytical methods common to the whisky industry.
Fatty acids with the exception of acetic acid and fatty acid esters (except ethyl acetate)
were generally not detected in the 20 year old whiskies (Figure 3.3), but were detected
in the 27 and 40 year old samples (Figure 3.3). It is suggested that the reason for this is
that fatty acids and fatty acid esters are normally derived from the original new make
spirit of malt whisky. The 27 year and 40 year whiskies were malt whiskies, but the
only 20 year old whiskies were grain whiskies which are closer to neutral spirit with fewer
aroma compounds due to the spirit distilled by continuous still and purified more than pot
still (Section 1.1.1). Whereas, the concentrations of acetic acid and ethyl acetate were
high because these compounds derived from not only new make spirit but also cask wood
during maturation (Reazin, 1981).
When considering fatty acids of JPN and USA whiskies, the concentrations were mostly
the same in all of three ages. When considering fatty acid esters, the concentration of
20 year old and 27 year old JPN whiskies were more than USA whiskies, however, the
concentration of 40 year old JPN whisky was less than or similar to USA whisky. It is
thought that this is probably due to the levels of these compounds found in the new make
spirit and not derived from maturation. Therefore, it is suggested that the fatty acids and
fatty acid esters levels are not a good indicator of the distinctive character of JPN whisky.
In the case of fusel alcohols, only the 40 year old JPN whisky showed a higher

36
concentration compared to all of other whiskies. However, when JPN whiskies were
compared with USA and SPN whisky for the 20 year and 27 year old samples, the
concentrations were similar, and do not show the same tendency as observed in 40 year
old whiskies. The reason why the higher concentration was found in the 40 year old
JPN whisky is not known. It is suggested that this may be due to the original new make
spirit and concentration occurring during very long periods of maturation (Conner et al.,
2003). Considering the aromatics, only the 40 year old JPN whisky showed a much
higher concentration. In addition to this the 20 year old JPN and SPN whiskies
demonstrated more aromatics than USA whisky. The reason for the higher
concentrations in 40 year old JPN whisky is not clear but this could be due to the different
maturation conditions, such as temperature or humidity, experienced over very long
periods of time.
When considering the 20 year old whiskies, JPN and SPN whiskies demonstrated
increased concentrations of fatty acids and fatty acids esters than USA whisky. The
reasons for this are unclear, it is postulated that the previous casks use (Section 1.2,
Conner et al., 2003) may influence fatty acid and fatty acid ester content. A small
quantity of residual whisky from the previous cask use fill may still be present at the point
of refill, this may be absorbed into the wood or may still in the cask, this will combine
with the next product as it matures (Section 1.3).
Therefore it is postulated that compounds derived from the new make spirit (fatty acids,
fatty acid esters, and fusel alcohols) are not suitable indicators for defining the distinct
character of JPN whisky. JPN whiskies demonstrated higher concentrations of
aromatics than USA whiskies, but the concentration found in SPN whisky was also higher
37
than USA whisky and similar to JPN whisky. Therefore, aromatic compounds also are
not indicative of the distinctive character of JPN whisky.
These results should not be considered to be surprising as new make spirit (and hence
whisky) are all derived from cereals. Although there is some variation within the use of
these cereals it may be difficult to use these compounds as defining characteristics of
whisky matured in different casks. Therefore, in subsequent work, chemical analysis
was used to focus on the woody aroma compounds which are more likely to be the source
of the different aroma and aromas associated with JPN whisky.

38
Chapter 4: The identification of a unique character imparted by casks
of Japanese oak
4.1 Introduction
The aroma of JPN whisky has previously been expressed using only Japanese domestic
descriptors which represented challenges when sharing sensory data amongst
international whisky researchers. This research began by looking for suitable
descriptors, in addition to those which are generally used in whisky industry (Section 3.1).
Descriptors are one of the most important tools to identify the unique character that
differentiate whiskies. The aroma descriptors used are those frequently used by the
whisky industry in both the UK and Japan, and which can be found on the Scotch whisky
aroma wheel (Figure 3.1). As a result, the use of established whisky descriptors in this
work did not adequately express the sensory experience of the JPN whisky under
consideration (Section 3.2.1). The Scotch whisky aroma wheel, as suggested by the
name was developed specially for ‘Scotch’ and therefore it is not comprehensive enough
to describe the unique character of JPN whisky. Therefore, a further in depth sensory
analysis was undertaken testing new terminology which could be added to whisky aroma
wheel lexicon in order to develop a universal language which could be used with whiskies
of global origin.
From the chemical analysis point of view, a previous lack of interest in whisky matured
in JPN oak means that the typical chemical aroma compounds especially those which are
characteristic of JPN oak, have yet to be identified. The volatiles compounds which are
generally used across the whisky industry as measures of aroma consistency were chosen
for the chemical analysis. In the previous chapter (Section 3), the fatty acids, fatty acid

39
esters, fusel alcohols, and aromatics were demonstrated to not be a good indicator of JPN
whisky. In order to identify a specific compound which contributes to JPN whisky
aroma, further chemical analysis would be required (Section 3.2.2).
Feedback from sensory panellists at SWRI was used to identify new words which could
be used as descriptors for Japanese whisky aroma. The focus for the chemical analysis
were the woody aroma compounds from which it was felt to be the most likely source of
variation since the aromas of interest are linked with maturation in Japanese oak.
4.2 Results
4.2.1 Sensory analysis using special aroma descriptions
Sensory analysis was performed using the method and general descriptors described in
Section 3.1. Panellists were also asked to comment on other aromas that they felt were
present in the whiskies. Descriptions obtained from the panellists included the terms
musty, earthy, varnish, incense, aniseed, matured pineapple, coconut, beeswax, and
melted butter. From these comments, the descriptions of ‘incense’, ‘matured pineapple’,
and ‘coconut’ which were the terms most frequently described by panellists and therefore
were identified as possible aromas that typify JPN whiskies. The sensory analysis was
repeated using these descriptions, in order to determine whether or not these attributes
were recognised by the sensory panellists as characterising the unique aroma of JPN
whisky.

40
Old whiskies which were felt to have a strong aroma, representative of typical JPN
whiskies were compared the equivalent age of USA whisky using the aroma descriptions
of incense, matured pineapple, and coconut. The summarised results are given for the
20 year old (Table 4.1), 27 year old (Table 4.2) and 40 year old (Table 4.3) whiskies.
Table 4.1 Sensory results of 20 year old JPN and USA whiskies using the aroma
descriptions of incense, matured pineapple, and coconut
(Raw data is available in Appendix 1)
Examination of the 20 year old whiskies found that the intensities of incense and coconut
were found to be scored equally with a mean score of 1.4 in JPN whisky, and they were
similar 1.0 and 0.8 respectively in USA whisky. The highest intensity score for coconut
was 2.5 in the JPN whisky. The differences between JPN and USA whisky in these
three descriptors were not found to be significant (p = 0.40, 0.26, 0.09 respectively).
IncenseMaturedpineapple
Coconut
Mean 1.4 0.8 1.4
St. Dev. 0.7 0.6 0.7
Minimum 0.3 0.1 0.6
Maximum 2.0 1.8 2.5
Mean 1.0 0.6 0.8
St. Dev. 0.6 0.4 0.4
Minimum 0.5 0.1 0.0
Maximum 2.0 1.5 1.7
0.40 0.26 0.09
JPN-20yo
USA-20yo
p value by t-test(N = 9)

41
When considering the 27 year old whiskies, the intensities of incense and coconut were
found to be different in JPN whisky and these mean scores were 1.8 and 0.9 respectively.
The score of the incense aroma was greater than that of coconut aroma, whereas the scores
for 20 year old JPN whisky were same 1.4 (Table 4.1). In the 27 year old USA whisky,
these characteristics were also found to be different (1.1 and 0.5 respectively). However,
these scores were all lower than those for the JPN whisky.
In both the 27 year old JPN and USA whiskies the incense character was found to be the
most intense and the coconut character the least intense. This did not reflect the results
when analysing the 20 year old JPN and USA whiskies. It should be noted that some
panellists did not pick up the matured pineapple and coconut character in USA whisky
(observed in the minimum scores found in Table 4.2). Analysis of the results in Table
4.2 determined that the scores for JPN and USA whiskies in ‘incense’ and ‘coconut’ were
significantly different (p = 0.01 and 0.05 respectively).

42
Table 4.2 Sensory results of 27 year old JPN and USA whiskies using the aroma
descriptions of incense, matured pineapple, and coconut
(Raw data is available in Appendix 2)
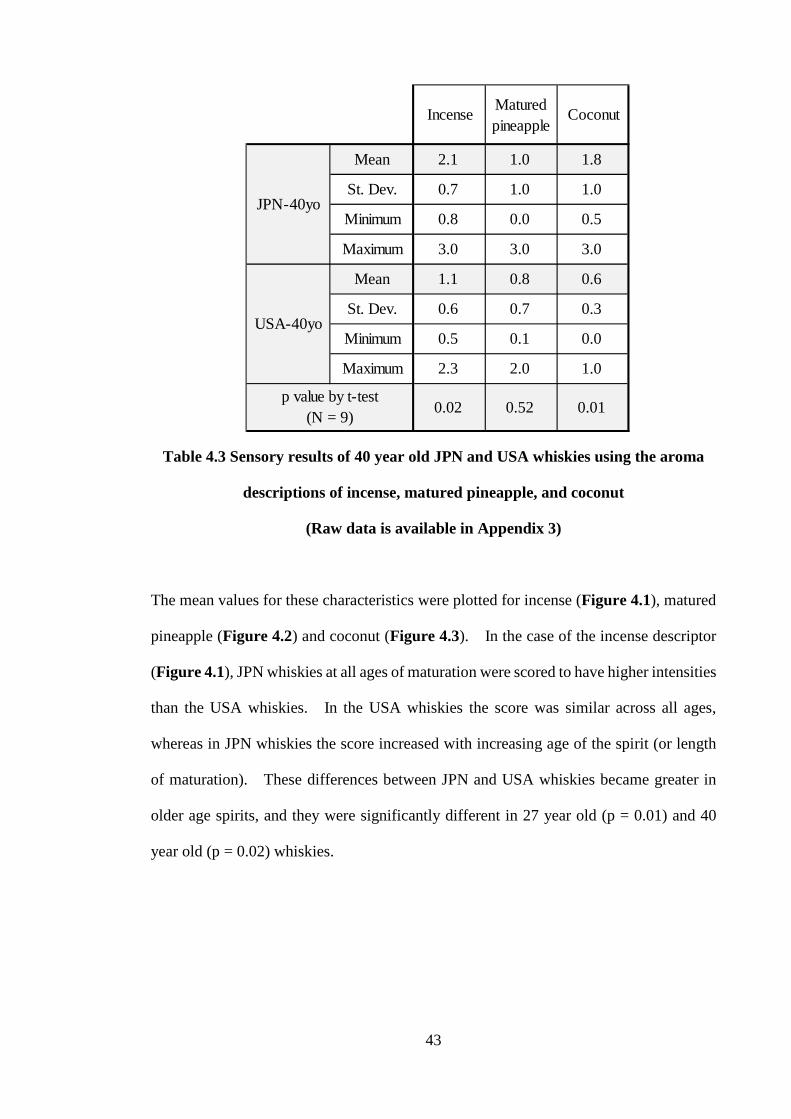
Analysis of the 40 year old whiskies found that the intensities of incense and coconut
were similar (2.1 and 1.8 respectively) in JPN whisky, but they were different and much
lower 1.1 and 0.6 in USA whisky. The intensity of matured pineapple was lowest 1.0
in JPN whisky, but had a mid-range score in the USA whisky. Some panellists did not
pick up the coconut character in USA whisky. The intensity of matured pineapple was
widely spread from 0.0 to 3.0 and its standard deviation was high 1.0. It is suggested
that this variation in scores may be due to panellists not understanding the properties of
this attribute or there may be a wide range of individual aroma thresholds for this attribute.
The differences between JPN and USA whiskies in incense and coconut attributes were
founded to be significant (p = 0.02 and 0.01 respectively).
IncenseMaturedpineapple
Coconut
Mean 1.8 1.3 0.9
St. Dev. 0.8 0.8 0.6
Minimum 0.5 0.1 0.2
Maximum 2.9 2.5 2.5
Mean 1.1 1.0 0.5
St. Dev. 0.7 0.7 0.3
Minimum 0.5 0.0 0.0
Maximum 2.7 2.5 1.0
0.01 0.22 0.05p value by t-test
(N = 9)
JPN-27yo
USA-27yo
43
Table 4.3 Sensory results of 40 year old JPN and USA whiskies using the aroma
descriptions of incense, matured pineapple, and coconut
(Raw data is available in Appendix 3)
The mean values for these characteristics were plotted for incense (Figure 4.1), matured
pineapple (Figure 4.2) and coconut (Figure 4.3). In the case of the incense descriptor
(Figure 4.1), JPN whiskies at all ages of maturation were scored to have higher intensities
than the USA whiskies. In the USA whiskies the score was similar across all ages,
whereas in JPN whiskies the score increased with increasing age of the spirit (or length
of maturation). These differences between JPN and USA whiskies became greater in
older age spirits, and they were significantly different in 27 year old (p = 0.01) and 40
year old (p = 0.02) whiskies.
IncenseMaturedpineapple
Coconut
Mean 2.1 1.0 1.8
St. Dev. 0.7 1.0 1.0
Minimum 0.8 0.0 0.5
Maximum 3.0 3.0 3.0
Mean 1.1 0.8 0.6
St. Dev. 0.6 0.7 0.3
Minimum 0.5 0.1 0.0
Maximum 2.3 2.0 1.0
0.02 0.52 0.01p value by t-test
(N = 9)
JPN-40yo
USA-40yo

44
Figure 4.1 Sensory results of old whiskies for ‘incense’ aroma descriptor
In the case of matured pineapple descriptor (Figure 4.2) JPN whiskies for all ages were
determined to have higher intensities. However, these differences were not significant
for any of the ages examined (p = 0.26, 0.22, 0.52). When considering the JPN whiskies,
the matured pineapple character was considered to be greatest in the 27 year old spirit.
This was also the case for the 27 year old USA whisky. The lowest across for this
descriptor when considering geography was interestingly both the 20 year old products,
JPN and USA whiskies.
0.0
0.5
1.0
1.5
2.0
2.5
20yo 27yo 40yo
Inte
nsi
ty o
f inc
ense
JPN
USA
(N = 9)

45
Figure 4.2 Sensory results of old whiskies for ‘matured pineapple’ aroma
descriptor
In the case of the coconut descriptor (Figure 4.3), again JPN whiskies in all ages were
scored to have higher intensities than USA whiskies. These differences were
determined to be significant in 27 year old (p = 0.05) and 40 year old (p = 0.01) whiskies.
When considering the USA whiskies this coconut character appeared to decrease over
time. In the JPN whiskies this was not the case and the 27 year old demonstrated a lower
score for coconut compared to the 20 year old. In contrast the 40 year old was observed
to have a much higher score.
0.0
0.5
1.0
1.5
2.0
2.5
20yo 27yo 40yo
Inte
nsity
of m
atu
red
pin
eap
ple
JPN
USA
(N = 9)

46
Figure 4.3 Sensory results of old whiskies for ‘coconut’ aroma descriptor
As described above, it was determined that the JPN whiskies clearly had higher scores
for the incense and coconut attributes compared to the USA whiskies at both 27 years old
and 40 years old. These differences were statistically significant when comparing the
older products.
4.2.2 Chemical analysis of whisky lactone
In Section 4.2.1, the coconut descriptor was determined to be one of the typical aromas
of JPN whisky. Although coconut was determined to be present in USA whisky, this
was lower than in JPN whisky and also declined over increased maturation, the inverse
of what was observed in JPN whisky. Whisky lactone is a wood extractive known to be
responsible for coconut aroma in whisky (Otuska et al., 1974). This molecule contains
two chiral carbons and as such can exist as four isomers, 3S,4S (cis) (Figure 4.4), 3S,4R
(trans) (Figure 4.5), 3R,4R (cis), and 3R,4S (trans). Although each isomer has a
0.0
0.5
1.0
1.5
2.0
2.5
20yo 27yo 40yo
Inte
nsity
of c
oco
nut
JPN
USA
(N = 9)

47
slightly different aroma, they all have coconut notes and could potentially contribute to
the overall coconut aroma in whisky (Koppenhoefer et al., 1994). Masson et al. (1995)
reported that only two of these isomers are reported to exist naturally, 3S,4S (cis), 3S,4R
(trans). Another research group reported that the isomerisation of these lactones will
not occur in wine or whisky because of the acidic nature of these media (Pollnitz et al.,
1999). Therefore it can be said that the conformation of whisky lactone is not affected
by the conditions of maturation.
Figure 4.4 Chemical structure of 3S,4S cis-whisky lactone
Figure 4.5 Chemical structure of 3S,4R trans-whisky lactone
Chemical analysis of lactones in old whiskies was carried out using GC-MS according to
the method in Section 2.3.5. The whiskies used in this study were 20 year old grain
O O
O O

48
whiskies from Japanese, American, and Spanish oak, and malt whiskies from Japanese
and American oak (27 and 40 year old).
Table 4.4 Chemical analysis results of whisky lactones in old whiskies
In the USA and JPN 20 year old whiskies, the total amount of lactone was found to be
similar (3.32 mg/L and 3.69 mg/L respectively), whereas in the SPN whisky the level was
lower (2.36 mg/L) (Table 4.4). When comparing the 27 year old whiskies, USA whisky
was determined to have similar level (3.19 mg/L) to the 20 year old (3.32 mg/L). In
contrast, the concentrations in the JPN 27 year old whiskies were greater (4.78 mg/L)
compared to that of 20 year old. When comparing the 40 year old whiskies, USA
whisky was greater (7.91 mg/L) compared to that of 27 year old whisky (3.19 mg/L), but
JPN whisky was much greater (44.38 mg/L) compared to that of 27 year old whisky (4.78
mg/L).
cislactone
[mg/L as is]
translactone
[mg/L as is]
Total(cis+trans)[mg/L as is]
Ratio(cis/trans)
USA 3.02 0.30 3.32 10.24
SPN 2.08 0.28 2.36 7.56
JPN 1.22 2.47 3.69 0.49
USA 2.72 0.47 3.19 5.79
JPN 2.27 2.52 4.78 0.90
USA 6.37 1.54 7.91 4.14
JPN 14.78 29.60 44.38 0.50
Whisky(N = 1)
20yo
27yo
40yo

49
Figure 4.6 Chemical analysis results of whisky lactones in old whiskies
All of ages of JPN whiskies were found to contain higher levels of trans-lactone (2.47
mg/L, 2.52 mg/L, 29.60 mg/L) than USA whiskies (0.30 mg/L, 0.47 mg/L, 1.54 mg/L)
(Table 4.4 and Figure 4.6). The ratio of cis/trans in all of the JPN whiskies were all
less than 1.0 (0.49, 0.90 and 0.50) while in the SPN and USA whiskies the ratios were all
well in excess of 1.0 (10.24, 7.56, 5.79, 4.14). Hence, only in the JPN whiskies were
the levels of trans-lactone higher than cis-lactone. These differences are clearly
illustrated in Figure 4.6.
These observations are important because previous studies by Nabeta et al. (1986)
reported that the levels of lactones differed among three types of oak, including Q.
mongolica. The Q. mongolica showed higher levels of trans-lactone than the other
types of oak considered by these authors (Figure 4.7). The wood of Q. mongolica is
also known as Japanese oak which was used in the construction of casks for the
maturation of the JPN whisky. Therefore this study confirms these previous observation
0.00
2.00
4.00
6.00
8.00
10.00
12.00
14.00
16.00
0.00
5.00
10.00
15.00
20.00
25.00
30.00
35.00
40.00
45.00
50.00
USA SPN JPN USA JPN USA JPN
20yo 27yo 40yo
Rat
io (c
is/tr
an
s)
Con
cent
ratio
n of
lact
one
isom
ers
[mg/
L] transcisRatio
(N = 1)

50
by Nabeta et al. (1986), although sadly these authors did not consider American (Q. Alba)
or European (Q. robur or Q. petraea) oaks in their work. The results from Section 4.2.2
led to the proposal of the hypothesis that casks constructed of Q. mongolica produces
whiskies which contain higher ratios of trans-lactones than casks constructed of
American or European oak.
Figure 4.7 Whisky lactone amounts in wood reported by Nabeta et al. (1986)
In order to test this hypothesis, wood chips were collected from the whole surface (to a
depth of approximately 2 mm) of casks that had been used for the extended maturation of
old JPN and USA whiskies. The details of these old whiskies are outlined in Section
2.1.1 (Table 2.1). Since these casks could not be disassembled, as these were not
exhausted casks at the end of their life, these chips were collected from the outside surface
of casks. The extraction using these chips with 60% abv spirit for one day at room
temperature was carried out according to the method outlined in Section 2.2.1. The
0.00
2.00
4.00
6.00
8.00
10.00
12.00
14.00
16.00
0
500
1,000
1,500
2,000
2,500
3,000
Q. mongolica Q. serrata Q. dentata
Rat
io (c
is/tr
an
s)
Con
cent
ratio
n o
f lac
tone
isom
ers
[mg/
L]
transcisRatio

51
concentration of lactones was determined by GC-MS following to the method in Section
2.3.5.
The results are presented as the lactone concentration and the ratio of lactone isomers and
are illustrated in Figure 4.8 with further detail given in Table 4.5. When considering
20 year old USA and JPN whiskies, the total amount of lactone in USA (13.82 mg/L) was
slightly higher than JPN (9.78 mg/L). In contrast, when comparing 27 year old whiskies,
USA (9.01 mg/L) was found to be lower than JPN (22.19 mg/L). In the case of 40 year
old whiskies, USA (10.12 mg/L) were slightly lower than JPN (13.14 mg/L).
Comparison of the trans-lactone content of the 20, 27, and 40 year old whiskies, all ages
of JPN (6.55mg/L, 11.90 mg/L, 8.43 mg/L) showed higher level than USA (1.24 mg/L,
1.14 mg/L, 0.99 mg/L). When comparing the ratio, all ages of JPN (0.49, 0.86, 0.56)
had a ratio of less than 1.00, but in contrast the ratio demonstrated by USA whiskies
(10.18, 6.90, 9.22) were all greatly in excess of 1.00. This reflects the results presented
earlier in this chapter (Figure 4.6) which also found that the ratios of cis/trans in all of
the JPN whiskies were all were less than 1.0 while in the USA whiskies the ratios were
all well in excess of 1.0.

52
Table 4.5 Whisky lactone amounts in wood collected from the cask surface of old
whiskies by the extraction using 60% abv solution
Figure 4.8 Whisky lactone amounts in wood collected from the cask surface of old
whiskies by the extraction using 60% abv solution
cislactone
[mg/L as is]
translactone
[mg/L as is]
Total(cis+trans)[mg/L as is]
Ratio(cis/trans)
USA 12.58 1.24 13.82 10.18
JPN 3.23 6.55 9.78 0.49
USA 7.87 1.14 9.01 6.90
JPN 10.29 11.90 22.19 0.86
USA 9.13 0.99 10.12 9.22
JPN 4.72 8.43 13.14 0.56
Cask(N = 1)
20yo
27yo
40yo
0.00
2.00
4.00
6.00
8.00
10.00
12.00
14.00
16.00
0.00
5.00
10.00
15.00
20.00
25.00
USA JPN USA JPN USA JPN
20yo 27yo 40yo
Rat
io (c
is/tr
an
s)
Con
cen
tra
tion
of la
cton
e is
ome
rs [m
g/L] trans
cisRatio
(N = 1)

53
4.3 Discussion
The aim of this work was to determine suitable specific descriptors for JPN whiskies,
which are not part of the current language used to describe Scotch whisky. Analysis of
sensory panellists comments were used to determine new language, and three descriptors
‘incense’, ‘matured pineapple’, and ‘coconut’ were concluded to be unique to Japanese
whisky. Repeated sensory analysis using these three descriptors found that the JPN
whiskies clearly had higher scores for incense and coconut attributes compared to the
USA whiskies (Table 4.1-3). These two descriptors, incense and coconut are common
and useful ones for communication between European and Japanese whisky researchers,
and are felt to be good expressions of the unique character of JPN whiskies.
Following on from the above work, chemical analysis focussed on the coconut aroma
compound, which is known to be ‘whisky lactone’. It was found that JPN whiskies have
different ratios of lactone isomers, weighted towards greater relative levels of trans-
lactone than was observed in USA whiskies (Table 4.4). This has not previously been
reported in the literature surrounding this area of whisky science. In the case of the 40
year old whisky, JPN whisky showed much higher concentration of both lactones. The
reason for this is unknown, but can be assumed that whisky maturation is normally
influenced by not only the cask extraction but also storage conditions in the warehouse
(Section 1.1.2). Therefore, 40 year old whiskies are thought to have had a greater
influence from the conditions in the surrounding environment during maturation and
therefore these differences were greater.
Further to this, when the ratio was determined in the extraction of lactones from wood
chips at laboratory scale and the ratios between American and Japanese oak, Japanese

54
oak showed higher relative levels of trans-lactone (Table 4.5). The total amounts
extracted from each wood type were not consistent, but the pattern observed within the
ratios were similar between casks of USA whisky and JPN whisky. Therefore, due to
the similar ratios of lactone found between laboratory wood chip extract experiments and
those found in whisky suggests that the analysis of wood chip extracts is a suitable model
to rapidly mimic a long period cask maturation. These results support the hypothesis
that the relatively high levels of trans-lactone in JPN whiskies are very likely to be
derived from the wood itself.
Many previous studies on the ratio of cis- and trans-lactone isomers have been reported
in the wine industry (Waterhouse and Towey, 1994; Diaz-Plaza et al., 2002; Simon et al.,
2003). From these reports the reported ratios for cis/trans lactone isomers in American
oak, were between 7.21 and 10.20. For wine matured in European oak wood, the ratio
ranged from 1.40 to 4.79. Analysis of the data presented in these papers demonstrates
that in these oaks the cis-lactone is the more abundant isomer. Therefore it is postulated
that only Japanese oak has higher ratio of trans-lactone than European or American oaks.
Therefore, it is suggested that the cis/trans lactone ratio may provide a means of
identifying by analytical methods whether or not a whisky has been matured in Japanese
oak. This is useful information for selection of cask staves which will give strong
coconut aroma. These results may also be useful when looking to confirm the
authenticity of Japanese whiskies in the market place as demand for these products
increases.

55
Chapter 5: The behaviour of whisky lactone isomers in Japanese oak
casks
5.1 Introduction
In Section 4, it was determined that JPN whisky has a unique coconut aroma which could
be identified by a professional sensory panel. Whisky lactone is a wood extractive
known to be responsible for coconut aroma in whisky (Otuska et al., 1974), and it was
reported that only two of isomers exist naturally although four isomers exist due to two
chiral carbons contained in the molecule (Masson et al., 1995). Following further
investigation, the ratio of whisky lactone isomers was found to be different in Japanese
oak to European and American oaks (Section 4.2.2). Here, the factors (Section 1.1,
Section 1.2) that influence the amount of lactone, and the ratio of lactones in matured
spirit were studied in order to determine the key factors involved in aroma activation.
Whisky maturation is long process involving complicated reactions (Section 1.1.2), and
is still yet to be fully understood. Therefore, a simple experiment using cask wood chip
extractions in an ethanol solution was developed. This could then be used to simulate
whisky maturation in a reduced period of time. Additionally, the potential of heat
treatment was also studied to determine if toasting or charring influenced lactone content
and ratio in spirit. The rationale was that heat treatment is known to be a good method
to regenerate casks (Section 1.3), when casks are regenerated by re-charring, thermal
degradation of lignin yields aroma compounds similar to those produced in a new charred
cask (Conner et al., 2014).

56
Whisky casks are stored for many years in bonded, secure warehouses without moving
or rolling, often with little environmental control. Whisky in casks naturally evaporates
at the rate of 2 or 3% annually in Japan (Koshimizu, 2011), known in Scotland as ‘the
angels’ share’, and this causes the volume of liquid in the cask (Figure 5.1) to decrease
(Conner et al., 2014). It therefore is suggested that it would be reasonable to assume
that the top stave would become dry over time as it has reduced contact with the liquid,
the bottom stave would be wet, with some staves in the top third of the cask having
variable contact as evaporation takes place over many years. It was postulated that the
extraction of wood component especially lactone, depends upon the position of the stave
in the cask.
Figure 5.1 Model casks of whisky evaporation at Yamazaki Distillery
5.2 Results
5.2.1 Wood extracts analysis
The ratio of lactones in the extracted 60% abv ethanol solution for one day was analysed
and was found to be similar to the ratios in matured whisky (Section 4.2.2). From this

57
result, it was suggested that wood chips extract using an ethanol solution for a short period
of one day can imitate the extraction of lactones into spirit occurring within the cask.
However, the method outlined in Section 2.2.1 was a technique in development and
required further validation. In the work presented here the methodology previously
described was further developed, focussing on the length of extraction and spirit strength.
In addition to this, the influence of stave position and extraction behaviour at different
depth of the stave during maturation on lactones was studied using the method developed
in this chapter. The wood chips required for this work were collected from the within
about two mm of the outside surface of a Japanese oak cask. The specific cask was
selected from inventory information, and allowed a cask to be selected which was similar
to those in which the JPN 27 year old whisky (Table 2.1 (Section 2.1.1)) was matured in
the previous study.
5.2.1.1 Extraction period
In order to establish whether one day (Section 2.2) was an adequate period of time for
extraction, additional periods of 2, 7, and 30 days extraction were performed using
Japanese oak chips by stirring with 60% abv ethanol solution at room temperature
(approximately 20°C). The lactone concentration and the ratio of lactone isomers are
presented in Table 5.1 and illustrated in Figure 5.2 which demonstrates the cumulative
concentration of lactones. The cis-lactone concentrations of all extraction lengths
ranged from 5.07 to 5.44 mg/L which were similar. The trans-lactone concentrations of
all extraction lengths ranged from 4.96 to 5.35 mg/L, which were also very similar. The
cis/trans ratios for all length of time were from 1.02 to 1.03 which were within a close
range. Statistical analysis determined that the p values were greater than 0.05 (Section
2.5), and therefore no significant difference (Table 5.1) in either isomer was shown under

58
the conditions examined. From this work it could be concluded that a period of one day
is sufficient for the extraction of whisky lactones for analysis.
Table 5.1 Effect of extraction length of wood chip on subsequent extraction of
lactones into 60% abv solution
(Raw data is available in Appendix 4)
cislactone
[mg/L as is]
translactone
[mg/L as is]
Total(cis+trans)[mg/L as is]
Ratio(cis/trans)
Mean 5.44 5.35 10.80 1.02
St. Dev. 0.36 0.32 0.68 0.01
Mean 5.07 4.96 10.03 1.02
St. Dev. 0.09 0.14 0.20 0.03
Mean 5.30 5.13 10.43 1.03
St. Dev. 0.09 0.13 0.21 0.02
Mean 5.35 5.21 10.56 1.03
St. Dev. 0.09 0.11 0.20 0.01
0.18 0.15 0.15 0.70
1 day
2 days
7 days
30 days
p value by ANOVA(N = 4)

59
Figure 5.2 Effect of extraction length of wood chip on subsequent extraction of
lactones into 60% abv solution
5.2.1.2 Extraction strength
The influence of spirit strength as alcohol by volume on lactone extraction and the ratio
of these isomers was examined. In addition to a concentration similar to that of whisky
cask strength (60% abv) (Section 1.1.1), extractions using dilutions of 20% abv, 40% abv,
80% abv were also carried out using Japanese oak chips. The spirit/wood chip mixture
was stirred for one day at room temperature (approximately 20°C). The levels of cis-
and trans- isomers were evaluated (Table 5.2), and the cumulative data presented in
Figure 5.3. The concentration of cis-lactone 20% abv experiment was found to be 3.35
mg/L, however the concentrations of other strengths ranged from 5.42 to 5.79 mg/L.
The concentration in the trans-lactone of 20% abv dilution was found to be 3.33 mg/L,
whereas the concentrations of other strengths ranged between 5.20 to 5.72 mg/L. The
cis/trans ratio for all spirit strengths were found to be between 1.01 and 1.04 which were
0.00
2.00
4.00
6.00
8.00
10.00
12.00
14.00
16.00
0.00
2.00
4.00
6.00
8.00
10.00
12.00
14.00
1day 2days 7days 30days
Rat
io (c
is/tr
an
s)
Con
cen
tra
tion
of la
cto
ne is
om
ers
[mg
/L]
trans
cis
Ratio
(N = 4)

60
similar values. Statistical analysis found that the p value of the ratio was greater than
0.05 (Section 2.5), meaning that no significant differences in the isomer ratio was
detected (Table 5.2). However, concentrations of both isomers were significantly
different (p = <0.01). The lower extract levels found in the in the 20% abv solution
agreed with the previous observations on the hydrophobicity of whisky lactones
published by Atanasova et al. (2004).
Table 5.2 Effect of extraction alcohol strength of wood chip on subsequent
extraction of lactones into ethanol solution
(Raw data is available in Appendix 5)
cislactone
[mg/L as is]
translactone
[mg/L as is]
Total(cis+trans)[mg/L as is]
Ratio(cis/trans)
Mean 3.35 3.33 6.67 1.01
St. Dev. 0.30 0.30 0.58 0.04
Mean 5.42 5.20 10.62 1.04
St. Dev. 0.59 0.57 1.16 0.01
Mean 5.44 5.35 10.80 1.02
St. Dev. 0.36 0.32 0.68 0.01
Mean 5.79 5.72 11.51 1.01
St. Dev. 0.16 0.15 0.31 0.01
<0.01 <0.01 <0.01 0.28
80% abv
20% abv
40% abv
60% abv
p value by ANOVA(N = 4)

61
Figure 5.3 Effect of extraction alcohol strength of wood chip on subsequent
extraction of lactones into ethanol solution
5.2.1.3 Stave position
The hypothesis that the position of the stave in the cask would influence the extraction of
wood components was tested using the extraction experimental protocol. Wood chips
were collected from within approximately 2 mm outside surface of the staves which had
previously been in positions representing the top, middle, and bottom of the casks
(Section 1.2). Experiments were also performed using chips which represented a
mixture of all the stave positions in the cask. The chips used in this experiment were
collected from casks used to mature the whiskies outlined in Table 2.1 (Section 2.1.1).
The extraction using these chips was carried out by stirring with 60% abv spirit for one
day at room temperature (Section 2.2). The results of concentration and ratio of lactone
isomers are shown in Table 5.3.
0.00
2.00
4.00
6.00
8.00
10.00
12.00
14.00
16.00
0.00
2.00
4.00
6.00
8.00
10.00
12.00
14.00
20% abv 40% abv 60% abv 80% abv
Rat
io (c
is/tr
an
s)
Con
cen
tra
tion
of la
cto
ne is
om
ers
[mg
/L]
trans
cis
Ratio
(N = 4)

62
Table 5.3 Effect of stave position of wood chip on subsequent extraction of lactones
into 60% abv solution
Positioncis
lactone[mg/L as is]
translactone
[mg/L as is]
Total(cis+trans)[mg/L as is]
Ratio(cis/trans)
Top 5.07 7.49 12.56 0.68
Middle 5.20 7.23 12.43 0.72
Bottom 2.86 3.72 6.58 0.77
All 3.23 6.55 9.78 0.49
Top 12.71 11.35 24.06 1.12
Middle 10.04 18.23 28.27 0.55
Bottom 8.28 15.60 23.88 0.53
All 10.29 11.90 22.19 0.86
Top 3.42 13.93 17.35 0.25
Middle 5.22 4.36 9.57 1.20
Bottom 6.74 20.61 27.35 0.33
All 4.72 8.43 13.14 0.56
Top 9.32 0.75 10.07 12.43
Middle 8.13 0.98 9.11 8.30
Bottom 11.81 1.17 12.98 10.09
All 12.58 1.24 13.82 10.18
Top 4.52 0.69 5.21 6.55
Middle 12.66 0.86 13.52 14.72
Bottom 11.09 0.78 11.87 14.22
All 7.87 1.14 9.01 6.90
Top 15.23 1.34 16.57 11.37
Middle 8.88 0.91 9.79 9.76
Bottom 6.95 0.73 7.68 9.52
All 9.13 0.99 10.12 9.22
Cask(N = 1)
27yo
40yo
20yo
JPN
USA
20yo
27yo
40yo
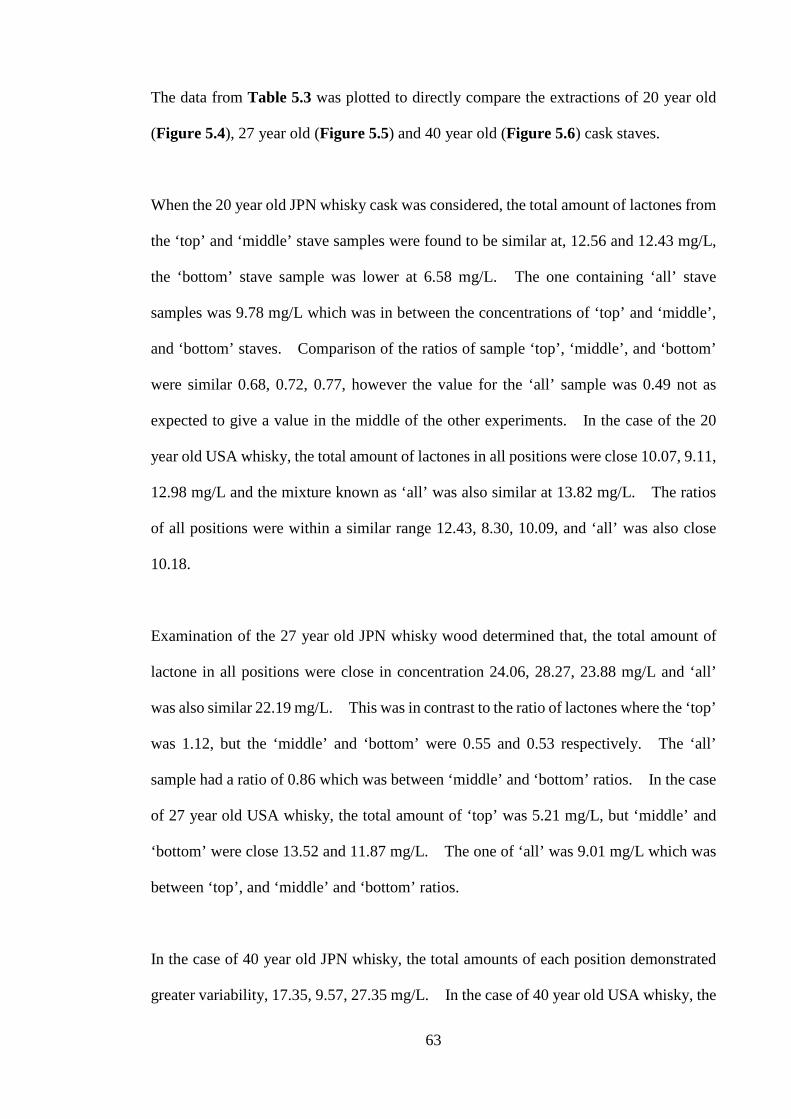
63
The data from Table 5.3 was plotted to directly compare the extractions of 20 year old
(Figure 5.4), 27 year old (Figure 5.5) and 40 year old (Figure 5.6) cask staves.
When the 20 year old JPN whisky cask was considered, the total amount of lactones from
the ‘top’ and ‘middle’ stave samples were found to be similar at, 12.56 and 12.43 mg/L,
the ‘bottom’ stave sample was lower at 6.58 mg/L. The one containing ‘all’ stave
samples was 9.78 mg/L which was in between the concentrations of ‘top’ and ‘middle’,
and ‘bottom’ staves. Comparison of the ratios of sample ‘top’, ‘middle’, and ‘bottom’
were similar 0.68, 0.72, 0.77, however the value for the ‘all’ sample was 0.49 not as
expected to give a value in the middle of the other experiments. In the case of the 20
year old USA whisky, the total amount of lactones in all positions were close 10.07, 9.11,
12.98 mg/L and the mixture known as ‘all’ was also similar at 13.82 mg/L. The ratios
of all positions were within a similar range 12.43, 8.30, 10.09, and ‘all’ was also close
10.18.
Examination of the 27 year old JPN whisky wood determined that, the total amount of
lactone in all positions were close in concentration 24.06, 28.27, 23.88 mg/L and ‘all’
was also similar 22.19 mg/L. This was in contrast to the ratio of lactones where the ‘top’
was 1.12, but the ‘middle’ and ‘bottom’ were 0.55 and 0.53 respectively. The ‘all’
sample had a ratio of 0.86 which was between ‘middle’ and ‘bottom’ ratios. In the case
of 27 year old USA whisky, the total amount of ‘top’ was 5.21 mg/L, but ‘middle’ and
‘bottom’ were close 13.52 and 11.87 mg/L. The one of ‘all’ was 9.01 mg/L which was
between ‘top’, and ‘middle’ and ‘bottom’ ratios.
In the case of 40 year old JPN whisky, the total amounts of each position demonstrated
greater variability, 17.35, 9.57, 27.35 mg/L. In the case of 40 year old USA whisky, the

64
total amounts of each position were also variable at 16.57, 9.79, 7.68 mg/L respectively,
but the extent of variability was smaller than observed with the 40 year old JPN whisky.
When JPN whiskies were compared with USA whiskies and the total amount of lactones
were found to be similar when considering the 20 year old whiskies (Figure 5.4).
However, in 27 year old samples, the levels of lactone in JPN whisky were greater than
USA whisky (Figure 5.5). In 40 year old, the ones of both JPN whisky and USA whisky
were variable and no pattern could be discerned (Figure 5.6).
All ages of JPN whiskies demonstrate higher levels of trans-lactones than the USA
whiskies confirming the pattern observed in Section 4.2.2, thus adding further weight to
the confirmation of that hypothesis. When focussing the analysis on the ratio (Table
5.3), the ratio of JPN whisky appeared consistent, between 0.25 and 1.20. The ratios of
USA whisky were more variable than JPN whisky, but all of the ratio were greater than
6.00. It is suggested that the amount of trans-lactone in this wood was small compared
with those of cis-lactone. However, when considering the total amount of lactones
(Figure 5.4-6), these were found to be inconsistent and did not show the same tendency
as was observed with the ratio values. The reasons for these differences remain unclear,
but may be related to the original habitat of the oak tree, or age of the tree at the time of
felling.

65
Figure 5.4 Effect of stave position of wood chip for casks of 20yo whiskies on
subsequent extraction of lactones into 60% abv solution
Figure 5.5 Effect of stave position of wood chip for casks of 27yo whiskies on
subsequent extraction of lactones into 60% abv solution
0.00
2.00
4.00
6.00
8.00
10.00
12.00
14.00
16.00
0.00
5.00
10.00
15.00
20.00
25.00
30.00
35.00
Top Middle Bottom All Top Middle Bottom All
JPN USA
Rat
io (c
is/tr
an
s)
Con
cent
ratio
n of
lact
one
isom
ers
[mg/
L] transcisRatio
(N = 1)
0.00
2.00
4.00
6.00
8.00
10.00
12.00
14.00
16.00
0.00
5.00
10.00
15.00
20.00
25.00
30.00
35.00
Top Middle Bottom All Top Middle Bottom All
JPN USA
Rat
io (c
is/tr
an
s)
Con
cent
ratio
n of
lact
one
isom
ers
[mg/
L]
transcisRatio
(N = 1)

66
Figure 5.6 Effect of stave position of wood chip for casks of 40yo whiskies on
subsequent extraction of lactones into 60% abv solution
5.2.1.4 Different depths within the stave of Japanese oak
The work presented earlier in this chapter (Section 5.2.1.3) regarding stave position
yielded inconsistent results and the reasons for this were unclear. In order to explore the
impact of the stave on spirit, the influence of depth of spirit penetration was investigated.
A stave from the bottom of a Japanese oak cask which was selected from inventory
information and had been used in whisky maturation for more than 30 years is presented
in Figure 5.7. The depth of visual whisky soaking into this stave was around 9 mm (by
visual analysis) from the internal surface.
0.00
2.00
4.00
6.00
8.00
10.00
12.00
14.00
16.00
0.00
5.00
10.00
15.00
20.00
25.00
30.00
35.00
Top Middle Bottom All Top Middle Bottom All
JPN USA
Rat
io (c
is/tr
an
s)
Con
cent
ratio
n of
lact
one
isom
ers
[mg/
L]
transcisRatio
(N = 1)

67
Figure 5.7 Visual whisky soaking into the stave
A series of one millimetre slices of wood were taken from different depths of the stave
pictured in Figure 5.7. These were collected using a wood slicer according to the
method in Section 2.1.2 and the extraction using these chips was carried out according to
the previous used extraction methods of 60% abv ethanol solution for one day (Section
2.2.1). The resultant samples of spirit were analysed for lactone content (Section 2.3.5),
colour (Section 2.2.4), and aromatic compounds (Section 2.3.4). The data for lactone
concentration is presented in Table 5.4 and colour and aromatic compounds in Table 5.5.
The cumulative data are respectively presented in Figure 5.8 and Figure 5.9.
The concentration of cis-lactone was 0.48 mg/L at a depth of 1 mm, but this decreased to
0.25 mg/L by a depth of 5 mm. From 6 mm depth, this increased to 1.85 mg/L at the 34
mm although this increasing was not constant at some depths, 14, 17, 19, 24 mm. The
concentration of trans-lactone was 0.78 mg/L at 1 mm which was greater than cis-lactone
at 1 mm. This also once decreased but increased again and kept increasing with sudden
decreases at some depths reflecting the pattern previously observed with the cis-lactone
levels. Comparison of the cis/trans ratio determined that the values were similar,
ranging between 0.49 and 0.65, because both lactones demonstrated similar trend.

68
Table 5.4 Lactone extraction from different depths within the Japanese oak stave
using 60% abv solution
Depth(N = 1)[mm]
cislactone
[mg/L as is]
translactone
[mg/L as is]
Total(cis+trans)[mg/L as is]
Ratio(cis/trans)
1 0.48 0.78 1.26 0.61
2 0.31 0.52 0.82 0.60
3 0.25 0.40 0.65 0.63
4 0.27 0.55 0.82 0.49
5 0.25 0.38 0.63 0.65
6 0.29 0.51 0.80 0.56
7 0.35 0.63 0.97 0.55
8 0.36 0.58 0.94 0.62
9 0.40 0.74 1.14 0.54
10 0.44 0.81 1.24 0.54
11 0.47 0.82 1.29 0.57
12 0.66 1.31 1.98 0.51
13 0.61 1.21 1.82 0.51
14 0.57 1.02 1.59 0.56
15 0.76 1.46 2.22 0.52
16 0.79 1.54 2.33 0.51
17 0.62 1.14 1.76 0.54
18 0.83 1.58 2.42 0.53
19 0.76 1.47 2.22 0.52
20 0.74 1.38 2.12 0.53
21 1.16 2.19 3.35 0.53
22 1.13 2.17 3.29 0.52
23 1.11 2.13 3.25 0.52
24 0.89 1.68 2.57 0.53
25 1.10 2.09 3.19 0.53
26 1.18 2.24 3.43 0.53
27 1.27 2.42 3.69 0.53
34 1.85 3.61 5.46 0.51

69
The colour (Table 5.5) was 0.36 ABS at 1 mm depth, peaking at 1.05 ABS at 9 to 11 mm.
After the peak the colour level decreased. The data for colour stop at 21 mm, because
further samples were lost before the analysis.
In the case of vanillic acid, the concentration at the depth of 1 mm was high 0.43 mg/L,
but following this (2 mm) dropped suddenly down to 0.24 mg/L. At a deeper depth
between 3 and 9 mm, these concentrations gradually increased and then maintained
around same level of 1.20 mg/L, although the levels demonstrated some variability
between 1.17 and 1.54 mg/L.
When vanillin was examined, the concentrations found at the depth of 1 mm was high at
0.48 mg/L, but the value at 2 mm was suddenly down reflecting the same pattern as
observed with vanillic acid. At deeper depths between 3 and 13 mm, these
concentrations gradually increased. Between 13 and 19 mm the concentration kept
same level around 0.70 mg/L before gradually increasing again.
The concentrations of syringic acid were found to be high at a depth of 1 mm (0.67 mg/L),
but at 2 mm was decreased which was the same as pattern as observed for vanillic acid
and vanillin. At deeper depths the levels of syringic acid increased, reaching 2.59 mg/L
at 27 mm.
The concentration of syringaldehyde at 1 mm was high which was same as previously
observed in vanillin and syringic acid. From 2 mm depth, this concentration was
gradually increased up to 1.84 mg/L at 26 mm.

70
The concentrations of sinapaldehyde at the 1 mm and 2 mm were almost same around
1.00 mg/L. That was gradually increased to 0.98 mg/L at 17 mm and kept same level
of around 1.00 mg/L.
Table 5.5 Colour & aromatics extraction from different depths within the
Japanese oak stave using 60% abv solution
Depth(N = 1)[mm]
Colour[ABS]
Vanillic acid[mg/L as is]
Vanillin[mg/L as is]
Syringic acid[mg/L as is]
Syringaldehyde[mg/L as is]
Sinapaldehyde[mg/L as is]
1 0.36 0.43 0.48 0.67 1.24 0.14
2 0.40 0.24 0.26 0.40 0.80 0.11
3 0.45 0.38 0.21 0.32 0.71 0.15
4 0.55 0.59 0.21 0.28 0.75 0.19
5 0.67 0.60 0.22 0.30 0.73 0.21
6 0.82 0.74 0.28 0.24 0.72 0.23
7 0.94 0.92 0.35 0.26 0.74 0.29
8 1.03 0.95 0.38 0.27 0.77 0.36
9 1.05 1.19 0.44 0.28 0.78 0.44
10 1.05 1.24 0.52 0.31 0.70 0.53
11 1.05 1.17 0.57 0.35 0.83 0.59
12 1.02 1.34 0.61 0.45 0.92 0.67
13 0.98 1.36 0.67 0.53 1.02 0.77
14 0.87 1.17 0.67 0.62 1.05 0.79
15 0.87 1.34 0.71 0.78 1.20 0.87
16 0.82 1.21 0.70 1.00 1.22 0.92
17 0.82 1.37 0.72 1.16 1.36 0.98
18 0.82 1.35 0.72 1.33 1.46 1.00
19 0.83 1.47 0.73 1.47 1.53 0.98
20 0.85 1.42 0.81 1.68 1.64 1.03
21 1.54 0.98 1.83 1.73 0.97
22 1.50 0.97 1.96 1.80 1.04
23 1.31 0.99 2.02 1.74 0.99
24 1.38 1.10 2.26 1.84 1.04
25 1.33 1.16 2.37 1.84 0.98
26 1.35 1.23 2.58 1.84 0.99
27 1.17 1.30 2.59 1.79 0.98
34 1.52 1.68 2.03 1.27 1.21

71
This result showed that the colour was most intense in chips relating to stave depths of 9
- 11 mm, with the colour at 8 and 12 mm also very similar. This pattern was not
observed for lactones and other aromatics. Only vanillin was determined to show a
sudden increase concentration at 21 mm, this might be similar extraction kinetics as
observed for colour. However, the other aromatics were extracted consistently with no
apparent relationship with depth to which whisky had previously soaked into the stave.
No change was observed in the lactones ratio (Table 5.4).
Figure 5.8 Lactones from different depths within the Japanese oak stave using
60% abv solution
0.0
2.0
4.0
6.0
8.0
10.0
12.0
14.0
16.0
0.0
1.0
2.0
3.0
4.0
5.0
6.0
7.0
0 5 10 15 20 25 30 35R
atio
(cis
/tra
ns)
Co
nce
ntra
tion
of l
aton
es [m
g/L]
Depth [mm]
cistransTotalRatio
(N = 1)

72
Figure 5.9 Colours and aromatics from different depths within the Japanese oak
stave using 60% abv solution
5.2.2 Effect of heating conditions
Whisky casks are often treated using heat and this has benefit of regenerating the inner
surface of the cask when it was exhausted (Section 1.3; Conner et al., 2014). When a
cask is described as exhausted this means distillers would not expect the cask to be
capable of a further contribution of the woody aroma compounds (Section 1.1.2.1;
Nishimura et al., 1989). In the following work, the potential of cask regeneration by
heat treatment in order to increase the lactone extraction into the maturing spirit was
examined. Stave slices were heat treated under different conditions and the lactone
content of spirit determined following mixing with 60% abv ethanol solution for one day
(Section 2.2.1).
0.00
0.20
0.40
0.60
0.80
1.00
1.20
1.40
0.0
0.5
1.0
1.5
2.0
2.5
3.0
0 5 10 15 20 25 30 35
Co
lour
[AB
S]
Con
cent
ratio
n o
f aro
mat
ics
[mg
/L]
Depth [mm]
Vanillic acid Vanillin
Syringic acid Syringaldehyde
Sinapaldehyde Colour
(N = 1)

73
5.2.2.1 Heat treatment of wood chips
The effects of heating conditions were studied by using Japanese and American oak chips
which were collected from ‘all’ positions of staves from casks (defined in Section 5.2.1.3)
which were selected from inventory information and had been used for whisky maturation
for more than 30 years. Wood chips were heat treated using gas chromatography oven
according to the method in Section 2.2.2. Extractions using 20% abv ethanol solution
for one day were performed using the method in Section 2.2.1 and lactones measured
using GC-MS (Section 2.3.5).
The data collected following heat treatment of chips are presented in Table 5.6. For
both Japanese and American oak chips, under the higher heat conditions, 250°C for more
than four minutes and 300°C for more than two minutes, the total amount of lactone was
clearly less than 250°C for less than two minutes and lower than 210°C. It is suggested
that these lactones were degraded during the treatment due to the high temperature.
When both types of chips were treated under the milder conditions and were compared,
at the JPN whisky, following treatment at 180°C was found to have the lowest
concentration of cis and trans-lactone, 1.43 and 2.68 mg/L respectively. At a
temperature of 210°C for a duration of four minutes the highest levels of cis and trans-
lactone (3.87 and 5.63 mg/L) were observed. Although these two conditions produced
a large difference in the concentration of lactone extracted, the ratio was similar (0.53 and
0.69). In the case of USA whisky, the concentration of cis-lactone ranged from 3.70 to
4.44 mg/L and trans-lactone were from 0.21 to 0.42 mg/L, although all the ratios were
variable, these were all greater than 10.

74
Table 5.6 Effect of different heat treatments of stave slices on subsequent
extraction of lactones into 60% abv solution
Temp.[°C]
Time[min]
cislactone
[mg/L as is]
translactone
[mg/L as is]
Total(cis+trans)[mg/L as is]
Ratio(cis/trans)
3.18 5.01 8.19 0.64
130 2 3.11 4.62 7.72 0.67
150 2 2.25 3.31 5.56 0.68
180 2 1.43 2.68 4.11 0.53
2 2.71 4.13 6.83 0.66
4 3.87 5.63 9.50 0.69
6 3.05 4.31 7.36 0.71
2 2.28 3.55 5.82 0.64
4 1.20 2.29 3.49 0.52
6 1.48 2.49 3.97 0.60
2 1.31 1.59 2.90 0.82
4 1.39 1.83 3.22 0.76
6 N.D. N.D.
4.40 0.42 4.83 10.36
130 2 4.32 0.33 4.65 13.20
150 2 3.88 0.27 4.15 14.13
180 2 3.70 0.21 3.91 17.44
2 4.44 0.33 4.77 13.50
4 4.33 0.38 4.71 11.42
6 3.91 0.34 4.25 11.68
2 4.05 0.25 4.30 16.06
4 3.13 0.09 3.22 34.57
6 2.82 0.05 2.88 51.51
2 0.92 N.D.
4 0.55 N.D.
6 0.72 N.D.
JPN(N = 1)
USA(N = 1)
210
250
300
210
250
300
No treatment
No treatment

75
The results of the conditions of 250°C for less than two minutes and the milder
temperature and time conditions are illustrated in Figure 5.10. It is suggested that under
the harsher conditions the wood lactones were degraded (Table 5.6) and therefore these
results were not included in the data analysis. Under all of the conditions illustrated, the
ratios of lactones from Japanese oak were consistent ranging from 0.53 up to 0.71. The
ratios of lactones extracted from American oak were higher, with a wider range from
10.36 to 17.44. It is suggested that this may be due to the very low amounts of trans-
lactone compared to cis-lactone (Figure 5.10). This was a similar result to that
previously demonstrated in Section 5.2.1.3, thus further strengthening these observations.
The total amounts of lactone from Japanese oak ranged from 4.11 to 9.50 mg/L and a
consistent pattern in these concentrations could not be detected. The amounts of
lactones from American oak varied from 3.91 to 4.83 mg/L and demonstrated consistency
across the conditions illustrated in Figure 5.10.
Figure 5.10 Effect of different heat treatments of stave slices on subsequent
extraction of lactones into 60% abv solution
0.00
2.00
4.00
6.00
8.00
10.00
12.00
14.00
16.00
18.00
0.00
2.00
4.00
6.00
8.00
10.00
12.00
14.00
No
tre
atm
ent
130°
C 2
min
150°
C 2
min
180°
C 2
min
210°
C 2
min
210°
C 4
min
210°
C 6
min
250°
C 2
min
No
tre
atm
ent
130°
C 2
min
150°
C 2
min
180°
C 2
min
210°
C 2
min
210°
C 4
min
210°
C 6
min
250°
C 2
min
JPN USA
Rat
io (c
is/tr
an
s)
Con
cen
tra
tion
of la
cto
ne is
ome
rs [m
g/L
] transcisRatio
(N = 1)

76
5.2.2.2 Stave regeneration in different depths of wood
In the previous section (Section 5.2.2.1), the effect of heat treatment of oak chips on
lactone extraction was studied. However, within the distillery cooperage the actual heat
treatment of the casks is done from the inner surface of staves and heat transmission is
different from that of small wood chips due to their shapes and sizes (Figure 5.11).
Figure 5.11 Stave (left) and small wood chips (right)
In the following section, the heat treatment of staves was investigated further. The same
staves as used previously in Section 5.2.1.4, were collected from a bottom stave of
Japanese oak cask which had been used in whisky maturation for more than 30 years.
The impact of heat treatments; light charring, heavy charring, or toasting using a handy
burner was examined according to the method in Section 2.2.3. A series of 1 mm slice
of wood chips were taken from different depths of the stave and were collected using a
wood slicer according to the method in Section 2.1.2 and the extraction using these chips
was carried out by stirring with 60% abv spirit for one day at room temperature according
to the methods in Section 2.2.1. The resultant samples of spirit were analysed for
lactones (Section 2.3.5), colour (Section 2.2.4), and aromatics (Section 2.3.4). The data
for lactones is presented in Table 5.7 and the colour of the data in Table 5.8 with the

77
aromatics in Table 5.9. The cumulative data are respectively presented in Figures 5.12
to 5.18.
When considering the effect of light charring, the concentration of total lactones at a depth
of 1 mm was 1.75 mg/L and the highest found in the all conditions tested. However,
highest concentration derived from light charring was observed at a depth of 20 mm (3.09
mg/L) and this was similar to the value obtained through heavy charring (3.02 mg/L) at
the same depth of 20 mm. When the chips were toasted, the concentration at 1 mm was
0.76 mg/L and this was lowest observed in the all conditions, but highest concentration
found was 3.63 mg/L at a depth of 19 mm and this was also highest observed for all
conditions. When the ratios were compared, these were between 0.49 and 0.88 in for all
depths and under all conditions, the only exception to this was for chips taken from a
depth of 1 mm and subjected to light charring.
Although small differences were observed for all of the heat treatment conditions, similar
trends in the concentration and ratio of lactones were identified. In addition to this, the
depth of visual whisky soaking (9 mm) corresponds with an increase in total lactone at
depth beyond this for all heat treatment conditions.

78
Table 5.7 Lactones in different depths of the Japanese oak stave after various heat
treatments by extraction using 60% abv solution
Depth(N = 1)[mm]
cislactone
[mg/L as is]
translactone
[mg/L as is]
Total(cis+trans)[mg/L as is]
Ratio(cis/trans)
cislactone
[mg/L as is]
translactone
[mg/L as is]
Total(cis+trans)[mg/L as is]
Ratio(cis/trans)
1 0.48 0.78 1.26 0.61 0.94 0.81 1.75 1.162 0.31 0.52 0.82 0.60 0.62 0.71 1.33 0.883 0.25 0.40 0.65 0.63 0.48 0.80 1.28 0.604 0.27 0.55 0.82 0.49 0.40 0.71 1.11 0.575 0.25 0.38 0.63 0.65 0.53 0.74 1.27 0.726 0.29 0.51 0.80 0.56 0.36 0.62 0.98 0.577 0.35 0.63 0.97 0.55 0.41 0.66 1.07 0.638 0.36 0.58 0.94 0.62 0.43 0.76 1.19 0.569 0.40 0.74 1.14 0.54 0.45 0.77 1.23 0.5810 0.44 0.81 1.24 0.54 0.51 0.88 1.38 0.5811 0.47 0.82 1.29 0.57 0.42 0.72 1.13 0.5812 0.66 1.31 1.98 0.51 0.60 1.05 1.66 0.5713 0.61 1.21 1.82 0.51 0.67 1.25 1.92 0.5314 0.57 1.02 1.59 0.56 0.56 1.00 1.57 0.5615 0.76 1.46 2.22 0.52 0.69 1.24 1.93 0.5616 0.79 1.54 2.33 0.51 0.83 1.51 2.34 0.5517 0.62 1.14 1.76 0.54 0.89 1.67 2.56 0.5318 0.83 1.58 2.42 0.53 0.96 1.92 2.88 0.5019 0.76 1.47 2.22 0.52 0.68 1.26 1.94 0.5420 0.74 1.38 2.12 0.53 1.07 2.02 3.09 0.53
1 0.54 0.81 1.35 0.67 0.34 0.42 0.76 0.812 0.47 0.76 1.23 0.62 0.35 0.47 0.82 0.753 0.53 0.85 1.38 0.62 0.34 0.46 0.81 0.744 0.47 0.70 1.17 0.67 0.32 0.43 0.75 0.755 0.41 0.68 1.09 0.60 0.33 0.44 0.78 0.766 0.33 0.54 0.88 0.62 0.38 0.50 0.88 0.767 0.53 0.95 1.49 0.56 0.41 0.56 0.98 0.738 0.53 0.99 1.52 0.54 0.51 0.70 1.21 0.739 0.41 0.70 1.12 0.59 0.55 0.77 1.32 0.7210 0.50 0.91 1.40 0.55 0.48 0.68 1.17 0.7011 0.56 0.89 1.45 0.63 0.75 1.04 1.79 0.7212 0.63 1.09 1.73 0.58 0.64 0.94 1.58 0.6913 0.79 1.21 2.00 0.65 0.83 1.17 2.00 0.7114 0.71 1.08 1.80 0.66 1.00 1.39 2.38 0.7215 0.86 1.36 2.22 0.63 1.16 1.60 2.76 0.7316 0.89 1.43 2.32 0.63 1.25 1.75 3.00 0.7117 1.04 1.53 2.57 0.68 1.09 1.60 2.69 0.6818 1.05 1.69 2.74 0.63 1.33 2.02 3.35 0.6619 1.00 1.52 2.51 0.66 1.48 2.15 3.63 0.6920 1.17 1.85 3.02 0.64 1.31 2.07 3.39 0.63
No treatment Light charring
Heavy charring Toasting

79
Figure 5.12 Lactones in different depths of the Japanese oak stave after various
heat treatments by extraction using 60% abv solution
From the result of the experimental work presented in Table 5.8 and Figure 5.13, the
colour was found to increase with a deeper stave depth, after 13 mm, the colour plateaued
at 0.8 to 0.9 ABS, but the colours of depth of 1 to 5 mm were clearly lower. However,
for all types of treatment the peak of colour extraction occurred between 7 mm and 9 mm.
With no treatment the peak of colour extraction was between 8 mm and 12 mm. The
toasting and heavy charring gave the highest, 1.12 and 1.13 ABS colour extraction, and
light charring 1.10 ABS was in second.
0.0
1.0
2.0
3.0
4.0
5.0
6.0
7.0
0 5 10 15 20
Con
cent
ratio
n of
tota
l (cis
+tr
an
s) [m
g/L]
Depth [mm]
No treatmentLight charringHeavy charringToasting
(N = 1)

80
Table 5.8 Colour in different depths of the Japanese oak stave after various heat
treatments by extraction using 60% abv solution
Depth(N = 1)[mm]
No treatment Light charring Heavy charring Toasting
1 0.36 0.54 0.74 0.81
2 0.40 0.36 0.39 0.42
3 0.45 0.51 0.51 0.40
4 0.55 0.58 0.66 0.47
5 0.67 0.80 0.85 0.52
6 0.82 0.94 1.01 0.62
7 0.94 1.10 1.13 0.82
8 1.03 1.08 1.12 1.04
9 1.05 1.05 1.03 1.12
10 1.05 0.99 1.00 1.07
11 1.05 0.95 0.94 0.90
12 1.02 0.93 0.90 0.80
13 0.98 0.92 0.84 0.84
14 0.87 0.92 0.82
15 0.87 0.98 0.90 0.83
16 0.82 0.89 0.87 0.83
17 0.82 0.93 0.87 0.95
18 0.82 0.94 0.88 0.83
19 0.83 0.99 0.86 0.83
20 0.85 0.96 0.93 0.82
Colours [ABS]

81
Figure 5.13 Colour in different depths of the Japanese oak stave after various heat
treatments by extraction using 60% abv solution
From the result presented in Table 5.9 and Figure 5.14, it can be seen that vanillic acid
at the shallower depths of 1 and 2 mm were found to have the highest values when
considering all heat treatments, especially toasting (6.03 mg/L). Following these high
levels of vanillic acid, the concentrations were subsequently found to decline with
increasing stave depth. However, even with the decline in vanillic acid, these levels
were still greater than those observed for the light and heavy charring treatments (Figure
5.14). Light and heavy charring treatments were found to increase the levels of vanillic
acid in the shallow depth of 1 mm, (1.49 mg/L, 1.99 mg/L) compared to those observed
at deeper depths of 2 to 4 mm (0.33 - 0.49 mg/L, 0.35 - 0.83 mg/L). From the heavy
charring and light charring treatments, the concentration was suddenly increased to 1.58
and 1.42 mg/L from the depth of 5 mm. This may indicate generation by heat as these
concentrations were greater than with no treatment.
0.0
0.2
0.4
0.6
0.8
1.0
1.2
0 5 10 15 20
Col
our
[AB
S]
Depth [mm]
No treatmentLight charringHeavy charringToasting
(N = 1)

82
Table 5.9 Aromatics in different depths of the Japanese oak stave after various
heat treatments by extraction using 60% abv solution
Depth(N = 1)[mm]
Vanillic acid[mg/L as is]
Vanillin[mg/L as is]
Syringic acid[mg/L as is]
Syringaldehyde[mg/L as is]
Sinapaldehyde[mg/L as is]
1 0.43 0.48 0.67 1.24 0.142 0.24 0.26 0.40 0.80 0.113 0.38 0.21 0.32 0.71 0.154 0.59 0.21 0.28 0.75 0.195 0.60 0.22 0.30 0.73 0.216 0.74 0.28 0.24 0.72 0.237 0.92 0.35 0.26 0.74 0.298 0.95 0.38 0.27 0.77 0.369 1.19 0.44 0.28 0.78 0.4410 1.24 0.52 0.31 0.70 0.53
1 1.49 3.42 2.95 10.03 11.582 0.49 0.69 0.70 1.23 1.123 0.43 0.65 0.51 1.01 0.354 0.33 0.53 0.35 0.75 0.325 1.42 0.61 0.38 0.76 0.346 1.69 0.63 0.53 0.79 0.427 1.94 0.65 0.67 0.80 0.518 1.95 0.63 0.74 0.80 0.589 2.10 0.65 0.95 0.86 0.6610 1.95 0.64 1.03 0.86 0.71
1 1.99 4.79 4.71 17.99 16.732 0.83 1.36 2.40 4.84 9.523 0.35 0.61 0.83 1.77 0.794 0.38 0.56 0.47 1.07 0.445 1.58 0.61 0.60 0.63 0.506 1.88 0.64 0.73 0.59 0.547 2.06 0.69 0.94 0.86 0.608 1.98 0.67 1.18 1.22 0.649 1.92 0.63 1.32 0.59 0.6710 1.88 0.67 1.36 0.87 0.73
1 6.03 19.11 11.22 46.83 103.782 3.64 7.65 8.57 22.94 87.823 2.33 3.76 6.32 11.80 57.424 1.71 2.53 4.71 8.23 40.085 1.34 2.15 3.86 8.10 28.846 1.05 1.94 3.41 8.56 16.997 0.86 1.72 3.10 8.13 8.158 0.70 1.54 2.80 7.20 4.359 0.69 1.27 2.25 5.51 2.8910 0.60 1.15 1.75 3.83 2.24
Heavy charring
Toasting
No treatment
Light charring

83
Figure 5.14 Vanillic acid in different depths of the Japanese oak stave after various
heat treatments by extraction using 60% abv solution
Examination of the concentrations of vanillin (Table 5.9 and Figure 5.15) found that the
shallower depths of 1, 2, and 3 mm showed higher levels with all heat treatments than
those at deeper depths. The highest concentration observed was in the 1 mm toasted
chips (19.11 mg/L). The concentration of vanillin observed following the toasting
treatment remained higher than found with no treatment or, either of the charring
treatments for all stave depths. However, the vanillin levels from the toasted samples
declined from this initial peak (1 - 3 mm) and by 9 mm these values more closely matched
those of the untreated samples and light and heavy charred chips.
0.0
1.0
2.0
3.0
4.0
5.0
6.0
7.0
0 2 4 6 8 10
Co
nce
ntra
tion
of v
ani
llic
acid
[mg
/L]
Depth [mm]
No treatmentLight charringHeavy charringToasting
(N = 1)

84
Figure 5.15 Vanillin in different depths of the Japanese oak stave after various
heat treatments by extraction using 60% abv solution
Evaluation of the results obtained for the syringic acid extraction (Table 5.9 and Figure
5.16) found that shallower depths of 1 and 2 mm demonstrated higher levels for all heat
treatments. The highest concentration observed was in the 1 mm toasted chips (11.22
mg/L). The concentration from treatment of wood chips by toasting remained higher
for all stave depths. The concentration from light and heavy charring from the depth of
3 to 7 mm was low (0.35 - 0.94mg/L). This reflected the pattern previously observed
with vanillin (Figure 5.15), although a slight difference was observed between all heat
treatment conditions and no treatment in 10 mm.
0.0
5.0
10.0
15.0
20.0
25.0
0 2 4 6 8 10
Con
cent
ratio
n of
van
illin
[mg/
L]
Depth [mm]
No treatmentLight charringHeavy charringToasting
(N = 1)

85
Figure 5.16 Syringic acid in different depths of the Japanese oak stave after
various heat treatments by extraction using 60% abv solution
The syringaldehyde results (Table 5.9 and Figure 5.17) demonstrated that at shallower
depths of 1, 2, and 3 mm extraction was greater for all the heat treatment conditions,
especially toasting with a concentration of syringaldehyde with 1 mm chips of 46.83 mg/L.
The concentration extracted from the toasted chips was greater at all depths of stave chips
when compared to charred chips and the control untreated chips. This is a similar
pattern to that observed for vanillin (Figure 5.15) and syringic acid (Figure 5.16).
0.0
2.0
4.0
6.0
8.0
10.0
12.0
0 2 4 6 8 10
Con
cent
ratio
n of
syr
ingi
c ac
id [m
g/L]
Depth [mm]
No treatmentLight charringHeavy charringToasting
(N = 1)

86
Figure 5.17 Syringaldehyde in different depths of the Japanese oak stave after
various heat treatments by extraction using 60% abv solution
The sinapaldehyde results (Table 5.9 and Figure 5.18) demonstrated that extraction
following toasting was much greater than for all other conditions and the concentration
derived from the 1 mm chips was the highest (103.78 mg/L). The concentrations
extracted toasted chips remained high in the deeper depths up to 10 mm. The
concentration extracted from the toasted chips was greater at all depths of stave chips
when compared to charred chips and the control untreated chips. This is a similar
pattern to that observed for vanillin (Figure 5.15), syringic acid (Figure 5.16), and
syringaldehyde (Figure 5.17).
0.0
5.0
10.0
15.0
20.0
25.0
30.0
35.0
40.0
45.0
50.0
0 2 4 6 8 10
Con
cent
ratio
n of
syr
inga
ldeh
yde
[mg
/L]
Depth [mm]
No treatmentLight CharringHeavy CharringToasting
(N = 1)

87
Figure 5.18 Sinapaldehyde in different depths of the Japanese oak stave after
various heat treatments by extraction using 60% abv solution
The effects of toasting and charring of staves upon extraction of wood compounds into
spirit was studied. The activation of extraction of lactones into spirit through heat
treatment was not observed (Table 5.7). However, the regeneration of the colour and
aromatics at the surface was demonstrated (Table 5.8-9, Figure 5.13-18). In particular,
toasting gave deeper regeneration of aromatics, vanillic acid, syringic acid, and
sinapaldehyde.
5.2.3 Whisky matured in re-charred cask
The effect of heat treatment on lactones was studied using Japanese oak chips (Section
5.2.2.2). In order to confirm the effect of heat treatment as a practical process, whiskies
matured in production scale casks were analysed. Analysis for lactone and aromatics
was carried out on young whiskies. These are Yamazaki malt whiskies had been
0.0
20.0
40.0
60.0
80.0
100.0
120.0
0 2 4 6 8 10
Con
cent
ratio
n of
sin
apa
ldeh
yde
[mg
/L]
Depth [mm]
No treatmentLight charringHeavy charringToasting
(N = 1)

88
matured in Japanese oak cask for nine years in untreated refill casks or for ten years in re-
charred refill casks (Table 2.1 (Section 2.1.1)). Whiskies were sampled from seven
different casks each for both cask types. Young whisky was used for this work due to
cask availability with known provenance.
The results from the lactone analysis is presented in Table 5.10, with the cumulative data
illustrated in Figure 5.19. When considering each lactone, cis-lactone concentrations
were found to be very close in value (0.6 and 0.7 mg/L), and trans-lactones were also
very similar (1.1 and 1.3 mg/L). The ratio of cis- to trans-lactones were the same at 0.6.
Statistical analysis determined that there were no significant differences (p = >0.05)
detected between the no treatment and re-charring (Section 2.3).
Table 5.10 Chemical analysis result of whisky lactones in young whiskies
(Raw data is available in Appendix 6)
cislactone
[mg/L as is]
translactone
[mg/L as is]
Total(cis+trans)[mg/L as is]
Ratio(cis/trans)
Mean 0.6 1.1 1.7 0.6
St. Dev. 0.1 0.4 0.4 0.2
Mean 0.7 1.3 2.0 0.6
St. Dev. 0.1 0.3 0.3 0.1
0.31 0.11 0.24 0.44
Notreatment
Re-charring
p value by t-test(N = 7)

89
Figure 5.19 Chemical analysis result of whisky lactones in young whiskies
The data collected from the result of aromatics analysis shown in Table 5.11 with the
cumulative data illustrated in Figure 5.20. This data was found to reflect the patterns
previously observed for vanillic acid and sinapaldehyde in the oak chips (Section 5.2.2.2).
The concentration of aromatics extracted due to re-charring were slightly higher than with
no treatment, 2.1 and 1.9 mg/L for vanillic acid, and 0.8 and 0.6 mg/L respectively for
sinapaldehyde. When these data sets were compared to those for vanillin and syringic
acid, the concentrations found in the spirit held in re-charred casks was found to be higher
(3.6 and 2.5 mg/L) than where the cask had received no treatment (3.0 and 1.7 mg/L).
In the case of syringaldehyde, the concentration in spirit from re-charred casks (6.3 mg/L)
was much higher than spirit from casks with no treatment (4.3 mg/L). No significant
differences were detected between the extraction levels of vanillic acid (p = 0.18).
However the concentrations of syringic acid, vanillin, syringaldehyde, and sinapaldehyde
were found to be significantly different (p = 0.05 or lower).
0.00
2.00
4.00
6.00
8.00
10.00
12.00
14.00
16.00
0.00
0.50
1.00
1.50
2.00
2.50
3.00
3.50
4.00
4.50
5.00
No treatment Re-charring
Rat
io (c
is/tr
an
s)
Con
cen
tra
tion
of la
cto
ne is
om
ers
[mg
/L]
trans
cis
Ratio
(N = 7)

90
Table 5.11 Chemical analysis result of aromatics in young whiskies
(Raw data is available in Appendix 7)
Figure 5.20 Chemical analysis result of aromatics in young whiskies
Vanillic acid[mg/L as is]
Vanillin[mg/L as is]
Syringic acid[mg/L as is]
Syringaldehyde[mg/L as is]
Sinapaldehyde[mg/L as is]
Mean 1.9 3.0 1.7 4.3 0.6
St. Dev. 0.3 0.5 0.2 0.7 0.1
Mean 2.1 3.6 2.5 6.3 0.8
St. Dev. 0.3 0.5 0.3 0.6 0.1
0.18 0.05 <0.01 <0.01 <0.01
Notreatment
Re-charring
p value by t-test(N = 7)
0.00
1.00
2.00
3.00
4.00
5.00
6.00
7.00
Vanillic acid Vanillin Syringic acid Syringaldehyde Sinapaldehyde
Con
cen
tra
tion
of a
rom
atic
s [m
g/L]
No treatment
Re-charring
(N = 7)

91
5.3 Discussion
The factors which influence the release of lactones from the oak staves of casks during
maturation were studied using the wood chip extraction using the ethanol solution
methodology developed earlier in this study.
When the stave position was compared, all stave extractions demonstrated the same
amount and ratio of lactones (Section 5.2.1.3). This was surprising as it had been
postulated that contact with maturing spirit over long periods of time would have had an
impact on the compounds remaining in the wood chips (Section 1.1.2.1). It was clear
that there was no difference in the stave position within the cask from this study. It is
suggested that one reason for this could be that wood chips were collected from the
outside surface of cask and penetration or extraction did not reach to the outside surface
and the outside surface was not influenced by the maturation inside the cask.
Comparison of the ratios of sample ‘top’, ‘middle’, and ‘bottom’ were similar 0.68, 0.72,
0.77, however the value for the ‘all’ sample was 0.49 not as expected, which would have
been to give a value around the middle of values the other positions (Table 5.3). It is
suggested that a reason for this may be that the ‘all’ sample were not a true mixture of
these three positions, but collected from a selection of the all staves of the cask used in
this work.
The impact of the contact of spirit penetrating to differing depths of staves in casks was
investigated (Section 5.2.1.4). The data collected demonstrated that the lactones and
most of the aromatics were extracted from the wood chips consistently with no apparent
relationship with depth of the whisky soaking (visual observation) achieved by 30 years
of storage and maturation. No differences were determined in the lactones ratio (Table

92
5.4). If the staves of old casks are sliced and analysed, it can be confirmed what amount
of compounds is still remained in the cask without waiting for further maturation.
Therefore, the analysis of sliced staves could be used to predict how long or how many
times the cask can be used as an active cask from wood extracts point of view, and be
part of a wood policy.
The effects of various heat treatments on wood chips and their subsequent extraction were
studied (Section 5.2.2.1 and Section 5.2.2.2) using Japanese oak and American oak chips.
The total amount of lactone which was extracted from Japanese oak were not found to be
consistent, but the concentration of lactone extracted from American oak were consistent
across the conditions tested (Table 5.6). It is not clear why the results of Japanese oak
were not consistent and this requires further investigation (Section 5.2.2.1). The more
intense heat treatments of toasting and heavy charring showed higher colour, confirming
that the stave surface was influenced by heat. In the toasting, the depth of highest colour
was 2 mm deeper those of than the light and heavy charring. The reasons behind this
are unclear, but one possibility is that the residue which was observed in 9 - 11mm may
be pushed deeper into the wood during longer periods of heat treatment (Section 5.2.2.2).
The heat regeneration in different depths of stave by light charring, heavy charring, and
toasting were studied. Considering the colour, the more intense heat treatments of
toasting and heavy charring showed higher colour (Table 5.8). This result indicated that
the surface of the stave was influenced by heat. Also, the lower colour values one to
five mm suggest that this is the depth to which colour compounds are leeched from the
stave during a 30 year period of maturation. Considering aromatics, these
concentrations following toasting remained higher for all stave depths (Table 5.9).
However, at a greater depth these concentrations more closely matched those of the

93
untreated, lightly and heavily toasted chips. These are probably caused by the strength
of heat treatment and heat transmission respectively. Although regeneration of the
colour and aromatics near the surface was observed, heat treatment of the wood chips and
staves showed no activation of lactones, with both the levels and their ratio being
unaffected (Table 5.7). All aromatics at the shallower depth of 1 and 2 mm was found
to have the highest values when considering all heat treatments, especially toasting
(Table 5.9). It is suggested here that toasting is the optimum heat treatment for the
generation of aromatics.
Finally, the whiskies, of the almost same age, matured in either un-treated or re-charred
casks were compared (Section 5.2.2.3). The whiskies matured in re-charred casks
showed elevated concentrations of aromatics (Table 5.11). Again no significant
difference in lactone levels was observed (Table 5.10). This result using matured
whisky supported the result using model solutions using oak chip (Section 5.2.2.2).
Heat treatment is normally used for the regeneration of cask in order to add a colour and
aroma (Section 1.3). Colour level and aromatic compound concentration were observed
to increase with heat treatment. However, lactones which are the important aroma
compound for Japanese oak character in whisky were not activated by any of the heat
treatments under investigation. Therefore it is suggested that the regeneration of casks
by heat treatment is limited, and is not effective for the activation of the Japanese oak
character which is a desirable and unique character of Japanese oak whisky.
From these results, two important learnings can be made. One is that surface shaving of
the insides of the cask would not to be sufficient for the activation and extractions of
lactones and aromatics by future spirit fills. The second one is that the aromas derived

94
from aromatics (vanilla, woody, etc.), are enhanced by heat treatment, while the coconut
aroma from lactone is not. In other words, the heat treatment during cask regeneration
is selective. Some aroma compounds such as vanillin are generated through heat
treatment while others, such as the lactones, are naturally present in the oak. Once the
levels of the latter are depleted by a period of maturation they cannot be regenerated.

95
Chapter 6: Synergy between whisky lactone isomers on coconut aroma
6.1 Introduction
In work presented earlier (Section 4.2.1), it was determined by sensory analysis that one
of the typical aromas of JPN whisky could be described as ‘coconut’. In addition, in
this study chemical analysis focussed on the coconut aroma compound ‘whisky lactone’,
and it was found that Japanese oak had a higher concentration of trans-lactone than other
oaks (American or European). However, it was also found that the total lactone content
of Japanese oak whisky was similar to the levels expressed in USA whisky (Section 4.2.2).
It has been postulated, as a result of this work, that the cis/trans lactone ratio may provide
a means of identifying, through analytical methods, whether or not a whisky has been
matured in Japanese oak.
The work presented in this thesis has developed that lactones are an important coconut
aroma component of JPN whisky. Following on from this two questions were posed,
why do JPN whiskies have a coconut aroma? And, does trans-lactone have any
significant aroma effect?
In this chapter, sensory analyses of threshold measurement and lactone isomer addition
to model solutions or whiskies were carried out in order to study any effects of trans-
lactone on coconut aroma in whisky. In addition to this, a numerical relationship was
investigated to explain the effect.

96
6.2 Results
6.2.1 Determination of odour thresholds of lactones
The two naturally occurring isomers (3S,4S (cis), 3S,4R (trans)) of whisky lactone have
slightly different aromas (Koppenhoefer et al., 1994), but they all have coconut notes and
could potentially contribute to coconut aroma in whisky (Section 4.2.2). In order to
determine the odour thresholds for each lactone, the threshold of cis-lactone, trans-
lactone, and cis and trans-lactone 1:1 mixture in 20% abv ethanol were calculated using
the method in Section 2.4 (ISO 13301) (Table 6.1). The total number of panellists were
plotted against log concentration. A straight line was fitted to this graph, and the
formula of this line, � = A� + B, was calculated by the least squares method. This was
performed for cis-lactone (Figure 6.1), trans-lactone (Figure 6.2) and the 1:1 ratio
mixture (Figure 6.3). The Log concentration at which half the panel can detect the
aroma was calculated and this was converted back to the standard concentration (Table
6.1).

97
Table 6.1 Determination of odour thresholds of lactones in 20% abv ethanol
solution
A B
0.05 -1.3010300 2 2
0.10 -1.0000000 8 10
0.15 -0.8239087 7 17
0.20 -0.6989700 1 18
0.25 -0.6020600 2 20
N.D. 10 30
0.40 -0.3979400 6 6
0.80 -0.0969100 4 10
1.20 0.0791812 10 20
1.60 0.2041200 6 26
2.00 0.3010300 0 26
N.D. 3 29
0.05 -1.3010300 2 2
0.10 -1.0000000 8 10
0.15 -0.8239087 12 22
0.20 -0.6989700 3 25
0.25 -0.6020600 3 28
N.D. 2 30
52.12 0.11
36.86 0.15
17.26 0.83
cislactone
translactone
cisand
translactone
1:1mixture
26.51
39.23
33.32
Threshold[mg/L]
Straight lineformula valuesConcentration
[mg/L]Log
concentration
Numberdetectingaroma
Totalnumber
ofpanelists
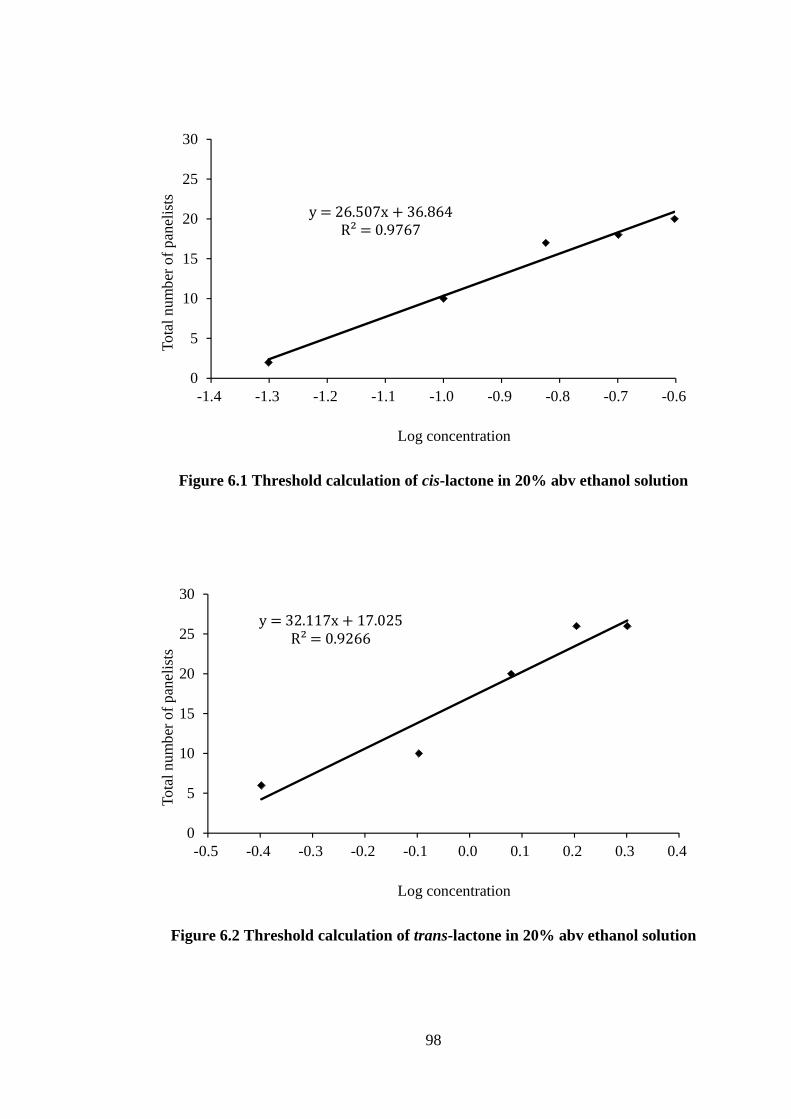
98
Figure 6.1 Threshold calculation of cis-lactone in 20% abv ethanol solution
Figure 6.2 Threshold calculation of trans-lactone in 20% abv ethanol solution
y = 26.507x + 36.864R² = 0.9767
0
5
10
15
20
25
30
-1.4 -1.3 -1.2 -1.1 -1.0 -0.9 -0.8 -0.7 -0.6
Tota
l nu
mb
er o
f pan
elis
ts
Log concentration
y = 32.117x + 17.025R² = 0.9266
0
5
10
15
20
25
30
-0.5 -0.4 -0.3 -0.2 -0.1 0.0 0.1 0.2 0.3 0.4
Tota
l nu
mb
er o
f pan
elis
ts
Log concentration

99
Figure 6.3 Threshold calculation of cis and trans-lactone 1:1 mixture in 20% abv
ethanol solution
The threshold of cis-lactone was 0.15 mg/L, that of trans-lactone was 0.83 mg/L, and the
threshold of the 1:1 mixture was 0.11 mg/L. The R2 (correlation coefficient) of cis-
lactone and 1:1 mixture were slightly higher than that of the trans-lactone, however all
values showed good correlations (greater than 0.9). These results demonstrate that the
threshold of cis-lactone was 5.5 times lower than that of trans-lactone, and is close a
previous study (Otuska et al., 1974) carried out in 30% abv ethanol solutions. This
previous study determined the thresholds to be cis-lactone was 0.067 mg/L and that of
trans-lactone was 0.79 mg/L. In similar research using wine, the threshold of each
lactone was reported by Brown et al. (2006). These authors reported that cis-lactone
had a lower threshold (0.057 mg/L) than trans-lactone (0.38 mg/L). In the past, due to
the higher ratio of cis-lactone in American oak European oaks, and the lower threshold
of cis-lactone, most studies have focussed on this isomer (Waterhouse et al., 1994; Diaz-
Plaza et al., 2002; Fernandez et al., 2003; Brown et al., 2006).
y = 39.225x + 52.122R² = 0.9702
0
5
10
15
20
25
30
-1.4 -1.2 -1.0 -0.8 -0.6
Tota
l nu
mb
er o
f pan
elis
ts
Log concentration

100
It was additionally observed in this study (Table 6.1) that the threshold of the 1:1 mixture
containing both lactones (0.11 mg/L) was similar to that of either cis-lactone (0.15 mg/L)
and lower than trans-lactone (0.83 mg/L) when measured individually. Therefore it was
postulated that there is a synergistic effect between the cis- and trans-lactones.
6.2.2 Synergistic effects on aroma between whisky lactones
6.2.2.1 Addition of lactones to whisky
The influence of each lactone in the complex matrix of whisky (compared to 20% abv
ethanol) was a subsequent focus of this research with further studies adding each lactone
to whisky. The spirits used for this work were 20 year old JPN and USA whiskies as
these contained different original ratios of lactones (Section 4.2.2). To these whiskies
1 mg/L of each lactone was added (Section 2.1.6), and the sensory analyses (Section
2.4.1-3) were carried out with specific focus on the coconut descriptor. The sensory
results obtained when each of the lactones were added to the USA and JPN whiskies are
given in Table 6.2 illustrated in Figure 6.4.
When trans-lactone was added to the USA whisky, intensity increased more (from 0.4 to
0.9) than cis-lactone (from 0.4 to 0.7). This pattern was not observed in the JPN whisky
sample. When either cis- or trans-lactones were added a similar increase in intensity
(from 0.5 to 1.0 and 1.1 respectively) was observed. This increase was greater than
detected in the USA whisky. These differences in JPN whiskies were determined to be
significantly different (p = 0.03, 0.02) (Table 6.2).

101
Table 6.2 Sensory results of addition experiment to USA and JPN 20yo whiskies
using coconut descriptor
(Raw data is available in Appendix 8, 9)
When trans-lactone or cis-lactone was added, all of intensities of coconut aroma in JPN
whisky increased to similar levels (Figure 6.4).
Noaddition
cis addition
trans addition
Mean 0.4 0.7 0.9
St. Dev. 0.3 0.6 0.6
p value by t-test(N = 14)
- 0.14 0.02
Mean 0.5 1.0 1.1
St. Dev. 0.3 0.7 0.8
p value by t-test(N = 13)
- 0.03 0.02
USA-20yo
JPN-20yo

102
Figure 6.4 Sensory results of addition experiment to USA and JPN 20yo whiskies
using the ‘coconut’ descriptor
6.2.2.2 Study of coconut aromas in model ethanol solutions
Model solutions were prepared using 20% abv ethanol spiked with additional lactones
which contained either no lactone or 1.00 mg/L of each lactone in order to examine the
aroma activities of each lactone (cis- or trans-) in a simple model solution (Section 2.1.5).
Sensory analysis was carried out according to the method described in Section 2.4.1-3.
The results of this analysis are summarised in Table 6.3. The intensity of cis addition
was given a value of 1.3 and trans addition a value of 0.5. The model solutions
demonstrated that addition of trans-lactones did not produce a significant increase in the
detection of coconut aroma. Addition of the cis-lactone resulted in the detection of
coconut aroma which was significantly different (p = <0.01) to the ethanol with no
additions.
0.0
0.2
0.4
0.6
0.8
1.0
1.2
1.4
1.6
1.8
2.0
No addition cis addition trans addition
Inte
nsi
ty o
f co
con
ut
USA-20yo
JPN-20yo
(N = 13-14)

103
Table 6.3 Intensity of coconut aroma in samples of 20% abv ethanol model
solutions containing each lactone
(Raw data is available in Appendix 10)
Following on from this, ethanol solutions (20% abv) spiked with additional lactones were
prepared to replicate the lactone levels as were found in the 20 year old JPN and USA
whiskies (Section 2.1.5; Table 4.4). These solutions also underwent sensory analysis
(Section 2.4.1-3) for the intensity of the coconut aroma of interest to this research (Table
6.4). Figure 6.5, which is cumulative data of Table 6.3 and Table 6.4, illustrates that
cis- addition resulted in a higher sensory mean score of (1.6) in the coconut aroma, this
difference was found to be significant (p = 0.04). This pattern is similar to that observed
with 1.00 mg/L model solution. When considering the trans- addition, this resulted in
greater detection (with a sensory mean score of 1.5) which was same level of cis- addition
(mean score of 1.6). This did not reflect the observations made using the 1.00 mg/L
model solution. These results which found that both cis- and trans- additions resulted
cislactone
translactone
Mean 0.3
St. Dev. 0.4
Mean 1.3
St. Dev. 0.8
p value by t-test(N = 15)
<0.01
Mean 0.5
St. Dev. 0.6
p value by t-test(N = 15)
0.29
0.00 1.00
Amount [mg/L as is]
Intensity
1.00 mg/Lmodelsolution
Noaddition
0.00 0.00
cisaddition
1.00 0.00
transaddition

104
in greater sensory intensity was quite similar with that demonstrated by JPN whisky in
Figure 6.4.
Table 6.4 Intensity of coconut aroma in samples of 20% abv ethanol model
solutions on replicating the lactone isomers of JPN or USA 20yo whisky
(Raw data is available in Appendix 11)
cislactone
translactone
Mean 0.9
St. Dev. 0.3
Mean 1.6
St. Dev. 0.8
p value by t-test(N = 8)
0.04
Mean 1.5
St. Dev. 0.8
p value by t-test(N = 9)
0.07
Mean 1.0
St. Dev. 0.7
Mean 1.5
St. Dev. 0.6
p value by t-test(N = 8)
0.15
Mean 1.5
St. Dev. 0.7
p value by t-test(N = 9)
0.14
transaddition
JPN-20yomodel
solution
USA-20yomodel
solution
0.41 0.82
1.41 0.82
0.41 1.82
1.01 0.10
2.01 0.10
1.01 1.10
Amount [mg/L as is]
Noaddition
cisaddition
transaddition
Noaddition
cisaddition
Intensity

105
Figure 6.5 Intensity of coconut aroma in samples of 20% abv ethanol model
solutions on replicating of USA and JPN 20yo whiskies
6.2.2.3 Coconut aroma intensity
Following on from the previous work presented in this chapter (Section 6.2.2.1) it may
be said to be surprising that ‘coconut’ is a typical aroma of JPN whisky (Section 4.2.1)
when these whiskies show higher amounts of trans-lactone, which is less aroma active,
than cis-lactone. This observation merited further investigation, therefore in order to
examine this coconut aroma, the calculated coconut dose over threshold of predicted
coconut aroma intensity was defined using threshold of each lactone. Equation 1 [EQ1]
was constructed by using the sum of coconut aroma intensity for each lactone isomer. It
is suggested that this could be used to predict coconut aroma based on a combination of
the concentrations (Figure 6.5) and thresholds of the two lactones (Section 6.2.1).
0.0
0.2
0.4
0.6
0.8
1.0
1.2
1.4
1.6
1.8
2.0
No addition cis addition trans addition
Inte
nsi
ty o
f co
con
ut
1.00 mg/L model
USA-20yo model
JPN-20yo model
(N = 9-15)

106
Calculated coconut dose over threshold = [567]
0.15+
[9:;<7]
0.83
[EQ1]
Using formula EQ1, the dose over threshold of cis-lactone (1.00 mg/L) is calculated to
be 6.7, and of the trans-lactone (at a concentration of 1.00 mg/L) is 1.2. Unsurprisingly
the dose of the trans-lactone 1.00 mg/L solution is lower than that of the cis-lactone 1.00
mg/L solution. Results of the sensory evaluation, shown in Table 6.4, agree with the
calculated doses (Table 6.5) although it should be noted that these calculated doses and
the nosing scores had different scales.
Table 6.5 Study of coconut intensity using calculated dose over threshold for 20%
abv ethanol solutions including each lactone isomer
Following on from the application of EQ1 to the model solutions it was applied to 20
year old USA and JPN whiskies (Section 2.1.1), based on the levels of each of the
lactones that they contained (Table 4.4). The calculated dose of JPN whisky was 3.7,
which was about half that of USA whisky with a score of 6.8. However, the sensory
results (Figure 4.1) showed the inverse of this, with the JPN whisky being given higher
scores for this aroma (Table 6.6).
cislactone
translactone
cis-lactone 1.00 0.00 6.7 1.3
trans-lactone 0.00 1.00 1.2 0.5
Sample
Amount [mg/L as is] Calculateddose over threshold
Nosingscore

107
Table 6.6 Coconut intensity and sensory result in whisky using calculated dose
over threshold
In order to examine this unexpected difference between calculated dose and actual
coconut intensity, the influence of each lactone in the whisky matrix became the focus of
the investigation. The experiments were carried out using the 20 year old USA and JPN
whiskies (Section 2.2.2), which contained different original ratios of lactones. In the
first experiment 1.00 mg/L of each lactone was added to the USA whisky. The
calculated dose was lowest in the sample containing no added lactone (score of 6.8).
The highest dose (13.5) was found in the sample with added cis-lactone, and an
intermediate dose (8.1) was found in the one with added trans-lactone (Table 6.7).
However, these calculated doses did not reflect the nosing scores gathered from the
sensory panel. This held true for both the USA and JPN whiskies. The nosing scores
of both the USA and JPN whiskies with added trans-lactone were highest. This result
indicated that the trans-lactone has higher coconut aroma activity than cis-lactone.
cislactone
translactone
USA-20yo 1.01 0.10 6.8 0.8
JPN-20yo 0.41 0.82 3.7 1.4
Sample
Amount [mg/L as is] Calculateddose over threshold
Nosingscore

108
Table 6.7 Coconut intensity and sensory results for additional experiment using
calculated dose over threshold
6.2.2.4 Possibility of a synergistic effect between whisky lactones
In order to examine why the trans-lactone shows this high aroma activity, 20% abv
ethanol model solutions were prepared which contained the same concentrations of each
lactone as the 20 year old JPN whisky used in Section 6.2.2.2. The sensory results for
these model samples (Table 6.4) are shown in Figure 6.6, alongside the original whisky
sensory results (Table 6.2). In the model samples, cis- and trans- addition showed
similar scores of 1.5, which was higher than the score of 0.9 for no addition. In the JPN
whisky, cis- and trans- addition showed also the mostly same score of 1.0 which was
higher than the score of 0.5 for no addition.
cislactone
translactone
cislactone
translactone
Noaddition
1.01 0.10 6.8 0.4 0.41 0.82 3.7 0.5
cis1 mg/L
2.01 0.10 13.5 0.7 1.41 0.82 10.4 1.0
trans1 mg/L
1.01 1.10 8.1 0.9 0.41 1.82 4.9 1.1
USA-20yo
Sample
JPN-20yo
Amount [mg/L as is] Calculateddose over threshold
Nosingscore
Amount [mg/L as is] Calculateddose over threshold
Nosingscore

109
Figure 6.6 Comparison of sensory results of JPN whisky and 20% abv ethanol
model samples replicating of JPN whisky
6.2.2.5 Numerical analysis for synergistic effects
The results of the previous section (Section 6.2.2.4) suggest a relationship between the
ratio of lactones and the aroma activity detected during sensory analysis. The possibility
of a numerical relationship to explain or more accurately predict the aroma intensity was
explored by further sensory analysis using model solutions containing lactone isomers.
6.2.2.5.1 Sensory analysis of individual lactone isomers
The first requirement was to determine the intensity of ‘coconut’ aroma in the 20% abv
ethanol model solutions containing varying amounts of the each lactones. The
concentration of lactone studied were 0.25, 0.50, 0.75 and 1.00 mg/L. The samples
0.0
0.5
1.0
1.5
2.0
2.5
3.0
No addition cis addition trans addition
Inte
nsi
ty o
f co
con
ut
JPN-20yo
20% abv ethanol model
(N = 9-13)

110
underwent sensory analysis (Section 2.4.1-3) the results are shown in Table 6.8 and
illustrated in Figure 6.7.
Table 6.8 Intensity of coconut aroma in 20% abv ethanol solutions containing
various amounts of either cis or trans-lactone
(Raw data is available in Appendix 12)
0.25 0.50 0.75 1.00
Mean 0.7 1.2 1.7 2.0
St. Dev. 0.4 0.4 0.5 0.5
p value by t-test(N = 12)
- <0.01 <0.01 <0.01
Mean 0.2 0.3 0.6 0.8
St. Dev. 0.3 0.4 0.6 0.7
p value by t-test(N = 12)
- 0.58 0.13 0.02
cislactone
translactone
Concentration of lactone [mg/L]

111
Figure 6.7 Intensity of coconut aroma in 20% abv ethanol solutions containing
various amounts of either cis or trans-lactone
Significant differences were observed in the levels of ‘coconut’ aroma depending on the
all concentrations of cis-lactones present (p = <0.01). In the case of trans-lactones,
intensities (0.2, 0.3, 0.6, 0.8 respectively) were much less than those of cis-lactone (0.7,
1.2, 1.7, 2.0 respectively). However, the trend of gradual increase was observed which
was same as cis-lactone, even though significant differences were not observed in the all
concentrations (p = 0.58, 0.13, 0.02). As may have been expected, an increase in the
levels of both cis and trans-lactone corresponded to an increase in aroma intensity. This
indicated that amount of lactones used in these samples was at a suitable level for sensory
discrimination. The intensity scores for cis-lactone were higher than those of the trans-
lactone. This result was expected due to the lower sensory threshold of cis-lactone.
The intention was to apply this knowledge to further develop the prediction of aroma
intensity using an equation. Intensity of a single aroma compound, I(compound) can
0.0
0.2
0.4
0.6
0.8
1.0
1.2
1.4
1.6
1.8
2.0
0.25 0.50 0.75 1.00
Inte
nsity
of c
oco
nut
Concentration of lactone [mg/L]
cis
trans
(N = 12)

112
generally be expressed as a log first order polynomials function with a variable parameter,
namely the level of the aroma compound present (Lawless et al., 1998). This function
is shown as F1.
I(isomer) = ln (A[isomer] + B)
where A and B are constants (F1)
Applying this function (F1) to the sensory data collected for the cis- and trans- isomers
(Figure 6.7) gave rise to the formula shown in F2 (Table 6.9) and F3 (Table 6.10).
Where A was determined to be the equation of the line plotted in Figure 6.8 for cis-
lactone and in Figure 6.9 for trans-lactone. Approximations were calculated using the
least squares method.
I(cis) = ln(5.6927 x [cis] + 1) (F2)
Table 6.9 Approximations calculated using the least squares method for cis-lactone
0.25 0.50 0.75 1.00
Intensity 0.7 1.2 1.7 2.0
Concentration of lactone [mg/L]

113
Figure 6.8 Approximations calculated using the least squares method for cis-
lactone
I(trans) = ln(1.1057 x [trans] + 1) (F3)
Table 6.10 Intensity for approximations calculated using the least squares method
for trans-lactone
y = 5.6927x + 1R² = 0.9522
1.0
2.0
3.0
4.0
5.0
6.0
7.0
8.0
0.00 0.20 0.40 0.60 0.80 1.00
EX
P(I
nte
nsity
)
Concentration [mg/L]
0.25 0.50 0.75 1.00
Intensity 0.2 0.3 0.6 0.8
Concentration of lactone [mg/L]

114
Figure 6.9 Approximations calculated using the least squares method for trans-
lactone
Both formula (F2 and F3) demonstrated a good linear trend, R2 = 0.9522 and 0.8949
respectively, indicating that this function gave a good approximation of aroma intensity
in the simple single isomer samples.
The intensities of both isomers at the determined detection thresholds of cis-lactone (0.15
mg/L) and trans-lactone (0.83 mg/L) (Section 6.2.1) were calculated using equations F2
and F3. An approximated curve was calculated for the cis- and trans-lactones (Figure
6.10), and the intensities were determined to be I(cis-threshold) = 0.62 and I(trans-
threshold) = 0.65. The intensities at the thresholds were both around 0.6 and therefore
numerically very close to each other. From this result it can be estimated that the lowest
intensity at which panellists can detect the presence of these lactones as contributing a
coconut aroma is around 0.6.
y = 1.1057x + 1R² = 0.8949
1.0
1.2
1.4
1.6
1.8
2.0
2.2
2.4
0.00 0.20 0.40 0.60 0.80 1.00
EX
P(I
nte
nsi
ty)
Concentration [mg/L]
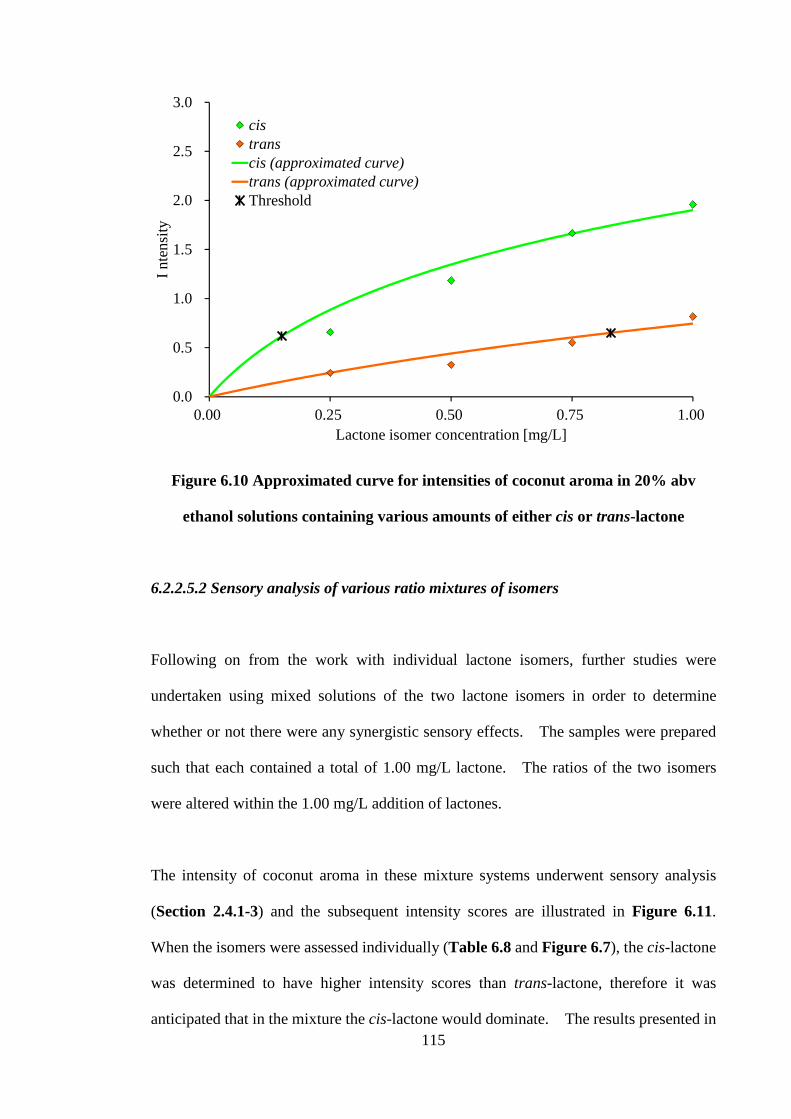
115
Figure 6.10 Approximated curve for intensities of coconut aroma in 20% abv
ethanol solutions containing various amounts of either cis or trans-lactone
6.2.2.5.2 Sensory analysis of various ratio mixtures of isomers
Following on from the work with individual lactone isomers, further studies were
undertaken using mixed solutions of the two lactone isomers in order to determine
whether or not there were any synergistic sensory effects. The samples were prepared
such that each contained a total of 1.00 mg/L lactone. The ratios of the two isomers
were altered within the 1.00 mg/L addition of lactones.
The intensity of coconut aroma in these mixture systems underwent sensory analysis
(Section 2.4.1-3) and the subsequent intensity scores are illustrated in Figure 6.11.
When the isomers were assessed individually (Table 6.8 and Figure 6.7), the cis-lactone
was determined to have higher intensity scores than trans-lactone, therefore it was
anticipated that in the mixture the cis-lactone would dominate. The results presented in
0.0
0.5
1.0
1.5
2.0
2.5
3.0
0.00 0.25 0.50 0.75 1.00
I nte
nsi
ty
Lactone isomer concentration [mg/L]
cistranscis (approximated curve)trans (approximated curve)Threshold

116
Figure 6.11 demonstrate that aroma intensity is not dominated by cis-lactone. The
intensity scores increase before decreasing again, the peak intensity scores were around
the 50:50 lactone ratio level. Furthermore, the intensity score for the 50:50 mix is 2.0.
This is greater than the scores for given for either the cis or trans-lactones when present
individually, which were 1.6 and 0.5 respectively.
Table 6.11 Intensity of coconut aroma in 20% abv ethanol solutions containing
mixture of cis and trans-lactones
(Raw data is available in Appendix 13)
cis 0.00 0.25 0.50 0.75 1.00
trans 1.00 0.75 0.50 0.25 0.00
0 25 50 75 100
0.5 1.2 2.0 1.9 1.6
0.5 0.5 0.6 0.6 0.8
- 0.01 <0.01 <0.01 <0.01
Concentration of lactone [mg/L]
p value by t-test(N = 10)
Lactoneisomer
Percentage of cis-lactone [%]
Mean
St. Dev.

117
Figure 6.11 Intensity of coconut aroma in 20% abv ethanol solutions containing
mixture of cis and trans-lactones
To confirm that this was synergistic effect, the calculated value, as described previously
(Section 6.2.2.3) was applied to the data for the mixed isomer samples. The function
F1 (Section 6.2.2.5.1) was adapted to allow the levels of the two different isomers to be
taken into account. The intensity of the mixture was initially calculated as a simple sum
of both lactones. A log second order polynomials function was used, as given in F4.
I(mix) = ln(A[cis] + B[trans] + C)
where A, B and C are constants (F4)
The total amount of lactone in all of the samples was known to be 1.00 mg/L, which
allowed the function F4 to be simplified to a log first order polynomials function (F5)
using only the concentration of cis-lactone as a variable. The resulting simplified
function is similar to F1.
0.0
0.2
0.4
0.6
0.8
1.0
1.2
1.4
1.6
1.8
2.0
0% 25% 50% 75% 100%
Inte
nsity
of c
oco
nut
Percentage of cis-lactone
(N = 10)

118
I(mix) = ln(A[cis] + B[trans] + C)
= ln((A - B)[cis] + (B + C))
= ln(D[cis] + E)
Where D = A - B, and E = B + C are constants (F5)
This function was applied to the sensory data obtained for the mixed isomer samples
(Table 6.11), the least squares method for approximation was used to calculate the
‘intensity score’ (Table 6.12, Figure 6.12). The slope of the Figure 6.12 was applied
to F5, producing equation F6.
Table 6.12 Approximations calculated using the least squares method for lactone
mixture
cis 0.00 0.25 0.50 0.75 1.00
trans 1.00 0.75 0.50 0.25 0.00
0 25 50 75 100
0.5 1.2 2.0 1.9 1.6
Lactoneisomer
Intensity
Percentage of cis-lactone [%]
Concentration of lactone [mg/L]
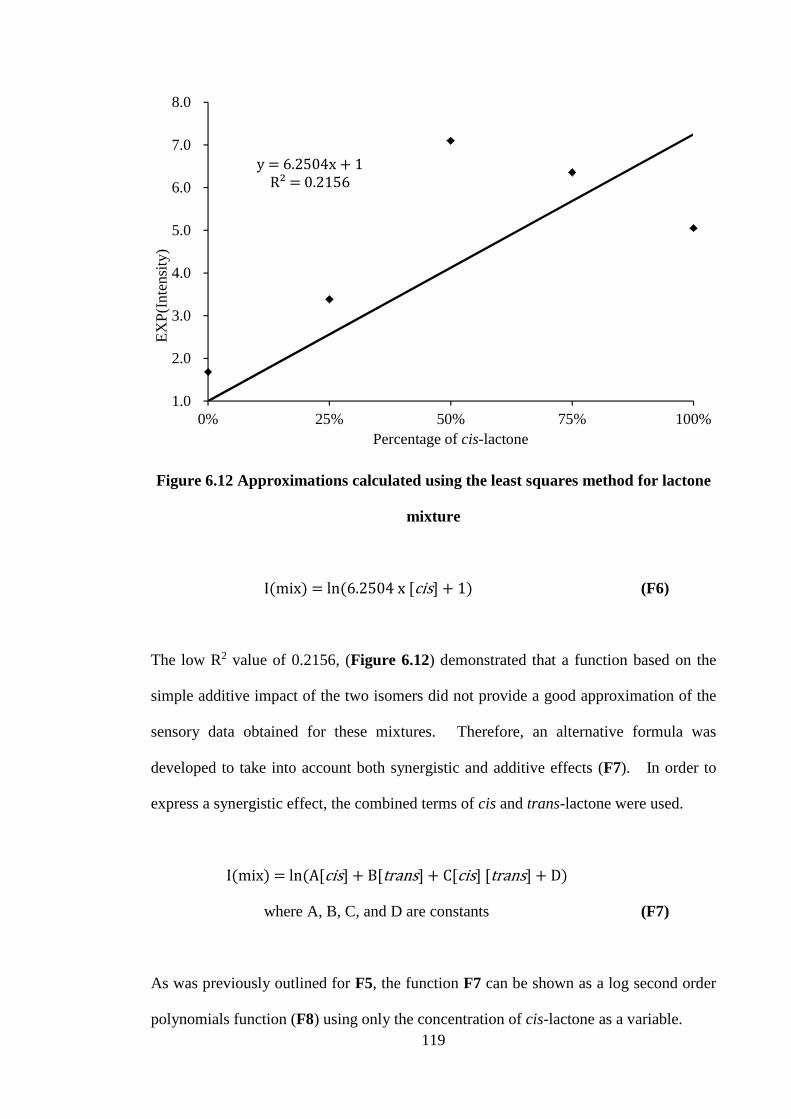
119
Figure 6.12 Approximations calculated using the least squares method for lactone
mixture
I(mix) = ln(6.2504 x [cis] + 1) (F6)
The low R2 value of 0.2156, (Figure 6.12) demonstrated that a function based on the
simple additive impact of the two isomers did not provide a good approximation of the
sensory data obtained for these mixtures. Therefore, an alternative formula was
developed to take into account both synergistic and additive effects (F7). In order to
express a synergistic effect, the combined terms of cis and trans-lactone were used.
I(mix) = ln(A[cis] + B[trans] + C[cis] [trans] + D)
where A, B, C, and D are constants (F7)
As was previously outlined for F5, the function F7 can be shown as a log second order
polynomials function (F8) using only the concentration of cis-lactone as a variable.
y = 6.2504x + 1R² = 0.2156
1.0
2.0
3.0
4.0
5.0
6.0
7.0
8.0
0% 25% 50% 75% 100%
EX
P(I
nte
nsity
)
Percentage of cis-lactone

120
I(mix) = ln(A[cis] + B[trans] + C[cis] [trans] + D)
= ln(– C[cis]2 + (A – B + C)[cis] + (B + D))
= ln(E[cis]2 + F[cis] + G)
where E = – C, F = A – B + C, and G = B + D are constants
(F8)
Applying this function to the sensory data shown in Table 6.11 and Table 6.12 when
plotted (Figure 6.13) gave the formula for the line which then resulted in the formula F9.
Figure 6.13 Approximations calculated using the least squares method for lactone
mixture by second order polynomials function
I(mix) = ln(-11.972 x [cis]2 + 15.858 x [cis] + 1.2768)
R2 = 0.8875 (F9)
y = -11.972x2 + 15.858x + 1.2768R² = 0.8875
1.0
2.0
3.0
4.0
5.0
6.0
7.0
8.0
0% 25% 50% 75% 100%
EX
P(I
nte
nsity
)
Percentage of cis-lactone

121
The formula which was based on both synergistic and additive effects between the two
isomers gave a greater R2 (0.8875) value than the formula based on additive effects alone
which had an R2 of 0.2156.
In order to confirm the result predicted by F9, a hypothetical calculation of the intensity
of mixed isomer solutions based on the data obtained for single isomers both presented
in Table 6.8 was performed. The intensity was calculated as a sum of isomers,
approximated in the same form as F4 or F5. The intensities were calculated and the
results are presented I(mix’) calculated was shown in Table 6.13. This data was plotted
in Figure 6.14 and the equation of the line used to develop function F10 from function
F5.
I(mix’) = ln(5.0172 x [cis] + 2.1833)
R2 = 0.9651 (F10)
Table 6.13 Approximations calculated using the least squares method for lactone
mixture by sum of isomers
cis 0.00 0.25 0.50 0.75 1.00
trans 1.00 0.75 0.50 0.25 0.00
0 25 50 75 100
cis 0.0 0.7 1.2 1.7 2.0
trans 0.8 0.6 0.3 0.2 0.0
total 0.8 1.3 1.5 1.9 2.0
Concentration of lactone [mg/L]
Lactoneisomer
Percentage of cis-lactone [%]
Intensity

122
Figure 6.14 Approximations calculated using the least squares method for lactone
mixture by sum of isomers
Comparison of the application of the data used to generate equations F9 and F10 is shown
in Figure 6.15. These two curves display differing shapes, which suggests that intensity
calculations by simple sums are different from the intensity of the actual mixed isomer
samples. It is proposed that this confirms the existence of synergistic effects between
cis and trans-lactones. In addition to this, the highest intensity is the same point as
where the ratio cis:trans equals 2:1. Interestingly this figure is much closer to the ratio
founded in JPN whisky than USA whisky (Section 4.2.2, Table 4.4). Therefore, the
results of F9 supports observation that JPN whisky has more coconut aroma than USA
whisky. It is postulated that model equation (F9) can be used to predict the intensity of
the coconut aroma of whisky using just the concentration of the cis-lactone isomer.
y = 5.2172x + 2.1833R² = 0.9651
1.0
2.0
3.0
4.0
5.0
6.0
7.0
8.0
0% 25% 50% 75% 100%
EX
P(I
nten
sity
)
Percentage of cis-lactone

123
I(mix) = ln(-11.972 x [cis]2 + 15.858 x [cis] + 1.2768) (F9)
I(mix’) = ln(5.0172 x [cis] + 2.1833) (F10)
Figure 6.15 Comparison of intensity scores approximated from individual and
mixed lactone data
6.2.3 Distinct aroma of whisky lactones
Although both cis and trans-lactones contribute to the coconut aroma, these are known to
have subtly different aromas. Cis-lactone has been described as having a faint coconut
note, faint musty, earthy note and is reminiscent of hay, whilst trans-lactone has a piquant
celery note, faint coconut note and green walnut note (Koppenhoefer et al., 1994). The
sensory panellists used during the course of this study were asked to describe these
lactones using their own terminology (Section 2.1.3). This resulted in cis-lactone being
described as ‘heavy & oily’ trans-lactone as ‘light & fresh’. Sensory analysis was
carried out using three coconut related descriptors; ‘heavy & oily’ coconut which is
mainly derived from cis-lactone, ‘light & fresh’ coconut which is mainly derived from
0.0
0.5
1.0
1.5
2.0
2.5
3.0
0% 25% 50% 75% 100%
Inte
nsi
ty
Percentage of cis-lactone
Mixture (by second order polynomials function (F9))
Mixture' (by sum of isomers (F10))
Mixture (approximated curve)
Mixture' (approximated curve)

124
trans-lactone, and ‘total’ coconut in order to investigate the coconut aroma interaction
between the lactone isomers.
6.2.3.1 Study of coconut aromas in whiskies
Sensory analysis (Section 2.4.1-3) was performed on JPN and USA 20 year old whiskies,
the sensory results are summarised in Table 6.14 and illustrated in Figure 6.16. The
JPN whisky (cis-lactone 0.41 mg/L, trans-lactone 0.82 mg/L) which contained the higher
concentration of trans-lactone (Section 4.2.2 Table 4.4) was given the higher score of
0.9 for ‘light & fresh’ coconut aroma than USA whisky (cis-lactone 1.01 mg/L, trans-
lactone 0.10 mg/L). Whereas for the USA whisky, the greatest lactone component was
cis-lactone which was described as more ‘heavy & oily’. When the JPN whisky was
compared with USA whisky, all of sensory intensity scores (0.4, 0.3, and 0.4) were lower
than those of the JPN whisky (1.0, 0.9, and 0.6). This was surprising as chemical
analysis demonstrated that the USA whisky contained a higher concentration of the more
aroma active cis-lactone.
Table 6.14 Sensory results of 20yo whiskies using three coconut related descriptors
(Raw data is available in Appendix 14)
cislactone
translactone
Mean 1.0 0.9 0.6
St. Dev. 0.8 0.8 0.6
Mean 0.4 0.3 0.4
St. Dev. 0.3 0.3 0.4
0.09 0.09 0.54
Totalcoconut
Light & freshcoconut
Heavy & oilycoconut
p value by t-test(N = 9)
JPN20yo
USA20yo
Amount [mg/L as is]
0.41 0.82
1.01 0.10

125
Figure 6.16 Sensory results of 20yo whiskies using three coconut related
descriptors
6.2.3.2 Study of coconut aromas in model ethanol solutions
In order to clarify the relation between the lactone isomers and these three coconut related
descriptors in whisky, ethanol solutions were prepared and sensory analysis was carried
out.
The equations were tested through the use of two model solutions each containing one of
the lactones (cis- or trans-). Lactones at a concentration of 1.00 mg/L in a 20% abv
ethanol solution were used (Section 2.1.5). The sensory analysis was carried out using
the three coconut related descriptors, ‘heavy & oily’ coconut, ‘light & fresh’ coconut and
‘total’ coconut (Section 2.4.1-3). The results from this sensory analysis are summarised
in Table 6.15 and illustrated in Figure 6.17.
0.0
0.2
0.4
0.6
0.8
1.0
1.2
1.4
1.6
1.8
2.0
Total Light & fresh Heavy & oily
Inte
nsi
ty
Coconut description
JPN
USA
(N = 9)

126
When considering the cis-lactone solution, the score of 0.9 for ‘light & fresh’ was similar
to the score of 1.0 for ‘heavy & oily’. Whereas, considering the trans-lactone solution
the score of 0.6 for ‘light & fresh’ was greater than the score of 0.2 for ‘heavy & oily’.
The intensity scores for the cis-lactone solution (1.3, 0.9, and 1.0) were all higher than
those given to the trans-lactone solutions (0.5, 0.6, and 0.2) for all three coconut
descriptors. It should be noted that the difference for ‘light & fresh’ was not significant
(p = 0.17). This was not an unexpected result as cis-lactone is known to have a lower
sensory threshold than trans-lactone. The ‘heavy & oily’ character was found to be
dominant in cis-lactone, while trans-lactone was characterised by ‘light & fresh’ coconut
notes. This agreed with the results from the sensory panel in the previous chapter
(Section 6.2.3.1).
Table 6.15 Intensity of 20% abv ethanol model solutions including each lactone
isomer using three coconut related descriptors
(Raw data is available in Appendix 15)
Totalcoconut
Light & freshcoconut
Heavy & oilycoconut
Mean 1.3 0.9 1.0
St. Dev. 0.8 0.6 0.8
Mean 0.5 0.6 0.2
St. Dev. 0.6 0.7 0.4
<0.01 0.17 0.01p value by t-test
(N = 15)
cislactone
translactone

127
Figure 6.17 Intensity of 20% abv ethanol model solutions including each lactone
isomer using three coconut related descriptors
6.2.3.3 Lactone addition experiments
The influence of each lactone in the whisky matrix was examined and explored in further
detail with each lactone added to whisky. The addition experiments (Section 2.1.6)
were carried out using both USA and JPN 20yo whiskies, which contained different
original ratios of lactones (Section 4.2.2). An addition rate of 1.00 mg/L of each lactone
was used, and the sensory analyses (Section 2.4.1-3) were carried out using three coconut
related descriptors.
The sensory results obtained when each of the lactones were added to the 20 year old
USA and JPN whiskies are summarised in Table 6.16 and Table 6.17 and illustrated in
Figure 6.18 (USA whisky) and Figure 6.19 (JPN whisky) respectively.
0.0
0.2
0.4
0.6
0.8
1.0
1.2
1.4
1.6
1.8
2.0
Total Light & fresh Heavy & oily
Inte
nsi
ty o
f co
con
ut
Coconut description
cis
trans
(N = 15)

128
Table 6.16 Sensory results of addition experiment to 20yo USA whisky using three
coconut related descriptors
(Raw data is available in Appendix 16)
Sensory results obtained when each lactone isomer was added to the USA whisky (Table
6.16 and Figure 6.18) demonstrated that when considering the no addition and trans-
lactone addition, the scores for ‘light & fresh’ (0.3, 0.8) were similar to the scores for
‘heavy & oily’ (0.4, 0.7). Whereas the results for cis- addition found that the score of
0.4 for ‘light & fresh’ was less than the score of 0.7 for ‘heavy & oily’. When trans-
lactone was added, the intensity of ‘light & fresh’ coconut aroma increased from 0.3 to
0.8, while upon the addition of cis-lactone ‘heavy & oily’ increased from 0.4 to 0.7. This
result was in line with what would be expected from the addition of these isomers and
their associated sensory characteristics. The scores for ‘total’ coconut aroma were
observed to increase from 0.4 to 1.1 when trans-lactone was added. This was surprising
and suggests that, despite its lower sensory activity, this isomer has a stronger
contribution to overall coconut aroma in USA whisky than the presence of cis-lactone.
cislactone
translactone
Mean 0.4 0.3 0.4
St. Dev. 0.3 0.2 0.3
Mean 0.7 0.4 0.7
St. Dev. 0.6 0.4 0.7
p value by t-test(N = 8)
0.28 0.76 0.35
Mean 1.1 0.8 0.7
St. Dev. 0.6 0.4 0.8
p value by t-test(N = 8)
0.02 0.02 0.36
Light & freshcoconut
Heavy & oilycoconut
Noaddition
cisaddition
transaddition
Amount [mg/L as is]Total
coconut
1.01 0.10
2.01 0.10
1.01 1.10

129
Figure 6.18 Sensory results of addition experiment to 20yo USA whisky using three
coconut related descriptors
Sensory results obtained when the lactones were added to the JPN whisky (Table 6.17
and Figure 6.19) demonstrated that the addition of cis-lactone had a positive impact on
all descriptors, however the smallest effect was on ‘light & fresh’. The addition of trans-
lactone also had a positive impact on all three aroma descriptors with the greatest impact
on the ‘total’ and ‘light & fresh’ characters. When trans-lactone was added, the
intensity of ‘light & fresh’ coconut aroma increased from 0.6 to 1.0, while on cis-lactone
addition ‘heavy & oily’ increased from 0.4 to the most 0.9. It suggested that when each
lactone was added, the intensities of the typical characters associated with each lactone
isomer increased. In both cases the ‘total’ coconut aroma also increased from 0.5 to 1.0
or 1.1. However, the scores were comparable for the two lactone isomers, indicating
that in the JPN whisky cis and trans-lactone make a similar contribution to the ‘total’
coconut aroma.
0.0
0.2
0.4
0.6
0.8
1.0
1.2
1.4
1.6
1.8
2.0
Total Light & fresh Heavy & oily
Inte
nsi
ty
Coconut description
No addition
cis addition
trans addition
(N = 8)

130
Table 6.17 Sensory results of addition experiment to 20yo JPN whisky using three
coconut related descriptors
(Raw data is available in Appendix 17)
Figure 6.19 Sensory results of addition experiment to 20yo JPN whisky using three
coconut related descriptors
cislactone
translactone
Mean 0.5 0.6 0.4
St. Dev. 0.3 0.5 0.3
Mean 1.0 0.6 0.9
St. Dev. 0.7 0.6 0.7
p value by t-test(N = 13)
0.03 0.74 0.06
Mean 1.1 1.0 0.6
St. Dev. 0.8 0.7 0.5
p value by t-test(N = 13)
0.02 0.06 0.27
Noaddition
cisaddition
transaddition
1.41 0.82
0.41 1.82
Amount [mg/L as is]Total
coconutLight & fresh
coconutHeavy & oily
coconut
0.41 0.82
0.0
0.2
0.4
0.6
0.8
1.0
1.2
1.4
1.6
1.8
2.0
Total Light & fresh Heavy & oily
Inte
nsi
ty
Coconut description
No additioncis additiontrans addition
(N = 13)

131
6.3 Discussion
In order to measure the coconut aroma activity for each lactone, the threshold of cis-
lactone, trans-lactone, and cis and trans-lactone 1:1 mixture in 20% abv ethanol were
calculated (Section 6.2.1). The threshold of a 1:1 mixture of both lactones was 0.11
mg/L, lower than that of either cis-lactone (0.15 mg/L) or trans-lactone (0.83 mg/L) when
these were measured individually. These results indicate that mixtures of lactones are
more aroma active than when using cis-lactone or trans-lactone alone. It is postulated
that there may be a synergistic effect between the two lactone isomers on the perception
of coconut aroma by sensory panel. An equation was constructed by using the sum of
coconut aroma intensity for each lactone isomer in order to predict coconut aroma based
on a combination of the levels and thresholds of the two lactones (Section 6.2.2.3).
Application of data to this equation found that the calculated value for predicted aroma
intensity did not match the results of the sensory analysis. This added further weight to
the proposed theory that there are synergistic effects. The addition of lactones to whisky
was carried out in order to explore further these synergies (Section 6.2.2.4). Trans-
lactone showed a highly active coconut aroma when added to whiskies containing
different ratios of lactones. To enable study greater detail, model ethanol solutions were
prepared which contained the levels of lactones found in whiskies (Section 6.2.2.2).
This experimental protocol was used as coconut aroma is easier to detect in simple ethanol
solutions than in a complex whisky matrix. Results for the model solutions
demonstrated that the sample containing trans-lactone had a higher score than the sample
containing no lactone and a similar score to the cis-lactone sample. These results led to
the formation of two possible theories which are proposed here. The first is that the
coconut aroma in whisky is mostly influenced by the ratio of lactones. The second is
that trans-lactone is more aroma-active when also in the presence of cis-lactone. The

132
threshold results showed that the thresholds of 1:1 (w/w) mixture of both lactones was
clearly lower than only cis-lactone or trans-lactone solutions (Section 6.2.1). The
mixed lactones demonstrated greater aroma-activity than individual isomers. When
taken together, the model sample behaviours and the threshold of mixed lactones together
demonstrated a synergistic effect between the cis-lactone and trans-lactone, which may
explain the high aroma activity of trans-lactone in whisky.
It was felt that it would be a useful tool for whisky blending if aroma intensity could be
explained or, more accurately predicted, through the development of a numerical
relationship (Section 6.2.2.5.1). The samples prepared all contained a total of 1.00
mg/L lactone, but with differing ratios of the two isomers, the aroma intensity was found
not to be cis-lactone dominated, rather the intensity scores increase then decrease again
peaking at around the 50:50 lactone ratio level (Section 6.2.2.5.2). Furthermore, the
intensity score for the 50:50 is greater than the scores for given from either the cis or
trans-lactones when present individually. When the expression of these aroma
intensities as first or second order polynomials function was demonstrated, the second
order polynomials function showed much more satisfactory fit (by R2) than using a first
order polynomials function. The second order polynomials function was based on both
synergistic and additive effects between the two isomers. Therefore, the supposition of
the existence of synergistic effects between cis and trans-lactone was supported by these
results. This second order polynomials function pointed the highest intensity in the ratio
cis:trans occurring at a ratio of 2:1. Interestingly this is much closer to the ratio found
in JPN whisky than that of USA whisky. Therefore, it is suggested that the result of the
occurrence of these lactone levels in whisky is that it corresponds to the observation that
JPN whisky has more coconut aroma than USA whisky. As described previously, the

133
coconut aroma intensity can be predicted by the use of numerical calculation using the
ratio of lactone isomers.
Finally, sensory analysis was carried out using three coconut related descriptors; ‘heavy
& oily’ coconut which is mainly derived from cis-lactone, ‘light & fresh’ coconut which
is mainly derived from trans-lactone, and ‘total’ coconut in order to investigate the
coconut aroma interaction between the lactone isomers. As a result, the intensity scores
for the cis-lactone solution were higher than those for trans-lactone for all three coconut
descriptors, although the difference for ‘light & fresh’ was not significant (Section
6.2.3.2). This was not unexpected as cis-lactone is known to have a lower sensory
threshold than trans-lactone. This suggests that trans-lactone can be detected as a ‘light
& fresh’ aroma compound more readily than cis-lactone even though trans-lactone has
higher threshold than cis-lactone. These results demonstrated that these three
descriptors could be used by a trained sensory panel to recognise the aroma differences
between the isomers.
In order to examine the influence of each lactone in the whisky matrix, each lactone was
added to JPN and USA whiskies (Section 6.2.3.3). As a result, the intensities of the
typical characters associated with each lactone isomer were increased, and the ‘total’
coconut aroma also increased in both cases by addition of either cis- or trans-lactone.
These results indicated further the existence of a synergistic effect between the lactone
isomers for the ‘total’ coconut aroma proposed in this chapter. The existence of a
synergistic effect, in combination with the findings in this study, allows a number of
conclusions to be proposed. The ‘total’ coconut aroma in the USA whisky was affected
to a lesser degree by the addition of cis-lactone, which is the naturally occurring dominant
lactone present in this spirit, than it is by the addition of trans-lactone. Whereas, in the

134
JPN whisky, which originally contained similar levels to each other of the two lactones,
the levels were found to be very close to highest aroma activity (Figure 6.15). The ‘total’
coconut aroma was much less influenced by which isomer is added. Furthermore, when
trans-lactone, which has higher threshold, was added the intensities in ‘light & fresh’
aroma, typical of trans-lactone, and ‘total’ coconut aroma both increased. Hence, the
synergistic effect for ‘total’ coconut aroma is likely to be caused by the ‘light & fresh’
aroma from trans-lactone, whose aroma activity is enhanced by the interaction with cis-
lactone.

135
Chapter 7: Conclusions & Future work
Since the whisky matured in Japanese oak cask has unique aromas which are not found
in any other whisky matured in casks constructed of other oak types, the aim of this
research was to identify the unique aromas imparted by casks of Japanese oak (Section
1.5).
‘Incense’ and ‘Coconut’ were identified as good expressions of the JPN whiskies (Section
4.2.1). When chemical analysis was focused on the coconut aroma compound, whisky
lactone, only JPN whiskies were found have a different ratio of lactone isomers, weighted
towards greater levels of trans-lactone (Section 4.2.2). In addition to this, it is indicated
by the analysis of wood chip extraction (Section 4.2.2) that the greater levels of trans-
lactone in JPN whiskies are very likely to be derived from the wood itself.
In order to determine the key factors involved in flavour activation, the wood chips using
ethanol solution were analysed instead of cask maturation. The lactones and most of the
aromatics were extracted consistently with no apparent relationship with depth of the
visual whisky soaking observation (Section 5.2.1.4). In addition to this, it was found
that the outside surface of the stave was not influenced by the maturation inside of the
cask. When these chemical analyses of stave are applied for casks in production, this
could be useful to predict how long or how many times the cask can be used as an active
cask from wood extracts point of view. Therefore, a part of the company wood policy
could be managed by the chemical analysis of stave instead of conventional sensory
analysis.

136
When the effects of various heat treatments, which would be used normally for the
regeneration of casks were studied, both the levels of lactones and their ratio which was
an important aroma compound for the Japanese oak character in whisky were not
activated by any heat treatments, although the regeneration of the colour and aromatics
were partially shown (Section 5.2.2.2). Therefore, some aroma compounds such as
vanillin are generated through heat treatment, while others, such as the lactones, cannot
be regenerated once the levels are depleted by a period of maturation. From the
production point of view, it was indicated that new casks are necessary to maintain
consistent whisky aroma derived from wood because regeneration of cask by heat
treatment is selective.
When sensory analyses of threshold measurements and lactone isomer addition to model
solutions or whiskies were carried out, it is postulated that there may be the possibility of
a synergetic effect between lactone isomers on the perception of coconut aroma (Section
6.2.2.4). In order to explain the effect, a numerical relationship was developed (Section
6.2.2.5). When the expression of the aroma intensities as first or second order
polynomials function with lactone concentration was demonstrated, second order
polynomials function which was based on both synergistic effects between the two
isomers showed much more satisfactory fit than using a first order polynomials function
(Figure 6.15). This second order polynomials function pointed the highest intensity in
the ratio which is much closer to the ratio of JPN whisky than USA whisky. Therefore
it is suggested that highly active coconut aroma of JPN whisky is derived from not only
the concentration of lactone but also ratio of two isomers. If the concentrations of both
lactones are analysed before whisky blending, this information could be useful to
determine the blending recipe from the coconut aroma point of view. When the sensory
analysis was carried out using coconut descriptors related to each lactone isomer, the
137
synergistic effect is likely to be caused by the aroma activity of trans-lactone enhanced
by the interaction with cis-lactone (Section 6.2.3).
As described above, this study was focused on the coconut aroma and lactone isomers in
JPN whisky. As a result, it could be demonstrated that only JPN whisky has a unique
coconut aroma due to higher levels of trans-lactone which are never found in USA or
SPA whisky. This means Japanese oak is an important raw material to appeal the
uniqueness of Japanese whisky worldwide.
In this study, limited whiskies were used as samples for analysis and interesting results
about the coconut character of Japanese whisky were obtained. In order to make this
study more practical in industry, wider range of whiskies, maturation period, oak tree of
locations or ages, and other factors, will be researched in the future. Additionally,
further investigation of the change on coconut aroma, because the coconut aroma intensity
of Japanese oak whisky was increased with time, but that of American oak whisky was
decreased. In the meantime, whisky maturation normally needs at least a couple of years
and especially for Japanese oak whisky, more than 20 years is needed until being unique.
Therefore already matured whiskies were used as samples for analysis. In order to
ascertain the result of this study, new maturation trial will be started and traced using long
period. Furthermore, ‘incense’ was determined as an alternative important character of
Japanese oak whisky in addition to coconut character. As the compound of ‘incense’ or
other unique characters of Japanese oak whisky have not been studied, the identification
of fascinating Japanese oak characters will be studied in order to demonstrate the
uniqueness of Japanese whisky.

138
Appendix
Appendix 1
Sensory results of 20 year old JPN and USA whiskies using the aroma descriptions
of incense, matured pineapple, and coconut
IncenseMaturedpineapple
Coconut
0.8 0.6 0.9
0.9 0.8 1.3
2.0 0.5 1.5
2.0 0.0 1.0
0.3 0.1 0.6
0.5 1.0 0.5
1.7 1.0 2.5
2.0 1.5 2.0
2.0 1.8 2.2
Mean 1.4 0.8 1.4
St. Dev. 0.7 0.6 0.7
1.0 0.7 0.6
0.5 0.2 0.5
0.5 1.0 1.0
0.5 0.0 0.0
1.9 0.1 1.7
1.0 0.5 1.0
2.0 1.5 1.0
0.5 0.5 1.0
1.4 0.5 0.6
Mean 1.0 0.6 0.8
St. Dev. 0.6 0.4 0.4
0.40 0.26 0.09p value by t-test
(N = 9)
USA-20yo
JPN-20yo

139
Appendix 2
Sensory results of 27 year old JPN and USA whiskies using the aroma descriptions
of incense, matured pineapple, and coconut
IncenseMaturedpineapple
Coconut
1.2 0.3 0.8
2.1 2.0 1.4
1.0 0.5 1.0
0.5 2.5 0.5
2.0 0.1 0.8
1.5 0.7 0.5
2.5 1.2 0.8
2.5 2.0 2.5
2.9 2.0 0.2
Mean 1.8 1.3 0.9
St. Dev. 0.8 0.8 0.6
0.7 0.6 0.5
1.4 0.9 0.6
0.5 0.0 1.0
0.5 1.5 0.0
0.9 0.1 0.3
1.0 1.0 0.5
1.5 1.2 0.5
0.5 1.0 1.0
2.7 2.5 0.5
Mean 1.1 1.0 0.5
St. Dev. 0.7 0.7 0.3
0.01 0.22 0.05p value by t-test
(N = 9)
USA-27yo
JPN-27yo

140
Appendix 3
Sensory results of 40 year old JPN and USA whiskies using the aroma descriptions
of incense, matured pineapple, and coconut
IncenseMaturedpineapple
Coconut
0.8 0.2 2.9
1.8 1.6 1.2
3.0 2.0 0.5
1.5 0.0 1.0
2.9 0.1 1.0
2.0 1.5 1.0
1.8 0.1 2.8
3.0 3.0 3.0
1.8 0.9 2.9
Mean 2.1 1.0 1.8
St. Dev. 0.7 1.0 1.0
1.1 0.2 0.4
0.7 0.5 0.7
1.0 2.0 1.0
0.5 0.0 0.0
1.4 0.1 0.2
1.5 0.8 1.0
0.5 1.0 0.3
0.5 1.0 0.5
2.3 1.9 0.9
Mean 1.1 0.8 0.6
St. Dev. 0.6 0.7 0.3
0.02 0.52 0.01p value by t-test
(N = 9)
USA-40yo
JPN-40yo

141
Appendix 4
Effect of extraction length of wood chip on subsequent extraction of lactones into
60% abv solution
cislactone
[mg/L as is]
translactone
[mg/L as is]
Total(cis+trans)[mg/L as is]
Ratio(cis/trans)
4.84 4.82 9.66 1.01
5.50 5.41 10.91 1.02
5.78 5.65 11.43 1.02
5.65 5.53 11.18 1.02
Mean 5.44 5.35 10.80 1.02
St. Dev. 0.4 0.3 0.7 0.0
5.07 4.73 9.81 1.07
5.20 5.10 10.30 1.02
4.95 4.93 9.88 1.00
5.06 5.07 10.13 1.00
Mean 5.07 4.96 10.03 1.02
St. Dev. 0.1 0.1 0.2 0.0
5.28 4.96 10.25 1.06
5.29 5.13 10.42 1.03
5.19 5.08 10.26 1.02
5.45 5.33 10.78 1.02
Mean 5.30 5.13 10.43 1.03
St. Dev. 0.1 0.1 0.2 0.0
5.44 5.21 10.66 1.04
5.27 5.12 10.39 1.03
5.25 5.11 10.35 1.03
5.44 5.39 10.83 1.01
Mean 5.35 5.21 10.56 1.03
St. Dev. 0.1 0.1 0.2 0.0
0.18 0.15 0.15 0.70p value by ANOVA(N = 4)
1day
2days
7days
30days

142
Appendix 5
Effect of extraction alcohol strength of wood chip on subsequent extraction of
lactones into ethanol solution
cislactone
[mg/L as is]
translactone
[mg/L as is]
Total(cis+trans)[mg/L as is]
Ratio(cis/trans)
3.11 2.95 6.06 1.06
3.06 3.24 6.30 0.94
3.44 3.33 6.76 1.03
3.80 3.78 7.58 1.00
Mean 3.35 3.33 6.67 1.01
St. Dev. 0.3 0.3 0.6 0.0
4.79 4.52 9.30 1.06
5.15 4.94 10.09 1.04
6.37 6.09 12.45 1.05
5.37 5.24 10.61 1.02
Mean 5.42 5.20 10.62 1.04
St. Dev. 0.6 0.6 1.2 0.0
4.84 4.82 9.66 1.01
5.50 5.41 10.91 1.02
5.78 5.65 11.43 1.02
5.65 5.53 11.18 1.02
Mean 5.44 5.35 10.80 1.02
St. Dev. 0.4 0.3 0.7 0.0
5.75 5.64 11.38 1.02
6.05 5.99 12.04 1.01
5.73 5.65 11.38 1.01
5.64 5.62 11.26 1.00
Mean 5.79 5.72 11.51 1.01
St. Dev. 0.2 0.2 0.3 0.0
<0.01 <0.01 <0.01 0.28p value by ANOVA(N = 4)
20% abv
40% abv
60% abv
80% abv

143
Appendix 6
Chemical analysis result of whisky lactones in young whiskies
Strength[% abv]
cislactone
[mg/L as is]
translactone
[mg/L as is]
Total(cis+trans)[mg/L as is]
Ratio(cis/trans)
56.6 0.60 0.70 1.31 0.86
56.0 0.56 0.97 1.53 0.57
57.4 0.66 1.75 2.40 0.38
58.8 0.72 1.57 2.29 0.46
59.7 0.63 1.01 1.63 0.63
59.8 0.54 0.77 1.31 0.70
59.4 0.68 0.84 1.53 0.81
0.63 1.09 1.71 0.58
St. Dev. 0.06 0.38 0.42 0.16
56.8 0.72 1.20 1.92 0.60
56.3 0.87 1.08 1.94 0.81
57.1 0.73 1.27 2.00 0.58
59.4 0.82 1.50 2.32 0.55
59.1 0.59 0.79 1.38 0.75
59.8 0.87 1.65 2.51 0.53
58.4 0.55 1.28 1.84 0.43
0.74 1.25 1.99 0.59
St. Dev. 0.12 0.26 0.34 0.12
0.31 0.11 0.24 0.44p value by t-test(N = 7)
No treatment
Mean
Mean
Re-charring

144
Appendix 7
Chemical analysis result of aromatics in young whiskies
Strength[% abv]
Vanillic acid[mg/L as is]
Vanillin[mg/L as is]
Syringic acid[mg/L as is]
Syringaldehyde[mg/L as is]
Sinapaldehyde[mg/L as is]
56.6 2.16 3.29 1.83 5.00 0.56
56.0 2.43 3.80 1.80 5.12 0.50
57.4 1.97 3.18 1.88 4.72 0.62
58.8 1.92 2.78 2.04 4.38 0.47
59.7 1.72 2.70 1.47 3.83 0.80
59.8 1.55 2.45 1.49 3.31 0.89
59.4 1.60 2.50 1.38 3.50 0.56
1.91 2.96 1.70 4.27 0.63
St. Dev. 0.29 0.45 0.23 0.67 0.14
56.8 2.73 4.42 2.96 7.52 0.68
56.3 1.93 3.41 2.07 6.06 0.87
57.1 2.13 3.42 2.35 5.65 0.81
59.4 1.80 3.08 2.29 5.56 0.87
59.1 2.48 4.32 2.34 6.43 0.78
59.8 1.97 3.48 2.78 6.69 1.13
58.4 1.99 3.34 2.37 5.90 0.72
2.15 3.64 2.45 6.26 0.84
St. Dev. 0.31 0.48 0.28 0.64 0.14
0.18 0.05 <0.01 <0.01 <0.01p value by t-test(N = 7)
No treatment
Mean
Re-charring
Mean

145
Appendix 8
Sensory results of addition experiment to USA 20yo whisky using coconut
descriptor
Noaddition
cis addition
trans addition
0.3 0.2 0.1
0.2 0.2 0.2
0.8 1.0 0.9
0.5 0.5 0.8
1.0 0.5 0.5
0.0 1.5 1.5
0.4 0.7 0.2
0.5 2.0 1.0
0.0 0.0 1.0
0.3 0.2 0.6
0.0 0.5 0.8
0.5 1.0 2.5
0.6 0.2 1.7
1.0 1.6 1.3
Mean 0.4 0.7 0.9
St. Dev. 0.3 0.6 0.6
0.14 0.02
USA-20yo
p value by t-test(N = 14)

146
Appendix 9
Sensory results of addition experiment to JPN 20yo whisky using coconut
descriptor
Noaddition
cis addition
trans addition
0.4 0.2 0.5
0.8 0.7 1.2
0.9 1.2 0.0
0.5 1.7 1.3
0.0 2.0 2.0
0.5 0.2 0.0
0.5 1.5 1.0
0.0 1.0 1.5
0.4 0.3 0.6
0.0 0.5 0.3
1.0 2.0 2.5
0.7 0.1 2.1
0.7 1.6 1.2
Mean 0.5 1.0 1.1
St. Dev. 0.3 0.7 0.8
0.03 0.02
JPN-20yo
p value by t-test(N = 13)

147
Appendix 10
Intensity of coconut aroma in samples of 20% abv ethanol model solutions
containing each lactone
Noaddition
cislactone
translactone
0.1 0.7 0.1
0.3 0.3 0.2
1.1 1.4 1.1
0.0 1.5 0.0
0.7 1.7 0.5
0.0 3.0 0.0
0.0 0.4 0.0
0.0 2.0 0.0
0.0 1.0 1.5
0.0 1.0 0.0
0.0 0.0 0.0
0.5 1.5 0.5
0.0 3.0 2.0
0.8 1.5 0.6
0.5 0.9 0.5
Mean 0.3 1.3 0.5
St. Dev. 0.4 0.8 0.6
p value by t-test(N = 15)
<0.01 0.29
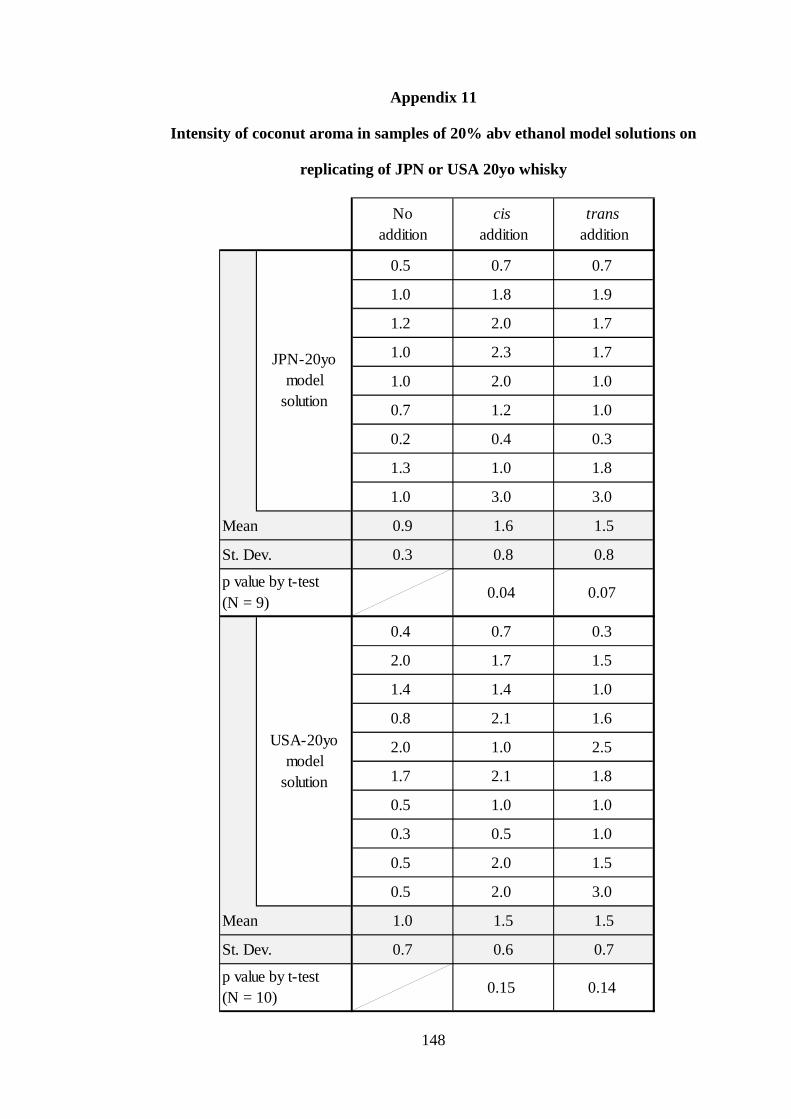
148
Appendix 11
Intensity of coconut aroma in samples of 20% abv ethanol model solutions on
replicating of JPN or USA 20yo whisky
Noaddition
cis addition
trans addition
0.5 0.7 0.7
1.0 1.8 1.9
1.2 2.0 1.7
1.0 2.3 1.7
1.0 2.0 1.0
0.7 1.2 1.0
0.2 0.4 0.3
1.3 1.0 1.8
1.0 3.0 3.0
Mean 0.9 1.6 1.5
St. Dev. 0.3 0.8 0.8
0.04 0.07
0.4 0.7 0.3
2.0 1.7 1.5
1.4 1.4 1.0
0.8 2.1 1.6
2.0 1.0 2.5
1.7 2.1 1.8
0.5 1.0 1.0
0.3 0.5 1.0
0.5 2.0 1.5
0.5 2.0 3.0
Mean 1.0 1.5 1.5
St. Dev. 0.7 0.6 0.7
0.15 0.14
JPN-20yomodel
solution
USA-20yomodel
solution
p value by t-test(N = 9)
p value by t-test(N = 10)

149
Appendix 12
Intensity of coconut aroma in 20% abv ethanol solutions containing various
amounts of either cis or trans-lactone
0.25 0.50 0.75 1.00 0.6 1.1 2.1 2.60.5 1.3 1.0 1.61.1 2.0 1.8 2.30.3 1.0 1.5 2.20.5 0.5 2.0 1.01.5 1.9 2.3 2.61.0 1.5 2.5 2.00.5 1.2 0.7 1.71.0 1.2 1.6 1.70.2 0.5 1.0 1.30.5 1.0 1.5 2.00.2 1.0 2.0 2.5
Mean 0.7 1.2 1.7 2.0St. Dev. 0.4 0.4 0.5 0.5
- <0.01 <0.01 <0.01
0.0 0.0 0.2 0.20.0 0.0 0.0 0.00.5 0.5 0.0 0.50.1 0.1 0.2 0.20.0 0.2 1.2 1.50.5 0.0 0.0 1.00.1 0.2 0.3 0.51.0 1.5 2.0 2.50.0 0.1 0.3 0.40.3 0.5 0.9 1.20.3 0.3 0.5 0.30.1 0.5 1.0 1.5
Mean 0.2 0.3 0.6 0.8St. Dev. 0.3 0.4 0.6 0.7
- 0.58 0.13 0.02p value by t-test(N = 12)
cislactone
translactone
Concentration of lactone [mg/L]
p value by t-test(N = 12)

150
Appendix 13
Intensity of coconut aroma in 20% abv ethanol solutions containing mixture of cis
and trans-lactones
cis 0.00 0.25 0.50 0.75 1.00
trans 1.00 0.75 0.50 0.25 0.00
0 25 50 75 100
0.5 1.5 3.0 2.0 2.0
0.0 1.0 0.9 0.2 0.3
0.8 1.1 2.1 1.8 1.5
1.2 0.8 2.1 2.1 2.0
1.5 1.9 2.5 2.6 2.3
0.5 2.0 2.0 2.0 0.0
0.2 1.4 1.3 1.6 1.9
0.0 0.3 2.1 1.8 1.2
0.0 0.5 1.5 2.0 2.5
0.5 1.7 2.1 2.4 2.5
Mean 0.5 1.2 2.0 1.9 1.6
St. Dev. 0.5 0.5 0.6 0.6 0.8
- 0.01 <0.01 <0.01 <0.01
Lactoneisomer
Percentage of cis-lactone [%]
Concentration of lactone [mg/L]
p value by t-test(N = 10)

151
Appendix 14
Sensory result of 20yo whiskies using three coconut related descriptors
Totalcoconut
Light & freshcoconut
Heavy & oilycoconut
0.1 0.2 0.5
0.8 0.6 0.4
1.3 0.4 0.9
0.5 1.0 0.5
1.0 1.0 0.0
0.0 0.0 0.0
2.5 2.5 2.0
2.1 1.5 0.5
Mean 1.0 0.9 0.6
St. Dev. 0.8 0.8 0.6
0.1 0.2 0.3
1.1 1.0 0.5
0.5 0.0 0.2
0.5 0.5 1.5
0.0 0.0 0.0
0.0 0.0 0.0
0.5 0.5 0.5
0.3 0.3 0.4
Mean 0.4 0.3 0.4
St. Dev. 0.3 0.3 0.4
0.09 0.09 0.54
USA-20yo
JPN-20yo
p value by t-test(N = 9)

152
Appendix 15
Intensity of 20% abv ethanol model solutions including each lactone isomer using
three coconut related descriptors
Totalcoconut
Light & freshcoconut
Heavy & oilycoconut
0.7 0.8 0.30.3 0.5 0.31.4 1.1 1.81.5 0.3 1.51.7 1.7 1.13.0 1.0 2.00.4 0.5 0.12.0 2.0 1.01.0 1.0 0.01.0 0.9 1.60.0 0.1 0.21.5 0.3 1.23.0 1.0 3.01.5 1.0 0.20.9 2.0 1.0
Mean 1.3 0.9 1.0St. Dev. 0.8 0.6 0.8
0.1 0.2 0.10.2 0.2 0.11.1 0.8 0.50.0 0.0 0.00.5 1.0 0.10.0 0.0 0.00.0 0.0 0.00.0 0.5 0.01.5 1.5 0.00.0 0.0 0.00.0 0.0 0.30.5 0.5 0.02.0 2.5 1.50.6 0.8 0.10.5 1.2 1.0
Mean 0.5 0.6 0.2St. Dev. 0.6 0.7 0.4
<0.01 0.17 0.01
cislactone
translactone
p value by t-test(N = 15)

153
Appendix 16
Sensory results of addition experiment to 20yo USA whisky using three coconut
related descriptors
Totalcoconut
Light & freshcoconut
Heavy & oilycoconut
0.2 0.1 0.10.8 0.4 0.80.5 0.3 0.20.5 0.5 1.00.0 0.0 0.00.0 0.0 0.00.5 0.5 0.50.6 0.6 0.4
Mean 0.4 0.3 0.4St. Dev. 0.3 0.2 0.3
0.2 0.1 0.21.0 0.8 1.20.5 0.3 0.22.0 0.5 2.00.0 0.0 0.00.5 0.0 0.51.0 1.0 1.00.2 0.1 0.1
Mean 0.7 0.4 0.7St. Dev. 0.6 0.4 0.7
0.28 0.76 0.35
0.2 0.2 0.20.9 0.6 1.10.8 0.8 0.21.0 1.0 0.01.0 0.5 0.50.8 0.5 0.32.5 1.5 2.51.7 0.9 0.6
Mean 1.1 0.8 0.7St. Dev. 0.6 0.4 0.8
0.02 0.02 0.36
cis addition
Noaddition
trans addition
p value by t-test(N = 8)
p value by t-test(N = 8)

154
Appendix 17
Sensory results of addition experiment to 20yo JPN whisky using three coconut
related
Totalcoconut
Light & freshcoconut
Heavy & oilycoconut
0.4 0.3 0.40.8 1.1 0.60.9 0.9 0.80.5 0.5 0.50.0 0.0 0.00.5 0.5 0.50.5 0.5 0.00.0 0.0 0.00.4 0.3 0.40.0 0.0 0.01.0 1.5 1.00.7 0.5 0.30.7 1.3 0.7
Mean 0.5 0.6 0.4St. Dev. 0.3 0.5 0.3
0.2 0.2 0.20.7 1.1 0.91.2 1.8 0.01.7 0.8 1.82.0 0.0 1.50.2 0.2 0.51.5 0.0 1.51.0 1.0 0.00.3 0.4 0.20.5 0.0 0.52.0 2.0 2.50.1 0.2 0.51.6 0.7 1.2
Mean 1.0 0.6 0.9St. Dev. 0.7 0.6 0.7
0.03 0.74 0.06
0.5 0.5 0.21.2 1.4 0.70.0 0.2 0.01.3 1.5 1.22.0 1.5 0.00.0 0.5 0.51.0 1.5 0.51.5 1.0 0.50.6 0.2 0.50.3 0.3 0.02.5 2.5 1.52.1 1.5 1.01.2 0.8 1.0
Mean 1.1 1.0 0.6St. Dev. 0.8 0.7 0.5
0.02 0.06 0.27
Noaddition
cis addition
trans addition
p value by t-test(N = 13)
p value by t-test(N = 13)

155
Abbreviations
ABS ; Absorbance Q. ; Quercus
abv ; Alcohol by volume R2 ; Correlation Coefficient
amu ; Atomic mass unit SPN ; Spanish oak
ANOVA ; Analysis of variance St. Dev. ; Standard Deviation
cm ; Centimetre SWRI ; Scotch Whisky Research
EXP ; Exponential Institute
FID ; Flame ionization detector UK ; United Kingdom
g ; Gram USA ; American oak
GC ; Gas chromatography UV ; Ultraviolet
GC-MS ; Gas chromatograph mass yo ; Year old
Spectrometer °C ; Degree Celsius
HPLC ; High performance liquid
chromatography
i- ; Iso-
JPN ; Japanese oak
L ; Litre
m ; Metre
mg ; Milligram
min ; Minute
mL ; Millilitre
mm ; Millimetre
n- ; Normal-
N.D. ; Not detected
P ; Probability value

156
References
Aishima, T., Matsushita, K., and Nishikawa, K., (1992) Measurements of brandy ageing
using O-17 NMR and small angle X-ray scattering. In: Élaboration et Connaissance
des Spiritueux: Recherche de la Qualité. Edited by Cantagrel, R., Lavoisier-Tec &
Doc, France, pp. 473-478
Atanasova, B., Thomas-Danguin, T., Chabanet, C., Langlois, D., Nicklaus, S., and
Etiévant, P., (2004) Perceptual Interactions in Odour Mixtures: Odour Quality in
Binary Mixtures of Woody and Fruity Wine Odorants, Chemical Senses, 30, 209-
217
Baldwin, S., Black, R. A., Andreasen, A. A., and Adams, S. L., (1967) Aromatic congener
formation in maturation of alcoholic distillates. Journal of Agricultural and Food
Chemistry, 15, 381-385
Brown, R. C., Sefton, M. A., Taylor, D. K., and Elsey, G. M., (2006) An Odour detection
threshold determination of all four possible stereoisomers of oak lactone in a white
and a red wine. Australian Journal of Grape and Wine Research 12: 115-118
Conner, J., Reid, K., and Jack, F., (2003) Chapter 7 Maturation and blending. In: Whisky
Technology, Production and Marketing. Edited by Russell, I., Bamforth, C., and
Stewart, G. G., Academic Press, UK, pp. 211-242
Conner, J., and Jack, F., (2003) Chapter 11 Maturation. In: Whisky Technology,
Production and Marketing Second edition. Edited by Russell, I., and Stewart, G. G.,
Academic Press, UK, pp. 199-220
DeRosso, M., Panighel, A., Vedova, A.D., Stella, L. and Flamini, R., (2009) Changes in
Chemical Composition of a Red Wine Aged in Acacia, Cherry, Chestnut, Mulberry,
and Oak Wood Barrels Journal of Agricultural and Food Chemistry, 57: 1915-1920

References
157
Díaz-Plaza, E. M., Reyero, J. R., Pardo, F., Alonso, G. L., and Salinas, R., (2002)
Influence of Oak Wood on the Aromatic Composition and Quality of Wines with
Different Tannin Contents. Journal of Agricultural and Food Chemistry 50: 2622-
2626
Fernández de Simón, B., Martínez, J., Sanz, M., Cadahía, E., Esteruelas, E. and Muñoz,
A.M., (2014) Volatile compounds and sensorial characterisation or red wine in
cherry, chestnut, false acacia, ash and oak wood barrels Food Chemistry 147: 346-
356
Fujii, T., Kurokawa, M., and Saita, M., (1992) Studies of volatile compounds in whisky
during aging. In: Élaboration et Connaissance des Spiritueux: Recherche de la
Qualité, Tradition et Innovation. Edited by Catagrel, R., Lavoisier-Tec & Doc, pp.
543-547
Furusawa, T., Saita, M., and Nishi, N., (1990) Analysis of Ethanol-Water Clusters in
Whisky. In: Proceedings of the Third Aviemore Conference on Malting, Brewing
and Distilling. Edited by Campbell, I., Institute of Brewing, pp. 431-438
Guichard, E., Fournier, N., Masson, G., and Puech, J. L., (1995) Stereoisomers of β-
Methyl-γ-Octalactone. I. Quantification in Brandies as a Function of Wood Origin
and Treatment of the Barrels. American Journal of Enology and Viticulture 46(4):
419-423
Hasuo, T. and Yoshizawa, K., (1986) Substance Change and Substance Evaporation
Through the Barrel During Whisky Aging. In: Proceedings of the second Aviemore
Conference on Malting, Brewing and Distilling. Edited by Campbell, I. and Priest,
F. G., Institute of Brewing, pp. 404-408
Katoh, S., (1985) Chapter 1. In: Textbook of Cooperage Technology. Edited by Katoh, S.,
pp. 140-146
Koga, K., (2009) Chapter 9. In: Whisky-no Kagaku. Kodansha, pp. 138-149

References
158
Koppenhoefer, B., Behnisch, R., Epperlein, U., Holzschuh, H., (1994) Enantiomeric Odor
Differences and Gas Chromatographic Properties of Aromas and Fragrances.
Perfumer & Flavorist 19(5): 1-14
Koshimizu, S. (2011) Chapter 2. In: Whisky-ha-Nippon-no-sake-dearu. Shincho Shinsho,
pp. 41-74
Lawless, H. T., Heymann, H., (1998). Chapter 2 Physiological and Psychological
Foundations of Sensory Function. In: Sensory Evaluation of Food: Principles and
Practices. Edited by Lawless, H. T., Heymann, H., Chapman & Hall, USA, pp. 28-
82
Lee, K. Y. M., Paterson, A., Piggott, J. R., (2000) Measurement of Thresholds for
Reference Compounds for Sensory Profiling of Scotch Whisky. Journal of The
Institute of Brewing 106(5): 287-294
Lee, K. Y. M., Paterson, A., Piggott, J. R., (2001) Origins of Aroma in Whiskies and a
Revised Aroma Wheel: Review. Journal of The Institute of Brewing 107(5): 287-
313
Masson, G., Guichard, E., Fournier, N., and Puech, J. -L., (1995) Stereoisomers of β-
Methyl-γ-Octalactone. II. Contents in the Wood of French (Quercus robur and
Quercus petraea) and American (Quercus alba) Oaks. American Journal of Enology
and Viticulture 46(4): 424-428
Masuda, M. and Nishimura, K., (1971) Branched Nonalactones from Some Quercus
Species. Phytochemical Reports 10: 1401-1402
Masuda, M. and Sugibayashi, K., (1980) Whisky-no-Kaori, Nippon Jozo Kyokai Zasshi,
75(6), 480-484
Nabeta, K., Yonekubo, J., Miyake, M., (1986) Analysis of Volatile Constituents of
European and Japanese Oaks. Mokuzai Gakkaishi 32(11): 921-927

References
159
Nishimura, K., Onishi, M., Masuda, M., Koga, K., and Matsuyama, R., (1983) Reactions
of Wood Components During Maturation. In: Aroma of Distilled Beverages: Origin
and Development. Edited by Piggott, J. R., Ellis Horwood Ltd., pp. 225-240
Nishimura, K. and Matsuyama, R., (1989) Maturation and Maturation Chemistry, In: The
Science and Technology of Whiskies. Edited by Piggott, J.R., Sharp, R., and Duncan,
R. E. B., Longman Scientific and Technical, pp. 235-263
Noguchi, Y. (2009) Chapter 2-5. Whisky. In: Shokuhin-to-Jukusei. Edited by Ishitani, T.,
Korin Sensho, pp. 65-72
Noguchi, Y., Hughes, P. S., Priest, F. G, Conner, J. M, and Jack, F. (2008). The influence
of wood species of cask on matured whisky aroma - the identification of a unique
character imparted by casks of Japanese oak. In: Proceedings of the third Worldwide
Distilled Spirits Conference, Edited by Walker, G. M. and Hughes, P. S., Institute of
brewing, London, pp. 243-251
Noguchi, Y., Koike, M., Hughes, P. S., Conner, J. M, and Jack, F. (2011). The Behaviour
of Whisky Lactone Isomers in Japanese Oak Casks. In: Proceedings of the fourth
Worldwide Distilled Spirits Conference, Edited by Walker, G. M., Goodall, I.,
Fotheringham, R., and Murray, D., Institute of brewing, London, pp. 191-197
Otuska, K., Zenibayashi, Y., Itoh, M., and Totsuka, A., (1974) Presence and Significance
of Two Diastereomers of β-Methyl-γ-octalactone in Aged Distilled Liquors.
Agricultural and Biological Chemistory 38(3): 485-490
Perry, D. R., (1986) Whisky Maturation Mechanisms. In: Proceedings of the Second
Aviemore Conference on Malting, Brewing and Distilling. Edited by Campbell, I.
and Priest, F. G., Institute of Brewing, pp. 409-412
Piggott, J. R., Conner, J. M., Paterson, A., and Clyne, J. (1993) Effects on Scotch whisky
composition and aroma of maturation in oak casks with varying histories.
International Journal of Food Science & Technology 28(3): 303–318

References
160
Pollnitz, A. P., Jones, G. P., and Sefton, M. A., (1999) Determination of oak lactones in
barrel-aged wines and in oak extracts by stable isotope dilution analysis. Journal of
Chromatography A 857: 239-246
Reazin, G. H., Baldwin, S., Scales, H. S., Washington, H. W., and Andreasen, A. A.,
(1976) Determination of the congeners produced from ethanol during whisky
maturation. Journal of the Association of Official Analytical Chemists, 59(4), 770-776
Reazin, G. H., (1981) Chemical Mechanisms of Whiskey Maturation. American Journal
of Enology and Viticulture, 32(4), 283-289
Shimatani, Y. and Koshimizu, S. (2013) Chapter 8. In: Nippon Whisky Sekai-ichiheno-
michi. Shueisha Shinsho, pp. 130-152
Simón, B. F., Cadahía, E., and Jalocha, J., (2003) Volatile Compounds in a Spanish Red
Wine Aged in Barrels Made of Spanish, French, and American Oak Wood. Journal
of Agricultural and Food Chemistry 51: 7671-7678
Suomalainen, H. and Nykänen, L., (1970) Investigations on the aroma of alcoholic
beverages. Naeringsmiddel Industrien, 23, 15-30
Waterhouse, A. L. and Towey, J. P., (1994) Oak Lactone Isomer Ratio Distinguishes
between Wines Fermented in American and French Oak Barrels. Journal of
Agricultural and Food Chemistry 42: 1971-1974
British Standard (2003) BS 13299:2003 Sensory Analysis - Methodology - General
Guidance for Establishing A Sensory Profile
European Brewery Convention (2000) Chemical/Physical - Beer - 9.6 Colour of Beer -
Spectrophotometric Method
International Organization for Standardization (2002) ISO 13301 Sensory analysis -
Methodology - General guidance for measuring odour, aroma and taste detection
thresholds by a three-alternative forced-choice (3-AFC) procedure

References
161
Scotch Whisky Regulations (2009) 12. Maturation, age and distillation statements
<http://www.legislation.gov.uk/uksi/2009/2890/regulation/12/made> Accessed
12/09/2016