academic analytics - educause
TRANSCRIPT
Academic Analytics John P. Campbell and Diana G. Oblinger
October 2007

EDUCAUSE is a nonprofit association whose mission is to advance higher education by promoting the intelligent use of information technology. Membership is open to institutions of higher education, corporations serving the higher education information technology market, and other related associations and organizations. Resources include professional development activities; print and electronic publications, including books, monographs, and the magazines EDUCAUSE Quarterly and EDUCAUSE Review; strategic policy advocacy; teaching and learning initiatives; applied research; special interest collaborative communities; awards for leadership and exemplary practices; and extensive online information services. The current membership comprises more than 2,100 colleges, universities, and educational organizations, including 250 corporations, with 16,500 active members. EDUCAUSE has offices in Boulder, Colorado, and Washington, D.C.; www.educause.edu, e-mail [email protected].
© EDUCAUSE 2007 This work is licensed under a Creative Commons Attribution-NonCommercial-NoDerivs 3.0 License.
http://creativecommons.org/licenses/by-nc-nd/3.0/
Academic Analytics John P. Campbell and Diana G. Oblinger
October 2007
Abstract
The importance of student success (commonly measured as degree completion) continues to rise, as does the demand for institutional accountability. Academic analytics can help institutions address student success and accountability while better fulfilling their academic missions. Academic systems generate a wide array of data that can predict retention and graduation. Academic analytics marries that data with statistical techniques and predictive modeling to help faculty and advisors determine which students may face academic difficulty, allowing interventions to help them succeed. This paper highlights what IT and institutional leaders need to understand about academic analytics, including changes it may require in data standards, systems, processes, policies, and institutional culture.

Academic Analytics
This paper explores the application of analytics to one of higher education’s most important challenges: student success. Student success can be defined in many ways—student retention and graduation are among the most common. Approximately 40 percent of students at four-year institutions graduate in four years; only 60 percent graduate by the end of six years. Graduation rates are uneven among ethnic groups: The six-year graduation rate for Asian students is 65 percent, followed by white students at 60 percent. Latino student graduation rates are 47 percent, followed by African Americans at 40 percent and Native Americans at 39 percent.1
Student retention and graduation may be improved through the use of tools such as analytics, which goes beyond descriptive statistics to apply methods including predictive modeling. Already used to create a competitive edge for major corporations, analytics promises new insights and perhaps new breakthroughs in student success.
This paper describes how data from sources such as a course management system (CMS) or a student information systems (SIS) can identify at-risk students through analytics and predictive modeling, alert key stakeholders, and suggest interventions.
The Value of a College Education Education—and higher education in particular—plays an important role in the economic health and competitiveness of individuals and of the nation. Once the world leader in attainment of bachelor’s degrees, the United States in 2003 ranked just ninth, with graduation rates hovering at 45–50 percent, even as graduation rates in other countries continued to rise. If these trends continue, by 2020 the overall portion of the U.S. workforce with a college degree will be lower than it was in 2000.
Educational attainment is strongly correlated with higher income and other economic benefits for individuals; with improved social conditions; and with benefits to colleges and universities.
Individual Benefits Full-time workers with a four-year college degree earn 62 percent more than workers with a high school diploma, which adds up to an $800,000 differential over a 40-year working life. For Hispanic males ages 25–34, the income gap between bachelor’s degree holders and individuals with high school diplomas is 86 percent; for black women, the wage differential is 70 percent.2 College graduates are more likely to receive a variety of employer-sponsored benefits, such as health insurance or pension plans, and they rate themselves as being in better health than those who have not attended college. College graduates are more likely to exercise regularly and to be civically engaged, as measured by voting or volunteering.
Benefits to Society All workers, regardless of educational attainment, earn more in communities where more college graduates are in the labor force. A 1 percent increase in the proportion of the population holding a four-year college degree leads to a 1.9 percent increase
1

Academic Analytics
in the wages of workers without a high school diploma and a 1.6 percent increase for high school graduates.3 The earnings of college graduates generate higher tax payments as well. College graduates working full time paid 134 percent more in federal income taxes and 80 percent more in total federal, state, and local taxes than the typical high school graduate.4
Due in large part to higher rates of employment and better salaries, college graduates are less dependent on public support programs (Medicaid, food stamps, subsidized school lunches) than high school graduates, and the children of parents with higher levels of educational attainment are better prepared for school and are more involved in all types of extracurricular activities.5
Institutional Benefits Retention of students saves institutions the cost of recruiting students to replace those who withdraw without completing a degree. Based on a 2005 study, the average cost for recruiting a student is $74 at a two-year institution, $455 for a four-year public college or university, or $2,073 for a private four-year institution.6 A four-year public institution, for example, with 20,000 students and a 60 percent retention rate for freshmen could save more than $900,000 in recruiting costs if it is able to identify students at risk of withdrawing and intervene appropriately. The loss of students can also result in lost revenues for the institution’s bookstore, food services, and other areas. According to estimates from the University of Alabama, the economic impact to the campus (tuition, books, and food services) for every one hundred students lost is $1 million by their junior year.7
From virtually any perspective, student success is worth working to improve. Analytics provides a new tool with great potential.
A New Approach to Making Decisions Higher education is entering an era of heightened scrutiny as governments, accrediting agencies, students, parents, and donors call for new ways of monitoring and improving student success. As the demand for accountability grows, institutions are being asked to present data that document their accomplishments. Data can also be used to guide internal improvement. This culture of accountability puts new pressures on higher education, but these pressures also create new opportunities for colleges and universities to reexamine the processes and tools they use for decision making.
At its simplest level, decision making can be based on intuition—an individual can draw conclusions based on accumulated experience, without specific data or analysis. In higher education many institutional decisions are too important to be based only on intuition, anecdote, or presumption; critical decisions require facts and the testing of possible solutions. Reports based on data and statistical analysis represent an improvement over intuition. Verification or proving/disproving a hypothesis is a common decision-making strategy, but the approach is limited by the quality of the original hypothesis; the answers to a poor question will not provide much insight. Newer techniques such as data mining use a discovery-based
2

Academic Analytics
approach in which algorithms find patterns in data, identifying trends that might not have surfaced otherwise.
Analytics (sometimes called business intelligence) has emerged as new hardware and software allow businesses to collect and analyze vast amounts of data. Some corporations use analytics to enhance their competitive advantage: Wal-Mart, for example, uses analytics to keep stores stocked with merchandise based on past purchasing trends as well as anticipated demand. Increasingly, decision makers need to identify patterns, interpret trends, and weigh options. The analytics process involves gathering and organizing information (often from different sources and in different forms), analyzing and manipulating data, and using the results to answer questions such as “why,” “what can we do about it,” or “what happens if we do x.” Analytics goes beyond traditional reporting systems by providing decision-support capabilities.
In higher education, admissions was among the first units to apply analytics, using formulas to narrow the pool of applicants based on information from standardized test scores, high school transcripts, and other data sources. Predictive modeling has allowed admissions offices to better anticipate the size and composition of an entering freshman class. Administrative units, such as admissions and fund raising, remain the most common users of analytics in higher education today. Due to concerns about accountability and student success, however, the use of academic analytics will probably grow.
Academic systems such as course management and student response systems generate a wide array of data that may relate to student effort and success (retention and graduation). Academic analytics marries large data sets with statistical techniques and predictive modeling to improve decision making. Current initiatives use such data to predict which students might be in academic difficulty, allowing faculty and advisors to intervene (with instruction tailored to students’ specific learning needs, for example). In this way, academic analytics has the potential to improve teaching, learning, and student success. With its ability to model, predict, and improve decision making, analytics may become a valuable tool in institutional improvement and accountability. IT and institutional leaders need to understand analytics, as well as the changes that might be required in data standards, tools, processes, organizational synergies, policies, and institutional culture.
The Five Steps of Analytics Academic analytics can be thought of as an engine to make decisions or guide actions. That engine consists of five steps: capture, report, predict, act, and refine.
Capture Data is the foundation of all analytics efforts. Academic analytics can be based on data from multiple sources (such as an SIS, a CMS, or financial systems) and in multiple formats (such as spreadsheets, enterprise financial system reports, or paper records). Moreover, data can originate inside or outside the institution. Managing these and other variables in the collection, organization, and rationalization of data
3
Academic Analytics
can be a considerable challenge but is vital because decisions based on data hinge on the quality and integrity of that data.
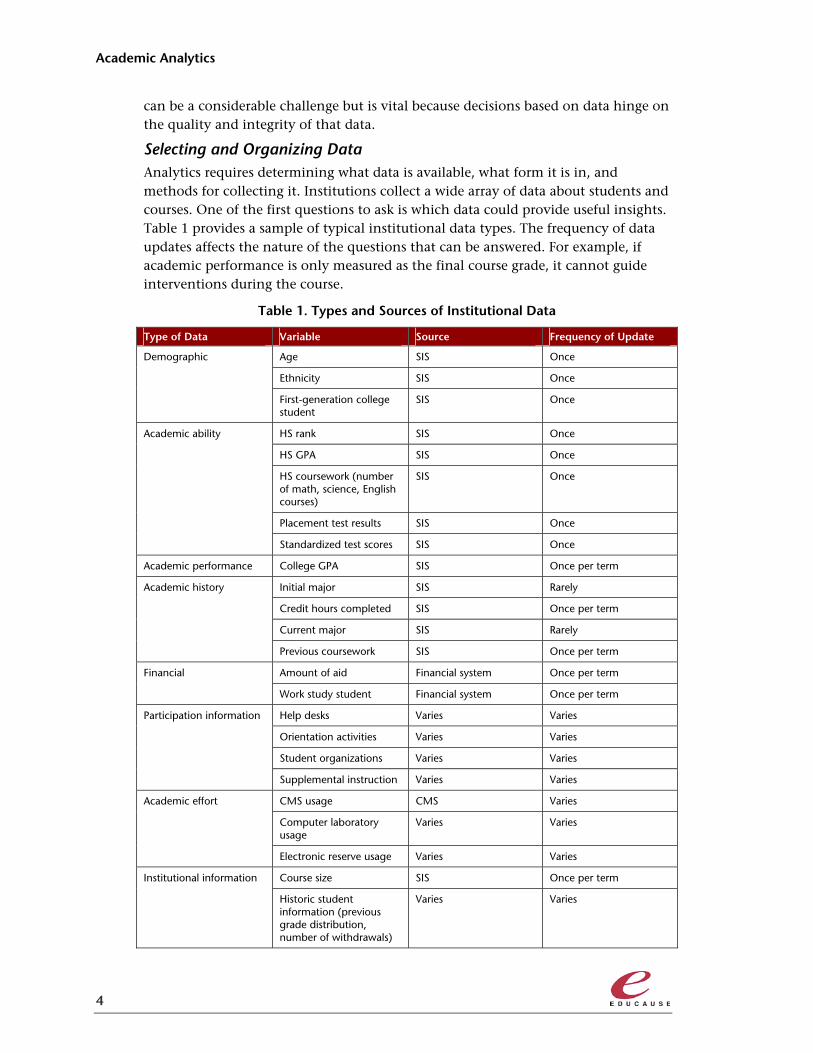
Selecting and Organizing Data Analytics requires determining what data is available, what form it is in, and methods for collecting it. Institutions collect a wide array of data about students and courses. One of the first questions to ask is which data could provide useful insights. Table 1 provides a sample of typical institutional data types. The frequency of data updates affects the nature of the questions that can be answered. For example, if academic performance is only measured as the final course grade, it cannot guide interventions during the course.
Table 1. Types and Sources of Institutional Data
Type of Data Variable Source Frequency of Update
Age SIS Once
Ethnicity SIS Once
Demographic
First-generation college student
SIS Once
HS rank SIS Once
HS GPA SIS Once
HS coursework (number of math, science, English courses)
SIS Once
Placement test results SIS Once
Academic ability
Standardized test scores SIS Once
Academic performance College GPA SIS Once per term
Initial major SIS Rarely
Credit hours completed SIS Once per term
Current major SIS Rarely
Academic history
Previous coursework SIS Once per term
Amount of aid Financial system Once per term Financial
Work study student Financial system Once per term
Help desks Varies Varies
Orientation activities Varies Varies
Student organizations Varies Varies
Participation information
Supplemental instruction Varies Varies
CMS usage CMS Varies
Computer laboratory usage
Varies Varies
Academic effort
Electronic reserve usage Varies Varies
Course size SIS Once per term Institutional information
Historic student information (previous grade distribution, number of withdrawals)
Varies Varies
4

Academic Analytics
Extracted data are migrated to a data warehouse (also called a data repository), which houses data from one or more systems, integrates it, and makes it available for analysis (modeling or data mining). Storing data in a warehouse enables complex queries and analysis without disrupting or slowing production systems. For example, course management data might be extracted nightly and stored in a data warehouse where they are matched and merged with other student data, such as attendance information or clicker data. Integrating and storing data in a single place ensures that various prediction models all use the same data.
Many admissions and retention analytics projects have relied on historical or longitudinal data collected through the admissions process. Emerging analytics projects mine real-time data to provide new insights and enable just-in-time intervention. For example, up-to-the-minute information about student effort can be obtained from a CMS in the form of data about how often a student logs on or how long an online session lasts. Such real-time information might generate more accurate models for student success than relying on high school GPA or precollege test scores. The mining of real-time data raises issues, however, about storage, granularity, and retention.
Storage. As a general rule, real-time data consumes more storage space than static data, such as admissions data. Real-time data measures actual usage of a service. For example, the real-time data within the CMS consists of log files, which record each student login, the amount of time spent on the system, and which files were viewed. Due to the large number of students using these systems, tracking such information from a large institution is likely to produce significantly more data than even the system that records all financial transactions.
Granularity. How much detail is enough? Systems can generate raw data or summarize it. For example, CMS data might be summarized by day or week rather than individual activity. Granularity is a balance between what the system provides, what questions the institution is attempting to answer, and the storage requirements of the data. Some institutions elect to back up all transactional data to tape for potential future use while maintaining key summary data within the data warehouse.
Retention. Since real-time data can include millions of records, the ability to store data for months or years may be problematic. Although retaining data for an extended period may require additional storage capacity, an advantage is that it allows for future revisions and additional testing of the model.
Policy Decisions Analytics projects require institutions to understand and address a number of policy issues about the collection and use of institutional data, including questions about data privacy and stewardship. The data collected and analyzed in an academic analytics project might be protected by federal, state, and institutional privacy regulations. For example, the Family Educational Rights and Privacy Act (FERPA) ensures privacy of student information except in cases of “legitimate educational interests.” Important questions include the following:
5
Academic Analytics
Does the institution need approval before using the data for academic analytics projects?
Who has access to the data during model development and implementation?
Is approval needed from your human subjects committee or institutional review board before using data?
Is personal information identifiable?
Will the information be shared?
The data for any analytics projects may derive from a wide range of sources, and this variation requires institutions to reconcile potentially divergent rules on data stewardship. Are there relevant policies on how data are preserved, secured, and shared? Once a data warehouse has been established, can anyone use it for any purpose? If not, how are decisions made about data usage?
Report Once the data have been extracted and stored in a common location, staff equipped with query, reporting, and analysis tools can perform queries, examine the information, and identify trends, patterns, and exceptions in the data. Descriptive statistics (mean, standard deviation) are often generated. For example, data from the SIS can reveal enrollment trends within a discipline. Correlations might also be run. In analytics projects, traditional reports (tables of data) are increasingly being replaced with “dashboards” that graphically show data in comparison to goals or targets, making the reports easy to scan.
Predict Data that have been collected and warehoused are analyzed using statistics. The rules governing the models can be simple or extremely complex, based on numerous data points and statistical algorithms to generate predictions. For example, a regression model using data from the SIS, the financial system, and class attendance data might predict the student’s likelihood of returning the following year. When data indicate that a student has limited preparation in mathematics and has not attended class for several sessions, a rule might raise a red flag that the student is at risk for failing the course.
Developing a Model The development of predictive models will vary based on the type of data and the nature of the question. Predictive models typically use statistical regression techniques to develop a probability. Each regression technique has its limitations: some are susceptible to missing data, while others require numerical data (versus categorical data). Predictive modeling requires expertise in statistical analysis. Collaboration with the institutional research, statistics, or education departments might be necessary during model development.
Skills Analysis and prediction require collaboration between a number of people. Among the skills your team may find useful are:
6
Academic Analytics
Data analysis. When pulling data from multiple sources, it might be necessary to manipulate files to match data. A data analyst frequently has these skills.
Statistics/educational statistics expertise. While many people have rudimentary statistical knowledge, relying on experts can save time in generating sound statistical models and increase project effectiveness. While most IT units lack the required statistical expertise, the office of institutional research, department of statistics, or college of education might have the necessary skills.
Content expertise. A content expert (in student retention, for instance) can help the statistician develop models based on previous research and understand and interpret the results. Content experts also can help detect miscoded or misinterpreted data.
Reliability of the Model Reliability depends on the type of data, the statistical approach, and the nature of the question. Additional historical data not employed in the model development can be used to test the model and provide a degree of comfort. For example, 60 percent of the data might be used for model development; the other 40 percent are used to test the reliability of the model. Models can be revised based on new data to improve the overall accuracy.
Frequency of Running the Model The number of times an institution will need to run a statistical model depends on the source of the data and the problem being solved. For example, if the model relies on annually updated data, it might only need to be run once a year. A model that depends on the latest course management data might need to be run weekly or even daily. The frequency also depends on the intended action. If the model predicts which students are likely to do poorly in a course, those students might receive a message about attending a help session. In this case, the model clearly should be run prior to the help session, rather than at the end of the semester.
Act The goal of any analytics project is to enable an institution to act based on predictions and probabilities. Actions might range from “information” to “invention.” For example, an analytics project might provide students with information in the form of an educational progress dashboard where they can view their progress toward a degree, comparisons with their peers, and possibly suggestions on how to improve. At the other end of the spectrum, if the model predicts that a student could be at risk of dropping out of school, analytics might trigger an intervention designed to change student behavior and improve learning. That intervention could be an automated, technology-mediated contact or a personal phone call or e-mail from an advisor about study skills and resources, such as help sessions or office hours. Institutions should create mechanisms for measuring impact, such as whether students actually came to office hours when invited.
7

Academic Analytics
Appropriate Interventions When deciding on what interventions to use with students, consider the following:
What does the research say? A research review will help you narrow the potential range of interventions, targeting those that have proven most effective.
What does experience say? For some faculty or student affairs staff, selection of the best interventions may come from a “gut feeling” based on years of working with students.
Determining Number of Interventions The number and type of interventions will largely depend on the project. If the goal is to improve course retention, the interventions might increase in “intensity” as the semester progresses. The initial contact could be in an e-mail informing the student of expectations; future interventions could include required attendance at help sessions.
Measuring Success In order to improve an analytics project, institutions should plan to evaluate the impact of the project on the regular basis. Did the project meet its goals? What measures will demonstrate success to others? Was retention improved? Did student and/or faculty satisfaction increase?
Refine Analytics projects should include a self-improvement process. Monitoring the impact of the project is a continual effort, and statistical models should be updated on a regular basis. For example, admissions analytics projects typically refine the model annually. A pilot project might use the same model for a year or two, but as the project moves into production, more frequent updates should be anticipated. Refinements can involve new data, process improvements, or different actions. Additional data collected from the outcomes can be added as another component of the data warehouse, allowing institutions to update their models and assess how their interventions affect performance.
Understanding the Stakeholders The introduction of analytics as an academic tool will affect many stakeholders on campus, including faculty, students, executive officers, student affairs staff, and information technology staff, each of whom will be listening for different answers when you respond to questions about the potential benefits and drawbacks of academic analytics. Students will be interested in how analytics might impact their grades. Faculty, on the other hand, might be concerned with how the data could be appropriated for other uses. Staff might be looking for an edge in performing their jobs more effectively, while the president might be seeking improvement in graduation rates or freshman retention.
Academic analytics projects clearly have considerable implications for a broad range of campus stakeholders, and these groups should also be seen as sources of expertise
8
Academic Analytics
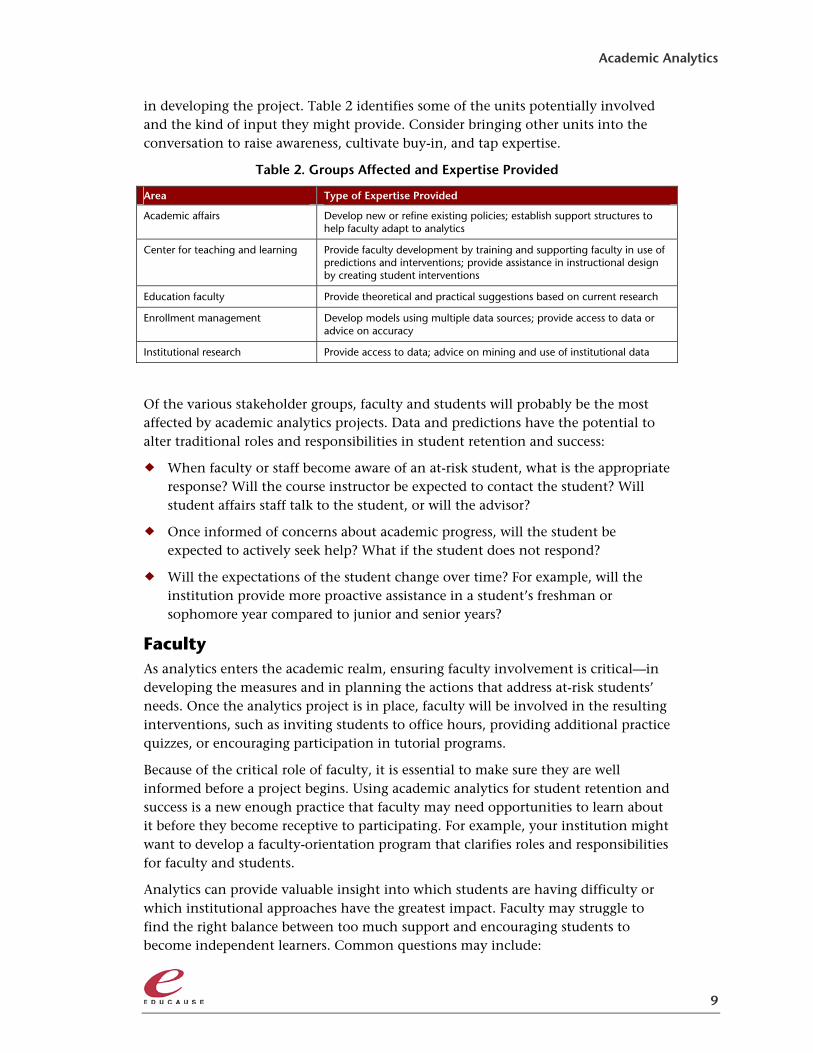
in developing the project. Table 2 identifies some of the units potentially involved and the kind of input they might provide. Consider bringing other units into the conversation to raise awareness, cultivate buy-in, and tap expertise.
Table 2. Groups Affected and Expertise Provided
Area Type of Expertise Provided
Academic affairs Develop new or refine existing policies; establish support structures to help faculty adapt to analytics
Center for teaching and learning Provide faculty development by training and supporting faculty in use of predictions and interventions; provide assistance in instructional design by creating student interventions
Education faculty Provide theoretical and practical suggestions based on current research
Enrollment management Develop models using multiple data sources; provide access to data or advice on accuracy
Institutional research Provide access to data; advice on mining and use of institutional data
Of the various stakeholder groups, faculty and students will probably be the most affected by academic analytics projects. Data and predictions have the potential to alter traditional roles and responsibilities in student retention and success:
When faculty or staff become aware of an at-risk student, what is the appropriate response? Will the course instructor be expected to contact the student? Will student affairs staff talk to the student, or will the advisor?
Once informed of concerns about academic progress, will the student be expected to actively seek help? What if the student does not respond?
Will the expectations of the student change over time? For example, will the institution provide more proactive assistance in a student’s freshman or sophomore year compared to junior and senior years?
Faculty As analytics enters the academic realm, ensuring faculty involvement is critical—in developing the measures and in planning the actions that address at-risk students’ needs. Once the analytics project is in place, faculty will be involved in the resulting interventions, such as inviting students to office hours, providing additional practice quizzes, or encouraging participation in tutorial programs.
Because of the critical role of faculty, it is essential to make sure they are well informed before a project begins. Using academic analytics for student retention and success is a new enough practice that faculty may need opportunities to learn about it before they become receptive to participating. For example, your institution might want to develop a faculty-orientation program that clarifies roles and responsibilities for faculty and students.
Analytics can provide valuable insight into which students are having difficulty or which institutional approaches have the greatest impact. Faculty may struggle to find the right balance between too much support and encouraging students to become independent learners. Common questions may include:
9

Academic Analytics
What are faculty obligations for helping students? Are faculty responsible for contacting at-risk students personally? Should faculty become proactive and intervene at the first signs of difficulty? Should faculty direct efforts toward the low performers within a course or continue to focus on the “average” student? Should faculty respond only to direct requests from students?
Are faculty required to know what resources are available to poor-performing students?
To what extent should faculty continue to reach out to at-risk students who have not responded to previous interventions?
What FERPA issues must faculty keep in mind as they work with students? What, if any, information can be provided to parents, the athletic department, issuers of scholarships, or others?
Are faculty required to produce new materials directed toward poor-performing students?
As you work with faculty, it will be important to illustrate the potential of analytics, as well as acknowledge potential concerns.
Potential of Academic Analytics Student success. Most faculty want students to be successful. Many faculty will
welcome information predicting student performance so they can better target their efforts. If the analytics project improves student success, many faculty will be eager to participate.
Effective practice. Analytics can provide new insights into which teaching techniques are more effective than others. The information allows faculty to adapt their teaching styles to the needs of students.
Scholarship of teaching and learning. Academic analytics might catalyze research on the linkage between effective teaching practices and student learning or student success. Such research would enhance the scholarship of teaching and learning.
Concerns About Academic Analytics Evaluation of teaching effectiveness. While many faculty are interested in
improving student success, that does not equate to wanting the data to be used to evaluate their teaching effectiveness. Teaching success does not always translate into student success.
Additional expectations. Faculty might be concerned that analytics will place additional demands on their time and resources.
Clarifying responsibility. Where does the faculty member’s obligation end and the student’s begin? Some faculty might feel students are ultimately responsible for their education and should monitor their own progress. Others believe faculty share that responsibility.
10

Academic Analytics
Creating independent learners. Ultimately, learners need to develop a degree of independence from—rather than dependence on—the institution and its faculty. Although analytics are designed to help students succeed, institutions must consider how to steer students toward self-sufficiency.
Students Students are at the heart of any academic analytics project, but many are probably unaware that their use of the CMS and other institutional systems is tracked, even though they take for granted that course materials and other services will be available online. As your institution plans an academic analytics project, it will be important to decide whether to let students know that their actions are being tracked and for what purpose:
What policies govern whether the results are shared with the student?
Who makes the determination of what and how information is shared?
What impact does a predicted student success score have on the student’s confidence?
The purpose of identifying at-risk students is to establish interventions that improve the likelihood of their success. But not all the effort is on the part of the institution; students must understand the degree to which they are responsible for their own learning. Consider using orientation programs and publications to clarify the institution’s philosophy on student responsibility. For example, if the role of faculty is to teach students to take ownership of their own learning, make sure this is clearly stated in all communications. Explain to students the resources available if they have academic difficulties and whether it is their responsibility to use them.
As you work with students, it will be important to illustrate the potential of analytics while acknowledging potential concerns.
Potential of Academic Analytics Better information. Some students might welcome predictive information because
it will help them improve their performance. The predictions could provide the needed encouragement for students to be successful in a class.
Awareness of resources. Academic analytics efforts have the potential to highlight campus resources of which students were previously unaware, such as study skills courses or a campus writing center.
Concerns About Academic Analytics Accuracy. Although some students might welcome a prediction of future success
along with steps to improve achievement, others might be concerned they will be judged incorrectly or misunderstood.
Privacy. Who has access to student data? To the predictions of success? Some students will not want information to be shared with faculty, advisors, or parents.
11

Academic Analytics
Executive Officers The president, provost, CFO, CIO, and other executive officers will likely be particularly interested in how analytics impacts the institution’s reputation, resources, and exposure to risks.
Potential of Academic Analytics Improved accountability. Academic analytics projects can help the institution be
perceived as taking accountability seriously.
Effective use of resources. Increasing academic success will result in fewer students retaking courses in which they performed poorly. Fewer repeat students would provide additional open seats in high-demand courses. By identifying students in need of academic assistance, existing retention and student-success projects might be more effective, improving the return on investment.
Enhanced reputation. The proactive nature of academic analytics demonstrates to students, parents, alumni, and legislators the institution’s concern for student success. Such a focus on student success can improve the institution’s reputation.
Concerns About Academic Analytics Privacy. A number of privacy issues will arise. Whether it is concern over “big
brother” watching over students or revealing the teaching effectiveness of faculty, issues of privacy will make initiating an analytics project challenging.
Security. Security breaches have become a way of life. The security and integrity of student records and aggregated information and predictions must be ensured. Access must be limited to those authorized to have access to specific types of data, analyses, and predictions, with distinctions being made between who can view the record and who can alter it.
Return on investment. Both the human and technical infrastructure required for a large-scale analytics project are substantial. The institution must also invest in faculty and staff development, communication programs with students (and possibly parents), and intervention systems. Will the return (improved graduation rates, for example) justify the investment? How long will it take for the investment to “pay” for itself?
Data used against the institution. Any time data are collected there is a chance for it to be used “against” the institution. For example, an institution that engages in academic analytics to improve student success could be required to provide data to legislators interested in documenting that the institution is (or is not) performing as well as another institution in the state. Such comparisons could provide the justification for budget increases; they might also result in reduced funding.
Student Affairs Student affairs staff include admissions, enrollment management, and student life. Historically involved with student success efforts, student affairs staff will probably be most interested in understanding how analytics can augment their current capabilities.
12

Academic Analytics
Potential of Academic Analytics Continuous feedback. Student affairs organizations have been mining data to
improve student success for decades. However, few have had access to real-time data that would allow continuous monitoring and feedback on students. Previous methodologies have sometimes involved additional data provided by faculty, but mining CMS or other data offers new possibilities.
Alignment of needs and resources. Current student affairs models are frequently based on readily available data from the admissions process. The use of real-time data can enhance ongoing efforts in getting the right students to the right resources.
New partnerships. Student affairs will likely welcome assistance from the IT organization. The skills and resources that IT can bring to bear on the problem will enhance ongoing efforts.
Concerns About Academic Analytics Ownership. With years of experience in student success, some student affairs staff
may view others’ involvement as encroaching on their territory.
Resources. While academic analytics provides new insights into which students need additional assistance, the project might also expose the lack of resources necessary to address the problems.
Misclassification. No prediction is perfect. Student affairs staff might be concerned that students misclassified as successful will not receive the assistance they need.
Information Technology The CIO, administrative computing director, academic technology director, and IT staff are responsible for providing an IT infrastructure (physical and human) that meets institutional needs. Analytics offers the potential to make existing systems more valuable (using data from a CMS) and to create new strategic and operational capabilities.
Potential of Academic Analytics Strategic alignment. Academic analytics provides IT units with the opportunity to
align IT services with key institutional goals and challenges.
Data handling. The potential scale of the data sets can be extremely large (gigabytes of data with millions of data points per semester). In many cases, the IT unit owns much of the data, particularly with academic systems. Where IT units are not the owner, IT frequently provides support to the infrastructure that stores the data. IT is uniquely positioned to handle large data sets.
Effective use of resources. Academic analytics has the potential to capitalize on existing systems in new ways. The use of system data for new purposes provides additional return on investment.
13
Academic Analytics
New partnerships. Academic analytics could provide the impetus for new partnerships, such as with students affairs, centers for teaching and learning, or specific departments with expertise in statistics or education.
Concerns About Academic Analytics New systems. A data warehouse might be necessary to house data from different
systems and to reduce the impact of analytics on production systems, such as the CMS. A new system involves cost and additional work.
New expectations. Academic analytics projects can elevate expectations of what the IT unit can provide. The new expectations may—or may not—come with additional resources.
Scalability. The work required to scale data extraction and analysis from a pilot to a full-scale implementation can be challenging.
Skills. An academic analytics project typically requires skills not represented in the organization, such as data warehousing, data extraction, and analysis skills. New staff or training of existing staff might be necessary.
Before You Begin Academic analytics projects offer numerous opportunities to increase student success, but such projects also raise many questions. Before starting work on an academic analytics initiative, colleges and universities should consider the questions below and how they relate to the unique culture of each institution.
Goals and Expectations Whether you use analytics for admission or to improve retention, be clear about what you hope to achieve. What institutional problems can analytics address? Will analytics be used to enhance or replace existing practices? For example, will it enhance an existing early intervention system by providing new data sources? Will it replace an existing system that relies on paperwork with one that mines data from an online system?
Analytics alone will not improve learning or retention. However, it may provide insights into student behavior that can improve decision making or prompt specific actions. As you consider what you hope to achieve, ask:
What is your goal? Increased student success? Increased retention?
What student population are you targeting? Freshmen? All students?
Which stakeholders have similar goals?
Care should be taken in setting expectations for an analytics project. Analytics can allow you to predict an event, but prediction is not synonymous with causality. For example, socioeconomic status may be a predictor of retention but is not necessarily the cause of a student’s dropping out of college.
14
Academic Analytics
Organizational Readiness Cultural differences from one institution to another can have a significant influence on the success of an analytics effort. Understanding those issues and being prepared to address them are important steps in planning such an effort.
Is it clear to others what institutional priority analytics will help you address? Although academic analytics has the potential to provide new insights to institutional challenges, it is essential to take the time to convince others that such a potentially large project will solve critical institutional problems. For example, rather than just requesting funding from the provost to create a data warehouse for analytics, show how analytics can be used to meet institutional goals such as student success or retention. Have informal discussions with key stakeholders on campus to determine their concerns and priorities. Be sure you can clearly identify the problem you are trying to solve with analytics and that it is an institutional priority. Is this analytics project part of making your campus more accountable to stakeholders? Will analytics improve student retention? Will the project improve decision making? Consider your institution’s priorities and help stakeholders make the connection between those priorities and analytics.
Is there sufficient evidence that analytics is the best solution? One should be prepared to demonstrate due diligence—have you done your homework? If you can, develop a list of others who are using academic analytics to address similar problems, particularly among peer institutions. Be prepared to provide information about their experiences and lessons learned. Because analytics is relatively new in higher education, a list of other institutions may be short. Consider providing evidence based on pilot projects, published research, or projects from other campus units. You may be able to extrapolate, for example, that a successful admissions analytics effort could be leveraged for academic issues.
If you know of analytics projects similar to the one you are planning, be prepared to provide evidence of effectiveness, including answers to these questions:
Is there solid proof of the project’s effectiveness (retention improvements or cost reductions)?
How does the campus environment at institutions that have implemented analytics projects compare to yours?
Did the rewards outweigh the risks?
How were the impact and success of other projects evaluated?
What are the other options for doing this? Once you have defined the problem you are trying to solve, you should be prepared to consider other options that might work. For example, is using institutional data good enough, or do you need the modeling and predictive capabilities of analytics? Identifying other options ensures that you and your institution fully evaluate the trade-offs before proceeding with an academic analytics project. As you consider
15

Academic Analytics
other options, be sure to include implementation issues that may make other options more or less attractive.
Will the return justify the investment? All projects require resources, so be prepared to detail the following:
Costs. How much will the project cost in terms of dollars, staff support, faculty time, and so on?
Step-by-step implementation. Can the project be implemented in incremental steps to address resource constraints?
Potential gains. Cost is only one part of the equation. The return on the investment may be well worth a significant cost. Consider looking at cost in relation to potential returns, such as reduced costs of remediation, improved graduation rates, and so on.
Does analytics fit the institutional culture? Whenever a new project is introduced, questions arise about the value of the approach and whether it aligns with the culture of the institution. An institutional culture that is skeptical of quantitative approaches may not be a good fit for an academic analytics project, potentially perceiving the numerical approach as dehumanizing the educational process. Some faculty might be concerned that predictions from an analytics project will be at odds with their own judgment about how individual students are performing and what interventions, if any, are called for. Others will welcome the addition of greater access to data about student learning. Before you begin a project, consider the alignment of the project with the institutional culture.
Why should IT be involved with these institutional priorities? IT can be a catalyst for change. Through the implementation of new software or tools such as an ERP or CMS, IT can effect institutional and process changes. The same might be true for academic analytics. As awareness of the value of the data stored with various computer applications grows, IT leaders will be increasingly important partners with academic and student affairs in responding to internal and external pressures for accountability, especially improved learning outcomes and student success. Academic analytics depends heavily on IT and data stored within its systems. IT can provide assistance with data warehousing, data extraction, statistical analysis, and so on.
How prepared is the IT organization? The skills necessary for end-to-end implementation of an analytics project may not exist within the IT organization. Consider whether you need additional strength in areas such as:
Infrastructure. Academic analytics projects require extracting data from applications and storing it in databases. Developing an infrastructure that can store potentially millions of entries and allow users to extract the necessary elements is essential. Additional infrastructure required may include more effective storage, databases, or data-extraction tools.
16
Academic Analytics
Statistical knowledge. Statistics is at the heart of most analytics projects. Having a general understanding of statistics will be important as models are developed and the results interpreted. While the actual model development may be done by an experienced statistician, statistical knowledge will improve IT’s ability to support the overall effort.
Understanding the issues. IT units might need to expand their understanding of key issues facing the institution. Understanding of the issues surrounding learning outcomes, accountability, student success, and retention might need to be developed. Consider holding seminars or sending staff to relevant conferences and then holding internal discussions on the issues.
Challenges and Risks Questions associated with academic values emerge with analytics projects. Many involve issues of privacy, responsibility, and equity:
Big brother. The possibility that a person or institution can track the actions of an individual with software will cause concern for many in higher education. The notion of a “big brother” watching over your shoulder is counter to many institutional beliefs about freedom and privacy. Are people aware that that such data is being collected? Do their feelings about data collection change when its purpose is to benefit students? What obligation does the institution have to inform faculty and/or students that their actions are being tracked? Does an individual need to provide formal consent before data can be collected and/or analyzed? Does an individual have the option to opt out of an analytics project?
Possibility of error. Although analytics produces a prediction based on available data, no prediction is perfect. No model can take into account all the possible causes of success or lack of success (problems at home, financial difficulty, and so on). After all, models predict the outcomes; they may not indicate direct cause and effect. What are the ramifications of making an error?
Obligation to act. If the analytics model provides a probability of student success, what is the obligation of faculty, students, and institutions to act on that information? With whom does the obligation to act lie? How is the responsibility shared among different groups?
Distribution of resources. With quantifiable prediction models, distribution of resources to those who most need assistance may emerge as an issue. What amount of resources should the institution invest on students who are unlikely to succeed in a course? Will access to supplementary services be limited to those with the greatest need, or will any who have interest be able to receive help? Who receives priority if resources are limited?
Profiling. One potential use of analytics is to create a profile of successful, or unsuccessful, students. The profile may prompt interventions or be used to predict student success. Does the profile bias people’s expectations and behaviors? Should the institution even create profiles that lead to generalizations about students? Are there uses of profiles that should be prohibited?
17
Academic Analytics
Resources The resources below can be valuable tools, both for understanding the context and rationale for academic analytics projects and for developing and implementing such projects on campus.
Articles Albrecht, Robert, and Judith A. Pirani. University of Phoenix: Driving Decisions
Through Academic Analytics, Case Study 9, 2005, http://www.educause.edu/ir/library/pdf/ecar_so/ers/ers0508/cs/ECS0509.pdf: This ECAR case study examines the challenges faced by the University of Phoenix’s central and campus organizations in developing a data-driven decision-making environment through academic analytics, including some of the issues involved in moving from data collection to data use.
Campbell, John P., Peter B. DeBlois, and Diana G. Oblinger. “Academic Analytics: A New Tool for a New Era.” EDUCAUSE Review, vol. 42, no. 4 (July/August 2007), http://www.educause.edu/apps/er/erm07/erm0742.asp: This article looks at how academic analytics can help answer the growing calls for accountability in the areas of higher education learning outcomes and student success, offering examples from a variety of institutions.
Carey, Kevin. A Matter of Degrees: Improving Graduation Rates in Four-Year Colleges and Universities. Washington, DC: The Education Trust, 2004, http://www2.edtrust.org/NR/rdonlyres/11B4283F-104E-4511-B0CA-1D3023231157/0/highered.pdf: This report analyzes six-year graduation rates from every degree-granting higher education institution in the United States.
“Data Mining for Academic Success.” Campus Technology, May 21, 2006, http://www.campustechnology.com/articles/40895/: This article highlights Purdue’s use of data from the course management and student information systems to develop predictive models that can support student retention strategies.
Goldstein, Philip, and Richard N. Katz. Academic Analytics: The Uses of Management Information and Technology in Higher Education. Boulder, CO: EDUCAUSE Center for Applied Research, Research Study Vol. 8, 2005, http://www.educause.edu/ers0508/: This ECAR research study analyzes the outcomes of academics analytics use at more than 380 higher education institutions, including what was accomplished, how the collected data were used, whether more resources are being invested in analytics tools, and the degree to which information and analysis are supporting institutional decision making.
Gore, Paul A. “Predicting the Performance and Persistence of First-Year College Students: The Role of Non-Cognitive Variables,” http://sc.edu/fye/events/presentation/2006annual/presentations/P-93.pdf: This article presents the results of a study that investigated the role of psychosocial and cognitive variables in predicting college student performance and persistence in a sample of students enrolled in a first-year experience course.
18

Academic Analytics
Horn, Laura, and Rachel Berger. College Persistence on the Rise? Changes in 5-Year Degree Completion and Postsecondary Persistence Rates Between 1994 and 2000. NCES, November 2005, http://nces.ed.gov/pubsearch/pubsinfo.asp?pubid=2005156: This Institute of Education Sciences report examines the variance over a six-year period in the numbers of students either graduating or remaining enrolled after five years, as well as the possible contributing factors.
Lotkowski, Veronica A., Steven B. Robbins, and Richard J. Noeth. The Role of Academic and Non-Academic Factors in Improving College Retention. ACT, 2004, http://www.act.org/path/policy/pdf/college_retention.pdf: In this policy report, ACT presents key factors related to student retention extracted from the current literature.
Muraskin, Lana, and John Lee, with Abigail Wilner and Watson Scott Swail. Raising the Graduation Rates of Low-Income College Students, http://www.luminafoundation.org/publications/PellDec2004.pdf: This Lumina Foundation report discusses specific, concrete steps that colleges and universities have taken to improve the success rates of their low-income students.
Wells, Dave. “Institutional Intelligence: Applying Business Intelligence Principles to Higher Education.” Campus Technology, April 11, 2007, http://campustechnology.com/articles/46689/: This article argues that higher education is late to embrace data warehousing and business intelligence.
Web Sites The Integrated Postsecondary Education Data System (IPEDS),
http://nces.ed.gov/ipeds/: IPEDS, part of the National Center for Education Statistics, collects data in a variety of areas, including enrollments, program completions, and graduation rates, from all primary providers of postsecondary education in the United States. This site offers students, researchers, and others access to the data.
The National Academic Advising Association, Student Retention/Attrition Resources, http://www.nacada.ksu.edu/Clearinghouse/AdvisingIssues/retain.htm: This NACADA Web site provides an extensive list of retention resource links.
“What Works in Student Retention?” http://www.act.org/path/policy/reports/retain.html: This ACT site provides a wealth of general information related to student retention.
Presentations “Academic Analytics: Using the CMS as an Early Warning System,”
http://www.alt.usg.edu/publications/impact2006/ campbellfinnegancollinsgage_impact06.ppt: This set of panel-discussion slides highlights three uses of CMS-based academic analytics for student retention and success.
19
Academic Analytics
20
“The Grand Challenge: Using Analytics to Predict Student Success,” http://connect.educause.edu/library/abstract/TheGrandChallengeUsi/39281: This 2007 EDUCAUSE Learning Initiative Annual Meeting presentation presents an analysis of CMS data collected from more than 30,000 students and explains how analytics can enable predictive decisions about student success and inform early intervention efforts.
“Predicting and Encouraging Student Persistence and Achievement Online: Best Practices,” http://www.alt.usg.edu/publications/lmorris_edmedia2005.ppt: This presentation looks at the University System of Georgia’s use of CMS data from online courses to predict student retention; track student persistence, achievement, and satisfaction; and look at faculty perspectives and activities.
Endnotes 1. Kevin Carey. A Matter of Degrees: Improving Graduation Rates in Four-Year Colleges and Universities.
Washington, DC: The Education Trust, 2004, http://www2.edtrust.org/NR/rdonlyres/11B4283F-104E-4511-B0CA-1D3023231157/0/highered.pdf.
2. Sandy Baum and Jennifer Ma, Education Pays: The Benefits of Higher Education for Individuals and Society (Washington, DC: CollegeBoard, 2007), http://www.collegeboard.com/prod_downloads/about/news_info/cbsenior/yr2007/ed-pays-2007.pdf (accessed September 21, 2007), pp. 10, 12.
3. Ibid., p. 17.
4. Ibid., p. 9.
5. Ibid., p. 24.
6. Cost of Recruiting Report (Iowa City, IA: Noel-Levitz), http://www.noellevitz.com/NR/rdonlyres/B3EB8C48-8886-4457-9B9E-514E30B88A3E/0/CostofRecruitingReport.pdf (accessed September 25, 2007), p. 2.
7. Mike Hardin, personal communication (phone), October 26, 2006.