abstract - atrfatrf.info/papers/2016/files/atrf2016_full_papers_resub… · web viewa total of...
TRANSCRIPT
Australasian Transport Research Forum 2016 Proceedings16-18 November 2016, Melbourne, Australia
Publication website: http://www.atrf.info/papers/index.aspx
Cognitive Mapping of Transfer: A New Approach to Understand Transfer Behaviour
Jason Chin Shin Chia1, Dr Jinwoo (Brian) Lee2 and Dr Jung Hoon Han3
1 PhD Candidate, Civil Engineering and Built Environment School, Science and Engineering Faculty, Queensland University of Technology (QUT), Brisbane, Australia
2 Senior Lecturer, Civil Engineering and Built Environment School, Science and Engineering Faculty, Queensland University of Technology (QUT), Brisbane, Australia
3 Senior Lecturer, City Planning, Faculty of the Built Environment, University of New South Wales (UNSW), Sydney, Australia
Email for correspondence: [email protected]
AbstractTransfer is a fundamental component of transit journey that expands the spatial coverage of transit service to satisfy increasingly diversifying travel needs. Despite the benefits that transfers can offer, transferring a transit service or mode is generally perceived as a burden to the whole transit journey experience. The conventional approach of reflecting the inconvenience of transfer has been through integrating the additional time and cost incurred during transfer, or transfer penalty that encapsulates subjective and physiological factors in the mode choice model in the form of generalised transfer costs.
This study builds upon the hypothesis that transit users will have a preference for the direction of travel towards their transfer point. A total of 11,409 single-transfer bus journeys were derived from Brisbane’s go card dataset. Each journey’s origin, transfer, and destination points were projected to a standardised two-dimensional Euclidean space by applying translation, rotation and compression/dilation transformation. As next, the grid-based hierarchical clustering was used to divide the Euclidean space into 150 cells to quantify the “preference” for transfer direction and position based on the number of transfer points in each cell. Majority of bus journeys conducted have made a transfer either near the origin or destination. Less number of transit journeys are realised if one is required to make a transfer that is deviated far from the straight line connecting the origin and destination. The straight line between origin and destination could be considered as the private vehicle path perceived by travellers. The deviation from the straight line may imply the impedance of transfer, which is likely to reduce the attractiveness of transit option. Findings from this study present a new approach to explain the transfer and associated travel behaviours.
1

ATRF 2016 Proceedings
1.0 IntroductionProviding seamless connection between origins and destinations has always been a long-standing goal of transit agencies, in order to compete with the door-to-door connectivity that private vehicle offers. Conventional radial transit orientation focuses on providing direct connections to bring commuters from the suburbs to the central business district (CBD). Due to continual dispersion of cities to surrounding suburbs, public transit agencies are unable to provide direct connections for all origin-destination pairs. The extra effort in making transfers has deemed to be necessary (Ceder et al., 2013). By incorporating transfers, transit system could expand service coverage and provide private vehicle competitive citywide access (Currie and Loader, 2010). Ironically, the extra effort required in making transfers has been recognised by travellers as an impeding factor that disrupts the transit travel experience and deters the usage of public transit (Guo and Wilson, 2011; Hadas and Ranjitkar, 2012).
Existing studies study the impact of transfer in terms of additional time and cost incurred during transfer including: walking time, waiting time, extra in-vehicle time and transfer cost (Sharaby and Shiftan, 2012; Wardman et al., 2001). Another type of transfer penalty encapsulates subjective and physiological factors based on preferences, attitudes, and perceptions of transit users (Guo and Ferreira, 2008; Liu et al., 1997). Different factors have been identified in the literature as those that will increase transit user’s perceived waiting and walking time during transfer such as service unreliability (Chowdhury and Ceder, 2013; Chowdhury et al., 2014; Currie and Loader, 2010; Hadas and Ceder, 2010; Iseki and Taylor, 2009), delayed service performance (Ceder et al., 2013; Mishalani et al., 2006), inadequate information at transfer facilities (Hadas and Ceder, 2010; Iseki and Taylor, 2009), poor walking environments (Guo and Wilson, 2004), lack of amenities at transfer facilities (Iseki and Taylor, 2009), types of transfer (Hadas and Ceder, 2010; Hadas and Ranjitkar, 2012) and unsafe environments at transfer stations (Loukaitou-Sideris et al., 2001). Perceived environment of transit therefore significantly affects the utility of public transport and mode choices.
This study builds on the hypothesis that transit users have a preference for the direction of travel towards transfer points and this will influence the travel mode choice. The attractiveness of public transit will decrease when one has to make a transfer that involves a significant deviation from the direction to the destination. The deviation may imply intrinsic factors that account for subjective and physiological impedance imposed by the transfer. The impact of transfer location will be even more significant in a radial transit system, where transit users travelling from an outer suburb to another require a transfer in the CBD to access connecting transit lines or alternative modes. Despite an extensive range of research on transfer, the current literature has neglected the potential implication of travel direction towards transfer points in one’s decision making process.
This study develops a cognitive transfer map of travellers by projecting the actual transit journey (i.e., journey origin, destination, and transfer point) into two-dimensional Euclidean space to better understand transfer behaviours of transit users, using smart card data of South East Queensland, Australia. The “preference” for transfer point location is quantified and ranked through grid-based hierarchical clustering.
2

Cognitive Mapping of Transfer: A New Approach to Understand Transfer Behaviour
2.0 Literature ReviewUrban decentralisation accelerates the diversification of travel demand, where public transit has no capacity to quickly cope with new trends as compared to private vehicles. In the past, the transit network was designed to mainly satisfy commuting trips from the suburbs to the CBD. Most major cities in the world have experienced significant growth and decentralisation of urban settlements into less-dense outer CBD areas over the last few decades. This has created a simultaneous need for transit systems to serve not only the traditional commuting trips to central city jobs from outlying suburbs, but commuting trips to suburban jobs from the central city and intra-suburb trips for various activities (Brown and Thompson, 2008). Pickrell (1985) argues that the failure to adapt transit service policies to changing travel patterns is a major source of the decline in transit demand. Empirical evidence also suggest that the attainment of a high level of transit ridership is most likely achievable when transit networks are designed to serve multiple passenger cohorts and diverse travel demand patterns (Thompson, 1977; Thompson and Matoff, 2003).
Transfer is a fundamental component of transit journeys that allows passengers to switch to different routes or modes to reach their destination. Efficient transfers provided at strategic locations improve transit connectivity and expand spatial coverage of transit systems (Luk and Olszewski, 2003). Despite the benefits that transfers can offer, transfers are often seen as a necessary burden in using public transit (Guo and Wilson, 2011). Inconvenient transfers would deter the use of public transit for potential transit users and reduce the satisfaction level of existing transit users, which ultimately leads to reduction in transit ridership.
The conventional way of quantifying the inconvenience of transfer has been through generalised cost, including monetary costs, time, effort, discomfort and inconvenience involved in transferring (Iseki and Taylor, 2009; Kittelson & Associates Inc. et al., 2003). Transfer penalty can be measured as an equivalence of travel time or money saving, which is done by taking the ratio between the coefficients of transfer variables and time or cost variables. This ratio shows how much further people are willing to travel (time without transfer) or how much they are willing to pay (cost), to save one transfer, demonstrating the time and money that must be saved in order to justify one transfer (Guo and Ferreira, 2008).
Out-of-vehicle times are shown to be perceived as more onerous than in-vehicle travel time by transit users when making transfers (Ceder et al., 2013). In practice, the general rule of thumb is that walking and waiting time are valued twice as much as in-vehicle time (Iseki and Taylor, 2009; Wardman et al., 2001). A study conducted by Wardman et al. (2001) suggests that bus users value the wait time about 1.2 times higher than the in-vehicle travel time and the walk time 1.6 times higher than the value of in-vehicle travel time. Generally, transfer waiting time is also valued higher than transfer walking time (Iseki and Taylor, 2009; Vande Walle and Steenberghen, 2006).
Operational factors such as the service reliability, headways regularity, on-time performance of service and the availability of adequate information affect the level of transfer penalty (Iseki and Taylor, 2009). Providing a guaranteed connection could significantly reduce transfer penalty and similarly, providing a through ticket for transfer could reduce transfer penalty (Wardman et al., 2001). An empirical study conducted in Haifa, Israel demonstrated that waiving a transfer fee resulted in a significant increase in the transit ridership (Sharaby and Shiftan, 2012). Another study conducted in metropolitan Los Angeles showed that user satisfaction with a transfer facility has little to do with the physical characteristics of the facility, but service frequency and reliability are more important factors for user satisfaction (Iseki and Taylor, 2010). Service frequency, schedule adherence and schedule information will affect both actual and perceived waiting time during transfers (Ceder et al., 2013; Iseki and Taylor, 2009; Mishalani et al., 2006). A study by Currie and Loader (2010) found that the
3
ATRF 2016 Proceedings
volume of transfers could significantly increase along a major transit route when the service headway is 10 minutes or shorter (Currie and Loader, 2010).
Physical environmental factors such as physical attributes of stops and stations could potentially affect the quality of transfer services. Guo and Wilson (2004) reported that transit users are more likely to transfer if escalators are available at transfer stations to assist with changing of levels. The provision of amenities, such as benches, shades, water fountains and rest rooms would increase the comfort and convenience of transit users while waiting and transferring (Iseki and Taylor, 2009). Security and safety, such as security staff and actual crime rates of transit facilities would influence the perception of waiting and walking for transfer (Loukaitou-Sideris et al., 2001). A case study of the London Underground found that worst transfer locations were stations with the largest and most complex transfer environments, and best transfer locations perceived were those stations with simple transfer environments and heavy use (Guo and Wilson, 2011).
In the case of whether to take a transfer or walk a longer distance to a destination, Guo and Wilson (2004) discovered that the demand of transfer increases if walking environments are improved. If wider sidewalks exist along the non-transfer path, transit riders are less likely to use a transfer service. To calculate the public transit connectivity index, Hadas and Ranjitkar (2012) took into consideration the type of transfer to classify them into four categories, namely: street crossing transfer, sidewalk transfer, non-walk transfer and one-leg trip (direct non-transfer path), and gave a different weighting vector for each type of transfer at [4,2,1,0] with the street crossing transfer to be perceived as the most burdensome.
The literature captures various factors that influence the quality of transfers. Much effort has been devoted to study the perceived costs of walking and waiting time during transfers. The impact of transfers has been formulated mostly in the form of additional cost. What is lacking is that instead of quantifying the inconvenience of transfer in scalar form, transit users could also consider the travel direction towards their transfer points.
3.0 Study ContextBrisbane is the capital of Queensland with a population of 2.3 million (Queensland Government, 2012). Queensland Department of Transport and Main Roads’ TransLink Division is responsible for leading and shaping Queensland’s overall passenger transit system. TransLink provides mass transit including buses, trains, ferries and trams across South East Queensland. The recent report by Queensland Government (2016) revealed that from January to March 2016, 27.38 million trips were conducted by bus, followed by 12.21 million trips by train, 1.71 million trips by ferry and 1.93 million trips by tram. Bus ridership consisted of more than 63% of total transit ridership. This shows that bus is the dominant transit mode in Brisbane. Brisbane’s public transit network can be characterised as a strong radial network orientation with more than 66% of the bus services operating to the CBD (Devney, 2014). The CBD is the central hub for the bus system, where three grade-separated bus only corridors (busways) provide high-speed, high-capacity services to regional centres.
This study relies on Brisbane smart card data to develop the cognitive transfer map of bus users in the study area. The data encapsulates the entire Brisbane City Council area. In the Australian Statistical Geography Standard, it is equivalent to the total area of Brisbane East, North, South, West and Inner City in the Statistical Area Level 4. The go card is an electronic ticket for use on transit services throughout the network and records travel data when a traveller touches on at the start of any trip stage, and touches off at the end of the trip stage. This dataset contains information such as go card ID, date of service, route ID, service ID, direction (inbound or outbound), boarding time and alighting time, boarding stop ID and
4

Cognitive Mapping of Transfer: A New Approach to Understand Transfer Behaviour
alighting stop ID, ticket type, journey ID and trip ID. If it is a transfer journey, it would have consecutive trip ID for each trip stage with the identical journey ID. According to TransLink, a journey is defined as the set of trip stage taken under one fare basis, while trip as a ride on a single transit vehicle. This study adopts the same convention for the terms “journey” and “trip”.
4.0 Mapping Cognitive Transfer Locations
4.1 Processing for Single-transfer Bus Journeys
In order to develop a cognitive transfer map, the first step taken was to reconstruct travel itineraries by combining related transactions for each smart card holder to form complete journeys from origins to destinations, including transfers. A single day go-card data was used for the mapping. The data processing to construct single-transfer journey is shown in Figure 1.
Figure 1: Single-transfer journey construction process
The process starts with filtering out noise data such as incomplete data of origin or destination information. A threshold of 60-minute time gap is applied to identify whether two trips are connected as a transfer journey. If one stays at a place for more than 60 minutes before making the next trip, it will be counted as a separate trip, rather than a continuous journey through a transfer. The next process is to differentiate return trips from single-transfer journeys. Studies have shown that one is willing to walk in average 400 or 500m to bus stops (Chia et al., 2016; Horner and Murray, 2004; O'Sullivan and Morrall, 1996; Weinstein Agrawal et al., 2008). A maximum distance threshold of 1km from origin and destination is used to distinguish single-transfer journeys from return trips. This study is only interested in single-transfer journeys, so if any journey that has more than one transfer, the whole journey will be removed from the dataset. After the reconstruction process, a total of 11,409 journeys are identified which account for 22,818 trips.
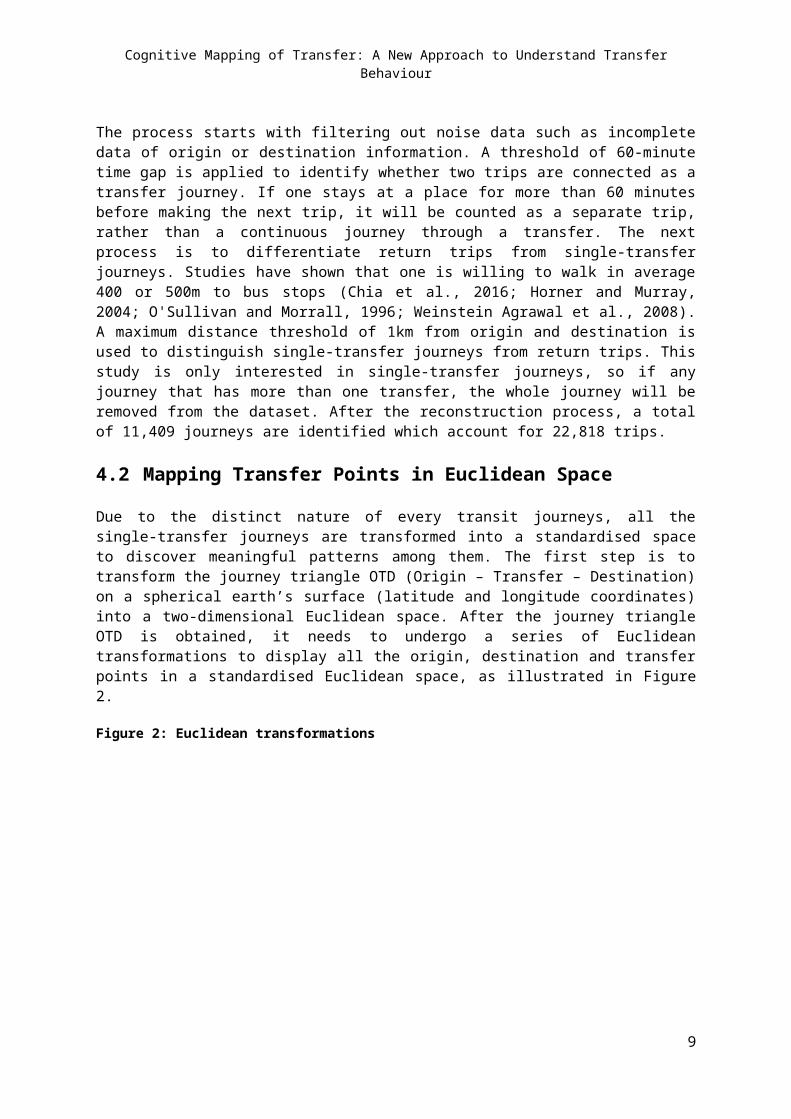
4.2 Mapping Transfer Points in Euclidean Space
Due to the distinct nature of every transit journeys, all the single-transfer journeys are transformed into a standardised space to discover meaningful patterns among them. The first step is to transform the journey triangle OTD (Origin – Transfer – Destination) on a
5

ATRF 2016 Proceedings
spherical earth’s surface (latitude and longitude coordinates) into a two-dimensional Euclidean space. After the journey triangle OTD is obtained, it needs to undergo a series of Euclidean transformations to display all the origin, destination and transfer points in a standardised Euclidean space, as illustrated in Figure 2.
Figure 2: Euclidean transformations
The first step of Euclidean transformation is translation. Translation relocates the journey triangle OTD to set the triangle’s origin point, O, at (0, 0). This transformation preserves the congruence and distance of the journey triangle OTD. Applying the translation process to the single-transfer journeys results in that all the journey triangles to originate from the same point at (0, 0). The notation for translation (T h ,k) is shown in Equation 1. The origin and destination points will undergo the same transformation.
T h ,k (T ' x ,T ' y )=(T x+h ,T y+k )Equation 1
where:T h ,k = The notation for translationT x = The original x coordinates for the transfer pointT y = The original y coordinates for the transfer pointT ' x = The new x coordinates for the transfer point after translationT ' y = The new y coordinates for the transfer point after translation
Preserving the congruence and distance, the journey triangle OTD is rotated at O (0, 0) until the triangle plane, OD, rests on the x-axis. This transformation rotates all the journey
6

Cognitive Mapping of Transfer: A New Approach to Understand Transfer Behaviour
triangles to lay along the x-axis for the destination point, D, to have the coordinate of (x, 0). The notation for rotation is shown in Equation 2.
[T ' ' xT ' ' y]=[cosθ −sin θsinθ cosθ ][T ' xT ' y] Equation
2
where:θ = The angle of rotation at new origin point (0,0)T ' ' x = The new x coordinates for the transfer point after rotationT ' ' y = The new y coordinates for the transfer point after rotation
At this stage, all journey triangles OTD lay on the same plane (x-axis). The next step of the transformation is to loosen up the restriction to consider bijection which preserve the shape and angles of the triangle, but not distance. Next step is to transform all journey triangles to have the same OD unit distance, as shown in Figure 2. The notation for compression and dilation (CDk) is shown in Equation 3.
CDk (T ' ' ' x , T ' ' ' y )=(kT ' ' x , kT ' ' y )Equation 3
where:CDk = The notation for compression / dilationT ' ' ' x = The new x coordinates for the transfer point after compression / dilationT ' ' ' y = The new y coordinates for the transfer point after compression / dilation
illustrates the transfer points of the single-transfer bus journeys, transformed to the scale of OD distance for both x and y axis. This study assumes this plot to represent the cognitive “preference” for transfer location of the travellers in the study area.
Figure 3: Cognitive transfer locations in Euclidean space
7

ATRF 2016 Proceedings
4.3 Grid-based Hierarchical Clustering
The cognitive transfer map displays the actual transfer points transformed in two-dimensional Euclidean space. To identify interesting patterns from the scattered points, this study uses the grid-based hierarchical clustering method, which combines the grid-based clustering and hierarchical clustering methods. Cluster analysis is a data reduction tool that partitions a sample dataset into clusters, where objects within a specific cluster share many characteristics, but are very dissimilar to objects not belonging to that cluster (Sarstedt and Mooi, 2011).
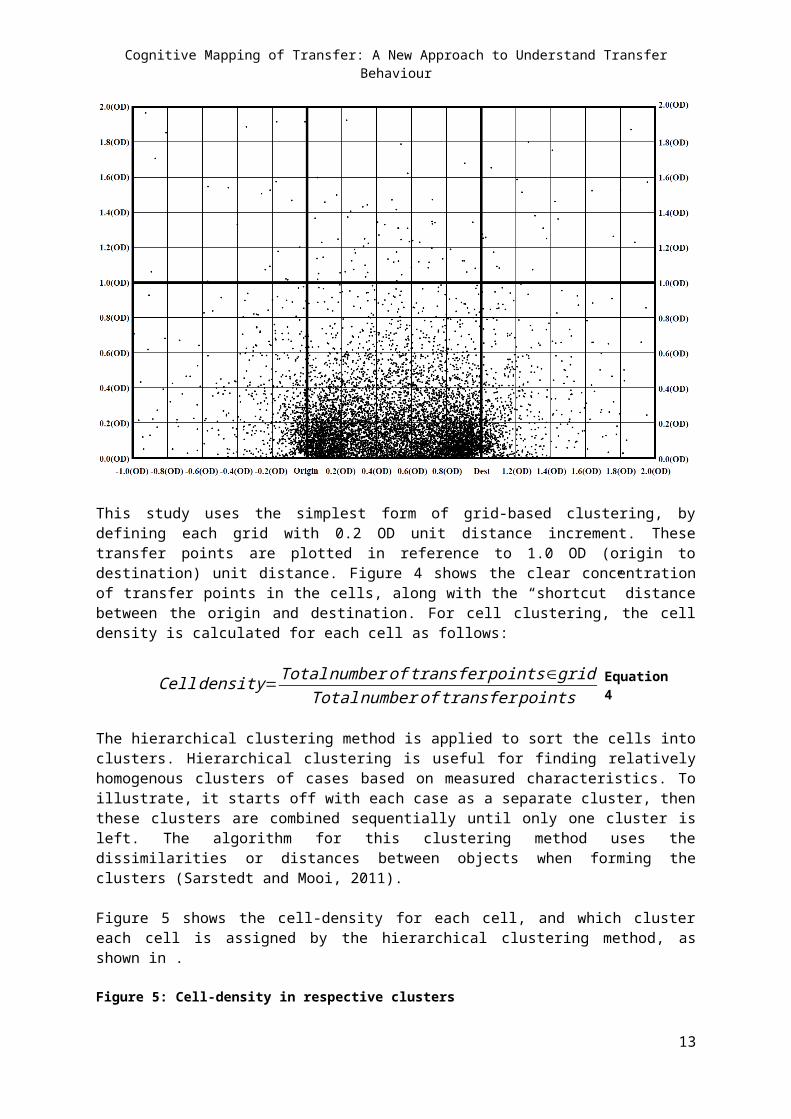
The grid-based clustering (also known as density-based clustering) is one of the most efficient approaches for mining large data sets. This method adopts algorithms that partition the data space into a finite number of cells to form a grid structure (Cheng et al., 2013) as shown in Figure 4.
Figure 4: Grid structure on cognitive transfer locations map
8
Cognitive Mapping of Transfer: A New Approach to Understand Transfer Behaviour
This study uses the simplest form of grid-based clustering, by defining each grid with 0.2 OD unit distance increment. These transfer points are plotted in reference to 1.0 OD (origin to destination) unit distance. Figure 4 shows the clear concentration of transfer points in the cells, along with the “shortcut” distance between the origin and destination. For cell clustering, the cell density is calculated for each cell as follows:
Cell density=Totalnumber of transfer points∈grid xTotalnumber of transfer points
Equation 4
The hierarchical clustering method is applied to sort the cells into clusters. Hierarchical clustering is useful for finding relatively homogenous clusters of cases based on measured characteristics. To illustrate, it starts off with each case as a separate cluster, then these clusters are combined sequentially until only one cluster is left. The algorithm for this clustering method uses the dissimilarities or distances between objects when forming the clusters (Sarstedt and Mooi, 2011).
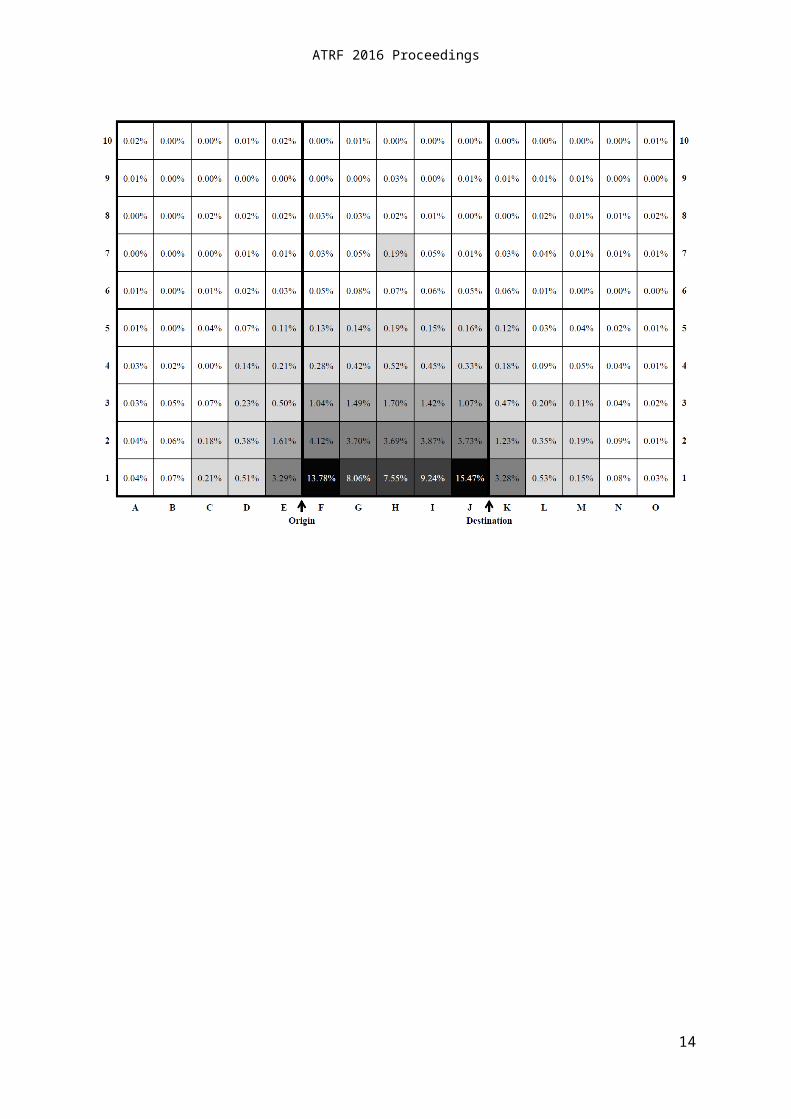
Figure 5 shows the cell-density for each cell, and which cluster each cell is assigned by the hierarchical clustering method, as shown in .
Figure 5: Cell-density in respective clusters
9

ATRF 2016 Proceedings
10

Cognitive Mapping of Transfer: A New Approach to Understand Transfer Behaviour
Figure 6: Cell density dendrogram
5.0 DiscussionInteresting results are observed in the travellers’ transfer point selection. The majority of bus journeys conducted have made a transfer located in the cells F1 and J1, as shown in Figure5. These two cells are identified to have the highest transfer point density at 13.78% and 15.47%, respectively. These two cells may be regarded as the most preferred cognitive transfer locations and the presence of a viable transfer service in those cells will increase the likelihood of making a transfer and eventually taking public transit compared to other cells.
These two cells (F1 and J1) are categorised as Cluster A by the hierarchical clustering. All the other cells are categorised into five different clusters by the cell’s grid density (). The hierarchical clustering uses the Ward’s method to measure the dissimilarity among clusters. Ward’s method uses an analysis of variance approach, instead of distance metrics to evaluate the distances between clusters, where cluster membership is assessed by calculating the total sum of squared deviations from the mean of a cluster (Ward, 1963). The dendrogram allows the tracing backward and forward to any cluster at any level. It gives an idea of how great the distance is between clusters in a particular step, using the 0 to 25 scale along the top of the chart.
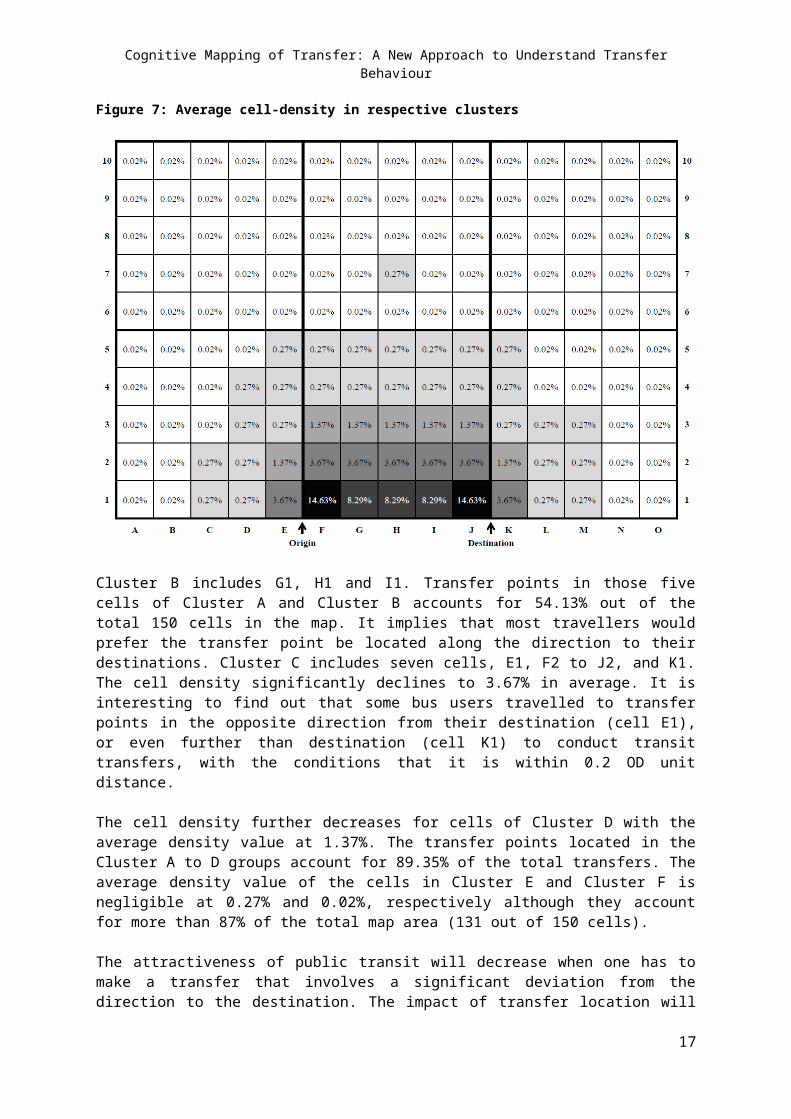
The mapping of the cognitive transfer locations is based on one day bus journey data. To minimise the probability of generating a bias index, the average of all indices within the same cluster is calculated, as displayed in .
11

ATRF 2016 Proceedings
Figure 7: Average cell-density in respective clusters
Cluster B includes G1, H1 and I1. Transfer points in those five cells of Cluster A and Cluster B accounts for 54.13% out of the total 150 cells in the map. It implies that most travellers would prefer the transfer point be located along the direction to their destinations. Cluster C includes seven cells, E1, F2 to J2, and K1. The cell density significantly declines to 3.67% in average. It is interesting to find out that some bus users travelled to transfer points in the opposite direction from their destination (cell E1), or even further than destination (cell K1) to conduct transit transfers, with the conditions that it is within 0.2 OD unit distance.
The cell density further decreases for cells of Cluster D with the average density value at 1.37%. The transfer points located in the Cluster A to D groups account for 89.35% of the total transfers. The average density value of the cells in Cluster E and Cluster F is negligible at 0.27% and 0.02%, respectively although they account for more than 87% of the total map area (131 out of 150 cells).
The attractiveness of public transit will decrease when one has to make a transfer that involves a significant deviation from the direction to the destination. The impact of transfer location will be more significant in a radial transit system, where transit users travelling from an outer suburb to another require a transfer in the downtown or major transit hubs to access connecting transit lines or alternative modes. For illustration purposes, Greenslopes is chosen as the origin Statistical Area Level 2 (SA2). Instead of using centroids to represent each SA2, the locations of the major bus stops are used. Major bus stop is defined as stop with the most transit routes that pass through in that SA2. This will give a better representation as compared to using centroid of each zone, based on the assumption that transit riders would often assess major stops with more frequent and consistent service, likewise to destinations. The fastest transit path to the neighbouring suburbs is shown in Figure 8.
12
Cognitive Mapping of Transfer: A New Approach to Understand Transfer Behaviour
Figure 8: The fastest transit path to the neighbouring suburbs of Greenslopes
Greenslopes (31055) to Coorparoo (31053) Greenslopes (31055) to East Brisbane (31115)
Greenslopes (31055) to Fairfield – Dutton Park (31054)
Greenslopes (31055) to Salisbury – Nathan (31070)
Greenslopes (31055) to Red Hill (31136) Greenslopes (31055) to Macgregor (31061)
13
ATRF 2016 Proceedings
In reference to Figure 8, though Greenslopes and Coorparoo are neighbouring SA2s, there is no direct transit service connecting these SA2s. Due to the strong radial nature of bus system in Brisbane, if one were to use transit, a transfer is needed at the nearby major transit hubs. The transfer location has deviated far from the direction to Coorparoo. Transit users travelling from Greenslopes to East Brisbane, and Fairfield – Dutton Park are required to make transfers that are beyond the destination points. Greenslopes to Salisbury Nathan requires a transfer. Unlike the previous three transfer locations, the transfer location to Salisbury Nathan has smaller deviation from the direction to destination. Travelling from Greenslopes to Red Hill and Macgregor using transit requires transfers which are less burdensome, as they are enroute to destinations. Figure 9 shows the transfer points on the standardised cognitive transfer locations map, with reference to the preference of transfer locations for each cell. Darker coloured cells represent the more preferred transfer locations, and vice versa.
Figure 9: Transfer points on the standardised cognitive transfer locations map
6.0 ConclusionDecentralising of urban settlement and growth onto less dense outer residential areas has created a challenge for public transit agencies to provide direct connections for all origin and destination pairs. The need to transfer has deemed to be necessary to provide private vehicle-competitive citywide access. However, the inconvenience of transfer could deter the use of public transit. Past studies have investigated factors that could affect the inconvenience of transfer, and conventionally as a generalised cost by converting extra time taken, cost and qualities of travel into comparable costs. In choosing a travel mode, travellers will make decision based on perceived total generalised cost. Different weights are applied to different valuation of time (transfer walking and transfer waiting time), and often taken as the ratio in relative to in-vehicle travel time. Transfer has too been included in mode
14

Cognitive Mapping of Transfer: A New Approach to Understand Transfer Behaviour
choice analysis, and often is incorporated as the total transit travel time or the number of transfer needed to complete a journey.
This research proposes a new approach to take into account the transfer impact from the perspective of travel direction to transfer points. By mapping the transfer locations on the standardised two-dimensional Euclidean space using the smart card data, the “preferred” cognitive transfer locations are observed. Generally, transit riders are reluctant to make a transfer if transfer locations are located far from the Euclidean straight line distance between origins and destinations and some preferred transfer locations are clearly identified.
Findings of this study present a new approach to understand transfer behaviours, and contribute to the current state of art of transfer. This study should be viewed as an exploratory effort to develop new concept: the cognitive transfer locations, to better capture transfer behaviours. The authors acknowledge that the definition of “transfer” can be more complicated than just any two trips made in less than 60 minutes apart and is not a round trip. Due to the limitation in the dataset, it is impossible to distinguish short activities enroute to destinations with those genuine transfers. Future research could build upon this to better define transfer journeys. For example, Nassir et al. (2015) uses the concept of “off-optimality” to identify short activities within the labelled transfers. This is measured as a difference in travel time between the observed trajectory and the fastest path in a time-dependant transit network. The focus of this study is only given to bus journeys with a single transfer. Future research could build upon this concept to consider multimodal transit journeys and those journeys with more than a single transfer. This new concept could later be incorporated as a new variable in mode choice analysis. This concept could also be applied to improve defining the transit service coverage. The conventional method defines the transit catchment area using door-to-door travel time, where the impedance of transfer is modelled simply as an extra travel time. Integrating the transfer location factor to the traditional door-to-door travel time approach could definitely give a more realistic representation of transit spatial coverage.
AcknowledgementsThe authors would like to take this opportunity to thank TransLink for valuable support to this research.
15

ATRF 2016 Proceedings
Reference List
Brown, J. and Thompson, G. (2008). Service orientation, bus—rail service integration, and transit performance: Examination of 45 U.S. metropolitan areas. Transportation Research Record, 2042, 82-89. doi: 10.3141/2042-09
Ceder, A., Chowdhury, S., Taghipouran, N. and Olsen, J. (2013). Modelling public-transport users’ behaviour at connection point. Transport Policy, 27, 112-122. doi: 10.1016/j.tranpol.2013.01.002
Cheng, W., Wang, W. and Batista, S. (2013). Grid-based clustering. In C. C. Aggarwal and C. K. Reddy (Eds.), Data clustering: Algorithms and applications (Vol. 31, pp. 127-148). Hoboken: CRC Press.
Chia, J., Lee, J. and Kamruzzaman, M. (2016). Walking to public transit – Exploring variations by socio-economic status. International Journal of Sustainable Transportation, 10(9), 805-814. doi: 10.1080/15568318.2016.1156792
Chowdhury, S. and Ceder, A. (2013). Definition of planned and unplanned transfer of public transport service and user decisions to use routes with transfers. Journal of public transportation, 16(2), 1-20. doi: 10.5038/2375-0901.16.2.1
Chowdhury, S., Ceder, A. and Sachdeva, R. (2014). The effects of planned and unplanned transfers on public transport users' perception of transfer routes. Transportation Planning and Technology, 37(2), 154-168. doi: 10.1080/03081060.2013.851511
Currie, G. and Loader, C. (2010). Bus network planning for transfers and the network effect in Melbourne, Australia. Transportation Research Record, 2145(1), 8-17. doi: 10.3141/2145-02
Devney, J. (2014). Redesigning bus networks to be simpler, faster and more connected. Paper presented at the Australian Institute of Traffic Planning and Management (AITPM) National Conference, Adelaide, South Australia, Australia.
Guo, Z. and Ferreira, J. (2008). Pedestrian environments, transit path choice, and transfer penalties: Understanding land-use impacts on transit travel. Environment and Planning B: Planning and Design, 35(3), 461-479. doi: 10.1068/b33074
Guo, Z. and Wilson, N. (2004). Assessment of the transfer penalty for transit trips geographic information system-based disaggregate modeling approach. Transportation Research Record: Journal of the Transportation Research Board, 1872, 10-18. doi: 10.3141/1872-02
Guo, Z. and Wilson, N. (2011). Assessing the cost of transfer inconvenience in public transport systems: A case study of the London Underground. Transportation Research Part A: Policy and Practice, 45(2), 91-104. doi: 10.1016/j.tra.2010.11.002
Hadas, Y. and Ceder, A. (2010). Public transit network connectivity. Transportation Research Record, 2143, 1-8. doi: 10.3141/2143-01
Hadas, Y. and Ranjitkar, P. (2012). Modeling public-transit connectivity with spatial quality-of-transfer measurements. Journal of Transport Geography, 22, 137-147. doi: 10.1016/j.jtrangeo.2011.12.003
16
Cognitive Mapping of Transfer: A New Approach to Understand Transfer Behaviour
Horner, M. W. and Murray, A. T. (2004). Spatial representation and scale impacts in transit service assessment. Environment and Planning B, 31, 785-798. doi: 10.1068/b3046
Iseki, H. and Taylor, B. D. (2009). Not all transfers are created equal: Towards a framework relating transfer connectivity to travel behaviour. Transport Reviews, 29(6), 777-800. doi: 10.1080/01441640902811304
Iseki, H. and Taylor, B. D. (2010). Style versus service? An analysis of user perceptions of transit stops and stations. Journal of public transportation, 13(3), 2. doi: 10.5038/2375-0901.13.3.2
Kittelson & Associates Inc., KFH Group Inc., Parsons Brinckerhoff Quade & Douglass Inc and Hunter-Zaworski, K. (2003). Transit capacity and quality of service manual (2 ed.). Washington, D.C.: Texas Transport Institute and Transport Consulting Limited.
Liu, R., Pendyala, R. and Polzin, S. (1997). Assessment of intermodal transfer penalties using stated preference data. Transportation Research Record(1607), 74-80. doi: 10.3141/1607-11
Loukaitou-Sideris, A., Liggett, R., Iseki, H. and Thurlow, W. (2001). Measuring the effects of built environment on bus stop crime. Environment and Planning B: Planning and Design, 28(2), 255-280. doi: 10.1068/b2642r
Luk, J. and Olszewski, P. (2003). Integrated public transport in Singapore and Hong Kong. Road and Transport Research, 12(4), 41-51.
Mishalani, R. G., McCord, M. M. and Wirtz, J. (2006). Passenger wait time perceptions at bus stops: Empirical results and impact on evaluating real-time bus arrival information. Journal of public transportation, 9(2), 89-106. doi: 10.5038/2375-0901.9.2.5
Nassir, N., Hickman, M. and Ma, Z. L. (2015). Activity detection and transfer identification for public transit fare card data. Transportation, 42(4), 683-705. doi: 10.1007/s11116-015-9601-6
O'Sullivan, S. and Morrall, J. (1996). Walking distances to and from light-rail transit stations. Transportation Research Record: Journal of the Transportation Research Board, 1538(-1), 19-26. doi: 10.3141/1538-03
Pickrell, D. H. (1985). Rising Deficits and the Uses of Transit Subsidies in the United States. Journal of Transport Economics and Policy, 19(3), 281-298.
Queensland Government. (2012). Travel in south-east Queensland. Australia: Queensland.
Queensland Government. (2016). TransLink tracker January-March 2016 Q3 (pp. 4). Australia: Department of Transport and Main Roads.
Sarstedt, M. and Mooi, E. (2011). Cluster Analysis. In M. Sarstedt and E. Mooi (Eds.), A concise guide to market research: The process, data, and methods using IBM SPSS statistics (pp. 273-324). Berlin, Heidelberg: Springer Berlin Heidelberg.
Sharaby, N. and Shiftan, Y. (2012). The impact of fare integration on travel behavior and transit ridership. Transport Policy, 21, 63-70. doi: 10.1016/j.tranpol.2012.01.015
17

ATRF 2016 Proceedings
Thompson, G. L. (1977). Planning considerations for alternative transit route structures. Journal of the American Institute of Planners, 43(2), 158-168. doi: 10.1080/01944367708977773
Thompson, G. L. and Matoff, T. G. (2003). Keeping up with the joneses: Radial vs. multidestinational transit in decentralizing regions. Journal of the American Planning Association, 69(3), 296-312. doi: 10.1080/01944360308978021
Vande Walle, S. and Steenberghen, T. (2006). Space and time related determinants of public transport use in trip chains. Transportation Research Part A: Policy and Practice, 40(2), 151-162. doi: 10.1016/j.tra.2005.05.001
Ward, J. H. (1963). Hierarchical grouping to optimize an objective function. Journal of the American Statistical Association, 58(301), 236-244. doi: 10.2307/2282967
Wardman, M., Hine, J. and Stradling, S. (2001). Interchange and travel choice (Vol. 1): Scottish Execuive Central Research Unit.
Weinstein Agrawal, A., Schlossberg, M. and Irvin, K. (2008). How far, by which route and why? A spatial analysis of pedestrian preference. Journal of Urban Design, 13(1), 81-98. doi: 10.1080/13574800701804074
18