abstract index terms ijser topsoil, clay, weathered layer and the fresh bedrock. the thickness and...
TRANSCRIPT

International Journal of Scientific & Engineering Research, Volume 5, Issue 10, October-2014 302 ISSN 2229-5518
IJSER © 2014 http://www.ijser.org
Integration of Geophysical and Geochemical Methods in the Study of ‘Laka’ Dumpsite
Ogbomoso, Oyo State Yusuf O. Azeez, Dorcas S. Eyinla
Abstract— Recently, the shock hazards that always come along contaminated groundwater in Laka area of Ogbomoso, south western Nigeria which contain some elements in excess quantity more than the Nigeria standard for drinking water quality 556 (207) recommendation for groundwater potability has become a major concern. With the aim of providing valuable information on hydrogeologic system of the aquifers, subsurface lithology, and delineating groundwater contamination, Thirty three (33) vertical electrical sounding (VES) was carried out utilizing surface Schlumberger electrode arrays and electrode spacing of 50m coupled with hydrogeochemical analysis of the surrounding hand dug wells for Cl-, Ca2+, Mg2+, Fe3+, No3
-, calcium, hardness, total hardness e.t.c. The DC resistivity survey revealed significant variation in the subsurface resistivity. Also, VES resistivity curves showed a dominant trend of low resistivity (high conductivity) at shallow depth of ≤15m and later increases with depth. In general the presences of three-four layers were delineated viz.: sandy, sand/gravel topsoil, clay, weathered layer and the fresh bedrock. The thickness and resistivity values range respectively from 0.42 to 2.5m and 13.51 to 150.9Ωm for the top soil, 1.1 to 12.5m and 11.7 to 300.1Ωm for the weathered/clay layer. These anomalous low resistivities indicate area with contaminated groundwater. The result of the hydrochemical analysis also agreed with the presence of contamination.
Index Terms— Groundwater contamination; Leachates; hydrogeochemical analysis; Flow net; Colometric method; and Nitrate concentration.
—————————— ——————————
1 INTRODUCTION ver the decades there has been an increasing concern of environmental pollution over the public health of the populace. Poor management of solid waste
materials leads to potentially disastrous environmental and health hazards. Among health hazards that have resulted from the lack of an effective disposal system are periodic epidemic and communicable diseases. Dumping of refuse at the “laka” dumpsite started at about 1950 but not in significant quantities until the early 70’s when the population then surged. Water supply problems are very common in most localities in Ogbomoso city just like in most tropical areas. In most cases, water required for domestic and agricultural uses are obtained from rivers, streams and shallow hand-dug well. Moreover, most of these rivers and streams are often situated at great distances from the villages they serve. The surface water sources are usually ephemeral/seasonal and prone to contamination by human beings and animals. The consequences of these pathetic situations on the water supply systems of the people in this region are the prevalence of such water-borne diseases like guinea worm, cholera and typhoid fever. According to the United Nations International Children Education Fund's Rural Water Sanitation, more than one million people are yearly affected by guinea worm. A prevention of the scourge of such water-borne diseases could have saved a lot of scarce resources spent on health care facilities. In view of this, the provision of sustainable potable water for the societal people becomes imperative. A geophysical technique of investigating the composition, structure and nature of the subsurface has over the time reached the high level of advancement, and has therefore found its applications in solving both the scientific and societal
problems. The electrical resistivity imaging technique has provided an appreciable tool for delineating the degree and extent of contamination owing to the resistivity contrast between the contamination zone and the immediate subsurface vicinity (Enikanselu, 2008). The technique is fast to use, and economical in delineating ground water contamination, as well as other environmental issues. Though the technique is not used to directly detect contaminants, it is used in the delineation of the geological environment through which the contaminants move, and in the determination of the distribution of contaminant in space and time through monitoring. In this study, Vertical Electrical Sounding (VES) survey and hydrochemical analysis of the water samples from the surrounding wells in the study location was adopted. These were used to determine the contamination spread both in lateral and vertical directions, to compare the reliability of the arrays as well as to ascertain the nature of the contamination present in the vicinity wells.
2 OVERVIEW 2.1 Location and Physiography of the Study Area The study was carried out in Ogbomosho, Oyo State, Nigeria in a hard rock terrain. Ogbomosho (figure 1) is the second largest city in Oyo state after the state capital, Ibadan. It is located between longitude of E 40 14´ 41.24´´ and latitude of N 80 7´ 31.5”. The study area is well drained by a stream with tributaries jointly forming a dendritic drainage pattern. The waste disposal site is cut across by a stream known as Laka. Accessibility of the area can be best described in terms of its road network as shown in fig. 1. The major drainage pattern at
O IJSER

International Journal of Scientific & Engineering Research, Volume 5, Issue 10, October-2014 303 ISSN 2229-5518
IJSER © 2014 http://www.ijser.org
this area is dendritic drainage pattern (fig. 2).
Fig. 1: Base Map of the Study Area Showing the Layout and
VES Locations
Fig. 2: Drainage Map of Ogbomosho Area
2.2 Literature Review Most environmental works on the impact of dumpsite and
effluents on surface and groundwater have been carried using hydrochemical and geophysical analysis approach. Enikanselu (2008) conducted geophysical survey to determine the effects of the “Hercules” dumpsite on the aquifer units around Giwa-Okearo area of Ogun State, South Western Nigeria. Amidu and Olayinka (2006) used 2D resistivity imaging technique and geochemical analysis to assess the impact of sewage disposal systems in the University of Ibadan, southwestern Nigeria. Griffiths and Baker (1993) presented the results of strong resistivity contrast which can occur across the junction between fresh and saline water in an area with the presence of saline groundwater due North of England.
2.3 Geology of the Study Area The study area lies within Basement Complex region of Nigeria. The rocks of the Precambrian basement complex have been extensively studied by Oyawoye (1964), Rahaman (1973, 1976), Odeyemi (1978) and a host of others, in an attempt to describing the occurrence, structural and stratigraphic relationships, classification and illustrating the metamorphic history and evolution of the rocks, as well as, correlation between these rocks and other pan-African belts. Ogbomoso is underlain by rocks of the Precambrian Basement complex with Migmatite gneiss, Granite gneiss, Quartzites, and Schist (fig. 3).
Fig. 3: Geological Map of Ogbomoso Area
3 METHODOLOGY For this study, three major methods were employed in the evaluation of groundwater contamination through seepages
IJSER

International Journal of Scientific & Engineering Research, Volume 5, Issue 10, October-2014 304 ISSN 2229-5518
IJSER © 2014 http://www.ijser.org
from “Laka” waste disposal site. These are geophysical investigation, hydrogeological investigation (well sampling) and Hydrochemical analysis of surrounding hand-dug wells. 3.1 Hydrogeological Study (Well Sampling and Flow net) A total of five (5) hand dug wells were sampled in the area. As shown on the well point post map generated (fig. 4), the well points were so chosen in order to ensure their evenly distribution, and hence an unbiased interpretation from the data acquired. First, the well points were sampled for the static water level and total depth. This was done using a 50 meter tape rule. The zero end of the tape rule was inserted into each well and on contact with the well water; measurements were taken from the base. Information about the total number of rings used during drilling made it possible to calculate the depth of each well and hence the thickness of water in each well. 3.2 Flow net Flow net is the graphical representation of two dimensional steady-state groundwater flows through aquifer. Construction of a flow net is often used for solving groundwater flow problem where the geometry makes analytical solution impractical. The method consists of filling the flow area with the stream equipotential lines, which are everywhere constant values of potential of hydraulic (upstream and downstream ends) and the other surface are no flow boundaries (impermeable layer) which define the sides of the outermost steamtubes. The process of constructing a flow net consists of contouring of the water table elevation from a piezometric network which can be used in flow net analysis to estimate groundwater seepage rate (fig. 4). This is a hydrometric method that can be applied for water level data either in the horizontal or vertical plane. As a first step, if the network is of sufficient density particularly near the stream or lake, contour of the piezometric surface can indicate relationship between an aquifer and the surface water features. The rules of flow net were initially formalized by Arthur Casagrande in 1937.
3.3 Geophysical Method Analysis of Geophysical investigation of the interior of the earth can reveal how the physical properties of the earth’s interior vary vertically or laterally. The main measuring instrument is the ABEM SAS terrameter, a composite unit made up of a transmitter and a receiver unit usually powered by either direct current (DC) or low frequency alternating current (AC) source. Current is sent through the current electrodes and now induces a voltage across the two inner electrodes. The terrameter converts voltage and current into electrical resistance which is displayed on a screen. The steel metal electrodes, four reels of insulated cables (usually in two colors ‘red and black’) connected to the electrodes and the terrameter with crocodile clips, measuring tape, hammer and Compass were also used.
Fig. 4: Flow Net Of Laka Area. 3.3.1 Vertical Electrical Sounding (VES) This is also known as electrical drilling or ‘expansion probe’. It is that method employed in investigating resistivity variation with depth. VES furnishes detailed information on the vertical succession and their thicknesses. The techniques is based on the fact that the fraction of the electric current put into the ground, penetrating below the any particular depth, increases with an increased separation of the current electrodes. Thus if the electrode separation is increased, the potential distribution at the surface will be affected more and more by variations of resistivity with depth within the earth. The Schlumberger arrangement was employed during for this study. It also utilizes four electrodes system like Wenner array but they are arranged linearly with different inter-electrode spacing as shown in the fig. 5. The electrodes are arranged such that the distance AB between the current electrodes is greater or equal to five times the distance MN, between the potential electrodes. The potential electrodes are fixed about the data station in which the current electrodes are spread until the required maximum separation is attained.
C1 C2
P1 P2 l l A M N B
Fig. 5: Typical Schlumberger Configuration Array
E 4°14.600' E 4°14.650' E 4°14.700' E 4°14.750' E 4°14.800'
E 8°7.500'
E 8°7.550'
E 8°7.600'
ves 25
ves 16
L4 ves 21
L7L8
L9 L10L11
L12
L133m
8m
13m
18m
23mLAKA DUMPSITE
L14LAKA CH
0m 35m 70m 105m
Flownet of Laka and environ
2L
IJSER

International Journal of Scientific & Engineering Research, Volume 5, Issue 10, October-2014 305 ISSN 2229-5518
IJSER © 2014 http://www.ijser.org
Where: AB = Current Electrode Distance (2L); MN = Potential Electrode Distance (2l)
AB ≥ 5MN For the VES, the potential electrodes remain fixed while the
current electrodes spacing is expanded symmetrically about the centre of the spread. For large value of L1 it is necessary to increase ‘l’ also in order to maintain a measurable potential. The assumption is that, the wider the current electrode spacing, the deeper the earth is being probed.
Multiplication of the values of resistance (R) obtained on field with the Schlumberger geometric factor (G) gave the apparent resistivity. The sounding curve for each point was obtained by plotting the apparent resistivity on the ordinate against half current-electrode spacing on a bilogarithmic transparent paper. Parameters such as apparent resistivity and thickness obtained from partial curve matching were used as input data for computer iterative modelling using the WinResist software.
3.4 Hydrochemical Analysis Water samples were taken from five hand-dug wells at an average depth of about 3.95m around the waste dump site for hydrochemical analysis (fig. 6). The samples were collected using 0.50 L plastic containers to avoid contamination during the sampling. Using the method and the procedure developed by the American Public Health Association (APHA, 1995, 2000) the samples were analyzed for temperature, color, PH, conductivity, chloride (Cl-), iron (Fe3+), nitrate (NO3-), calcium hardness, magnesium (Mg2+), calcium (Ca2+), total hardness, total alkalinity, nitrite(NO2-), turbidity and dissolved oxygen (DO).
Figure 6: Post Map Showing Well Positions Samples were analyzed for temperature using
thermometer. The concentration of Ca2+, Mg2+, and calcium hardness, were determined by using TitraVerHardness Titrant (EDTA) Method. The color was determined by APHA Platinum-Cobalt standard. The conductivity was determined using direct measurement with a Hach Conductivity Meter having a range of 0 to 20,000 micromhos/cm. The Cl- concentration was obtained using Mercuric Nitrate titration
method. The total hardness was obtained by titration method using ManVer2 Hardness Reagent, NO3- and NO2- was determined using Codmium Reduction Method using NitraVer5 Nitrate Reagent. Fe3+ was determined by phenanthroline method using FerroVer Iron Reagent. The PH was obtained using colorimetric method. The DO was determined using Azide modification of Winkler method and turbidity was determined using photometric method of determining suspended solids in a sample.
4 RESULTS AND DISCUSSION 4.1 Geoelectric Sections The results of the study are presented as Geological interpretation (flownet), Geoelectric sections, Maps and Hydrochemical interpretation.
From the flow net (fig. 4), regions around location (4, 13, 14), Laka church, Laka dumpsite and VES 25 are found to be discharge zones with static water level value of ≥ 15m while dumpsite I and region around VES 21, 16, location 9, 10, and 11 are recharge zones. The convergence at these points of recharge may be due to high thickness of weathering or permeability of the rocks.
In the northern region, groundwater flows in N–W direction (dumpsite). In the southwestern portion, the groundwater flows in a divergent manner in all direction (VES 25). At the southeastern part, there is the presence of an underground basin (≤ 3m). Also at the southwestern part is the presence of a small underground basin. Laka dumpsite which is situated at the south of Ogbomoso is seen here as a discharge zone. The dump site sheds underground contaminated water to the environment. The groundwater could however be hazardous at the recharging zones due to the effect of contamination.
Thirty three (33) vertical electrical sounding (VES) were carried out in the study area (fig. 1). Schlumberger electrode spread was used with maximum spread of 50m. The apparent resistivity curves shows that most of the sounding curves reflect the presence of three – four geoelectric layers. Most curve types found in the study area are of A, H and KH (fig. 7). The percentage distribution of the curve types are represented in table 1.
Table 1: Percentage Distribution of Curve Types
S/N CURVE TYPES
PERCENTAGE (%)
1 A 24 2 H 64 3 KH 12
The results of the interpreted VES curves were used to
draw geoelectric sections (figs. 8–10) along profiles A–A’, B–B’, and C–C’ to show the vertical distribution of resistivities within the volume of the earth in the investigated area.
IJSER

International Journal of Scientific & Engineering Research, Volume 5, Issue 10, October-2014 306 ISSN 2229-5518
IJSER © 2014 http://www.ijser.org
Fig. 7: Dominant curve types from the survey
Fig. 8: Geoelectric Section along Profile A1-A2 styel guide: http://www.ijser.org. Please note that math equations might need to be reformatted
from the original submission for page layout reasons. This includes the possibility that some in-line equations will be made display equations to create better flow in a paragraph. If display equations do not fit in the two-column format, they will also be reformatted. Authors are strongly encouraged to ensure that equations fit in the given column width.
Fig. 9: Geoelectric Section along Profile B1-B2
Fig. 10: Geoelectric Section along Profile C1-C2
The sections consist of sequence of uniform horizontal (or
slightly inclined) layers (horizons). Each layer (horizon) in the geo-electrical section may completely be characterized by its
)]2(/[),( 020µσϕϕ rddrrF∫ IJSER
International Journal of Scientific & Engineering Research, Volume 5, Issue 10, October-2014 307 ISSN 2229-5518
IJSER © 2014 http://www.ijser.org
thickness and true resistivity. The strikes for all the traverses is approximately NW-SE and strike lengths of the sections A–A’, B–B’ and C–C’ are approximately; 260m, 225m, and 200m respectively. The geoelectric sections show vertical variations in layer resistivity, which is a revelation of the vertical facie changes.
A maximum of four subsurface geoelectric units were delineated beneath these sections. These include the topsoil, the lateritic layer, the clay/weathered rock, and the fractured/fresh bedrock.
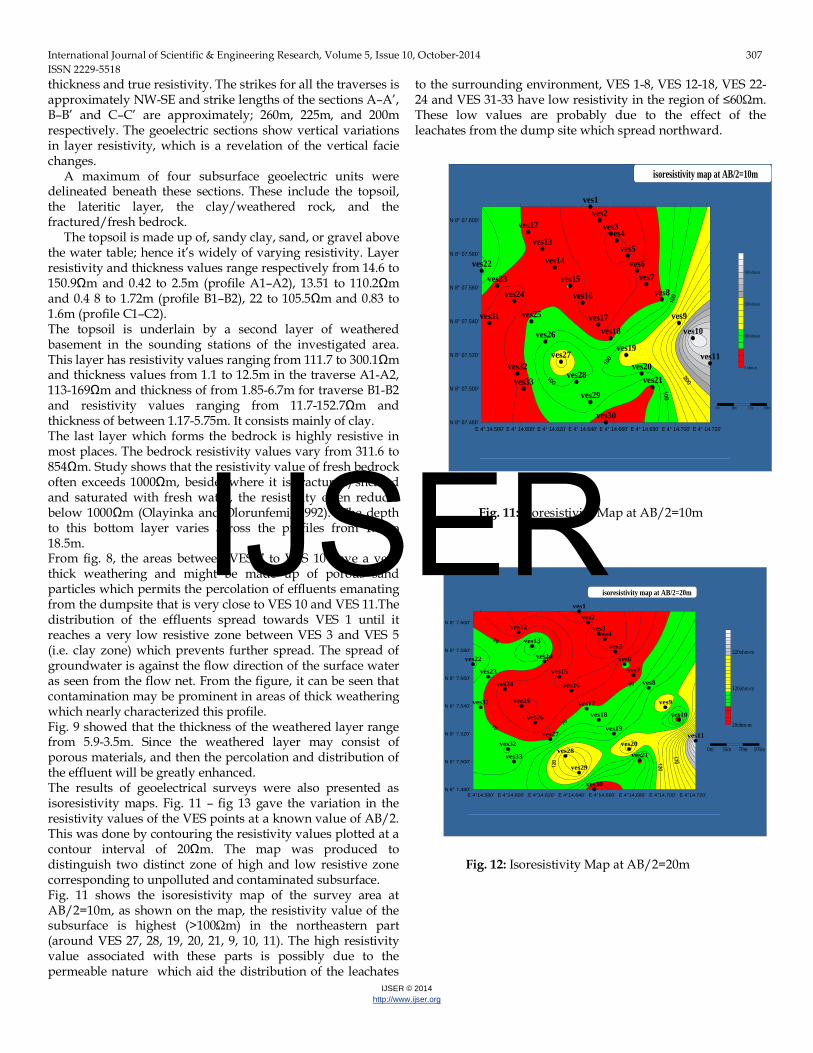
The topsoil is made up of, sandy clay, sand, or gravel above the water table; hence it’s widely of varying resistivity. Layer resistivity and thickness values range respectively from 14.6 to 150.9Ωm and 0.42 to 2.5m (profile A1–A2), 13.51 to 110.2Ωm and 0.4 8 to 1.72m (profile B1–B2), 22 to 105.5Ωm and 0.83 to 1.6m (profile C1–C2). The topsoil is underlain by a second layer of weathered basement in the sounding stations of the investigated area. This layer has resistivity values ranging from 111.7 to 300.1Ωm and thickness values from 1.1 to 12.5m in the traverse A1-A2, 113-169Ωm and thickness of from 1.85-6.7m for traverse B1-B2 and resistivity values ranging from 11.7-152.7Ωm and thickness of between 1.17-5.75m. It consists mainly of clay. The last layer which forms the bedrock is highly resistive in most places. The bedrock resistivity values vary from 311.6 to 854Ωm. Study shows that the resistivity value of fresh bedrock often exceeds 1000Ωm, beside, where it is fractured/sheared and saturated with fresh water, the resistivity often reduces below 1000Ωm (Olayinka and Olorunfemi, 1992). The depth to this bottom layer varies across the profiles from 1.8 to 18.5m. From fig. 8, the areas between VES 7 to VES 10 have a very thick weathering and might be made up of porous sand particles which permits the percolation of effluents emanating from the dumpsite that is very close to VES 10 and VES 11.The distribution of the effluents spread towards VES 1 until it reaches a very low resistive zone between VES 3 and VES 5 (i.e. clay zone) which prevents further spread. The spread of groundwater is against the flow direction of the surface water as seen from the flow net. From the figure, it can be seen that contamination may be prominent in areas of thick weathering which nearly characterized this profile. Fig. 9 showed that the thickness of the weathered layer range from 5.9-3.5m. Since the weathered layer may consist of porous materials, and then the percolation and distribution of the effluent will be greatly enhanced. The results of geoelectrical surveys were also presented as isoresistivity maps. Fig. 11 – fig 13 gave the variation in the resistivity values of the VES points at a known value of AB/2. This was done by contouring the resistivity values plotted at a contour interval of 20Ωm. The map was produced to distinguish two distinct zone of high and low resistive zone corresponding to unpolluted and contaminated subsurface. Fig. 11 shows the isoresistivity map of the survey area at AB/2=10m, as shown on the map, the resistivity value of the subsurface is highest (>100Ωm) in the northeastern part (around VES 27, 28, 19, 20, 21, 9, 10, 11). The high resistivity value associated with these parts is possibly due to the permeable nature which aid the distribution of the leachates
to the surrounding environment, VES 1-8, VES 12-18, VES 22-24 and VES 31-33 have low resistivity in the region of ≤60Ωm. These low values are probably due to the effect of the leachates from the dump site which spread northward.
Fig. 11: Isoresistivity Map at AB/2=10m
Fig. 12: Isoresistivity Map at AB/2=20m
E 4° 14.580' E 4° 14.600' E 4° 14.620' E 4° 14.640' E 4° 14.660' E 4° 14.680' E 4° 14.700' E 4° 14.720'N 8° 07.480'
N 8° 07.500'
N 8° 07.520'
N 8° 07.540'
N 8° 07.560'
N 8° 07.580'
N 8° 07.600'
ves1ves2
ves3ves4
ves5ves6
ves7ves8
ves9ves10
ves11
ves12
ves13
ves14
ves15
ves16
ves17ves18
ves19
ves20ves21
ves22ves23
ves24
ves25
ves26
ves27
ves28
ves29
ves30
ves31
ves32ves33
0 ohm-m
100 ohm-m
200 ohm-m
300 ohm-m
0m 36m 72m 108m
isoresistivity map at AB/2=10m
E 4°14.580' E 4°14.600' E 4°14.620' E 4°14.640' E 4°14.660' E 4°14.680' E 4°14.700' E 4°14.720'N 8° 7.480'
N 8° 7.500'
N 8° 7.520'
N 8° 7.540'
N 8° 7.560'
N 8° 7.580'
N 8° 7.600'
ves1
ves2
ves3ves4
ves5
ves6
ves7
ves8
ves9
ves10
ves11
ves12
ves13
ves14
ves15
ves16
ves17
ves18
ves19
ves20
ves21
ves22
ves23
ves24
ves25
ves26
ves27
ves28
ves29
ves30
ves31
ves32
ves33
isoresistivity map at AB/2=20m
20ohm-m
120ohm-m
220ohm-m
0m 35m 70m 105m
IJSER

International Journal of Scientific & Engineering Research, Volume 5, Issue 10, October-2014 308 ISSN 2229-5518
IJSER © 2014 http://www.ijser.org
Fig. 13: Isoresistivity Map at AB/2=30m
Fig. 12 shows the isoresistivity map of the survey area at AB/2=20m. Here the resistivity values reduces generally and the resistivity value of the subsurface is highest (>100Ωm) in the northeastern part (around VES, 28, 29, 9, 20, 21, 11).The reduction in the number of VES points having higher resistivity may be due to the effect of the leachates percolating the subsurface. The remaining VES points have low resistivity in the region of ≤60Ωm. These low values are probably due to the effect of the leachates from the dump site which spread northward. At a relatively higher depth of about 30m, the effect of the contamination is least felt as can be seen in fig. 13. The resistivity decreases radially towards the north and in the northeast direction from about 200Ωm in the N-E around VES (9, 10, and 20) and ≤130Ωm in the surrounding VES points. Thus, it can be concluded that the degree of contamination decreases with depth i.e. at depth of about 10m, the contamination in the subsurface is severest and least at the depth of about 30m.
4.2 Hydrochemical Analysis
Interpretation of the hydrochemical analysis was carried by plotting various values of certain ion concentration against the sample.
From the study area, 5 groundwater samples were taken and analyzed (Fig. 6). The major part of the TDS includes HCO3, SO42-, and chloride of Ca2+, Mg2+, Na2+ whereas KCl and NO32- as dissolved solids in groundwater samples. Several processes including movement of groundwater through rocks containing soluble mineral matter, contamination due to municipal waste disposal may cause increase in the dissolved solid.
The physical parameters measured are temperature, electrical conductivity, color, and turbidity. The electrical conductivity values range between 0.98 mS/cm and 1.68 mS/cm. From this result, sample L3 has the highest conductivity value and sample L4 has the lowest value. The higher the conductivity the higher the total dissolved solids (TDS) and the mineralization possibility of the groundwater.
Therefore, wells L1, L2, L3, and well L5 which have higher electrical conductivity than L4 can be attributed with their closeness to the dump site. This high value obtained indicates high potential of leachates from the dumpsite to cause gross organic pollution.
The colour determined for the water sample varies between 0 PCU and 125 PCU. Generally, all analyzed samples have values higher than the NIS limits of 5PCU. This may be due to long residence time (Olasehinde et al., 1998) of water in study area; this encourages microorganism activities which aids water decoloration.
The turbidity varies across the analyzed samples with sample L2 having the highest turbidity value of 34 PCU, followed by L5 with higher value of 15 FTU. Sample L4 has the lowest turbidity value of 0 FTU. Generally, the turbidity values of analyzed sample are higher than the Nigeria Standards for drinking water (NIS) limits. Turbidity is associated with suspended solids concentrations. The values of the above are more than the permissible limit of the Nigeria Standards for drinking water (NIS).
4.3 Piper Trilinear Plot The hydrochemical data is displayed as piper diagram in
figure 14. The cations and anions triangle clearly differentiate the groundwater types. The arrows in the diagram indicate the direction of increasing water conductivity (increasing dissolving ionic content). It shows that the increasing water conductance is associated with increasing solution of chlorides and nitrates. The sewage contaminated samples fall at saline zone. However, the origin of salinity is not the rock matrix but the sewage. All the samples have nitrate concentrations in excess of the 45 mg/L recommended by NIS.
Figure 14: Piper Trilinear Plot of Laka showing The Distribution Of Major Dissolved Ions
E 4°14.580' E 4°14.600' E 4°14.620' E 4°14.640' E 4°14.660' E 4°14.680' E 4°14.700' E 4°14.720'N 8°7.480'
N 8°7.500'
N 8°7.520'
N 8°7.540'
N 8°7.560'
N 8°7.580'
N 8°7.600'
ves1ves2
ves3ves4
ves5ves6
ves7ves8
ves9ves10
ves11
ves12
ves13
ves14
ves15
ves16
ves17ves18
ves19
ves20ves21
ves22ves23
ves24
ves25
ves26
ves27
ves28
ves29
ves30
ves31
ves32ves33
30 ohm-m
130 ohm-m
230 ohm-m
0m 35m 70m 105m
isoresistivity map at AB/2=30m
IJSER

International Journal of Scientific & Engineering Research, Volume 5, Issue 10, October-2014 309 ISSN 2229-5518
IJSER © 2014 http://www.ijser.org
5 SUMMARY The geophysical investigation of Laka area, south western
Nigeria has revealed through the flownet that Laka dumpsite is a discharge zone. The northern region includes groundwater flowing in a divergent manner in the eastern, western and southern direction. The implication is that the groundwater could be contaminated around the dumpsite.
The geophysical investigation involved a total of 33 Schlumberger Vertical Electrical Sounding along four established traverses. The VES interpretations are presented in form of geoelectric sections. A maximum of four subsurface layers were delineated from the resistivity soundings across the investigated area. It includes sandy, sand/gravel topsoil, clay, weathered layer and the fresh bedrock. The thickness and resistivity values range respectively from 0.42 to 2.5m and 13.51 to 150.9Ωm for the top soil, 1.1 to 12.5m and 11.7 to 300.1Ωm for the weathered/clay layer.
The isoresistivity map at AB/2=10m, shows resistivity values ≥ 100Ωm in the N-E part and low resistivity ≤40m in the surrounding environment. At AB/2=20m the resistivity values is ≥ 100Ωm in the N-E part, with the surrounding environment having low resistivity value ≤ 50Ωm. At a greater depth of AB/2 = 30m the resistivity decrease generally towards the north and in the N-E from ≥ 20Ωm to ≤ 130Ωm. The results of the hydrochemical analysis were used to plot a piper trilinear diagram. It shows the increasing water conductivity is equivalent to increasing dissolving ionic content. The empirical relationship has been obtained between water resistivity and earth resistivity. The relationship was used for delineation of groundwater quality zones.
6 CONCLUSION Surface electrical resistivity survey involving Vertical
Electrical Sounding was conducted in Laka area south western Nigeria, with the aim of providing valuable information on the hydrogeological system of the aquifer and delineating trend of increasing resistivity with depth which indicated contamination at a shallow depth.
Resistivity values increases with distances away from the site indicating reduction in the amount of leachates away from the dumpsite. The results of the hydrochemical analysis agree with the presence of contamination established by the geophysical survey. The result of the study had established that the source of the contaminant of the water in the surrounding wells is the leachates from the dumpsite. These have demonstrated the effectiveness of integrated geophysical and hydrochemical analysis in Environmental Impact Assessments (EIA).
7 RECOMMENDATION Since the geoelectric sections had revealed the presence of
clay materials which prevent percolation, it is however recommended that prior to locating a dumpsite, a geophysical investigation should be carried out as reconnaissance survey with a view to knowing the lithology in the subsurface. With
these, incompetent porous material should be evacuated and fill with non-porous competent materials like clay.
For domestic and industrial consumption, hand dug wells and boreholes should be drilled to a depth more than 20m to avoid the contamination and clay zone present at a shallow depth. Further studies are recommended in the study location using other geophysical methods such as Dipole-Diploe technique, Electromagnetic Methods, Ground Penetrating Radar (GPR) and Spontaneous Potential (SP) integrated with other geochemical analyses.
REFERENCES [1] American Public Health Association (Apha), 1995 &2000:
Standard Methods for the Examination Of Water And Waste Water. 18th& 20th Edition, Apha, Washington, D.C.
[2] Amidu, S.A.; Olayinka, A.I., 2006.Environmental Assessment of Sewage Disposal Systems Using 2d Electrical- Resistivity Imaging and Geochemical Analysis: A Case Study from Ibadan, Southwestern Nigeria: The Geological Society of America: Environmental &Engineering Geosciences, Vol. Xii, No. 3, Pp. 261 – 272.
[3] Casagrande, A, 1937, Seepage through Dams, Journal of New England Water Works, 51, 295-336 (Harvard Graduate School England Pub.2009).
[4] Enikanselu, P.A., 2008.Detection and Monitoring Of Dumpsite-Induced Groundwater Contamination Using Resistivity Method: The Pacific Journal of Science And Technology, Vol. 9. No.1.Pp.254-262.
[5] Griffiths, D.H., Barker, R.D., 1993, Two-Dimensional Resistivity Imaging and Modelling
[6] In Areas Of Complex Geology. J. Appl. Geophysics. 29, 211–226.
[7] Odeyemi, I.B., 1978. Orogenic Events In Precambrian Basement Of Nigeria, West Africa. Paob Newsletter, Yace, I. (Ed), Vol. No.3, Pp.18-24.
[8] Olaseinde, P.I., Virbka, P. And Esan, A., (1998).Preliminary Result of Hydrogeological Investigation in Ilorin Area, Southwestern Nigeria: Quality of Hydrochemical Analysis. Water Resources Journal of NAH, Vol. 9, Pp.51 – 61.
[9] Oyawoye, M.O., 1973. The Geology of the Nigeria Basement Complex. Journal of Nigeria Mining, Geology and Metallurgy Soc. Vol. 1, Pp.87-102.
[10] Oyawoye, M.O., 1976. The Basement Complex of Nigeria. In: African Geology (T.F.J. Dessauvagieand A.J. Whiteman, Eds.). Ibadan University Press, Ibadan. Pp. 67-99.
IJSER