absence, substitutability and productivity: evidence from teachers · absence, substitutability and...
TRANSCRIPT
Absence, Substitutability and
Productivity: Evidence from Teachers
Asma Benhenda ∗
University College London, Institute of Education
June 2019
Abstract
Worker absence is a frequent phenomenon but little is known on its effects
on productivity nor on organizations’ strategies to cope with this temporary dis-
ruptive event through substitute workers. Using a unique French administrative
dataset matching, for each absence spell, each missing secondary school teacher
to her substitute teacher, I find that the expected loss in daily productivity from
non-replaced days is on par with replacing an average teacher with one at the
30th percentile of the teacher value-added distribution. On average, substitute
teachers are unable to mitigate this negative effect. There is substantial hetero-
geneity by substitute teacher quality: higher quality substitute teachers are able
to compensate up to 25 % of this negative impact while lower quality substi-
tute teachers do not have any statistically significant impact. JEL: I2, J2, M51.
Keywords: absence, substitutability, productivity, teachers.
∗Contact: [email protected]. I am deeply grateful to my advisors Julien Grenet and Thomas
Piketty for invaluable guidance and support. Part of this paper was conceived during my visit at
Columbia University, I am grateful to Jonah Rockoff for very insightful feedback. I thank Joshua
Angrist, David Autor, Ghazala Azmat, Raj Chetty, David Deming, Pascaline Dupas, Alex Eble,
Albrecht Glitz, Marc Gurgand, Eric French, Hilary Hoynes, Andrea Ichino, Rafael Lalive, Maarten
Lindeboom, Ben Ost, Petra Persson, Imran Rasul, Roland Rathelot, Randall Reback, Miika Rokkanen,
Jesse Rothstein, Danny Yagan and seminar participants at UCL IoE, Paris School of Economics, the
French Ministry of Education, and UC Berkeley for helpful comments. I also thank the French Ministry
of Education for help with the data. I acknowledge financial support from the Alliance Program of
Columbia University.
1
1 Introduction
Worker absence is frequent in many countries. For example, in the United Kingdom,
the United States and France alike, every year, two to three percent of annual work time
is lost due to worker absence (DARES, 2013; UK Office for National Statistics, 2014;
US Bureau of Labor Statistics, 2016). Despite the importance of this phenomenon,
empirical evidence on the causal effect of worker absence on productivity is scarce.1
Even much less is known on organizations’ strategies to cope with this temporary
disruptive event through worker substitution. When a worker is absent, how does it
hurt her productivity? How easily can organizations mitigate this effect with substitute
workers? Several major economic issues, from the impact of worker health and effort
on productivity (Lazear and Oyer, 2012) to the analysis of specific human capital
(Jacobson et al., 1993; Altonji and Williams, 2005; Gathmann and Schonberg, 2010)
and its relationship with worker substitutability (Stole and Zwiebel, 1996), depend on
the answer to these questions.
I offer an empirical answer to these questions using a unique comprehensive admin-
istrative French panel dataset covering the 2007-2015 period and matching, for each
absence spell, each missing secondary school teacher to her substitute teacher. This pa-
per estimates, for Math, French and History ninth grade teachers and their students:
a) the effect of the number of days of non-replaced teacher absence on student test
scores ; b) how this impact can be mitigated by the assignment of substitute teachers;
c) how the impact of substitute teachers depends on their quality, measured by their
type (tenured vs contract teachers).
I implement a two-way fixed effect model with teacher and classroom-year fixed
effects. I exploit the longititudinal dimension of the data with teacher-school fixed
effects. I also exploit the cross-sectional dimension of the data: in secondary school,
teachers are subject-specific and students stay with the same peers in the same class-
room, throughout the school year and for all subjects. This allows me to use variation
within classroom-year, across subjects. I perform several robustness checks to confirm
that the results are not driven by a) reverse causality: teachers are more absent when
assigned to low performing students and it is more difficult to find quality substitution
for this type of students; b) the fact that absences are only a reflection of poor on-the-
job teacher productivity; c) or the fact that replaced absence spells are not comparable
to non-replaced ones.
1To my best knowledge, there are only four papers covering this question: Miller et al (2008);Clotfelter et al. (2009); Duflo et al. (2012); Herrmann and Rockoff (2012)
2
Based on the analysis of more than 100,000 teachers and three millions students, I
show that teacher absence has a statistically negative impact on student test scores: the
expected loss in daily productivity from non-replaced days is on par with replacing an
average teacher with one at the 30th percentile of the teacher value-added distribution,
which is consistent with the very few studies on this question (Herrmann and Rockoff,
2012). The fraction of absence spell replaced does not have any statistically significant
compensating effect. However, when I make the distinction between the two type of
substitute teachers, I find that one additional replaced day with a tenured substitute
teacher (as opposed to a missed day at school) mitigates 26 % of the marginal impact
of non-replaced days. The marginal impact of a replaced day with a contract teacher
(as opposed to a missed day at school) is not statistically significant.
I also estimate heterogeneity by teacher and absence spell characteristics to pro-
vide suggestive evidence on the underlying mechanisms highlighted in a conceptual
framework. I investigate the role of the gap in general human capital between the
regular and the substitute teachers. The main prediction from the conceptual frame-
work is that the larger this gap, the smaller the mitigating effect of substitution. I use
teacher experience as a measure of general human capital because the link between
teacher experience and teacher productivity is well established in the literature (see
Koedel et al., 2015 for a review). I find that the mitigating effect of tenured sub-
stitution is not significantly impacted by the experience gap. This suggests that the
results cannot be entirely explained by this mechanism. I also investigate the role of
the specific human capital gap: teaching requires specific human capital which can be
acquired only through prolonged and repeated interactions with students. This mech-
anism is supported by the heterogeneity analysis by month of the year: absence spells
happening at the end of the school year have a larger impact than those happening at
the beginning of the year, when the specific human capital gap between the substitute
and the regular teachers is smaller.
This paper contributes to several strands of the literature. First, this paper con-
tributes to an emerging empirical literature on worker substitutability. Hensvik and
Rosenqvist (2016) show that worker sickness absence is lower in positions with few
internal substitute and give evidence that firms try to keep absence low in positions
with few internal substitute. Jager (2016) analyzes the effect of unexpected worker
deaths in the German private sector and shows these worker exits on average raise the
remaining workers’ wages and retention probabilities. While these papers use wage and
retention as proxies for worker productivity, I measure it based on an actual and mul-
tidimensional output, student outcomes. I can rely on an important literature which
3
consistently finds teachers to be the most important determinant of student outcomes,
both in the short and long run (Rockoff, 2004; Rivkin, Hanushek and Kain, 2005;
Chetty, Friedman and Rockoff, 2014a;b). Moreover, because teaching is a complex,
multidimensional task, based on direct, personal and prolonged interactions with the
“output” (students), it requires specific human capital (student-specific, grade-specific
etc., see Ost, 2014), which makes it particularly well suited to the analysis of the
relationship between human capital specificity and substitutability.
Second, it contributes to the very small literature on the effect of worker absence on
productivity (Miller et al., 2008; Clotfelter et al., 2009; Duflo et al., 2012; Herrmann
and Rockoff, 2012). This literature focuses on teachers and finds that the expected
loss in daily productivity from teacher absence is on par with replacing a teacher of
average productivity with one at the 10th-20th percentile of productivity. One of the
most important limitation of this literature is that it does not provide any empirical
evidence on the impact of substitute teachers and the channels through which teacher
absence affects students.
Third, this paper contributes to the small literature on contract teachers, which
focuses on developing countries. The main paper on this question is Duflo et al.(2012),
which shows that, in Kenyan primary schools, contract teachers are more efficient than
regular teachers when their hiring is more closely monitored and they have higher
incentives to exert effort. The French context analyzed in this paper is very different
because the requirements to become a contract teacher are very low and contract
teachers do not seem to have higher incentives than regular teachers to exert effort.
Finally, this paper contributes to the literature on instruction time (Pischke, 2007;
Lavy, 2015). This literature finds that longer instructional time has a positive impact
on student test scores and one-time grade progression. While these papers focus on
variations in planned instruction time defined by law, I go a step further and analyze
the impact on student outcomes of variations in the actual amount of instruction hours,
and of variations with whom they are actually spent (regular or substitute teacher).
The remainder of the paper is organized as follows. Section 2 describes the French
educational context, highlighting its relevance to the analysis of worker absence and
substitutability. Section 3 presents a highly stylized conceptual framework to illus-
trate the mechanisms through which teacher absence and substitution affect student
outcomes. Section 4 presents the data and some descriptive statistics. Section 5 ex-
poses the empirical strategy, section 6 the baseline results and section 7 the robustness
checks. Section 8 shows the hetergoneity analysis. Section 9 concludes.
4

2 Institutional Setting
To provide context for the empirical analysis, this section describes the main relevant
features of the French educational system. It focuses more specifically on describing
the different types of teachers and the teacher assignment system.
2.1 Secondary School Teachers in France
The public French educational system is highly centralized. Schools have little auton-
omy and they are in particular, all required to follow the same national curriculum.
School principals cannot hire nor fire their teachers. The French territory 2 is decom-
posed in 25 large administrative school districts, called academies (hereafter regions).
Secondary school teachers are selected through a subject-specific national compet-
itive examination, which is very demanding academically and has low passing rates
(between 15 and 30 %). There are two main certification levels: basic, called CAPES
(Certificat d’aptitude au professorat de l’enseignement du second degre) and advanced,
called Agregation. Conditional on passing this examination, teachers become civil
servants and are managed by the government. They have a permanent position and
cannot be fired.
Certified teachers are assigned via a centralized point-based system (called SIAM,
Systeme d’information et d’aide aux mutations) with two rounds: the inter-regional
round and the regional round. Candidates submit a rank-ordered list of choices and
are assigned according to a modified version of the school-proposing Deferred Accep-
tance mechanism (Combes, Tercieux and Terrier, 2016). Teachers’ priorities are mostly
determined by their number of years of experience. Every year, i) new teachers and
tenured teachers who want to change region apply to the inter-regional mobility round;
ii) participants of the inter-regional mobility round, and tenured teachers who want to
change school within their region, apply to the intra-regional mobility round.
Teachers’ wage is set through a national wage scale based on teachers’ number of
years of experience and certification level (none, basic and advanced). For example,
the gross wage of a teacher with the basic certification level and a year of experience
is approximately 2,000 euros per month. Wages do not vary across schools and do not
depend on output.
Secondary school teachers are subject-specific: each subject is taught by a different
teacher. The legal working week is 15 hours for teachers with an advanced certification
level and 18 hours for teachers with a basic certification level. Students are not tracked
2This paper focuses on mainland France and does not analyse its overseas territories.
5
by major nor ability. Students stay in the same class, with the same peers throughout
the school year and in all subjects. For ninth graders, a typical week consists in 29
school hours, distributed across 11 teachers– subjects, among which 4 hours of French,
3.30 hours of Mathematics, and 3.30 hours of History. 3 At the end of 9th grade,
students take a national and externally graded examination called Diplome national
du Brevet in three subjects: French, Math and History. This exam takes place in the
very last days of June/early days of July.
2.2 Teacher Absence Leave Regulation
Teachers are fully paid during the first three months of their absence leave for minor
illness, and during the first to third year of their leave for serious illness. After this
period, they receive half of their regular pay. Teachers are fully paid during their
maternity leave, which can last from 16 to 46 weeks depending on the order of the birth.
Paternity leaves are also fully paid and can last from 11 to 18 days. Teacher can also
take fully paid leave for professional reasons such as training, meetings, participation
to an examination board etc.. There is no limitation in the number of days of paid
absence each teacher can take per year.
2.3 Teacher Substitution Procedure
Teacher absences are not systematically replaced in France. Overall, the probability of
replacement depends on the length of the absence spell and the availability of substitute
teachers. Absences are handled by the regional educational authority (rectorat). There
are no official precise criteria: regional educational authorities are simply asked to give
priority to long term absences (IGEN, 2011).
In practice, when a teacher is absent, she has to notify her school principal, who
then notifies the region via an online form, whatever the length of the absence spell.
Regional educational authorities assign substitute teachers manually.
2.4 Substitute Teachers
Tenured Substitute Teachers. Certified teachers can ask to become substitute
teachers during the intra-regional mobility round of the centralized teacher assignment
3The rest of the hours are distributed between Foreign Languages (5h30), Science (4h30), Sport(3h)and Art (2h), see http://www.education.gouv.fr/cid80/les-horaires-par-cycle-au-college.html
6
procedure but most tenured substitutes (Titulaires sur zone de remplacement) are
teachers who participated to the inter-regional mobility round and failed to obtain one
of their choices in the intra-regional mobility round (IGAENR, 2015). They are as-
signed to a reference school called etablissement de rattachement administratif (RAD),
and can be called to replace absent teachers in any school located in an geographical
area called zone de remplacement. 4 There are around 250 zones de remplacement in
France. Tenured substitute teachers’ wages do not depend on the number of substitu-
tion they perform nor on the number of hours they work. Their wage is mainly fixed
and equal the regular teachers’ wage. As explained above, there is no clear rule for the
assignment of tenured substitute teachers. Regional educational authorities, which are
in charge of the assignment and do it manually, are simply given the general guideline
to give priority to long absence spells (IGEN, 2011). Substitute teachers do not have
the possibility to refuse any assignment. 5
Contract Teachers. When there is a shortage of available tenured substitute
teachers, regions hire contract teachers on the spot. Contract teachers are not hired
via the same procedure as certified teachers. Candidates apply directly to regional
educational authorities via an online platform. 6 To be eligible, they must hold a
Bachelor’s degree and have no criminal record. Candidates submit their resume, cover
letter and, in some regions, their geographical preferences. The selection process is
managed by regional professional inspectors. In general, professional inspectors are
former experienced teachers. They screen candidates based on their online application
and conduct interviews. Successful candidates are hired on a short term contract
(Contrat a duree determinee) of maximum a year. Contract teachers’ wage depends
on their degree (High school degree, Bachelor’s, Master’s or more), their professional
experience, and on their region. 7 For example, the gross wage of a contract teacher
in Paris, with a Bachelor’s degree and a year of experience is 1699 e/ month.
3 Conceptual Framework
This section presents the main intuitions and predictions of a highly stylized concep-
tual framework illustrating how teacher absences can impact teacher productivity and
4Decret 99-823 du 17 septembre 19995This is different in other countries such as the United States, see Gershenson (2012)6This online platform is called, depending on the region, either SIATEN (Systeme d’information
des agents temporaires de l’Education nationale) or ACLOE (Application de gestion des candidaturesen ligne)
7http://vocationenseignant.fr/devenir-enseignant-contractuel-ou-vacataire-mode-d-emploi
7
how this impact can be mitigated or aggravated by substitute teachers. This detailed
conceptual framework is presented in appendix (section A).
This framework builds on the education production function framework. Teacher
productivity depends on her ability, general human capital (including professional ex-
perience) and, importantly, student-specific human capital. The basic intuition of
student-specific human capital is that the longer teachers spend time teaching the spe-
cific students they are assigned to, the better they are at teaching them. This may be
because they get to know students and adjust to them, and also have more time to im-
plement a long-term instructional strategy. Several suggestive empirical evidence back
this intuition. Duflo, Dupas and Kremer (2011) suggest teachers adjust the level at
which they teach in response to changes in class composition. Herrmann and Rockoff
(2012) find daily productivity losses from absence decline with the length of an absence
spell, consistent with substitute teachers learning on the job.
The main predictions of this conceptual framework are the following. Teacher
absence can impact teacher productivity through different channels, depending on
whether the absent teacher is replaced, and on the quality of the substitute teacher:
1. If the regular teacher is absent and no substitute teacher is assigned, teacher
absence can impact productivity through the loss in instruction time and the
amount of student-specific capital the regular teacher loses during her absence.
The higher the regular teacher productivity, the bigger the impact of the loss in
instruction time
2. If the regular teacher is absent and a substitute teacher is assigned, the main
channels are:
- the difference in ability and experience between the regular and the substitute
teachers
- how fast substitute teachers gain student-specific human capital
- the amount of student-specific capital the regular teacher loses during her
absence
4 Data and Descriptive Statistics
This section presents the administrative data on regular teachers, substitute teachers
and their students. Its main advantage is the fact that it is a comprehensive panel
8
data matching each teacher to her students, and each absent teacher to her substi-
tute teacher for each absence spell. The main estimation sample is composed of all
ninth grade students and their Math, French and History teachers from 2007 to 2015.
This corresponds to 5,233 schools, 101,479 teachers and 3,259,290 students. This sec-
tion also provides the descriptive statistics necessary to understand how absence and
substitution spells are distributed across teachers and schools.
4.1 Data
This paper relies on administrative data from the French ministry of Education cov-
ering the whole country and school years 2005-2006 through 2014-2015. I focus on
Math, French and History teachers matched to their ninth grade students. A precise
description of the data is found in appendix (section C). I exploit four main set of
data:
- individual data on students including an encrypted national identification number,
gender, financial aid status, parents’ occupation, the identification number of their
school and of their class. A separate database also includes their test scores at the
end of 9th grade examination in French, Math and History, which I standardize by
year and region.
- individual data on teachers including national identification number, date of birth,
gender, number of year of teaching experience, teaching subject, identification num-
ber of their assignment, and the identification number of the school and of the class
they teach. The two latter variables are used to match each teacher to her stu-
dents. I take into account, throughout the paper, only open business days and
remove holidays and weekends.
- data on teachers’ absence spells: regional identification number of the absent teacher;
day, month and year of the absence spells; detailed cause of absence (minor illness,
maternity leave, training etc.); region identification number.
- data on teachers’ assignment spells: region identification number of the substitute
teacher, day, month and year of the assignment spells; identification number of their
assignment; national identifying number of the school. The match between the
absent and the substitute teachers is made on the identification number and dates
of their respective assignment spells. As for absence spells, I take into account,
throughout the paper, only open business days and remove from absence spells
holidays and weekends.
9
4.2 Summary Statistics
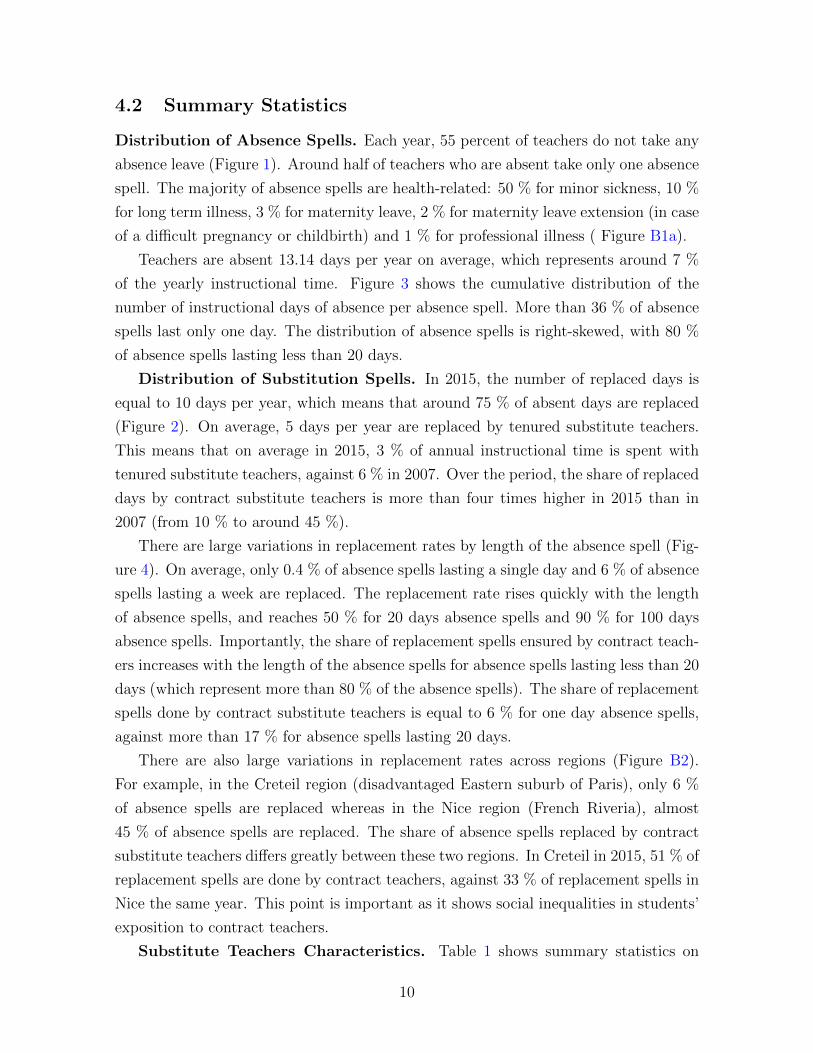
Distribution of Absence Spells. Each year, 55 percent of teachers do not take any
absence leave (Figure 1). Around half of teachers who are absent take only one absence
spell. The majority of absence spells are health-related: 50 % for minor sickness, 10 %
for long term illness, 3 % for maternity leave, 2 % for maternity leave extension (in case
of a difficult pregnancy or childbirth) and 1 % for professional illness ( Figure B1a).
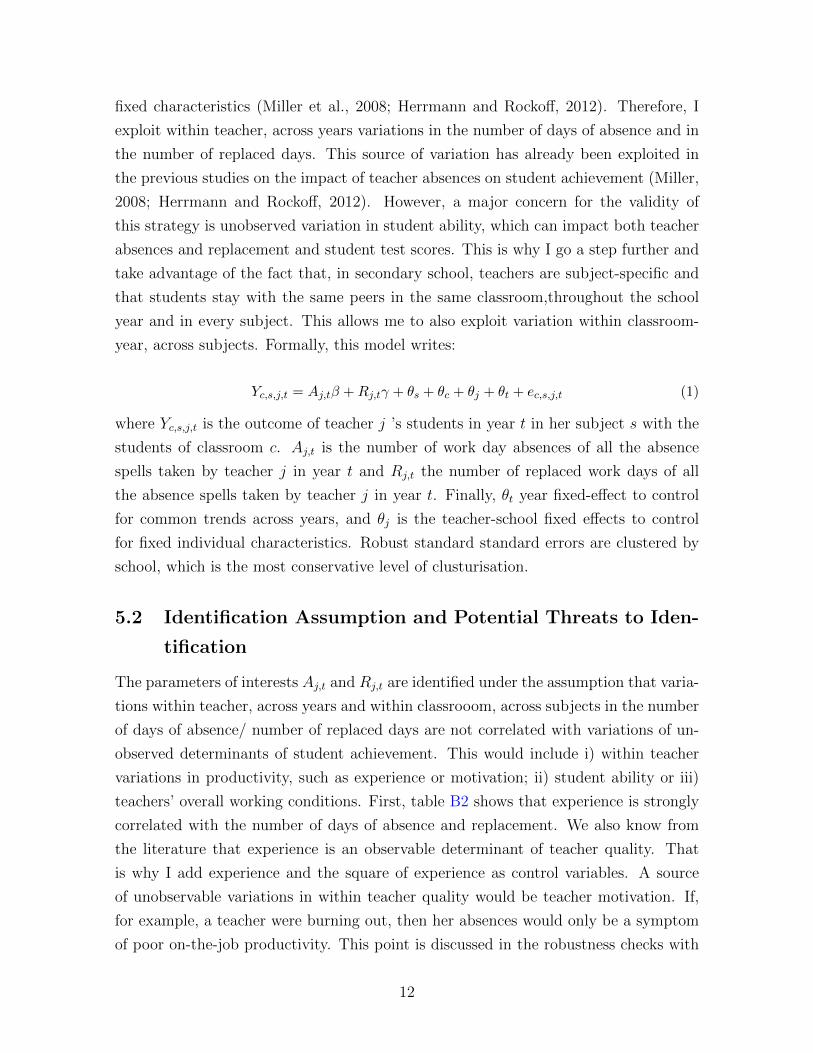
Teachers are absent 13.14 days per year on average, which represents around 7 %
of the yearly instructional time. Figure 3 shows the cumulative distribution of the
number of instructional days of absence per absence spell. More than 36 % of absence
spells last only one day. The distribution of absence spells is right-skewed, with 80 %
of absence spells lasting less than 20 days.
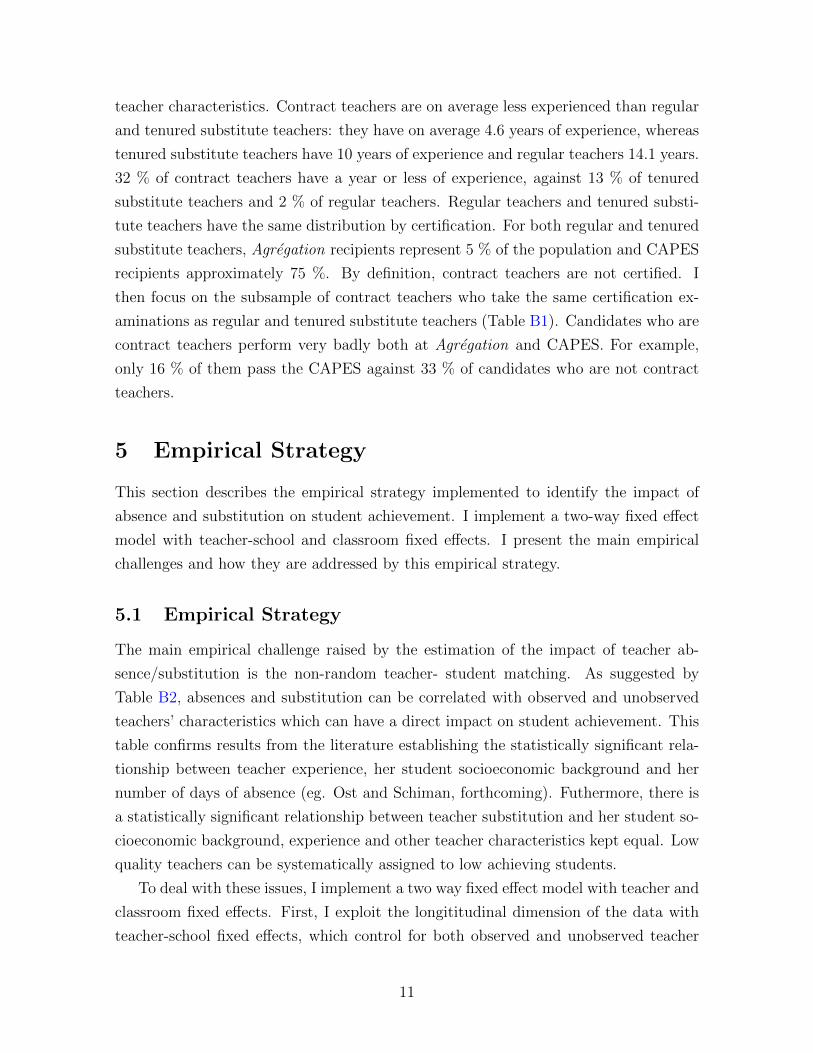
Distribution of Substitution Spells. In 2015, the number of replaced days is
equal to 10 days per year, which means that around 75 % of absent days are replaced
(Figure 2). On average, 5 days per year are replaced by tenured substitute teachers.
This means that on average in 2015, 3 % of annual instructional time is spent with
tenured substitute teachers, against 6 % in 2007. Over the period, the share of replaced
days by contract substitute teachers is more than four times higher in 2015 than in
2007 (from 10 % to around 45 %).
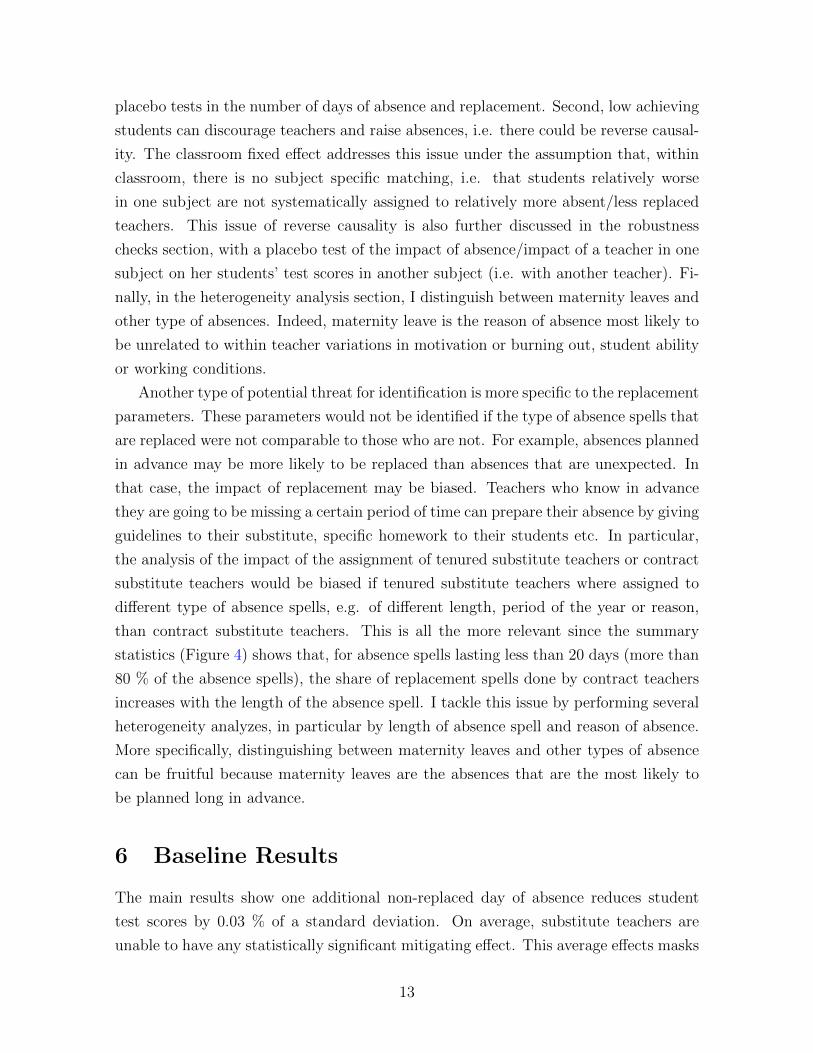
There are large variations in replacement rates by length of the absence spell (Fig-
ure 4). On average, only 0.4 % of absence spells lasting a single day and 6 % of absence
spells lasting a week are replaced. The replacement rate rises quickly with the length
of absence spells, and reaches 50 % for 20 days absence spells and 90 % for 100 days
absence spells. Importantly, the share of replacement spells ensured by contract teach-
ers increases with the length of the absence spells for absence spells lasting less than 20
days (which represent more than 80 % of the absence spells). The share of replacement
spells done by contract substitute teachers is equal to 6 % for one day absence spells,
against more than 17 % for absence spells lasting 20 days.
There are also large variations in replacement rates across regions (Figure B2).
For example, in the Creteil region (disadvantaged Eastern suburb of Paris), only 6 %
of absence spells are replaced whereas in the Nice region (French Riveria), almost
45 % of absence spells are replaced. The share of absence spells replaced by contract
substitute teachers differs greatly between these two regions. In Creteil in 2015, 51 % of
replacement spells are done by contract teachers, against 33 % of replacement spells in
Nice the same year. This point is important as it shows social inequalities in students’
exposition to contract teachers.
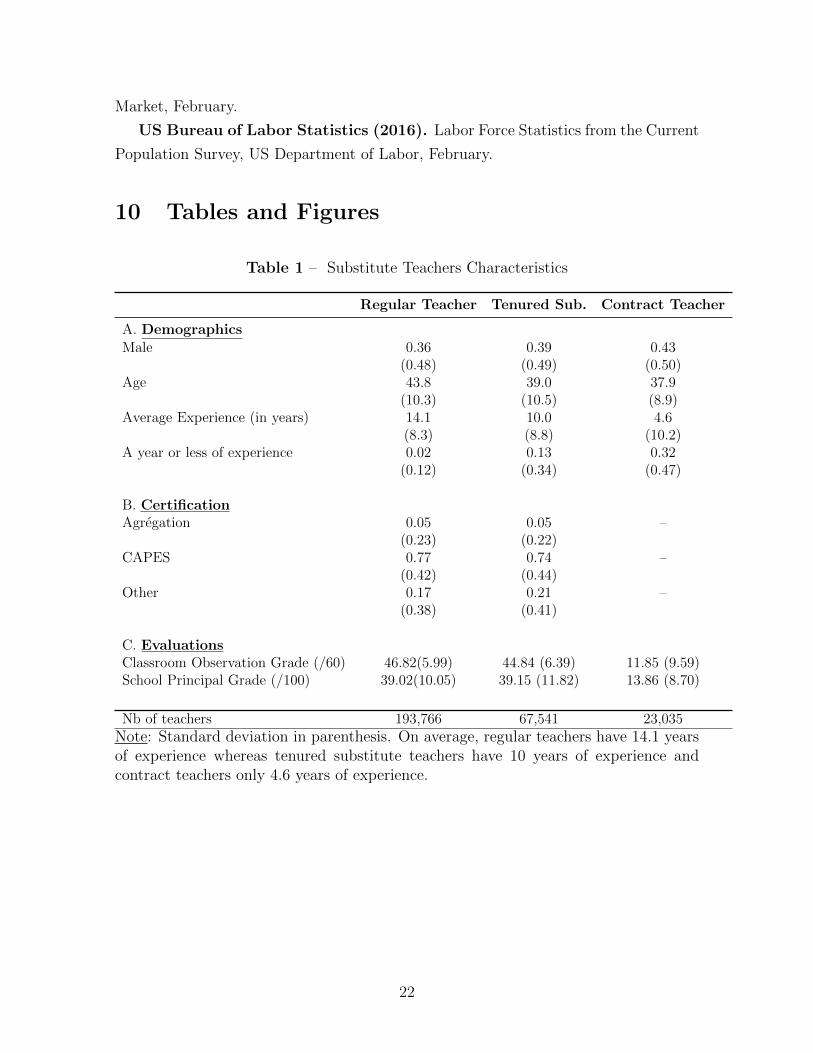
Substitute Teachers Characteristics. Table 1 shows summary statistics on
10
teacher characteristics. Contract teachers are on average less experienced than regular
and tenured substitute teachers: they have on average 4.6 years of experience, whereas
tenured substitute teachers have 10 years of experience and regular teachers 14.1 years.
32 % of contract teachers have a year or less of experience, against 13 % of tenured
substitute teachers and 2 % of regular teachers. Regular teachers and tenured substi-
tute teachers have the same distribution by certification. For both regular and tenured
substitute teachers, Agregation recipients represent 5 % of the population and CAPES
recipients approximately 75 %. By definition, contract teachers are not certified. I
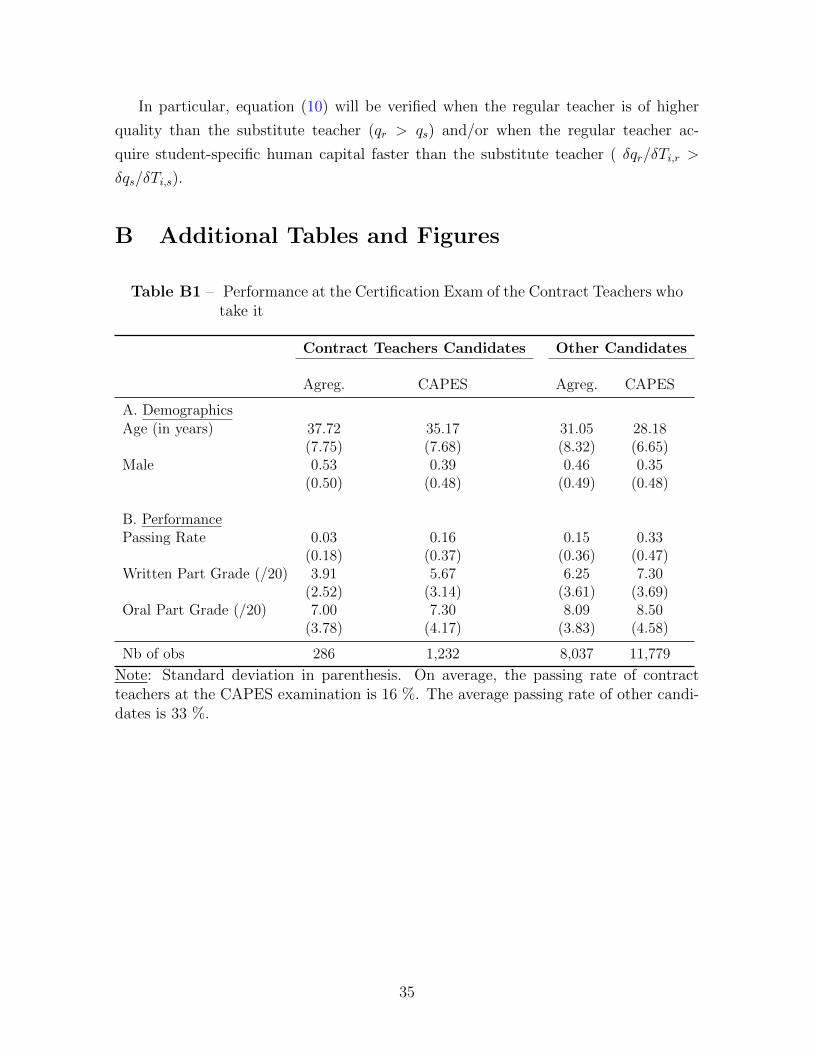
then focus on the subsample of contract teachers who take the same certification ex-
aminations as regular and tenured substitute teachers (Table B1). Candidates who are
contract teachers perform very badly both at Agregation and CAPES. For example,
only 16 % of them pass the CAPES against 33 % of candidates who are not contract
teachers.
5 Empirical Strategy
This section describes the empirical strategy implemented to identify the impact of
absence and substitution on student achievement. I implement a two-way fixed effect
model with teacher-school and classroom fixed effects. I present the main empirical
challenges and how they are addressed by this empirical strategy.
5.1 Empirical Strategy
The main empirical challenge raised by the estimation of the impact of teacher ab-
sence/substitution is the non-random teacher- student matching. As suggested by
Table B2, absences and substitution can be correlated with observed and unobserved
teachers’ characteristics which can have a direct impact on student achievement. This
table confirms results from the literature establishing the statistically significant rela-
tionship between teacher experience, her student socioeconomic background and her
number of days of absence (eg. Ost and Schiman, forthcoming). Futhermore, there is
a statistically significant relationship between teacher substitution and her student so-
cioeconomic background, experience and other teacher characteristics kept equal. Low
quality teachers can be systematically assigned to low achieving students.
To deal with these issues, I implement a two way fixed effect model with teacher and
classroom fixed effects. First, I exploit the longititudinal dimension of the data with
teacher-school fixed effects, which control for both observed and unobserved teacher
11
fixed characteristics (Miller et al., 2008; Herrmann and Rockoff, 2012). Therefore, I
exploit within teacher, across years variations in the number of days of absence and in
the number of replaced days. This source of variation has already been exploited in
the previous studies on the impact of teacher absences on student achievement (Miller,
2008; Herrmann and Rockoff, 2012). However, a major concern for the validity of
this strategy is unobserved variation in student ability, which can impact both teacher
absences and replacement and student test scores. This is why I go a step further and
take advantage of the fact that, in secondary school, teachers are subject-specific and
that students stay with the same peers in the same classroom,throughout the school
year and in every subject. This allows me to also exploit variation within classroom-
year, across subjects. Formally, this model writes:
Yc,s,j,t = Aj,tβ +Rj,tγ + θs + θc + θj + θt + ec,s,j,t (1)
where Yc,s,j,t is the outcome of teacher j ’s students in year t in her subject s with the
students of classroom c. Aj,t is the number of work day absences of all the absence
spells taken by teacher j in year t and Rj,t the number of replaced work days of all
the absence spells taken by teacher j in year t. Finally, θt year fixed-effect to control
for common trends across years, and θj is the teacher-school fixed effects to control
for fixed individual characteristics. Robust standard standard errors are clustered by
school, which is the most conservative level of clusturisation.
5.2 Identification Assumption and Potential Threats to Iden-
tification
The parameters of interests Aj,t and Rj,t are identified under the assumption that varia-
tions within teacher, across years and within classrooom, across subjects in the number
of days of absence/ number of replaced days are not correlated with variations of un-
observed determinants of student achievement. This would include i) within teacher
variations in productivity, such as experience or motivation; ii) student ability or iii)
teachers’ overall working conditions. First, table B2 shows that experience is strongly
correlated with the number of days of absence and replacement. We also know from
the literature that experience is an observable determinant of teacher quality. That
is why I add experience and the square of experience as control variables. A source
of unobservable variations in within teacher quality would be teacher motivation. If,
for example, a teacher were burning out, then her absences would only be a symptom
of poor on-the-job productivity. This point is discussed in the robustness checks with
12
placebo tests in the number of days of absence and replacement. Second, low achieving
students can discourage teachers and raise absences, i.e. there could be reverse causal-
ity. The classroom fixed effect addresses this issue under the assumption that, within
classroom, there is no subject specific matching, i.e. that students relatively worse
in one subject are not systematically assigned to relatively more absent/less replaced
teachers. This issue of reverse causality is also further discussed in the robustness
checks section, with a placebo test of the impact of absence/impact of a teacher in one
subject on her students’ test scores in another subject (i.e. with another teacher). Fi-
nally, in the heterogeneity analysis section, I distinguish between maternity leaves and
other type of absences. Indeed, maternity leave is the reason of absence most likely to
be unrelated to within teacher variations in motivation or burning out, student ability
or working conditions.
Another type of potential threat for identification is more specific to the replacement
parameters. These parameters would not be identified if the type of absence spells that
are replaced were not comparable to those who are not. For example, absences planned
in advance may be more likely to be replaced than absences that are unexpected. In
that case, the impact of replacement may be biased. Teachers who know in advance
they are going to be missing a certain period of time can prepare their absence by giving
guidelines to their substitute, specific homework to their students etc. In particular,
the analysis of the impact of the assignment of tenured substitute teachers or contract
substitute teachers would be biased if tenured substitute teachers where assigned to
different type of absence spells, e.g. of different length, period of the year or reason,
than contract substitute teachers. This is all the more relevant since the summary
statistics (Figure 4) shows that, for absence spells lasting less than 20 days (more than
80 % of the absence spells), the share of replacement spells done by contract teachers
increases with the length of the absence spell. I tackle this issue by performing several
heterogeneity analyzes, in particular by length of absence spell and reason of absence.
More specifically, distinguishing between maternity leaves and other types of absence
can be fruitful because maternity leaves are the absences that are the most likely to
be planned long in advance.
6 Baseline Results
The main results show one additional non-replaced day of absence reduces student
test scores by 0.03 % of a standard deviation. On average, substitute teachers are
unable to have any statistically significant mitigating effect. This average effects masks
13
substantial heterogeneity: tenured substitute teachers are able to mitigate up to 25 % of
this negative effect whereas contract teachers have no statistically significant mitigating
effect.
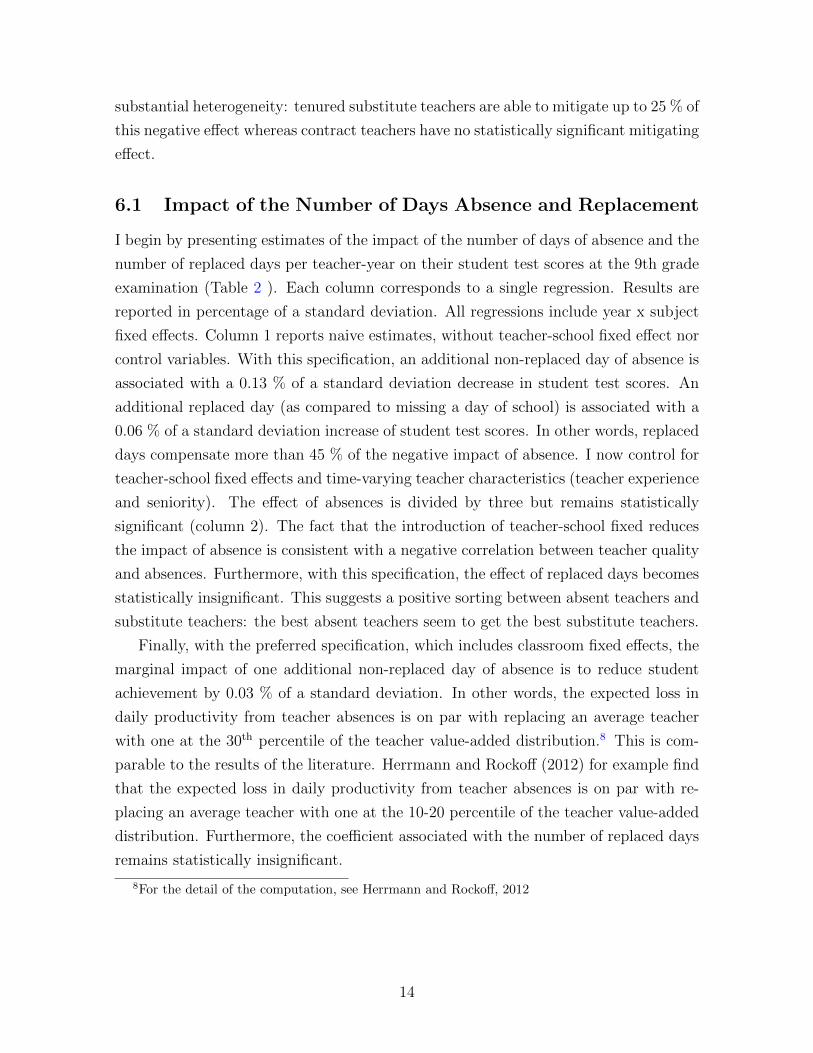
6.1 Impact of the Number of Days Absence and Replacement
I begin by presenting estimates of the impact of the number of days of absence and the
number of replaced days per teacher-year on their student test scores at the 9th grade
examination (Table 2 ). Each column corresponds to a single regression. Results are
reported in percentage of a standard deviation. All regressions include year x subject
fixed effects. Column 1 reports naive estimates, without teacher-school fixed effect nor
control variables. With this specification, an additional non-replaced day of absence is
associated with a 0.13 % of a standard deviation decrease in student test scores. An
additional replaced day (as compared to missing a day of school) is associated with a
0.06 % of a standard deviation increase of student test scores. In other words, replaced
days compensate more than 45 % of the negative impact of absence. I now control for
teacher-school fixed effects and time-varying teacher characteristics (teacher experience
and seniority). The effect of absences is divided by three but remains statistically
significant (column 2). The fact that the introduction of teacher-school fixed reduces
the impact of absence is consistent with a negative correlation between teacher quality
and absences. Furthermore, with this specification, the effect of replaced days becomes
statistically insignificant. This suggests a positive sorting between absent teachers and
substitute teachers: the best absent teachers seem to get the best substitute teachers.
Finally, with the preferred specification, which includes classroom fixed effects, the
marginal impact of one additional non-replaced day of absence is to reduce student
achievement by 0.03 % of a standard deviation. In other words, the expected loss in
daily productivity from teacher absences is on par with replacing an average teacher
with one at the 30th percentile of the teacher value-added distribution.8 This is com-
parable to the results of the literature. Herrmann and Rockoff (2012) for example find
that the expected loss in daily productivity from teacher absences is on par with re-
placing an average teacher with one at the 10-20 percentile of the teacher value-added
distribution. Furthermore, the coefficient associated with the number of replaced days
remains statistically insignificant.
8For the detail of the computation, see Herrmann and Rockoff, 2012
14
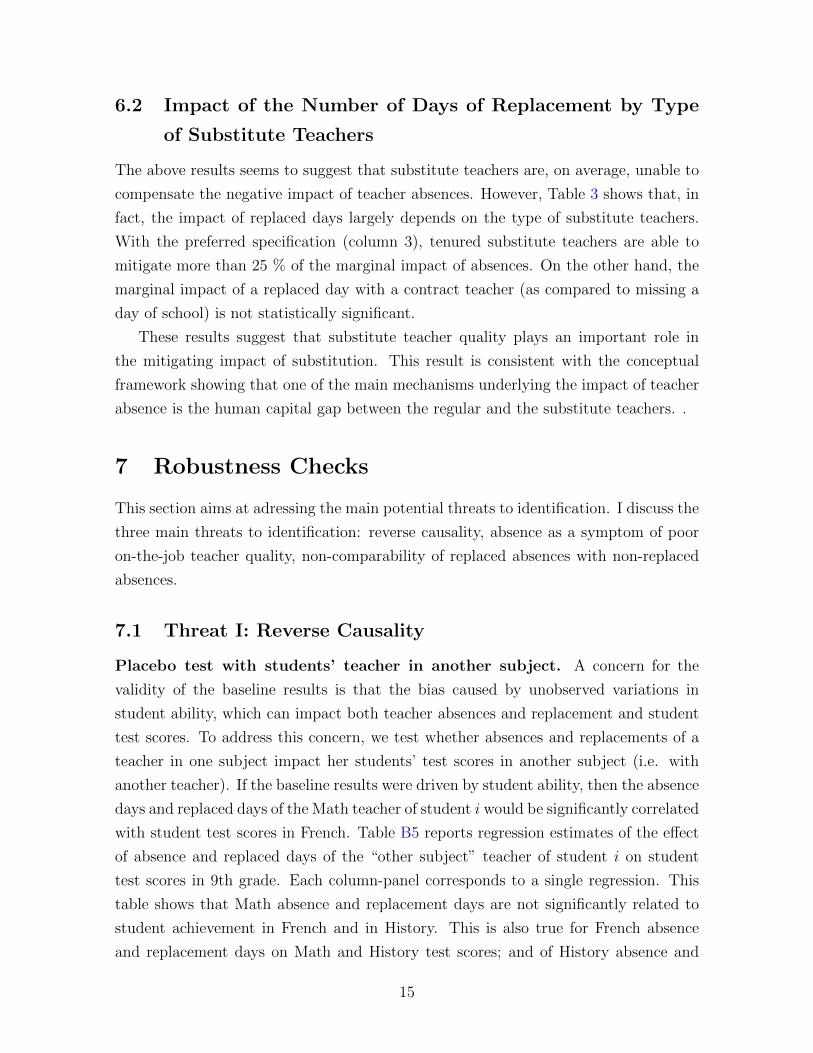
6.2 Impact of the Number of Days of Replacement by Type
of Substitute Teachers
The above results seems to suggest that substitute teachers are, on average, unable to
compensate the negative impact of teacher absences. However, Table 3 shows that, in
fact, the impact of replaced days largely depends on the type of substitute teachers.
With the preferred specification (column 3), tenured substitute teachers are able to
mitigate more than 25 % of the marginal impact of absences. On the other hand, the
marginal impact of a replaced day with a contract teacher (as compared to missing a
day of school) is not statistically significant.
These results suggest that substitute teacher quality plays an important role in
the mitigating impact of substitution. This result is consistent with the conceptual
framework showing that one of the main mechanisms underlying the impact of teacher
absence is the human capital gap between the regular and the substitute teachers. .
7 Robustness Checks
This section aims at adressing the main potential threats to identification. I discuss the
three main threats to identification: reverse causality, absence as a symptom of poor
on-the-job teacher quality, non-comparability of replaced absences with non-replaced
absences.
7.1 Threat I: Reverse Causality
Placebo test with students’ teacher in another subject. A concern for the
validity of the baseline results is that the bias caused by unobserved variations in
student ability, which can impact both teacher absences and replacement and student
test scores. To address this concern, we test whether absences and replacements of a
teacher in one subject impact her students’ test scores in another subject (i.e. with
another teacher). If the baseline results were driven by student ability, then the absence
days and replaced days of the Math teacher of student i would be significantly correlated
with student test scores in French. Table B5 reports regression estimates of the effect
of absence and replaced days of the “other subject” teacher of student i on student
test scores in 9th grade. Each column-panel corresponds to a single regression. This
table shows that Math absence and replacement days are not significantly related to
student achievement in French and in History. This is also true for French absence
and replacement days on Math and History test scores; and of History absence and
15
replacement days on French and Math test scores. Thus, this placebo test gives strong
evidence in favour of the robustness of the baseline results with respect to within
teacher variations in student ability.
7.2 Threat II: Absence as a Symptom of Poor On-the-job
Teacher Quality
Previous and Following Year Absences and Substitution. I also give evidence
against the idea that the baseline results are driven by the fact that absences are only
a symptom of poor on-the-job teacher quality. If, for example, the impact of absence
were only capturing the fact that absent teacher were burning out, then previous and
following absences would have a statistically significant impact. Table B6 reports a
placebo test of the effect of absence and replacement of the previous year ( t− 1) and
following year ( t + 1) of teacher j on student test scores in 9th grade with teacher j
during the year t. Each column corresponds to a different regression. All regressions
correspond to the preferred specification. This table shows absent days and replacement
day of years t− 1 and t+ 1 do not have any statistically significant impact on student
achievement in year t. Therefore, it does not seem that the baseline result are biased
by poor on-the-job teacher performance.
Absences During the Holidays. Teachers who fall sick or pregnant during the
school holidays (days when they do not have class) or during summer time have the
possibility to declare these days in order to have these absence days transferred during
school time 9. These absence spells represent around 1 % of the observations. Half
of them are maternity leaves happening over the summer. Table B3 shows regression
estimates of the marginal impact of one day of absence during holidays. It shows
that these estimates are not statistically significant. Therefore, this suggests that the
baseline estimates are not driven by that the baseline estimates are not driven by the
fact that absence would be a symptom of poor on-the-job teacher quality.
7.3 Threat III: Replaced Absences are not Comparable to
non-replaced Absences
Heterogeneity by Reason of Absence. Table B4 reports regression estimates by
reason of absence. This table corresponds to a single regression. I make the distinction
between absence spells for maternity leave and non maternity leave absence spells. As
9Source: https://www.service-public.fr/particuliers/vosdroits/F2481
16
discussed in the empirical strategy, the reason for this distinction is that maternity
leave absence spells are those less likely to be determined by within teacher variations
in teacher quality, student ability or working conditions. Furthermore, maternity leaves
are the type of absence the most likely to be planned long in advance. We observe that
the marginal impact of absence for maternity leave is to reduce student test scores
by 0.05 % of a standard deviation. The impact of absence for non maternity leave
absences is similar. The impact of replacement by a tenured substitute teacher, for
both maternity leave and non maternity leave absences, is to mitigate 30 - 35 % of
the negative impact of absence. The fact that estimates for maternity leave absence
spells and non maternity absence spells are very similar gives strong support for the
robustness of the baseline results.
8 Heterogeneity Analysis
Having established the impact of teacher absence and substitution affects on student
achievement, I then estimate heterogeneity across teachers, absence spells and school
characteristics. This heterogeneity analysis aims at shedding light on the mechanisms
underlying the main results and giving suggestive evidence on the conceptual frame-
work’s predictions.
8.1 Heterogeneity by Subject
According to the conceptual framework, the main channel through which non-replaced
days impact student achievement is the loss in instructional time. In this framework,
the higher the regular teacher productivity, the bigger the impact of loss of instructional
time and thus the bigger the impact of non-replaced days.
I investigate this mechanism by leveraging the research design to estimate hetero-
geneity across teaching subject. It is well established in the literature that teacher
productivity varies greatly by subject. In particular Math teachers value-added is
higher than in other subjects (see Chetty et al., 2014 for the latest evidence). There-
fore, according to the conceptual framework, the negative impact of non-replaced days
in Math should be higher than in the other two subjects.
Figure 5 reports regression estimates by teaching subject. The marginal impact of
one additional day of non-replaced absence in Math is to reduce student achievement
by 0.08 % of a standard deviation. In French and History, this impact is equal to
0.04 % of a standard deviation. The fact that absences have a larger impact in Math
17
than in other subjects is consistent with the literature (Miller et al., 2008; Herrmann
and Rockoff, 2012). This result is consistent with the intuition that the higher the
teacher value-added, the higher the impact of absence.
8.2 Heterogeneity by the Experience Gap between the Sub-
stitute and the Regular Teacher
Another major prediction of the conceptual framework is that the mitigating effect of
substitution depends on the general human capital gap between the regular and the
substitute teachers. I use teacher experience as a measure of general human capital be-
cause the link between teacher experience and teacher productivity is well established
in the literature (see Koedel et al., 2015 for a review). According to the concep-
tual framework, the larger the experience gap between the regular and the substitute
teacher, the smaller the mitigitating impact of substitution.
Table 4 reports estimates from interacting the number replaced days by each type
of substitute teachers and the experience gap between the regular and the substitute
teachers. It mainly shows that the mitigating effect of tenured substitution is not
significantly impacted by the experience gap, suggesting the existence of other mecha-
nisms.
8.3 Heterogeneity by Month of the School Year
The last mechanism I explore is the role of the student-specific human capital gap
between the regular and the substitute teachers. According to this framework, the
larger this gap, the bigger the impact of absence. I analyse the impact of non-replaced
days by month of absence spell to provide suggestive evidence on this mechanism.
The intuition is that the student-specific human capital gap between the regular and
substitute teachers is larger in the end of the school year than in the beginning: in
September, both regular and substitute teachers have limited knowledge of students
and the classroom dynamics, but as the regular teacher interacts more and more with
her students, she gains more and more specific human capital.
Figure 6 reports estimates of the impact of the number of days/substitution by
month of the beginning of the absence spell. The three graphs correspond to a single
regression with the preferred specification. The graph 6a shows the seasonality of
the marginal impact of absence (controlling for the number of replaced days with
tenured substitute and contract substitute). The marginal impact of absence starting
in September is not statistically significant at the five percent level. Between October
18
and January, the marginal impact of absence on student test scores is equal to -0.06/-
0.08 percent of a standard deviation and is statistically significant at the five percent
level. It then drops to -0.10/ - 0.11 percent of a standard deviation in February and
March. The marginal impact of absence is the most negative in June when it reaches a
-0.12 percent of a standard deviation. Thus, this graph shows a trend of the impact of
non-replaced days getting larger as the school year goes by. The graph 6b, which shows
the marginal impact of one replaced day with a tenured substitute teacher, confirms
this trend.
Overall, these results are consistent with the the existence of a student-specific
human capital gap mechanism.
9 Conclusion
Using a unique French administrative dataset matching, for each absence spell, each
missing secondary school teacher to her substitute teacher, this paper (a) estimates
the effect of teacher absence on student test achievement; (b) studies how the effect
of teacher absence can be mitigated through the assignment and quality of substitute
teachers.I find that the expected loss in daily productivity from teacher absences on
student test scores is on par with replacing an average teacher with one at the 30th
percentile of the teacher value-added distribution. Tenured substitute teachers are
able to compensate 25 % of this negative impact, while contract substitute teachers
do not have a statistically significant impact. I also provide suggestive evidence on the
possible channels, including the gap in general and specific human capital between the
regular and the substitute teachers.
This paper has major implications for public policy. It shows that contract teachers
are unable to significantly mitigate the negative impact of absence, whereas tenured
substitute teachers seem to do a decent job. This is a source of inefficiency as contract
teachers represent, overall, an ever growing share of the teaching workforce. It is also
a source of educational inequality as substitution spells ensured by contract teachers
are concentrated in disadvantaged areas.
References
Abadzi, H. (2009). Instructional Time Loss in Developing Countries: Concepts,
Measurement, and Implications, World Bank.
19
Altonji, J. G., and Williams, N. (2005). Do Wages Rise with Job Seniority
? A Reassessment. ILR Review, 58(3), 370-397.
Chetty, R., Friedman, J.N. and Rockoff, J.E. (2014a). Measuring the Im-
pact of Teachers I: Evaluating Bias in Teacher Value-Added Estimates. The American
Economic Review, 104(9), pp.2593-2632.
Chetty, R., Friedman, J.N. and Rockoff, J.E.(2014b). Measuring the Im-
pact of Teachers II: Teacher Value-Added and Student Outcomes in Adulthood. The
American Economic Review, 104(9), pp.2633-2679.
Clotfelter, C. T., H. F. Ladd, and Vigdor J.L. (2009). Are Teacher Absences
Worth Worrying about in the US? Education Finance and Policy, 4, 115-149.
Combes J., Tercieux O. and Terrier C. (2016). The Design of Teacher
Assignment: Theory and Evidence, Working Paper, Paris School of Economics.
DARES (2013). Les absences au travail des salaries pour raisons de sante : un
role important des conditions de travail, Dares analyses, fevrier.
Dee T. and Goldhaber D.(2017). Understanding and Addressing Teacher
Shortages in the United States, The Hamilton Project, April.
DEPP(2015). Les enseignants non-titulaires du second degre public, Note d’information,
Direction de l’evaluation, de la prospective et de la performance, ministere de l’Education
nationale.
Duflo, E., Dupas, P., Kremer, M., (2011). Peer Effects, Teacher Incentives,
and the Impact of Tracking. The American Economic Review, 101(5).
Duflo, E., Hanna, R. and Ryan, S.P. (2012). Incentives work: Getting teach-
ers to come to school. The American Economic Review, 102(4), pp.1241-1278.
Gathmann, C., and Schonberg, U. (2010). How General is Human Capital ?
A Task-Based Approach. Journal of Labor Economics, 28(1), 1-49.
Gershenson, S. (2012). How do Substitute Teachers Substitute? An Empirical
Study of Substitute-Teacher Labor Supply. Economics of Education Review, 31(4),
410-430.
Hensvik, L. and Rosenqvist, O. (2016). The Strength of the Weakest Link:
Sickness Absence, Internal Substitution and Worker-Firm Matching, Working Paper,
Uppsala University.
Herrmann M. and Rockoff J.E (2012). Worker Absence and Productivity:
Evidence from Teaching, Journal of Labor Economics, 30(4), 749-782
IGAENR (2015). Les mouvements academiques et departementaux comme outils
de gestion des ressources humaines, Rapport 2015-025, Inspection generale de l’administration
de l’Education nationale et de la recherche.
20
Koedel, C., Mihaly, K., and Rockoff, J. E. (2015). Value-Added Modeling:
A Review. Economics of Education Review, 47, 180-195.
Jacobson, L.S., LaLonde, R.J. and Sullivan, D.G.(1993). Earnings losses
of displaced workers. The American Economic Review, pp.685-709.
Jackson, C. K. (2017) . What Do Test Scores Miss? The Importance of Teacher
Effects on Non-Test-Score Outcomes. Journal of Political Economy, Forthcoming.
Jager S.(2016). How Substitutable Are Workers? Evidence from Worker Deaths,
Working Paper, Harvard University.
Lavy, V. (2015). Do Differences in Schools’ Instruction Time Explain Interna-
tional Achievement Gaps? Evidence from Developed and Developing Countries, The
Economic Journal, 125(588), F397-F424.
Lazear E., Oyer P. (2012). Personnel Economics, The Handbook of Organiza-
tional Economics. Princeton University Press, 479-519.
Miller, R.T., Murnane, R.J. and Willett, J.B.(2008). Do worker absences
affect productivity? The case of teachers. International Labour Review, 147(1), pp.71-
89.
Ost, B. (2014). How do Teachers Improve? The Relative Importance of Specific
and General Human Capital. American Economic Journal. Applied Economics, 6(2),
p.127.
Ost, B. and Schiman J.(2017). Workload and Teacher Absence. Economics of
Education Review (Forthcoming)
Pope N.,G. and Petek N. (2017). The Multidimensional Impact of Teachers
on Student Outcomes, Working Paper.
Pischke, J.S. (2007). The Impact of Length of the School Year on Student Per-
formance and Earnings: Evidence from the German Short School Years. The Economic
Journal, 117(523),1216-1242.
Rivkin, S.G., Hanushek, E.A. and Kain, J.F.(2005). Teachers, Schools, and
Academic Achievement, Econometrica, 73(2), pp.417-458.
Rockoff, J.E.(2004). The Impact of Individual Teachers on Student Achievement:
Evidence from Panel Data.The American Economic Review, 94(2), pp.247-252.
Stole, L., and Zwiebel, J. (1996). Organizational Design and Technology
Choice under Intrafirm Bargaining.The American Economic Review, 86(1), 195-222.
Todd, P., and Wolpin, K. (2003). On the Specification and Estimation of the
Production Function for Cognitive Achievement. The Economic Journal, 113(485),
F3-F33.
UK Office for National Statistics (2014). Sickness Absence in the Labour
21
Market, February.
US Bureau of Labor Statistics (2016). Labor Force Statistics from the Current
Population Survey, US Department of Labor, February.
10 Tables and Figures
Table 1 – Substitute Teachers Characteristics
Regular Teacher Tenured Sub. Contract Teacher
A. DemographicsMale 0.36 0.39 0.43
(0.48) (0.49) (0.50)Age 43.8 39.0 37.9
(10.3) (10.5) (8.9)Average Experience (in years) 14.1 10.0 4.6
(8.3) (8.8) (10.2)A year or less of experience 0.02 0.13 0.32
(0.12) (0.34) (0.47)
B. CertificationAgregation 0.05 0.05 –
(0.23) (0.22)CAPES 0.77 0.74 –
(0.42) (0.44)Other 0.17 0.21 –
(0.38) (0.41)
C. EvaluationsClassroom Observation Grade (/60) 46.82(5.99) 44.84 (6.39) 11.85 (9.59)School Principal Grade (/100) 39.02(10.05) 39.15 (11.82) 13.86 (8.70)
Nb of teachers 193,766 67,541 23,035Note: Standard deviation in parenthesis. On average, regular teachers have 14.1 yearsof experience whereas tenured substitute teachers have 10 years of experience andcontract teachers only 4.6 years of experience.
22
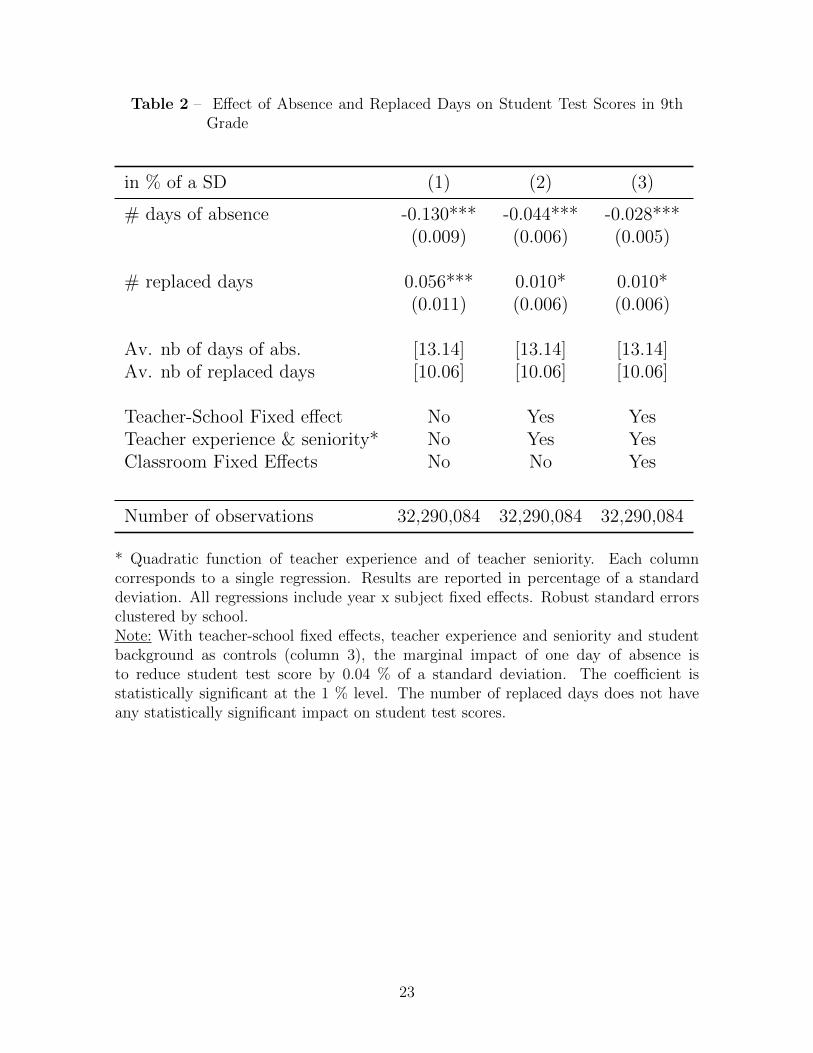
Table 2 – Effect of Absence and Replaced Days on Student Test Scores in 9thGrade
in % of a SD (1) (2) (3)
# days of absence -0.130*** -0.044*** -0.028***(0.009) (0.006) (0.005)
# replaced days 0.056*** 0.010* 0.010*(0.011) (0.006) (0.006)
Av. nb of days of abs. [13.14] [13.14] [13.14]Av. nb of replaced days [10.06] [10.06] [10.06]
Teacher-School Fixed effect No Yes YesTeacher experience & seniority* No Yes YesClassroom Fixed Effects No No Yes
Number of observations 32,290,084 32,290,084 32,290,084
* Quadratic function of teacher experience and of teacher seniority. Each columncorresponds to a single regression. Results are reported in percentage of a standarddeviation. All regressions include year x subject fixed effects. Robust standard errorsclustered by school.Note: With teacher-school fixed effects, teacher experience and seniority and studentbackground as controls (column 3), the marginal impact of one day of absence isto reduce student test score by 0.04 % of a standard deviation. The coefficient isstatistically significant at the 1 % level. The number of replaced days does not haveany statistically significant impact on student test scores.
23
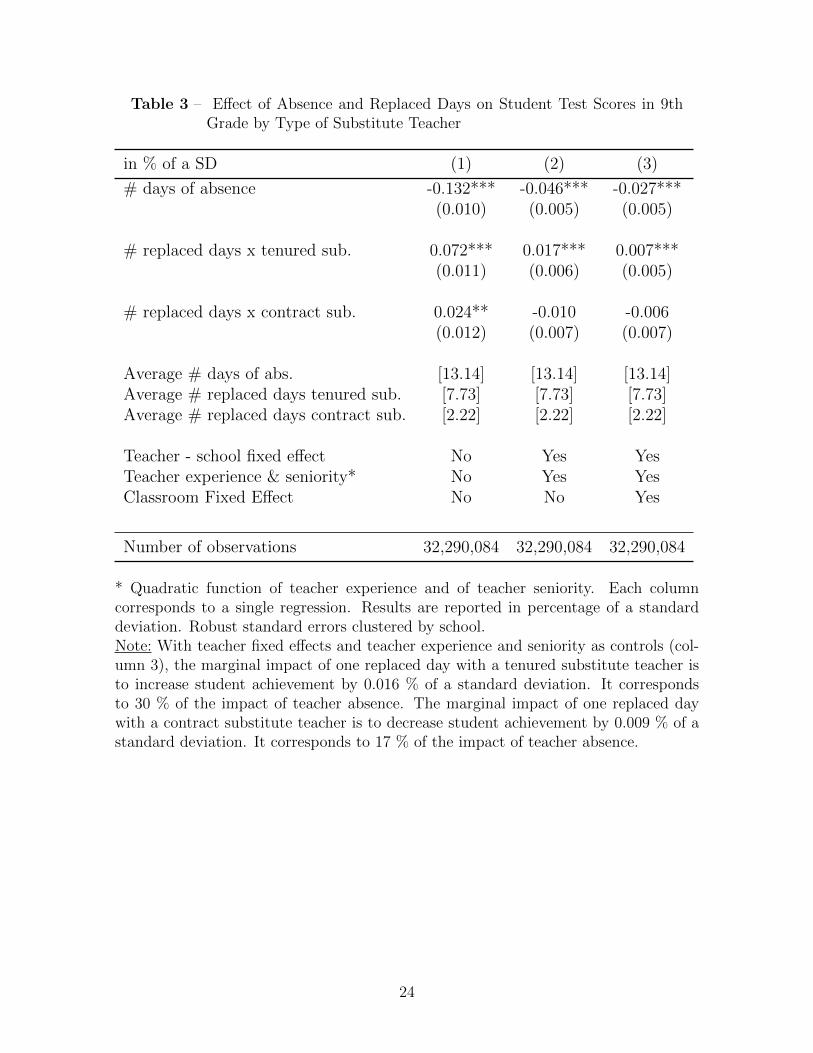
Table 3 – Effect of Absence and Replaced Days on Student Test Scores in 9thGrade by Type of Substitute Teacher
in % of a SD (1) (2) (3)
# days of absence -0.132*** -0.046*** -0.027***(0.010) (0.005) (0.005)
# replaced days x tenured sub. 0.072*** 0.017*** 0.007***(0.011) (0.006) (0.005)
# replaced days x contract sub. 0.024** -0.010 -0.006(0.012) (0.007) (0.007)
Average # days of abs. [13.14] [13.14] [13.14]Average # replaced days tenured sub. [7.73] [7.73] [7.73]Average # replaced days contract sub. [2.22] [2.22] [2.22]
Teacher - school fixed effect No Yes YesTeacher experience & seniority* No Yes YesClassroom Fixed Effect No No Yes
Number of observations 32,290,084 32,290,084 32,290,084
* Quadratic function of teacher experience and of teacher seniority. Each columncorresponds to a single regression. Results are reported in percentage of a standarddeviation. Robust standard errors clustered by school.Note: With teacher fixed effects and teacher experience and seniority as controls (col-umn 3), the marginal impact of one replaced day with a tenured substitute teacher isto increase student achievement by 0.016 % of a standard deviation. It correspondsto 30 % of the impact of teacher absence. The marginal impact of one replaced daywith a contract substitute teacher is to decrease student achievement by 0.009 % of astandard deviation. It corresponds to 17 % of the impact of teacher absence.
24
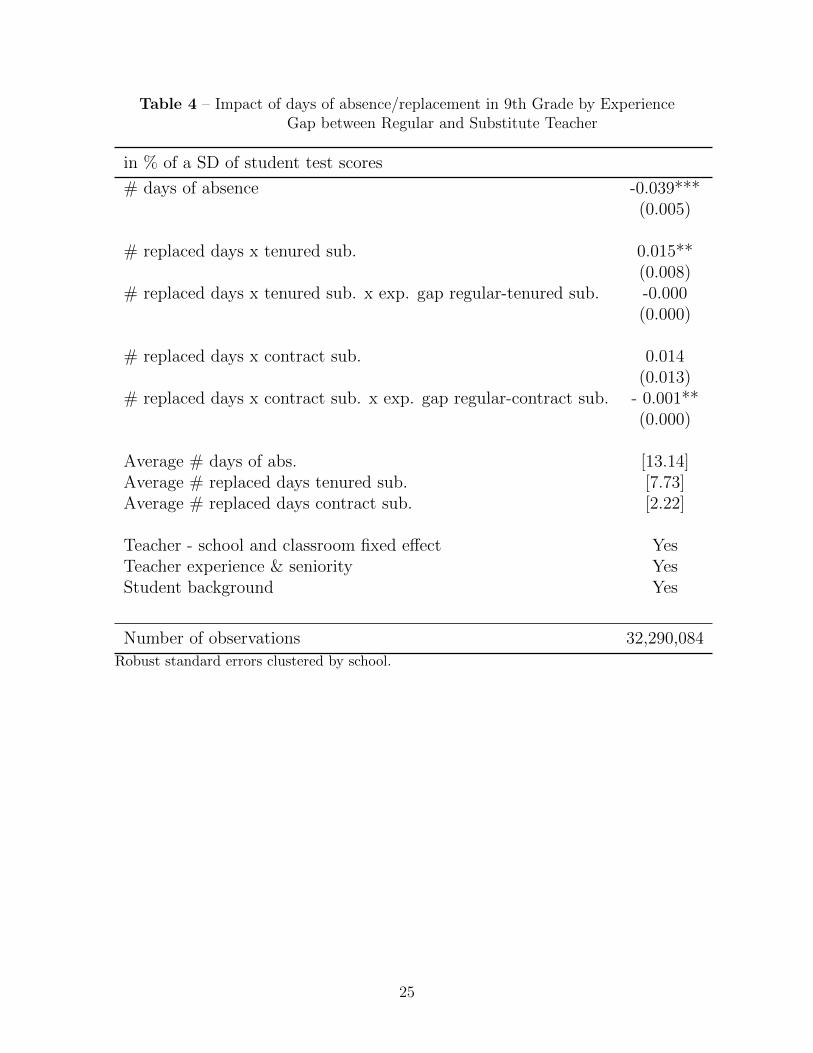
Table 4 – Impact of days of absence/replacement in 9th Grade by ExperienceGap between Regular and Substitute Teacher
in % of a SD of student test scores
# days of absence -0.039***(0.005)
# replaced days x tenured sub. 0.015**(0.008)
# replaced days x tenured sub. x exp. gap regular-tenured sub. -0.000(0.000)
# replaced days x contract sub. 0.014(0.013)
# replaced days x contract sub. x exp. gap regular-contract sub. - 0.001**(0.000)
Average # days of abs. [13.14]Average # replaced days tenured sub. [7.73]Average # replaced days contract sub. [2.22]
Teacher - school and classroom fixed effect YesTeacher experience & seniority YesStudent background Yes
Number of observations 32,290,084
Robust standard errors clustered by school.
25
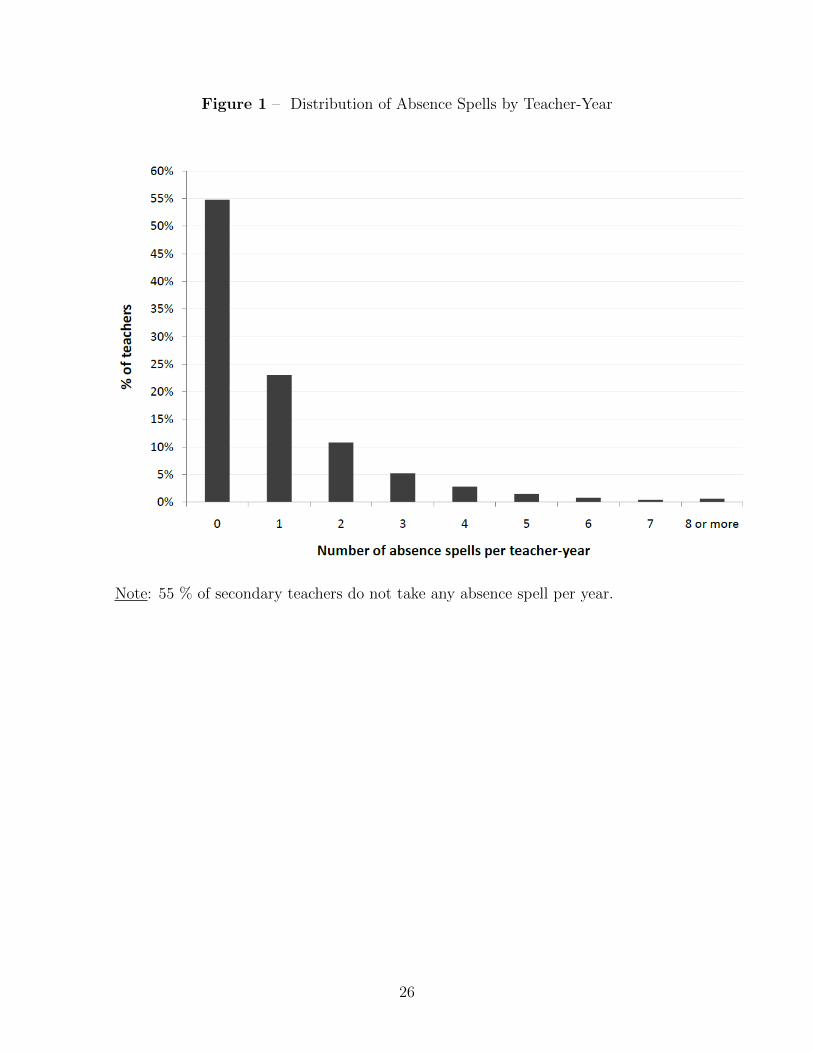
Figure 1 – Distribution of Absence Spells by Teacher-Year
Note: 55 % of secondary teachers do not take any absence spell per year.
26
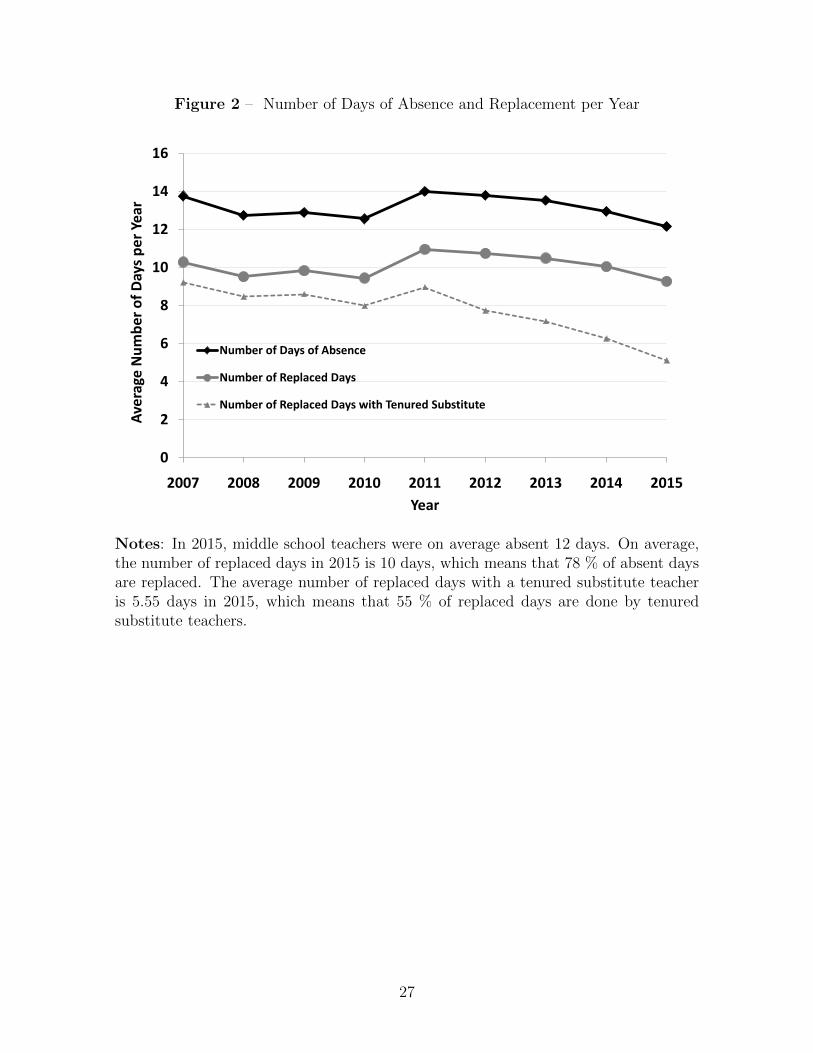
Figure 2 – Number of Days of Absence and Replacement per Year
0
2
4
6
8
10
12
14
16
2007 2008 2009 2010 2011 2012 2013 2014 2015
Aver
age
Num
ber o
f Day
s per
Yea
r
Year
Number of Days of Absence
Number of Replaced Days
Number of Replaced Days with Tenured Substitute
Notes: In 2015, middle school teachers were on average absent 12 days. On average,the number of replaced days in 2015 is 10 days, which means that 78 % of absent daysare replaced. The average number of replaced days with a tenured substitute teacheris 5.55 days in 2015, which means that 55 % of replaced days are done by tenuredsubstitute teachers.
27
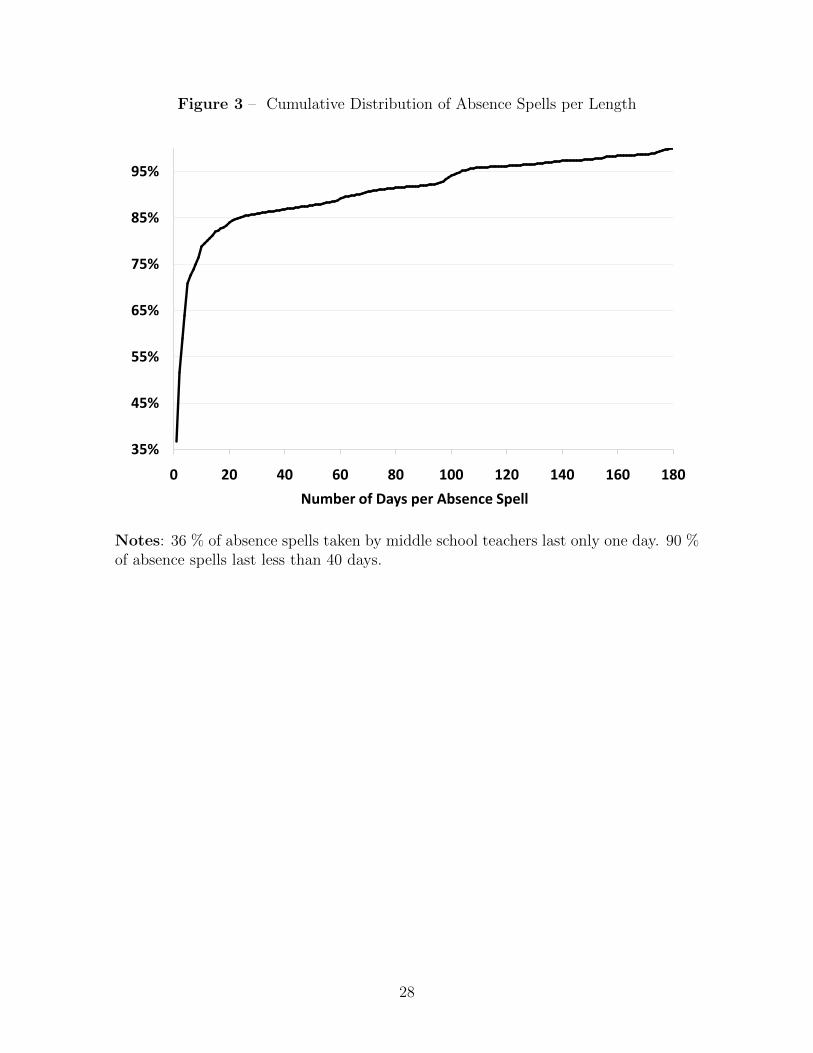
Figure 3 – Cumulative Distribution of Absence Spells per Length
35%
45%
55%
65%
75%
85%
95%
0 20 40 60 80 100 120 140 160 180Number of Days per Absence Spell
Notes: 36 % of absence spells taken by middle school teachers last only one day. 90 %of absence spells last less than 40 days.
28
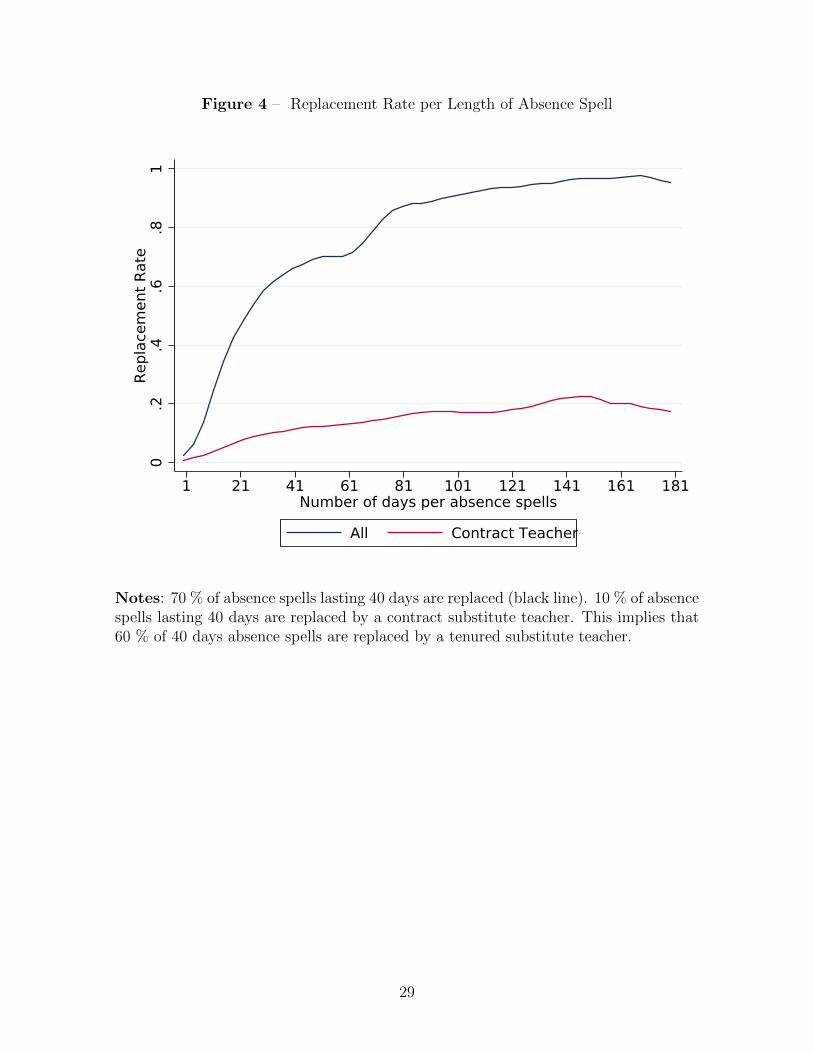
Figure 4 – Replacement Rate per Length of Absence Spell
0.2
.4.6
.81
Rep
lace
ment
Rate
1 21 41 61 81 101 121 141 161 181Number of days per absence spells
All Contract Teacher
Notes: 70 % of absence spells lasting 40 days are replaced (black line). 10 % of absencespells lasting 40 days are replaced by a contract substitute teacher. This implies that60 % of 40 days absence spells are replaced by a tenured substitute teacher.
29
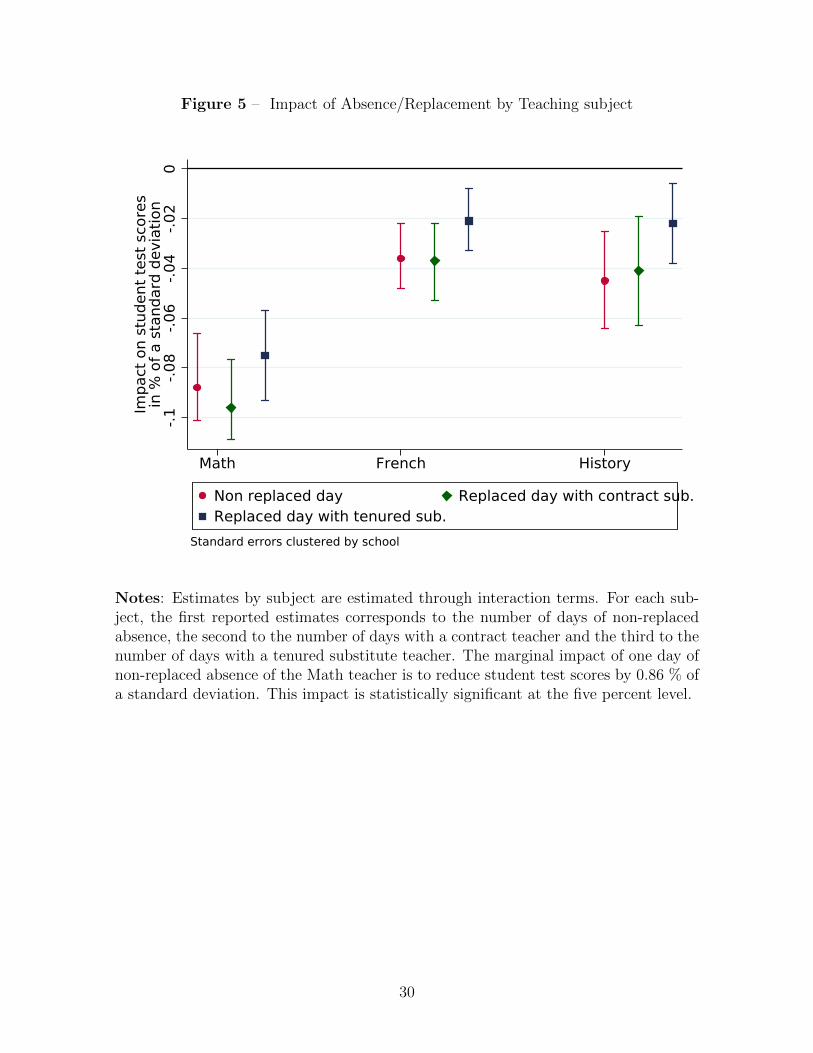
Figure 5 – Impact of Absence/Replacement by Teaching subject
-.1
-.0
8-.
06
-.0
4-.
02
0
Imp
act
on s
tud
ent
test
sco
res
in %
of
a s
tand
ard
devia
tion
Math French History
Non replaced day Replaced day with contract sub.Replaced day with tenured sub.
Standard errors clustered by school
Notes: Estimates by subject are estimated through interaction terms. For each sub-ject, the first reported estimates corresponds to the number of days of non-replacedabsence, the second to the number of days with a contract teacher and the third to thenumber of days with a tenured substitute teacher. The marginal impact of one day ofnon-replaced absence of the Math teacher is to reduce student test scores by 0.86 % ofa standard deviation. This impact is statistically significant at the five percent level.
30
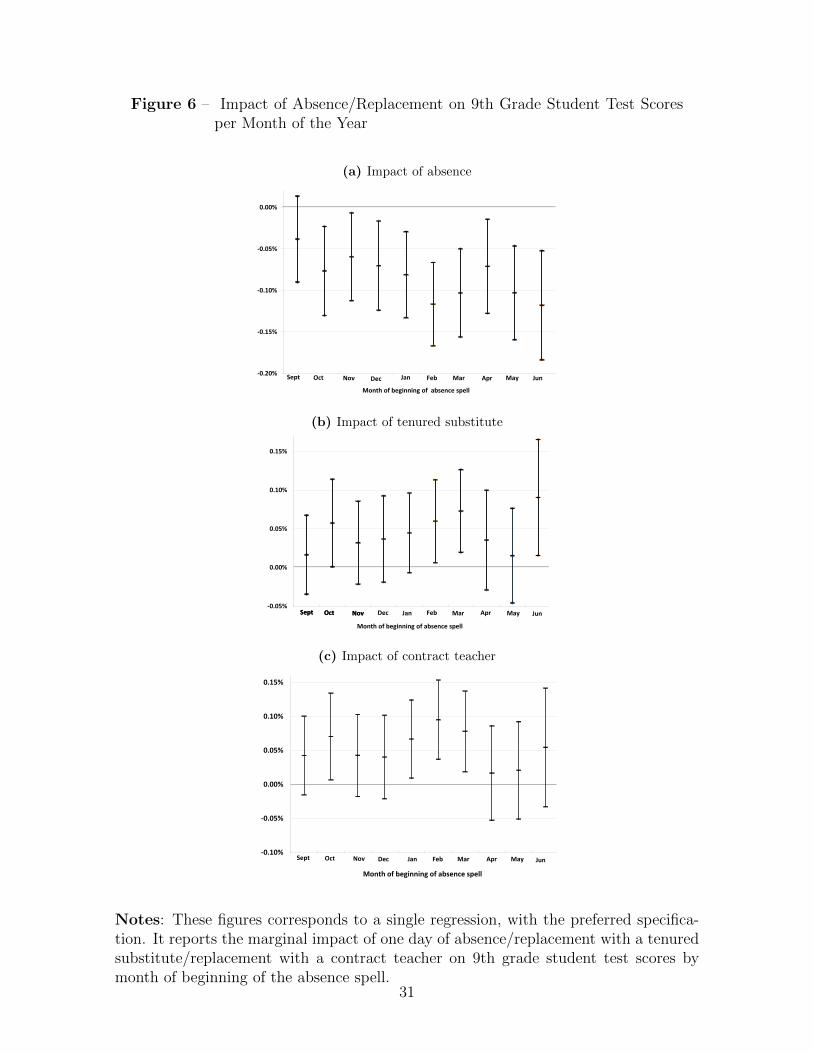
Figure 6 – Impact of Absence/Replacement on 9th Grade Student Test Scoresper Month of the Year
(a) Impact of absence
-0.20%
-0.15%
-0.10%
-0.05%
0.00%
Month of beginning of absence spell
Sept Oct Nov Dec Jan Feb Mar Apr May Jun
(b) Impact of tenured substitute
-0.05%
0.00%
0.05%
0.10%
0.15%
Month of beginning of absence spell
Sept Oct NovSept Oct Nov Dec Jan Feb Mar Apr May Jun
(c) Impact of contract teacher
-0.10%
-0.05%
0.00%
0.05%
0.10%
0.15%
Month of beginning of absence spell
Sept Oct Nov Dec Jan Feb Mar Apr May Jun
Notes: These figures corresponds to a single regression, with the preferred specifica-tion. It reports the marginal impact of one day of absence/replacement with a tenuredsubstitute/replacement with a contract teacher on 9th grade student test scores bymonth of beginning of the absence spell.
31
Appendix
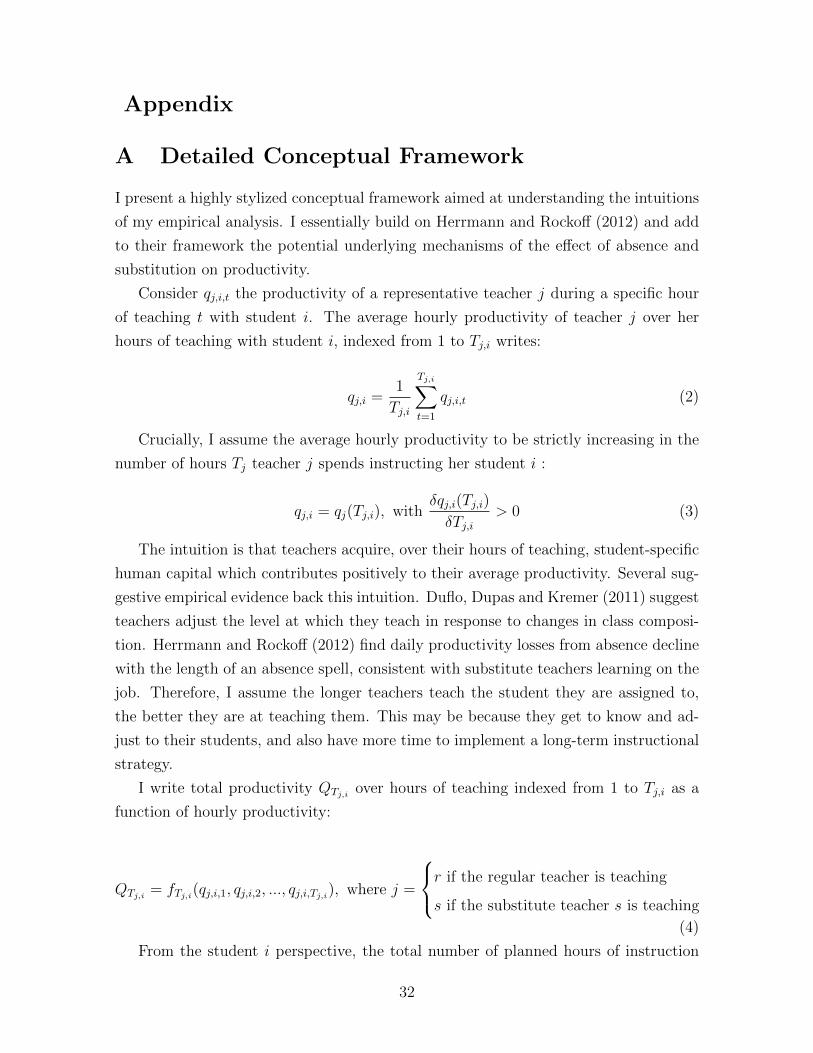
A Detailed Conceptual Framework
I present a highly stylized conceptual framework aimed at understanding the intuitions
of my empirical analysis. I essentially build on Herrmann and Rockoff (2012) and add
to their framework the potential underlying mechanisms of the effect of absence and
substitution on productivity.
Consider qj,i,t the productivity of a representative teacher j during a specific hour
of teaching t with student i. The average hourly productivity of teacher j over her
hours of teaching with student i, indexed from 1 to Tj,i writes:
qj,i =1
Tj,i
Tj,i∑t=1
qj,i,t (2)
Crucially, I assume the average hourly productivity to be strictly increasing in the
number of hours Tj teacher j spends instructing her student i :
qj,i = qj(Tj,i), withδqj,i(Tj,i)
δTj,i> 0 (3)
The intuition is that teachers acquire, over their hours of teaching, student-specific
human capital which contributes positively to their average productivity. Several sug-
gestive empirical evidence back this intuition. Duflo, Dupas and Kremer (2011) suggest
teachers adjust the level at which they teach in response to changes in class composi-
tion. Herrmann and Rockoff (2012) find daily productivity losses from absence decline
with the length of an absence spell, consistent with substitute teachers learning on the
job. Therefore, I assume the longer teachers teach the student they are assigned to,
the better they are at teaching them. This may be because they get to know and ad-
just to their students, and also have more time to implement a long-term instructional
strategy.
I write total productivity QTj,i over hours of teaching indexed from 1 to Tj,i as a
function of hourly productivity:
QTj,i = fTj,i(qj,i,1, qj,i,2, ..., qj,i,Tj,i), where j =
r if the regular teacher is teaching
s if the substitute teacher s is teaching
(4)
From the student i perspective, the total number of planned hours of instruction
32
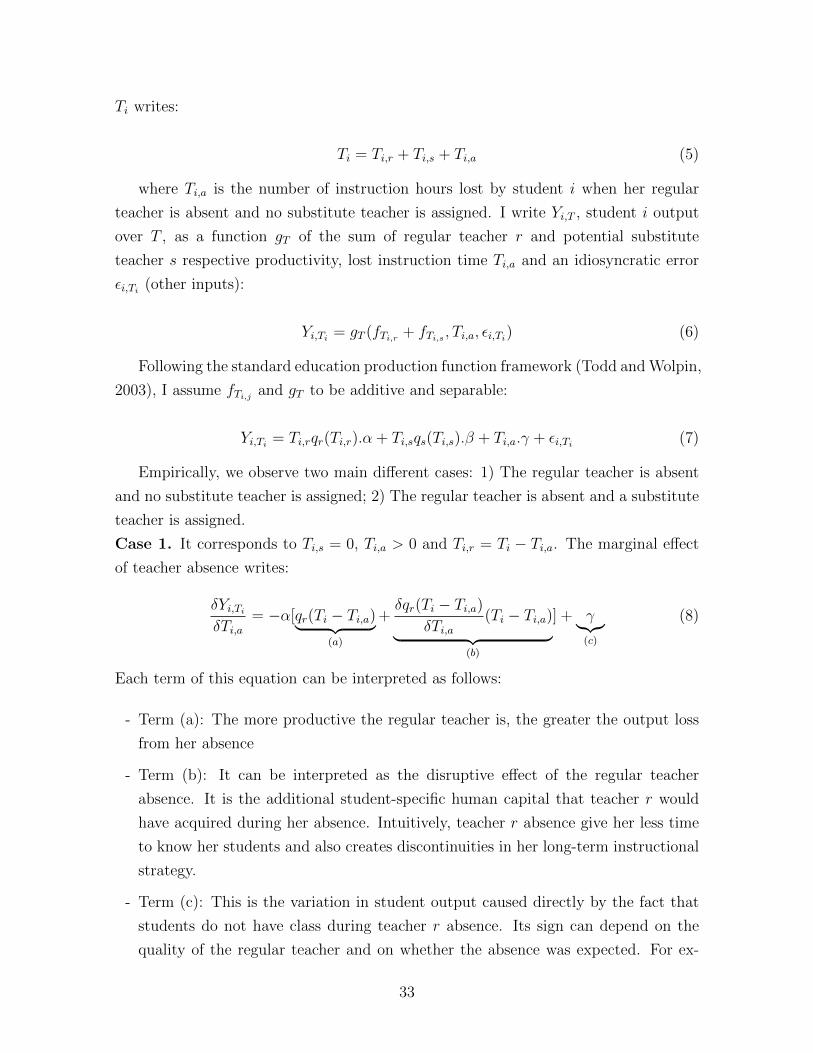
Ti writes:
Ti = Ti,r + Ti,s + Ti,a (5)
where Ti,a is the number of instruction hours lost by student i when her regular
teacher is absent and no substitute teacher is assigned. I write Yi,T , student i output
over T , as a function gT of the sum of regular teacher r and potential substitute
teacher s respective productivity, lost instruction time Ti,a and an idiosyncratic error
εi,Ti (other inputs):
Yi,Ti = gT (fTi,r + fTi,s , Ti,a, εi,Ti) (6)
Following the standard education production function framework (Todd and Wolpin,
2003), I assume fTi,j and gT to be additive and separable:
Yi,Ti = Ti,rqr(Ti,r).α + Ti,sqs(Ti,s).β + Ti,a.γ + εi,Ti (7)
Empirically, we observe two main different cases: 1) The regular teacher is absent
and no substitute teacher is assigned; 2) The regular teacher is absent and a substitute
teacher is assigned.
Case 1. It corresponds to Ti,s = 0, Ti,a > 0 and Ti,r = Ti − Ti,a. The marginal effect
of teacher absence writes:
δYi,TiδTi,a
= −α[qr(Ti − Ti,a)︸ ︷︷ ︸(a)
+δqr(Ti − Ti,a)
δTi,a(Ti − Ti,a)︸ ︷︷ ︸
(b)
] + γ︸︷︷︸(c)
(8)
Each term of this equation can be interpreted as follows:
- Term (a): The more productive the regular teacher is, the greater the output loss
from her absence
- Term (b): It can be interpreted as the disruptive effect of the regular teacher
absence. It is the additional student-specific human capital that teacher r would
have acquired during her absence. Intuitively, teacher r absence give her less time
to know her students and also creates discontinuities in her long-term instructional
strategy.
- Term (c): This is the variation in student output caused directly by the fact that
students do not have class during teacher r absence. Its sign can depend on the
quality of the regular teacher and on whether the absence was expected. For ex-
33
ample, if the absence was expected and the regular teacher is forward-looking, she
can give them extra homework: they have material to study during her absence,
which can mitigate the negative impact of her absence. The sign of this term can
also depend on the quality of the school environment outside the classroom. More
precisely, it can depend on the amount and the quality of adult supervision out-
side the classroom, in the school and its premises. For example, if students are
left without sufficient adult supervision during the hours teacher r is absent, they
can adopt negative non-cognitive behavior (bullying, fighting, smoking drugs etc.),
which can exacerbate the negative impact of teacher absence (Burdick-Will, 2013;
Lacoe, 2013). The quality of the school environment depends on the quality of the
school principal, and on the number and quality of hall monitors.
Overall, in case 1, the marginal effect of teacher absence will be negative unless
γ > α[qr(Ti−Ti,a) +δqr(Ti−Ti,a)
δTi,a(Ti−Ti,a)], i.e. unless students use their lost instruction
hours so efficiently that these hours are more productive than the instruction hours
they would have had with their missing regular teacher.
Case 2. It corresponds to Ti,s > 0, Ti,a = 0 and Ti,r = Ti − Ti,s. The marginal effect
of teacher absence writes:
δYi,TiδTi,s
= −α[qr(Ti − Ti,s)︸ ︷︷ ︸(d)
+δqr(Ti − Ti,s)
δTi,s(Ti − Ti,s)︸ ︷︷ ︸
(e)
] + β[qs(Ti,s)︸ ︷︷ ︸(f)
+Ti,sδqs(Ti,s)
δTi,s︸ ︷︷ ︸(g)
] (9)
The terms (d) and (e) have similar interpretations as (a) and (b) in case 1, the
other terms can be interpreted as follows:
- Term (f): The more productive the substitute teacher, the smaller the negative
effect of teacher r absence
- Term (g): This is the additional student-specific human capital acquired by the
substitute teacher.
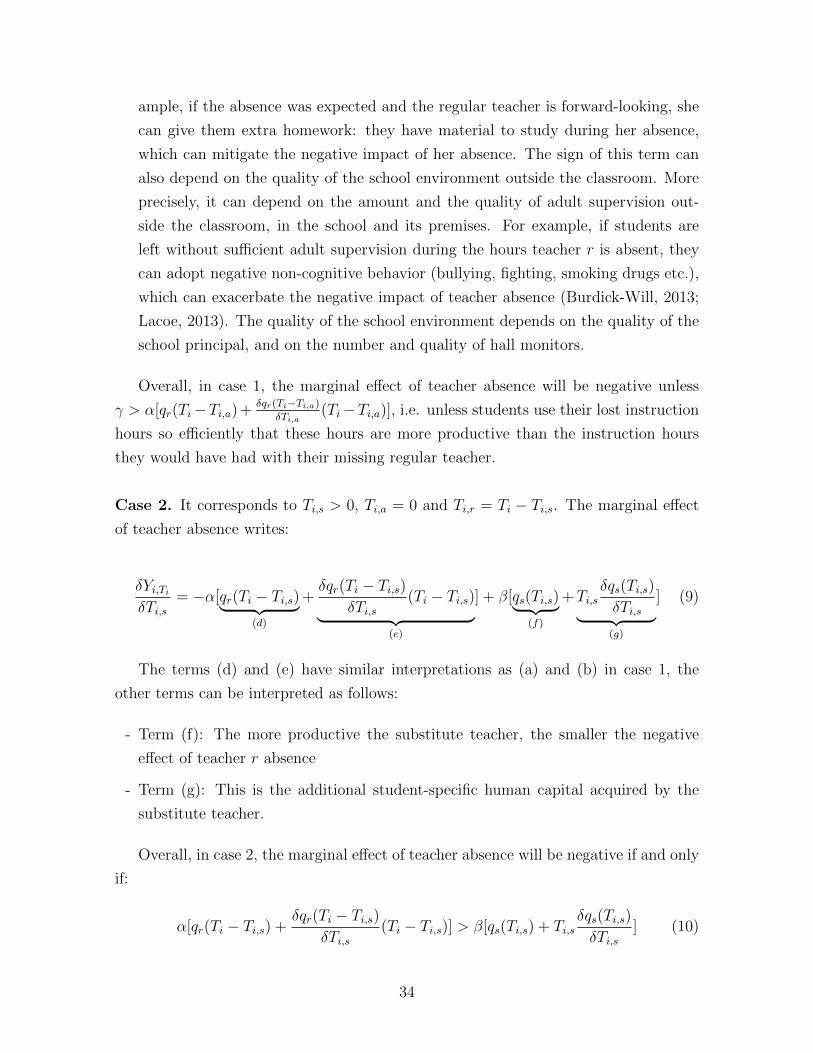
Overall, in case 2, the marginal effect of teacher absence will be negative if and only
if:
α[qr(Ti − Ti,s) +δqr(Ti − Ti,s)
δTi,s(Ti − Ti,s)] > β[qs(Ti,s) + Ti,s
δqs(Ti,s)
δTi,s] (10)
34
In particular, equation (10) will be verified when the regular teacher is of higher
quality than the substitute teacher (qr > qs) and/or when the regular teacher ac-
quire student-specific human capital faster than the substitute teacher ( δqr/δTi,r >
δqs/δTi,s).
B Additional Tables and Figures
Table B1 – Performance at the Certification Exam of the Contract Teachers whotake it
Contract Teachers Candidates Other Candidates
Agreg. CAPES Agreg. CAPES
A. DemographicsAge (in years) 37.72 35.17 31.05 28.18
(7.75) (7.68) (8.32) (6.65)Male 0.53 0.39 0.46 0.35
(0.50) (0.48) (0.49) (0.48)
B. PerformancePassing Rate 0.03 0.16 0.15 0.33
(0.18) (0.37) (0.36) (0.47)Written Part Grade (/20) 3.91 5.67 6.25 7.30
(2.52) (3.14) (3.61) (3.69)Oral Part Grade (/20) 7.00 7.30 8.09 8.50
(3.78) (4.17) (3.83) (4.58)
Nb of obs 286 1,232 8,037 11,779
Note: Standard deviation in parenthesis. On average, the passing rate of contractteachers at the CAPES examination is 16 %. The average passing rate of other candi-dates is 33 %.
35
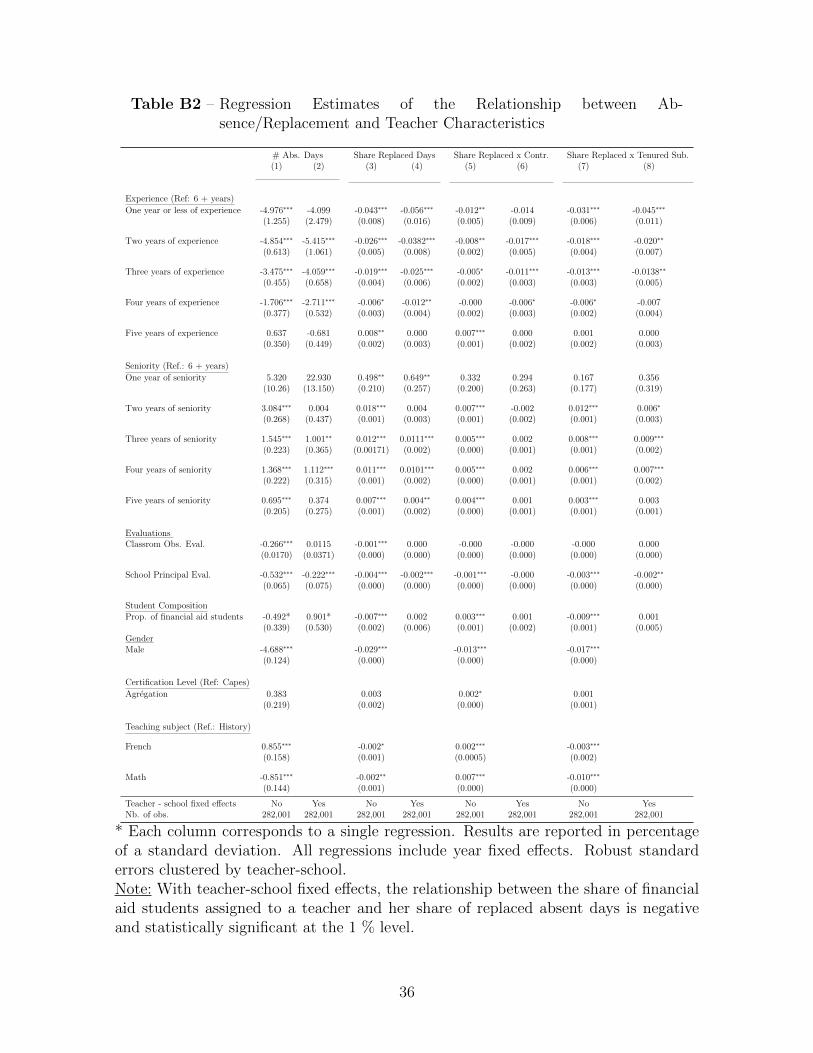
Table B2 – Regression Estimates of the Relationship between Ab-sence/Replacement and Teacher Characteristics
# Abs. Days Share Replaced Days Share Replaced x Contr. Share Replaced x Tenured Sub.(1) (2) (3) (4) (5) (6) (7) (8)
Experience (Ref: 6 + years)
One year or less of experience -4.976∗∗∗ -4.099 -0.043∗∗∗ -0.056∗∗∗ -0.012∗∗ -0.014 -0.031∗∗∗ -0.045∗∗∗
(1.255) (2.479) (0.008) (0.016) (0.005) (0.009) (0.006) (0.011)
Two years of experience -4.854∗∗∗ -5.415∗∗∗ -0.026∗∗∗ -0.0382∗∗∗ -0.008∗∗ -0.017∗∗∗ -0.018∗∗∗ -0.020∗∗
(0.613) (1.061) (0.005) (0.008) (0.002) (0.005) (0.004) (0.007)
Three years of experience -3.475∗∗∗ -4.059∗∗∗ -0.019∗∗∗ -0.025∗∗∗ -0.005∗ -0.011∗∗∗ -0.013∗∗∗ -0.0138∗∗
(0.455) (0.658) (0.004) (0.006) (0.002) (0.003) (0.003) (0.005)
Four years of experience -1.706∗∗∗ -2.711∗∗∗ -0.006∗ -0.012∗∗ -0.000 -0.006∗ -0.006∗ -0.007(0.377) (0.532) (0.003) (0.004) (0.002) (0.003) (0.002) (0.004)
Five years of experience 0.637 -0.681 0.008∗∗ 0.000 0.007∗∗∗ 0.000 0.001 0.000(0.350) (0.449) (0.002) (0.003) (0.001) (0.002) (0.002) (0.003)
Seniority (Ref.: 6 + years)
One year of seniority 5.320 22.930 0.498∗∗ 0.649∗∗ 0.332 0.294 0.167 0.356(10.26) (13.150) (0.210) (0.257) (0.200) (0.263) (0.177) (0.319)
Two years of seniority 3.084∗∗∗ 0.004 0.018∗∗∗ 0.004 0.007∗∗∗ -0.002 0.012∗∗∗ 0.006∗
(0.268) (0.437) (0.001) (0.003) (0.001) (0.002) (0.001) (0.003)
Three years of seniority 1.545∗∗∗ 1.001∗∗ 0.012∗∗∗ 0.0111∗∗∗ 0.005∗∗∗ 0.002 0.008∗∗∗ 0.009∗∗∗
(0.223) (0.365) (0.00171) (0.002) (0.000) (0.001) (0.001) (0.002)
Four years of seniority 1.368∗∗∗ 1.112∗∗∗ 0.011∗∗∗ 0.0101∗∗∗ 0.005∗∗∗ 0.002 0.006∗∗∗ 0.007∗∗∗
(0.222) (0.315) (0.001) (0.002) (0.000) (0.001) (0.001) (0.002)
Five years of seniority 0.695∗∗∗ 0.374 0.007∗∗∗ 0.004∗∗ 0.004∗∗∗ 0.001 0.003∗∗∗ 0.003(0.205) (0.275) (0.001) (0.002) (0.000) (0.001) (0.001) (0.001)
EvaluationsClassrom Obs. Eval. -0.266∗∗∗ 0.0115 -0.001∗∗∗ 0.000 -0.000 -0.000 -0.000 0.000
(0.0170) (0.0371) (0.000) (0.000) (0.000) (0.000) (0.000) (0.000)
School Principal Eval. -0.532∗∗∗ -0.222∗∗∗ -0.004∗∗∗ -0.002∗∗∗ -0.001∗∗∗ -0.000 -0.003∗∗∗ -0.002∗∗
(0.065) (0.075) (0.000) (0.000) (0.000) (0.000) (0.000) (0.000)
Student CompositionProp. of financial aid students -0.492* 0.901* -0.007∗∗∗ 0.002 0.003∗∗∗ 0.001 -0.009∗∗∗ 0.001
(0.339) (0.530) (0.002) (0.006) (0.001) (0.002) (0.001) (0.005)GenderMale -4.688∗∗∗ -0.029∗∗∗ -0.013∗∗∗ -0.017∗∗∗
(0.124) (0.000) (0.000) (0.000)
Certification Level (Ref: Capes)
Agregation 0.383 0.003 0.002∗ 0.001(0.219) (0.002) (0.000) (0.001)
Teaching subject (Ref.: History)
French 0.855∗∗∗ -0.002∗ 0.002∗∗∗ -0.003∗∗∗
(0.158) (0.001) (0.0005) (0.002)
Math -0.851∗∗∗ -0.002∗∗ 0.007∗∗∗ -0.010∗∗∗
(0.144) (0.001) (0.000) (0.000)
Teacher - school fixed effects No Yes No Yes No Yes No YesNb. of obs. 282,001 282,001 282,001 282,001 282,001 282,001 282,001 282,001
* Each column corresponds to a single regression. Results are reported in percentageof a standard deviation. All regressions include year fixed effects. Robust standarderrors clustered by teacher-school.Note: With teacher-school fixed effects, the relationship between the share of financialaid students assigned to a teacher and her share of replaced absent days is negativeand statistically significant at the 1 % level.
36
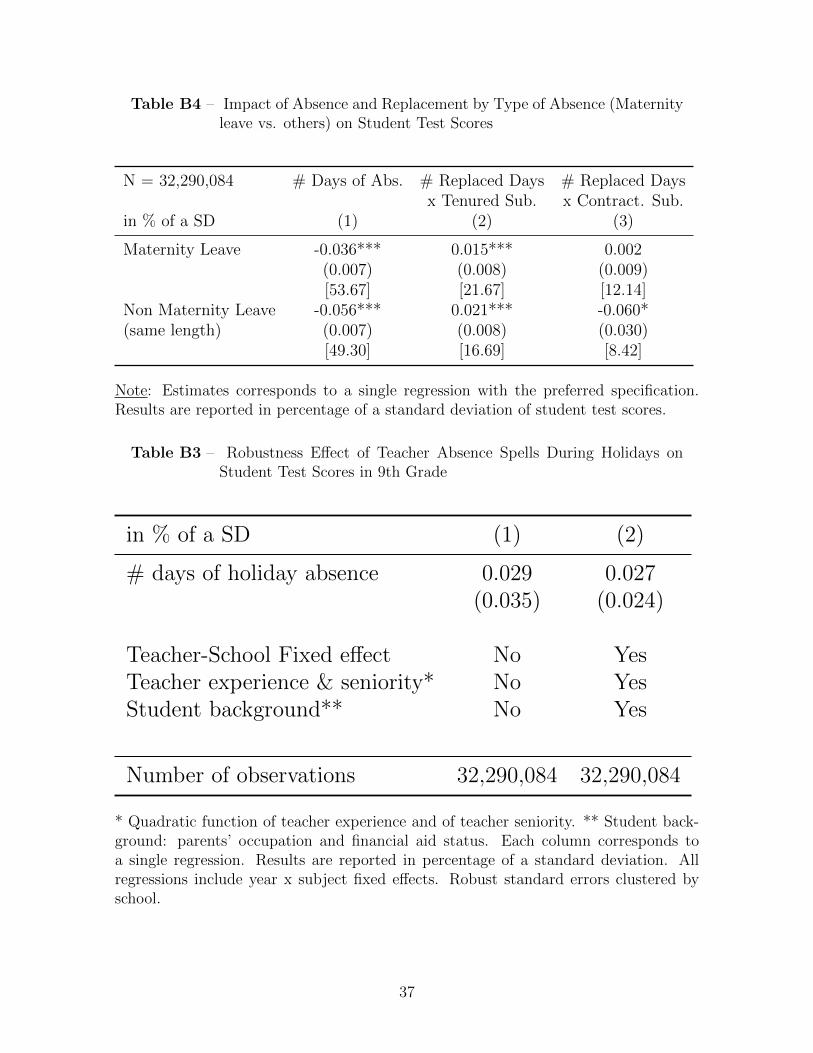
Table B4 – Impact of Absence and Replacement by Type of Absence (Maternityleave vs. others) on Student Test Scores
N = 32,290,084 # Days of Abs. # Replaced Days # Replaced Daysx Tenured Sub. x Contract. Sub.
in % of a SD (1) (2) (3)
Maternity Leave -0.036*** 0.015*** 0.002(0.007) (0.008) (0.009)[53.67] [21.67] [12.14]
Non Maternity Leave -0.056*** 0.021*** -0.060*(same length) (0.007) (0.008) (0.030)
[49.30] [16.69] [8.42]
Note: Estimates corresponds to a single regression with the preferred specification.Results are reported in percentage of a standard deviation of student test scores.
Table B3 – Robustness Effect of Teacher Absence Spells During Holidays onStudent Test Scores in 9th Grade
in % of a SD (1) (2)
# days of holiday absence 0.029 0.027(0.035) (0.024)
Teacher-School Fixed effect No YesTeacher experience & seniority* No YesStudent background** No Yes
Number of observations 32,290,084 32,290,084
* Quadratic function of teacher experience and of teacher seniority. ** Student back-ground: parents’ occupation and financial aid status. Each column corresponds toa single regression. Results are reported in percentage of a standard deviation. Allregressions include year x subject fixed effects. Robust standard errors clustered byschool.
37
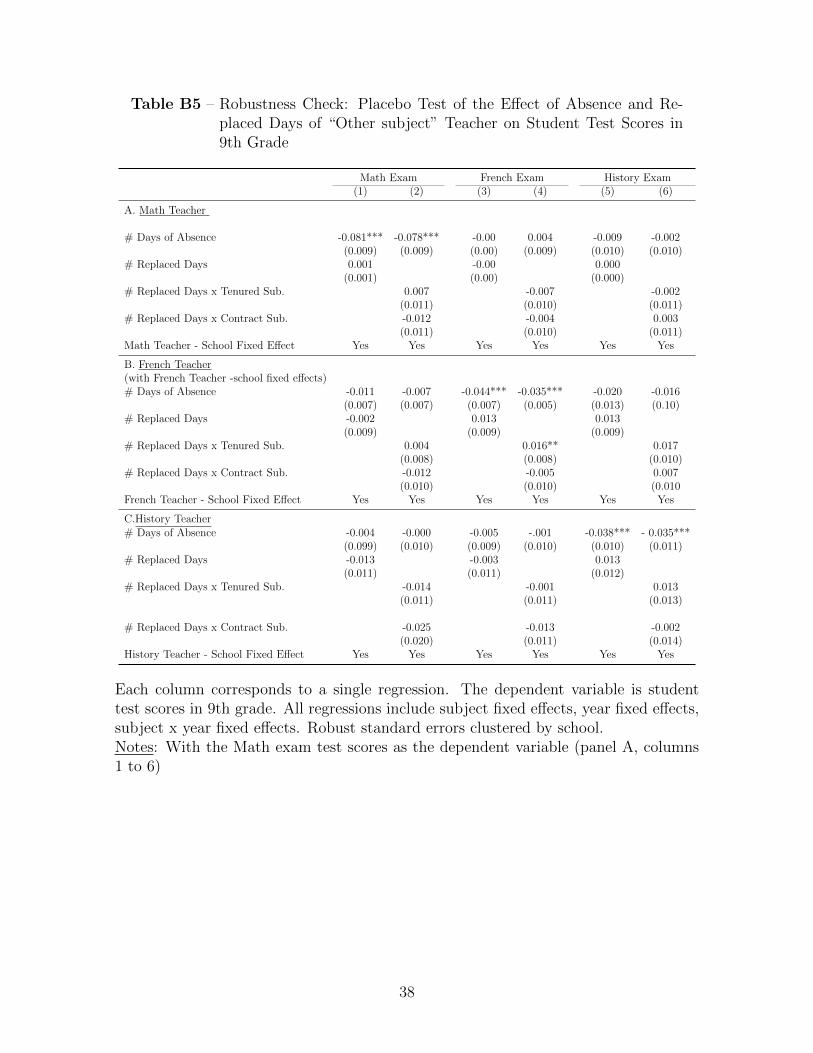
Table B5 – Robustness Check: Placebo Test of the Effect of Absence and Re-placed Days of “Other subject” Teacher on Student Test Scores in9th Grade
Math Exam French Exam History Exam(1) (2) (3) (4) (5) (6)
A. Math Teacher
# Days of Absence -0.081*** -0.078*** -0.00 0.004 -0.009 -0.002(0.009) (0.009) (0.00) (0.009) (0.010) (0.010)
# Replaced Days 0.001 -0.00 0.000(0.001) (0.00) (0.000)
# Replaced Days x Tenured Sub. 0.007 -0.007 -0.002(0.011) (0.010) (0.011)
# Replaced Days x Contract Sub. -0.012 -0.004 0.003(0.011) (0.010) (0.011)
Math Teacher - School Fixed Effect Yes Yes Yes Yes Yes Yes
B. French Teacher(with French Teacher -school fixed effects)# Days of Absence -0.011 -0.007 -0.044*** -0.035*** -0.020 -0.016
(0.007) (0.007) (0.007) (0.005) (0.013) (0.10)# Replaced Days -0.002 0.013 0.013
(0.009) (0.009) (0.009)# Replaced Days x Tenured Sub. 0.004 0.016** 0.017
(0.008) (0.008) (0.010)# Replaced Days x Contract Sub. -0.012 -0.005 0.007
(0.010) (0.010) (0.010French Teacher - School Fixed Effect Yes Yes Yes Yes Yes Yes
C.History Teacher# Days of Absence -0.004 -0.000 -0.005 -.001 -0.038*** - 0.035***
(0.099) (0.010) (0.009) (0.010) (0.010) (0.011)# Replaced Days -0.013 -0.003 0.013
(0.011) (0.011) (0.012)# Replaced Days x Tenured Sub. -0.014 -0.001 0.013
(0.011) (0.011) (0.013)
# Replaced Days x Contract Sub. -0.025 -0.013 -0.002(0.020) (0.011) (0.014)
History Teacher - School Fixed Effect Yes Yes Yes Yes Yes Yes
Each column corresponds to a single regression. The dependent variable is studenttest scores in 9th grade. All regressions include subject fixed effects, year fixed effects,subject x year fixed effects. Robust standard errors clustered by school.Notes: With the Math exam test scores as the dependent variable (panel A, columns1 to 6)
38
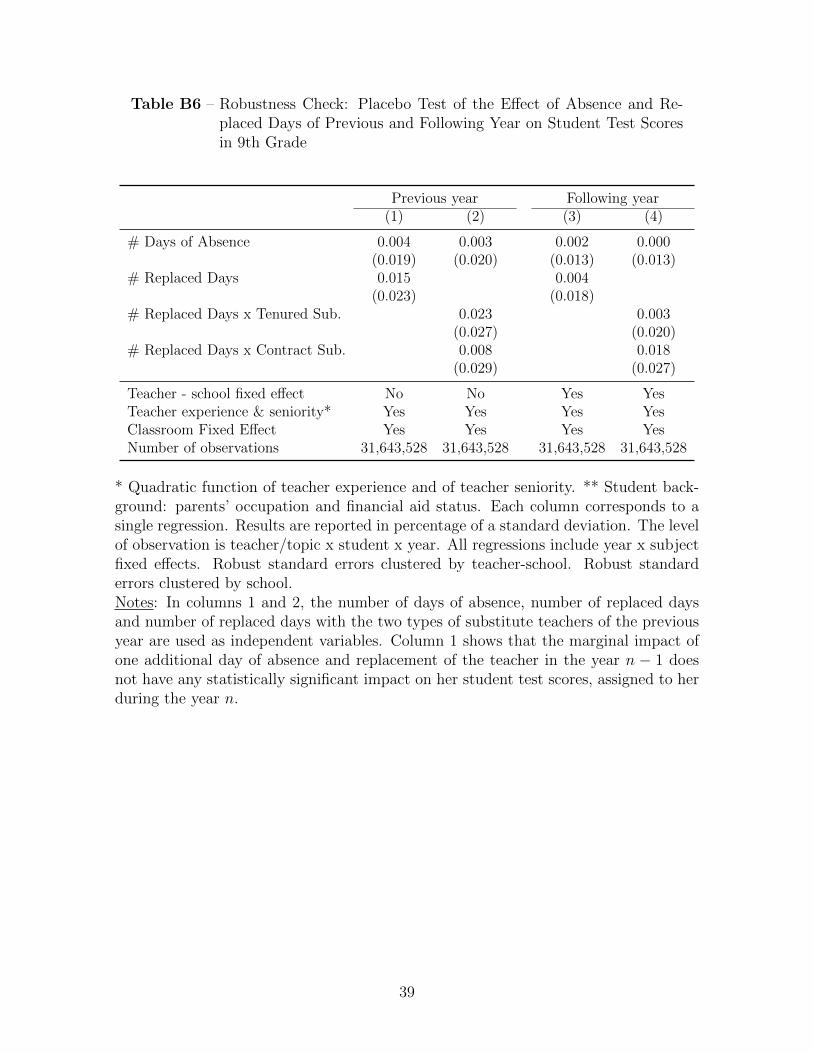
Table B6 – Robustness Check: Placebo Test of the Effect of Absence and Re-placed Days of Previous and Following Year on Student Test Scoresin 9th Grade
Previous year Following year(1) (2) (3) (4)
# Days of Absence 0.004 0.003 0.002 0.000(0.019) (0.020) (0.013) (0.013)
# Replaced Days 0.015 0.004(0.023) (0.018)
# Replaced Days x Tenured Sub. 0.023 0.003(0.027) (0.020)
# Replaced Days x Contract Sub. 0.008 0.018(0.029) (0.027)
Teacher - school fixed effect No No Yes YesTeacher experience & seniority* Yes Yes Yes YesClassroom Fixed Effect Yes Yes Yes YesNumber of observations 31,643,528 31,643,528 31,643,528 31,643,528
* Quadratic function of teacher experience and of teacher seniority. ** Student back-ground: parents’ occupation and financial aid status. Each column corresponds to asingle regression. Results are reported in percentage of a standard deviation. The levelof observation is teacher/topic x student x year. All regressions include year x subjectfixed effects. Robust standard errors clustered by teacher-school. Robust standarderrors clustered by school.Notes: In columns 1 and 2, the number of days of absence, number of replaced daysand number of replaced days with the two types of substitute teachers of the previousyear are used as independent variables. Column 1 shows that the marginal impact ofone additional day of absence and replacement of the teacher in the year n − 1 doesnot have any statistically significant impact on her student test scores, assigned to herduring the year n.
39
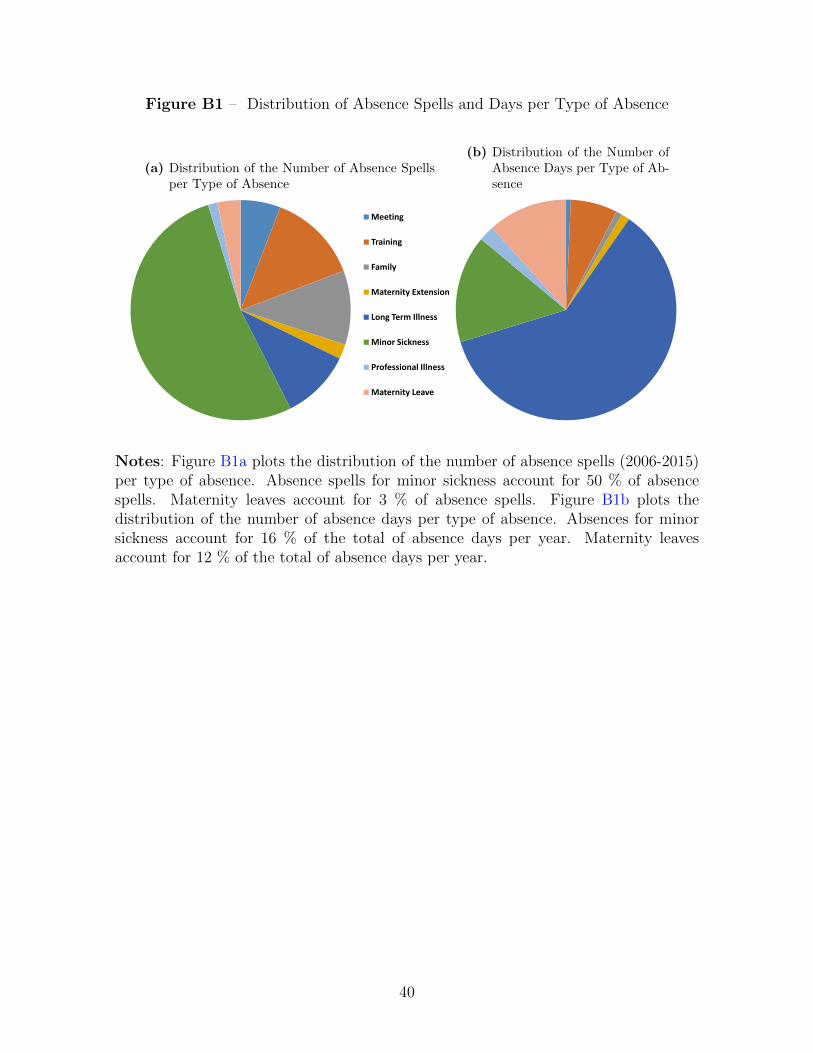
Figure B1 – Distribution of Absence Spells and Days per Type of Absence
(a) Distribution of the Number of Absence Spellsper Type of Absence
Meeting
Training
Family
Maternity Extension
Long Term Illness
Minor Sickness
Professional Illness
Maternity Leave
(b) Distribution of the Number ofAbsence Days per Type of Ab-sence
Meeting
Training
Family
Maternity ExtensionLong Term Illness
Minor Sickness
Professional Illness
Maternity Leave
Notes: Figure B1a plots the distribution of the number of absence spells (2006-2015)per type of absence. Absence spells for minor sickness account for 50 % of absencespells. Maternity leaves account for 3 % of absence spells. Figure B1b plots thedistribution of the number of absence days per type of absence. Absences for minorsickness account for 16 % of the total of absence days per year. Maternity leavesaccount for 12 % of the total of absence days per year.
40
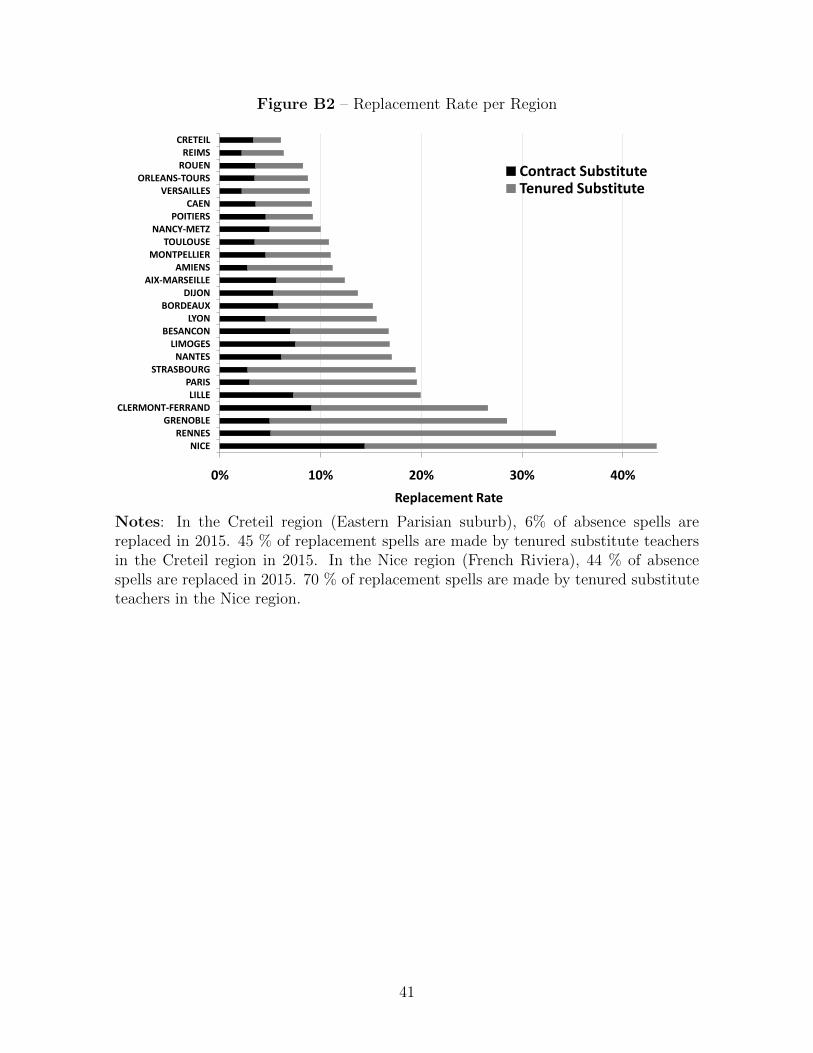
Figure B2 – Replacement Rate per Region
0% 10% 20% 30% 40%
NICERENNES
GRENOBLECLERMONT-FERRAND
LILLEPARIS
STRASBOURGNANTES
LIMOGESBESANCON
LYONBORDEAUX
DIJONAIX-MARSEILLE
AMIENSMONTPELLIER
TOULOUSENANCY-METZ
POITIERSCAEN
VERSAILLESORLEANS-TOURS
ROUENREIMS
CRETEIL
Replacement Rate
Contract SubstituteTenured Substitute
Notes: In the Creteil region (Eastern Parisian suburb), 6% of absence spells arereplaced in 2015. 45 % of replacement spells are made by tenured substitute teachersin the Creteil region in 2015. In the Nice region (French Riviera), 44 % of absencespells are replaced in 2015. 70 % of replacement spells are made by tenured substituteteachers in the Nice region.
41
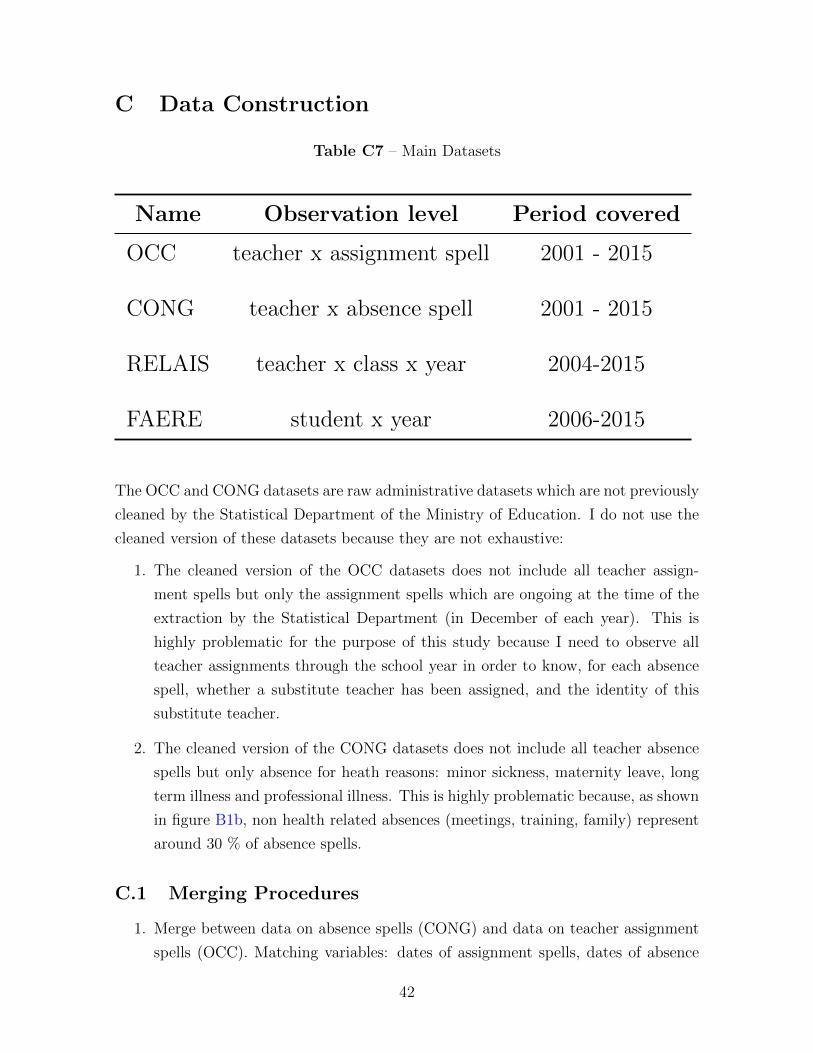
C Data Construction
Table C7 – Main Datasets
Name Observation level Period covered
OCC teacher x assignment spell 2001 - 2015
CONG teacher x absence spell 2001 - 2015
RELAIS teacher x class x year 2004-2015
FAERE student x year 2006-2015
The OCC and CONG datasets are raw administrative datasets which are not previously
cleaned by the Statistical Department of the Ministry of Education. I do not use the
cleaned version of these datasets because they are not exhaustive:
1. The cleaned version of the OCC datasets does not include all teacher assign-
ment spells but only the assignment spells which are ongoing at the time of the
extraction by the Statistical Department (in December of each year). This is
highly problematic for the purpose of this study because I need to observe all
teacher assignments through the school year in order to know, for each absence
spell, whether a substitute teacher has been assigned, and the identity of this
substitute teacher.
2. The cleaned version of the CONG datasets does not include all teacher absence
spells but only absence for heath reasons: minor sickness, maternity leave, long
term illness and professional illness. This is highly problematic because, as shown
in figure B1b, non health related absences (meetings, training, family) represent
around 30 % of absence spells.
C.1 Merging Procedures
1. Merge between data on absence spells (CONG) and data on teacher assignment
spells (OCC). Matching variables: dates of assignment spells, dates of absence
42
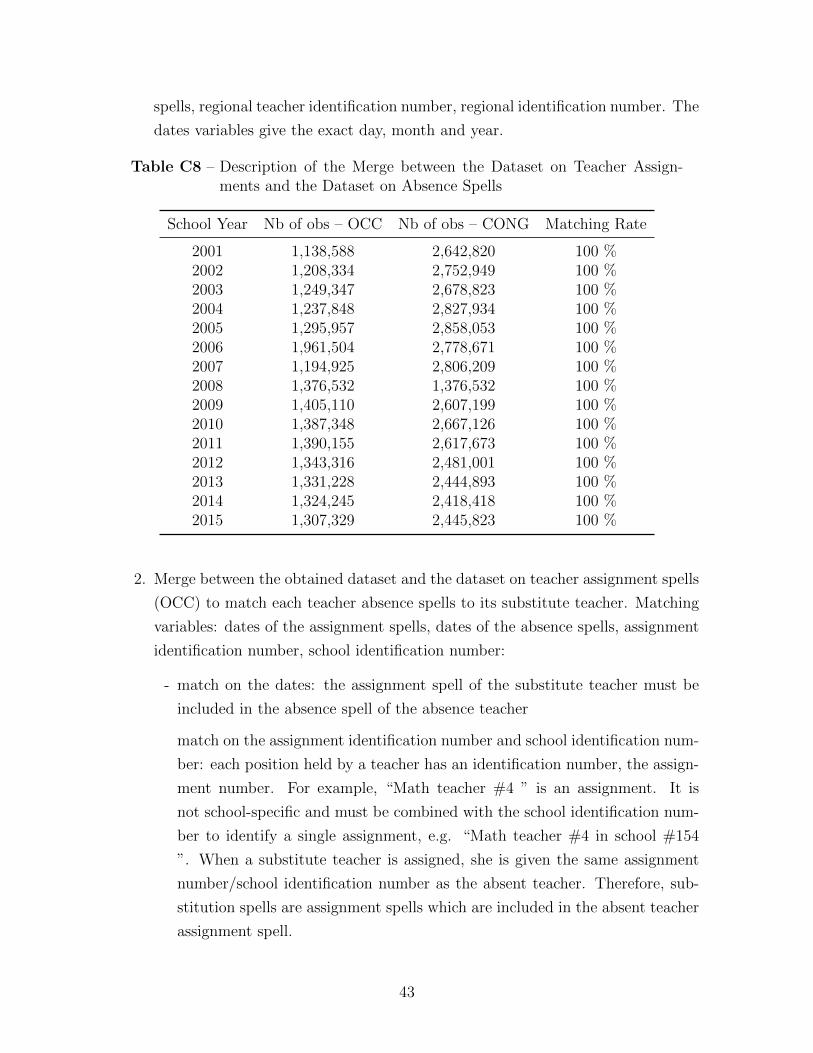
spells, regional teacher identification number, regional identification number. The
dates variables give the exact day, month and year.
Table C8 – Description of the Merge between the Dataset on Teacher Assign-ments and the Dataset on Absence Spells
School Year Nb of obs – OCC Nb of obs – CONG Matching Rate
2001 1,138,588 2,642,820 100 %2002 1,208,334 2,752,949 100 %2003 1,249,347 2,678,823 100 %2004 1,237,848 2,827,934 100 %2005 1,295,957 2,858,053 100 %2006 1,961,504 2,778,671 100 %2007 1,194,925 2,806,209 100 %2008 1,376,532 1,376,532 100 %2009 1,405,110 2,607,199 100 %2010 1,387,348 2,667,126 100 %2011 1,390,155 2,617,673 100 %2012 1,343,316 2,481,001 100 %2013 1,331,228 2,444,893 100 %2014 1,324,245 2,418,418 100 %2015 1,307,329 2,445,823 100 %
2. Merge between the obtained dataset and the dataset on teacher assignment spells
(OCC) to match each teacher absence spells to its substitute teacher. Matching
variables: dates of the assignment spells, dates of the absence spells, assignment
identification number, school identification number:
- match on the dates: the assignment spell of the substitute teacher must be
included in the absence spell of the absence teacher
match on the assignment identification number and school identification num-
ber: each position held by a teacher has an identification number, the assign-
ment number. For example, “Math teacher #4 ” is an assignment. It is
not school-specific and must be combined with the school identification num-
ber to identify a single assignment, e.g. “Math teacher #4 in school #154
”. When a substitute teacher is assigned, she is given the same assignment
number/school identification number as the absent teacher. Therefore, sub-
stitution spells are assignment spells which are included in the absent teacher
assignment spell.
43