about these financial statements - contact energy
TRANSCRIPT
2 Contact | Interim Financial Statements Contact | Interim Financial Statements 3
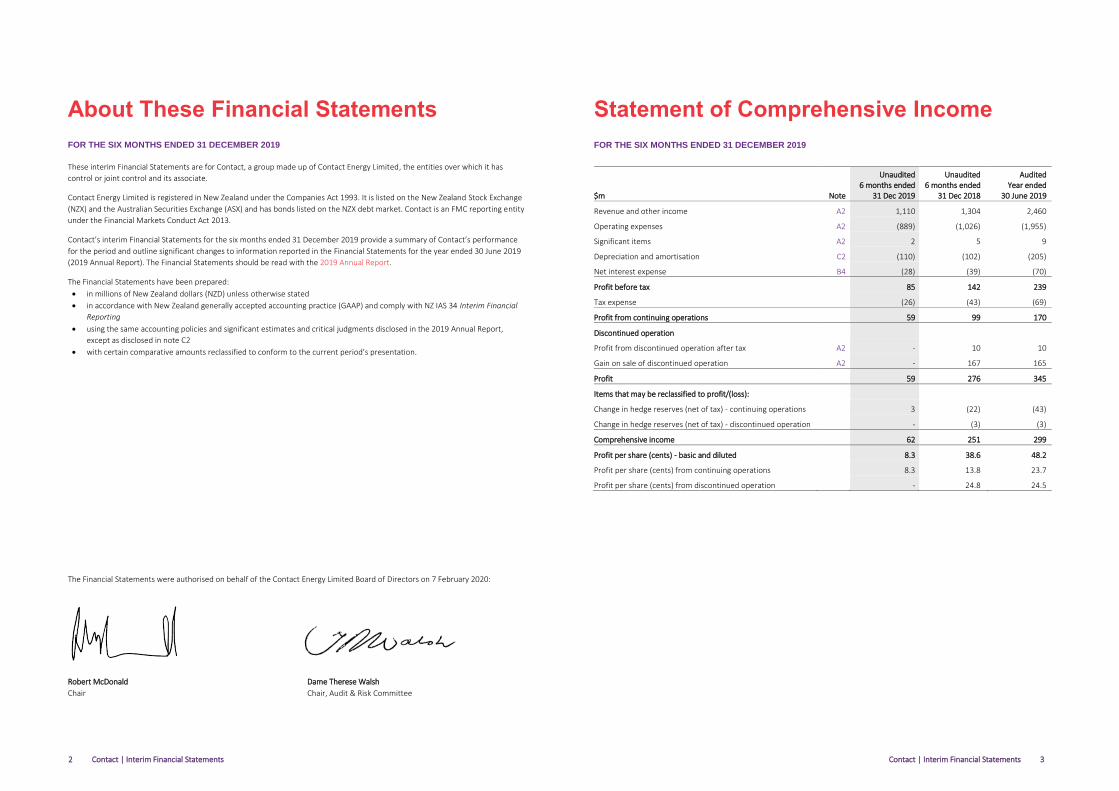
About These Financial Statements
FOR THE SIX MONTHS ENDED 31 DECEMBER 2019
These interim Financial Statements are for Contact, a group made up of Contact Energy Limited, the entities over which it has
control or joint control and its associate.
Contact Energy Limited is registered in New Zealand under the Companies Act 1993. It is listed on the New Zealand Stock Exchange
(NZX) and the Australian Securities Exchange (ASX) and has bonds listed on the NZX debt market. Contact is an FMC reporting entity
under the Financial Markets Conduct Act 2013.
Contact’s interim Financial Statements for the six months ended 31 December 2019 provide a summary of Contact’s performance
for the period and outline significant changes to information reported in the Financial Statements for the year ended 30 June 2019
(2019 Annual Report). The Financial Statements should be read with the 2019 Annual Report.
The Financial Statements have been prepared:
in millions of New Zealand dollars (NZD) unless otherwise stated
in accordance with New Zealand generally accepted accounting practice (GAAP) and comply with NZ IAS 34 Interim Financial
Reporting
using the same accounting policies and significant estimates and critical judgments disclosed in the 2019 Annual Report,
except as disclosed in note C2
with certain comparative amounts reclassified to conform to the current period’s presentation.
The Financial Statements were authorised on behalf of the Contact Energy Limited Board of Directors on 7 February 2020:
Robert McDonald Dame Therese Walsh
Chair Chair, Audit & Risk Committee
Statement of Comprehensive Income
FOR THE SIX MONTHS ENDED 31 DECEMBER 2019
$m Note
Unaudited 6 months ended
31 Dec 2019
Unaudited 6 months ended
31 Dec 2018
Audited Year ended
30 June 2019
Revenue and other income A2 1,110 1,304 2,460
Operating expenses A2 (889) (1,026) (1,955)
Significant items A2 2 5 9
Depreciation and amortisation C2 (110) (102) (205)
Net interest expense B4 (28) (39) (70)
Profit before tax 85 142 239
Tax expense (26) (43) (69)
Profit from continuing operations 59 99 170
Discontinued operation
Profit from discontinued operation after tax A2 - 10 10
Gain on sale of discontinued operation A2 - 167 165
Profit 59 276 345
Items that may be reclassified to profit/(loss):
Change in hedge reserves (net of tax) - continuing operations 3 (22) (43)
Change in hedge reserves (net of tax) - discontinued operation - (3) (3)
Comprehensive income 62 251 299
Profit per share (cents) - basic and diluted 8.3 38.6 48.2
Profit per share (cents) from continuing operations 8.3 13.8 23.7
Profit per share (cents) from discontinued operation - 24.8 24.5
4 Contact | Interim Financial Statements Contact | Interim Financial Statements 5
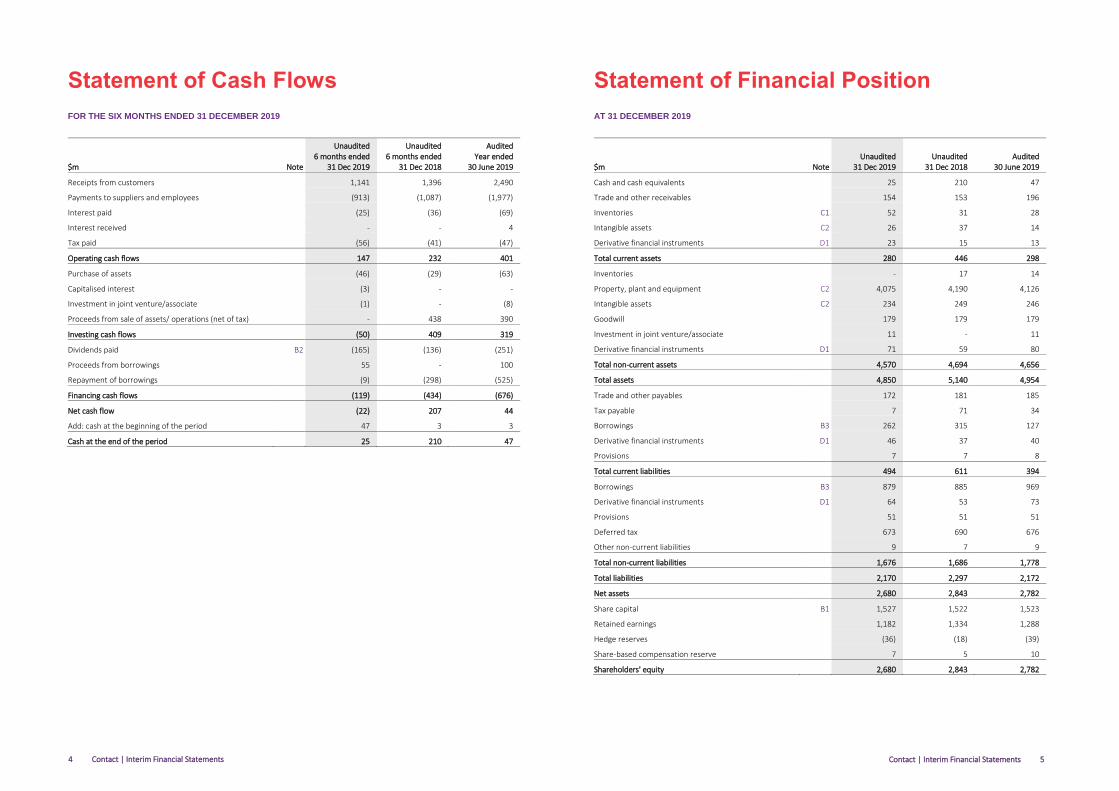
Statement of Cash Flows
FOR THE SIX MONTHS ENDED 31 DECEMBER 2019
$m Note
Unaudited 6 months ended
31 Dec 2019
Unaudited 6 months ended
31 Dec 2018
Audited Year ended
30 June 2019
Receipts from customers 1,141 1,396 2,490
Payments to suppliers and employees (913) (1,087) (1,977)
Interest paid (25) (36) (69)
Interest received - - 4
Tax paid (56) (41) (47)
Operating cash flows 147 232 401
Purchase of assets (46) (29) (63)
Capitalised interest (3) - -
Investment in joint venture/associate (1) - (8)
Proceeds from sale of assets/ operations (net of tax) - 438 390
Investing cash flows (50) 409 319
Dividends paid B2 (165) (136) (251)
Proceeds from borrowings 55 - 100
Repayment of borrowings (9) (298) (525)
Financing cash flows (119) (434) (676)
Net cash flow (22) 207 44
Add: cash at the beginning of the period 47 3 3
Cash at the end of the period 25 210 47
Statement of Financial Position
AT 31 DECEMBER 2019
$m Note Unaudited
31 Dec 2019 Unaudited
31 Dec 2018 Audited
30 June 2019
Cash and cash equivalents 25 210 47
Trade and other receivables 154 153 196
Inventories C1 52 31 28
Intangible assets C2 26 37 14
Derivative financial instruments D1 23 15 13
Total current assets 280 446 298
Inventories - 17 14
Property, plant and equipment C2 4,075 4,190 4,126
Intangible assets C2 234 249 246
Goodwill 179 179 179
Investment in joint venture/associate 11 - 11
Derivative financial instruments D1 71 59 80
Total non-current assets 4,570 4,694 4,656
Total assets 4,850 5,140 4,954
Trade and other payables 172 181 185
Tax payable 7 71 34
Borrowings B3 262 315 127
Derivative financial instruments D1 46 37 40
Provisions 7 7 8
Total current liabilities 494 611 394
Borrowings B3 879 885 969
Derivative financial instruments D1 64 53 73
Provisions 51 51 51
Deferred tax 673 690 676
Other non-current liabilities 9 7 9
Total non-current liabilities 1,676 1,686 1,778
Total liabilities 2,170 2,297 2,172
Net assets 2,680 2,843 2,782
Share capital B1 1,527 1,522 1,523
Retained earnings 1,182 1,334 1,288
Hedge reserves (36) (18) (39)
Share-based compensation reserve 7 5 10
Shareholders' equity 2,680 2,843 2,782
6 Contact | Interim Financial Statements Contact | Interim Financial Statements 7
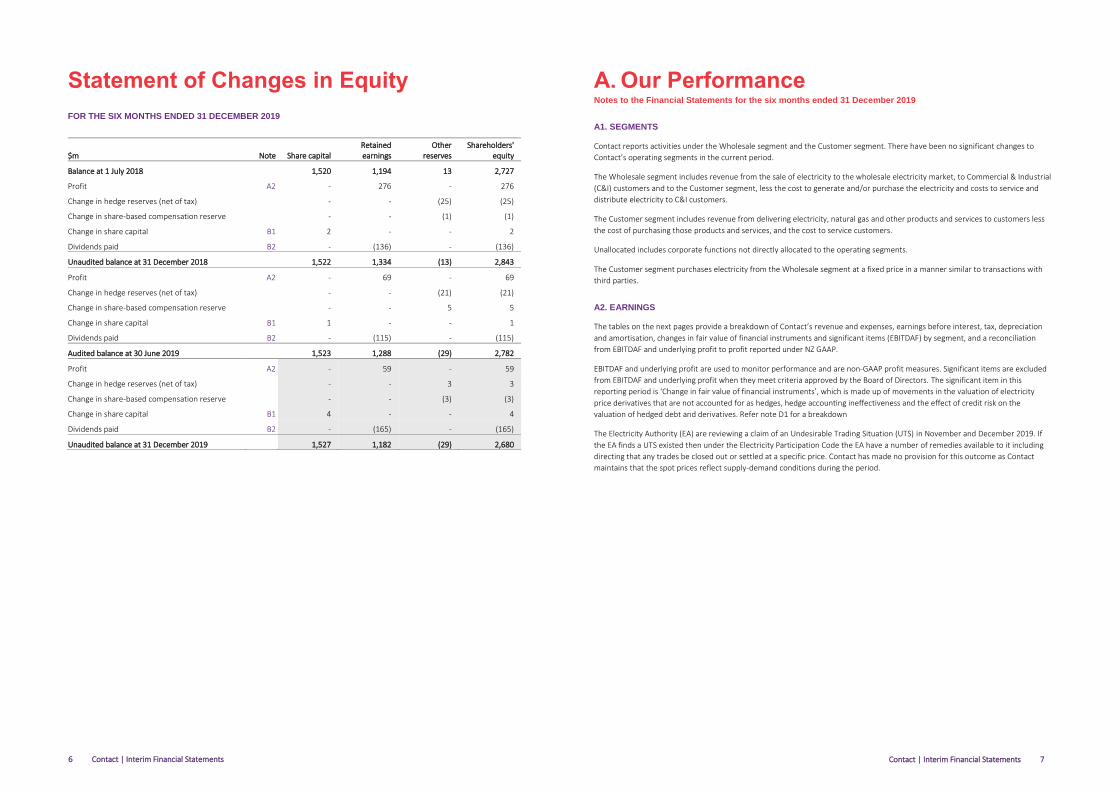
Statement of Changes in Equity
FOR THE SIX MONTHS ENDED 31 DECEMBER 2019
$m Note Share capital Retained earnings
Other reserves
Shareholders' equity
Balance at 1 July 2018 1,520 1,194 13 2,727
Profit A2 - 276 - 276
Change in hedge reserves (net of tax) - - (25) (25)
Change in share-based compensation reserve - - (1) (1)
Change in share capital B1 2 - - 2
Dividends paid B2 - (136) - (136)
Unaudited balance at 31 December 2018 1,522 1,334 (13) 2,843
Profit A2 - 69 - 69
Change in hedge reserves (net of tax) - - (21) (21)
Change in share-based compensation reserve - - 5 5
Change in share capital B1 1 - - 1
Dividends paid B2 - (115) - (115)
Audited balance at 30 June 2019 1,523 1,288 (29) 2,782
Profit A2 - 59 - 59
Change in hedge reserves (net of tax) - - 3 3
Change in share-based compensation reserve - - (3) (3)
Change in share capital B1 4 - - 4
Dividends paid B2 - (165) - (165)
Unaudited balance at 31 December 2019 1,527 1,182 (29) 2,680
A. Our Performance Notes to the Financial Statements for the six months ended 31 December 2019
A1. SEGMENTS
Contact reports activities under the Wholesale segment and the Customer segment. There have been no significant changes to
Contact’s operating segments in the current period.
The Wholesale segment includes revenue from the sale of electricity to the wholesale electricity market, to Commercial & Industrial
(C&I) customers and to the Customer segment, less the cost to generate and/or purchase the electricity and costs to service and
distribute electricity to C&I customers.
The Customer segment includes revenue from delivering electricity, natural gas and other products and services to customers less
the cost of purchasing those products and services, and the cost to service customers.
Unallocated includes corporate functions not directly allocated to the operating segments.
The Customer segment purchases electricity from the Wholesale segment at a fixed price in a manner similar to transactions with
third parties.
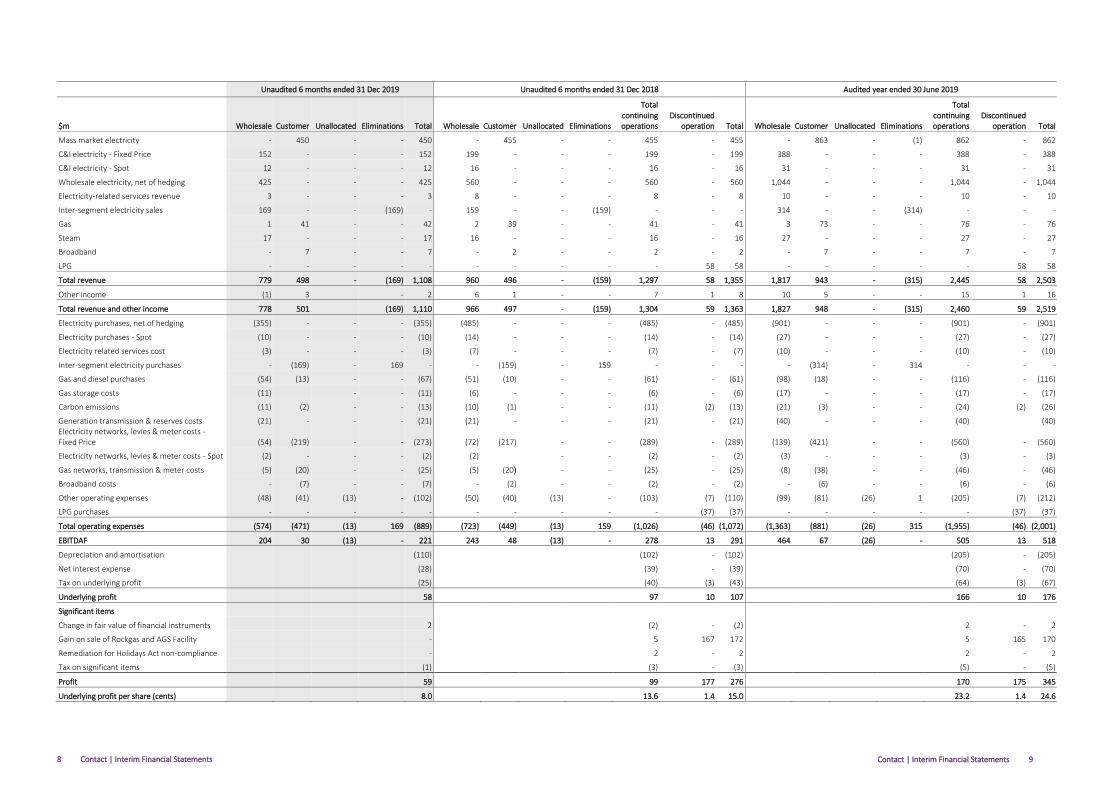
A2. EARNINGS
The tables on the next pages provide a breakdown of Contact’s revenue and expenses, earnings before interest, tax, depreciation
and amortisation, changes in fair value of financial instruments and significant items (EBITDAF) by segment, and a reconciliation
from EBITDAF and underlying profit to profit reported under NZ GAAP.
EBITDAF and underlying profit are used to monitor performance and are non-GAAP profit measures. Significant items are excluded
from EBITDAF and underlying profit when they meet criteria approved by the Board of Directors. The significant item in this
reporting period is ‘Change in fair value of financial instruments’, which is made up of movements in the valuation of electricity
price derivatives that are not accounted for as hedges, hedge accounting ineffectiveness and the effect of credit risk on the
valuation of hedged debt and derivatives. Refer note D1 for a breakdown
The Electricity Authority (EA) are reviewing a claim of an Undesirable Trading Situation (UTS) in November and December 2019. If
the EA finds a UTS existed then under the Electricity Participation Code the EA have a number of remedies available to it including
directing that any trades be closed out or settled at a specific price. Contact has made no provision for this outcome as Contact
maintains that the spot prices reflect supply-demand conditions during the period.
8 Contact | Interim Financial Statements Contact | Interim Financial Statements 9
Unaudited 6 months ended 31 Dec 2019 Unaudited 6 months ended 31 Dec 2018 Audited year ended 30 June 2019
$m Wholesale
Customer Unallocated
Eliminations Total Wholesale
Customer Unallocated
Eliminations
Total continuing operations
Discontinued operation Total Wholesale
Customer Unallocated
Eliminations
Total continuing operations
Discontinued operation Total
Mass market electricity - 450 - - 450 - 455 - - 455 - 455 - 863 - (1) 862 - 862
C&I electricity - Fixed Price 152 - - - 152 199 - - - 199 - 199 388 - - - 388 - 388
C&I electricity - Spot 12 - - - 12 16 - - - 16 - 16 31 - - - 31 - 31
Wholesale electricity, net of hedging 425 - - - 425 560 - - - 560 - 560 1,044 - - - 1,044 - 1,044
Electricity-related services revenue 3 - - - 3 8 - - - 8 - 8 10 - - - 10 - 10
Inter-segment electricity sales 169 - - (169) - 159 - - (159) - - - 314 - - (314) - - -
Gas 1 41 - - 42 2 39 - - 41 - 41 3 73 - - 76 - 76
Steam 17 - - - 17 16 - - - 16 - 16 27 - - - 27 - 27
Broadband - 7 - - 7 - 2 - - 2 - 2 - 7 - - 7 - 7
LPG - - - - - - - - - - 58 58 - - - - - 58 58
Total revenue 779 498 - (169) 1,108 960 496 - (159) 1,297 58 1,355 1,817 943 - (315) 2,445 58 2,503
Other income (1) 3 - 2 6 1 - - 7 1 8 10 5 - - 15 1 16
Total revenue and other income 778 501 (169) 1,110 966 497 - (159) 1,304 59 1,363 1,827 948 - (315) 2,460 59 2,519
Electricity purchases, net of hedging (355) - - - (355) (485) - - - (485) - (485) (901) - - - (901) - (901)
Electricity purchases - Spot (10) - - - (10) (14) - - - (14) - (14) (27) - - - (27) - (27)
Electricity related services cost (3) - - - (3) (7) - - - (7) - (7) (10) - - - (10) - (10)
Inter-segment electricity purchases - (169) - 169 - - (159) - 159 - - - - (314) - 314 - - -
Gas and diesel purchases (54) (13) - - (67) (51) (10) - - (61) - (61) (98) (18) - - (116) - (116)
Gas storage costs (11) - - (11) (6) - - - (6) - (6) (17) - - - (17) - (17)
Carbon emissions (11) (2) - - (13) (10) (1) - - (11) (2) (13) (21) (3) - - (24) (2) (26)
Generation transmission & reserves costs (21) - - - (21) (21) - - - (21) - (21) (40) - - - (40) (40) Electricity networks, levies & meter costs - Fixed Price (54) (219) - - (273) (72) (217) - - (289) - (289) (139) (421) - - (560) - (560)
Electricity networks, levies & meter costs - Spot (2) - - - (2) (2) - - (2) - (2) (3) - - - (3) - (3)
Gas networks, transmission & meter costs (5) (20) - - (25) (5) (20) - - (25) - (25) (8) (38) - - (46) - (46)
Broadband costs - (7) - - (7) - (2) - - (2) - (2) - (6) - - (6) - (6)
Other operating expenses (48) (41) (13) - (102) (50) (40) (13) - (103) (7) (110) (99) (81) (26) 1 (205) (7) (212)
LPG purchases - - - - - - - - - - (37) (37) - - - - - (37) (37)
Total operating expenses (574) (471) (13) 169 (889) (723) (449) (13) 159 (1,026) (46) (1,072) (1,363) (881) (26) 315 (1,955) (46) (2,001)
EBITDAF 204 30 (13) - 221 243 48 (13) - 278 13 291 464 67 (26) - 505 13 518
Depreciation and amortisation (110) (102) - (102) (205) - (205)
Net interest expense (28) (39) - (39) (70) - (70)
Tax on underlying profit (25) (40) (3) (43) (64) (3) (67)
Underlying profit 58 97 10 107 166 10 176
Significant items
Change in fair value of financial instruments 2 (2) - (2) 2 - 2
Gain on sale of Rockgas and AGS Facility - 5 167 172 5 165 170
Remediation for Holidays Act non-compliance - 2 - 2 2 - 2
Tax on significant items (1) (3) - (3) (5) - (5)
Profit 59 99 177 276 170 175 345
Underlying profit per share (cents) 8.0 13.6 1.4 15.0 23.2 1.4 24.6

10 Contact | Interim Financial Statements Contact | Interim Financial Statements 11
A3. FREE CASH FLOW
$m
Unaudited 6 months ended
31 Dec 2019
Unaudited 6 months ended
31 Dec 2018
Audited Year ended
30 June 2019
EBITDAF 221 291 518
Tax paid (56) (41) (47)
Change in working capital net of investing and financing activities 5 18 (7)
Non-cash share-based compensation 2 1 4
Significant items, net of non-cash amounts - (1) (2)
Net interest paid, excluding capitalised interest (25) (36) (65)
Operating cash flows 147 232 401
Stay in business capital expenditure (27) (29) (60)
Operating free cash flow 120 203 341
Proceeds from sale of assets/operations (net of tax) - 438 390
Free cash flow 120 641 731
Operating free cash flow per share (cents) 16.8 28.3 47.5
During the current interim reporting period, interest paid and interest received were reclassified to operating cash flows, to better
reflect the purpose and use of the underlying instruments.
A4. RELATED PARTY TRANSACTIONS
Contact’s related parties include the Directors, the Leadership Team, Simply Energy Limited and Drylandcarbon One Limited
Partnership. Contact sold its 50% interest in Rockgas Timaru Limited as part of the sale of Rockgas on 30 November 2018.
Transactions with Rockgas Timaru Limited up to that point, and other related party transactions are disclosed below:
Sales of LPG to Rockgas Timaru Limited of $nil (31 December 2018: $1 million, 30 June 2019: $1 million).
Directors’ fees of $1 million (31 December 2018: $1 million, 30 June 2019: $1 million).
Leadership Team’s salary and other short-term benefits of $4 million (31 December 2018: $4 million, 30 June 2019: $7 million),
which includes $1 million of share-based compensation expense (31 December 2018: $1 million, 30 June 2019: $2 million).
Members of the Leadership Team and Directors purchase goods and services from Contact for domestic purposes on normal
commercial terms and conditions. For members of the Leadership Team this includes staff discount available to all eligible
employees.
B. Our Funding Notes to the Financial Statements for the six months ended 31 December 2019
B1. SHARE CAPITAL
Number $m
Balance at 1 July 2018 716,286,570 1,520
Share capital issued 418,002 2
Balance at 31 December 2018 716,704,572 1,522
Share capital issued 70,210 1
Balance at 30 June 2019 716,774,782 1,523
Share capital issued 1,302,816 4
Balance at 31 December 2019 718,077,598 1,527
Comprised of:
Ordinary shares 717,795,924 1,528
Contact Share 281,674 (1)
During the period Contact granted a new tranche of share awards under the Equity Scheme, comprising 154,164 performance
share rights (PSRs) and 244,404 deferred share rights (DSRs). PSRs and DSRs have no exercise price.
B2. DIVIDENDS PAID
$m Cents per share
Unaudited 6 months ended
31 Dec 2019
Unaudited 6 months ended
31 Dec 2018
Audited Year ended
30 June 2019
2018 final dividend 19 - 136 136
2019 interim dividend 16 - - 115
2019 final dividend 23 165 - -
165 136 251
On 7 February 2020 the Board declared an interim dividend of 16 cents per share to be paid on 7 April 2020.

12 Contact | Interim Financial Statements Contact | Interim Financial Statements 13
B3. BORROWINGS
$m Unaudited
31 Dec 2019 Unaudited
31 Dec 2018 Audited
30 June 2019
Bank overdraft 2 1 6
*Commercial paper 100 80 60
*Bank facilities 31 - 16
Lease obligations 24 26 25
*Wholesale bonds 50 50 50
*Retail bonds 350 472 350
*Export credit agency facility 57 65 61
*USPP notes 447 447 447
Face value of borrowings 1,061 1,141 1,015
Deferred financing costs (5) (5) (5)
Fair value adjustment on hedged borrowings 85 64 86
Carrying value of borrowings 1,141 1,200 1,096
Current 262 315 127
Non-current 879 885 969
Borrowings denoted with an asterisk (*) are Green Debt Instruments under Contact’s Green Borrowing Programme, which has
been certified by the Climate Bonds Initiative. At 31 December 2019 Contact remains compliant with the requirements of the
programme. Further information is available on the sustainability section on our website.
B4. NET INTEREST EXPENSE
$m
Unaudited 6 months ended
31 Dec 2019
Unaudited 6 months ended
31 Dec 2018
Audited Year ended
30 June 2019
Interest expense on borrowings (28) (36) (69)
Unwind of discount on provisions (3) (3) (5)
Capitalised interest 3 - -
Interest income - - 4
Net interest expense (28) (39) (70)
Included within interest expense on borrowings is $1 million (31 December 2018: $1 million, 30 June 2019: $2 million) of interest
expense relating to finance leases.
C. Our Assets Notes to the Financial Statements for the six months ended 31 December 2019
C1. INVENTORY
Under the new contractual arrangements with FlexGas, gas held as inventory in storage at the Ahuroa Gas Storage (AGS) facility is
subject to an annual capacity assessment by a third party expert. Aspects of the determination of AGS volumes for 2019 are under
discussion and yet to be formally agreed.
C2. PROPERTY, PLANT AND EQUIPMENT AND INTANGIBLE ASSETS
Property, plant and equipment $m
Unaudited 31 Dec 2019
Unaudited 31 Dec 2018
Audited 30 June 2019
Opening balance 4,126
4,253 4,253
Additions 41
22 43
Depreciation (92)
(84) (169)
Disposals -
(1) (1)
Closing balance 4,075
4,190 4,126
The useful economic life of Taranaki Combined Cycle plant assets (excluding those depreciated on operating hours) has been
reassessed for accounting purposes as a result of changes in the external environment, and the likely outcome that the plant will
be closed once operating hours are fully utilised. As a change in accounting estimate, this has been applied from 1 July 2019, and
has resulted in a $9 million increase to depreciation in the six months ended 31 December 2019.
Included within property, plant and equipment is $27 million (31 December 2018: $29 million, 30 June 2019: $29 million) of lease
assets with a depreciation charge of $2 million for the six months ended 31 December 2019 (31 December 2018: $2 million, 30
June 2019: $5 million).
Included within additions for the six months ended 31 December 2019 is capitalised interest of $3 million in relation to capital
works underway at the Tauhara geothermal field.
Intangibles $m
Unaudited 31 Dec 2019
Unaudited 31 Dec 2018
Audited 30 June 2019
Opening balance 260 272 272
Additions 18 35 52
Amortisation (18) (18) (36)
Disposals - (3) (28)
Closing balance 260 286 260
Current 26 37 14
Non-current 234 249 246
At 31 December 2019, Contact was committed to $13 million of capital expenditure (31 December 2018: $8 million, 30 June 2019:
$22 million) and $31 million of carbon forward contracts (31 December 2019: $7 million, 30 June 2019: $38 million), of which $36
million is due within one year of the reporting period end and $8 million is due between one to two years of the reporting period
end.

14 Contact | Interim Financial Statements Contact | Interim Financial Statements 15
D. Financial Risks Notes to the Financial Statements for the six months ended 31 December 2019
D1. SUMMARY OF DERIVATIVE FINANCIAL INSTRUMENTS
A summary of the balance and movement of derivatives and the impact on Contact’s financial position is provided below grouped by type of hedge relationship.
Unaudited at 31 Dec 2019 Unaudited at 31 Dec 2018 Audited at 30 June 2019
Fair value
hedge Cash flow and fair
value hedge
Cash flow hedge No hedge
relationship Fair value
hedge Cash flow and fair
value hedge
Cash flow hedge No hedge
relationship Fair value
hedge Cash flow and fair
value hedge
Cash flow hedge No hedge
relationship
$m IRS CCIRS IRS Electricity price
derivatives Electricity price
derivatives Total IRS CCIRS IRS Electricity price
derivatives Electricity price
derivatives Total IRS CCIRS IRS Electricity price
derivatives Electricity price
derivatives Total
Carrying value of derivatives - asset 7 78 - 2 7 94 5 57 - 6 6 74 8 78 - 1 6 93
Carrying value of derivatives - liability - (4) (70) (31) (5) (110) - (2) (60) (23) (5) (90) - (4) (77) (29) (3) (113)
Carrying value of hedged borrowings 244 523 - - - 767 255 503 - - - 758 245 524 - - - 769
Fair value adjustments to borrowings (7) (78) - - - (85) (7) (57) - - - (64) (8) (78) - - - (86)
Change in fair value in significant items - - 2 - - 2 (2) - - - - (2) - - - - 2 2 Hedge effectiveness recognised in OCI - 1 2 (12) - (9) - - (7) (25) - (32) - (2) (24) (31) - (57)
Amounts reclassified to profit/(loss) - - 3 10 - 13 - - 1 (3) - (2) - - 1 (6) - (5)
The cross currency interest rate swaps (CCIRS) liability arises from the cash flow hedge component.

16 Contact | Interim Financial Statements Contact | Interim Financial Statements 17
Conclusion
Based on our review, nothing has come to our attention that
causes us to believe that the interim financial statements on
pages 2 to 15 do not:
i. present fairly in all material respects the company’s financial
position as at 31 December 2019 and its financial performance
and cash flows for the six month period ended on that date; and
ii. comply with NZ IAS 34 Interim Financial Reporting.
We have completed a review of the accompanying interim
financial statements which comprise:
the statement of financial position as at 31 December 2019;
the statements of comprehensive income, changes in equity and cash flows for the six month period then ended; and
notes, including a summary of significant accounting policies and other explanatory information.
Basis for conclusion
A review of interim financial statements in accordance with NZ
SRE 2410 Review of Financial Statements Performed by the
Independent Auditor of the Entity (“NZ SRE 2410”) is a limited
assurance engagement. The auditor performs procedures,
consisting of making enquiries, primarily of persons responsible
for financial and accounting matters, and applying analytical and
other review procedures.
As the auditor of Contact Energy Limited, NZ SRE 2410 requires
that we comply with the ethical requirements relevant to the
audit of the annual financial statements.
Our firm has also provided other services to the company in
relation to AGM Scrutineering and trustee reporting. Subject to
certain restrictions, partners and employees of our firm may also
deal with the company on normal terms within the ordinary
course of trading activities of the business of the company. These
matters have not impaired our independence as reviewer of the
company. The firm has no other relationship with, or interest in,
the company.
Use of this Independent Review Report
This report is made solely to the shareholders as a body. Our
review work has been undertaken so that we might state to the
shareholders those matters we are required to state to them in
the Independent Review Report and for no other purpose. To the
fullest extent permitted by law, we do not accept or assume
responsibility to anyone other than the shareholders as a body for
our review work, this report, or any of the opinions we have
formed.
Responsibilities of the Directors for the interim financial
statements
The Directors, on behalf of the company, are responsible for:
the preparation and fair presentation of the interim financial statements in accordance with NZ IAS 34 Interim Financial Reporting;
implementing necessary internal control to enable the preparation of interim financial statements that is fairly presented and free from material misstatement, whether due to fraud or error; and
assessing the ability to continue as a going concern. This includes disclosing, as applicable, matters related to going concern and using the going concern basis of accounting unless they either intend to liquidate or to cease operations, or have no realistic alternative but to do so.
Auditor’s Responsibilities for the review of the interim
financial statements
Our responsibility is to express a conclusion on the interim
financial statements based on our review. We conducted our
review in accordance with NZ SRE 2410. NZ SRE 2410 requires us
to conclude whether anything has come to our attention that
causes us to believe that the interim financial statements are not
prepared, in all material respects, in accordance with NZ IAS 34
Interim Financial Reporting.
The procedures performed in a review are substantially less than
those performed in an audit conducted in accordance with
International Standards on Auditing (New Zealand). Accordingly
we do not express an audit opinion on these interim financial
statements.
This description forms part of our Independent Review Report.
KPMG
Wellington
7 February 2020
Corporate Directory
BOARD OF DIRECTORS
Robert McDonald (Chair)
Victoria Crone
Whaimutu Dewes
Jon Macdonald
David Smol
Elena Trout
Dame Therese Walsh
LEADERSHIP TEAM
Dennis Barnes
Chief Executive Officer
Jan Bibby
Chief People Officer
Venasio-Lorenzo Crawley
Chief Customer Officer
Dorian Devers
Chief Financial Officer
James Kilty
Chief Generation and Development Officer
Catherine Thompson
General Manager, External Relations and General Counsel
REGISTERED OFFICE
Contact Energy Limited
Harbour City Tower
29 Brandon Street
Wellington 6011
New Zealand
Phone: +64 4 499 4001
Fax: +64 4 499 4003
Find us on Facebook, Twitter, LinkedIn and Youtube by
searching for Contact Energy
COMPANY NUMBERS
NZ Incorporation 660760
ABN 68 080 480 477
AUDITOR
KPMG
PO BOX 996
Wellington 6140
REGISTRY
Change of address, payment instructions and investment
portfolios can be viewed and updated online:
investorcentre.linkmarketservices.co.nz
investorcentre.linkmarketservices.com.au
New Zealand Registry
Link Market Services Limited, PO Box 91976, Auckland 1142
Level 11, Deloitte Centre, 80 Queen Street, Auckland 1010
Phone: +64 9 375 5998
Fax: +64 9 375 5990
Australian Registry
Link Market Services Limited, Locked Bag A14, Sydney
South, NSW 1235
680 George Street, Sydney, NSW 2000
Phone: +61 2 8280 7111
Fax: +61 2 9287 0303
INVESTOR ENQUIRIES
Matthew Forbes
GM Corporate Finance
Phone: +64 21 072 8578
SUSTAINABILITY ENQUIRIES
Nakia Randle
Sustainability Advisor
Independent Auditor’s Review Report
To the shareholders of Contact Energy Limited
Report on the interim financial statements