powerpoint presentation...based on management’s current expectations and assumptions. these...
TRANSCRIPT

CAGNY 2019FEBRUARY 19, 2019

This presentation contains forward-looking statements within the meaning of the Private Securities Litigation Reform Act of 1995 that arebased on management’s current expectations and assumptions. These forward-looking statements are subject to certain risks anduncertainties that could cause actual results to differ materially from the potential results discussed in the forward-looking statements. Inparticular, our predictions about future net sales and earnings could be affected by a variety of factors, including: competitive dynamicsin the consumer foods industry and the markets for our products, including new product introductions, advertising activities, pricingactions, and promotional activities of our competitors; economic conditions, including changes in inflation rates, interest rates, tax rates,or the availability of capital; product development and innovation; consumer acceptance of new products and product improvements;consumer reaction to pricing actions and changes in promotion levels; acquisitions or dispositions of businesses or assets, including ouracquisition of Blue Buffalo and issues in the integration of Blue Buffalo and retention of key management and employees; unfavorablereaction to our acquisition of Blue Buffalo by customers, competitors, suppliers, and employees; changes in capital structure; changes inthe legal and regulatory environment, including tax legislation, labeling and advertising regulations, and litigation; impairments in thecarrying value of goodwill, other intangible assets, or other long-lived assets, or changes in the useful lives of other intangible assets;changes in accounting standards and the impact of significant accounting estimates; product quality and safety issues, including recallsand product liability; changes in consumer demand for our products; effectiveness of advertising, marketing, and promotional programs;changes in consumer behavior, trends, and preferences, including weight loss trends; consumer perception of health-related issues,including obesity; consolidation in the retail environment; changes in purchasing and inventory levels of significant customers;fluctuations in the cost and availability of supply chain resources, including raw materials, packaging, and energy; disruptions orinefficiencies in the supply chain; effectiveness of restructuring and cost saving initiatives; volatility in the market value of derivativesused to manage price risk for certain commodities; benefit plan expenses due to changes in plan asset values and discount rates usedto determine plan liabilities; failure or breach of our information technology systems; foreign economic conditions, including currency ratefluctuations; and political unrest in foreign markets and economic uncertainty due to terrorism or war. The company undertakes noobligation to publicly revise any forward-looking statements to reflect any future events or circumstances.
A Reminder on Forward-looking Statements
2

Our Primary Focus is Restoring Consistent Topline Growth
Making Progress on Our “Compete, Accelerate, Reshape” Priorities
Maintaining Margin and Cash Discipline
Reaffirming Full-year Fiscal 2019 Guidance
Today’s Key Messages
3

Our Consumers are at theHeart of Everything We Do
4
Our Purpose
Our StrategyConsumer First: Deeply understand the needs and lives of our consumers and
respond quickly to give them what they want
Our GoalCreate market-leading growth to deliver
top-tier shareholder returns

“Accelerate”Snack BarsIce CreamMexicanNatural & Organic¹
Our Portfolio Today
5
FISCAL 2018 PRO FORMA NET SALES: $17.0 BILLION*
North America RetailConvenience
Stores & Foodservice
Europe & Australia
Asia & Latin America
Pet
BySegment
ByPlatform
Cereal Yogurt
Pet Food
* F18 Pro Forma includes $15.7B consolidated net sales and $1.3B of net sales for Blue Buffalo.
8%
12%15%
25%59%
11%
12%
10%8%
Regional Snacks and Meals
Dough andBaking Mixes
(1) Natural & Organic includes N&O cereal, yogurt, snacks, meals, and other categories.

Brands with $1B+ in retail salesSource: Nielsen and Euromonitor 6
Eight $1B Brands Competing Around the World

Living Our Values Drives Value for Shareholders
7

SalesGrowth
MarginExpansion
CashConversion
CashReturns
Restoring Topline Growth Will Drive Long-term Shareholder Returns
8
OUR SHAREHOLDER RETURN FRAMEWORK

Our Global Growth Priorities
9
COMPETE1
ACCELERATE2
RESHAPE3
Effectively Across All Brands and All Geographies
Our Differential Growth Platforms
the Portfolio for Growth

Competing Effectively through Superior Execution
10
• Remarkable Innovation andBrand Building
• Excellence at Point of Sale
• Differentiated Capabilities inE-commerce and Strategic Revenue Management (SRM)
Goal: Grow with Our Categories (~1%)

Accelerating Our Differential Growth Platforms
11
• Meaningful Scale: 25% of Global Portfolio
• Advantaged Category Growth Rates
• Leading Brand Positions
• Investing in Innovation, Brand Building, and Distribution Expansion
Goal: MSD+ Net Sales Growth

• #1 Wholesome Natural Pet Food Brand
• Leading the Transformation of U.S. Pet Food
• Adds 50-80bps to Organic Growth Profile
Reshaping the Portfolio for Growth
12
Goal: Add 100+ bps to Organic Net Sales Growth
DIVESTITURESACQUISITIONS: BLUE BUFFALO
• Targeting ~5% of Net Sales
• Focusing on Growth Dilutive Platforms with Lower ROIs
• F19 Priorities: Grow the Core, Transition Blue Buffalo, and Deliver Financial Commitments

Our Path to Restoring Consistent Topline Growth
13
NET SALES GROWTH OPPORTUNITY
13
+LSD
Sustainable Growth
Opportunity
Accelerate Differential
Growth Platforms
Reshape Portfolio
F14-F17 CGR*
-1%
Compete Effectively
1 2 3
*Organic Net Sales CGR. Non-GAAP measure. See appendix for reconciliation.

Accelerate Platforms Represent a Tremendous Growth Opportunity
14
HÄAGEN-DAZS NATURAL & ORGANIC OLD EL PASO SNACK BARS
$61B, +MSD $47B, +HSD $4B, +LSD $26B, +MSD
Category Size and Growth
Source: Euromonitor, Nielsen, and company estimates for calendar 2018.

Häagen-Dazs Growth Drivers
15
Remarkable Innovation Distribution
WORLD’S PREMIER SUPER-PREMIUM ICE CREAM BRAND
Global Marketing Campaign

Natural & Organic Growth Drivers
16
SECOND LARGEST U.S. NATURAL & ORGANIC FOOD PRODUCER
Brand Building Innovation Core Distribution

WORLD’S LARGEST MEXICAN FOOD BRAND
Old El Paso Growth Drivers
17
Innovation and Brand Building Support Exciting In-store Events and Execution

Snack Bars Growth Drivers
18
Brand Building and Innovation Global Expansion
GLOBAL LEADER IN SNACK BARS

19
ACCELERATE: CONSUMER INTEGRATIONS

Group President, North America Retail
Jon Nudi
20
CAGNY 2019GENERAL MILLS
COMPETE

• Making Strides on Top and Bottom Line
• Stronger Execution on Innovation, Brand Building, and In Store
• Benefiting from Investments in E-commerce and SRM Capabilities
Competing More Effectively in North America Retail
21

General Mills Retail Sales Trends Improving
(% vs. LY)
22Source: Nielsen xAOC, Q3TD ended January 2019
-7.0%
-3.6%
-0.3%
1.2%
-0.2% -0.2%-1.2%
0.4%0.8%
F17 Q1 Q2 Q3 Q4 Q1 Q2 Q3TD
% +/- LY2-Year Average
F18 F19F17
Annual
-5.0%
U.S. RETAIL SALES

F17 F18 H1 F18 H2 F19 YTDCereal
Bars
Yogurt
Refrigerated Dough
Soup
Hot Snacks
Desserts
Mexican
Fruit Snacks
Natural & Organic
Top 10 Holding / Gaining Share 3 of 10 6 of 10 8 of 10 7 of 10
General Mills U.S. Retail Market Share Performance
23Source: Nielsen xAOC, dollar share, FYTD ended January 2019Natural & Organic includes Nielsen XAOC tracked categories

Competing Effectively with Consumer First Innovation
• Strong F19 H1 Performance and H2 Line-up
• Increased Levels of Innovation
• Consumer First Design Improves Speed and Quality of Ideas
24

POINT OF SALE
PARTNERSHIPS
PACKAGING
MEDIA
A Holistic Approach to Building Brands
25

E-COMMERCE
Investments in Capabilities Driving Growth
26
STRATEGIC REVENUE MANAGEMENT
Optimal Price
Price Pack Architecture
Mix Management
Promotion Optimization
F19 H1 Price/Mix +2pts F19 H1 E-commerce Net Sales +~50%Source: Company estimates, Profitero, Retailer POS, FYTD Ending December 2018North America Retail Net Sales

U.S. Cereal Performance
27
SOLIDIFYING #1 SHARE POSITIONCEREAL CATEGORY IS STRENGTHENING(Retail Sales % vs. LY)
-2.5% -2.3%
-1.0%
0.4%
F17 F18 F19 H1 F19 Q3TD
Source: Nielsen xAOC, Q3TD ended January 2019
30.8
31.6 32.0 31.9
31.5
30.7
F17 F18 F19 YTD
General Mills Top Competitor
(Dollar Share)
Source: Nielsen xAOC, FYTD ended January 2019

Cereal Growth Drivers
28
REMARKABLE BRAND BUILDING AND STRONG EXECUTION IN-STORE
INNOVATION AND VARIETY BRINGS CONSUMERS TO THE CATEGORY
Q4Launch

IMPROVING SHARE PERFORMANCE
U.S. Yogurt Performance
29
DIVERGING TRENDSWITHIN YOGURT SEGMENTS
-2.5
-3.8
-1.5
0.2
F16 F17 F18 F19 YTD
Source: Nielsen xAOC, FYTD month ending January 2019 Source: Nielsen xAOC, Calendar Year 2018
Greek, 45%
Non-Greek, 55%
(% of Category Retail Sales, % vs. LY)
Flat vs. LY
-8% vs. LY
Yogurt Category Retail Sales -4% vs. LY
(General Mills Dollar Share vs. LY)

GROW THE CORE WITH FOCUS ON FUNDAMENTALS AND PRODUCT NEWS
Yogurt Growth Drivers
30
CATEGORY-LEADING INNOVATION UNLOCKING GROWTH IN SIMPLY BETTER

U.S. Meals & Baking Highlights
31
REFRIGERATED BAKED GOODS HOT SNACKS
Retail Sales +6%Retail Sales +2%
Source: Nielsen XAOC, FYTD ended January 2019
OLD EL PASO
Retail Sales +7%
(F19 YTD Retail Sales % vs. LY)

U.S. Snacks and Natural & Organic Highlights
32
SUCCESS ON CORE NATURAL & ORGANICWORK CONTINUES ON U.S. SNACKSSTRONG NUTRITION BAR PERFORMANCE
Retail Sales +15% Retail Sales +14%Retail Sales -3%
Source: Nielsen XAOC, FYTD ended January 2019
(F19 YTD Retail Sales % vs. LY)
Q4Launch

33
COMPETE: CONSUMER INTEGRATIONS

Group President,Pet Segment
Billy Bishop
34
CAGNY 2019GENERAL MILLS
RESHAPE
It All Started with Our Family Dog Blue
35

True BLUE Promise
36
FORMULATED WITH THE FINEST NATURAL INGREDIENTSBRINGING TRANSPARENCY TO THE INDUSTRY

BLUE is Growing the Wholesome Natural Segment
FDM Expansion Plans are On Track and First Wave Customer Results Are Encouraging
Upside for BLUE Across Channels and Pet Food and Treat Segments
BLUE On Track For Continued Growth
37

$27
$29
2015 2018
U.S. PET FOOD RETAIL SALES GROWING IN WHOLESOME NATURAL
Wholesome Natural Outpacing Total Market
38
U.S. PET FOOD RETAIL SALES ($ in billions)
Source: Total U.S. Sales, Nielsen Tracked Channels + company estimates Source: Nielsen Tracked Channels + company estimates, CY 2018
20%
80%
Wholesome Natural+HSD vs. LY
All OtherFlat vs. LY
(% of Pet Food Retail Market Sales, % vs. LY)
CGR = +2%

A Complete Portfolio of Products for Pet Parents
39
PRODUCT LINES FOR ALL LIFE STAGES, SPECIAL NEEDS, AND DIET PREFERENCES
PRODUCT FOR ALL OCCASIONS
Life Protection Formula
Basics
Wilderness
Freedom
Source: Net Sales, 52 Weeks Ending October 2018
Natural Veterinary Diet
79%
15%
6%
Dry Food+LSD vs. LY
Wet Food+DD vs. LY
Treats+DD vs. LY
(% of BLUE Net Sales, % vs. LY)

(1) “LPF” stands for Life Protection Formula, our base natural line. Note: Medium sized dog assumed to be 35 pounds. Price/day based on recommended serving sizes per brand.Source: Prices are auto-ship/subscribe & save price as of Feb 2019 on Amazon, Chewy, and Walmart.com
High Quality Products at Accessible Price Points
40
$18.1030 lbs
$22.9850 lbs
56¢
49¢ $31.9429.1 lbs
$43.4935 lbs
$48.9930 lbs
$58.9922 lbs
$86.99 22 lbs
$45.5935 lbs
33¢
19¢
9¢
Approximate daily cost difference for a medium-sized dog to switch to BLUE LPF1

Positioned For Growth
41
FOOD, DRUG, & MASSE-COMMERCEPET SPECIALTY
#1 Brand in Pet Specialty Fastest Growing FDM Pet Brand#1 Pet Food Brand Online
Source; Net Sales three months ending October 2018, excludes Int’l/Vet/Other
55% of Business 21% of Business24% of Business
SHOP NOW
(% of Net Sales)

OBJECTIVE: REACH MORE PET PARENTS AND FEED MORE PETS
Our Strategic Framework
42
Capitalize on Select
International Opportunities
Grow Market Share in the U.S.
Grow with younger pets and younger pet parents
Drive awareness with pet parents and influencers
Make BLUE more available
Increase our share of
wet foods and treats

4.8 5.26.2
8.4
2015 2016 2017 2018
Grow with Pets and Pet Parents
43
HOUSEHOLD PENETRATION GROWING
+35%
Source: IRI Household panel, All Outlets, Total Blue Buffalo
• Impressive Household Penetration Gains in 2018
• Significant Upside Remains
• Growth with Younger Pets and Pet Parents Outpacing Total BLUE Sales Growth

$1B Spent on Brand Building Since 2003
Drive Awareness with Pet Parents and Influencers
44
IN-STORE DIGITAL TRADITIONAL MEDIA

45
BLUE BUFFALO ADVERTISEMENT

Make BLUE More Available
46Source: Nielsen XAOC
HEALTHY SALES GROWTH IN FIRST WAVE OF FDM CUSTOMERS
$13.8
$17.4$18.8
$21.7
$26.0
12/02/17 02/24/18 05/19/18 08/11/18 11/03/18
4 W/E 12/02/17 4 W/E 02/24/18 4 W/E 05/19/18 4 W/E 08/11/18 4 W/E 11/03/18
FDM EXPANSION HAS BEEN SUCCESSFUL(Retail Sales, $in millions, 4 weeks ending)
Source: Nielsen and IRI: Kroger, Target, Publix, Meijer
7.4 8.0$ Share75% of FDM Buyers are New to BLUE!
Source: InfoScout Panel 52w/e 11/18/18
(Retail Sales, $ in millions, 12 weeks ending)
8/11/18 11/4/18
+11%

Significant Expansion Plans On Track in F19
47
1
17
25
32
Jul 2017 Oct 2017 Apr 2018 Oct 2018 Apr 2019Target
BLUE BUFFALO U.S. FDM DISTRIBUTIONH2 FDM Expansion Plans:• Double Distribution (% ACV)• Expand Product Offerings
Source: Nielsen xAOC
(% ACV)
65% ACV

Increase Share of Wet Foods and TreatsBLUE PRODUCT MIX SHIFTING TO HIGHER MARGIN ITEMS IN WET FOOD AND TREATS
(% of Retail Sales)
Source: Nielsen xAOC + Pet Specialty, CY 2018
55%
79%62%
45%
21%38%
Total Category Pet Superstores FDMDry Food Wet Food & Treats
Blue BuffaloCategory
48
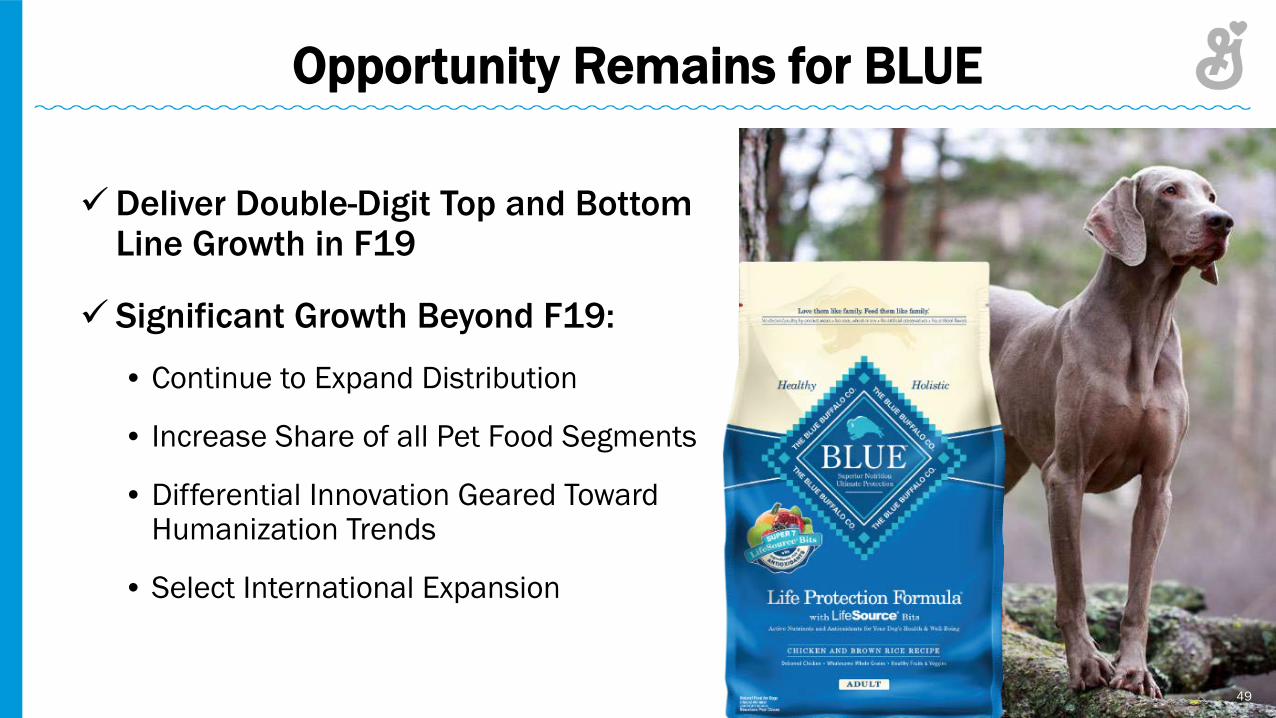
Deliver Double-Digit Top and Bottom Line Growth in F19
Significant Growth Beyond F19:
• Continue to Expand Distribution
• Increase Share of all Pet Food Segments
• Differential Innovation Geared TowardHumanization Trends
• Select International Expansion
Opportunity Remains for BLUE
49

50
Chief Financial OfficerDon Mulligan
CAGNY 2019FINANCIAL OVERVIEW
GENERAL MILLS

SalesGrowth
MarginExpansion
CashConversion
CashReturns
Four Levers to Drive Shareholder Returns
51
+MSDAdj. Operating Profit*
Long-term Target: +LSD
Organic Sales*
≥ 95%Adj. EAT to FCF*
≥ 90%of FCF*
*Non-GAAP measures.

15.9%16.6%
F15 F18
+70 bps
ADJUSTED OP PROFIT MARGIN* (% of Net Sales)
Generated Significant Cost Savingsin Fiscal 2015-2018
52
• Cumulative COGS HMM Savings = $1.6B
• Additional Project Savings = $700MM
Restructured Global Supply Chain
Realigned Global Org Structure
Implemented ZBB
F15-F18 COST SAVINGS DRIVERS
*Non-GAAP measure. See appendix for reconciliation. Reflects new Retirement and Postemployment Benefit reporting requirement.

$391 $396
$450
F17 F18 F19 Target
53
COGS HMM SAVINGS($ in Millions)
• Record Levels of HMM Savings Includes Global Sourcing
• SRM Driving Increased Price/Mix
• Further Supply Chain Optimization
• Enterprise Process Transformation
Actions to Support Profitabilityin Fiscal 2019 and Beyond

ENTERPRISE PROCESS TRANSFORMATION
Further Global Efficiency Opportunities
54
DEMAND & SUPPLY PLANNINGGO-TO-MARKET FINANCE
Improved Cost Visibility
Enhanced Technology
New Reporting Suite

$1.6 $1.4
$1.2
$0.7 $0.8
$0.6
34
29
24
810
00
5
10
15
20
25
30
35
40
$0.0
$0.2
$0.4
$0.6
$0.8
$1.0
$1.2
$1.4
$1.6
$1.8
F13 F14 F15 F16 F17 F18 F19 Plan
Core Working Capital CWC Days
($ in Billions)
Delivering Working Capital Improvement
55
-62% Cum Decline
Lower than F18
F19 Target

49
-36
GIS
0
Opportunities to Drive FurtherCore Working Capital Improvement
56
Top Quartile
Core Working Capital DaysGlobal CPG Peer Median = 10 Days
Source: CapIQ, peer fiscal 2018/calendar year 2017.Industry Peer Group – see 2018 proxy for full list.

(3-Year Rolling, $ in Billions)
Free Cash Flow Performance
57
$5.3
$6.2 $6.3
$5.9 $5.7
$6.0 $6.2
101%
115% 115%108%
103%108%
112%
F11-F13 F12-F14 F13-F15 F14-F16 F15-F17 F16-F18 Latest 12 Qtrs
+13% Cum Increase
Free Cash Flow* Free Cash Flow Conversion**Non-GAAP measure. See appendix for reconciliation. Adjusted for the adoption of new accounting requirements.

Priorities Targets Recent Allocation
1) Capital Investments ~4% of Net Sales Cost SavingsGrowth Initiatives
2) Dividends Grow with Earnings 5-yr CGR: +8%¹
3) Strategic M&A
4) Share Repurchases -2% Annual Avg.* 5-yr CGR: -3%¹
Long-run Capital Allocation Strategy
58
CAPITAL ALLOCATION PRIORITIES
Share Repurchases
CapEx
Dividends
M&A
F15-F17 USES OF CASH
(1) Compound annual growth rate for Fiscal 2013-2018. *Annual average net share count reduction over multiyear time frame.
109% of FCF Returned to Shareholders

Debt Repayment
CapEx
Dividends
Share Repurchas
es
Capital Allocation PrioritiesPost-Blue Buffalo Acquisition
59*Non-GAAP measure. See appendix for reconciliation.
• Maintain Current Dividend Per ShareCurrent Dividend Yield ~4.4%
• Share Repurchases and Large-scale M&A on Hold
• F18 Net Debt-to-Pro Forma Adjusted EBITDA* Ratio of 4.2x Targeting 3.5x by F20
CAPITAL ALLOCATION ADJUSTMENTSESTIMATED F19-F20 USES OF CASH

SalesGrowth
MarginExpansion
CashConversion
CashReturns
Four Levers to Drive Shareholder Returns
60

On Track to Deliver 2019 Full-year Targets
61
KEY FINANCIAL METRICSF19-1H
RESULTSFISCAL 2019
OUTLOOK
Net Sales Growth +8%¹ +9 to +10%²
Organic Net Sales Growth* Flat Flat to +1%
Adjusted Operating Profit Growth* +5%¹ +6 to +9%²
Adjusted Diluted EPS Growth* +1%¹ Flat to -3%²
Free Cash Flow Conversion* 120% >95%
One-time purchase accounting adjustment a headwind to Op Profit (4 pts) and EPS (5 pts) in F19-1H
*Non-GAAP measure. See appendix for reconciliation.(1) Constant-currency growth rate. Non-GAAP measure. See appendix for reconciliation. (2) Constant-currency growth rate. Non-GAAP measure.

Our fiscal 2019 outlook for organic net sales growth, constant currency adjusted operating profit and adjusted diluted EPS, and free cash flow are non-GAAP financial measures that exclude, or have otherwise been adjusted for, items impacting comparability, including the effect of foreign currency exchange rate fluctuations, restructuring charges and project-related costs, acquisition transaction and integration costs, acquisitions, divestitures and mark-to-market effects. We are not able to reconcile these forward-looking non-GAAP financial measures to their most directly comparable forward-looking GAAP financial measures without unreasonable efforts because we are unable to predict with a reasonable degree of certainty the actual impact of changes in foreign currency exchange rates and commodity prices or the timing or impact of acquisitions, divestitures and restructuring actions throughout fiscal 2019. The unavailable information could have a significant impact on our fiscal 2019 GAAP financial results.
For fiscal 2019, we currently expect: foreign currency exchange rates (based on blend of forward and forecasted rates and hedge positions) to reduce net sales growth by 1-2 percent; acquisitions and divestitures to increase net sales growth by high single digits; foreign currency exchange rates to have an immaterial impact on adjusted operating profit and adjusted diluted EPS growth; and total restructuring charges and project-related costs related to actions previously announced to total approximately$85 million.
A Reminder on Non-GAAP Guidance
62

Reconciliation of Organic Net Sales Growth
63
(Fiscal Years)
Full Year
Organic Volume
Organic Price/Mix
Organic Net Sales
Foreign Exchange
Acquisitions & Divestitures 53rd Week
Reported Net Sales
Growth
2015 (2) pts 2 pts Flat (3) pts - 1 pt (2) %
2016 Flat Flat Flat (4) pts (1) pt (1) pt (6) %
2017 (7) pts 3 pts (4) % (1) pt (1) pt - (6) %

Reconciliation of Adjusted Operating Profit Margin
64
% of Net Sales
2018 2015
Operating profit as reported 15.4 % 11.8 %Mark-to-market effects (0.2) 0.5Divestitures (gain) loss, net - -Restructuring costs 0.5 1.9Project-related costs - 0.1Acquisition transaction and integration costs 0.3 0.1Intangible asset impairments 0.6 1.5
Adjusted operating profit margin 16.6 % 15.9 %
(Fiscal Years)

Reconciliation of Free Cash Flow and Free Cash Flow Conversion
65
(Fiscal Years, $ in Millions)2018 2017 2016 2015 2014 2013 2012 2011
Net earnings, including earnings attributable to redeemable and noncontrolling interests $2,163 $1,701 $1,737 $1,259 $1,861 $1,892 $1,589 $1,804
Mark-to-market effects* (22) (9) (40) 56 (30) (3) 66 (60)
Divestitures (gain) loss* - 9 (66) - (36) - - -Tax-related items 41 - - 79 - (85) - (89)
Acquisition transaction and integration costs* 58 - - 10 - 9 10 -
Venezuela currency devaluation* - - - 8 58 21 - -
Restructuring costs* 61 154 161 218 4 16 64 3
Project-related costs* 8 28 37 8 - - - -
Provisional net tax benefit (523) - - - - - - -
CPW restructuring costs, net of tax 2 - - - - - - -
Intangible asset impairments* 65 - - 177 - - - -Adjusted net earnings, including earnings attributable to redeemable and noncontrolling interests $1,853 $1,884 $1,829 $1,815 $1,856 $1,850 $1,729 $1,657
Net cash provided by operating activities, as reported $2,841 $2,415 $2,764 $2,648 $2,622 $3,048 $2,512 $1,678Purchases of land, buildings, and equipment (623) (684) (729) (712) (664) (614) (676) (649)Free cash flow $2,218 $1,731 $2,035 $1,936 $1,959 $2,434 $1,836 $1,029 Free cash flow, rolling 3-year $5,984 $5,702 $5,930 $6,329 $6,229 $5,299 Free cash flow conversion, rolling 3-years 108% 103% 108% 115% 115% 101%
*See reconciliation of Income Taxes on Adjusting Items. Table does not foot due to rounding.

Reconciliation of Free Cash Flow and Free Cash Flow Conversion for Latest 12 Quarters
66
(Fiscal Years, $ in Millions)
*See reconciliation of Income Taxes on Adjusting Items. Table does not foot due to rounding.
Latest 12 Quarters 2019 1H 2018 2017 2016 2H
Net earnings, including earnings attributable to redeemable and noncontrolling interests $5,369 $747 $2,163 $1,701 $758
Provisional net tax benefit (523) - (523) - -Tax-related items 41 - 41 - -Divestitures loss* 31 - - 9 22Mark-to-market effects* (31) 33 (22) (9) (33)Restructuring costs* 267 2 61 154 50Project-related costs* 55 1 8 28 18
Acquisition transaction and integration costs* 70 12 58 - -
CPW restructuring costs, net of tax 7 5 2 - -
Intangible asset impairments* 223 158 65 - -
Hyperinflationary accounting* 3 3 - - -
Investment valuation adjustments* (10) (10) - - -Adjusted net earnings, including earnings attributable to redeemable and noncontrolling interests $5,503 $951 $1,853 $1,884 $815
Net cash provided by operating activities, as reported $8,181 $1,396 $2,841 $2,415 $1,528Purchases of land, buildings, and equipment (1,997) (254) (623) (684) (436)Free cash flow $6,184 $1,142 $2,218 $1,731 $1,092Free cash flow conversion, rolling 3-years 112%
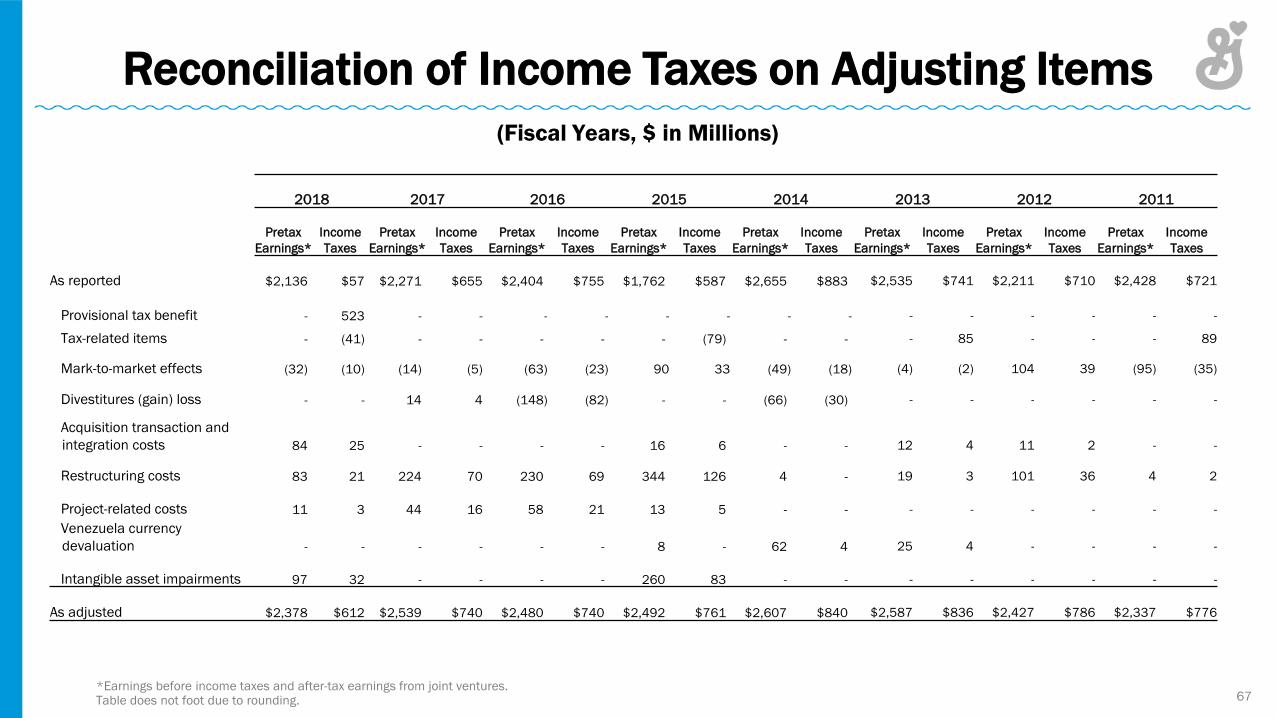
Reconciliation of Income Taxes on Adjusting Items
67
(Fiscal Years, $ in Millions)
2018 2017 2016 2015 2014 2013 2012 2011
Pretax Earnings*
Income Taxes
Pretax Earnings*
Income Taxes
Pretax Earnings*
Income Taxes
Pretax Earnings*
Income Taxes
Pretax Earnings*
Income Taxes
Pretax Earnings*
Income Taxes
Pretax Earnings*
Income Taxes
Pretax Earnings*
Income Taxes
As reported $2,136 $57 $2,271 $655 $2,404 $755 $1,762 $587 $2,655 $883 $2,535 $741 $2,211 $710 $2,428 $721
Provisional tax benefit - 523 - - - - - - - - - - - - - -
Tax-related items - (41) - - - - - (79) - - - 85 - - - 89
Mark-to-market effects (32) (10) (14) (5) (63) (23) 90 33 (49) (18) (4) (2) 104 39 (95) (35)
Divestitures (gain) loss - - 14 4 (148) (82) - - (66) (30) - - - - - -
Acquisition transaction and integration costs 84 25 - - - - 16 6 - - 12 4 11 2 - -
Restructuring costs 83 21 224 70 230 69 344 126 4 - 19 3 101 36 4 2
Project-related costs 11 3 44 16 58 21 13 5 - - - - - - - -Venezuela currency devaluation - - - - - - 8 - 62 4 25 4 - - - -
Intangible asset impairments 97 32 - - - - 260 83 - - - - - - - -
As adjusted $2,378 $612 $2,539 $740 $2,480 $740 $2,492 $761 $2,607 $840 $2,587 $836 $2,427 $786 $2,337 $776
*Earnings before income taxes and after-tax earnings from joint ventures. Table does not foot due to rounding.

Reconciliation of Income Taxes on Adjusting Items for Latest 12 Quarters
68
(Fiscal Years, $ in Millions)
Latest 12 Quarters 2019 1H 2018 2017 2016 2H
Pretax Earnings* Income Taxes
Pretax Earnings* Income Taxes
Pretax Earnings* Income Taxes
Pretax Earnings* Income Taxes
Pretax Earnings* Income Taxes
As reported $6,295 $1,175 $924 $217 $2,136 $57 $2,271 $655 $964 $245
Provisional tax benefit - 523 - - - 523 - - - -
Tax-related items - (41) - - - (41) - - - -
Mark-to-market effects (55) (25) 43 10 (32) (10) (14) (5) (52) (19)
Divestitures loss 64 33 - - - - 14 4 51 29
Acquisition transaction and integration costs 99 29 15 4 84 25 - - - -
Restructuring costs 374 107 2 0 83 21 224 70 65 15
Project-related costs 85 29 1 0 11 3 44 16 28 10
Intangible asset impairments 303 79 206 47 97 32 - - - -
Hyperinflationary accounting 3 - 3 - - - - - - -
Investment valuation adjustments (13) (3) (13) (3) - - - - - -
As adjusted $7,155 $1,907 $1,182 $276 $2,378 $612 $2,539 $740 $1,055 $280
*Earnings before income taxes and after-tax earnings from joint ventures. Table does not foot due to rounding.

Full Year 2018Total Debt $15,818.6Cash 399.0Net Debt $15,419.6
Pro forma net earnings attributable to General Mills, as reported $2,252.4Net earnings, attributable to redeemable and noncontrolling interests 32.0After tax earnings from joint ventures (84.7)Income taxes 104.3
Earnings before income taxes and after tax earnings from joint ventures $2,304.0Interest, net 527.8Depreciation and amortization 642.6
Pro forma EBITDA $3,474.4Mark-to-market effects (32.1)Restructuring costs 82.7Project-related costs 11.3Intangible asset impairments 96.9
Adjusted pro forma EBITDA $3,633.2
Net Debt $15,419.6Adjusted pro forma EBITDA $3,633.2Net debt-to-pro forma adjusted EBITDA ratio 4.2
Reconciliation of Fiscal 2018Net Debt-to-Pro Forma Adjusted EBITDA Ratio
69
(Fiscal Year, $ in Millions)

Cash Returns to Shareholders
70
(Fiscal Years, $ in Millions)
2017 2016 2015
Dividends paid $1,135 $1,072 $1,018
Purchases of common stock for treasury 1,652 607 1,162 Proceeds from common stock issued on exercised options (113) (172) (164)
Total cash return to shareholders $2,674 $1,507 $2,016
Cash returns, rolling 3-year $6,197
Cash returns %, rolling 3-year 109%

Reconciliation of First Half Fiscal 2019 Constant-currency Net Sales Growth
71
2019
Percentage Change in Net Salesas Reported
Impact of Foreign Currency Exchange
Percentage Change in Net Sales on a Constant-
currency Basis
1H 7% (1) pt 8 %
(Fiscal Year)

Reconciliation of First Half Fiscal 2019 Organic Net Sales Growth
72
2019
Organic Volume
Organic Price/Mix
Organic Net Sales
Foreign Exchange
Acquisitions & Divestitures
Reported Net Sales Growth
1H (2) pts 2 pts Flat (1) pt 8 pts 7 %
(Fiscal Year)

Reconciliation of First Half Fiscal 2019 Adjusted Operating Profit Constant-currency Growth Rate
73
1H
2019 2018 ChangeOperating profit as reported $ 1,148.5 $ 1,314.3 (13) %
Mark-to-market effects 42.9 (6.3)Restructuring charges 2.4 19.7Project-related costs 1.2 5.4Acquisition integration costs 15.5 -Asset impairments 205.8 -Hyperinflationary accounting 3.2 -Investment valuation adjustments (13.0) -
Adjusted operating profit, excluding certain items affecting comparability $ 1,406.5 $ 1,331.1 6 %
Foreign currency exchange impact 1 ptAdjusted operating profit growth, excluding certain items affecting comparability, on a constant-currency basis 5 %
(Fiscal Year, $ in Millions)

Reconciliation of First Half Fiscal 2019 Adjusted Diluted EPS and Related Constant-currency Growth Rate
74
1HPer Share Data 2019 2018 ChangeDiluted earnings per share, as reported $ 1.22 $ 1.43 (15) %Tax adjustment* - 0.07Mark-to-market effects* 0.06 -Acquisition integration costs* 0.02 -CPW restructuring charges 0.01 -Restructuring charges* - 0.02Project-related costs* - 0.01Asset impairments* 0.26 -Investment valuation adjustments* (0.01) -
Diluted earnings per share, excluding certain items affecting comparability $ 1.56 $ 1.53 2 %
Foreign currency exchange impact 1 ptDiluted earnings per share growth,
excluding certain items affecting comparability, on a constant-currency basis 1 %
*See reconciliation of tax rate excluding items for tax impact of individual items.
(Fiscal Years)

Reconciliation of First Half Fiscal 2019 Free Cash Flow and Free Cash Flow Conversion
75
2019-1HNet earnings, including earnings attributable to redeemable and noncontrolling interests $747.1
Mark-to-market effects* 33.0Restructuring charges* 2.2Project-related costs* 0.9Acquisition integration costs* 11.9Asset impairments* 158.4Hyperinflationary accounting* 3.2Investment valuation adjustments* (10.0)CPW restructuring charges, net of tax 4.7
Adjusted net earnings, including earnings attributable to redeemable and noncontrolling interests $951.4
Net cash provided by operating activities, as reported $1,396.5Purchases of land, buildings, and equipment (253.8)
Free cash flow $1,142.7Free cash flow conversion rate 120%
*See reconciliation of Income Taxes on Adjusting Items.
(Fiscal Year, $ in Millions)

Reconciliation of First Half Fiscal 2019 Tax Rate Excluding Items
76
1H2019 2018
Pretax Earnings*
Income Taxes
Pretax Earnings*
Income Taxes
As reported $924.2 $217.3 $1,208.3 $403.4Mark-to-market effects 42.9 9.9 (6.3) (2.3)Restructuring charges 2.4 0.2 19.7 5.9Project-related costs 1.2 0.3 5.4 1.8Acquisition integration costs 15.5 3.6 - -Tax adjustment - - - (42.2)Asset impairments 205.8 47.4 - -Hyperinflationary accounting 3.2 - - -Investment valuation adjustments (13.0) (3.0) - -
As adjusted $1,182.2 $275.7 $1,227.1 $366.6Effective tax rate:
As reported 23.5% 33.4 %As adjusted 23.3% 29.9 %
Sum of adjustments to income taxes $58.4 $(36.8)Average number of common shares - diluted EPS 603.8 583.6Impact of income tax adjustments on diluted EPS
excluding certain items affecting comparability $0.10 $(0.06)*Earnings before income taxes and after-tax earnings from joint ventures.
(Fiscal Year, $ in Millions)