about sales forecasts
TRANSCRIPT

5 POPULAR BELIEFSABOUT SALES FORECASTS
Is sales forecasting still a complex discipline?
How can it easily be deployed in your company?

1
Sales forecasting is essential for Supply Chain stock optimization
and inventory flow management.
Although a simple concept, sales forecasting is misunderstood by many. To fully comprehend the
attributes of sales forecasting, it is vital to understand the nature of a forecast, how it is used, created and
interpreted. Intuition alone is inadequate when referencing mathematical
models, impact factors or probability. Here, we examine five popular beliefs about sales forecasts in the Supply Chain. We
clarify the fundamental concepts with examples to help readers use the sales forecasts wisely and with unbeatable results.
2
1. SALES FORECASTS ARE ALWAYS FALSE

3
« SALES FORECASTS ARE ALWAYS FALSE »
Before identifying wether a forecast is false, it’s essential to know what it is and what it really means. Unlike intuition, a sales forecast is not a «bet», or a number of sales that will take place at a given time for a given product at a given location.
In the broadest sense, a forecast assesses the weight associated with each possible value for the quantity to be sold. This weighting is called a probability. In Figure 1, we provide two forecast examples (a and b) and do not recognize only one single possible sale value, but several weighted values.
Unlike the probability-based view describing future possibilities, far often do we find the sales forecast expressed or understood as a single whole number, associated with some remaining uncertainty. Realistically, this number represents the average quantity sold (or «expected» quantity). It should be noted that there are more possible values outside of this single averaged value. In Figure 1 (b), we see that the average value is 1.40, but the forecast indicates that it is more likely to sell the quantity of 0, 1 or 2. The probability of selling three or more
is relatively low. In all cases, the quantity sold will be different from the expected value (1.40 as in Figure 1). A naive reading would concur that the forecast is «false.”
For supply use, the forecast of sales as expressed by probabilities is the necessary figure since it directly links the forecast, target service rate and quantity to be supplied. In Figure 1, let us imagine that we want to determine what is the quantity of stock that guarantees a service rate of at least 98% (to have a maximum 2% stock-out rate). In Figure 1 (a), the probability of selling the quantity of 0 or 1 or 2 is equal to the sum of probabilities of selling 0, 1 or 2 (here, 98.5%). This emphasizes the importance of having at least two pieces in stock to satisfy the desired service level. In example (b), four pieces would be kept in stock by using the same reasoning.
A first glance of the two sales forecasts would conclude that one piece (example a) and two pieces (example b) be respectively stocked. It must be noted that these figures fall short in guaranteeing the desired rate of service.
Figure 1:
Two sales forecast profiles for an article in a point of sale on a given day. The left profile (a) predicts an average of 0.21 sales, with a probability of nearly 90% selling 0, while the right profile (b) predicts an ave-rage of 1.40 sales with a 35% probability of selling 1. This profile is more «uncer-tain» than the one on the left.

4
A common point of view in relation to this scenario is: «It is useless to make sales forecasts, they are too false to be useful». Physics can address this view by two fundamental truths:
• Truth #1: It takes time to transport stock from point A to point B. When the stock arrives at point B for being used, several days or months have passed.
• Truth #2: The stock needed at point B is subject to demand variations and logistic constraints.
Today, there are high-performance sales forecasting methods that significantly reduce inventories from 5% to 50% across the supply chain. Security stocks are reduced to the absolute minimum without creating stock out due to a strong estimation of the uncertainty. They also work when sales are low, as we will see in the next point.
We now understand why forecasts are not as «false» as a first glance reading might suggest,and that the various demands for optimal Supply Chain management must be based on quality forecasts.
If no forecasts are made, how can we define the stock required for point B in the future? We can identify «security stock», but recognize it as a vehicle to mitigate demand uncertainty. This brings the question ‘how do you move forward when you have to calibrate the security stock?’ Anticipating sales is a vital teller of when security stock should be calibrated. All in all, sales forecasts are always created in explicit, implicit manners, with or without sophisticated tools. It is important to always establish a vision of future sales, while keeping uncertainty in mind.
A
B

5
2. DON’T FORECAST WHEN SALES ARE LOW

6
DON’T FORECAST WHEN SALES ARE LOW
Sales forecasting for rare-selling items does not work with traditional statistical methods such as moving averages or even more sophisticated approaches (ARIMA models, Winter-Holt, etc.).
Figure 2:
Rare sales are characterized by long periods without any sales (green dots), with a sale from time to time (orange dot).
Figure 3:
Rare sales of the same item over time in several stores. We see that some stores have more sales than others (by row), however specific days also bring more sales over all stores combined (by column).
Figure 4:
The crossing with similar articles makes it possible to better determine a generalizable behavior.
Figure 2 shows an example of rare sales. Observing an item in a store over time doesn’t provide enough information to make usable forecasts. On the other hand, in Figure 3, if we observe this same article in several points of sale, we see the phenomena relative to the store or the period. This enables us to estimate the probabilities of daily sales per store.
It’s possible to refine the sales knowledge of any given article by also analyzing the sales of «similar» items at the same point of sale (Figure 4). The correlations between these sales can be identified and provide a statistically significant consolidated sample.
7
With reference to the supply of rare-selling items, another concern is: ‘Why make a forecast for a rare sale item, which is sold bi-monthly? At the end we will provide a stock of one piece.’
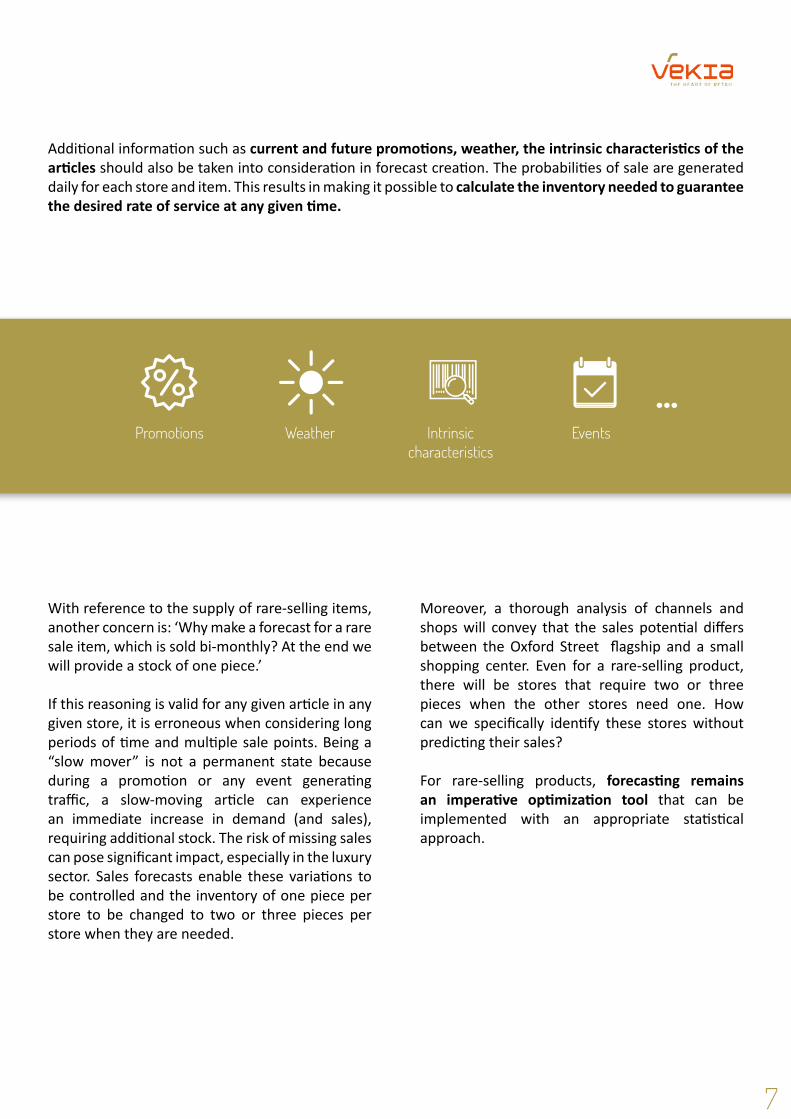
If this reasoning is valid for any given article in any given store, it is erroneous when considering long periods of time and multiple sale points. Being a “slow mover” is not a permanent state because during a promotion or any event generating traffic, a slow-moving article can experience an immediate increase in demand (and sales), requiring additional stock. The risk of missing sales can pose significant impact, especially in the luxury sector. Sales forecasts enable these variations to be controlled and the inventory of one piece per store to be changed to two or three pieces per store when they are needed.
Additional information such as current and future promotions, weather, the intrinsic characteristics of the articles should also be taken into consideration in forecast creation. The probabilities of sale are generated daily for each store and item. This results in making it possible to calculate the inventory needed to guarantee the desired rate of service at any given time.
Moreover, a thorough analysis of channels and shops will convey that the sales potential differs between the Oxford Street flagship and a small shopping center. Even for a rare-selling product, there will be stores that require two or three pieces when the other stores need one. How can we specifically identify these stores without predicting their sales?
For rare-selling products, forecasting remains an imperative optimization tool that can be implemented with an appropriate statistical approach.
Promotions Weather Intrinsiccharacteristics
Events

8
3. TOO MANY FACTORSIN A SALES FORECAST
9
TOO MANY FACTORS IN A SALES FORECAST
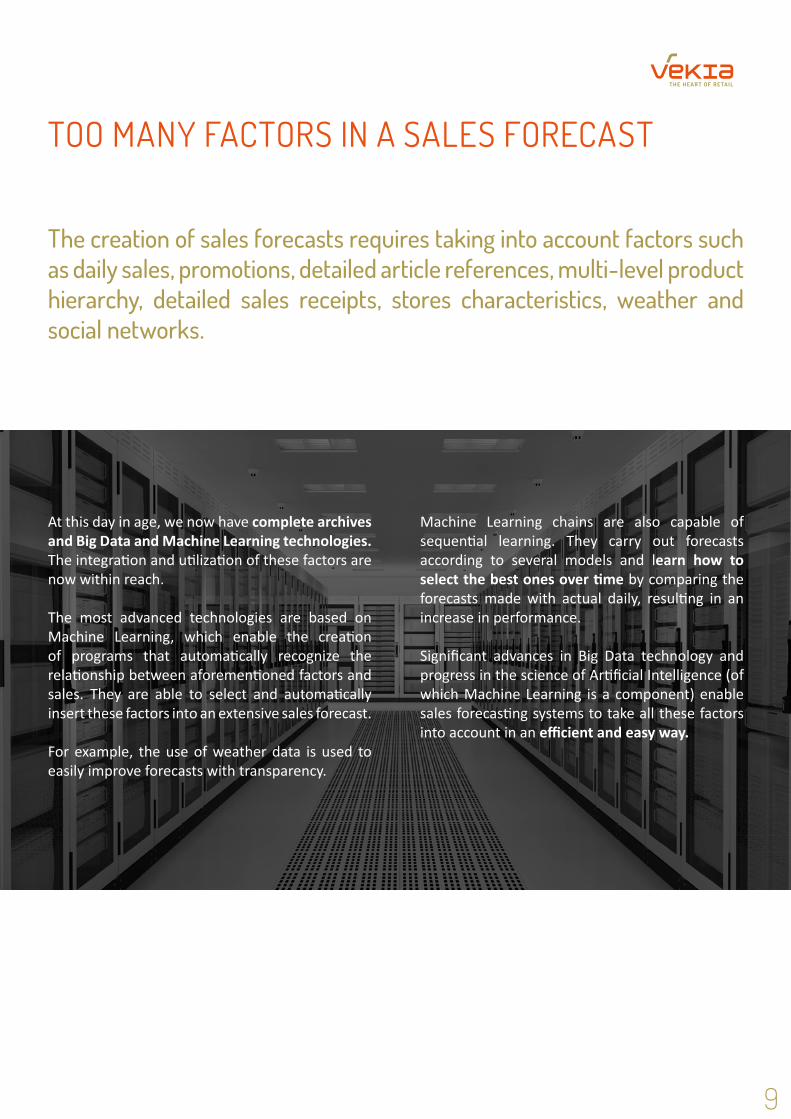
The creation of sales forecasts requires taking into account factors such as daily sales, promotions, detailed article references, multi-level product hierarchy, detailed sales receipts, stores characteristics, weather and social networks.
At this day in age, we now have complete archives and Big Data and Machine Learning technologies. The integration and utilization of these factors are now within reach.
The most advanced technologies are based on Machine Learning, which enable the creation of programs that automatically recognize the relationship between aforementioned factors and sales. They are able to select and automatically insert these factors into an extensive sales forecast.
For example, the use of weather data is used to easily improve forecasts with transparency.
Machine Learning chains are also capable of sequential learning. They carry out forecasts according to several models and learn how to select the best ones over time by comparing the forecasts made with actual daily, resulting in an increase in performance.
Significant advances in Big Data technology and progress in the science of Artificial Intelligence (of which Machine Learning is a component) enable sales forecasting systems to take all these factors into account in an efficient and easy way.

10
4. ONLY ONE SALE FORECAST IS NEEDED
11
ONLY ONE SALE FORECAST IS NEEDED
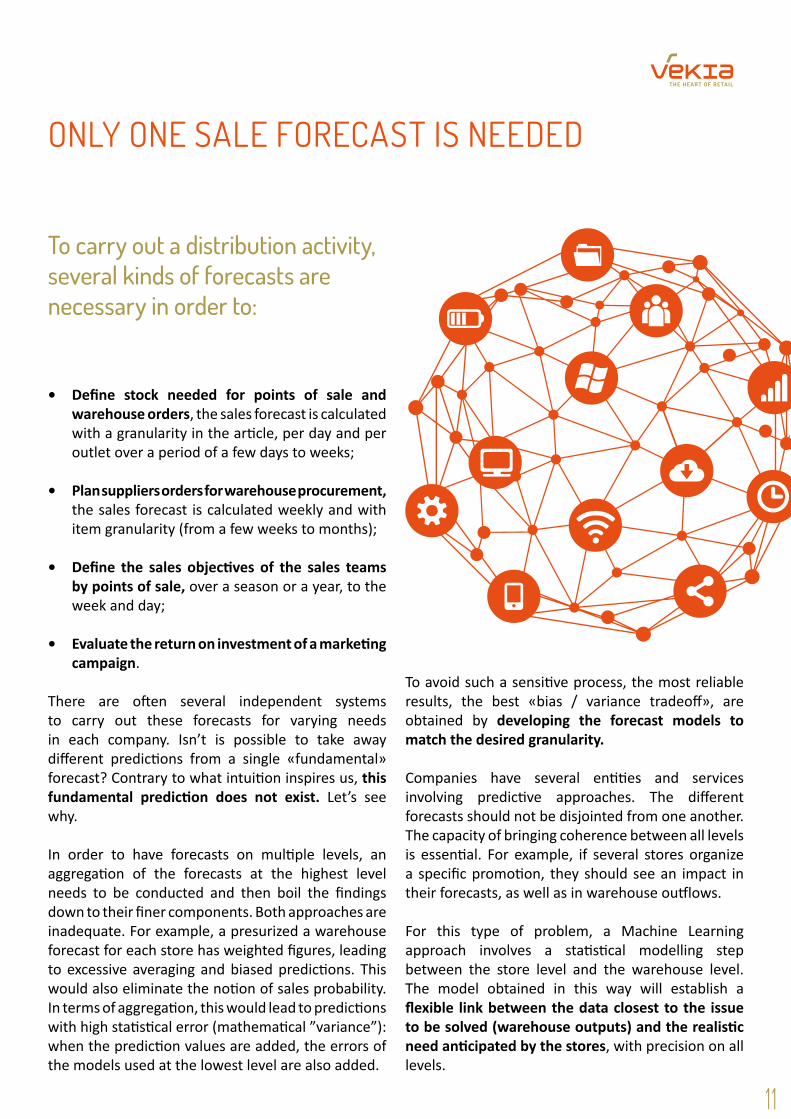
To carry out a distribution activity, several kinds of forecasts are necessary in order to:
• Define stock needed for points of sale and warehouse orders, the sales forecast is calculated with a granularity in the article, per day and per outlet over a period of a few days to weeks;
• Plan suppliers orders for warehouse procurement, the sales forecast is calculated weekly and with item granularity (from a few weeks to months);
• Define the sales objectives of the sales teams by points of sale, over a season or a year, to the week and day;
• Evaluate the return on investment of a marketing campaign.
There are often several independent systems to carry out these forecasts for varying needs in each company. Isn’t is possible to take away different predictions from a single «fundamental» forecast? Contrary to what intuition inspires us, this fundamental prediction does not exist. Let’s see why.
In order to have forecasts on multiple levels, an aggregation of the forecasts at the highest level needs to be conducted and then boil the findings down to their finer components. Both approaches are inadequate. For example, a presurized a warehouse forecast for each store has weighted figures, leading to excessive averaging and biased predictions. This would also eliminate the notion of sales probability. In terms of aggregation, this would lead to predictions with high statistical error (mathematical ”variance”): when the prediction values are added, the errors of the models used at the lowest level are also added.
To avoid such a sensitive process, the most reliable results, the best «bias / variance tradeoff», are obtained by developing the forecast models to match the desired granularity.
Companies have several entities and services involving predictive approaches. The different forecasts should not be disjointed from one another. The capacity of bringing coherence between all levels is essential. For example, if several stores organize a specific promotion, they should see an impact in their forecasts, as well as in warehouse outflows.
For this type of problem, a Machine Learning approach involves a statistical modelling step between the store level and the warehouse level. The model obtained in this way will establish a flexible link between the data closest to the issue to be solved (warehouse outputs) and the realistic need anticipated by the stores, with precision on all levels.

12
5. USING SALES FORECASTSIS COMPLICATED

13
USING SALES FORECASTS IS COMPLICATED
For example, the in-store inventory manager will only see order proposals, with a detailed explanation of all its steps (cadence, frequency, packaging, current inventory and overall period sales forecast). Analysis and forecasting management will be entrusted to a specialized team of inventory planners and forecasters, oftentimes operating from headquarters.
A powerful procurement tool is designed taking into account the expertise of its various users. It directly calculates a probable forecast to the desired granularity, considering many real world constraints (budget, financing, delays, merchandising, stock shortage, service rate,
preparation and reception capacity). To support the business need, the tool speaks the language of the end user. Depending on the targeted business, the forecast can be transformed into a calculation of inventory to be supplied, budget forecasts, recommendations for supply width and simulation of commercial operations.
The next-generation Supply Chain forecasting tools are efficient, ergonomic and highly automated. A thorough training in mathematics to use the forecast is unnecessary because it is an intermediate datum which drives the desired result: an efficient and controlled Supply Chain.
The best sales forecasts are misunderstood and misused, therefore not bringing their expected value. For this reason, we must define the business gesture upstream to not confront the user with concepts left unmastered.

14
VEKIA
Euratechnologies - Bâtiment Urbawood58 allée Marie-Thérèse Vicot-Lhermitte59000 LILLE
[email protected] - www.vekia.frTél. + 33 (0) 3 51 08 11 62
4 Crown Place, EC2A 4BT, LondonUnited Kingdom
[email protected] - www.vekia.co.ukTel : + 44 020 3290 8482
© Copyright April 2017 VEKIA SAS - All rights reserved.
...