abdul majid, jamaliah (2013) accounting choices relating...
TRANSCRIPT

Glasgow Theses Service http://theses.gla.ac.uk/
Abdul Majid, Jamaliah (2013) Accounting choices relating to goodwill impairment: Evidence from Malaysia. PhD thesis. http://theses.gla.ac.uk/4095/ Copyright and moral rights for this thesis are retained by the author A copy can be downloaded for personal non-commercial research or study, without prior permission or charge This thesis cannot be reproduced or quoted extensively from without first obtaining permission in writing from the Author The content must not be changed in any way or sold commercially in any format or medium without the formal permission of the Author When referring to this work, full bibliographic details including the author, title, awarding institution and date of the thesis must be given

Accounting choices relating to goodwill impairment:
Evidence from Malaysia
Jamaliah Abdul Majid
BA Hons (Accounting and Finance), Msc (Accounting),
MRes
Submitted in fulfilment of the requirements for the
Degree of Doctor of Philosophy in Accountancy
Adam Smith Business School
College of Social Sciences
University of Glasgow
February 2013

ii
Abstract
This thesis examines the accounting choices related to goodwill impairment
exercised by Malaysian listed companies in the first three years of the
implementation of FRS 3 Business Combinations (i.e. 2006/7 to 2008/9). Three
aspects of these accounting choices are examined, i.e. disclosure,
measurement, and recognition of goodwill impairment.
This thesis makes four main contributions. Firstly, it shows how the
opportunistic behaviour perspective, previously developed and tested by prior
studies using data from listed companies in developed economies (reported to
have dispersed ownership), helps explain managerial decisions on the
measurement of goodwill impairment in the developing economy of Malaysia
(documented to have concentrated ownership). Managerial opportunism is
normally discussed in prior studies in the context of agency conflict between
managers and shareholders in companies with disperse ownership. Because of
the high outside ownership concentration found in the Malaysian listed
companies, the empirical result of this thesis suggests that most probably the
opportunistic behaviour occurs due to an agency conflict between the
controlling shareholders (shareholders outside of the companies) and the
minority shareholders. Within this conflict, managers would possibly act on
behalf of the controlling shareholders at the expense of the minority
shareholders.
Secondly, this thesis contributes to research design by developing a disclosure
framework. Future researchers could make use of the disclosure framework to
identify accounting choices related to goodwill impairment, or to interpret their
statistical findings, which this thesis has attempted to do.
Thirdly, this thesis presents new results from the empirical evidence related to
factors influencing managerial decisions on the measurement of goodwill
impairment by Malaysian listed companies. These factors are: managerial
ownership, and two different measures of pre-write-off earnings. These results
highlight the need for future studies to incorporate these variables, in order to

iii
provide a more comprehensive model of accounting choices related to goodwill
impairment.
Finally, this thesis constructs a research setting which aims to capture evidence
of a recognition choice related to reporting zero goodwill impairment exercised
by Malaysian listed companies. Testing this setting allows the recognition study
to make a contribution, by identifying the motives of companies for recognising
zero goodwill impairment, which has received limited attention in prior studies.
Information concerning these motives is useful to the relevant regulatory bodies
overseeing financial reporting standards on goodwill.

iv
TABLE OF CONTENTS
Abstract .................................................................................... ii
List of Tables .............................................................................. xii
List of Figures ............................................................................. xiv
Acknowledgement ........................................................................ xvi
Abbreviations............................................................................ xviii
Appendices within specific chapters ................................................... xix
Appendix for the entire thesis .......................................................... xix
Chapter 1: Introduction .................................................................. 1
1.1 Introduction ..................................................................... 1
1.2 Motivation of the study ........................................................ 2
1.3 Research objectives and questions .......................................... 5
1.4 Summary of research design .................................................. 8
1.4.1 Disclosure study of goodwill impairment ................................... 8
1.4.2 Measurement study of goodwill impairment ............................... 9
1.4.3 Recognition study of goodwill impairment ............................... 10
1.5 Research contributions ...................................................... 11
1.6 Structure of the thesis ...................................................... 13
Chapter 2: Review of Literature and Theoretical Framework of Accounting
Choices ........................................................................ 16
2.1 Introduction ................................................................... 16
2.2 Review of literature on accounting choices .............................. 17
2.2.1 Definitions of accounting choice ........................................... 17
2.2.2 Gaps in the literature of prior studies in analysing asset write-offs and
goodwill impairment ......................................................... 22
2.2.3 Companies‘ motivations for accounting choice as classified by Fields
et al. (2001) ................................................................... 26
2.3 Agency theory ................................................................ 29
2.3.1 Contracting perspective ..................................................... 31
2.3.1.1 Management compensation plan: Internal agency conflicts ........... 34
2.3.1.2 Debt covenants: External agency conflicts ............................... 34
2.3.1.3 Limitation of research works testing the contracting perspective .... 36
2.3.2 Opportunistic behaviour perspective ...................................... 37

v
2.3.3 Evaluation of agency theory ................................................ 38
2.4 Summary and conclusions ................................................... 40
Chapter 3: Accounting for Goodwill in Malaysia ................................... 43
3.1 Introduction ................................................................... 43
3.2 History of the development of an accounting standard on goodwill in
Malaysia ........................................................................ 44
3.2.1 Efforts of the standard setters in developing an accounting standard
on goodwill .................................................................... 44
3.2.2 Objections to Malaysian Accounting Standard (MAS) 6 Accounting for
Goodwill ....................................................................... 47
3.2.3 Establishment of the Financial Reporting Act 1997 ..................... 49
3.2.4 Implication of reviewing the history of the development of an
accounting standard on goodwill in Malaysia ............................ 51
3.2.5 Background information obtained from semi-structured Interviews . 53
3.3 Regulatory bodies overseeing the compliance with accounting
standards of companies in Malaysia ....................................... 54
3.4 Ownership structures of listed companies in Malaysia .................. 56
3.5 Summary and conclusions ................................................... 57
Chapter 4: Discretion Available in IFRS 3 while Performing an Impairment
Test of Goodwill ............................................................. 59
4.1 Introduction ................................................................... 59
4.2 Phases of the development of IFRS 3 and FRS 3 Business Combinations
.................................................................................. 60
4.3 Indications that an asset (goodwill) may be impaired .................. 62
4.4 Judgements and estimates involved in performing an impairment test
of goodwill .................................................................... 65
4.4.1 Identification of cash-generating-units (CGUs) for an allocation of
goodwill ........................................................................ 66
4.4.2 Judgements and estimates involved in determining the recoverable
amount of CGUs .............................................................. 67
4.5 Dissenting opinions regarding an impairment test of goodwill ........ 69
4.6 Accounting choices related to goodwill impairment after the
implementation of FRS 3 .................................................... 71
4.6.1 Implementation decisions as accounting choices related to goodwill
impairment .................................................................... 72

vi
4.6.2 Process of identifying accounting choices related to goodwill
impairment after the implementation of FRS 3 ......................... 74
4.6.3 Researching accounting choices related to goodwill impairment by
Malaysian listed companies after the implementation of FRS 3 ....... 77
4.6.3.1 Measurement study related to goodwill impairment ................... 77
4.6.3.2 Recognition study related to goodwill impairment ..................... 78
4.7 Summary and conclusions ................................................... 81
Chapter 5: Hypotheses Development ................................................ 84
5.1 Introduction ................................................................... 84
5.2 Overview of the hypotheses and summary of the dependent variables .
.................................................................................. 84
5.3 Framework for the independent variables: Factors potentially
influencing the measurement and the recognition studies of goodwill
impairment .................................................................... 86
5.4 Economic factors ............................................................. 89
5.4.1 Change in sales (∆Sales) ..................................................... 91
5.4.2 Companies‘ pre-write-off earnings ........................................ 94
5.4.2.1 Prior year earnings (EARNINGSPrior) ........................................ 94
5.4.2.2 Current year pre-write-off earnings (EARNINGSPreGWILcurrent) ........... 97
5.4.2.3 Change in pre-write-off earnings (∆EARNINGSpreGWIL) ................... 99
5.4.3 Change in operating cash flows (∆OCF) .................................. 100
5.4.4 Book-to-market ratio (BTM) ............................................... 102
5.4.5 Relative size of goodwill balance (GWB) ................................ 104
5.5 Contracting perspective: Debt hypothesis (DEBTRATIO) .............. 106
5.6 Opportunistic behaviour perspective ..................................... 109
5.6.1 Change in Chief Executive Officer (∆CEOCurrent/prior) .................... 109
5.6.2 CEO tenure (CEOTENURE) .................................................. 112
5.6.3 Big bath reporting (BATH) ................................................. 114
5.6.4 Earnings smoothing (SMOOTH) ............................................ 116
5.7 Ownership structures ....................................................... 118
5.7.1 Managerial ownership (MANOWNLinear , and MANOWNNon-monotonic) .... 118
5.7.2 Outside ownership concentration (OUTCON) ............................ 122
5.8 Discretion available in performing an impairment test of goodwill .....
................................................................................. 124

vii
5.8.1 Cash-generating-units containing goodwill (CGUs01 and CGUsContinous) ...
................................................................................. 124
5.8.2 Discount rates employed in estimating the recoverable amount CGUs
containing goodwill ......................................................... 128
5.8.2.1 Wide span of discount rates (DISCRATE) ................................. 128
5.8.2.2 Application of either a single discount rate or multiple discount rates
(DISCMULTIPLE) .............................................................. 129
5.8.2.3 Discount rate – Disclosed/Not disclosed (DISCRATEDisclosed/Not) ........ 130
5.9 Control variables ............................................................ 131
5.9.1 Size of company (SIZE) ..................................................... 131
5.9.2 Types of industry (INDUSTRYG5) .......................................... 133
5.9.3 Financial year-end (YEND) ................................................. 134
5.9.4 Additions to goodwill (ADD) ............................................... 135
5.10 Summary ...................................................................... 136
Chapter 6: Research Design and Methods.......................................... 138
6.1 Introduction .................................................................. 138
6.2 Methodological position .................................................... 138
6.3 Total population of Malaysian listed companies which implemented
FRS 3 Business Combinations from 2006/7-2008/9 ..................... 141
6.4 Validation of Datastream source data ................................... 145
6.4.1 Accuracy of the amount of goodwill impairment recorded by
Datastream ................................................................... 145
6.4.2 Gap of information concerning the opening goodwill balance at the
initial year of the implementation of FRS 3 ............................. 146
6.5 Research design: Disclosure study of goodwill impairment ........... 150
6.5.1 Research design: Part one of the disclosure study ..................... 150
6.5.1.1 Data specification ........................................................... 150
6.5.1.2 Research method ............................................................ 151
6.5.2 Research design: Part two of the disclosure study ..................... 152
6.5.2.1 Data specification ........................................................... 152
6.5.2.2 Research method ............................................................ 152
6.6 Statistical tests to be carried out for both the measurement and
recognition studies of goodwill impairment ............................. 154
6.6.1 Descriptive statistics ........................................................ 154
6.6.1.1 Normality test ............................................................... 154
viii
6.6.1.2 Univariate analysis .......................................................... 155
6.6.2 Missing values analysis ...................................................... 155
6.6.3 Detecting multicollinearity ................................................ 156
6.7 Multivariate analysis to be carried out for the measurement study of
goodwill impairment ........................................................ 157
6.7.1 Censored regression model: Tobit model and the random-effects tobit
model ......................................................................... 157
6.7.2 Random-effects tobit model ............................................... 158
6.8 Multivariate analysis to be carried out for the recognition study of
goodwill impairment ........................................................ 160
6.9 Goodness-of-fit of the regression models to be conducted on the
measurement and recognition studies ................................... 161
6.10 Summary ...................................................................... 162
Chapter 7: Disclosure Study of Goodwill Impairment - Results and Analysis ..
................................................................................. 163
7.1 Introduction .................................................................. 163
7.2 Part one of the disclosure study: The appropriateness of the market
capitalisation indication ................................................... 163
7.3 Part two of the disclosure study: Types of accounting choice related
to goodwill impairment .................................................... 169
7.3.1 Delayed reporting goodwill impairment losses ......................... 172
7.3.2 Timing in reporting goodwill write-off from goodwill which arose from
an apparent overpayment made at the time of business acquisition 181
7.3.3 Systematic reduction of goodwill balance ............................... 186
7.4 Summary and conclusions .................................................. 191
Chapter 8: Measurement Study of Goodwill Impairment - Results and Analysis
................................................................................ 193
8.1 Introduction .................................................................. 193
8.2 Descriptive analysis ......................................................... 194
8.2.1 Dependent variable ......................................................... 194
8.2.1.1 Dependent variable: Distribution of data ................................ 194
8.2.1.2 Dependent variable: Skewed data for the relative magnitude of
goodwill impairment losses ................................................ 197
8.2.2 Distribution of data for the independent variables and control
variables ...................................................................... 199

ix
8.2.2.1 Skewed data for the independent variables ............................ 199
8.2.2.2 Missing values ................................................................ 199
8.2.2.3 Lack of data for industry variable ........................................ 201
8.3 Multivariate analyses ....................................................... 201
8.3.1 An overall regression model ............................................... 202
8.3.2 Multicollinearity ............................................................. 204
8.3.3 Model specifications ........................................................ 206
8.4 Regression result for Model 1 .............................................. 209
8.5 Overall regression results for Model 2: Malaysian context ............ 212
8.5.1 Results of the overall models.............................................. 213
8.5.2 Sensitivity analyses ......................................................... 213
8.5.2.1 Sensitivity analyses – Change in CEO ..................................... 218
8.5.2.2 Sensitivity analyses – Managerial ownership ............................ 219
8.5.2.3 Sensitivity analysis – Prior year earnings ................................. 220
8.6 Research Question 4: Economic factors .................................. 220
8.6.1 Change in sales [Log(∆Sales+1)] ........................................... 221
8.6.2 Companies‘ pre-write-off earnings ....................................... 221
8.6.2.1 Prior year earnings (EARNINGSPrior) ....................................... 221
8.6.2.2 Current year pre-write-off earnings (EARNINGSPreGWILcurrent) .......... 222
8.6.2.3 Change in pre-write-off earnings (∆EARNINGSpreGWIL) .................. 223
8.6.3 Change in operating cash flows (∆OCF) .................................. 223
8.6.4 Book-to-market ratio (BTM) ............................................... 224
8.6.5 Relative size of goodwill balance (GWB) ................................ 224
8.7 Research Question 5: Contracting perspective (DEBTRATIO) ......... 224
8.8 Research Question 6: Opportunistic behaviour perspective .......... 225
8.8.1 Change in CEO (∆CEOCurrent/prior) ........................................... 225
8.8.2 CEO tenure (CEOTENURE) .................................................. 226
8.8.3 Big bath reporting (BATH) ................................................. 227
8.8.4 Earnings smoothing (SMOOTH) ............................................ 228
8.9 Research Question 7: Ownership structures ............................. 228
8.9.1 Managerial ownership (MANOWNLinear and MANOWNNon-monotonic) ...... 229
8.9.2 Outside ownership concentration (OUTCON) ............................ 230
8.10 Research Question 8: Discretion available in performing an
impairment test of goodwill ............................................... 231
8.10.1 Cash-generating-units containing goodwill (CGU01 and CGUContinuous) 231

x
8.10.2 Discount rates (DISCRATE, DISCMULTIPLE, and DISCRATEDisclosed/Not ) 232
8.11 Company-specific factors (control variables) ........................... 232
8.11.1 Size of company (SIZE) ..................................................... 233
8.11.2 Types of industry (INDUSTRYG5) .......................................... 233
8.11.3 Financial year-end (YEND) ................................................. 233
8.11.4 Addition to goodwill (ADD) ................................................. 234
8.12 Overall results of the measurement study .............................. 234
8.12.1 Conflicting results for two different measures of pre-write-off
earnings ....................................................................... 235
8.12.2 Interpretation of the findings of the measurement study using the
self-constructed disclosure framework .................................. 236
8.13 Summary and conclusions .................................................. 238
Chapter 9: Recognition Study of Goodwill Impairment - Results and Analysis
................................................................................ 257
9.1 Introduction .................................................................. 257
9.2 Descriptive analysis ......................................................... 259
9.2.1 Setting designed to capture evidence of a recognition choice related
to reporting zero goodwill impairment .................................. 259
9.2.2 Distribution of data ......................................................... 261
9.3 Binary logistic regression models ......................................... 262
9.4 Regression results: Recognition choice related to reporting zero
goodwill impairment ........................................................ 268
9.4.1 Regression diagnostic test I: Small number of observations .......... 272
9.4.2 Regression diagnostic test II: Influential observations ................. 273
9.4.3 Assessing the overall model ............................................... 273
9.4.4 Sensitivity analysis – Current year pre-write-off earnings............. 274
9.5 Discussion of the result for a recognition choice related to reporting
zero goodwill impairment .................................................. 274
9.5.1 Research Question 9: Economic factors .................................. 275
9.5.1.1 Companies‘ pre-write-off earnings (EARNINGSPreGWILcurrent and
EARNINGSPreGWILprior) ......................................................... 275
9.5.1.2 Change in pre-write-off earnings (∆EARNINGSpreGWIL) .................. 276
9.5.1.3 Change in operating cash flows (∆OCF) .................................. 277
9.5.2 Research Question 10: Contracting perspective ........................ 278
9.5.3 Research Question 11: Opportunistic behaviour perspective ......... 278

xi
9.5.4 Research Question 12: Ownership structures ........................... 280
9.5.5 Company-specific factors (control variables) ........................... 281
9.6 Summary and conclusions .................................................. 281
Chapter 10: Discussion and Conclusion ............................................ 288
10.1 Introduction .................................................................. 288
10.2 Research aim and objectives .............................................. 288
10.3 Achievement of the four research objectives ........................... 289
10.3.1 Objective 1: Theoretical research question ............................. 289
10.3.2 Objective 2: Disclosure study of goodwill impairment ................ 290
10.3.3 Objective 3: Measurement study of goodwill impairment ............ 293
10.3.4 Objective 4: Recognition study of goodwill impairment .............. 296
10.3.5 Synthesis of accounting choices related to goodwill impairment
exercised by Malaysian listed companies ................................ 298
10.4 Research contributions ..................................................... 301
10.4.1 Contribution to theories of accounting choice (Objective 1) ......... 301
10.4.1.1 Contracting perspective .................................................... 302
10.4.1.2 Opportunistic behaviour perspective ..................................... 303
10.4.2 Empirical contributions ................................................... 307
10.4.2.1 Managerial ownership (Objective 3) ...................................... 308
10.4.2.2 Companies‘ pre-write-off earnings (Objective 3) ...................... 309
10.4.3 Contributions to research design ......................................... 310
10.4.3.1 A self-constructed disclosure framework (Objective 2) ............... 310
10.4.3.2 Research setting designed to capture evidence of a recognition
choice related to reporting zero goodwill impairment (Objective 4) 311
10.4.4 Policy implications .......................................................... 312
10.5 Limitations of the study .................................................... 313
10.6 Suggestions for future research ........................................... 314
Appendix 1 of the thesis: Summary of Hypotheses Formulated and Detailed
Definitions of the Variables Employed ................................. 316
References ............................................................................... 327

xii
List of Tables
1.1 Summary of research objectives
5
1.2 Research questions and their link to research objectives as well as empirical chapters
6-7
5.1 Summary of dependent variables for the measurement and recognition studies related to goodwill impairment
86
5.2 Variables employed for the analysis of accounting choices related to goodwill impairment examined in the measurement and the recognition studies
86-87
6.1 Total number of companies available for analysis of accounting choices related to goodwill impairment for the first three years of the implementation of FRS 3
143
6.2 The final number of companies available for the analysis of accounting choices related to goodwill impairment in the first three years of the implementation of FRS 3
149
7.1 The first part of the disclosure study conducted across companies within one year of implementing FRS 3
166
7.2 The first part of the disclosure study conducted on a subset of companies over a period of two years implementing FRS 3
167
7.3 Analysis of goodwill movement for ABC1 Bhd from 31 December 2003-2007
172-173
7.4 Analysis of goodwill movement for ABC2 Bhd from 31 December 2003-2008
175-176
7.5 Analysis of goodwill movement for ABC3 Bhd from 31 December 2003-2008
178-179
7.6(a) Analysis of goodwill movement for DEF1 Bhd from 31 December 2007-2008
182-183
7.6(b) Detail analysis of an addition of goodwill for DEF1 Bhd - 31 December 2007
183
7.7(a) Analysis of goodwill movement for DEF2 Bhd from 31 December 2006-2007
183-184
7.7(b) Detail analysis of an addition of goodwill for DEF2 Bhd from 2006-2007
184
7.8(a) Analysis of goodwill movement for DEF3 Bhd from 31 December 184-185

xiii
2006-2007
7.8(b) Detail analysis of an addition of goodwill for DEF3 Bhd from 2006-2007
185
7.9 Analysis of goodwill movement for XYZ1 Bhd from 31 March 2002-2009
187-188
7.10 Analysis of goodwill movement for XYZ2 Bhd from 31 December 2004-2008
189-190
8.1 Distribution of data for the dependent variable of the measurement study
195
8.2 Pearson product-moment correlation coefficients
205
8.3 Models specification for the analysis of the measurement of goodwill impairment
207
8.4 Factors influencing managerial decisions on the measurement of goodwill impairment - Comparison of the regression results between Model 1 and AbuGhazaleh et al. (2011)
210
8.5 Random-effects tobit regression Model 2: Factors influencing managerial decisions on the measurement of goodwill impairment
214-217
9.1 Pearson product-moment correlation coefficients
266-267
9.2 Binary logistic regression models: Factors influencing the recognition choice related to reporting zero goodwill impairment
269-271
10.1 Summary of research objectives
289
10.2 Companies' motives in reporting goodwill impairment losses derived from the measurement study which examined the total population of companies from 2006/7 to 2008/9
300

xiv
List of Figures
1.1 Structure of the thesis
15
2.1 Companies‘ motivations for accounting choice classified by Fields et al. (2001) into three different types of market imperfection
27
3.1 Chronology of initiatives carried out by the Malaysian standard setter in issuing an accounting standard on goodwill
46
3.2 Detailed objections to MAS 6 Accounting for Goodwill
47-48
4.1 Phases of the IFRS 3 (FRS 3 in Malaysia) Business Combinations and IAS 36 (FRS 136 in Malaysia) Impairment of Assets
61-62
4.2 Indications that an asset (goodwill) may be impaired as outlined in FRS 136 (2006: paragraph 12)
63-64
4.3 An ideal flowchart to identify accounting choices related to goodwill impairment
75
4.4 Identification of recognition choices related to reporting goodwill impairment using the market capitalisation indication
79
5.1 Factors potentially influencing accounting choices related to goodwill impairment examined in the measurement and the recognition studies and corresponding research questions
85
6.1 The first three years of the implementation of FRS 3
142
6.2 A self-constructed disclosure framework for identifying types of accounting choice related to goodwill impairment exercised by Malaysian listed companies
153-154
7.1 Types of accounting choice related to goodwill impairment identified through detailed analysis of annual reports of 20 companies
171
7.2 A scenario of companies that delayed reporting goodwill impairment losses
180
7.3 A scenario of companies exercising discretion in timing the goodwill write-off due to an apparent overpayment made at the time of business acquisition
186
8.1 Summary of research questions (RQ) for the measurement study of goodwill impairment by Malaysian listed companies
193

xv
8.2 The relationship between CEO tenure and companies‘ addition to their goodwill
226
9.1 Summary of research questions (RQ) for the recognition study of goodwill impairment by Malaysian listed companies
258
9.2 Summary of a setting designed to capture evidence of a recognition choice related to reporting zero goodwill impairment
260
9.3 Number of companies tested for the test group and the control group
261
9.4 Models specification for the analysis of the recognition choice related to reporting zero goodwill impairment
263-264

xvi
In the Name of Allah, the Most Beneficent, the Most Merciful
Acknowledgement
I thank Allah, the Most Beneficent, the Most Merciful, for giving me the strength
and ability to complete this research successfully.
I acknowledge the financial support received from the Malaysian Ministry of
Higher Education as part of the training scheme of the Universiti Utara Malaysia.
I extend my sincere thanks to Professor Pauline Weetman, as the main
supervisor, for her supervision throughout the study. This thesis is a better
product thanks to her critical comments, and prompt feedback. Also, my
heartfelt thanks to Dr Hassan Yazdifar, as thesis advisor, for his helpful
comments on this thesis.
Thank you to friends who have helped with finding respondents for the semi-
structured interviews, the legal advice on the disclosure study, and for their
many other obligements which facilitated the completion of this thesis.
This research would not have been completed as planned without the strong
supports of my family. I can never thank them enough for their continuous helps
and ‗dua‘. I am grateful to Allah for giving me such a wonderful family.
This thesis has benefitted from the consultation advices and suggestions
received as follows:
Consultation advices:
Thanks to Dr Mark Shephard from the University of Strathclyde for his
helpful suggestion on the logistic regression model employed (in Chapter 9
of this thesis). This meeting was made possible by AQMeN.

xvii
Thanks to Dr Jan Eichhorn (under AQMeN) for arranging two consultation
advices concerning tobit model. Firstly, my discussion with Professor
Vernon Gayle from the University of Stirling. I appreciate the advice
offered by Professor Gayle concerning the tobit model in STATA and the
additional reading suggested. Secondly, my discussion with Mr Darryl
Holden – the author of testing the normality assumption in the tobit model,
in the Journal of Applied Statistics, 2004, 31(5), 521-532. My heartfelt
thanks to Mr Holden who kindly spent time discussing the issue of skewed
data for the dependent variable, faced in the measurement study of this
thesis (see Section 8.2.1.2). His valuable advice has been highly
appreciated.
Presentations:
Thanks to ICAS for sponsoring me in the ICAS Research Development Event
28/3-29/3/2011. I greatly appreciate the thoughtful questions and
comments raised by Dr Louise Crawford, the Chairperson of the workshop,
regarding the policy impact of this study (see Section 10.4.4). Also, to the
PhD students who participated at this ICAS event who raised interesting
questions and suggestions during my approximately one hour presentation
and discussion.
Thanks to chair-persons and participants at the doctoral colloquium of the
British Accounting Association (BAA) 2008, BAA 2009, BAA 2010, BAFA 2011,
Scottish Doctoral colloquium 2011, and Financial Reporting & Business
Communication 2011. The questions raised and comments received from
these presentations have improved this thesis.

xviii
Abbreviations
BV Book values of the net assets of companies
CEOs Chief Executive Officers
CGUs Cash-generating-units
FASB US Financial Accounting Standards Board
FPLC Federation of Public Listed Companies
FRS Financial Reporting Standard
FRS 136 Malaysian Financial Reporting Standard 136 Impairment of Assets
FRS 3 Malaysian Financial Reporting Standard 3 Business Combinations
FYE Financial year-end
GAAP Generally Accepted Accounting Principles
GWIL(IL) Reporting goodwill impairment losses
GWIL(0) Reporting zero goodwill impairment
IAS 36 International Accounting Standard 36 Impairment of Assets
IASB International Accounting Standards Board
IASC International Accounting Standards Committee
IFRS 3 International Financial Reporting Standard 3 Business Combinations MACPA Malaysian Association of Certified Public Accountants
MAS 6 Malaysian Accounting Standard 6 Accounting for Goodwill
MASB Malaysian Accounting Standards Board
MASB ED 28 MASB exposure draft on goodwill
MCI Market capitalisation indication
MIA Malaysian Institute of Accountants
MV Market values of companies
UK United Kingdom
US United States of America

xix
Appendices within specific chapters
8.1 Break down of companies which have reported goodwill impairment losses into one time impairers and repeated impairers and their mean and median values of the ratio of goodwill write-off to prior year total assets (including goodwill)
241
8.2 Descriptive statistics for the continuous variables for total firm-years within the three years period of study
242-243
8.3 Descriptive statistics for the categorical variables for the total firm-years within the three years period of study
244
8.4 Missing value analysis: The result of Little‘s MCAR test and Separate Variance t tests
245-246
8.5 The result of sensitivity analyses for ∆CEOCurrent/prior
247-249
8.6 The result of sensitivity analyses for Managerial ownership
250-252
8.7 The result of sensitivity analyses for EARNINGSprior by replacing it with EARNINGSPreGWILprior
253-256
9.1 Descriptive statistics for the continuous variables
284
9.2 Descriptive statistics for the categorical variables
285
9.3 Sensitivity analysis for current year pre-write-off earnings by replacing it with prior year pre-write-off earnings
286-287
Appendix for the entire thesis
Appendix 1 of the thesis
Summary of Hypotheses Formulated and Detailed Definitions of the Variables Employed
316-326

1
Chapter 1: Introduction
1.1 Introduction
The overall aim of the thesis is to analyse accounting choices related to goodwill
impairment exercised by listed companies in Malaysia in the first three years of
the implementation of Financial Reporting Standard (FRS) 3 Business
Combinations (i.e. 2006/7 to 2008/9). In this thesis, accounting choices are
identified by the implementation decisions made by managers, in particular,
through judgements and estimates employed in performing an impairment test
of goodwill (see Section 2.2.1 for a detailed definition of accounting choice
applied in this thesis). Three aspects of implementation decisions related to
goodwill impairment are analysed, namely, disclosure, measurement, and
recognition of goodwill impairment.
Three theoretical papers which are pertinent to the definition of accounting
choice adopted in this thesis are Fields et al. (2001), Francis (2001), and Nobes
(2006) (see Section 2.2.1). Fields et al. (2001), in their review of accounting
choice studies published in the 1990s, defined accounting choice as:
‗any decision whose primary purpose is to influence (either in form or
substance) the output of the accounting system in a particular way,
including not only financial statements published in accordance with
GAAP [Generally Accepted Accounting Principles], but also tax returns
and regulatory filings.‘
Fields et al. (2001: 256)
This definition, according to Francis (2001: 311), broadens the scope of
accounting choice to include, among others, judgements and estimates required
to implement GAAP. In a similar vein, Nobes (2006: 240), in his discussion of the
international differences in IFRSs, relating particularly to International
Accounting Standard (IAS) 36 Impairment of Assets, considers the judgements
and estimates employed by managers when undertaking an impairment test of
assets (including goodwill), to be ‗covert options‘.

2
The consideration of implementation decisions as key elements of accounting
choice, discussed by Fields et al. (2001) and Francis (2001: 312), is timely, as
the aim of the International Accounting Standards Board (IASB) is ‗not to permit
choices in the accounting treatment‘ (IASB, 2006a: Preface to International
Financial Reporting Standards, paragraph 13). The IASB‘s elimination of
alternative accounting treatments for a number of the revised financial
reporting standards has at least two implications which have a bearing on the
accounting choice studies. Firstly, academic researchers should focus less on
accounting method choice (Francis, 2001: 313). This is because many of the
revised financial reporting standards, which are either issued by the IASB or the
Financial Accounting Standard Board (FASB), no longer have an alternative
accounting treatment.
Secondly, more research is needed in examining individual accounting items
which are known ‗to require substantial managerial judgement and to have a
significant impact on reported profitability‘ (Francis, 2001: 314). This is because
managers could, when exercising judgement be conveying credible private
information about companies to investors (Healy and Wahlen, 1999: 366; Fields
et al., 2001: 257). Alternatively, they could be opportunistically be making use
of discretion, either for their own self-interest (Fields et al., 2001: 312) or for
the interest of the existing shareholders, and possibly at the expense of other
contracting parties (Francis, 2001: 312).
1.2 Motivation of the study
Motivated by Francis‘s call (2001: 314) for further research looking into the
implementation decisions of individual accounting items, this thesis seeks to
analyse accounting choices related to goodwill impairment exercised by
Malaysian listed companies.
Goodwill impairment represents an interesting area of research because in
implementing FRS 3 Business Combinations and FRS 136 Impairment of Assets
(similar to IAS 36), managers are required to apply judgements and estimates,
especially when performing an impairment test of goodwill (see Section 4.4 for
detail). The judgements applied would determine whether an impairment loss

3
needed to be recognised (IASB, 2006b: IAS 36, Basis for Conclusions, BCZ24) (see
Section 4.3). At the same time, two IASB Board members argued that the
impairment test itself has not yet met the requirement of a ‗rigorous and
operational impairment test‘ (IASB, 2006b: IAS 36, Basis for Conclusions,
Dissenting opinions, DO3; IFRS 3, Basis for Conclusions, DO14 - see Section 4.5).
Given that an impairment loss of goodwill directly affects a company‘s net
income, the reliance on the impairment-only approach as a way of ensuring that
the carrying amount of goodwill reported on the balance sheet does not exceed
its recoverable amount, without the existence of a strong control mechanism for
the impairment test, imposed within the standard, may create an avenue for
managers to manipulate the impairment loss if they have explicit incentives (via
contractual agreements) or implicit incentives to do so.
Malaysia provides a unique setting for testing the theories of accounting choice
related to goodwill impairment for two main reasons. Firstly, listed companies
in Malaysia are documented to have concentrated ownership (see Section 3.4).
The concentrated ownership is also found in other East Asian countries such as
Thailand and Indonesia (Leuz et al., 2003: 516). On the other hand, listed
companies in developed economies, in particular, the United States (US) and the
United Kingdom (UK), are said to have dispersed ownership (Leuz et al., 2003:
507). For example, Leuz et al. (2003: 516-517) reported that during their period
of study (i.e. from 1990 to 1999), the median shareholding of the largest three
shareholders of listed companies in Malaysia was 52% while for the UK and the
US it was 15% and 12% respectively (see Section 3.4).
With different features of ownership structure observed among Malaysian listed
companies compared to those in developed economies, such as the US and UK,
the nature of agency problem which exists in these Malaysian companies might
also differ (see Section 2.3.3). Shleifer and Vishny (1997: 754) reason that
compared to companies with disperse ownership, companies with concentrated
ownership might face fewer agency problems arising from the separation of
ownership and management. Fan and Wong (2002: 405), however, argue that
when shareholders obtain a substantial portion of company shares, to the point
at which they acquire an effective control of the company, the nature of agency
problem shifts. Instead of a conflict of interest between managers and

4
shareholders, the conflict is between controlling owners and minority
shareholders (Fan and Wong, 2002: 405). Thus, the potentially different nature
of the agency problem in companies with concentrated ownership may affect
the applicability of the contracting perspective and the opportunistic behaviour
perspective, which rely on the agency theory model as developed by Jensen and
Meckling (1976).
Thus far, the contracting perspective and the opportunistic behaviour
perspective have been tested by prior studies examining goodwill impairment by
listed companies located in developed economies which have dispersed
ownership, such as the US (e.g. Beatty and Weber, 2006; Guler, 2007; Zang,
2008), Canada (i.e. Lapointe-Antunes et al., 2008), and the UK (i.e.
AbuGhazaleh et al., 2011) (see Section 2.2.2). To the researcher‘s knowledge,
there exists no comprehensive study of goodwill impairment testing the two
perspectives of accounting choice in listed companies located in developing
economies1. By focusing on listed companies in Malaysia, as an example of listed
companies in a developing economy, this thesis provides an opportunity to test
the contracting perspective and the opportunistic behaviour perspective in a
new institutional setting hitherto unexplored by prior studies analysing goodwill
impairment.
The second motivation for studying Malaysian listed companies is because of the
country‘s specific history of accounting for goodwill (see Section 3.2.4). Since
the 1970s, the Malaysian standard setter has struggled to come up with an
accounting standard on goodwill (Susela, 1999: 359). Large corporations
objected to the publication of an accounting standard on goodwill (Susela, 1999:
370), basing these objections on, for example, the socio-economic
consequences of the standard. In addition, there was a lack of acceptance of
the standard by the business community (Susela, 1999: 375 and 379). Their
objections reached the point of them lobbying the Ministry of Finance to defer
the standard (Susela, 1996: 338). Only when FRS 3 was implemented in 2006 did
listed companies in Malaysia have a specific accounting standard on goodwill.
Malaysia‘s history of resisting an accounting standard on goodwill based on its
1 There is one conference paper, i.e. Omar and Mohd-Saleh (2011) which has tested the applicability of the two perspectives in explaining the recognition of goodwill impairment by Malaysian listed companies (see Section 2.2.2 for detail).

5
suitability raises the question of whether companies are following the standard
in good faith or whether they are taking advantage of the covert options
available to managers during an impairment test of goodwill in order to get the
desired result.
1.3 Research objectives and questions
As noted in Section 1.1, the overall aim of the thesis is to analyse accounting
choices related to goodwill impairment exercised by listed companies in
Malaysia in the first three years of the implementation of FRS 3 Business
Combinations (i.e. 2006/7 to 2008/9). In line with the motivation of the study -
which is to test both the contracting perspective and the opportunistic
behaviour perspective in a new institutional setting (see Section 1.2), the
following theoretical and specific research objectives have been formulated.
Table 1.1: Summary of research objectives
Theoretical research objective
1.
To assess the applicability of theories of accounting choice in explaining the implementation decisions related to goodwill impairment by Malaysian listed companies.
Specific research objectives
Empirical chapters
2.
To explore, via the annual reports of companies, types of accounting choice related to goodwill impairment exercised by Malaysian listed companies after the implementation of FRS 3.
Disclosure study – Chapter 7
3. To analyse factors influencing managers‘ decisions when determining the magnitude of goodwill impairment losses divided by prior year total assets (including goodwill), and zero otherwise reported on the income statement.
Measurement study - Chapter 8
4. To analyse factors influencing the recognition choice related to reporting zero goodwill impairment exercised by Malaysian listed companies in a situation where companies‘ market values are lower than the book values of their net assets for three consecutive years.
Recognition study - Chapter 9
Table 1.2 maps the research questions with the relevant research objectives and
empirical chapters. The next section discusses the summary of research design
for each of the empirical chapters.

6
Table 1.2: Research questions and their link to research objectives as well as empirical chapters
Research questions
Link to objectives
Empirical chapters
Theoretical research question
Research Question 1:
How can an investigation of FRS 3, focusing on goodwill impairment by Malaysian listed companies, contribute to the theories of accounting choice?
Objective 1
8 - Measurement study and
9 - Recognition study
Specific research questions
Research Question 2:
To what extent is the market capitalisation indication (i.e. companies‘ market values lower than the book values of their net assets at the balance sheet date) an appropriate proxy for an indication that goodwill may be impaired?
Objective 2
7 - Disclosure study
Research Question 3:
What are the types of accounting choice related to goodwill impairment exercised by Malaysian listed companies which can be identified through detailed analysis of annual reports?
Research Question 4:
To what extent do the decisions of Malaysian listed companies in measuring goodwill impairment indicate that they reflect the underlying economic values of cash-generating-units containing goodwill?
Objective 3
8 - Measurement
study Research Question 5:
To what extent do the decisions of Malaysian listed companies in measuring goodwill impairment support the contracting perspective?
Research Question 6:
To what extent do the decisions of Malaysian listed companies in measuring goodwill impairment support the opportunistic behaviour perspective?

7
Table 1.2 (continue): Research questions and their link to research objectives as well as empirical chapters
Specific research questions Link to objectives
Empirical chapters
Research Question 7:
To what extent do the decisions of Malaysian listed companies in measuring goodwill impairment indicate that they reflect companies‘ ownership structures?
Objective 3
8 - Measurement study Research
Question 8: To what extent do the decisions of Malaysian listed companies in measuring goodwill impairment indicate that they reflect the discretion available in FRS 136 Impairment of Assets?
Research Question 9:
To what extent does the recognition choice1 related to reporting zero goodwill impairment exercised by Malaysian listed companies reflect the underlying economic values of cash-generating-units containing goodwill?
Objective 4
9 - Recognition study
Research Question 10:
To what extent does the recognition choice related to reporting zero goodwill impairment exercised by Malaysian listed companies support the contracting perspective?
Research Question 11:
To what extent does the recognition choice related to reporting zero goodwill impairment exercised by Malaysian listed companies support the opportunistic behaviour perspective?
Research Question 12:
To what extent does the recognition choice related to reporting zero goodwill impairment exercised by Malaysian listed companies indicate that they reflect companies‘ ownership structures?
1 The recognition choice related to reporting zero goodwill impairment focuses on companies which their market values lower than the book values of the net assets for three consecutive years and which reported zero goodwill impairment.
8
1.4 Summary of research design
Research approach adopted in this thesis is primarily quantitative, in that, it
emphasises the quantification in the collection and analysis of data. Because the
implementation decisions made by managers in relation to goodwill impairment
are not visible or, as Nobes (2006: 239-240) calls them, ‗covert options‘, the
disclosure study acts as an initial exploration of accounting choices related to
goodwill impairment (see Section 1.4.1). The research then continues with the
measurement study (see Section 1.4.2), and ends with the recognition study
(see Section 1.4.3).
1.4.1 Disclosure study of goodwill impairment
The aim of the disclosure study is to explore, via the annual reports of
companies, types of accounting choice related to goodwill impairment exercised
by Malaysian listed companies after the implementation of FRS 3 (see Section
1.3). To achieve this aim, the disclosure study is carried out in two parts.
The first part of the disclosure study aims to examine the appropriateness of the
market capitalisation indication as an indication that goodwill may be impaired
(see Section 6.5.1). This is undertaken by comparing two types of information,
which represent the observed practice vs. the stated explanation. The data
compared are: (i) the market capitalisation indication of companies (i.e. where
market values are lower than the book values of net assets at the balance sheet
date), and (ii) reasons for companies reporting goodwill impairment (both zero,
and goodwill impairment losses) disclosed in the Notes to the Financial
Statement (see Section 7.2). This comparison has been carried out in two ways.
Firstly, it is performed across companies implementing FRS 3 within one year.
This covers 294 companies for the financial year ended December 2006 and a
further 235 companies for the financial years ended between January and
November 2007. Secondly, the comparison has been conducted on the same
companies over a period of two years. This includes 258 companies with data

9
available for financial years ended December 2006 and December 2007 (see
Section 6.5.1.1).
The second part of the disclosure study aims to identify types of accounting
choice related to goodwill impairment exercised by Malaysian listed companies
after the implementation of FRS 3 (see Section 6.5.2). This is conducted using a
self-constructed disclosure framework (see Section 6.5.2.2). The disclosure
framework takes into account six key items of data: (i) goodwill data, (ii)
segment result, (iii) financial performance, (iv) the market capitalisation
indication, (v) reasons for reporting goodwill impairment loss disclosed in the
Notes to the Financial Statement, and (vi) audit report concerning goodwill (see
Figure 6.2 in Section 6.5.2.2). Using the disclosure framework, 20 companies
which reported goodwill impairment losses and are categorised into Group 2
(see Section 6.5.1.2) from the result of part one of the disclosure study, will be
examined in greater depth (in Sections 7.3 to 7.3.3). The analysis is carried out
over several years (depending on the traceability of goodwill impairment losses
backward from the write-off year to the acquisition year) (see Section 6.5.2.2).
1.4.2 Measurement study of goodwill impairment
The measurement study examines factors influencing managers‘ decisions when
determining the magnitude of goodwill impairment losses divided by prior year
total assets (including goodwill), and zero otherwise reported on the income
statement (see Section 1.3). Studies of the measurement of goodwill
impairment have until now been conducted using data from countries in
developed economies, such as the US (e.g. Beatty and Weber, 2006; Guler,
2007; Zang, 2008), Canada (i.e. Lapointe-Antunes et al, 2008), and the UK (i.e.
AbuGhazaleh et al., 2011) (see Section 2.2.2). As noted in Section 1.2, these
countries are reported to have dispersed ownership. The measurement study of
this thesis, therefore, extends these studies to the developing economy of
Malaysia, which has concentrated ownership.
Investigating the measurement of goodwill impairment by Malaysian listed
companies, as an example of listed companies in a developing economy,
provides an opportunity to test the contracting perspective and the

10
opportunistic behaviour perspective in a new institutional setting, previously
unexplored in prior studies analysing the measurement of goodwill impairment
(see Section 1.2). Hence, the result of the measurement study is expected to
contribute to the theories of accounting choice by providing support for the
opportunistic behaviour perspective and the contracting perspective in
explaining the measurement of goodwill impairment by Malaysian listed
companies which have concentrated ownership.
The measurement study is carried out on the total population of Malaysian listed
companies which implemented FRS 3 in the first three years of the standard
taking effect. This includes 1498 firm-years with 369 firm-years reporting
goodwill impairment losses and 1129 firm-years reporting zero goodwill
impairment from 2006/7 to 2008/9 (see Table 8.1 in Section 8.2.1.1). The
dependent variable for the measurement study is the magnitude of goodwill
impairment losses divided by prior year total assets (including goodwill), and
zero otherwise reported on the income statement (see Table 5.1 in Section 5.2).
This dependent variable has four characteristics: (i) a lower limit, which is zero
value, (ii) a substantial number of observations which take on the limiting value,
(iii) the remaining observations take on a wide range of values above the limit,
and (iv) repeated observations. These characteristics lead to the application of
random-effects tobit regression model (see Section 6.7.1).
1.4.3 Recognition study of goodwill impairment
The recognition study of goodwill impairment is conducted in an attempt to fill
the gap identified by Alciatore et al., (1998: 33), i.e. a need for studies ‗to
identify and examine firms that have impaired assets but have not written them
down, or did not write them down in a timely manner‘ (see Section 2.2.2). In
the context of goodwill impairment, the gap identified by Alciatore et al. (1998)
is timely as one of the concerns raised by the IASB board members via the
dissenting opinion of IAS 36 Impairment of Assets is the lack of a rigorous
impairment test of goodwill because of the focus of the IASB on preventing
excessive goodwill write-offs (see Section 4.5). By undertaking the recognition
study, this thesis will be able to identify companies‘ motives in recognising zero
goodwill impairment.

11
To test the recognition choice related to reporting zero goodwill impairment, all
of those companies which have market values below the book values of their net
assets for three consecutive years, and which recognise zero goodwill
impairment throughout the three years, are selected as a test group (see
Section 9.2.1). This group is tested against a control group of companies which
experience a similar condition (i.e. market values below the book values of net
assets for three consecutive years); but which reported goodwill impairment
losses at the end of the third year. To perform the analysis, the test group is
coded as one and the control group is coded as zero. The recognition study is
carried out on 132 companies (before missing values) of which 96 companies are
regarded as the test group and 36 companies are considered as the control
group (see Figure 9.3 in Section 9.2.1). Because of the binary nature of the
dependent variable, a binary logistic regression is applied in the recognition
study (see Section 6.8).
1.5 Research contributions
This thesis meets the four research objectives in the following four main ways.
Firstly, in meeting Research Objective 1, this thesis contributes to the theories
of accounting choice. It shows how the opportunistic behaviour perspective,
previously developed and tested by prior studies using data from listed
companies in developed economies (reported to have dispersed ownership),
helps explain managerial decisions on the measurement of goodwill impairment
in the developing economy of Malaysia (documented to have concentrated
ownership) (see Section 10.4.1.2 for detail). Managerial opportunism is normally
discussed in prior studies in the context of agency conflict between managers
and shareholders in companies with disperse ownership (see Sections 2.3.2 and
2.3.3). Because of the high outside ownership concentration found in the
Malaysian listed companies, the empirical result of this thesis suggests that most
probably the opportunistic behaviour occurs due to an agency conflict between
the controlling shareholders (shareholders outside of the companies) and the
minority shareholders (see Section 10.4.1.2). Within this conflict, managers
would possibly act on behalf of the controlling shareholders at the expense of
the minority shareholders.

12
Secondly in meeting Research Objective 2, the disclosure study contributes to
the research design by developing a disclosure framework (see Figure 6.2 in
Section 6.5.2.2), which aims to explore, via annual reports of companies, types
of accounting choice related to goodwill impairment exercised by Malaysian
listed companies. Future researchers could make use of the disclosure
framework to identify accounting choices related to goodwill impairment, or to
interpret their statistical findings, which this thesis has attempted to do (see for
e.g. Table 7.3 in Section 7.3.1 and Section 8.12.2 for the application of the
disclosure framework).
Thirdly, in meeting Research Objective 3, the measurement study contributes to
literature of accounting choices related to goodwill impairment by presenting
new results from the empirical evidence related to factors influencing
managers‘ decisions when determining the magnitude of goodwill impairment
losses divided by prior year total assets (including goodwill), and zero otherwise
reported on the income statement by Malaysian listed companies. These factors
are: managerial ownership (see Section 10.4.2.1 for detail), and two different
measures of pre-write-off earnings (see Section 10.4.2.2 for detail). These
results highlight the need for future studies to incorporate these variables, in
order to provide a more comprehensive model of accounting choices related to
goodwill impairment.
Finally, in meeting Research Objective 4, the recognition study contributes to
the research design by constructing a research setting which aims to capture
evidence of a recognition choice related to reporting zero goodwill impairment.
Testing this setting allows the recognition study to makes a contribution, by
identifying the motives of companies for recognising zero goodwill impairment,
which has received limited attention in prior studies (see Section 10.4.3.2 for
detail). Information concerning these motives is useful to the relevant
regulatory bodies overseeing financial reporting standards on goodwill in
Malaysia, such as Malaysian Accounting Standard Board (MASB), Malaysian
Securities Commission, and auditors.
The research contributions of this thesis are discussed in detail in Sections 10.4
to 10.4.4.

13
1.6 Structure of the thesis
A conceptual map of this thesis is displayed in Figure 1.1. This thesis is
structured as follows:
Chapter 1 (Introduction): The introduction sets out the motivation, research
objectives and questions, research design, contributions of the study, and
structure of the thesis.
Chapter 2 (Literature review): The literature review discusses the definitions
of accounting choice, the gaps in the literature of prior studies in analysing
asset write-offs and goodwill impairment, and companies‘ motivations for
accounting choice. It also discusses the theoretical framework, and the two
perspectives of accounting choices to be applied in this thesis.
Chapters 3-4 (Context of the study): Chapter 3 reviews the history of the
development of an accounting standard on goodwill in Malaysia, the
regulatory bodies overseeing the compliance with accounting standards, and
the ownership structure of Malaysian listed companies. Chapter 4 reviews
the requirements of IFRS 3, focusing on indications that an asset (goodwill)
may be impaired, judgements and estimates involved in an impairment test
of goodwill, and issues surrounding the impairment test of goodwill.
Chapter 5 (Hypotheses development): This chapter develops hypotheses to
test both the measurement and the recognition studies related to goodwill
impairment by Malaysian listed companies.
Chapter 6 (Research design and methods): The chapter describes the total
population of Malaysian listed companies which implemented FRS 32 from
2006/7 to 2008/9, discusses the process of validating the Datastream source
data, and specifies the final number of Malaysian listed companies which are
available for the analysis. It also describes the research designs and
statistical tests for the three empirical chapters – disclosure, measurement,
and recognition study.
2 FRS 3 Business Combinations refers to Malaysian Financial Reporting Standard 3 Business Combinations while IFRS 3 refers to the International Financial Reporting Standard 3 Business Combinations, issued by the IASB. When a discussion revolves around the exact requirement of the standard, especially when the issues are stated in the Basis for Conclusion (not available in FRS 3), IFRS 3 is applied; when a discussion involves Malaysian environment, FRS 3 is applied.

14
Chapters 7-9 (Empirical chapters of the thesis): These three chapters present
the empirical findings for the disclosure, measurement, and recognition
studies respectively.
Chapter 10 (Discussion and conclusion): This chapter reviews briefly the
achievement of the four research objectives, formulated at the outset of this
thesis. It discusses the contributions of the study, explains its limitations,
and offers suggestions for future research.

15
Figure 1.1: Structure of the thesis
Chapter 1
Introduction
Chapter 2
Review of literature and
theoretical framework of accounting
choices
Chapter 3
Accounting for goodwill in Malaysia
Chapter 4
Discretion available in
IFRS 3 – Impairment
test of goodwill
Chapter 5
Hypotheses
Development
Chapter 6
Research design & methods
Chapter 7
Disclosure
study
Chapter 8
Measurement study
Chapter 9
Recognition
study
Chapter 10
Discussion &
Conclusion
- Literature review &
Context of the study -
- Empirical chapters of
the thesis -

16
Chapter 2: Review of Literature and Theoretical Framework of Accounting Choices
2.1 Introduction
This chapter has two main purposes. Firstly, it reviews the literature on
accounting choices. The review covers three key issues; the various
definitions of accounting choice, the gaps in the literature of prior studies in
analysing asset write-offs and goodwill impairment, and companies‘
motivations for accounting choice as classified by Fields et al. (2001).
Secondly, it discusses the theoretical framework of accounting choices which
is applied in this thesis, that is, the agency theory model of Jensen and
Meckling (1976). It then continues with the two perspectives of accounting
choice which emerge from the agency theory, i.e. the contracting
perspective, and the opportunistic behaviour perspective.
This chapter is expected to contribute to the wider thesis in the following five
ways. Firstly, the review of definitions of accounting choice (in Section 2.2.1)
helps set a boundary on the issue of accounting choices related to goodwill
impairment examined in this thesis. Thus, the review contributes to the
formulation of the research objectives in Chapter 1 (see Section 1.3).
Secondly, the review of prior studies analysing asset write-offs and goodwill
impairment (in Section 2.2.2) highlights gaps in the literature, which this
thesis attempts to bridge. Thirdly, the review of companies‘ motivations for
accounting choice as classified by Fields et al. (2001) (in Section 2.2.3) helps
in identifying the appropriate theoretical framework of accounting choice to
be applied in this thesis. Fourthly, the review of the contracting perspective
(in Section 2.3.1) and the opportunistic behaviour perspective (in Section
2.3.2) set expectations for the development of hypotheses in Chapter 5.
Finally, the review of agency theory (in Section 2.3) and its evaluation in the
context of listed companies in the developing economy of Malaysia (in Section
2.3.3) highlight the nature of agency problem that may exist in companies
with concentrated ownership, which may have an influenced on the
applicability of the contracting perspective and the opportunistic behaviour

17
perspective. The review also generates ideas concerning the ownership
structures of companies, which will be further explored in Chapter 5, upon
development of the hypotheses.
This chapter is structured into four main sections, including the introduction.
Section 2.2 reviews the literature on accounting choices. Section 2.3
continues with a review and discussion of the theoretical framework of
accounting choice applied in this thesis. Section 2.4 summarises and
concludes the chapter.
2.2 Review of literature on accounting choices
The review of literature on accounting choices helps to define the scope of
the study (see Section 2.2.1), identifies gaps in the literature (see Section
2.2.2), and presents an overall picture of the motivations of companies in
exercising accounting choice (see Section 2.2.3). Thereafter (in Section 2.3)
the relevant perspectives of accounting choice to be applied in this thesis are
specified.
2.2.1 Definitions of accounting choice
Three definitions of accounting choice offered in the literature are:
‗[Accounting] policy choices in financial reporting — situations in which
one reporting method enables the user to convert easily to the
alternative method‘
(Carter, 1981: 109-110)
‗Accounting choice includes the firm manager's choice of one
accounting method over another. An example is the manager's choice
of straight-line depreciation rather than accelerated depreciation.
Accounting choice also includes the FASB's choice of accounting
standards.‘
(Watts, 1992: 235)

18
‗An accounting choice is any decision whose primary purpose is to
influence (either in form or substance) the output of the accounting
system in a particular way, including not only financial statements
published in accordance with GAAP [Generally Accepted Accounting
Principles], but also tax returns and regulatory filings.‘
(Fields et al. 2001: 256)
Other academics (e.g. Warfields et al., 1995: 63; DeFond and Jiambalvo,
1994: 149), although not providing an explicit definition, have described the
accounting choice in terms of the discretionary portion of total accruals
applied by managers. For example, Warfield et al. (1995) explained:
‗We concentrate on accounting accruals, or more specifically the
discretionary portion of total accruals, as reflective of managers‘
accounting choices.‘
(Warfields et al., 1995: 63)
DeFond and Jiambalvo (1994) exemplified:
‗Estimates of bad debt expense, estimates of inventory obsolescence,
and timing of sales are examples of management choices reflected in
accruals.‘
(DeFond and Jiambalvo, 1994: 149)
All of these definitions share a common feature, that is, they emphasise the
discretion exercised by the managers. The discretion could be directly
observed such as choosing between the accounting methods available to their
companies. Alternatively, it could be indirectly identified through the
accounting estimates made by the managers in applying a particular
accounting procedure. As expressed by McNichols and Wilson (1988):
‗[M]anagement can exercise discretion through accounting method
choice, through operating, investing, and financing policies, and
through choice of estimates for a given accounting method.‘
(McNichols and Wilson, 1988: 2)
Compared to other definitions, the definition offered by Fields et al. (2001) is
comprehensive. In reviewing their work, Francis (2001) considers the

19
definition to be wide-ranging, in the sense that it includes a number of
choices examined by prior studies. She elaborates that:
‗The definition includes: choices among equally acceptable rules (what
I term ‗‗hard‘‘ accounting choices, such as selecting LIFO versus FIFO
for inventory valuation or choosing ......); judgments and estimates
required to implement generally accepted accounting rules (for
example, the estimated service life of long-lived assets or …….);
disclosure decisions (such as the amount of detail provided in the
description of accounting policies); timing decisions (such as …….);
lobbying activities (such as ……); choices about display (e.g.,
………………); aggregation decisions (such as the extent to which
components of income are displayed as separate line items);
classification decisions (e.g., ……………….); decisions to structure
transactions in certain ways to achieve a desired accounting outcome
(for example, ……….); and real production and investment decisions
(such as ……………).‘
(Francis, 2001: 310-311)
Of the many types of accounting choice outlined by Francis (2001), two are
analysed in this thesis. These are: judgements and estimates employed by
managers in performing an impairment test of goodwill, and detailed
information on goodwill impairment disclosed in the Notes to the Financial
Statement. These two types of accounting choice lead to three aspects of
goodwill impairment to be examined in this thesis. These are disclosure (see
Chapter 7), measurement (see Chapter 8), and recognition (see Chapter 9) of
goodwill impairment.
According to Francis (2001: 309 and 313), in providing the definition of
accounting choice, Fields et al. (2001) consider ‗implementation decisions‘ to
be part of an accounting choice. Francis (2001: 312-313) views such a
definition as consistent with the focus of the regulators in the US.
Accordingly, she (p. 312) sees the effort as creating more opportunities for
future research in the field of accounting choice. It is also the researcher‘s
view that these opportunities could be extended to other researchers who are
interested in investigating companies located outside the US which implement

20
IFRSs. This is because the aim of the IASB is ‗not to permit choices in the
accounting treatment‘ (IASB 2006a: Preface to International Financial
Reporting Standards, paragraph 13). Should this aim be achieved, the
implication is that there would be no accounting method choice. Therefore,
by considering the implementation decisions as part of accounting choice,
Fields et al. (2001) paved the way for researchers interested in analysing
companies which implemented IFRSs.
The definition of accounting choice that this thesis builds upon is that of
Fields et al. (2001: 256). As noted earlier in Section 2.2.1, Fields et al. (2001:
256) define accounting choice as:
‗An accounting choice is any decision whose primary purpose is to
influence (either in form or substance) the output of the accounting
system in a particular way, including not only financial statements
published in accordance with GAAP, but also tax returns and regulatory
filings.‘
(Fields et al. 2001: 256)
Because the definition of accounting choice offered by Fields et al. (2001) is
too broad for a single research project, four terms offered by Fields et al.
(2001) in their definition (as underlined by the researcher above) require
further explanation and contextualisation. The contextualisation is essential
as it confines the scope of the issue of goodwill impairment examined in this
thesis.
Firstly, the term any decision, in this research should be interpreted as
referring to decisions made by managers of Malaysian listed companies in
implementing FRS 3, focusing specifically on goodwill impairment. As noted
earlier in this section, three aspects of implementation decisions are
examined, namely, disclosure, measurement, and recognition of goodwill
impairment. These implementation decisions cannot be observed directly, in
the sense that companies do not have a choice, for example, to measure or
not to measure goodwill impairment losses. Rather, the implementation
decisions represent indirect options, or as Nobes (2006: 240) refers to them
‗covert options‘, which are available to managers via judgements and
estimates employed while performing an impairment test of goodwill. These

21
‗covert options‘ allow the managers to make decisions when reporting
goodwill impairment losses (see Sections 4.4.2). As an example, in performing
an impairment test of goodwill, managers can be selective in the discount
rates employed in estimating the recoverable amount of cash-generating-units
containing goodwill so that they will be able to report goodwill impairment
losses (see Section 5.8.2.1). Alternatively, the managers could decide to
allocate goodwill to high growth cash-generating-units and thus report zero
goodwill impairment (see Section 5.8.1).
Secondly, the term primary purpose refers to companies‘ motives in reporting
goodwill impairment losses, or in reporting zero goodwill impairment. Because
the motives cannot be observed directly, they will be hypothesised based on
the contracting perspective (see Section 2.3.1) and the opportunistic
behaviour perspective (see Section 2.3.2). Among the potential motives for
reporting goodwill impairment losses, hypothesised in this thesis, are Chief
Executive Officers (CEOs) (both existing and incoming) attempting to provide
a signal that past problems have been addressed (see Section 5.6.3), to
smooth earnings (see Section 5.6.4), and new CEOs attempting to reduce the
benchmark against which their future performance will be judged (see Section
5.6.1). Potential motives for reporting zero goodwill impairment are the
concerns of CEOs for their reputation (see Section 5.6.2), and managers
attempting to avoid debt covenant violations (see Section 5.5).
Thirdly, because reporting goodwill impairment losses has an impact on
companies‘ earnings, the term to influence (either in form or substance) the
output of the accounting system refers mainly to managers‘ attempts to
influence company earnings reported in the income statement.
Fourthly, the investigation of implementation decisions is confined to
financial statements published in accordance with GAAP. It does not take into
accounts tax returns and regulatory filings.

22
2.2.2 Gaps in the literature of prior studies in analysing asset write-offs and goodwill impairment
The literature of asset write-offs emerged in the 1980s and focused on US
listed companies (e.g. Strong and Meyer, 1987; Elliot and Shaw, 1988; Zucca
and Campbell, 1992; Francis et al., 1996). In the 1980s and 1990s, prior
studies of asset write-offs hypothesise the motives of companies for taking
asset write-offs (e.g. Strong and Meyer, 1987; Zucca and Campbell, 1992;
Francis et al., 1996), or for taking large write-offs (e.g. Elliot and Shaw,
1988). In their review of prior studies analysing asset write-offs of US and
Australian listed companies between 1987 and 1998, Alciatore et al. (1998)
explained there was a need for research in this area during this period as
companies tended to take a large magnitude of asset write-offs (i.e. mean
amount of write-offs ranged from 4% to 19.4% of the total assets) (Alciatore et
al., 1998: 1). This is because before 1995, there was no specific requirement
for US listed companies to write-down the value of those assets that had
become impaired (Alciatore et al., 1998: 4). As a result, the US GAAP allowed
a great deal of flexibility in accounting for the write-offs (Alciatore et al.,
1998: 1).
To test motives of companies for reporting asset write-offs, prior studies (e.g.
Strong and Meyer, 1987; Elliot and Shaw, 1988; Zucca and Campbell, 1992;
Francis et al., 1996) employed variables which captured these motivations,
such as change in CEO, big bath variable, and earnings smoothing variable.
They then tested the companies‘ decisions in taking asset write-offs against a
control group of companies which did not. By selecting variables which tested
the motives for taking asset write-offs, it seems that these studies say very
little about the motivation of companies for reporting zero asset write-offs
(i.e. not reporting the write-offs). They also assumed a zero reported figure
to be a faithful indication that no impairment has occurred.
Alciatore et al. (1998: 33) considered these prior studies to be a ‗subtle
problem‘, due to their emphasis on examining companies‘ motives for taking
asset write-offs. They recommended that future studies identify and examine
companies that ‗have impaired assets but have not written them down‘
(Alciatore et al., 1998: 33). They stated:

23
‗A more subtle problem is that researchers have generally only examined
firms that have taken asset write-downs. An interesting avenue for future
research would be to identify and examine firms that have impaired assets
but have not written them down, or did not write them down in a timely
manner.‘
(Alciatore et al., 1998: 33)
The literature of goodwill impairment was initially part of the literature of
asset write-offs. For example, Francis et al. (1996: 118), in examining asset
write-offs categorised goodwill impairment as discretionary asset write-offs.
In 2001, as a result of a joint effort between US FASB and IASB in accounting
for business combinations, that required an impairment-only approach to
accounting for goodwill, academic researchers started to focus exclusively on
goodwill impairment. This research was initiated by Beatty and Weber (2006),
and examined US listed companies implementing SFAS 1423 in 2001. The study
carried out by Beatty and Weber (2006) was later adapted by others focusing
on US listed companies but with an increased sample size (i.e. Zang, 2008),
including subsequent years of investigation (e.g. Guler, 2007; Ramanna and
Watts, 2012), and in different environments [i.e. Lapointe-Antunes et al.‘s
(2008) analysis of goodwill impairment by Canadian4 listed companies]. Two
prior studies closely related to this thesis are the studies of the
implementation of IFRS 3 Business Combinations focusing on goodwill
impairment by AbuGhazaleh et al. (2011), which examined UK listed
companies, and Omar and Mohd-Saleh (2011) which analysed Malaysian listed
companies.
Prior studies which focused on goodwill impairment appear to be divided into
three groups. The first group examined a specific accounting choice related to
goodwill impairment available to US listed companies (e.g. Beatty and Weber,
3 SFAS 142 refers to Statement of Financial Accounting Standards on Goodwill and Other Intangible Assets and was implemented in 2001.
4 Canadian listed companies implement Section 3062 of the Canadian Institute of Chartered Accountants‘ Handbook which is similar to SFAS 142, in that, it offers a transitional period to Canadian listed companies in reporting goodwill impairment in 2002. However, it differs from SFAS 142 with regard to its treatment of the transitional goodwill impairment loss as a retroactive method of a change in accounting principle instead of cumulative effect of a change in accounting principle, as required by SFAS 142.
24
2006; Zang, 2008) and Canadian listed companies (e.g. Lapointe-Antunes et
al., 2008) during the transitional period of implementing an accounting
standard on goodwill5. This transitional choice is not available for companies
which implement IFRS 3 including Malaysian and UK listed companies.
Therefore, this thesis will not discuss the hypotheses formulated by these
studies, which aimed to capture companies‘ motives in selecting and
reporting the transitional choice6.
The second group of studies related to goodwill impairment extended the
prior studies of asset write-offs by focusing on companies‘ motives for
reporting goodwill impairment losses. For example, Godfrey and Koh (2009:
129) selected only those US listed companies which reported goodwill
impairment losses from 2002 to 2004. This thesis will discuss the hypotheses
formulated by this group (see Chapter 5, e.g. Section 5.6.3).
The third group of studies related to goodwill impairment examined
companies likely to require write-offs (e.g. Guler, 2007; Ramanna and Watts,
2012). According to Guler (2007: 18), companies which have the ‗probability
of having to take a goodwill impairment charge‘ are companies that have
their market values lower than the book values of their net assets and the
difference does not exceed the amount of goodwill balance reported.
Ramanna and Watts (2012: 750) regard the ‗market indications of goodwill
impairment‘ to be when companies experienced a book-to-market ratio
greater than one for two consecutive years after previously reporting higher
5 At the times of these studies, the accounting standard on goodwill for US listed companies is SFAS 142 Statement of Financial Accounting Standards on Goodwill and Other Intangible Assets while for Canadian listed companies, it is Section 3062 of the Canadian Institute of Chartered Accountants‘ Handbook.
6 For US listed companies, the transitional choice refers to a trade-off faced by managers in
either reporting goodwill impairment losses as the cumulative effect of a change in accounting principle during the transitional year (known as below-the-line of an income from continuing operation), or in delay reporting the impairment losses in that year by reporting the impairment losses in the subsequent year as an operating charge (known as above-the-line of an income from continuing operation) (Beatty and Weber, 2006: 257 and 262). For Canadian listed companies, the transitional choice refers to a decision made by managers in reporting the transitional goodwill impairment losses as a retroactive method of a change in accounting principle (Lapointe-Antunes et al., 2008: 38). The cumulative effect method under SFAS 142 requires the transitional goodwill impairment loss to be charged to income statement while the retroactive method under Section 3062 requires transitional goodwill impairment to be charged to the opening retained earnings (Lapointe-Antunes et al., 2008: 38).
25
market values than the book values of their net assets. Guler (2007)
investigated factors influencing managers‘ choice in recognising goodwill
impairment losses. Ramanna and Watts (2012: 750), on the other hand,
adopted a more direct approach by investigating factors influencing ‗goodwill
non-impairment‘. This thesis will also discuss the hypotheses formulated by
this group (see Chapter 5, e.g. Section 5.6.2).
The two studies which analysed companies implementing IFRS3, namely,
AbuGhazaleh et al. (2011) and Omar and Mohd-Saleh (2011), appear to have
analysed both goodwill impairment losses and zero goodwill impairment. In
the case of AbuGhazaleh et al. (2011), their analysis of goodwill impairment
(a measurement study) includes the top 500 UK listed companies which
reported zero goodwill impairment and goodwill impairment losses. Omar and
Mohd-Saleh (2011: 400 and 402) focused on the recognition of goodwill
impairment by the total population of Malaysian listed companies during the
initial year of implementing FRS 3 (i.e. either in 2006, 2007 or 2008).
The review of literature discussed in this section highlights two important
gaps in the studies of asset write-offs and goodwill impairment. Firstly, the
majority of these studies focused on listed companies in developed
economies, mainly in the US (e.g. Beatty and Weber, 2006; Guler, 2007; Zang,
2008; Ramanna and Watts, 2012) but also in Canada (i.e. Lapointe-Antunes et
al., 2008) and the UK (i.e. AbuGhazaleh et al., 2011). Omar and Mohd-Saleh
(2011) represent an early attempt in analysing goodwill impairment among
listed companies in the developing economy of Malaysia. However, they
investigate (p. 402) companies which implemented FRS 3 in the first year
(either in 2006, 2007, or 2008), and the study focuses on the recognition of
goodwill impairment7. Thus, there is a need for a more comprehensive study
focusing on goodwill impairment by listed companies in a developing
economy, a gap which this thesis attempts to address by conducting a
measurement study8 of goodwill impairment (see Chapter 8).
7Their dependent variable is a dichotomous variable, equal to one when a company reported goodwill impairment loss, and zero otherwise.
8In the measurement study, the dependent variable is the magnitude of goodwill impairment losses divided by prior year total assets (including goodwill), and zero otherwise reported on the income statement.

26
The second gap identified in the literature of asset write-offs and goodwill
impairment concerns their emphasis on examining only those companies
taking asset write-offs and their motives. As highlighted by Alciatore et al.
(1998: 33), future studies need to identify and examine ‗firms that have
impaired assets but have not written them down, or did not write them down
in a timely manner‘. Similar in concept to the study undertaken by Ramanna
and Watts (2012) as discussed in this section, this thesis aims to analyse
companies‘ motives for recognising zero goodwill impairment in a specific
setting in which impairment might reasonably be expected. The setting
chosen in this thesis is one where the market values of companies are lower
than the book values of their net assets for three consecutive years (see
Chapter 9).
Having discussed two gaps in the literature of asset write-offs and goodwill
impairment, Section 2.2.3 now briefly describes the taxonomy of accounting
choice literature offered by Fields et al. (2001).
2.2.3 Companies’ motivations for accounting choice as classified by Fields et al. (2001)
This section serves two purposes. Firstly, it presents an overall picture of
companies‘ motivations with regard to accounting choice. Secondly, it
identifies the relevant perspectives of accounting choice to be applied in this
thesis.
In presenting an overall picture of companies‘ motivations for accounting
choice, this thesis applies the taxonomy of accounting choice literature
offered by Fields et al. (2001). In their review of accounting choice studies
published in the 1990s, Fields et al. (2001) endeavoured to classify the various
perspectives of accounting choice into three categories based on three
different types of market imperfection, i.e. agency costs, externalities
affecting non-contracting parties, and information asymmetries (Fields et al.
(2001). Figure 2.1 depicts companies‘ motivations for accounting choice as
per the taxonomy provided by Fields et al. (2001).

27
Figure 2.1: Companies’ motivations for accounting choice classified by Fields et al. (2001) into three different types of market imperfection
Market imperfections * Agency costs * Externalities affecting non-
contracting parties * Information asymmetries
Agency costs - Contractual motivations
Information asymmetries
- Asset pricing motivations
Externalities affecting non-contracting parties -
Motivation due to impact on
third parties
Internal agency
conflicts
External agency
conflicts
Taxes Regulation Disclosure
policies
Market
efficiency
Earnings
management

28
Turning to Figure 2.1, the first motivation for accounting choice outlined by
Fields et al. (2001: 257) is the contractual motive, which arises as a result of
the existence of agency costs. In this category, managers exercise an
accounting choice in order to influence contractual arrangements with the
primary purpose of alleviating agency costs (Fields et al., 2001: 261-262). This
view of accounting choice is referred to as an efficient contracting
perspective (Fields et al., 2001: 261). For example, management
compensation contracts tied to the accounting numbers are established in
order to better align the incentives of the managers with the shareholders
(Fields et al., 2001: 262). On the other hand, ex post accounting choice could
be exercised in order to increase the level of management compensation or to
avoid debt covenant violations (Fields et al., 2001: 262). Fields et al. (2001:
267) describe this view of accounting choice as managerial opportunism
[alternatively referred to by Holthausen (1990: 207) as an opportunistic
behaviour perspective]. Companies‘ contractual motivations will be explored
in this thesis (see Section 2.3.1).
As outlined by Fields et al. (2001), externalities affecting non-contracting
parties are the second motivation for an accounting choice. Fields et al.
(2001) segregated this motivation into two - taxes and regulation (see Figure
2.1). Following on from this, political cost hypotheses have been developed
and tested (Watts and Zimmerman, 1990: 134; Fields et al., 2001). Studies on
the link between taxes and accounting choice normally analyse whether
managers make use of accounting choice to minimise the present value of
taxes (Dhaliwal and Wang, 1992), or to reduce the tax burden (Kang, 1993).
The issue of taxes will not be explored in this thesis because under the
Malaysian tax system, goodwill impairment losses are non-tax deductible
(Azmi, 2006). Similarly, in the case of regulation, prior studies normally
examine the impact of accounting choice on industry-specific regulation (e.g.
Jones, 1991). However, in Malaysia, the number of companies which are
classified under industry specific regulation is small9.
9 For example, Malaysian steel industry is price regulated by the government (JUBM, 2008). In this industry, only 28 firm-years (from 2006 to 2008) implemented FRS 3 related to goodwill impairment.

29
The third motivation for an accounting choice outlined by Fields et al. (2001)
comprises asset pricing. This arises because of the existence of asymmetrical
information between a company and the market (Fields et al., 2001). This
motivation is segregated into three areas – earnings management, companies‘
disclosure policies, and market efficiency (see Figure 2.1). Asset pricing
motivation will not be explored in this thesis because the issue is too far
reaching for inclusion and this thesis is already committed to an analysis of
three aspects of the implementation decisions, i.e. disclosure (see Chapter 7),
measurement (see Chapter 8), and recognition (see Chapter 9) of goodwill
impairment. However, because the asset pricing motivation examines the
consequence of the accounting choice exercised, it is seen as the next step in
the study of accounting choice and will be considered for future research.
One challenge faced by the researcher in following exactly the three
classifications of companies‘ motivations for accounting choice as offered by
Fields et al. (2001) (see Figure 2.1) is that these classifications do not
emphasise the theoretical frameworks of accounting choice. Rather, Fields et
al. (2001) focus on three types of market imperfection. Because of this, an
opportunistic behaviour perspective, which is a common perspective of an
accounting choice applied by prior studies of asset write-offs and goodwill
impairment, is discussed by Fields et al. (2001) interchangeably both in the
contractual motivations and asset pricing motivations. To overcome this issue,
Section 2.3.2 discusses an opportunistic behaviour perspective both within
contracts and without an explicit link with companies‘ contractual
arrangements.
2.3 Agency theory
This section first reviews the agency theory model as developed by Jensen
and Meckling (1976). Following this review, the section is expanded into three
areas. Section 2.3.1 discusses the contracting perspective, Section 2.3.2
discusses the opportunistic behaviour perspective, and Section 2.3.3 evaluates
the idea of the agency theory to listed companies in the developing economy
of Malaysia, which are found to have concentrated ownership.

30
Agency theory as developed by Jensen and Meckling (1976) models the
relationship between a principal (who delegates work) and an agent (who
performs the work) (Eisenhardt, 1988: 490). In the model, Jensen and
Meckling (1976: 308) consider contracts between owners and managers of a
company, where in the contract, the owner is the principal and the manager
is the agent (Jensen and Meckling, 1976). They describe these contracts as an
agency relationship (Watts and Zimmerman, 1986: 181), and define the
agency relationship as:
‗A contract under which one or more persons (the principal(s)) engage
another person (the agent) to perform some service on their behalf
which involves delegating some decision making authority to the
agent.‘
(Jensen and Meckling, 1976: 308)
In describing the agency relationship, agency theory assumes that both the
principal (owner) and the agent (manager) are utility maximisers (Jensen and
Meckling, 1976: 308). Based on this assumption, the theory predicts that the
agent will not always act in the best interests of the principal (ibid., p. 308).
This may lead to agency conflict between the two parties (Jensen and
Meckling, 1976: 308; Eisenhardt, 1989). In this context, conflict refers to a
situation when the actions which maximise the agent‘s expected utilities do
not necessarily lead to the maximisation of the principal‘s expected utilities
(Watts, 1977: 55).
The divergence of interests (and therefore the potential conflict between the
principal and the agent) generates agency costs (Jensen and Meckling, 1976).
These costs consist of three components: monitoring costs, bonding costs, and
residual loss (Jensen and Meckling, 1976: 308). Monitoring costs are costs
borne by the principal in his efforts to ensure that the agent is acting in the
principal‘s best interest (Jensen and Meckling, 1976: 308). Watts and
Zimmerman (1986: 181) explained that these costs are incurred by the
principal to guarantee that the agent limits his activities, consistent with the
contracts. Bonding costs are costs borne by the agent in order to provide some
assurance to the principal that he will not take an action which will harm the
principal‘s best interest, or if he does, that compensation will be provided

31
(Jensen and Meckling, 1976: 308). These costs are incurred by the agent to
guarantee that he will limit his activities in line with the contract (Watts and
Zimmerman, 1986: 181). Residual loss is a reduction in welfare faced by the
principal, given optimal bonding and monitoring (Jensen and Meckling, 1976:
308).
2.3.1 Contracting perspective
In developing the contracting perspective, Watts and Zimmerman (1986: 201)
emphasised the role of accounting numbers employed in the contracts. They
argue that accounting numbers are used in designing the terms of the contract
and in monitoring of the contracts (ibid., p.196). For example, a bonus plan
contract which is formulated to align the interests of the manager (agent)
with those of the shareholder (principal) utilises accounting earnings (Watts,
1992). Thus, accounting numbers are seen as monitoring and bonding devices
between the manager (agent) and the shareholder (principal) (Watts and
Zimmerman, 1986).
The argument about the role of accounting numbers in contracts goes further
by suggesting that if the accounting numbers become an integral part of the
contracting process, and the numbers used in the contracts reduce
companies‘ agency costs, then the accounting procedure used to calculate the
number is more efficient than an alternative accounting procedure (ibid., p.
196). Employing the alternative procedure increases the agency costs and thus
reduces the company‘s value or the manager‘s wealth (ibid., p. 196). Thus,
the contracting role of accounting allows accounting procedures to have an
impact on companies‘ values and their cash flows (ibid., p. 199). It also
provides an explanation for managers‘ choice of one accounting method over
another (ibid., p. 196).
Following this line of argument, the contracting hypothesis is developed
(Watts and Zimmerman, 1986). The hypothesis states that:
‗Accounting methods are primarily determined by the use of accounting
numbers in contracts between parties to the firm.‘
(Watts and Zimmerman, 1990: 132)
32
Watts and Zimmerman (1990: 135) further elaborate the contracting
hypothesis by stating that the managers‘ choice of one accounting method
compared to another could be because the accounting choice exercised
increases the wealth of all the contracting parties (i.e. efficiency reasons) or
because it maximises the managers‘ wealth to the detriment of other
contracting parties (i.e. managers acted opportunistically). Holthausen (1990:
207 and 208) referred to these explanations, i.e. efficiency reasons, and
managers behaving opportunistically, as ‗efficient contracting perspective‘
and ‗opportunistic behaviour perspective‘ respectively.
Similar to Watts and Zimmerman (1990), Holthausen (1990) explained that
under the efficient contracting perspective, accounting choice is exercised in
order to reduce agency costs. He states:
‗The efficient contracting perspective with respect to accounting
choice implies that accounting methods, like the form of organization
chosen or the form of contracts written, will be selected to minimize
agency costs amongst the various parties to the firm.‘
(Holthausen, 1990: 207)
For the opportunistic behaviour perspective, Holthausen (1990) explained that
managers take the existing contracts as given and choose an accounting
method to make themselves better off at the expense of other contracting
parties. He states:
‗the accounting method a manager would choose is driven by how the
choice affects the existing contracts without considering how future
contracts might be written. From this perspective and some additional
assumptions come hypotheses such as: managers will tend to choose
more income-increasing techniques the greater the company‘s leverage
in an effort to reduce the extent to which accounting-based debt
covenants are binding, or managers choose income-increasing
techniques to increase their bonuses if their compensation is directly
tied to accounting earnings. These hypotheses arise not from
maximization of firm value but from a transfer of wealth between
bondholders, shareholders, and management which increases

33
management‘s utility because of their holdings of stock and stock
options and because of their bonus compensation plans.‘
(Holthausen, 1990: 208)
Briefly, the contracting perspective suggests that the manager of a company
will exercise an accounting choice because of the accounting numbers used in
the contracts (Watts and Zimmerman, 1990: 132). From the contracting
perspective, two further perspectives emerge, namely, an efficient
contracting perspective, and an opportunistic behaviour perspective (Watts
and Zimmernman, 1990: 135-136; Holthausen, 1990: 207).
The efficient contracting perspective suggests that the choice of one
accounting method over another is ‗to minimize agency costs amongst the
various parties to the firm‘, which lead to the maximisation of a company‘s
value (Holthausen, 1990: 207 and 208). In contrast, taking the existing
contracts as given, the opportunistic behaviour perspective sees that the
accounting choice exercised by managers is designed to make them better off
at the expense of other contracting parties (Holthausen, 1990: 208; Christie
and Zimmerman, 1994: 539). In this thesis, it is not feasible to design a test to
distinguish between the efficient contracting perspective and the
opportunistic behaviour perspective (see Section 2.3.1.3). Thus, the position
taken in this thesis is to interpret the finding of the debt hypothesis (which
will be discussed in Sections 2.3.1.2 and 5.5) from the contracting perspective
without specifying whether the result could be interpreted from the efficient
contracting or opportunistic behaviour perspective. Detailed discussion of the
opportunistic behaviour perspective is presented in Section 2.3.2.
In applying the contracting perspective of accounting choice, Watts and
Zimmerman (1986: 198) explained that prior studies focused on two types of
contract - the management compensation agreements and the debt
agreements. Sections 2.3.1.1 to 2.3.1.2 discuss these two types of contract
and Section 2.3.1.3 ends the section by discussing the limitation of prior
studies testing the contracting perspective.

34
2.3.1.1 Management compensation plan: Internal agency conflicts
A management compensation plan is a contract between companies and their
managers. This contract is set up in order to reduce any internal agency
conflicts between the two parties. One of the management compensation
contracts which has been thoroughly examined is the bonus plan (Fields et al.,
2001: 266). The bonus plan is designed so that the bonus awarded is based on
a certain percentage of the accounting numbers, and which reflects a
company‘s performance (e.g. reported income, sales, or assets) (Deegan and
Unerman, 2006).
Generally prior studies investigating the bonus plans found that managers
exercised an accounting choice to boost their compensation (Fields et al.,
2001: 267). For example, in the case of goodwill impairment, Beatty and
Weber (2006), found that managers of companies with earnings-based bonus
contracts that are written on net income and which include special items (i.e.
goodwill impairment losses), are less likely to take goodwill impairment losses
than those with earnings-based bonuses that exclude special items. For
Malaysian listed companies, data on management compensation is not publicly
available. For this reason, this thesis will not explore the issue of the
management compensation plans.
2.3.1.2 Debt covenants: External agency conflicts
A debt covenant is a contract between companies and their debt-holders,
established to reduce the agency conflicts between the two parties (Fields et
al., 2001: 265). The contract often includes covenants related to the
accounting numbers published in financial statements. These are designed to
limit the actions of managers (Watts and Zimmerman, 1986) in redistributing
the companies‘ values to the shareholders (Lys, 1984) at the expense of the
debt-holders (Duke and Hunt, 1990). Any breach of the covenant is regarded
as a default, which allows lenders to then take legal action (Watts and
Zimmerman, 1986: 210).

35
Assuming that defaulting on the debt contracts is costly to companies, prior
studies predict that managers of companies which are close to violating the
debt covenants are likely to exercise an accounting choice to reduce the
likelihood of breaching the accounting-based debt contracts (Watts and
Zimmerman, 1986; Duke and Hunt, 1990). By exercising an accounting choice,
these companies are attempting to relax the accounting-based restrictions
stipulated in the debt covenants (Smith, 1993), hence avoiding violating the
terms of these covenants (Dichev and Skinner, 2002). Thus, in general, the
debt hypothesis suggests that companies which are close to violating their
debt covenants are more likely to exercise an accounting choice by adopting
income increasing accounting methods than those companies which are not
(Whittred, 1987: 269; Fields et al., 2001: 273) (see Section 5.5 for detailed
discussion of the debt hypothesis in relation to goodwill impairment).
To test the debt hypothesis, many of the prior studies (e.g. Press and
Weintrop, 1990; Hall, 1993; Guler, 2007; AbuGhazaleh et al., 2011; Hamberg
et al., 2010) employed leverage as a surrogate for companies‘ closeness to
debt covenant violations (Duke and Hunt, 1990; Fields et al., 2001: 272).
However, one continuing issue in applying leverage is that it does not fully
capture the default risk of debt (Lys, 1984; Fields et al., 2001; Dichev and
Skinner, 2002). For example, Dichev and Skinner (2002) examined the
association between companies‘ actual covenant slacks and leverage for
114,330 loans (or 2,810 US borrowing companies) between 1989 and 1999.
Their argument, not stated, is that for leverage to be a good proxy for the
closeness to the debt covenant violation, it should be highly associated
negatively with the actual debt covenant slacks, in that, highly levered
companies will have fewer slacks. They found that, although the actual
covenant slacks and leverage are significantly associated (in a negative
direction), the correlation of the two variables is not ‗large economically‘ (p.
1105). To them, the results of the correlation between the two variables,
which is less than 0.5, suggest that for the companies they analysed, leverage
is ‗a noisy proxy for actual closeness to covenants‘ (p. 1105).
To overcome the limitation of using leverage, some researchers began to
inspect the actual debt covenants of companies (e.g. Dichev and Skinner,

36
2002). In this thesis, because data on these debt covenants is not publicly
available, leverage is employed as a proxy for closeness to debt covenant
violations. The application of leverage represents a limitation to the study, in
the sense that the variable is an indirect test of the debt hypothesis (see
Section 5.5).
2.3.1.3 Limitation of research works testing the contracting perspective
One of the limitations of prior studies of accounting choice analysing
companies‘ contractual arrangements is that generally they would interpret
the findings as evidence of managerial opportunism (Fields et al., 2001: 267
and 271). These studies view managers as taking advantage of the discretion
available in contracts to increase their compensation (Fields et al., 2001:
267). However, it is possible that in some cases, the behaviour of managers
could be interpreted as value maximising (Fields et al., 2001: 271). The
inclination to interpret the result from the opportunistic behaviour
perspective instead of the efficient contracting perspective is because of the
difficulties academic researchers face in constructing variables to test the
efficient contracting perspective (Holthausen, 1990). Moreover, it is almost
impossible to measure either the efficiency in contracting or the value
maximisation of the companies (Fields et al., 2001: 274).
As noted in Section 2.3.1.2, the contracting perspective will be tested in this
thesis by employing leverage (debt ratio). Realising that it is not yet feasible
to design a test to distinguish between an efficient contracting, and an
opportunistic behaviour perspective as discussed above, the position taken in
this thesis is to interpret the finding of the debt hypothesis from the
contracting perspective (using leverage as a proxy for company‘s closeness to
debt covenant violation), without specifying whether the result could be
interpreted from the efficient contracting, or the opportunistic behaviour
perspective.

37
2.3.2 Opportunistic behaviour perspective
In this section, two aspects of the opportunistic behaviour perspective are
discussed, namely, managerial opportunism within contracts, and managerial
opportunism without an explicit link with the contractual arrangements.
Incentives for the opportunistic behaviour by managers include: to influence
their own compensations, based on reported earnings (Christie and
Zimmerman, 1994: 542; Francis et al., 1996: 123; Riedl, 2004: 828 and 833),
to reduce the likelihood of being removed as a result of their companies‘ poor
performance (Christie and Zimmerman, 1994: 542; Healy, 1996: 108), and to
transfer wealth to shareholders from other stakeholders (Healy, 1996: 108).
As noted in Section 2.3.1, managerial opportunism within contracts emerges
from the contracting perspective. Taking the existing contracts as given, the
opportunistic behaviour perspective posits that managers choose an
accounting method to make themselves better off at the expense of other
contracting parties (Holthausen, 1990: 208; Christie and Zimmerman, 1994:
539).
Prior studies generally employed proxies to capture managers‘ incentives in
influencing companies‘ contractual arrangements, and they interpreted the
result as providing evidence of managerial opportunism, driving the
accounting choice (Skinner, 1993: 408). For example, in the case of a
management compensation plan, Beatty and Weber (2006: 270) captured the
effects of bonus compensation on the decisions to report goodwill impairment
losses via a dichotomous variable, equal to one if a company has an earnings-
based bonus plan. They (p. 273) then regress the dependent variable (i.e.
measures of accounting choice) on the dichotomous variable for a bonus plan.
A negative relation between the two variables is interpreted by Beatty and
Weber (2006: 259) as evidence of managers exercising an accounting choice to
influence their compensation. In this instance, managerial opportunism
includes transferring wealth from companies to the managers under
managerial compensation contracts (Skinner, 1993: 416). In the case of debt
covenant, managerial opportunism involved transferring wealth from
bondholders to shareholders by the managers (Skinner, 1993: 416).

38
Apart from interpreting evidence of managerial opportunism within the
contractual arrangements of companies, prior studies have also interpreted
evidence of managerial opportunism without an explicit link with companies‘
contracts. In the context of asset write-offs and goodwill impairment, prior
studies applied the opportunistic behaviour perspective by suggesting that
managers take advantage of the discretion afforded by the standard (Francis
et al., 1996: 118; Riedl, 2004: 849; Hilton and O‘ Brien, 2009: 181 and 201).
Reasons for such managerial opportunism are explained in terms of the
behaviour of incoming CEOs in reporting goodwill impairment losses soon after
appointment (see Section 5.6.1), the behaviour of continuing CEOs in being
less likely to report goodwill impairment losses (see Section 5.6.2), big bath
reporting behaviour (see Section 5.6.3), and earnings smoothing activities (see
Section 5.6.4). For all these reasons, the prior studies (e.g. Elliott and Shaw,
1988; Francis et al., 1996; Riedl, 2004) did not discuss the link between the
behaviour of the CEOs and the contracts which may exist between the top
managers and the company. Detailed discussion of the reasons for managerial
opportunism is carried out in Section 5.6.
2.3.3 Evaluation of agency theory
La Porta et al. (1998: 471) and Claessens et al. (2000: 82) believed that the
theoretical study of Jensen and Meckling (1976) was developed around the
image of companies with disperse ownership. The idea of disperse ownership
might be challenging to listed companies in Malaysia because these companies
possess at least two characteristics distinct from listed companies in the
developed economies, such as the US and UK. Firstly, listed companies in
Malaysia are reported by prior studies (e.g. La Porta et al., 1998: 1147; Leuz
et al., 2003: 516; Haniffa and Hudaib, 2006: 1035) to have concentrated
ownership (see Section 3.4). Secondly, managers of Malaysian listed
companies were observed to own a large portion of their companies‘ shares
(Claessens et al., 2000: 103; Mohd Ghazali, 2004:192) (see Section 3.4).
With concentrated ownership, the nature of the agency problem which exists
in Malaysian listed companies might differ from those in developed
economies, such as the US and UK. Shleifer and Vishny (1997: 754) argue that

39
compared to companies with disperse ownership, companies with
concentrated ownership might face fewer agency problems arising from the
separation of ownership and management. Niehaus (1989: 271-272) explains
that when shareholders have a small stake in the companies in which they
have invested, they have less incentive for monitoring the actions of
managers, as the monitoring costs outweigh the benefits. However, as
shareholders ownership claims increase, the benefits of monitoring managers
tends to outweigh the costs (Niehaus, 1989: 271-272).
On the other hand, Fan and Wong (2002: 405) argue that in companies with
concentrated ownership, the nature of the agency problem might have shifted
to a conflict between controlling owners (who are also the managers) and
minority shareholders. This could occur when shareholders obtain a
substantial portion of a company‘s shares, to the point where they acquire an
effective control of the company (Fan and Wong, 2005: 405). Once the
effective control is acquired, the conflict of interest shifted (Fan and Wong,
2005: 405). Instead of a conflict of interest between managers and
shareholders, the conflict is between controlling and the minority
shareholders (Fan and Wong, 2002: 405).
The potentially different nature of the agency problem faced by companies
with concentrated ownership, compared to companies with dispersed
ownership (discussed above), might affect the applicability of the contracting
perspective and the opportunistic behaviour perspective. The applicability of
these two perspectives will be examined in the measurement study (see
Chapter 8) and the recognition study (see Chapter 9) of this thesis.
With regard to managerial ownership, agency theory suggests that as an
owner-manager‘s fraction of the equity falls, his claim on the outcome
declines (Jensen and Meckling, 1976: 313; Warfield et al., 1995: 62). This in
turn creates incentives for him to pursue non-value maximising behaviour such
as ‗shirking and perquisite taking‘ (Jensen and Meckling, 1976: 313; Warfield
et al., 1995: 62). To restrict the manager‘s value-reducing behaviour when
there is a separation of ownership and control, contracts which normally
contain accounting-based constraints are established (Warfield et al., 1995:
62).

40
Given that there is latitude in GAAP, managers tend to exercise an accounting
choice to either alleviate the accounting-based constraints, or to benefit from
the incentives available in the contracts (Warfield et al., 1995: 62 and 63).
Therefore, lower managerial ownership is associated with an increase in
companies‘ contractual constraints, which is often based on accounting
numbers (Warfield et al., 1995: 65). Accordingly, this may lead to greater
accounting choice being exercised by managers in order to relax the
constraints or to capitalise on the incentives (Warfield et al., 1995: 65). Thus,
it is possible that when managerial ownership is high, there may be less
emphasis on the incentives contracts, leading to the contracting perspective
being less applicable in explaining the accounting choices exercised by
managers of Malaysian listed companies.
The argument discussed above suggests that the ownership structures of
companies, specifically, outside ownership concentration and managerial
ownership, may well influence the accounting choices related to goodwill
impairment exercised by Malaysian listed companies. By incorporating the
ownership structures variables, it is hoped that a more complete model of
accounting choices related to goodwill impairment by Malaysian listed
companies is developed.
2.4 Summary and conclusions
This chapter has reviewed the literature on accounting choices by discussing
the various definitions of accounting choice (in Section 2.2.1) and the gaps in
the literature of prior studies in analysing asset write-offs and goodwill
impairment (in Section 2.2.2). It has also reviewed two perspectives of
accounting choice – the contracting perspective and the opportunistic
behaviour perspective (in Sections 2.3.1, and 2.3.2), and discussed the
applicability of the agency theory model to listed companies in the developing
economy of Malaysia (in Section 2.3.3). The main conclusions of the chapter
are as follows:
Firstly, the review of the various definitions of accounting choice (in Section
2.2.1) highlights that the definitions of accounting choice share a common

41
feature, in that, they emphasise the discretion exercised by managers. This
helps the researcher to confine the scope of this thesis by focusing on the
decisions made by managers of Malaysian listed companies in implementing
FRS 3, focusing specifically on the disclosure, measurement, and recognition
of goodwill impairment.
Secondly, the review of prior studies analysing asset write-offs and goodwill
impairment (in Section 2.2.2), demonstrates that there remains at least two
gaps in the study of goodwill impairment. The first gap is that all of the
published studies to date have focused on companies in developed economies,
in particular US listed companies. Given that the contracting perspective and
the opportunistic behaviour perspective were formulated by prior studies
using data from developed economies, the lack of studies on accounting
choices related to goodwill impairment in a developing economy highlights
the need to investigate such an issue.
The second gap in the literature is the lack of focus regarding companies‘
motives for reporting zero goodwill impairment. This leads this thesis to
analyse both aspects of goodwill impairment, i.e. (i) motives for reporting
goodwill impairment losses (in the measurement study – see Chapter 8); and
(ii) motives for reporting zero goodwill impairment (in the recognition study –
see Chapter 9).
Thirdly, the review of companies‘ motivations for accounting choice as
outlined by Fields et al. (2001) (in Section 2.2.3) helps in identifying the
appropriate theoretical framework of accounting choice to be applied in this
thesis.
Fourthly, the review of the contracting perspective (in Section 2.3.1) and the
opportunistic behaviour perspective (in Section 2.3.2) forms a basis for the
development of the hypotheses in Chapter 5. Testing the hypotheses in
Chapters 8 and 9 will provide empirical evidence for whether the contracting
perspective and the opportunistic behaviour perspective are applicable in
explaining the measurement and recognition of goodwill impairment by listed
companies in a developing economy, in particular Malaysian listed companies.
42
Finally, the evaluation of agency theory (in Section 2.3.3) highlights that prior
studies (i.e. La Porta et al., 1998: 471; Claessens et al., 2000: 82) took the
view that the theoretical study of Jensen and Meckling (1976) had been
developed around the image of companies with disperse ownership.
Accordingly, this may affect the applicability of the contracting perspective
and the opportunistic behaviour perspective among listed companies in
Malaysia (in Chapters 8 and 9). The evaluation of the agency theory model
also suggests that the ownership structures of companies may well influence
the accounting choices exercised by Malaysian listed companies. The
ownership structures of Malaysian listed companies will be discussed in
Chapter 3, and the formulation of additional hypotheses related to the
ownership variables in Chapter 5.

43
Chapter 3: Accounting for Goodwill in Malaysia
3.1 Introduction
Chapter 2 has provided a review of literature on accounting choices and the
two perspectives of accounting choices, i.e. the contracting perspective, and
the opportunistic behaviour perspective, to be applied in this thesis. As noted
in that chapter, most of the prior studies analysing asset write-offs and
goodwill impairment have focused on listed companies in developed
economies, namely, the US, Canada, and UK. As this thesis is concerned with
accounting choices related to goodwill impairment exercised by Malaysian
listed companies, the present chapter serves as an introduction to the
financial reporting environment in Malaysia, both before and after the
implementation of the FRS 3 Business Combinations.
The purpose of this chapter is threefold. Firstly, it reviews the history of the
development of an accounting standard on goodwill in Malaysia, prior to the
implementation of FRS 3 Business Combinations. The review provides an
insight into the issue of accounting for goodwill surrounding the Malaysian
standard setters since the 1970s, and assists the researcher in forming an
expectation regarding the possibility of accounting choices exercised by listed
companies in Malaysia.
Secondly, it discusses the regulatory bodies overseeing Malaysian listed
companies‘ compliance with accounting standards. This review helps in the
formulation of the hypotheses in Chapter 5 and the interpretation of the
findings in Chapters 8 and 9.
Thirdly, it discusses the ownership structures of Malaysian listed companies.
This discussion provides insight into the applicability of the contracting
perspective and the opportunistic behaviour perspective (reviewed in Chapter
2) in explaining the accounting choices related to goodwill impairment
exercised by Malaysian listed companies. It also leads to the formulation of

44
additional hypotheses related to the ownership structures variables in Chapter
5.
This chapter is structured into five main sections including the introduction.
Section 3.2 presents the history of the development of an accounting standard
on goodwill in Malaysia, prior to the implementation of FRS 3. Section 3.3
highlights the regulatory bodies overseeing companies‘ compliance with
financial reporting standards, especially during the implementation of FRS 3.
Section 3.4 discusses the distinctive ownership structures of Malaysian listed
companies. Section 3.5 provides a summary and conclusions.
3.2 History of the development of an accounting standard on goodwill in Malaysia
This section aims to review the history of the development of an accounting
standard on goodwill in Malaysia. It begins with the efforts of the standard-
setters in developing an accounting standard on goodwill (see Section 3.2.1),
before continuing with objections to Malaysian Accounting Standard (MAS) 6
Accounting for Goodwill (see Section 3.2.2), and ending with the setting up of
the Financial Reporting Act 1997 (see Section 3.2.3). Understanding the
history, assists the researcher in forming an expectation concerning the
possibility for accounting choices related to goodwill impairment being
exercised by Malaysian listed companies.
3.2.1 Efforts of the standard setters in developing an accounting standard on goodwill
In Malaysia, the development and issuance of financial reporting standards is
the responsibility of an independent body known as the Malaysian Accounting
Standards Board (MASB), which was established in 1997 by the enactment of
the Financial Reporting Act 1997 (MASB, Undated10). Prior to 1997, the
issuance of accounting standards was the responsibility of a professional
accounting body, the Malaysian Association of Certified Public Accountants
(MACPA) (Susela, 1999). Specifically, during the period 1958-1967, there was
10 MASB (Undated). MASB profile. Retrieved on April 15, 2011 from
http://www.masb.org.my/index.php?option=com_content&view=article&id=3&Itemid=7

45
no legislation to regulate the accountancy profession (Ibid, p. 361). Only in
1967, the Accountancy Act 1967 came into force, and the Malaysian Institute
of Accountants (MIA) was established as a statutory body for the regulation of
the accountancy profession (Ibid, p. 362).
The discussion of accounting for goodwill in Malaysia emerged as early as
1971, when the Central Bank of Malaysia requested that MACPA should look
into companies‘ practices of accounting for goodwill (Susela, 1996). As noted
in a letter dated September 10, 1971 sent by the Governor of the Central
Bank to the President of MACPA:
‗Generally, our Committee tends to view ―goodwill‖ with scepticism
and I would like to have the assurance that the auditing profession
would not support the valuation placed on goodwill without full
confidence that it is fairly stated.‘
(Susela, 1996: 332)
From 1971 onwards, a number of initiatives were put in place to probe the
issue of accounting for goodwill. Figure 3.1 shows the chronology of these
initiatives. In 1971, a Technical Committee was set up by MACPA to address
the various issues raised by the Central Bank, among which was the question
of accounting for goodwill (Susela, 1996: 332). However, the issue related to
goodwill was not addressed explicitly until 1987, when the two accounting
professions - MACPA and MIA, initiated a joint effort on the subject (Ibid, p.
335) (see Figure 3.1). The joint effort resulted in a discussion paper on
accounting for goodwill, which was circulated to members of these two
professional bodies (Ibid, p. 335). However, the feedback received from their
members was so diverse that they decided to defer issuing an accounting
standard on goodwill (Ibid, p. 335).
In 1991, in the absence of an accounting standard on goodwill, the Capital
Issue Committee (part of the Ministry of Finance11), decided to tackle the
11 Capital Issue Committee is a regulatory body under the Ministry of Finance, which oversee the capital market in Malaysia prior to the establishment of the Securities Commission (Securities Commission, Undated). Frequently-Asked Questions. General information on the SC. Retrieved on April 9, 2011 from http://www.sc.com.my/eng/html/resources/faq/faqgeneral.html

46
issue of accounting for goodwill on its own initiatives by issuing guidelines on
accounting for goodwill for Malaysian listed companies (Susela, 1996: 335).
This action, plus the significant increase in the numbers of business
acquisitions, pressured the two accounting bodies to reconsider the issue of
an accounting standard on goodwill (Ibid, p. 335).
Figure 3.1: Chronology of initiatives carried out by the Malaysian standard setter in issuing an accounting standard on goodwill
Year Agenda
1971 Technical Committee of MACPA - Goodwill standard was on the agenda of the committee.
1987 Discussion paper on accounting for goodwill - A joint effort initiated by MACPA and MIA.
1991 Capital Issue Committee (part of the Ministry of Finance) - Issued guidelines on accounting for goodwill.
1992 Exposure draft - Malaysian Accounting Standard 6 (MAS 6) Accounting for Goodwill
1993 Issued MAS 6 Accounting for Goodwill as a result of a joint effort of
MIA and MACPA - The effective date of MAS 6 is for periods commencing on or after January 1, 1995.
1994 MIA defers the implementation of MAS 6 to January 1, 1997
1997 The enactment of the Financial Reporting Act (1997) and the establishment of the MASB
1998 MAS 6 was not adopted by MASB as an approved accounting standards
2000 MASB Exposure Draft 28 (MASB ED 28) issued for comments by February 2001
2006 FRS 3 Business Combinations
Sources: Susela (1996); Tan (2000); MASB (2000, 2001, 2005, 2006a)
Accordingly, the two accounting bodies assigned an academic (i.e. Tan, 1990)
to study the accounting treatment of goodwill practised by companies listed
on the main board of the Kuala Lumpur Stock Exchange for the reporting year
ended 1990 (Susela, 1999: 336). Using annual reports published in 1990 and
focusing on companies listed on the main board, the study, by Tan (1990),
revealed that of the 276 companies examined, 155 had a goodwill accounting
policy with three distinct accounting treatments (Susela, 1999: 365). 35% of
the companies capitalised and amortised the goodwill, 34% treated it as a
permanent item, and 27% used immediate write-off to reserves, with the
remaining 4% employing other methods (Susela, 1999: 365).

47
In 1992, MIA and MACPA jointly published an exposure draft of accounting for
goodwill - Malaysian Accounting Standard 6 (MAS 6) (Susela, 1996: 338). In
April 1993, MAS 6 Accounting for Goodwill was issued as an accounting
standard for goodwill with an effective date for periods commencing on or
after January 1, 1995 (Ibid, p. 338). Among the key requirements of MAS 6
were that purchased goodwill should be recognised as a fixed asset, and the
amount should be amortised systematically through the Profit and Loss
account (Susela, 1999: 359; Tan, 2000: 293). Further, the standard stipulated
the amortisation period not to exceed 25 years, and that amortisation charges
were to be treated as a normal expense (above the line of the operating
income) (Tan, 2000: 293).
3.2.2 Objections to Malaysian Accounting Standard (MAS) 6 Accounting for Goodwill
Prior to its effective date, MAS 6 encountered objections from large Malaysian
corporations and big-6 audit firms (Susela, 1999: 366 and 383). The main
objections centred on the concerns for the socio-economic consequences of
the accounting standard on Malaysian listed companies, consideration for the
specific nature of the economy in Malaysia, and acceptance of the standard
by the business community (Susela, 1999). Figure 3.2 depicts the detailed
objections to MAS 6 documented by Susela (1999).
Figure 3.2: Detailed objections to MAS 6 Accounting for Goodwill
1. Socio-economic consequences of the standard
i. ‗we [Malaysian companies] are in the stage of experiencing growth and therefore, it might be too early to adopt the goodwill standard [MAS 6] as it might have a severe impact upon the profit of listed companies‘ cited in Susela (1999: 375).
ii. ‗goodwill amortisation would, in the absence of associated tax relief, hamper development of capital markets through its impact on reported earnings‘ cited in Susela (1999: 375).
iii. ‗Malaysian companies would be placed at a competitive disadvantage by the standard [MAS 6]‘ cited in Susela (1999: 375).
2. Specific nature of the Malaysian economy
i. ‗it was the peculiar12 regulated environment in Malaysia that created huge goodwill accounting numbers, some portion of which
12
The peculiar regulated environment in Malaysia argued by the opponents of MAS 6 referred
to licences such as stock-broking and broadcasting which were controlled and regulated by
48
might be represented by identifiable intangibles. MAS 6‘s amortisation requirements were problematic because they did not acknowledge that Malaysia was different‘ cited in Susela (1999: 375-376).
3. Acceptance by the business community
i. ‗Accounting standards should not be adopted that are not accepted by commerce and industry‘ cited in Susela (1999: 379).
Source: Based on Susela (1999)
The objections raised by the large corporations induced MACPA to defer the
approval of MAS 6. MIA, on the other hand, stood by its decision and
implemented the standard in 1993 (Susela, 1996: 338; Susela, 1999: 359).
Failing to persuade MIA to defer MAS 6, the large corporations pursued the
issue with the Federation of Public Listed Companies (FPLC13), who then
appealed the matter to the Ministry of Finance (Susela, 1996: 338). Susela
(1996) noted that on page eight of the FPLC memorandum sent to MIA, the
FPLC argues that:
‗[T]he approach taken ignores business and economic realities - the
amortised goodwill reduces the post-acquisition earnings, and is a
disincentive to businessmen and entrepreneurs who assume significant
risks in their investments, and discourages the growth of companies
through mergers and acquisitions.‘
(Susela, 1996: 349)
At the end of 1994, increased pressure from the state compelled MIA to defer
the implementation of MAS 6, initially until January 1, 1997 (Susela, 1996:
338; Susela, 1999: 366), and then indefinitely (Tan, 2000: 307). To Susela
(1996), the obstacles faced by the standard setter in issuing an accounting
standard on goodwill showed that:
the Malaysian government (Susela, 1995: 352). Because in certain areas, no more licences would be granted by the government, these licences became very valuable, which lead to a high value of goodwill where companies had acquired the licences. Thus, the opponents argued that the standard setter should consider the accounting standard on intangibles before implementing an accounting standard for goodwill (Susela, 1996: 352).
13 The Federation of Public Listed Companies (FPLC) is a non-profit organisation, whose members comprise companies listed on the Stock Exchange, as defined under the Securities Industry Act 1983 (FPLC, Undated). Retrieved on April 9, 2011 from http://www.fplc.com.my/FPLCv02/index.html

49
‗The case of the Goodwill Standard illustrates the attempts by the
internal forces, the major corporations, to resist the urge to follow
International Accounting Standards (which hitherto had been a major
influence on the standard setting process) and instead defer the
standard in consideration of the environmental issues raised.‘
Susela (1996: 148)
3.2.3 Establishment of the Financial Reporting Act 1997
In 1997, the Financial Reporting Act 1997 was established together with the
setting up of the Malaysian Accounting Standards Board (MASB) (MASB,
Undated14). As a result, the Companies Act 1965 was amended to require
compliance with the MASB-approved accounting standards (Susela, 1999: 366).
In issuing the accounting standards, MASB has a convergence policy towards
the International Accounting Standards (IASs) issued by the IASB (MASB, 2004).
This means that the MASB approved accounting standards are based on those
set by the IASB (formerly the International Accounting Standards Committee -
IASC) with the wording in the IASB standards strictly maintained (MASB, 2004).
Alterations to the IASB standards would only be made if there existed specific
local issues which were not covered by the IASB, when there was a need to
ensure compliance with Malaysian laws and regulations, or as an illustration to
better understand the standards (MASB, 2004). In 1998, MASB adopted 24
accounting standards issued by the former standard setters (i.e. MACPA and
MIA) (Tan, 2000: 13). MAS 6 was not adopted (Tan, 2000: 13).
A study undertaken by Abdullah et al. (2004), which investigated the
accounting treatment of goodwill by Malaysian listed companies between 1996
and 2000, documented that the three diverse accounting treatments for
goodwill, as reported by Tan (1990) and discussed earlier in this section had
reduced. Between 1996 and 2000, the majority of listed companies now
capitalised and amortised goodwill. For example, in 1996, 64.8% of the
companies (or 93 companies) amortised the goodwill. In 2000, the percentage
14 MASB (Undated). MASB profile. Retrieved on April 15, 2011 from
http://www.masb.org.my/index.php?option=com_content&view=article&id=3&Itemid=7

50
of companies that capitalised and amortised goodwill increased to 68.8% (or
106 companies). The remaining companies either capitalised and carried out
an impairment review of the goodwill, or treated goodwill as a permanent
item.
In December 2000, MASB adopted IAS 22 Business Combinations and renamed
it as MASB 21 Business Combinations (MASB, 2006: MASB 21). In paragraph six
of MASB 21, it was stated that the standard on business combinations does not
deal with accounting for goodwill or negative goodwill (MASB, 2006: MASB 21).
The paragraph stipulated that the treatment for goodwill would be dealt with
in a separate standard (MASB, 2006: MASB 21). The board explicitly stated in
Appendix 1 of MASB 21 that compliance with the standard ensured conformity,
in all material respects, with IAS 22 (revised) except for goodwill, reverse
acquisition, and measurement of minority interest (MASB, 2006b: MASB 21).
In 2001, MASB issued MASB ED 28 (MASB, 2001). This MASB exposure draft on
goodwill was issued for comment by February 2001 (MASB, 2000). Among the
key requirements of the Exposure Draft were: the treatment of purchased
goodwill as an asset (paragraph 9); the treatment of goodwill subsequent to
the initial recognition (paragraphs 32-47); and the disclosure requirements
related to goodwill (paragraphs 55-58) (MASB 2001: MASB ED 28). In the case
of the treatment of goodwill subsequent to initial recognition, the Exposure
Draft proposed that goodwill should be carried at cost, less any accumulated
amortisation and any accumulated impairment losses (paragraph 32) (MASB
2001: MASB ED 28). As for the amortisation of goodwill, the Exposure Draft
proposed goodwill to be amortised using a straight-line method with a
rebuttable presumption that the useful life shall not exceed 20 years from the
initial recognition (paragraph 33) (MASB 2001: MASB ED 28). If the estimated
useful life of goodwill exceeds 20 years from its initial recognition, the
Exposure Draft proposed an annual impairment test of the goodwill (paragraph
47) (MASB 2001: MASB ED 28). Both the amortisation and impairment loss of
goodwill would be recognised as expenses (paragraph 35) (MASB 2001: MASB
ED 28).
According to the then Chairman of MASB, the Exposure Draft aimed to solve
the ‗contentious issue of accounting for goodwill‘ (MASB, 2000). The Exposure
51
Draft was released to professional accountancy bodies, regulators, users,
preparers, and other interested users and organisations for comment by
February 20, 2001 (MASB 2001: MASB ED 28). However, the comment letters
submitted to MASB cannot be analysed by the researcher. This is because,
according to the Technical Director of MASB, the comment letters were not
made publicly available due to the respondents‘ requests for confidentiality.
MASB ED 28, which was intended to be issued on 1 July 2001, was withdrawn
by the MASB (Abdullah et al., 2004). The standard setter reasoned that the
Board wanted to adopt an approach which was similar to that of the IASB,
that is, to combine goodwill into the Business Combinations standard.
In January 2006, MASB approved 21 financial reporting standards issued by the
IASB (MASB, 2005). Of these, 1815 were finalised and became effective for
listed companies with annual period beginning on or after January 1, 2006
(MASB, 2005). IFRS 3 Business Combinations which specifies the accounting
treatment for goodwill was one of the 18 financial reporting standards
adopted by MASB (MASB, 2005). IFRS 3 is a result of a joint effort between the
IASB and the US FASB (see Section 4.2 for detail). In Malaysia, it was renamed
as FRS 3, and, together with its two consequential standards (i.e. FRS 136
Impairment of Assets and FRS 138 Intangible Assets), was made effective for
business combinations on or after January 1, 2006 (MASB, 2005). The
implementation of FRS 3 in 2006 provided listed companies in Malaysia with a
specific accounting standard on goodwill, previously unavailable prior to 2006
(Pillai, 2006).
3.2.4 Implication of reviewing the history of the development of an accounting standard on goodwill in Malaysia
The review of the history of the development of an accounting standard on
goodwill in Malaysia (discussed in Sections 3.2.1 to 3.2.3 above) has two
implications for this thesis.
15 The three financial reporting standards which were deferred included FRS 117 Leases, FRS
124 Related Party Disclosures, and FRS 139 Financial Instruments: Recognition and Measurement (MASB, 2005).

52
Firstly, the review demonstrates that in Malaysia, accounting for goodwill has
been an issue since the 1970s (see Section 3.2.1). The issue arose as large
corporations objected to the publication of an accounting standard on
goodwill and their objections reached the point of them lobbying the Ministry
of Finance to defer the standard (see Section 3.2.2). As pointed out by Susela
(1999: 379), the objections raised by these large corporations indicate that
the acceptance of an accounting standard by the corporations was based on
the suitability of the accounting method to the environment in which the
organisations operated.
Secondly, the review highlights that although there were numerous efforts put
in place by standard setters in order to resolve the issue of accounting for
goodwill, none has succeeded (see Section 3.2.1). The implementation of FRS
3 in 2006 appears to have silenced the debate as companies are now required
to comply with the FRSs (see Section 3.2.3). Nonetheless, given the history of
companies resisting an accounting standard based on its suitability, it raises
the question of whether companies are following the standard in good faith or
whether they are taking advantage of the covert options available to
managers during an impairment test of goodwill in order to get the desired
result (see detailed discussion in Sections 4.4 and 4.4.2).
A point of note is that although a review of the history is important for
background information for this thesis, the findings, in particular the works of
Susela (1999) and Abdullah et al. (2004) could not provide information
concerning the reactions of the Malaysian listed companies toward the
implementation of FRS 3 and FRS 136. Moreover, since the comment letters on
MASB ED 28 (an exposure draft on accounting for goodwill) are not available
for public viewing, there remains a gap in knowing the degree of acceptance
of the Malaysian listed companies toward the implementation of FRS 3 and
FRS 136. To address this gap, semi-structured interviews were carried out
between June and July 2009, and these are discussed in the next section.

53
3.2.5 Background information obtained from semi-structured Interviews
The semi-structured interviews were designed to obtain the respondents‘
perspectives on the implementation of FRS 3 and FRS 136, focusing on an
impairment test of goodwill. Four groups of respondents were targeted:
finance managers, auditors, analysts, and standard setters. A list of open
ended interview questions was designed and ethical approval to conduct the
interviews was obtained from the Ethics Committee of the Accounting and
Finance Department, University of Glasgow on March 17, 2009. Following this
approval, 30 potential interviewees were contacted through formal
gatekeepers and personal acquaintances. These potential interviewees were
selected based on the existence of goodwill in the company and their
expertise in the area. Of the 30 potential interviewees contacted, seven
initially agreed to participate. However, one day prior to the interviews,
three personnel cancelled their appointments. Thus, only four semi-structured
interviews were carried out independently. These were interviews with a
finance manager, a senior auditor, an analyst, and a former standard setter
from the MASB. The interviews were tape-recorded, transcribed, and
analysed.
Due to the very low number of respondents, it was impossible to gain broad
understanding of the implementation of accounting standards on goodwill (i.e.
FRS 3 and FRS 136) via the findings generated from the semi-structured
interviews. Consequently, the findings of the semi-structured interviews serve
as background information, rather than forming the key results for this thesis.
The findings have assisted the researcher in the following two ways.
Firstly, the information gathered from the senior manager of a big-4 audit
firm, the financial analyst, and the finance manager of Malaysian listed
companies, suggests that when companies‘ market values are lower than the
book values of their net assets within a year (i.e. there is a market
capitalisation indication), that situation requires careful consideration. This
is because companies might consider the market capitalisation indication
which occurs within a single year as a temporary phenomenon. This
information has led the researcher to design a research setting which aims to

54
provide a much stronger market capitalisation indication that goodwill may be
impaired. This is accomplished by selecting companies which have their
market values lower than the book values of their net assets for three
consecutive years instead of within a year (see Section 9.2.1). This research
setting will be explored in the recognition study (see Chapter 9).
Secondly, the semi-structured interviews provided insight into how a company
identifies its cash-generating-units (CGUs) and the rationale for such
identification. This information helped the researcher to better understand
companies‘ disclosure of CGUs, i.e., in terms of identifying the number of
CGUs disclosed by companies in their annual reports. Hence, the information
assisted the researchers in the collection of data, in order to test the
hypotheses related to the CGUs (see Section 5.8.1).
3.3 Regulatory bodies overseeing the compliance with accounting standards of companies in Malaysia
This section reviews the financial reporting environment surrounding
Malaysian listed companies in order to assist in the interpretation of findings
for the empirical chapters of this thesis (see Chapters 8 and 9). Ball et al.
(2003: 236) argue that political forces such as the extent of involvement of
regulatory bodies in enforcing accounting standards may affect the incentives
of managers when producing companies‘ financial reports.
In Malaysia, the regulatory bodies responsible for enforcing compliance with
the approved accounting standards include the Registrar of Companies (under
the Companies Act 1965), the Central Bank (under the Banking and Financial
Institutions Act 1989), and the Securities Commission (under the Securities
Commission Act 1993) (MASB, Undated16). In the 1990s, Malaysia experienced
a significant transformation in its financial reporting framework, with the
government announcing its plan to establish a new financial accounting and
reporting regime (Tan, 2000: 2-3). Consequently, on March 6, 1997, the
Financial Reporting Act 1997 was passed together with the setting up of the
16 MASB (Undated). Foreword to Financial Reporting Standards. Retrieved on April 17, 2011 from http://www.masb.org.my/index.php?option=com_content&view=article&id=146%3Aforeword-full-pg2&catid=9%3Aforeword&Itemid=23

55
Financial Reporting Foundation17 and MASB (MASB, Undated18; Tan, 2000).
Thus, from 1997 onwards, the accounting standards issued by MASB became
legal requirements (Susela, 1999: 366; Tan, 2000: 4). The enactment of the
Financial Reporting Act 1997 also made it a statutory duty of companies‘
directors and managers to ensure that their financial statements complied
with the MASB approved accounting standards (Tan, 2000: 4).
With regards to companies listed on the Malaysian stock exchange (i.e. Bursa
Malaysia), which is the focus of this thesis, the Securities Commission and the
Bursa Malaysia each play a role in monitoring, and supervising companies‘
compliance with MASB approved accounting standards (Tan, 2000: 7 and 9).
The Securities Commission, demonstrating its commitment to enforcement,
revealed on its website, a list of court cases in which it had prosecuted
directors of listed companies for the criminal offences related to furnishing
misleading statements to the Securities Commission and to the Bursa Malaysia
(Securities Commission, Undated19).
Unlike the Securities Commission, which has the legal power to enforce
compliance with MASB approved accounting standards, Bursa Malaysia is a
private sector body incorporated to regulate companies listed on its exchange
(Tan, 2000: 9). It has no legal authority to enforce compliance (Tan, 2000: 9).
Nonetheless, the Bursa Malaysia Listing Requirements and Bursa Malaysia
Rules empower the stock exchange to take enforcement actions for breaches
of the requirements (Bursa Malaysia, Undated20). One of the Listing
Requirements of the Bursa Malaysia is for companies to submit annual audited
17 Among the primary roles of the Financial Reporting Foundation are to oversee the performance, financials and funding arrangements for the MASB (MASB, Undated). Retrieved on May 6, 2011 from http://www.masb.org.my/index.php?option=com_content&view=article&id=1&Itemid=5
18 MASB (Undated). Foreword to Financial Reporting Standards. Retrieved on April 17, 2011 from http://www.masb.org.my/index.php?option=com_content&view=article&id=146%3Aforeword-full-pg2&catid=9%3Aforeword&Itemid=23
19 Securities Commission (Undated). Enforcement actions. Criminal prosecution initiated. Retrieved on April 5, 2011 from http://www.sc.com.my/main.asp?pageid=729&menuid=394&newsid=&linkid=2496&type=
20 Bursa Malaysia (Undated). Enforcement overview. Retrieved on April 17, 2011 from http://www.bursamalaysia.com/website/bm/regulation/enforcement/overview.html

56
accounts, prepared in accordance with the MASB approved accounting
standards (Tan, 2000: 9).
The various regulatory bodies which exist in Malaysia, plus active monitoring
by the Securities Commission and the Bursa Malaysia, suggest that strong
regulatory enforcement is in place in Malaysia. In the context of companies
implementing FRS 3, and focusing on goodwill impairment, such strong
regulatory enforcement implies that listed companies in Malaysia have no
choice but to comply with FRS 3.
3.4 Ownership structures of listed companies in Malaysia
Section 2.3.3 discusses briefly the applicability of the agency theory model of
Jensen and Meckling (1976) to Malaysian listed companies. This section
continues the discussion by identifying two features of the ownership
structure of Malaysian listed companies which distinguish the Malaysian
context.
Firstly, Malaysian listed companies are documented by prior studies (e.g. La
Porta et al., 1998: 1147; Leuz et al., 2003: 516; Haniffa and Hudaib, 2006:
1035) to have concentrated ownership. For example, Leuz et al. (2003: 516)
reported that during their period of study (1990 to 1999), the median
shareholding of the largest three shareholders of listed companies in Malaysia
was 52% while for the UK and US it was 15% and 12% respectively. Likewise,
Mohd Ghazali‘s (2004) analysis of 87 Malaysian listed companies in 2001
reported the median shareholding of the top 10 largest shareholders to be
67.2%.
Secondly, Malaysian listed companies are reported by prior studies (Claessens
et al., 2000: 103; Mohd Ghazali and Weetman, 2006: 231) to be managed by
their owners. As an illustration, Claessens et al. (2000: 103) observed that at
the 20% cut-off levels, 67.2% of listed companies in Malaysia were in family
hands, and 85% had the owner as the manager.

57
The two features of the ownership structure discussed above suggest that the
ownership structures of Malaysian listed companies are not widely dispersed.
Given the different features of the ownership structures which exists in the
Malaysian listed companies compared to listed companies in developed
countries, such as the US and UK, ownership structures will be examined in
this thesis. Ownership concentration and managerial ownership will be further
explored in developing the hypotheses (see Sections 5.7 to 5.7.2).
3.5 Summary and conclusions
This chapter has reviewed the history of the development of an accounting
standard on goodwill in Malaysia, prior to the implementation of FRS 3 (in
Section 3.2), and highlighted the regulatory bodies overseeing Malaysian listed
companies‘ compliance with accounting standards (in Section 3.3). It has also
discussed how the ownership structures of listed companies in Malaysia differ
from listed companies in developed economies, such as the US and UK (in
Section 3.4). The main conclusions of the chapter are as follows:
Firstly, reviewing the history of the development of an accounting standard on
goodwill in Malaysia (in Section 3.2) demonstrated that Malaysia has a specific
history of accounting for goodwill. The specific history, that is, the objections
to an accounting standard on goodwill prior to the implementation of FRS 3
raised by large corporations, which lead to deferment of the standard
indefinitely, indicates that the acceptance of an accounting standard by these
large corporations was based on questions about the suitability of the
accounting method to the environment in which the organisations operated.
The review of the history (in Section 3.2.1) has also shown that prior to FRS 3,
though numerous efforts were put in place by standard setters to resolve the
issue of accounting for goodwill, none succeeded. The implementation of FRS
3 in 2006 appears to have dismissed the issue as companies are now required
to comply with the financial reporting standard. Nonetheless, given the
history of companies resisting an accounting standard based on its suitability,
it raises the question of whether companies are following the standard in good
faith or whether they are taking advantage of the covert options available to

58
managers during an impairment test of goodwill for their reporting incentives.
This question leads to a discussion of the covert options available to managers
in the next chapter (see Section 4.4.2).
Secondly, the review of the regulatory bodies overseeing compliance with
accounting standards in Malaysia (in Section 3.3) suggests that strong
regulatory enforcement is in place in Malaysia. This implies that compliance
with FRS 3 is not a choice. This information facilitates the formulation of
hypotheses in Chapter 5 and the interpretation of the findings in Chapters 8
and 9.
Finally, the different ownership structures which exists between Malaysian
listed companies and those listed companies in developed economies, such as
the US or UK suggests a potentially different form of agency conflict might
have occurred (in Section 3.4). By incorporating ownership structure
variables, it is hoped that a more complete model of accounting choices
related to goodwill impairment will be developed. This is particularly crucial
when prior studies (e.g. La Porta et al., 1998; Claessens et al., 2000) argue
that the work of Jensen and Meckling (1976) is based on the assumptions of
companies with disperse ownership. Listed companies in Malaysia are found to
have concentrated ownership. Thus, the investigation of Malaysian listed
companies is expected to provide insight into the applicability of the agency
theory, the contracting perspective, and the opportunistic behaviour
perspective in explaining the accounting choices related to goodwill
impairment in a country with concentrated ownership.

59
Chapter 4: Discretion Available in IFRS 3 while Performing an Impairment Test of Goodwill
4.1 Introduction
Chapter 3 has reviewed the financial reporting environment in Malaysia both
before and after the implementation of FRS 3 Business Combinations. The
present chapter continues by reviewing the requirements of IFRS 321, focusing
on an impairment test of goodwill. The purposes of the present chapter are
twofold. Firstly, it describes the development of the IFRS 3 and FRS 3 in order
to specify the phase of the FRS 3 which will be examined in this thesis.
Secondly, it discusses three issues - the indications that an asset (goodwill)
may be impaired, the judgements and estimates applied by managers in
performing an impairment test of goodwill, and the weakness of the
impairment test raised by few of the IASB board members, in order to
describe the accounting choices related to goodwill impairment, which will be
examined in this thesis.
The chapter is structured into seven sections including the introduction.
Section 4.2 describes the development phases of the IFRS 3 and FRS 3. Section
4.3 proceeds with indications that an asset (goodwill) may be impaired.
Section 4.4 discusses the judgements and estimates involve in measuring the
recoverable amount of the cash-generating-units (CGUs) containing goodwill.
Section 4.5 continues with a discussion of the critiques of the impairment test
of goodwill highlighted by few of the board members of the IASB through their
dissenting opinions. Section 4.6 discusses the accounting choices related to
goodwill impairment which will be examined in this thesis. Section 4.7 ends
the chapter with a summary and conclusions.
21 FRS 3 Business Combinations refers to Malaysian Financial Reporting Standard 3 Business Combinations while IFRS 3 refers to the International Financial Reporting Standard 3 Business Combinations, issued by the IASB (see Figure 4.1). When a discussion revolves around the exact requirement of the standard, especially when the issues are stated in the Basis for Conclusion (not available in FRS 3), IFRS 3 is applied; when a discussion involves Malaysian environment, FRS 3 is applied.

60
4.2 Phases of the development of IFRS 3 and FRS 3 Business Combinations
The purpose of this section is to review the phases of the development of FRS
3 in order to specify the phase of the FRS 3 and FRS 136 Impairment of Assets,
examined in this thesis.
IFRS 3 Business Combinations is the result of a joint effort between the IASB
and the US FASB to improve financial reporting and promote an international
convergence of accounting standards (IASB, 2010a: IFRS 3, IN1, A97). The joint
effort was conducted in two phases, the first phase of the project resulted in
the issuance of IFRS 3 by the IASB with an effective date of April 1, 2004; the
second phase of the project led to a revised version of IFRS 3 by the IASB with
an effective date of July 1, 2009 (IASB, 2010a: IFRS3, IN1, A97; IASB,
Undated22). The issuance of IFRS 3 also led to a revision of its consequential
standard, IAS 36 Impairment of Assets (IASB 2010b: IAS 36, IN2, A758). Figure
4.1 shows the phases of the development, and revision of the IFRS 3 (FRS 3 in
Malaysia) and the IAS 36 (FRS 136 in Malaysia) and their effective dates for
both the IASB and the MASB. As of July 1, 2010, IFRS 3 has been revised twice
and IAS 36 has been revised three times by the IASB (IASB, Undated).
Although MASB has a convergence policy23 towards the IASs, the
implementation dates of the MASB approved accounting standards differ from
those of the IASB. As shown in Figure 4.1, in Malaysia, the effective dates for
FRS 3 and FRS 136 were January 1, 2006 (MASB, Undated24). The first revision
of FRS 3 (phase II) and the second revision of FRS 136 (phase II) became
effective on July 1, 2010 (MASB, Undated). For this reason, the investigation
of accounting choices related to goodwill impairment which will be examined
22 IASB (Undated). Summaries of International Financial Reporting Standards. Retrieved on April 18, 2011 from http://www.iasplus.com/standard/ifrs03.htm
23 Convergence policy with IFRS means full compliance with IFRS as a basis for the financial reporting system in Malaysia. However, the term convergence is applied instead of adopt as the MASB follows a Malaysian due process and need to comply with the local legislation on financial reporting (MASB, Undated). Retrieved on August 16, 2012 from http://www.masb.org.my/index.php?option=com_content&view=article&id=1685&Itemid=57 24 MASB (Undated). Financial reporting Standards. Retrieved on April 19, 2011 from http://www.masb.org.my/index.php?option=com_content&view=article&id=1476

61
in this thesis focuses on Malaysian listed companies implementing FRS 3 and
FRS 136, from January 1, 2006 (i.e. phase I of the development as shown in
Figure 4.1). The period of investigation is in the first three years of the
implementation of FRS 3 (i.e. from 2006/7 to 2008/8 - see Figure 6.1 for
detail).
Figure 4.1: Phases of the IFRS 3 (FRS 3 in Malaysia) Business Combinations and IAS 36 (FRS 136 in Malaysia) Impairment of Assets
IASB MASB
Business Combinations IFRS 3 FRS 3
Phase I:
IFRS 3 Business Combinations and related amended versions of IAS 36 and IAS 38 - IFRS 3 supersedes IAS 22
31 March 2004
Effective date of IFRS 3 1 April 2004 1 January 2006
Phase II:
Exposure Draft of Proposed Amendments to IFRS 3 - Addressed the guideline for applying the acquisition method.
25 June 2005
Revised IFRS 3 (2008) issued
10 January 2008
Effective date of IFRS 3 (2008) (Revised 1) 1 July 2009 1 July 2010
Annual improvements:
IFRS 3 amended for Annual Improvements to IFRSs 2010 - Focus on the measurement of non-controlling interests
6 May 2010
Effective date of May 2010 to IFRS 3 (Revised 2)
1 July 2010 1 July 2010
Impairment of Assets
IAS 36 FRS 136
Exposure Draft E55 Impairment of Assets
May 1997
IAS 36 Impairment of Assets
June 1998
Effective date of IAS 36 (1998)
1 July 1999
Phase I:
IAS 36 Revised
31 March 2004
Effective date of March 2004 revisions to IAS 36 (Revised 1)
1 April 2004
1 January 2006
Phase II: IAS 36 amended for Annual Improvements to IFRSs 2007 about disclosure of estimates used to determine a recoverable amount, which is based on fair values less costs to sell
22 May 2008
Effective date of the May 2008 revisions to 1 January 2009 1 January 2010

62
IAS 36 (Revised 2)
Annual improvements:
IAS 36 amended for Annual Improvements to IFRSs 2009 about units of accounting for goodwill impairment testing using segments under IFRS 8 before aggregation
16 April 2009
Effective date of the April 2009 revisions to IAS 36 (Revised 3)
1 January 2010 Has not been implemented at the date
of writing (August 16, 2012)
4.3 Indications that an asset (goodwill) may be impaired
This section aims to review indications that an asset25 (goodwill) may be
impaired. The indications are outlined in IAS 36 Impairment of Assets in its
paragraph 12. The review assists in identifying appropriate indicators of
goodwill impairment to be examined in this thesis.
IFRS 3 prohibits an amortisation of goodwill, and it requires companies to
perform an impairment review annually, or more frequently if events or
changes in circumstances indicate that the goodwill might be impaired, in
accordance with IAS 36 (IASB, 2006c: IFRS 3, paragraph 55)26. The purpose of
an impairment test of assets (inclusive of goodwill) is to ensure that the
carrying amount of the assets reported on the balance sheet do not exceed
25 According to IAS 36 Impairment of Assets, the term asset applies equally to an individual
asset or a cash-generating unit containing goodwill (IASB 2006: IAS 36, paragraph 7). In addition, in IFRS 3, when the standard discusses the issue of whether or not to permit choice in the accounting treatment for goodwill, the term asset is replaced with goodwill as follow ‗entities should not be allowed a choice between approaches (a) [straight-line amortisation but with an impairment test whenever there is an indication that the goodwill might be impaired – in BC137] and (b) [non-amortisation but with an impairment test annually or more frequently – in BC137]. Permitting such choices impairs the usefulness of the information provided to users of financial statements because both comparability and reliability are diminished‘ (IASB, 2006c: IFRS 3, Basis for Conclusions, BC138). Therefore, in this thesis, when the discussion involves the requirement of the standard, similar to IAS 36 (paragraph 7), the following wording is applied - indications that an asset (goodwill) may be impaired. When the discussion deals specifically with research questions formulated in this thesis and the findings, the following wording is applied - indications that goodwill may be impaired.
26 FRS 136 (paragraph 11) (similar to IAS 36, paragraph 11) prohibits an impairment loss
recognised for goodwill in a previous period to be reversed [MASB, 2006(c)]. This means that goodwill once impaired cannot be reinstated.
Source: IASB (Undated) and MASB (Undated)

63
their recoverable amount27 (IASB, 2006b: IAS 36, paragraph 1; Ernst and
Young, 2008: 1034). The IASC (the predecessor of the IASB) in its Basis for
Conclusions acknowledges that a company ‗would use judgement in
determining whether an impairment loss needed to be recognised‘ (IASB,
2006c: IFRS 3, BCZ24). To limit the risk of an over-optimistic or over-
pessimistic estimation of the recoverable amount, IAS 36 provides safeguards
in the form of a list of indicators that an asset (goodwill) may be impaired
(IASB, 2006c: IFRS 3, BCZ24), though the standard emphasises that the list is
not exhaustive (IASB, 2006b: IAS 36, paragraph 13).
The list of indicators, stated in paragraph 12 of the IAS 36 (equivalent to FRS
136), are grouped into external and internal sources of information (see
Figure 4.2).
Figure 4.2: Indications that an asset (goodwill) may be impaired as outlined in FRS 136 (2006: paragraph 12)
External sources of information
1. Market value of the asset declined significantly
- ‗During the period, an asset‘s market value has declined significantly more than would be expected as a result of the passage of time or normal use.‘
(MASB, 2006c: FRS 136, paragraph 12a)
2. Significant changes with an adverse effect on the entity [Economic condition indication]
- ‗Significant changes with an adverse effect on the entity have taken place during the period, or will take place in the near future, in the technological, market, economic or legal environment in which the entity operates or in the market to which an asset is dedicated.‘
(MASB, 2006c: FRS 136, paragraph 12b)
3. Increased in the market interest rates
- ‗Market interest rates or other market rates of return on investments have
increased during the period, and those increases are likely to affect the discount rate used in calculating an asset‘s value in use and decrease the
asset‘s recoverable amount materially.‘ (MASB, 2006c: FRS 136, paragraph 12c)
4. The market capitalisation indication ‗The carrying amount of the net assets of the entity is more than its market
capitalisation.‘ (MASB, 2006c: FRS 136, paragraph 12d)
Internal sources of information
27
The recoverable amount refers to the amount of cash flow which would be derived from the asset either from selling it at the present moment or from continuing using it in the future (Ernst and Young, 2008: 1034).

64
5. ‗Evidence is available of obsolescence or physical damage of an asset.‘ (MASB, 2006c: FRS 136, paragraph 12e)
6. Significant changes with an adverse effect on the entity which affect the asset
- ‗Significant changes with an adverse effect on the entity have taken place during the period, or are expected to take place in the near future, in the extent to which, or manner in which, an asset is used or is expected to be used. These changes include the asset becoming idle, plans to discontinue or restructure the operation to which an asset belongs, plans to dispose of an asset before the previously expected date, and reassessing the useful life of an asset as finite rather than indefinite‘.
(MASB, 2006c: FRS 136, paragraph 12f)
7. ‗Evidence is available from internal reporting that indicates that the economic performance of an asset is, or will be, worse than expected.‘
(MASB, 2006c: FRS 136, paragraph 12g)
8. Dividend for an investment in a subsidiary, jointly controlled entity or associate
- ‗Dividend from a subsidiary, jointly controlled entity or associate - for an investment in a subsidiary, jointly controlled entity or associate, the investor recognises a dividend from the investment and evidence is available that: (i) the carrying amount of the investment in the separate financial statements exceeds the carrying amounts in the consolidated financial statements of the investee's net assets, including associated goodwill; or (ii) the dividend exceeds the total comprehensive income of the subsidiary, jointly controlled entity or associate in the period the dividend is declared.‘
(MASB, 2006c: FRS 136, paragraph 12h)
Source: MASB (2006c: FRS 136, paragraph 12)
Turning to Figure 4.2, the researcher‘s views that of the eight indications
provided by FRS 136, six indications (i.e. indications number 1, 3, 5-8) relate
specifically to the assets. Information concerning these indications can only
be accessed internally by the management. The remaining two indications
relate to the economic environment in which the asset (goodwill) operates.
These two indications are: the economic condition indication (i.e. number 2),
and the market capitalisation indication (i.e. number 4). The market
capitalisation indication will be further discussed in this chapter in identifying
the recognition choice related to reporting goodwill impairment (see Section
4.6.3.2) and will be explored in the recognition study (see Chapter 9). The
researcher has attempted to explore the influence of the economic condition
indication (indication number 2), i.e. the financial crisis which experienced by
Malaysian listed companies in 2008. The result shows that the financial crisis
has no influence on the decisions to report goodwill impairment. Due to words
constraint, the result for the economic condition is not reported in this thesis.

65
With regards to the market capitalisation indication, according to
PricewaterhouseCoopers (2009: 1), if a company‘s market value is lower than
the book value of the net assets (i.e. an existence of the market capitalisation
indication) is not due to short term volatility in the market, the indicator
represents one of the factors that can ‗potentially increase the risk for
impairment‘. Ernst and Young (2011: 1083) added that the market
capitalisation could possibly be a powerful indicator of impairment of assets
(inclusive of goodwill). The audit firm notes that:
‗Market capitalisation is, potentially a powerful indicator as, if it shows
a lower figure than the book value of equity, it suggests the market
considers that the business is overvalued.‘
(Ernst and Young, 2011: 1083)
Nonetheless, Ernst and Young (2011: 1083) noted that some CGUs may not be
sensitive to the market capitalisation as an indicator. Thus, if the recoverable
amount of the CGUs exceeds the market capitalisation, the audit firm
suggested companies should disclose sufficient information to indicate the
reasons for such a condition, as well as describing factors which may lead to
impairment losses in the next year (Ernst and Young, 2011: 1083).
To assess whether the market capitalisation indication is an appropriate proxy
for an indication that goodwill may be impaired, information regarding
companies‘ reasons for reporting goodwill impairment will be analysed by
looking at companies‘ annual reports. Detail information of the investigation
will be carried out in the disclosure study (see Section 7.2).
4.4 Judgements and estimates involved in performing an impairment test of goodwill
The purpose of this section is to discuss the judgements and estimates
involved in performing an impairment test of goodwill. The discussion aims to
shed light on specific areas where managers may exercise their judgements
and estimates. The areas of discretion identified will be used to form relevant
variables in developing the hypotheses in Chapter 5 (see Sections 5.8 to
5.8.2.3).

66
Healy and Wahlen (1999: 366) argue that if financial reports are meant to
convey information provided by managers about a company‘s performance,
then accounting standards must allow managers to exercise judgement in
producing such reports. This is because if managers are considered to be
experts in the field (i.e. with regard to their company‘s performance), then,
the judgements they exercise will enable them to produce financial reports
which reflect the underlying economic values of their company (Healy and
Wahlen, 1999: 366). Nonetheless, because auditing is imperfect, the use of
judgements also creates an avenue for managers to manipulate company‘s
earnings (Healy and Wahlen, 1999: 366) if they have the motive to do so.
In the case of goodwill impairment, if managers have an incentive to
overstate or understate goodwill impairment losses, they can be selective in
applying estimates and judgements while performing an impairment test of
goodwill (Guler, 2007: 11; AbuGhazaleh et al., 2011: 169 and 180). Ernst and
Young (2007: 1) identify two areas in an impairment test of assets (inclusive
of goodwill) under IAS 36 which require managers to apply judgements and
estimates. These are: in identifying CGUs in order to allocate goodwill
acquired in business combinations, and in determining the recoverable
amount of assets (inclusive of goodwill) (Ernst and Young, 2007: 1). The next
two sections discuss the identification of CGUs (in Section 4.4.1) and the
judgements and estimates in determining the recoverable amount of CGUs (in
Section 4.4.2) respectively.
4.4.1 Identification of cash-generating-units28
(CGUs) for an allocation of goodwill
IAS 36 acknowledges that the identification of CGUs requires judgements to
be made (IASB, 2006b: IAS 36, paragraph 68; Ernst and Young, 2010: 7). This is
because the identification process is influenced by how the business operation
is monitored by managers, for example, should CGUs be based on product
lines, business, or regional areas (Ernst and Young, 2010: 7).
28 A cash-generating-unit is the smallest identifiable group of assets that generates cash inflows that are largely independent of the cash inflows from other assets or groups of assets (IASB, 2006b: IAS 36, paragraph 6).

67
Thus far, no studies have explored the relationship between how companies
identify CGUs and their decisions in reporting goodwill impairment. Rather,
what has been analysed is the number of CGUs and the decisions to report
goodwill impairment losses (i.e. AbuGhazaleh et al., 2011). AbuGhazaleh et
al. (2011: 179) argue that companies with multiple CGUs have greater
flexibility in allocating their goodwill. Managers of companies with multiple
CGUs could exploit the number of CGUs by accelerating, avoiding or
understating reporting goodwill impairment losses (AbuGhazaleh et al., 2011:
179-180). For examples, to accelerate goodwill impairment losses, managers
could allocate a large portion of the purchased goodwill to those CGUs that
are anticipated to decline in value; and to avoid or understate goodwill
impairment losses, the managers could allocate the purchased goodwill to
CGUs that are anticipated to rise in value (AbuGhazaleh et al., 2011: 180).
Similar to AbuGhazaleh et al. (2011), this thesis will analyse the number of
CGUs and the decisions to report goodwill impairment losses (see Section
5.8.1).
4.4.2 Judgements and estimates involved in determining the recoverable amount of CGUs
In determining the recoverable amount of assets (inclusive of goodwill),
managers are required to use assumptions and estimations (Ernst and Young,
2007: 1). Nobes (2006: 240) and Kvaal and Nobes (2010: 185) consider such
assumptions and estimations to be ‗covert options‘. Kvaal and Nobes (2010:
185) elaborate that the covert options include the managers‘ computation of
cash flows in arriving at the recoverable amount of assets (inclusive of
goodwill), and in applying appropriate discount rates to the cash flow
computed.
In the case of goodwill, when computing the recoverable amount of CGUs
containing goodwill, a company has to choose the higher of fair value less
costs to sell and value-in-use of the CGUs (MASB, 2006c: FRS 136, paragraph
74). In this thesis, managers‘ use of judgement in applying fair value less costs
to sell will not be explored. This is because a study carried out by Carlin et al.
(2009: 83 and 97), analysing the disclosure of goodwill impairment by 36 top
Malaysian listed companies which implemented FRS 3 in 2006, revealed that

68
none of these companies disclosed that they had applied fair value less costs
to sell exclusively as a basis of the recoverable amount. The managers‘ use of
judgement in the value-in-use will be explored in this thesis. The next
paragraphs discuss the application of value-in use.
In calculating the value-in-use of CGUs containing goodwill, managers are
required to estimate expected cash flows from the continuing use of the
assets, and to discount the cash flows to present value using the pre-tax
discount rate (MASB, 2006c: FRS 136, paragraph 31; Ernst and Young, 2007:
7). Managers‘ expectations concerning possible variation in the value-in-use
may be reflected, either through adjustment to the forecasted cash flow or
the discount rate (FRS 136, paragraph 30-32).
According to PricewaterhouseCoopers (2008: 8), both the expected cash flows
and discount rate are important factors in determining whether there is any
impairment loss. In forecasting the cash flows, managers have to make a
number of assumptions and estimations, e.g. about forecast sales volume and
profit margins (PricewaterhouseCoopers, 2008: 8). Likewise, the discount rate
which is applied by managers in computing the value-in-use does not come
from application of a simple formula (PricewaterhouseCoopers, 2008: 8).
Rather, the estimation of the discount rate requires managers to exercise
judgement based on the overall valuation exercise (PricewaterhouseCoopers,
2008: 8). A change in the discount rate will have an impact on the recoverable
amount (PricewaterhouseCoopers, 2008: 3).
Ideally to identify whether companies have over-estimated or under-
estimated the calculation of the value-in-use, one would examine both the
specific forecasted cash flows and the estimated discount rate employed.
Nonetheless, the specific forecasted cash flows which are computed by
companies in arriving at the value-in-use are not disclosed in annual reports.
As a result, the analysis of the value-in-use is confined to the application of
the discount rate. Thus, the discount rates will be employed as a test variable
in formulating the hypotheses in Chapter 5 (see Section 5.8.2).
Additionally, in an attempt to identify the possibility of estimating the cash
flow from the segment data, this thesis will explore whether the segment

69
result could be employed as a proxy for an indication that goodwill may be
impaired (see Sections 6.5.2.2 and 7.3.3).
4.5 Dissenting opinions regarding an impairment test of goodwill
This section discusses the dissenting opinions of a few of the IASB members
concerning an impairment test of goodwill. The discussion seeks to highlight
the weakness of the impairment test and hence points to the possibility of
companies exercising accounting choices related to goodwill impairment.
IFRS 3 was approved by 12 of the 14 board members; two board members
dissented from the issuance of the standard (IASB, 2006c: IFRS 3, p. 309).
Simultaneously, IAS 36 was approved by eleven members with three board
members dissenting (IASB, 2006b: IAS 36, p. 1496). The key point which
materialises through the dissenting opinions, both in the IFRS 3 and IAS 36, is
that with the abolition of the amortisation of goodwill, the impairment test of
goodwill implemented in IAS 36 does not meet the requirement of a ‗rigorous
and operational impairment test‘ (IASB, 2006b: IAS 36, Basis for Conclusions,
Dissenting opinions, DO3; IFRS 3, Basis for Conclusions, DO14).
Specifically, two board members, namely, Messrs Cope and Leisenring were of
the view that ‗a more rigorous effort must be made to determine the
recoverable amount of goodwill‘ (IASB, 2006b: IAS 36, Basis for Conclusions,
Dissenting opinions, DO4). They agreed with the idea in the Exposure Draft of
Proposed Amendments to IAS 36 which requires companies to carry out a two-
step approach in the impairment test of goodwill (IASB, 2006b: IAS 36, Basis
for Conclusions, Dissenting opinions, DO4). This approach is based on the two-
step approach in SFAS 142 Goodwill and Other Intangible Assets, which is
applied by US listed companies (IASB, 2006b: IAS 36, Basis for Conclusions,
BC167b). In step one of the approach, a company is required to compare the
recoverable amount of the CGUs to which goodwill is allocated with its
carrying amount (IASB, 2006b: IAS 36 BC, BC160). If the carrying amount
exceeds the recoverable amount, a company is required to proceed to the
second step. In step two, a company must determine the fair value of each
identifiable asset, liability, and contingent liability within the CGUs (IASB,

70
2006b: IAS 36 BC, BC163). Nonetheless, because of the complexity and costs
of applying the two-step approach which outweigh its benefits, the IASB
decided to retain the one-step approach as applied in the previous version of
IAS 36 (IASB, 2006b: IAS 36, Basis for Conclusions, BC170).
In addition to the two-step approach of an impairment test of goodwill
discussed above, the IASB has also considered a subsequent cash flow test as a
solution to improve the reliability of an impairment test of goodwill (IASB,
2006b: IAS 36, Basis for Conclusions, BC194). This subsequent cash flow test,
applied in the UK under FRS 11 Impairment of Fixed Assets and Goodwill
(IASB, 2006b: IAS 36, Basis for Conclusions, BC194) is meant to correct the
cash flow estimate applied in the computation of the value-in-use (IASB,
2006b: IAS 36, Basis for Conclusions, Dissenting opinions, DO8). It helps in
safeguarding ‗against over-optimism in the estimation of cash flows‘ (IASB,
2006b: IAS 36, Basis for Conclusions, Dissenting opinions, DO10).
However, the test was not accepted by the board members for two reasons
(IASB, 2006b: IAS 36, Basis for Conclusions, BC198). Firstly, the IASB explains
that the focus of the impairment test should be on avoiding companies with
excessive write-downs (IASB, 2006b: IAS 36, Basis for Conclusions, Dissenting
opinions, DO9). The IASB clarifies:
‗[T]he greater risk to the quality of financial reporting might be from
entities trying to write-off goodwill without adequate justification in an
attempt to ‗manage‘ the balance sheet.‘
(IASB, 2006b: IAS 36, Basis for Conclusions, BC197).
Thus, the IASB claims that any subsequent cash flow test is misdirected (IASB,
2006b: IAS 36, Basis for Conclusions, DO9).
The second reason for rejecting the subsequent cash flow test is because the
IASB views that the test could become extremely burdensome, especially for
companies with a large number of CGUs (IASB, 2006b: IAS 36, Basis for
Conclusions, BC197 (c)). If the test was required, these companies would have
to re-perform the cash flow test every year within a five year period (IASB,
2006b: IAS 36, Basis for Conclusions, BC197 (c)).

71
In the end, the IASB decided to ‗explore improving the reliability of
impairment test of goodwill through disclosure requirements‘ (IASB, 2006b:
IAS 36, Basis for Conclusions, BC198). This was done by requiring companies to
disclose enough information to allow users to evaluate the reliability of the
impairment test and at the same time maintaining an appropriate balance in
the magnitude of the disclosures (IASB, 2006b: IAS 36, Basis for Conclusions,
BC208).
The dissenting opinions discussed above have two implications for this thesis.
Firstly, the comments raised by the board members of the IASB regarding the
lack of rigour in the impairment test of goodwill suggest that there is a lack of
a strong control mechanism, such as the two-step approach and the
subsequent cash flow test put in place by the IASB under its IAS 36
Impairment of Assets. Relying on an impairment-only approach as a way of
ensuring that the carrying amount of goodwill reported on the balance sheet
does not exceed its recoverable amount, and at the same time allowing
managers to exercise judgements and estimates (see Section 4.4) without a
strong control mechanism in place, may possibly create an avenue whereby
managers can exercise accounting choices related to goodwill impairment,
especially if they have the motive to do so.
The second implication of the review is that, in issuing IFRS 3 and revising IAS
36, IASB relies on companies‘ disclosure to police the measurement rules
related to goodwill impairment, rules which they do not impose (i.e. the two-
step approach of an impairment test or the subsequent cash flow test). This
leads this thesis to examine (in Chapter 7) whether disclosure would be able
to provide enough information concerning a company‘s reasons for reporting
goodwill impairment and thus provide empirical evidence on whether the
actions of the IASB and thus the MASB in relying on companies‘ disclosure is
successful or not (see Section 10.4.4).
4.6 Accounting choices related to goodwill impairment after the implementation of FRS 3
The purpose of this section is to specify accounting choices related to
goodwill impairment which will be examined in this thesis. This section covers

72
three areas. Section 4.6.1 discusses the notion of accounting choices which
cannot be directly observed but exists in the form of the implementation
decisions. Section 4.6.2 discusses the process of identifying the accounting
choice. Section 4.6.3 discusses the accounting choices related to goodwill
impairment, which will be investigated in the measurement study (in Section
4.6.3.1) and the recognition study (in Section 4.6.3.2).
4.6.1 Implementation decisions as accounting choices related to goodwill impairment
The implementation of IFRS 3 resulted in an impairment-only approach in
accounting treatment for acquired goodwill (IASB, 2006c: IFRS 3, Dissenting
opinions, DO10). One of the stated reasons for adopting the approach is
because in formulating the IFRS 3, the IASB intends that a company should not
be allowed the previous explicit choice between two accounting methods for
the acquired goodwill. The IASB expresses the view that:
‗[E]ntities should not be allowed a choice between approaches (a)
[straight-line amortisation but with an impairment test whenever there
is an indication that the goodwill might be impaired] and (b) [non-
amortisation but with an impairment test annually or more frequently].
Permitting such choices impairs the usefulness of the information
provided to users of financial statements because both comparability
and reliability are diminished.‘
(IASB, 2006c: IFRS 3, Basis for Conclusions, BC138)
This view regarding goodwill is consistent with the aim of the IASB in general,
which is ‗not to permit choices in the accounting treatment‘ (IASB 2006a:
Preface to International Financial Reporting Standards, paragraph 13). The
impairment-only approach required by IFRS 3 implies that there is no longer a
choice of accounting method related to ‗subsequent accounting for goodwill‘
exercised by companies.
On the other hand, three issues discussed in this thesis suggest that it is
possible for companies to exercise accounting choices related to goodwill
impairment. Firstly, the definition of accounting choice offered by Fields et
al. (2001: 256) and the review of the various definitions of accounting choice

73
in Chapter 2 (see Section 2.2.1) suggest that accounting choice exists not only
through the selection of accounting methods but also via implementation
decisions. The implementation decisions, according to Francis (2001: 311) in
her review of the definition provided by Fields et al. (2001), include estimates
and judgements applied by managers in implementing GAAP. The view of
Francis (2001: 311) concerning the estimates and judgements is in line with
DeFond and Jiambalvo (1994: 149) who see the estimates and judgements
exercised by managers as ‗management choices‘ (see Section 2.2.1).
Secondly, the review of the requirements of IFRS 3, focusing on issues related
to an impairment test of goodwill, shows that managers are given discretion
to apply their assumptions and judgements, especially in determining the
recoverable amount of assets (inclusive of goodwill) (see Section 4.4).
Commenting on IAS 36, Nobes (2006: 240) and Kvaal and Nobes (2010: 185)
indicate that IAS 36 is one of the IFRSs that include ‗covert options‘ (see
Section 4.4.2). Kvaal and Nobes (2010) note:
‗[T]here are several covert options and estimations in the issue of
impairment, such as whether to recognise impairments, how to
measure cash flows, and what discount rate to use.‘
(Kvaal and Nobes, 2010: 185)
Thirdly, the review of the dissenting opinions regarding the impairment test
of goodwill (in Section 4.5) points to the lack of a control mechanism, such as
the two-step approach and the subsequent cash flow test put in place by the
IASB in its IAS 36 Impairment of Assets, after the prohibition of an
amortisation of goodwill.
The above issues suggest that, although there is no longer an explicit choice
of accounting method after the implementation of IFRS 3, there are covert
options and estimations available to managers performing an impairment test
of goodwill. Given the lack of strong control mechanism put in place in the
impairment test of goodwill after the impairment-only approach as required
under IFRS 3 (see Section 4.5), there could possibly be a scope for managers
to exercise accounting choices in the form of the implementation decisions if
they have the motive to do so. For example, to prevent debt covenant

74
violations (see Section 5.5), managers could allocate goodwill to a high growth
CGUs (see Section 4.4.1) and thus report zero goodwill impairment.
4.6.2 Process of identifying accounting choices related to goodwill impairment after the implementation of FRS 3
Figure 4.3 presents a flowchart to enable a researcher to identify accounting
choices related to goodwill impairment. The figure illustrates two phases that
are involved in identifying the accounting choice. The first phase is when
companies perform an impairment test of goodwill by comparing the
recoverable amount of a CGU containing goodwill with the carrying amount of
that unit. This gives the initial result of the impairment test. However, at this
phase, the result is not disclosed in the annual report and hence not made
publicly available.
The second phase is when managers decide how they wish to report the result
(obtained in the first phase) in the income statement. In this second phase,
routes 1 and 2 portray situations in which there is no accounting choice
exercised that conflicts with the expectations of the accounting standard.
This is because the goodwill impairment reported immediately in the income
statement (in Phase II) reflects the result of the initial impairment test (in
Phase I). For example, in route 1, by reporting goodwill impairment losses
immediately in the income statement when the result of the impairment test
shows that the recoverable amount of the CGUs is lower than the carrying
amount of the unit, the company is following the requirement of FRS 136.
Similar reasoning applies to route 2 where the company reports zero
impairment, consistent with FRS 136, as the recoverable amount is higher
than the carrying amount.

75
Figure 4.3: An ideal flowchart to identify accounting choices related to goodwill impairment
GWIL(0) denotes Zero goodwill impairment reported on the income statement
GWIL(IL) denotes Goodwill impairment losses reported on the income statement
CGU denotes Cash-generating-unit
Accounting choice, which is in the form of implementation decisions, comes
into the picture when the managers decide to report zero goodwill
impairment in the income statement (i.e. route 4 in Phase II) although the
result that they obtain in Phase I indicates that they should report goodwill
impairment losses. With this decision, the managers would then revisit the
initial calculation obtained in Phase I in order to record an appearance of
route 2 in Phase II. Similarly, accounting choice would occur when managers
make a decision to report goodwill impairment losses in the income statement
(i.e. route 3 in Phase II) even though the result that they obtain in Phase I
indicate that they should report zero goodwill impairment. These choices are
Perform an impairment test of goodwill by comparing the recoverable amount (RA) of CGU containing goodwill with the carrying amount (CA) of the unit, and obtain the
result
Route 1
Is RA < CA ? No Reported
GWIL(0)?
No Accounting
choice
GWIL(IL)
Yes
Reported
GWIL(IL)?
No
Yes No
accounting
choice
Yes
Accounting choice
GWIL(0)
Route 2
Route 3
Route 4
Phase I Result of the impairment test of
goodwill
Phase II Goodwill impairment reported in the income
statement

76
not disclosed openly because the managers revisit the initial calculation to
use different estimates.
Figure 4.3 highlights two important points. Firstly, there are two types of
accounting choice related to goodwill impairment which could be exercised by
Malaysian listed companies which implemented FRS 3. These are: (i)
accounting choice related to reporting a zero goodwill impairment in the
income statement when there should be an impairment loss reported, and (ii)
accounting choice related to reporting a goodwill impairment losses in the
income statement when there should be a zero impairment reported.
Secondly, if a company discloses the recoverable amount and the carrying
amount of the CGUs in the annual reports (i.e. the result of the impairment
test in Phase I), identifying accounting choices related to goodwill impairment
becomes a straightforward process. However, such disclosure is not the case.
The Exposure Draft of the revised IAS 36 included a disclosure requirement
whereby companies were required to disclose the ‗amount by which the unit‘s
recoverable amount exceeds its carrying amount‘ [IASB, 2002: Exposure Draft
of Revised IAS 36, C69(c), 151]. However, the proposal was not accepted, as
the IASB was concerned about the comments made by the respondents to the
Exposure Draft and the field visit participants that disclosing the values would
cause significant commercial harm to companies [IASB, 2006b: IAS 36, Basis
for Conclusions, BC 207(b)]. For example, users of financial statements might
use the quantitative disclosure as a basis for initiating litigation against
companies in cases where the assumptions stated in the financial statement
are inaccurate [IASB, 2006b: IAS 36, Basis for Conclusions, BC 207 (b)].
Because the information concerning the amount by which the unit‘s
recoverable amount exceeds its carrying amount (see Phase I of Figure 4.3) is
not disclosed in the annual reports, identifying accounting choices related to
goodwill impairment is a challenging task. Sections 4.6.3 to 4.6.3.2 discuss
accounting choices related to goodwill impairment, which will be investigated
via both the measurement and the recognition studies.

77
4.6.3 Researching accounting choices related to goodwill impairment by Malaysian listed companies after the implementation of FRS 3
This section discusses the accounting choices related to goodwill impairment
which will be researched in the measurement study (see Section 4.6.3.1) and
the recognition study (see Section 4.6.3.2).
4.6.3.1 Measurement study related to goodwill impairment
IASB in its Framework for the Preparation and Presentation of Financial
Statements defines measurement as ‗the process of determining the monetary
amounts at which the elements of the financial statements are to be
recognised and carried in the balance sheet and income statement‘ (IASB,
2006d: Framework for the Preparation and Presentation of Financial
Statements, paragraph 99). Based on this definition, the measurement study
of this thesis focuses on the magnitude of goodwill impairment losses divided
by prior year total assets (including goodwill), and zero otherwise reported on
the income statement (see Section 1.3).
Analysing the magnitude of goodwill impairment losses (discussed above) is an
approach which has been employed by prior studies in analysing asset write-
offs in the 1980s to 1990s, when an accounting standard on long-lived assets
in the US did not provide clear guidance on the timing and magnitude of
assets write-off (Francis et al., 1996: 117) or when the standard (i.e. SFAS
12129) requires ‗inherently subjective estimates and assumptions‘ (Riedl,
2004: 824). Francis et al. (1996: 117), for example, argue that during the
period of their study (i.e. 1989-1992), the absence of clear guidelines allowed
managers of US listed companies substantial discretion in terms of the timing
and magnitude of asset write-offs. Additionally, Riedl (2004: 850) opines that
the ‗highly subjective estimates and assumptions‘ required by SFAS 121, could
be one of the possible reasons for the asset write-offs of 1306 US listed
29 SFAS 121: Statement of Financial Accounting Standards No. 121: Accounting for the
Impairment or Disposal of Long-Lived Assets, issued in 1995.

78
companies from 1995-1998 which he analysed (post-SFAS 121) as not
reflecting the underlying economic values of the companies.
In this thesis, the rationale for undertaking a measurement study of goodwill
impairment may be explained as follows. After requiring companies to rely on
an impairment-only approach as a way of safeguarding the goodwill balance
(see Section 4.5), would the lack of a strong control mechanism in FRS 3 and
FRS 136 on the impairment test of goodwill allow managers to be selective in
their judgements and estimates in deciding the magnitude of goodwill
impairment losses reported, should they have the motive to do so. Thus, the
measurement study represents an indirect test of an accounting choice, in the
sense that it neither identifies the accounting choices exercised nor tests the
choice directly. Rather, the accounting choices exercised are inferred, based
on companies‘ hypothesised motives in reporting goodwill impairment. For
example, if a company‘s magnitude of goodwill impairment loss is influenced
by earnings smoothing activity, in that, the larger the positive earnings
surprise, the larger the magnitude of goodwill impairment loss reported, then
in this case, there is a possibility for the company to exercise an accounting
choice by reporting a goodwill impairment loss (see Section 5.6.4).
4.6.3.2 Recognition study related to goodwill impairment
IASB, in its Framework for the Preparation and Presentation of Financial
Statements, defines recognition as ‗the process of incorporating in the
balance sheet or income statement an item that meets the definition of an
element and satisfies the criteria for recognition set out in paragraph 83‘
(IASB, 2006d: Framework for the Preparation and Presentation of Financial
Statements, paragraph 82). Based on this definition, the recognition study of
this thesis focuses on decisions made by companies on whether to incorporate
goodwill impairment losses or zero goodwill impairment in the income
statement.
Following on this definition, to identify the recognition choice related to
reporting goodwill impairment, the researcher makes use of the market
capitalisation indication as discussed in Section 4.3. This is accomplished by
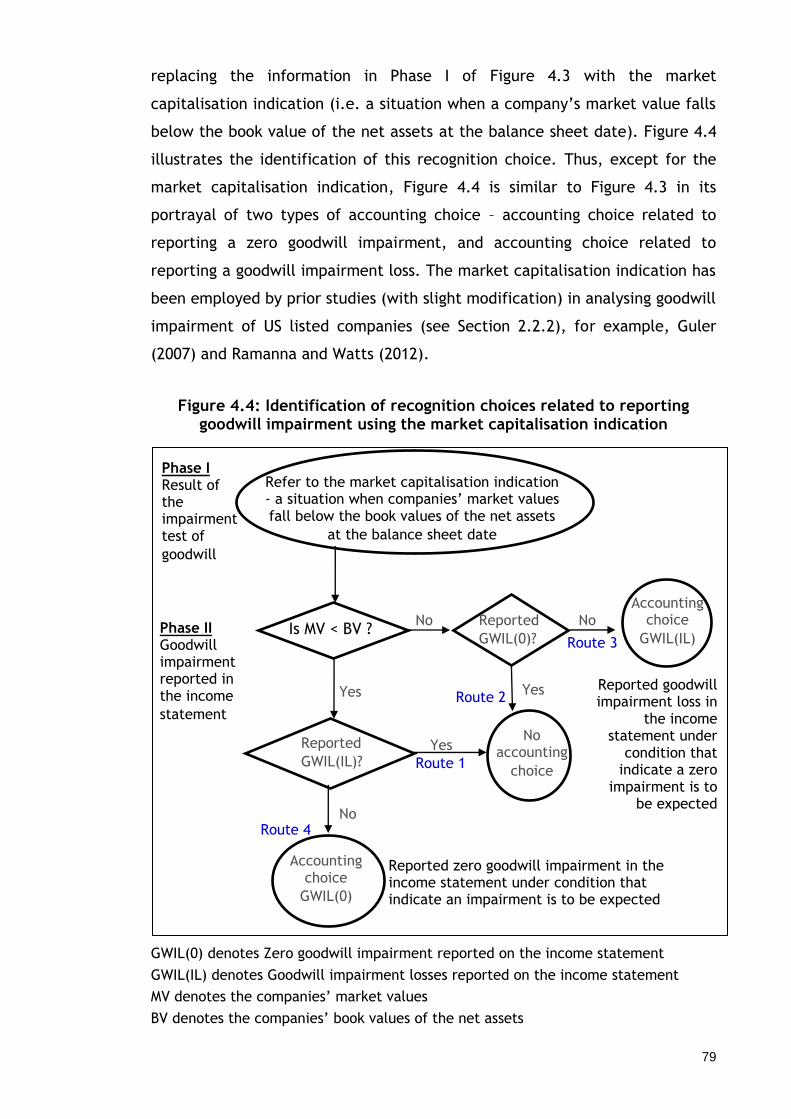
79
replacing the information in Phase I of Figure 4.3 with the market
capitalisation indication (i.e. a situation when a company‘s market value falls
below the book value of the net assets at the balance sheet date). Figure 4.4
illustrates the identification of this recognition choice. Thus, except for the
market capitalisation indication, Figure 4.4 is similar to Figure 4.3 in its
portrayal of two types of accounting choice – accounting choice related to
reporting a zero goodwill impairment, and accounting choice related to
reporting a goodwill impairment loss. The market capitalisation indication has
been employed by prior studies (with slight modification) in analysing goodwill
impairment of US listed companies (see Section 2.2.2), for example, Guler
(2007) and Ramanna and Watts (2012).
Figure 4.4: Identification of recognition choices related to reporting goodwill impairment using the market capitalisation indication
GWIL(0) denotes Zero goodwill impairment reported on the income statement
GWIL(IL) denotes Goodwill impairment losses reported on the income statement
MV denotes the companies‘ market values
BV denotes the companies‘ book values of the net assets
Refer to the market capitalisation indication - a situation when companies‘ market values fall below the book values of the net assets
at the balance sheet date
Route 1
Is MV < BV ? No Reported
GWIL(0)?
No Accounting
choice
GWIL(IL)
Yes
Reported
GWIL(IL)?
No
Yes No
accounting
choice
Yes
Accounting choice
GWIL(0)
Route 2
Route 3
Route 4
Reported zero goodwill impairment in the income statement under condition that indicate an impairment is to be expected
Reported goodwill impairment loss in
the income statement under
condition that indicate a zero
impairment is to be expected
Phase I Result of the impairment test of
goodwill
Phase II Goodwill impairment reported in the income
statement

80
Using the market capitalisation indication, the researcher argues that it is
possible for companies to be regarded as exercising recognition choices when
they are not following the market capitalisation indication. For the
recognition choice related to reporting zero goodwill impairment, companies
are considered to be exercising choice when their market capitalisation
indications indicate that they should report goodwill impairment losses yet
they report zero goodwill impairment (route 4). For the recognition choice
related to reporting goodwill impairment loss, companies are considered to be
exercising choice when they have no market capitalisation indication yet they
report goodwill impairment losses in the income statement (route 3).
As noted in Section 3.2.5, semi-structured interviews with a senior manager in
a big-4 audit firm, a financial analyst, a former standard setter, and a finance
manager of a Malaysian listed company were carried out by the researcher at
the early stage of the PhD study. The information gathered from the
interviews suggest that for Malaysian listed companies, when the market
values of companies are lower than the book values of their net assets within
a single year, the market capitalisation indication might be considered by
companies to be a temporary phenomenon. Accordingly, companies may not
refer to the market capitalisation indication in reporting goodwill impairment.
To create a stronger market capitalisation indication that goodwill may be
impaired, instead of applying market capitalisation indication which occur
within a year, the researcher focuses on market capitalisation indication
which occur for three consecutive years.
Applying the market capitalisation indication for three consecutive years, a
specific scenario which aims at testing the recognition choice related to
reporting zero goodwill impairment is constructed. In this scenario, companies
which have their market values lower than the book values of their net assets
for three consecutive years are selected (i.e. the market capitalisation
indication persists for three consecutive years). Within this group, companies
which recognised zero goodwill impairment are considered to be exercising
the recognition choice related to reporting zero goodwill impairment. They
are tested against a control group of companies which faced similar conditions
but reported goodwill impairment losses at the end of the third year. In this

81
scenario, there are 132 companies (before missing values) which have market
values below the book values of their net assets for three consecutive years,
with 96 companies recognising zero goodwill impairment for three consecutive
years and 36 companies recognising goodwill impairment losses at the end of
year 3. This scenario will be tested in the recognition study (see Section 9.2.1
for detail).
Ideally, the recognition choice related to reporting goodwill impairment losses
should be tested as well by selecting companies which have their market
values higher than the book values of their net assets for three consecutive
years. However, the number of companies which recognised goodwill
impairment losses in this scenario is too small (i.e. only two companies30)
which renders this thesis unable to examine the recognition choice related to
reporting goodwill impairment losses.
Unlike the measurement study which represents an indirect test of accounting
choices related to goodwill impairment, the recognition study attempts to
test the accounting choice directly. This is done by analysing companies‘
decisions in going against the market capitalisation indication by recognising
zero goodwill impairment. Thus, the recognition choice related to reporting
zero goodwill impairment is defined as follow:
The decisions made by managers in term of their judgements and
estimates employed during an impairment test of goodwill which lead
them to recognise zero goodwill impairment when their market values
are below the book values of their net assets for three consecutive
years.
4.7 Summary and conclusions
This chapter has reviewed the requirements of IFRS 3, focusing on the
impairment test of goodwill. The main conclusions of the chapter are as
follow.
30 There are 17 companies which have market values below the book values of their net assets
for two consecutive years and reported goodwill impairment losses.

82
Firstly, the review of the phases of the development of IFRS 3 (in Section 4.2)
has specified the phase of FRS 3 Business Combinations (and FRS 136
Impairment of Assets), which will be examined in this thesis.
Secondly, the indications that an asset (goodwill) may be impaired (in Section
4.3) are important given that the accounting choices related to goodwill
impairment which may exist after the implementation of IFRS 3 are not
directly observable, or as Nobes (2006: 239-240) calls them, ‗covert options‘.
Using the market capitalisation indication, this thesis has specified the
recognition choice related to goodwill impairment, which will be examined in
Chapter 9 of this thesis (see Section 4.6.3.2). The discussion of the indications
that an asset (goodwill) may be impaired has also highlighted the importance
of analysing companies‘ disclosure of goodwill impairment. This leads to an
empirical analysis of companies‘ disclosure, which will be discussed in more
detailed in Chapter 7 (Disclosure study).
Thirdly, the discussion of judgements and estimates involved in performing an
impairment test of goodwill (in Section 4.4) has demonstrated that the IFRS 3
provides covert options for managers while performing the impairment test.
These judgements and estimates generate variables which will be further
explored in formulating the hypotheses in Chapter 5 (see Section 5.8).
Fourthly, the dissenting opinions of few of the IASB members regarding the
lack of rigour in the impairment test of goodwill (in Section 4.5) have pointed
toward the lack of any strong control mechanism, such as the two-step
approach and the subsequent cash flow test in its IFRS 3 and IAS 36. This issue
is crucial particularly when companies rely on an impairment-only approach as
a way of safeguarding the goodwill amount reported on the balance sheet.
The review has also indicated that the IASB relies on companies‘ disclosure to
police the measurement rule related to goodwill impairment. This lead this
researcher to conduct a disclosure study in order to examine whether
companies provide enough information concerning their reasons for reporting
goodwill impairment, and thereby assisting the researcher to explore the
types of accounting choice exercised by Malaysian listed companies (see
Chapter 7).

83
Finally, the discussion of the accounting choices related to goodwill
impairment after the implementation of FRS 3 (in Section 4.6) has assisted in
defining the accounting choices which will be inferred from companies‘
hypothesised motives in reporting goodwill impairment in the measurement
study (see Chapter 8). The discussion has also provided the operational
definition of the recognition choice related to reporting zero goodwill
impairment (see Chapter 9).

84
Chapter 5: Hypotheses Development
5.1 Introduction
Chapter 3 introduces the financial reporting environment of Malaysian listed
companies before and after the implementation of FRS 3 Business
Combinations, and discusses the ownership structures of these companies
during the period of study. Chapter 4 continues with a discussion of the
discretion available to companies in performing an impairment test of
goodwill, such as CGUs and discount rates. Drawing on these two chapters and
the two accounting choice perspectives reviewed in Chapter 2 (i.e. the
contracting perspective, and the opportunistic behaviour perspective), the
present chapter seeks to develop hypotheses to test both the measurement
and the recognition studies related to goodwill impairment by Malaysian listed
companies.
This chapter is structured into 10 main sections, including the introduction.
Section 5.2 presents an overview of the hypotheses and a summary of the
dependent variables for the measurement and recognition studies of goodwill
impairment. Section 5.3 outlines the framework for the independent
variables. Sections 5.4 to 5.9 formulate relevant hypotheses. Section 5.10
summarises the chapter.
5.2 Overview of the hypotheses and summary of the dependent variables
As noted in Section 5.1, the hypotheses discuss in the present chapter are
designed for both the measurement and the recognition studies. These
hypotheses (derived from the review of literature in Chapter 2, and the
discussion of the context of study in Chapters 3 and 4), are grouped into six
categories. These are: (i) economic factors, (ii) contracting perspective, (iii)
opportunistic behaviour perspective, (iv) ownership structures, (v) discretion
available to companies in performing an impairment test of goodwill, such as
CGUs and discount rates, and (vi) company-specific factors. The first four

85
categories represent companies‘ motives while the fifth category (i.e. the
discretion) reflects the amount of flexibilities, which companies have in
measuring and recognising goodwill impairment. The last category comprises
variables controlling for company-specific factors. Figure 5.1 maps these
companies‘ motives and abilities with their relevant research questions and
empirical chapters. Detailed discussion of these motives and abilities will be
presented in Sections 5.4 to 5.8 upon developing the hypotheses.
Figure 5.1: Factors potentially influencing accounting choices related to goodwill impairment examined in the measurement and the
recognition studies and corresponding research questions
Potential factors
Research questions (RQ) and empirical chapters (see Section 1.3)
Companies’ motives
(i) Economic factors (see Section 5.4)
RQ 4 - Measurement study
RQ 9 - Recognition study
(ii) Contracting perspective (see Section 5.5)
RQ 5 - Measurement study
RQ 10 - Recognition study
(iii) Opportunistic behaviour perspective (see Section 5.6)
RQ 6 - Measurement study
RQ 11 - Recognition study
(iv) Ownership structures (see Section 5.7)
RQ 7 - Measurement study
RQ 12 - Recognition study
Companies’ abilities
(i) Discretion31 available in FRS 136 (see Section 5.8)
RQ 8 - Measurement study
Table 5.1 summarises the dependent variables and the unit of analysis for
both the measurement and recognition studies related to goodwill
impairment.
31 The recognition study does not test the discretion available to managers in performing
impairment test of goodwill, including the CGUs and discount rates, because these variables suffer from a high frequency of missing values which significantly reduces the number of observation (see Section 9.3).

86
Table 5.1: Summary of dependent variables for the measurement and recognition studies related to goodwill impairment
Dependent variable Unit of analysis
Measurement study The magnitude of
goodwill impairment losses divided by prior year total assets (including goodwill), and zero otherwise reported on the income statement (GWIL – see Appendix 1 of the thesis).
All companies which implement FRS 3 in the first three years of the standard taking effect, i.e. 2006/7 to 2008/9. These companies either have goodwill balance at the end of the financial year or reported goodwill impairment losses during the financial year.
This includes 1129 firm-years which reported zero goodwill impairment and 369 firm-years which reported goodwill impairment losses (see Table 6.2 in Section 6.4.2 for detailed of the data specification).
Recognition study A dichotomous variable,
equal to one when companies are considered as exercising a recognition choice related to reporting zero goodwill impairment, and zero otherwise [GWIL(0,1) – see Appendix 1 of the thesis].
132 companies (before missing values)
which have their market values lower than the book values of their net assets for three consecutive years. 96 of these companies recognised zero goodwill impairment throughout the three years (the test group) while 36 of these companies recognised goodwill impairment losses at the end of the third year (the control group) (see Figure 9.3 for detail).
5.3 Framework for the independent variables: Factors potentially influencing the measurement and the recognition studies of goodwill impairment
Factors potentially influencing both the measurement and the recognition
studies of goodwill impairment are grouped into six categories as shown in
Table 5.2.
Table 5.2: Variables employed for the analysis of accounting choices related to goodwill impairment examined in the measurement and the
recognition studies
Hypotheses Variables
Section
1. Economic factors 5.4
H1 Change in sales (∆Sales) 5.4.1
H2A Prior year earnings (EARNINGSPrior) 5.4.2.1
H2B Current year pre-write-off earnings 5.4.2.2

87
(EARNINGSPreGWILcurrent) Hypotheses Variables
Section
H3 Change in pre-write-off earnings (∆EARNINGSpreGWIL)
5.4.2.3
H4 Change in operating cash flows (∆OCF) 5.4.3
H5 Book-to-market ratio (BTM) 5.4.4
H6 Relative size of goodwill balance (GWB)
5.4.5
2. Contracting perspective 5.5
H7 Leverage (DEBTRATIO)
5.5
3. Opportunistic behaviour perspective 5.6
H8 Change in Chief Executive Officer (∆CEO) 5.6.1
H9 CEO tenure (CEOTENURE) 5.6.2
H10 Big bath reporting (BATH) 5.6.3
H11 Earnings smoothing (SMOOTH)
5.6.4
4. Ownership structures 5.7
H12A Managerial ownership – Linear relationship (MANOWNLinear)
5.7.1
H12B Managerial ownership – Non-monotonic relationship (MANOWNNon-monotonic)
H13 Outside ownership concentration (OUTCON)
5.7.2
5. Discretion available in performing an impairment test of goodwill
5.8
H14A CGUs containing goodwill – A dummy variable (CGU01)
5.8.1
H14B CGUs containing goodwill – Actual number of CGUs (CGUContinous)
5.8.1
H15A Discount rates - % disclosed (DISCRATE) 5.8.2.1
H15B Discount rates – Single vs. Multiple (DISCMULTIPLE) 5.8.2.2
H15C Discount rates – Disclosed or not (DISCRATEDisclosed/Not)
5.8.2.3
6. Control variables 5.9
H16 Size of company (SIZE) 5.9.1
H17 Industry dummy (INDUSTRYG5) 5.9.2
H18 Year-end dummy (YEND) 5.9.3
H19 Additions to goodwill (ADD) 5.9.4
With regard to accounting choices, this thesis focuses on two perspectives:
the contracting perspective (see Section 2.3.1) and the opportunistic
behaviour perspective (see Section 2.3.2). Both these perspectives were
developed from prior studies investigating listed companies in developed
economies, mainly in the US and UK, which were reported to have dispersed
ownership. To assess the applicability of these perspectives to Malaysian
listed companies, found to have concentrated ownership, the formulation of
the hypotheses involves two stages.

88
During the first stage of formulating the hypotheses, the measurement study
of this thesis attempts to compares the findings from the analyses of
Malaysian companies with the findings of AbuGhazaleh et al. (2011) in their
study of UK listed companies implementing IFRS 3 from 2005 to 2006.
Although there are measurement studies analysing goodwill impairment by US
listed companies (e.g. Beatty and Weber, 2006; Guler, 2007; Zang, 2008;
Ramanna and Watts, 2012), the analysis documented by AbuGhazaleh et al.
(2011) is selected as a comparison mainly because listed companies in both
Malaysia and UK apply IFRS 3 Business Combinations, whereas listed
companies in the US, implement SFAS 14232 Goodwill and Other Intangible
Assets. Thus, for the purposes of comparing the results, the first regression
model employ in the measurement study (i.e. Model 1 - see Section 8.3.3 for
detailed of the model specifications) closely follow the study of AbuGhazaleh
et al. (2011). Specifically, Model 1 replicates variables testing the economic
factors, contracting perspective, and opportunistic behaviour perspective
which are employed by AbuGhazaleh et al. (2011).
However, unlike AbuGhazaleh et al. (2011: 178-179), the model tests neither
corporate governance variables (e.g. the number of independent non-
executive directors and separation of chairman and CEO - see Table 8.4 for
detail) nor a control variable (which assesses whether a company is cross-
listed on the US stock exchange).
Corporate governance variables are not explored in this thesis as this thesis
focuses on analysing the motives and abilities of companies in reporting
goodwill impairment. Due to the nature of the information required and the
poor database coverage for Malaysian listed companies, many of the variables
testing these motives and abilities require manual collection through company
annual reports. Examples include information on CEOs, variables testing
discretion, such as CGUs and discount rates, and variables testing the
32 IFRS 3 is a result of joint effort between IASB and US FASB (see Section 4.2 for detailed discussion). Both IFRS 3 and SFAS 142 prohibit amortisation of goodwill and require companies to perform an annual impairment test of goodwill. Nevertheless, SFAS 142 differs from IFRS 3 with respect to the transitional period given to US listed companies, allocation of goodwill to reporting unit instead of CGU in IFRS 3, the 2-step approach in an impairment test of goodwill, and the requirement to apply fair values.
89
ownership structures of companies. Moreover, for the variables testing
ownership structures, care needs to be taken in order to differentiate
between shares held by company directors and those held by outside
shareholders (see Footnote 40 in Section 5.7.2). Given the extensive manual
collection of data required, and since the main aim of the thesis is to assess
the applicability of the contracting and opportunistic behaviour perspectives
in companies with ownership structures that differs from those listed
companies in developed economies (e.g. the US and UK), the researcher
decided to trade-off testing the corporate governance variables against the
comprehensive analysis of company ownership structures.
A cross-listing variable is not tested in this thesis due to a lack of companies.
Mohd Ghazali (2004: 177) found that only three of the top 100 listed
companies she examined had foreign listings.
After following as closely as possible the study of AbuGhazaleh et al. (2011) in
the first stage of the hypotheses development, the second stage involves
contextualising the regression model for the Malaysian environment. To
accomplish this aim, Models 2(a)(i) to 2(h)(ii) are constructed with three
purposes (see Section 8.3.3 for detail). Firstly, to incorporate variables which
capture the ownership structures of Malaysian listed companies. Secondly, to
include variables which are pertinent to understanding the measurement of
goodwill impairment but which are not tested by AbuGhazaleh et al. (2011).
Thirdly, to improve EARNINGSPrior, as employed by AbuGhazaleh et al. (2011),
by replacing the variable with EARNINGSPreGWILcurrent and ∆EARNINGSpreGWIL.
The next section discusses in detail the development of all the hypotheses for
the measurement and recognition studies of goodwill impairment. Appendix 1
of the thesis presents a summary of these hypotheses.
5.4 Economic factors
In the studies of asset write-offs and goodwill impairment, economic factors
refer to factors which may affect the underlying economic performance of
companies‘ assets (inclusive of goodwill) (Riedl, 2004: 830). According to
Wilson (1996: 172), the credibility of the findings of assets write-off and

90
goodwill impairment which point to the evidence of ‗manipulation‘ depends
on the extent to which the studies control for the economic factors. As a
result, variables which aim to capture the economic factors have been
incorporated in studies of asset write-off (e.g. Francis et al., 1996; Riedl,
2004; AbuGhazaleh et al., 2011).
An ideal economic factor would take account of managers‘ unbiased
expectations of future performance of the assets (Riedl, 2004: 830). In the
case of goodwill, an ideal economic factor of goodwill impairment would
comprise managers‘ unbiased expectations of future performance of the CGUs
containing goodwill (AbuGhazaleh et al., 2011: 173). Nonetheless, because
managers‘ expectations are generally unobservable (Riedl, 2004: 830;
AbuGhazaleh et al., 2011: 173), proxies are employed to reflect certain parts
of these expectations (Riedl, 2004: 830; AbuGhazaleh et al., 2011: 173).
To reflect the expectations of managers, AbuGhazaleh et al. (2011) employ
five empirical proxies, i.e., change in sales, prior year earnings, change in
operating cash flows, book-to-market ratio, and relative size of goodwill
balance. As a starting point, as noted in Section 5.3, this thesis attempts to
compare analyses of Malaysian data with the findings of AbuGhazaleh et al.
(2011) in their analysis of UK listed companies implementing IFRS 3. Thus, the
five empirical proxies which have been employed by AbuGhazaleh et al.
(2011) will also be employed in this thesis. However, due to the limitation of
a company‘s prior year earnings as employed by AbuGhazaleh et al. (2011)
(see Section 5.4.2.1), two additional variables will be included as proxies for
the economic factors, i.e., current year pre-write-off earnings (see Section
5.4.2.2) and change in pre-write-off earnings (see Section 5.4.2.3). These
additional variables will be tested in separate regression models (see Section
8.3.3 for the model specification). Therefore, seven variables in total are
employed in this thesis to test the influence of the economic factors on the
measurement and the recognition studies of goodwill impairment by Malaysian
listed companies. These are: ∆Sales, ∆OCF, BTM, GWB, EARNINGSprior,
EARNINGSPreGWILCurrent, and ΔEARNINGSpreGWIL .
The selection of these empirical proxies, as acknowledged by Riedl (2004) and
AbuGhazaleh et al. (2011), raises an important issue which requires
91
explanation. These empirical proxies measure the economic performance of a
company rather than being specific to assets (Riedl, 2004: 831) or to CGUs
containing goodwill (AbuGhazaleh et al., 2011: 173). According to Riedl (2004:
831), it is difficult to capture the specific attributes of assets such as sales,
earnings, or cash flows, as such information is generally unavailable. Likewise,
AbuGhazaleh et al. (2011: 173) explain that ‗no financial information is
publicly available at the CGUs level‘. For this reason, both Riedl (2004) and
AbuGhazaleh et al. (2011) include neither the economic performance of
specific assets (Riedl, 2004) nor CGUs containing goodwill (AbuGhazaleh et
al., 2011) when considering the economic factors. Similar to Riedl (2004) and
AbuGhazaleh et al. (2011), this thesis does not capture the economic
performance which is specific to CGUs containing goodwill as a test variable.
Nevertheless, the disclosure study of this thesis (see Chapter 7) attempts to
explore the performance of CGUs by looking at the segment result containing
goodwill and comparing this result with companies‘ financial performance and
their market capitalisation in selected companies (see Table 7.3 for an
example of this analysis). The findings of the disclosure study confirm the
difficulties in obtaining information concerning CGUs as explained by Riedl
(2004: 831) and AbuGhazaleh et al. (2011: 173), i.e., it is challenging to
capture the economic performance of CGUs containing goodwill, especially
when the goodwill is allocated to a number of CGUs and the allocation of
goodwill to each of the CGUs (or segment results) is not clearly disclosed.
Next, Sections 5.4.1 to 5.4.5 discuss the development of the hypotheses for
the economic factors.
5.4.1 Change in sales (∆Sales)
Change in sales aims to capture accrual-related performance attributes
(Riedl, 2004: 831; AbuGhazaleh et al., 2011: 180). An improvement in sales
suggests that a company is performing well, which reflects the recoverability
of asset values (inclusive of goodwill) (AbuGhazaleh et al., 2011).
Prior studies analysing measurement (i.e. AbuGhazaleh et al., 2011 – UK
study) and recognition (i.e. Guler, 2007 – US study) of goodwill impairment

92
predict a negative association between change in sales and reporting goodwill
impairment losses. Their empirical results provided mixed findings. In term of
the univariate analysis, AbuGhazaleh et al. (2011: 186) found that the median
change in sales for the write-off companies is significantly lower than the non-
write-off companies (at p-value less than 0.01). However, the mean change in
sales between the two groups is not statistically significant33.
Guler (2007: 89) documented that both the median and mean change in sales
for the write-off group is significantly lower than the non-write-off groups (at
p<10%). To her, the result of the univariate analysis suggests that the write-
off companies exhibit worse financial performance than the non-write-off
companies (p. 31). As for the multivariate analysis, AbuGhazaleh et al. (2011:
190) observed the change in sales to be non-significance in explaining
companies‘ measurement of goodwill impairment losses while Guler (2007:
72) found the variable to be marginally significant (at p-value less than 0.10)
in explaining the recognition of goodwill impairment.
In this thesis, and similar to AbuGhazaleh et al. (2011: 178), change in sales is
defined as change in sales from prior period to current period, divided by
total assets at the end of prior period34 (see Appendix 1 of the thesis). The
following hypothesis is developed both in a null form and an alternate form:
H1-Null: Ceteris paribus, there is no significant association between
companies‘ decisions in reporting goodwill impairment losses and
change in sales.
H1-Alternative1: Ceteris paribus, there is a significant negative association
between companies‘ decisions in reporting goodwill impairment
losses and change in sales.
33 The fact that the mean and median change in sales as employed by AbuGhazaleh et al. (2011) differs significantly raises the issue of skewed data, which is not addressed by that study (see Section 8.2.2.1). 34 In this thesis, total assets at the end of prior period are employed because for Malaysian listed companies, Datastream does not provide information concerning the total assets at the beginning of the current period.

93
H1-Alternative2: Ceteris paribus, there is a significant positive association
between companies‘ decisions in reporting goodwill impairment
losses and change in sales.
The null hypothesis is no significant association between companies‘ decisions
in reporting goodwill impairment losses and change in sales. There are two
alternatives hypothesis.
H1-Alternative1 is based on the assumption that companies do not make choices
which conflict with economic factors. Finding a significant negative
association in H1-Alternative1 indicates that the poorer the company‘s
performance (reflected as a decline in value of change in sales), the greater
the likelihood of, or the greater the magnitude of, goodwill impairment losses
reported by the company. By recognising or measuring goodwill impairment
losses when sales are falling, managers are reflecting their expectations of
future performance of the asset (based on past performance) at a firm-level.
Thus, in this case, there is no accounting choice exercised as managers are
complying with FRS 3 and FRS 136.
H1-Alternative2 is based on the assumption that companies do make choices which
conflict with economic factors. Finding a significant positive association in H1-
Alternative2 suggests that the poorer the company‘s performance (reflected as a
decline in value of change in sales), the lower the likelihood of, or the lower
the magnitude of, goodwill impairment losses reported by the company. By
not recognising goodwill impairment losses or reporting lower amount of
goodwill impairment losses when sales are falling, managers are possibly
attempting to avoid goodwill impairment losses, or reporting lower magnitude
of impairment losses, hoping their companies‘ performance will improve in
the future. In such cases, the managers‘ decisions in reporting goodwill
impairment losses do not reflect their expectations of the future performance
of the asset at a firm-level, which may point to the possibility of accounting
choices being exercised.

94
5.4.2 Companies’ pre-write-off earnings
Companies‘ pre-write-off earning is another measure of a company‘s
performance (Riedl, 2004: 831; AbuGhazaleh et al, 2011: 180). Prior studies
(e.g. Riedl, 2004: 831; Guler, 2007: 23; AbuGhazaleh et al., 2011: 180)
hypothesise that the worse the company‘s performance, the higher the
likelihood of, or the magnitude of, goodwill impairment losses reported. In
employing the pre-write-off earnings, prior studies either make use of
companies‘ earnings at one specific point in time (e.g. prior year earnings in
AbuGhazaleh et al., 2011: 170) or employ a change in pre-write-off earnings
from prior year to current year (e.g. Riedl, 2004: 829; Guler, 2007: 21 and
23). This thesis has employed both measures of earnings and tested them in
separate random-effects tobit regression models. The next Section 5.4.2.1
discusses the prior year earnings as employed by AbuGhazaleh et al. (2011).
5.4.2.1 Prior year earnings (EARNINGSPrior)
AbuGhazaleh et al. (2011: 178) employ prior year earnings (EARNINGSPrior) as
one of the economic factors. They (p. 178) define earnings as ‗return on
assets for company i at the end of t-1 (measured as pre-tax profit divided by
total assets)‘. This variable faces three limitations.
Firstly, the definition of prior year earnings provided by AbuGhazaleh et al.
(2011) does not clearly explain whether the pre-tax profit is adjusted for
(added back) goodwill impairment losses, yet for other variables(e.g. BATH35
and SMOOTH), AbuGhazaleh et al. (2011: 178) specify that the earnings figure
employed in testing big bath reporting is computed based on pre-write-off
earnings. Thus, it is assumed that the company‘s prior year earnings
(EARNINGSPrior) employed by AbuGhazaleh et al (2011) is not adjusted for
(added back) goodwill impairment losses. To overcome this limitation in this
thesis, a sensitivity analysis is carried out by replacing companies‘ prior year
35 BATH is defined as ‗change in company i‘s pre-write-off earnings from t -1 to t deflated by
total assets at the end of t -1, when this change is below the median of non-zero negative values of this variable, and zero otherwise‘ (AbuGhazaleh et al., 2011: 178).

95
earnings (EARNINGSPrior) with prior year pre-write-off earnings
(EARNINGSPreGWILprior) (see Sections 8.5.2.3 and 8.6.2.1).
Secondly, it is not clear why managers would refer to prior year earnings in
making decisions in reporting goodwill impairment in the current year. Francis
et al. (1996: 123) argue that companies‘ current year earnings may also
influence the timing in reporting goodwill impairment losses. This has led the
researcher to employ an additional variable - current year pre-write-off
earnings (EARNINGSPreGWILcurrent) (see Section 5.4.2.2).
Thirdly, the prior year earnings (EARNINGSPrior) measure a company‘s
performance at one specific point in time. Riedl (2004: 831) argues that
managers might base their decisions to write down the assets by looking at
the change in the company‘s performance (i.e. change in pre-write-off
earnings from the prior year to the current year). This limitation has led the
researcher to incorporate change in pre-write-off earnings (∆EARNINGSpreGWIL)
as another variable for the economic factors (see Section 5.4.2.3).
For the purpose of comparing the result of this thesis with the UK data, prior
year earnings (EARNINGSPrior) as employed by AbuGhazaleh et al. (2011) is
included in this thesis. AbuGhazaleh et al. (2011) hypothesise a negative
association between prior year earnings (EARNINGSPrior) and reporting goodwill
impairment losses. The multivariate analysis documented by AbuGhazaleh et
al. (2011: 190) reveals prior year earnings (EARNINGSPrior) to be marginally
significant (p-value less than 0.10) in explaining the measurement of goodwill
impairment losses.
In this thesis, prior year earnings (EARNINGSPrior) is defined as prior year net
income36 before extraordinary items37 or preferred dividends, divided by total
36 Net income before extraordinary items or preferred dividends is selected because this is the level of earnings which is employed by Malaysian listed companies in computing the earnings per share (for e.g. see Annual report – A & M Realty Berhad, 2006: 61). This approach is similar to Beattie et al. (1994: 792). 37 In Malaysia, prior to the implementation of IFRSs, ‗extraordinary items‘ was defined by FRS 1082004 Net Profit or Loss for the Period, Fundamental Errors and Changes in Accounting Policies (paragraph 6) as ‗income or expenses that arise from events or transactions that are clearly distinct from the ordinary activities of the enterprise and, therefore, are not expected to recur frequently or regularly‘ (MASB, 2004b). The standard required such items to be disclosed on the face of the income statement, separately from the profit or loss on ordinary

96
assets at the end of prior year (see Appendix 1 of the thesis). The following
hypothesis is developed both in a null form and an alternate form:
H2A-Null: Ceteris paribus, there is no significant association between
companies‘ decisions in reporting goodwill impairment losses and
prior year earnings (EARNINGSPrior).
H2A-Alternative1: Ceteris paribus, there is a significant negative association
between companies‘ decisions in reporting goodwill impairment
losses and prior year earnings (EARNINGSPrior).
H2A-Alternative2: Ceteris paribus, there is a significant positive association
between companies‘ decisions in reporting goodwill impairment
losses and prior year earnings (EARNINGSPrior).
The null hypothesis is no significant association between companies‘ decisions
in reporting goodwill impairment losses and companies‘ prior year earnings
(EARNINGSPrior). There are two alternatives hypothesis.
H2A-Alternative1 is based on the assumption that companies do not make choices
which conflict with economic factors. Finding a significant negative
association in H2A-Alternative1 indicates that the poorer the company‘s
performance (reflected in the lower EARNINGSprior), the greater the likelihood
of, or the greater the magnitude of, goodwill impairment losses reported by
the company. By recognising or measuring goodwill impairment losses when
prior year earnings are low, managers are reflecting their expectations of the
future performance of the asset (based on past performance) at a firm-level.
Consequently, there is no accounting choice exercised, as managers are
complying with FRS 3 and FRS 136.
activities (MASB, 2004b: FRS 1082004, paragraph 5). However, after having a convergence policy towards the IFRSs, MASB, effective from January 1, 2006, prohibited the presentation of extraordinary items (MASB, 2006d: FRS 101 Presentation of Financial Statements, paragraph 87 - similar to IAS 1 issued by the IASB). The rationale for such prohibition is because extraordinary items arise from the normal business risks faced by an entity and do not warrant presentation in a separate component of the income statement (KPMG, 2005).

97
H2A-Alternative2 is based on the assumption that companies make choices which
conflict with economic factors. Finding a significant positive association in
H2A-Alternative2 suggests that the poorer the company‘s performance (reflected in
the lower EARNINGSprior), the lower the likelihood of, or the lower the
magnitude of, goodwill impairment losses reported by the company. By not
recognising goodwill impairment losses, or reporting a lower amount of
goodwill impairment losses, when a company‘s prior year earnings is low, it is
possible that managers are attempting to avoid goodwill impairment losses, or
reporting a lower magnitude of impairment losses in hope that the companies‘
performance will improve in the future. Consequently, the managers‘
decisions in reporting goodwill impairment losses do not reflect their
expectations of the future performance of the asset at a firm-level, which
may point to the possibility of accounting choices being exercised.
5.4.2.2 Current year pre-write-off earnings (EARNINGSPreGWILcurrent)
Thus far, no prior studies have examined current year pre-write-off earnings
(EARNINGSPreGWILcurrent) of companies. In this thesis, the variable is expected to
be negatively associated with companies‘ decisions in reporting goodwill
impairment losses, in that, the higher the current year pre-write-off earnings,
the lower the likelihood of, or the magnitude of, goodwill impairment losses
reported on the income statement. Current year pre-write-off earnings
(EARNINGSPreGWILcurrent) is defined as current year net income before
extraordinary items or preferred dividends after adding back goodwill
impairment losses, divided by total assets at the end of prior year (see
Appendix 1 of the thesis). The following hypothesis is developed both in a null
form and an alternate form:
H2B-Null: Ceteris paribus, there is no significant association between
companies‘ decisions in reporting goodwill impairment losses and
current year pre-write-off earnings (EARNINGSPreGWILcurrent).
H2B-Alternative1: Ceteris paribus, there is a significant negative association
between companies‘ decisions in reporting goodwill impairment

98
losses and current year pre-write-off earnings
(EARNINGSPreGWILcurrent).
H2B-Alternative2: Ceteris paribus, there is a significant positive association
between companies‘ decisions in reporting goodwill impairment
losses and current year pre-write-off earnings
(EARNINGSPreGWILcurrent).
The null hypothesis is no significant association between companies‘ decisions
in reporting goodwill impairment losses and current year pre-write-off
earnings (EARNINGSPreGWILcurrent). There are two alternatives hypothesis.
H2B-Alternative1 is based on the assumption that companies do not make choices
which conflict with economic factors. Finding a significant negative
association in H2B-Alternative1 indicates that the poorer the company‘s
performance (reflected in the lower EARNINGSPreGWILcurrent), the greater the
likelihood of, or the greater the magnitude of, goodwill impairment losses
reported by the company. By recognising or measuring goodwill impairment
losses when the current year pre-write-off earnings are low, managers are
reflecting their expectations of the future performance of the asset (based on
past performance) at a firm-level. Consequently, there is no accounting
choice being exercised, as managers are complying with FRS 3 and FRS 136.
H2B-Alternative2 is based on the assumption that companies make choices which
conflict with economic factors. Finding a significant positive association in
H2B-Alternative2 suggests that the poorer the company‘s performance (reflected in
the lower EARNINGSPreGWILcurrent), the lower the likelihood of, or the lower the
magnitude of, goodwill impairment losses reported by the company. By not
recognising goodwill impairment losses, or reporting lower amount of goodwill
impairment losses, when a current year pre-write-off earnings is low,
managers are possibly attempting to avoid goodwill impairment losses, or
reporting a lower magnitude of impairment losses, in the belief that the
companies‘ performance will improve in the future. Consequently, the
managers‘ decisions in reporting goodwill impairment losses do not reflect
their expectations of the future performance of the asset at a firm-level,
which may point to the possibility of accounting choices being exercised.

99
5.4.2.3 Change in pre-write-off earnings (∆EARNINGSpreGWIL)
Change in pre-write-off earnings (∆EARNINGSpreGWIL) is employed by Riedl
(2004: 829), and is another measure of a company‘s performance. Similar to
improvement in sales (∆Sales), improvement in pre-write-off earnings from
the previous year to the current year (∆EARNINGSpreGWIL) suggests that a
company is performing well. Riedl (2004: 843) predicts a negative association
between change in pre-write-off earnings (∆EARNINGSpreGWIL) and companies‘
decisions in taking the write-off. This means that the poorer the company‘s
change in pre-write-off earnings (∆EARNINGSpreGWIL), the greater the
magnitude of the write-off reported (Riedl, 2004: 843).
In this thesis, similar to Riedl (2004: 829), change in pre-write-off earnings
(∆EARNINGSpreGWIL) is defined as change in a company‘s pre-write-off earnings
from the prior period to the current period, divided by total assets at the end
of the prior period. The pre-write-off earnings refer to net income before
extraordinary items or preferred dividends after adding back goodwill
impairment losses (see Appendix 1 of the thesis). This has led to the
formulation of the following hypothesis, both in a null form and an alternate
form:
H3-Null: Ceteris paribus, there is no significant association between
companies‘ decisions in reporting goodwill impairment losses and
the change in pre-write-off earnings (∆EARNINGSpreGWIL).
H3-Alternative1: Ceteris paribus, there is a significant negative association
between companies‘ decisions in reporting goodwill impairment
losses and the change in pre-write-off earnings
(∆EARNINGSpreGWIL).
H3-Alternative2: Ceteris paribus, there is a significant positive association
between companies‘ decisions in reporting goodwill impairment
losses and the change in pre-write-off earnings
(∆EARNINGSpreGWIL).

100
The null hypothesis is no significant association between companies‘ decisions
in reporting goodwill impairment losses and the change in pre-write-off
earnings (∆EARNINGSpreGWIL). There are two alternatives hypothesis.
H3-Alternative1 is based on the assumption that companies do not make choices
which conflict with economic factors. Finding a significant negative
association in H3-Alternative1 indicates that the poorer the company‘s
performance (reflected as a decline in the value of ∆EARNINGSpreGWIL), the
greater the likelihood of, or the greater the magnitude of, goodwill
impairment losses reported by the company. By recognising or measuring
goodwill impairment losses when a company‘s pre-write-off earnings are
falling, managers are reflecting their expectations of the future performance
of the asset (based on past performance) at a firm-level. Thus, in this case,
there is no accounting choice being exercised as managers are complying with
FRS 3 and FRS 136.
H3-Alternative2 is based on the assumption that companies make choices which
conflict with economic factors. Finding a significant positive association in H3-
Alternative2 suggests that the poorer the company‘s performance (reflected as a
decline in value of ∆EARNINGSpreGWIL), the lower the likelihood of, or the lower
the magnitude of, goodwill impairment losses reported by the company. By
not recognising goodwill impairment losses, or reporting a lower magnitude of
goodwill impairment losses, when a company‘s change in pre-write-off
earnings fall from prior year to current year, managers are possibly
attempting to avoid goodwill impairment losses, or reporting lower magnitude
of impairment losses, in the belief that the companies‘ performance will
improve in the future. Thus, in this case, the managers‘ decisions in reporting
goodwill impairment losses do not reflect their expectations of the future
performance of the asset at a firm-level, which may point to the possibility of
accounting choices being exercised.
5.4.3 Change in operating cash flows (∆OCF)
Change in operating cash flows (∆OCF) measures the cash-related
performance attributes (Riedl, 2004: 831; AbuGhazaleh et al., 2011: 180). An

101
improvement in operating cash flows suggests that a company is performing
well, which is likely to be reflected more in the return on investment in the
asset (Riedl, 2004: 831) or goodwill (AbuGhazaleh et al., 2011: 180).
Prior studies analysing measurement of asset write-off (i.e. Riedl, 2004) or
goodwill impairment (i.e. AbuGhazaleh et al., 2011) predict a negative
association between change in operating cash flows (∆OCF) and reporting the
write-off. AbuGhazaleh et al. (2011: 190) found change in operating cash
flows (∆OCF) to be marginally significant (at p-value less than 0.10) in
explaining the measurement of goodwill impairment losses.
In this thesis, similar to AbuGhazaleh et al. (2011: 178), change in operating
cash flows (∆OCF) is defined as change in operating cash flows from prior
period to current period, divided by total assets at the end of prior period
(see Appendix 1 of the thesis). The following hypothesis is developed both in a
null form and an alternate form:
H4-Null: Ceteris paribus, there is no significant association between
companies‘ decisions in reporting goodwill impairment losses and
change in operating cash flows (∆OCF).
H4-Alternative1: Ceteris paribus, there is a significant negative association
between companies‘ decisions in reporting goodwill impairment
losses and change in operating cash flows (∆OCF).
H4-Alternative2: Ceteris paribus, there is a significant positive association
between companies‘ decisions in reporting goodwill impairment
losses and change in operating cash flows (∆OCF).
The null hypothesis is that there is no significant association between
companies‘ decisions in reporting goodwill impairment losses and change in
operating cash flows (∆OCF). There are two alternatives hypothesis.
H4-Alternative1 is based on the assumption that companies do not make choices
which conflict with economic factors. Finding a significant negative
association in H4-Alternative1 indicates that the poorer the company‘s

102
performance (reflected as a decline in the value of ∆OCF), the greater the
likelihood of, or the greater the magnitude of, goodwill impairment losses
reported by the company. By recognising or measuring goodwill impairment
losses when operating cash flows are falling, managers are reflecting their
expectations of future performance of the asset (based on past performance)
at a firm-level. Thus, in this case, there is no accounting choice exercised as
managers are complying with FRS 3 and FRS 136.
H4-Alternative2 is based on the assumption that companies make choices which
conflict with economic factors. Finding a significant positive association in H4-
Alternative2 suggests that the poorer the company‘s performance (reflected as a
decline in the value of ∆OCF), the lower the likelihood of, or the lower the
magnitude of, goodwill impairment losses reported by the company. By not
recognising goodwill impairment losses or reporting lower amount of goodwill
impairment losses when operating cash flows are falling, it is possible that
managers are attempting to avoid goodwill impairment losses, or reporting a
lower magnitude of impairment losses, in the hope that companies‘
performance will improve in the future. Consequently, the managers‘
decisions in reporting goodwill impairment losses do not reflect their
expectations of the future performance of the asset at a firm-level, which
may point to the possibility of accounting choices being exercised.
5.4.4 Book-to-market ratio (BTM)
Book-to-market ratio (BTM) attempts to capture the intensity of expected
economic impairment of goodwill at a firm-level (Guler, 2007: 24). According
to FRS 136 (paragraph 12), one of the indications that an asset (goodwill) may
be impaired is when the carrying amount of the net assets of the entity is
more than its market capitalisation (MASB, 2006c: FRS 136, paragraph 12d)
(see Section 4.3 for detailed discussion). Following the FRS 136 indication, a
higher book-to-market ratio (BTM) may indicate a possible goodwill
impairment loss at a firm-level. Guler (2007) and AbuGhazaleh et al. (2011)
posit a positive relationship between book-to-market ratio (BTM) and
reporting goodwill impairment losses. That is, companies with higher book-to-

103
market ratio (BTM) are expected to report larger amount of goodwill
impairment losses (AbuGhazaleh et al., 2011: 179).
In the multivariate analysis, using tobit regression in their measurement
study, AbuGhazaleh et al. (2011: 190) documented the book-to-market ratio
(BTM) to be positively associated with the measurement of goodwill
impairment losses (at p-value less than 0.05). Applying logistic regression in
her recognition study, Guler (2007: 72) also found that the higher the book-to-
market ratio (BTM), the higher the likelihood of reporting goodwill
impairment losses, though the association is marginally significant (p-value
less than 0.10).
In this thesis, the book-to-market ratio (BTM) is defined as book value of
equity divided by market value of equity at the end of the current period (see
Appendix 1 of the thesis). The following hypothesis is developed both in a null
form and an alternate form:
H5-Null: Ceteris paribus, there is no significant association between
companies‘ decisions in reporting goodwill impairment losses and
the book-to-market ratio (BTM).
H5-Alternative1: Ceteris paribus, there is a significant positive association
between companies‘ decisions in reporting goodwill impairment
losses and the book-to-market ratio (BTM).
H5-Alternative2: Ceteris paribus, there is a significant negative association
between companies‘ decisions in reporting goodwill impairment
losses and the book-to-market ratio (BTM).
The null hypothesis is no significant association between companies‘ decisions
in reporting goodwill impairment losses and the book-to-market ratio (BTM).
There are two alternatives hypothesis.
H5-Alternative1 is based on the assumption that companies do not make choices
which conflict with economic factors. Finding a significant positive association
in H5-Alternative1 indicates that the poorer the company‘s performance (reflected

104
in a higher BTM), the greater the likelihood of, or the greater the magnitude
of, goodwill impairment losses reported by the company. By recognising or
measuring goodwill impairment losses when BTM is large, managers are
reflecting expectations of future performance of the asset (based on past
performance) at a firm-level. Thus, in this case, there is no accounting choice
exercised as managers are following the indication of FRS 136.
H5-Alternative2 is based on the condition of choice that conflict with economic
factors. Finding a significant negative association in H5-Alternative2 suggests that
the poorer the company‘s performance (reflected in a higher BTM), the lower
the likelihood of, or the lower the magnitude of, goodwill impairment losses
reported by the company. By not recognising goodwill impairment losses, or
reporting a lower magnitude of goodwill impairment losses, when BTM are
large, managers are possibly attempting to avoid goodwill impairment losses,
or reporting lower magnitude of impairment losses, hoping that the
companies‘ performance will improve in the future. Thus, in this case, the
managers‘ decisions in reporting goodwill impairment losses are conflicting
with the indication provided by FRS 136 (paragraph 12d), which may point to
the possibility of accounting choices being exercised.
5.4.5 Relative size of goodwill balance (GWB)
Relative size of goodwill balance (GWB) represents one of the characteristics
of goodwill (Lapointe-Antunes et al., 2008: 44; Zang, 2008: 48; AbuGhazaleh
et al., 2011: 179). It is considered to be one of the economic factors related
to impairment (AbuGhazaleh et al., 2011: 179). Prior studies (Lapointe-
Antunes et al., 2008: 44; Zang, 2008: 49; AbuGhazaleh et al., 2011: 179)
argue that companies with a large amount of goodwill balance in their asset
composition are more exposed to an impairment test, and thus more likely to
report goodwill impairment losses than companies with a small magnitude of
goodwill balance in their asset composition. All of the prior studies (i.e.
Lapointe-Antunes et al., 2008; Zang, 2008; Ramanna and Watts, 2012;
AbuGhazaleh et al., 2011) predict a positive association between relative size
of goodwill balance (GWB) and the measurement of goodwill impairment
losses.

105
The empirical results testing the association between relative size of goodwill
balance (GWB) and companies‘ decisions in reporting goodwill impairment
losses provide conflicting findings. For the measurement study, in their
multivariate analysis, Zang (2008: 53) and Lapointe-Antunes et al. (2008: 48)
found the variable to be strongly significant (at p-values less than 0.01) in
explaining the measurement of goodwill impairment losses by US and
Canadian listed companies respectively. On the other hand, AbuGhazaleh et
al. (2011: 190) found the variable not to be statistically significant in
explaining the measurement of goodwill impairment losses by UK listed
companies. Likewise, for the recognition study, Omar and Mohd-Saleh (2011:
403) found the relative size of goodwill balance as non-significant in
explaining the recognition of goodwill impairment by Malaysian listed
companies.
In this thesis, similar to AbuGhazaleh et al. (2011: 178), relative size of
goodwill balance (GWB) is defined as the opening carrying value of goodwill in
the current year divided by total assets at the end of prior period (see
Appendix 1 of the thesis). The following hypothesis is developed both in a null
form and an alternate form:
H6-Null: Ceteris paribus, there is no significant association between
companies‘ decisions in reporting goodwill impairment losses and
relative size of goodwill balance (GWB).
H6-Alternative1: Ceteris paribus, there is a significant positive association
between companies‘ decisions in reporting goodwill impairment
losses and relative size of goodwill balance (GWB).
H6-Alternative2: Ceteris paribus, there is a significant negative association
between companies‘ decisions in reporting goodwill impairment
losses and relative size of goodwill balance (GWB).
The null hypothesis is no significant association between companies‘ decisions
in reporting goodwill impairment losses and the relative size of goodwill
balance (GWB). There are two alternatives hypothesis.

106
H6-Alternative1 is based on the assumption that companies do not make choices
which conflict with economic factors. Finding a significant positive association
in H6-Alternative1 indicates that the larger the size of goodwill balance relative to
a company‘s total assets (reflected in a high GWB), the greater the likelihood
of, or the greater the magnitude of, goodwill impairment losses being
reported by the company. By recognising or measuring goodwill impairment
losses when GWB is high, managers are reflecting the exposure of the goodwill
balance to the performance of the total assets. Thus, in this case, there is no
accounting choice exercised.
H6-Alternative2 is based on the condition of choices that conflict with the
economic factors. Finding a significant negative association in H6-Alternative2
suggests that the larger the size of goodwill balance relative to a company‘s
total assets (reflected in a higher GWB), the lower the likelihood of, or the
lower the magnitude of, goodwill impairment losses reported by the company.
By not recognising goodwill impairment losses, or reporting lower amount of
goodwill impairment losses, when GWB are high, managers are possibly
attempting to avoid goodwill impairment losses, or reporting a lower
magnitude of impairment losses, hoping that the companies‘ performance will
improve in the future. Thus, in this case, the managers‘ decisions in reporting
goodwill impairment losses do not reflect the exposure of the goodwill
balance to the performance of the total assets, which may lead to the
possibility of accounting choices being exercised.
5.5 Contracting perspective: Debt hypothesis (DEBTRATIO)
The contracting perspective of accounting choice which will be tested in this
thesis is the debt hypothesis. From a contracting point of view, managers‘
motives for exercising an accounting choice is to influence an external
contractual arrangement between companies and their debt-holders (Fields et
al., 2001) (See Section 2.3.1.2). This is especially true for companies that are
close to violating their debt covenants (Fields et al., 2001). By exercising an
accounting choice, these companies are attempting to relax the accounting-
based restrictions stipulated in the debt covenants (Smith, 1993); hence
avoiding any violation of such covenants (Dichev and Skinner, 2002).

107
In the context of goodwill impairment, previous researchers testing the debt
hypothesis either predicted a negative relationship between companies‘
closeness to the debt covenant violations and their decisions in reporting
goodwill impairment losses (Zang, 2008; Ramanna and Watts, 2012) or
provided no predicted sign (AbuGhazaleh et al., 2011: 174 and 190). The
negative prediction implies that companies which are close to violating their
debt covenants are less likely to recognise goodwill impairment losses (Beatty
and Weber, 2006: 265; Zang, 2008: 53). By not recognising goodwill
impairment losses, companies are trying to maximise their current earnings
(Godfrey and Koh, 2009: 127), and thus possibly avoiding debt covenant
violations (Ramanna and Watts, 2012). AbuGhazaleh et al. (2011: 174) reason
that due to the conflicting results documented by prior studies, they do not
hypothesise a direction in testing the debt hypothesis.
The empirical evidence of accounting choices related to goodwill impairment,
testing the debt hypothesis, documented mixed results. In the US, Zang (2008:
48 and 54) demonstrates that regardless of five different measures of
leverage employed in his measurement study, the results consistently support
the debt hypothesis, showing a negative association between leverage and
companies‘ decisions in reporting goodwill impairment losses during the
transitional period (at p-value less than 0.05). Likewise, the empirical finding
of Ramanna and Watts (2012) in their measurement study supported the debt
hypothesis (at p-value less than 0.10).
On the other hand, Beatty and Weber (2006: 280) found no significant
association between companies‘ leverage and their decisions to report
goodwill impairment losses in the probit regression model of their recognition
study of goodwill impairment. Similarly, Guler (2007: 22), in her recognition
study, found no significant relationship between debt ratio (measured as total
liabilities at the end of t-1 divided by total assets at the end of t-1) and
companies‘ decisions in recognising goodwill impairment losses. Nevertheless,
Guler (2007) does not provide a possible explanation for the non-significant
relationship between the two variables.
Moving away from US listed companies which implemented SFAS 142,
AbuGhazaleh et al. (2011) found leverage (DEBTRATIO) as non-significant in

108
explaining the decisions of the UK listed companies they analysed in
measuring goodwill impairment losses. Meanwhile, Omar and Mohd-Saleh
(2011) found leverage (DEBTRATIO) as marginally significant (at p-value less
than 0.10) in explaining the decisions of the Malaysian listed companies they
analysed in recognising goodwill impairment losses.
In this thesis, due to difficulties in obtaining data relating to actual debt
covenants38, as they are not made public, debt ratio (DEBTRATIO) has been
employed as a proxy for companies‘ closeness to the debt covenant violations
(see Section 2.3.1.2). Similar to AbuGhazaleh et al. (2011: 178), DEBTRATIO is
defined as total debts at the end of prior year, divided by total assets at the
end of prior year (see Appendix 1 of the thesis). In view of the inconclusive
evidence discussed above, no prediction sign is formed regarding the
relationship between companies‘ decisions in reporting goodwill impairment
losses and leverage (DEBTRATIO). Thus, the following hypothesis is developed
both in a null form and an alternate form:
H7-Null: Ceteris paribus, there is no significant association between
companies‘ decisions in reporting goodwill impairment losses and
leverage (DEBTRATIO).
H7-Alternative: Ceteris paribus, there is a significant association between
companies‘ decisions in reporting goodwill impairment losses and
leverage (DEBTRATIO).
Finding a significant negative association between companies‘ decisions in
reporting goodwill impairment losses and leverage (DEBTRATIO) would suggest
that the companies are exercising accounting choices related to goodwill
impairment in an attempt to avoid debt covenant violations.
38 According to a senior auditor of the PricewaterhouseCoopers who work in Malaysia, debt
covenants are in use in Malaysia, particularly for companies which obtained a large amount of loan from financial institutions. The covenants are usually stipulated in the loan agreement and they include certain conditions to be met which normally relates to company‘s annual performance. To illustrate, in the Notes to the Financial Statement of Axiata Group Berhad 2008, the group disclosed the following conditions of its debt covenants: ‗debt equity ratio of not more than 1.25; debt over EBITDA ratio of not more than 2.5; EBITDA over finance cost ratio of more than 5; and finance service coverage ratio of more than 1.2‖ (Axiata annual report 2008: Notes 15(e)(iv), page 217 – document retrieved on February 7, 2013, from http://axiata.listedcompany.com/misc/ar2008.pdf). It is noted that the debt equity ratio disclosed by Axiata Group Berhad is similar to those used in the US and the UK.

109
5.6 Opportunistic behaviour perspective
Four variables are employed to test the evidence of managerial opportunism
in reporting goodwill impairment. These are, change in CEO (∆CEOCurrent/prior)
(see Section 5.6.1), CEO tenure (see Section 5.6.2), big bath reporting (see
Section 5.6.3), and earnings smoothing (see Section 5.6.4).
5.6.1 Change in Chief Executive Officer (∆CEOCurrent/prior)
Change in CEO is employed by prior studies (e.g. Strong and Meyer, 1987;
Elliott and Shaw, 1988; Francis et al., 1996) to examine the behaviour of the
incoming CEOs in reducing reported earnings in the early year of their tenure,
for example, by taking large asset write-off (Fields et al., 2001: 269). The
argument raised by prior studies (e.g. Wells, 2002: 172; Riedl, 2004: 832;
Francis, 2008: 628; AbuGhazaleh et al., 2011: 175) is that because the
incoming CEO is not held responsible for the company‘s past performance, he
may have a tendency to take asset write-offs and goodwill impairment loss as
soon as joining a company, and thus attribute current loss to some aspects of
the preceding CEO‘s poor management.
An opportunistic behaviour perspective suggests that incoming CEOs may have
an incentive to take asset write-offs (including goodwill impairment losses) in
an attempt to protect their self-interests (Elliott and Shaw, 1988; Francis et
al., 1996; Riedl, 2004). Elliott and Shaw (1988), for example, explain that the
new CEOs are taking asset write-offs (including goodwill impairment losses) in
the first year of their tenure in order to reduce the benchmark against which
their future performance will be measured. At the same time, by incurring
large asset write-offs (including goodwill impairment losses) at an early stage
of their appointment, the incoming CEOs would be able to relieve future
earnings from these losses (Moore, 1973). As a result, they might be able to
report an improved earnings trend in the future (Moore, 1973) and hence
improve the investors‘ perceptions of the company‘s future performance
(Francis et al., 1996; Riedl, 2004). Following this line of argument, prior
studies analysing measurement (i.e. Zang, 2008; Lapointe-Antunes et al.,

110
2008; AbuGhazaleh et al., 2011) and recognition (i.e. Guler, 2007) of goodwill
impairment predict a positive association between change in CEO and
reporting goodwill impairment losses.
In the measurement study of goodwill impairment, using tobit regression,
Lapointe-Antunes et al. (2008: 48) and AbuGhazaleh et al. (2011: 190) found a
positive association between change in CEO and companies‘ decisions in
reporting goodwill impairment losses at p-values less than 0.05 and 0.10
respectively. In the recognition study of goodwill impairment, Guler (2007:
72) and Omar and Mohd-Saleh (2011) also observed a positive association
between companies‘ decisions in reporting goodwill impairment losses and
change in CEO. These studies interpret the finding of the positive association
between the two variables as managerial incentives playing an important role
in reporting goodwill impairment losses (e.g. Francis et al., 1996; Lapointe-
Antunes et al., 2008).
An alternative explanation to the positive association between reporting
goodwill impairment losses and change in CEO is because of the economic
factors of a company (Francis et al., 1996; Riedl, 2004). Murphy and
Zimmerman (1993) argue that companies would normally face poor earnings
performance prior to a change in CEO. Consequently, the newly appointed
CEO may take asset write-offs (including goodwill impairment losses) to mirror
the company‘s poor performance rather than behaving opportunistically
(Francis et al., 1996). If this is the case, it is viewed that the positive
association between the two variables would indicate compliance with the
accounting standard. Nevertheless, Riedl (2004) explains that to the extent
that the economic factors control for the underlying performance of the
companies, change in CEO may capture additional incentives for the incoming
CEOs to expedite future charges in the hope of improving investors‘
perceptions of the companies‘ future performances.
In this thesis, similar to AbuGhazaleh et al. (2011: 178), change in CEO
(∆CEOCurrent/prior) is said to occur when a company experiences a change in CEO
in the previous financial year or the current financial year. It is measured as a
dichotomous variable, equal to one if a company experienced the CEO

111
change, and zero otherwise (see Appendix 1 of the thesis). The following
hypothesis is developed both in a null form and an alternate form:
H8-Null: Ceteris paribus, there is no significant association between
companies‘ decisions in reporting goodwill impairment losses and
change in CEO which take place in the prior year or current year
(∆CEOCurrent/prior).
H8-Alternative: Ceteris paribus, there is a significant positive association
between companies‘ decisions in reporting goodwill impairment
losses and change in CEO which take place in the prior year or
current year (∆CEOCurrent/prior).
Finding a statistically significant positive association between change in CEO
(in H8) and companies‘ decisions in reporting goodwill impairment losses,
after controlling for the economic factors, would indicate that incoming CEOs
exercised accounting choices related to goodwill impairment losses. This view
is based on the above explanation given by Riedl (2004) that to the extent the
economic factors control for the underlying economic performance of the
companies, a change in CEO might capture additional incentives for the
incoming CEO to expedite future charges, with the aim of improving investors‘
perceptions of the companies‘ future performances.
A point for discussion is that AbuGhazaleh et al. (2011) assumes (not stated in
the study) that a CEO holds the highest position in a company. However, prior
studies analysing asset write-offs (i.e. Francis et al., 1996; Riedl, 2004) apply
no such assumption. Francis et al. (1996: 123), for example, define a change
in top management as ‗any of the top-three executive positions (Chairman of
the Board, CEO, or President)‘. However, Francis et al. (1996) and Riedl
(2004) provide no rationale for including any of these three positions.
Pourciau (1993: 324), in her investigation of earnings management associated
with non-routine executive changes, stated that the titles of top executives
vary among US listed companies. She exemplifies that in some companies, the
highest position in the office is held by the president, while in other
companies this position is subordinate to that of CEO (Pourciau, 1993: 324).

112
For this reason, Pourciau (1993: 324) considers the highest position in a
company to be a CEO, Chairman, or President.
In Malaysia, Gibson‘s (2003: 236) analysis of the effectiveness of corporate
governance of eight emerging market, including Malaysia, from 1993-1997
found variations in the title of the top management position. He (p. 236)
identifies that in Malaysia, this position can include CEO, President, Chief
Executive, Managing Director, or Chairman. For this reason, this thesis will
carry out a sensitivity analysis for change in CEO in order to assess whether
empirical results following a change in CEO would be sensitive to alternative
definition of CEO change, which included one of the five aforementioned
executive positions (see Section 8.5.2.1 for detail).
Another sensitivity analysis that will be conducted for change in CEO is to
assess whether the empirical results for a change in CEO would be sensitive to
specification of the year of CEO change. This is done by using two additional
definitions for the change in CEO. These are: (i) change in CEO occurring in
the previous year (t-1), and (ii) change in CEO occurring in the current year
(t). This sensitivity analysis will also be conducted for the top management
positions as discussed in the above paragraph (see Section 8.5.2.1 for detail).
5.6.2 CEO tenure (CEOTENURE)
CEO tenure is employed by prior studies (e.g. Beatty and Weber, 2006;
Ramanna and Watts, 2012) for testing the behaviour of existing CEOs. The
variable is employed as a proxy for whether the CEO was actually in place
when the goodwill being written off was first recognised (Beatty and Weber,
2006; Ramanna and Watts, 2012). As explained by Ramanna and Watts (2012:
752), CEOs with a longer tenure are more likely to have initiated the mergers
that generated the goodwill.
Ramanna and Watts (2012: 752) argue that CEOs with a longer tenure are less
likely to take goodwill impairment losses, in order to shield their reputations
from the implications of the write-off. This is because reporting goodwill
impairment losses would imply that the CEO has made costly business decision
(Beatty and Weber, 2006; Masters-Stout et al., 2008; Ramanna and Watts,

113
2012) or that they failed to achieve the promised synergies from the business
acquisition (Lapointe-Antunes et al. 2008: 41). Thus, the prior studies (e.g.
Beatty and Weber, 2006; Ramanna and Watts, 2012) hypothesise a negative
relationship between CEO tenure and companies‘ decisions in reporting
goodwill impairment losses. Their empirical results reveal a statistically
significant negative association between CEO tenure and companies‘ decisions
in reporting goodwill impairment losses (Beatty and Weber, 2006; Ramanna
and Watts, 2012). Ramanna and Watts (2012: 750) explain that in their study
although all of the companies analysed have ‗market indications39 of goodwill
impairment‘, CEOs with long tenure were less likely to take goodwill
impairment losses when compared to CEOs with a short tenure due concerns
about their reputation.
In the context of a developing economy, Gibson‘s (2003: 236) analysis of the
effectiveness of corporate governance of eight emerging market, including
Malaysia, from 1993-1997 observed that listed companies in Malaysia faced
the second highest CEO turnover rate. With high CEO turnover rate, it is
possible that Malaysian listed companies are concerned about their
reputations when making decisions on whether to report goodwill impairment
losses or zero goodwill impairment.
In this thesis, similar to Beatty and Weber (2006: 274), CEO tenure
(CEOTENURE) is defined as the number of years that the CEO has held the
position (see Appendix 1 of the thesis). Given the negative association
revealed by Beatty and Weber (2006) and Ramanna and Watts (2012), a
negative relationship is expected between CEO tenure (CEOTENURE) and
companies‘ decisions in reporting goodwill impairment losses. Thus, the
following hypothesis is developed both in a null form and an alternate form:
39 Ramanna and Watts (2012: 750-751) define market indications of goodwill impairment as
‗companies with market values that are greater than the book values of their net assets in t0 (i.e. 2003), and experienced book-to-market ratio greater than one for the next two consecutive years (t1 -2004, and t2 – 2005)‘.

114
H9-Null: Ceteris paribus, there is no significant association between
companies‘ decisions in reporting goodwill impairment losses and
CEO tenure (CEOTENURE).
H9-Alternative: Ceteris paribus, there is a significant negative association
between companies‘ decisions in reporting goodwill impairment
losses and CEO tenure (CEOTENURE).
H9-Alternative focuses on testing the accounting choice of reporting zero goodwill
impairment. Finding a statistically significant negative association between
CEO tenure (CEOTENURE) and the decisions of companies to report goodwill
impairment losses indicates that companies which have CEOs with a relatively
longer tenure are less likely to report goodwill impairment losses.
5.6.3 Big bath reporting (BATH)
Big bath reporting behaviour occurs when managers take actions which lead to
a large reduction in companies‘ earnings, especially when the earnings can
already be considered sufficiently bad (Kirschenheiter and Melumad, 2002:
762). Managers might engage in big bath reporting by taking a large amount of
asset write-offs (Zucca and Campbell, 1992: 35). In such cases, there can be
several incentives for taking the write-offs: to provide a signal that past
problems have been addressed (Alciatore et al., 1998: 29), to reduce earnings
and assets values in an attempt to avoid take over (Alciatore et al., 1998: 29),
or it may be that new CEOs are attempting to reduce the benchmark against
which future earnings will be judged (Alciatore et al., 1998: 29; Francis,
2008).
The big bath hypothesis implies managers taking higher than necessary
economic impairment during periods when their companies have a ‗larger
[negative pre-write-off] earnings surprise‘ (Riedl, 2004: 832; Guler, 200740;
AbuGhazaleh et al., 2011). Thus, prior studies analysing asset write-offs (e.g.
40 Instead of using the term larger [negative pre-write-off] earnings surprise, as applied by
Riedl (2004: 832), Guler (2007: 26) uses the term ‗unexpectedly low‘ pre-write-off earnings while AbuGhazaleh et al. (2011: 175) refer to it as ‗abnormally low‘ pre-write-off earnings.

115
Riedl, 2004: 832) and goodwill impairment (e.g. Guler, 2007: 17; AbuGhazaleh
et al, 2011: 174) predict a negative association between companies‘ decisions
in reporting asset write-offs inclusive of goodwill impairment losses and the
larger negative pre-write-off earnings surprise, in that the stronger the
downward trend in companies‘ pre-write-off earnings, the higher the
magnitude of goodwill impairment losses reported.
For the recognition study of goodwill impairment, using logistic regression,
Guler (2007: 26 and 72) found no statistically significant difference between
companies‘ decisions in recognising goodwill impairment losses and the larger
negative pre-write-off earnings surprise. Nonetheless, for the measurement
study of goodwill impairment, the tobit regression analysis carried out by
Guler (2007: 73) and AbuGhazaleh et al. (2011: 190) in their measurement
studies, provided support to the big bath hypothesis, finding a negative
association between the magnitude of goodwill impairment losses and the
larger negative pre-write-off earnings surprise.
This thesis follows Riedl (2004: 829) and AbuGhazaleh et al. (2011: 178), in
that larger negative pre-write-off earnings surprise (BATH) is defined as
change in a company‘s pre-write-off earnings from prior period to current
period, divided by total assets at the end of prior period, when this change is
below the median of non-zero negative values of this variable, and zero
otherwise. The pre-write-off earnings refer to net income before
extraordinary items or preferred dividends after adding back goodwill
impairment losses (see Appendix 1 of the thesis).
The following hypothesis is formulated both in a null form and an alternate
form:
H10-Null: Ceteris paribus, there is no significant association between
companies‘ decisions in reporting goodwill impairment losses and
larger negative pre-write-off earnings surprise (BATH).
H10-Alternative: Ceteris paribus, there is a significant negative association
between companies‘ decisions in reporting goodwill impairment
losses and larger negative pre-write-off earnings surprise (BATH).

116
H10-Alternative focuses on testing the accounting choice of reporting goodwill
impairment losses. Finding a statistically significant negative association
between companies‘ decisions in reporting goodwill impairment losses and
BATH in H10-Alternative, suggests managers exercise an accounting choice by
taking large goodwill impairment losses for big bath motivation. This view is
based on the explanation offered by Riedl (2004: 833) that, to the extent
economic factors [i.e. change in pre-write-off earnings (∆EARNINGS preGWIL) in
H3] control for the underlying economic performance of the companies, BATH
might capture any incremental effect relating to the big bath reporting
incentive.
Thus far, prior studies interpret the statistically significant result for BATH in
a negative direction, as predicted, in two competing ways. Firstly, given that
the change in pre-write-off earnings is negative, it implies that managers take
a big bath to reveal private information about the company‘s true value
(AbuGhazaleh et al., 2011: 194). Alternatively, seeing the negative change in
the pre-write-off earnings, managers are behaving opportunistically and thus
distorting the underlying economics of the company (Riedl, 2004: 833).
Similar to Riedl (2004: 833), this thesis considers that, to the extent the
change in pre-write-off earnings (one of the variables testing the economic
factors - see Section 5.4.2.3) control for the performance of the underlying
economic values of the assets, BATH (i.e. change in pre-write-off earnings
below the median of non-zero negative values) may capture incremental
effects relating to the big bath reporting incentives.
5.6.4 Earnings smoothing (SMOOTH)
Earnings smoothing involves a ‗reduction in earnings variability over a number
of periods, or, within a single period, as the movement towards an expected
level of reported earnings‘ (Beattie et al., 1994: 793). It is carried out by
managers in order to maintain a steady earnings growth (Zucca and Campbell,
1992: 35). Managers may smooth earnings where there exists concern about
their job security (DeFond and Park, 1997), hoping that the market will
equate smooth earnings with lower risk and thus higher stock values (Zucca

117
and Campbell, 1992: 35), or because management compensation plans are
designed to reward smooth earnings patterns (Zucca and Campbell, 1992: 35).
The earnings smoothing hypothesis suggests that managers take actions to
reduce the earnings variability when their companies face ‗larger [positive
pre-write-off] earnings surprise‘ (Riedl, 2004: 832). Thus, prior studies (e.g.
Francis et al., 1996; Guler, 2007; AbuGhazaleh et al., 2011) hypothesise a
positive association between companies‘ decisions in taking asset write-offs
inclusive of goodwill impairment losses and companies‘ larger positive pre-
write-off earnings surprise41. The multivariate analysis undertaken by Francis
et al. (1996: 124-125 and 127), Guler (2007: 72) and AbuGhazaleh et al.
(2011: 190) provided support to the earnings smoothing hypothesis finding a
positive association between companies‘ decisions in taking goodwill
impairment losses and the larger positive pre-write-off earnings surprise.
Similar to Riedl (2004: 829) and AbuGhazaleh et al. (2011: 178), in this thesis,
larger positive pre-write-off earnings surprise (SMOOTH) is defined as change
in a company‘s pre-write-off earnings from prior period to current period,
divided by total assets at the end of prior period, when this change is above
the median of non-zero positive values of this variable, and zero otherwise
(see Appendix 1 of the thesis). The pre-write-off earnings refer to net income
before extraordinary items or preferred dividends after adding back goodwill
impairment losses (see Appendix 1 of the thesis). The following hypothesis is
formulated both in a null form and an alternate form:
H11-Null: Ceteris paribus, there is no significant association between
companies‘ decisions in reporting goodwill impairment losses and
the larger positive pre-write-off earnings surprise (SMOOTH).
H11-Alternative: Ceteris paribus, there is a significant positive association
between companies‘ decisions in reporting goodwill impairment
losses and the larger positive pre-write-off earnings surprise
(SMOOTH).
41 Instead of using the term larger [positive pre-write-off] earnings surprise, as applied by
Riedl (2004: 832), Francis et al. (1996: 124) refer to it as ‗unexpectedly good performance‘, Guler (2007: 26) uses the term ‗unexpectedly high‘ pre-write-off earnings and AbuGhazaleh et al. (2011: 175) call it ‗abnormally high‘ pre-write-off earnings.

118
H11-Alternative focuses on testing the accounting choice of reporting goodwill
impairment losses. Finding a statistically significant positive association
between companies‘ decisions in reporting goodwill impairment losses and
SMOOTH in H11-Alternative, suggests managers are exercising an accounting choice
by taking goodwill impairment losses for the purposes of earnings smoothing.
5.7 Ownership structures
Two variables, i.e. managerial ownership (in Section 5.7.1) and outside
ownership concentration (in Section 5.7.2) are employed to test the influence
of companies‘ ownership structures on the measurement and the recognition
studies of goodwill impairment by Malaysian listed companies.
5.7.1 Managerial ownership (MANOWNLinear , and MANOWNNon-monotonic)
As discussed in Section 2.3.3, prior studies normally associate lower
managerial ownership with an increase in companies‘ contractual constraints,
which is often contain accounting-based restrictions (Warfield et al., 1995:
65). With low managerial ownership, managers might be encouraged to either
alleviate the accounting-based restriction or to capitalise on the incentives
available in the contracts (Warfield et al., 1995: 65). Following this line of
argument, prior studies analysing accounting method choice (e.g. Niehaus,
1989) and accounting choice manifested in discretionary accruals adjustment
(e.g. Warfield et al., 1995), argue that as managerial ownership increases,
their interests become closely aligned with those of outside shareholders,
which results in less motivation for the managers to be involved in wealth
transferring activities. Thus, a negative association is predicted between
managerial ownership and the accounting choice analysed (Niehaus, 1989;
Warfield et al., 1995). The empirical results of Warfield et al. (1995: 63)
supported their hypothesis, in finding a negative relationship between
managerial ownership and the discretionary accruals.
Apart from predicting the negative relationship as discussed above, there are
also studies which hypothesise a non-monotonic relationship between
managerial ownership and accounting method choice (e.g. Niehaus, 1989:

119
283), income smoothing (e.g. Carlson and Bathala, 1997) or discretionary
accruals as a proxy for earnings management (e.g. Teshima and Shuto, 2008:
115). These studies posit two effects of managerial ownership on their
dependent variable.
Firstly, as managerial ownership increases, the accounting method choice
decreases (Niehaus, 1989: 272). This is because when managers own shares,
their incentives become closely aligned with shareholders (Niehaus, 1989:
272; Carlson and Bathala, 1997: 181; Teshima and Shuto, 2008: 108).
Secondly, a high level of managerial ownership resulted in increased in
managerial discretion, and hence increase the accounting method choice
(Niehaus, 1989: 270). The reason is because it is difficult to discipline the
managers who hold large portion of companies‘ shares (Niehaus, 1989: 270;
Teshima and Shuto, 2008: 108). The combination of these two effects may
lead to a non-monotonic relationship between managerial ownership and
accounting method choice (Niehaus, 1989: 283). The empirical evidence
provided by Niehaus (1989: 283), Carlson and Bathala (1997: 193), and
Teshima and Shuto (2008: 107) provide support to the non-monotonic
relationship between management ownership and their dependent variable.
In this thesis, the influence of managerial ownership on companies‘ decisions
in reporting goodwill impairment losses is tested in two separate ways: (i) the
linear relationship, and (ii) the non-monotonic relationship. Following Ismail
and Weetman (2007: 521), managerial ownership (MANOWNLinear) is measured
as the number of ordinary shares held directly by executive directors divided
by total number of issued and paid up ordinary shares (see Appendix 1 of the
thesis). Shares held by independent non-executive directors are not included,
as these directors play a monitoring role, and are expected to limit any
managerial opportunism (Mohd Ghazali, 2004: 118). The following paragraphs
formulate the hypotheses for these two types of managerial ownership. As
there is a lack of prior studies related to goodwill impairment analysing
managerial ownership, no prediction sign is formed for these two hypotheses.
For the linear relationship (MANOWNLinear), the following hypothesis is
developed both in a null form and an alternate form:

120
H12A-Null: Ceteris paribus, there is no significant association between
companies‘ decisions in reporting goodwill impairment losses and
the managerial ownership (MANOWNLinear).
H12A-Alternative: Ceteris paribus, there is a significant association between
companies‘ decisions in reporting goodwill impairment losses and
the managerial ownership (MANOWNLinear).
For the non-monotonic relationship, the MANOWNLinear (discussed above) is
transformed into three categories as follows:
MANOWN1 = board ownership if board ownership < 0.05 = 0.05 if board ownership ≥ 0.05
MANOWN2 = 0 if board ownership < 0.05 = board ownership minus 0.05 if 0.05≤board ownership< 0.25 = 0.20 if board ownership ≥ 0.25
MANOWN3 = 0 if board ownership < 0.25 = board ownership minus 0.25 if board ownership ≥ 0.25
The hypothesis which is developed for the non-monotonic relationship
(MANOWNNon-monotonic) is as follows:
H12B-Null: Ceteris paribus, there is no significant association between
companies‘ decisions in reporting goodwill impairment losses and
the managerial ownership (MANOWNNon-monotonic).
H12B-Alternative: Ceteris paribus, there is a significant association between
companies‘ decisions in reporting goodwill impairment losses and
the managerial ownership (MANOWNNon-monotonic).
The idea of the non-monotonic relationship is motivated by Morck et al.
(1988) in their analysis of managerial ownership and companies‘ performance,
which is then adapted by others in their study of earnings management (e.g.
Teshima and Shuto, 2008), income smoothing (e.g. Carlson and Bathala,
1997), audit committee (e.g. Chau and Leung, 2010), and companies‘
performance (e.g. McConnell and Servaes, 1995). Similar to the prior studies,
in this thesis, these three variables (i.e. MANOWN1, MANOWN2, and

121
MANOWN3) attempt to illustrate that the relationship between managerial
ownership and reporting goodwill impairment differs at three different cut-off
points.
It is noted that there is an element of arbitrariness in the cut-off points of 5%
and 25%. Although these are the cut-off points employed by Morck et al.
(1988) in their analysis of US listed companies and later adapted by Chau and
Gray (2010) in their investigation of Hong Kong listed companies, academic
researchers (e.g. Morck et al., 1988: 298; Chau and Leung, 2006: 5)
acknowledge that there is no consensus in the literature on the appropriate
cut-off point. In Malaysia, the 5% cut-off point is in line with the Malaysian
Securities Commission under its Securities Industry (Reporting of substantial
shareholding) Regulations 1998 who considered substantial shareholding to be
an ownership stake of 5% (Ngee, 2010: 11). However, there is no specific rule
imposed by the Malaysian authorities which would dictate the choice of cut-
off point.
To assess whether the empirical result for managerial ownership would be
sensitive to the specification of a particular cut-off point, two other
breakpoints will be applied in the sensitivity analysis (see Section 8.5.2.2).
These are at 20% and at 30%. The 20% figure is adopted from Claessens et al.
(2000: 92-93) who, in their analysis of the separation of ownership and control
in nine East Asian countries, including Malaysia, apply the 20% rule in
considering whether there is a control42 right of a company due to a pyramid
structure. The 30% rule is applied by Morck et al. (1988) as part of a
sensitivity analysis. In this thesis, a breakpoint of 50% and more could not be
explored due to the small number of companies (i.e. 14 companies) with a
managerial ownership of 50% and more.
42 Claessens et al. (2000: 84) supported the cut-off point of 20% by bringing in the work of La Porta et al. (1999). Claessens et al. (2000: 84) stated that ‗through the use of pyramiding and management appointments, as well as through cross-ownership and the (infrequent) use of shares that have more votes, they [La Porta et al., 1999] documented that control of East Asian corporations can be achieved with significantly less than an absolute majority share of the stock, as the probability of being a single controlling owner through holding only 20% of the stock is very high (above 80% across the four East Asian countries).‘

122
5.7.2 Outside ownership concentration (OUTCON)
With regard to outside ownership concentration, prior studies analysing
accounting method choice hypothesise that when companies‘ ownership is
diffused, managers exercised greater discretion in choosing one accounting
method over another (Dhaliwal et al., 1982: 42; Niehaus, 1989: 269). This is
because when shareholders have a small stake in the companies, they have
less incentive for monitoring the managers‘ actions as the monitoring costs
outweigh the benefits (Niehaus, 1989: 271-272). However, as the
shareholders‘ ownership claims increase, the benefit of monitoring
management tends to outweigh the costs (Niehaus, 1989: 271-272). Thus,
these prior studies (e.g. Niehaus, 1989: 271-272; Astami and Tower, 2006: 8)
associate increased outside ownership concentration with an increase in
shareholder‘s monitoring of the management.
In line with the argument that increased outside ownership concentration
serves as a monitoring mechanism, which helps in mitigating incentive
problems, prior studies (i.e. Niehaus, 1989: 279; Astami and Tower, 2006: 8)
analysing accounting method choice expect increase in outside ownership
concentration to reduce managerial discretion. Thus, these studies
hypothesise a negative relationship between outside ownership concentration
and managerial discretion [stated in terms of an income-increasing accounting
method choice through the selection of FIFO in Niehaus (1989: 270); income-
increasing accounting policy choice in Astami and Tower (2006:1)]. The
empirical results documented by Niehaus (1989) and Astami and Tower (2006)
are consistent with their prediction. Using 344 US listed companies for the
financial year ended 1980, Niehaus (1989: 283) found that as outside
ownership concentration declined, managers are more likely to select FIFO
over LIFO as the former increases company‘s reported earnings. Investigating
442 annual reports in 2000/2001 for listed companies in the Asia Pacific region
(i.e. Australia, Hong Kong, Indonesia, Malaysia, and Singapore), Astami and
Tower (2006: 6) observed that companies‘ levels of ownership concentration
are negatively associated with the use of income-increasing accounting
method.

123
Nevertheless, Fan and Wong (2002: 405) argued that when shareholders obtain
a substantial portion of shares to the point at which they obtain an effective
control of the company, the nature of the agency problem shifted. Instead of
a conflict of interest between managers and shareholders, the conflict is now
between controlling owners and minority shareholders (Fan and Wong (2002:
405). Accordingly, it is possible that an increase in outside ownership
concentration can lead to an increase in managerial discretion by the
controlling owners at the expense of the minority shareholders (Shleifer and
Vishny, 1997: 760; Fan and Wong, 2002: 401-402).
In view of the two opposite arguments discussed above and the lack of prior
studies related to goodwill impairment examining the outside ownership
concentration, no prediction sign is formed regarding the relationship
between companies‘ decisions in reporting goodwill impairment losses and
outside ownership concentration (OUTCON). Similar to Niehaus (1989: 277),
outside ownership concentration (OUTCON) is measured as number of ordinary
shares held by outsiders with the five largest claims, divided by the total
number of issued and paid up ordinary shares. In this thesis, following Haniffa
and Hudaib (2006: 1042), outside shareholders43 refers to institutions,
blockholders, and other individuals outside the company (see Appendix 1 of
the thesis).
The following hypothesis is developed both in a null form and an alternate
form:
H13-Null: Ceteris paribus, there is no significant association between
companies‘ decisions in reporting goodwill impairment losses and
the outside ownership concentration (OUTCON)
43 Information concerning these shareholders is obtained from the statistics on shareholdings, provided by companies in their annual reports, whereby, Malaysian listed companies disclosed the name of the shareholders, the number of ordinary shares held, and the percentage of issued capital. In the case of nominee shareholders, the name of the nominee and the shareholders are disclosed. For example, in the annual report of Astral Supreme Berhad, the following information is disclosed ‗Mayban Nominees (Tempatan) Sdn. Bhd. pledged securities account for Cherng Chin Guan‘ (Astral Supreme Berhad, 2008: 67). From this list, the researcher then examines the annual reports to gauge the level of involvement which the investor (Cherng Chin Guan) has with the company.

124
H13-Alternative: Ceteris paribus, there is a significant association between
companies‘ decisions in reporting goodwill impairment losses and
the outside ownership concentration (OUTCON)
Finding a significant association for H13-Alternative suggests the influential role of
outside ownership concentration (OUTCON) on the measurement of goodwill
impairment.
5.8 Discretion available in performing an impairment test of goodwill
In performing an impairment test of goodwill, FRS 136 Impairment of Assets
allows managers to make judgements and estimates (Ernst and Young, 2007:
1), which Nobes (2006: 240) and Kvaal and Nobes (2010: 185) consider as
‗covert options‘ (see detailed discussion in Sections 4.4 to 4.4.2). The
managerial discretion investigated in this thesis includes the number of cash-
generating-units containing goodwill (CGUs) (see Section 5.8.1), and the
discount rates employed in estimating the recoverable amount of CGUs
containing goodwill (see Sections 5.8.2 to 5.8.2.3).
5.8.1 Cash-generating-units containing goodwill (CGUs01 and CGUsContinous)
The discussion and empirical evidence on managerial discretion with respect
to CGUs containing goodwill emanates largely from empirical studies analysing
how managers of US (i.e. Beatty and Weber, 2006; Guler, 2007; Ahmed and
Guler, 2007; Ramanna and Watts, 2012) and Canadian (i.e. Lapointe-Antunes
et al., 2008) listed companies make use of reporting units44 containing
goodwill.
44 For the purpose of an impairment test of goodwill, under IAS 36 (FRS 136 in Malaysia), goodwill is allocated to a CGU(s) while under US and Canadian GAAP, goodwill is allocated to a reporting unit. A CGU is the smallest identifiable group of assets that generates cash inflows that are largely independent of the cash inflows from other assets or groups of assets (IASB, 2006b: IAS 36, paragraph 6); a reporting unit is an operating segment or one level below an operating segment (Ernst and Young, 2010: 7). Accordingly, CGUs and reporting unit are two different basis of goodwill allocation (Ernst and Young, 2010: 7).

125
Prior studies (i.e. Beatty and Weber, 2006; Guler, 2007; Ramanna, 2008;
Ramanna and Watts, 2012) analysing the relationship between reporting units
and goodwill impairment losses argue that as the number of reporting unit
increases, it provides managers with greater flexibility in allocating goodwill.
This in turns increases the managerial discretion (Beatty and Weber, 2006;
Guler, 2007; Ramanna, 2008; Ramanna and Watts, 2012). These studies
rationalise that for companies with one reporting unit, managers are unable
to allocate the goodwill balance among various reporting units (Beatty and
Weber, 2006: 271; Guler, 2007: 24-25). Accordingly, the managers have fewer
avenues to opportunistically manage the allocation of goodwill (Guler, 2007:
24-25).
On the other hand, for companies with multiple reporting units, managers
have more choice in allocating the goodwill (Ramanna, 2008: 262; Ramanna
and Watts, 2012: 760). To accelerate goodwill impairment losses, the
managers could choose to allocate purchased goodwill to a low growth
reporting unit (Ramanna, 2008: 261). Alternatively, to avoid reporting
goodwill impairment losses, the managers could choose to allocate purchased
goodwill to a high growth reporting unit that has internally generated goodwill
(Roychowdhury and Watts, 2007: 30; Ramanna, 2008: 261; Ramanna and
Watts, 2012: 760). In this unit, subsequent goodwill impairment losses can be
masked by the internally generated goodwill (Ramanna and Watts, 2012: 760).
Thus, Ramanna (2008: 255) expects that as the number of reporting units
containing goodwill increases, managerial discretion increases.
Instead of expecting managers to behave opportunistically where there occurs
an increase in reporting units, Ahmed and Guler (2007: 4) argue that
managers of companies with multiple reporting units are able to perform
goodwill valuation more precisely. In this case, with more reporting units,
more goodwill impairment losses will be expected as the existing losses
cannot be netted against each other (Lapointe-Antunes et al., 2008: 44).
Therefore, with more reporting units, managers are able to reflect the
underlying economics of the companies (Guler, 2007: 51).
Applying similar arguments to the reporting units, AbuGhazaleh et al. (2011)
explore the managerial discretion with respect to CGUs containing goodwill of

126
UK listed companies implementing IFRS 3 from 2005-2006. They argue that
compared to companies with a single CGUs, companies with multiple CGUs are
expected to perform more impairment tests of goodwill (AbuGhazaleh et al.,
2011: 179). Consequently, these companies may report higher goodwill
impairment losses as the existing impairment losses cannot be netted against
one another (AbuGhazaleh et al., 2011: 179).
On the contrary, it is possible for managers of companies with multiple CGUs
to exploit the number of CGUs by accelerating, avoiding or understating
reporting goodwill impairment losses (AbuGhazaleh et al., 2011: 180). They
exemplify, to accelerate goodwill impairment losses, managers of companies
with multiple CGUs could allocate a large portion of the purchased goodwill to
CGUs that are anticipated to decline in value; to avoid or understate goodwill
impairment losses, the managers could allocate the purchased goodwill to
CGUs that are anticipated to rise in value (AbuGhazaleh et al., 2011: 180).
Because of the two different aspects of the argument, no prediction sign is
provided by AbuGhazaleh et al. (2011). Using a dichotomous variable, equal to
one when companies have more than one CGUs and zero otherwise,
AbuGhazaleh et al. (2011: 188) observed that the two variables are non-
significant in explaining the measurement of goodwill impairment by UK listed
companies (AbuGhazaleh et al., 2011: 190).
To compare the results of this thesis with the UK data, in the first stage of the
analysis (see Model 1 in Section 8.3.3), a dummy variable for the cash-
generating-unit (CGUs01) is employed. Similar to AbuGhazaleh et al. (2011:
178), the variable is defined as a dichotomous variable, equal to one if a
company has more than one CGUs at the end of the current period, and zero
otherwise (see Appendix 1 of the thesis). Accordingly, the following
hypothesis is developed both in a null form and an alternate form:
H14A-Null: Ceteris paribus, there is no significant association between
companies‘ decisions in reporting goodwill impairment losses and
the multiple CGUs goodwill (CGUs01).

127
H14A-Alternative: Ceteris paribus, there is a significant association between
companies‘ decisions in reporting goodwill impairment losses and
the multiple CGUs containing goodwill (CGUs01).
The limitation of using a dichotomous variable is that it leads to loss of
information (Farrington and Loeber, 2000: 103). It appears that by
dichotomising the CGUs, AbuGhazaleh et al. (2011) have treated all
companies with multiple CGUs as equivalent. They (p. 199) explain that the
CGUs is measured as a dichotomous variable because many of the UK listed
companies analysed do not disclose the number of CGUs - these companies
‗simply stating that goodwill is allocated to ―multiple‖ units‘.
To overcome the issue of dichotomisation discussed above, in the second
stage of the analysis (see Model 2 in Section 8.3.3), this thesis employs a
continuous variable (CGUsContinous) for the CGUs. Specifically, CGUsContinous is
defined as the actual number of CGUs containing goodwill disclosed in the
annual reports by Malaysian listed companies at the end of the current year
(see Appendix 1 of the thesis). However, to identify the number of CGUs
requires careful inspection of the companies‘ Notes to the Financial
Statement. This is where the semi-structure interviews conducted at the
beginning of the PhD are advantageous, as the interviews provide insight into
how companies identify their CGUs (see Section 3.2.5).
As there are no prior studies analysing the association between CGUsContinous
and reporting goodwill impairment losses, no prediction sign is provided in
this thesis. Thus, the following hypothesis is developed, both in a null form
and an alternate form:
H14B-Null: Ceteris paribus, there is no significant association between
companies‘ decisions in reporting goodwill impairment losses the
number of CGUs (CGUsContinous).
H14B-Alternative: Ceteris paribus, there is a significant association between
companies‘ decisions in reporting goodwill impairment losses and
the number of CGUs (CGUsContinous).

128
5.8.2 Discount rates employed in estimating the recoverable amount CGUs containing goodwill
The application of discount rates in estimating the recoverable amount of
assets including goodwill is one of the important factors in determining
whether there is any impairment charge (PricewaterhouseCoopers, 2008: 8)
(see detailed discussion in Section 4.4.2). It requires managers to exercise
judgement in which a change in the discount rate may have an impact on the
recoverable amount of the assets (PricewaterhouseCoopers, 2008: 3).
Prior studies of asset write-offs and goodwill impairment focusing on US and
Canadian listed companies do not examine whether the discount rates applied
by companies have any influence on their decisions to report goodwill
impairment losses. This is because (for these companies), goodwill valuation
is based on fair value instead of the recoverable amount. Because of the lack
studies analysing the discount rates in relation to companies‘ decisions in
reporting goodwill impairment losses, to analyse the issue of the discount
rates, the researcher has referred to the results of the disclosure studies
examining discount rates disclosed by companies which implement FRS 3.
Three of the key findings of these studies that relate to the discount rates,
and which are of interest to this thesis, are: (i) there is a wide span of
discount rates employed by listed companies (see Section 5.8.2.1), (ii) the
majority of companies employed a single discount rate on a blanket basis to
all CGUs (see Section 5.8.2.2), and (iii) there are companies which do not
disclose the discount rate employed (see Section 5.8.2.3).
5.8.2.1 Wide span of discount rates (DISCRATE)
Prior studies (Glaum et al., 2007: 9; Carlin and Finch, 2011) observed a wide
span of discount rates employed by listed companies. Glaum et al. (2007:9),
for example, found that the discount rates of 357 blue-chips companies from
17 European countries for financial year ended 2005 ranged from 4% to 34%,
with high proportion of companies applying a rate of between 7% and 9%.
Likewise, Carlin and Finch (2011) documented that the discount rates of the
200 large Australian listed companies with financial year ended 2006 which
they examined ranged from 5.7% to 40%, with a mean discount rate of 12.3%.

129
Carlin and Finch (2009) argued that companies may manipulate reported
earnings via the estimated discount rates. For example, to accelerate
goodwill impairment losses, companies may estimate very high discount rates;
to avoid reporting goodwill impairment loss, excessively low discount rates
will be selected (Carlin and Finch, 2009).
However, Gallery (2009: 337) opines that managers may select discount rates
which are specific to CGUs, and these discount rates could be excessively high
or low compared to the discount rates employed by other companies. Gallery
(2009) argue that the specific discount rates selected by managers are
because they attempt to signal the underlying value of the CGUs rather than
to manipulate reported earnings.
In view of the above discussion, this thesis attempts to explore the
relationship between companies‘ application of discount rates (DISCRATE) and
the decisions in reporting goodwill impairment losses. The discount rate
(DISCRATE) is defined as the percentage of discount rate employed by
companies in estimating the recoverable amount of CGUs containing goodwill
which is disclosed in the annual reports at the end of the current year (see
Appendix 1 of the thesis). Because there is no empirical evidence which has
tested this variable, no prediction sign is formed in the following hypothesis,
which is developed both in a null form and an alternate form:
H15A-Null: Ceteris paribus, there is no significant association between
companies‘ decisions in reporting goodwill impairment losses and
the percentage of discount rates employed (DISCRATE).
H15A-Alternative: Ceteris paribus, there is a significant association between
companies‘ decisions in reporting goodwill impairment losses and
the percentage of discount rates employed (DISCRATE).
5.8.2.2 Application of either a single discount rate or multiple discount rates (DISCMULTIPLE)
The second issue related to the discount rates revealed by the disclosure
study in relation to goodwill impairment is the application of either a single

130
discount rate or multiple discount rates to estimate the recoverable amount
of CGUs containing goodwill. Carlin et al. (2010a: 90-91), for example,
reported that of the 168 Singaporean listed companies which implement FRS
36 Impairment of Assets, more than half of the companies applied a single
explicit discount rate. A similar result is also found for Hong Kong listed
companies by Carlin et al (2010b: 15).
Given the large number of companies employing a single discount rate to
estimate the recoverable amount of CGUs containing goodwill (despite
companies having more than one CGU), it would be interesting to analyse
whether applying a single discount rate or multiple discount rates would
influence a company‘s decision to report goodwill impairment losses.
Application of either a single or multiple discount rates is defined as a
dichotomous variable, equal to one if a company applies multiple discount
rates, zero if the company applies a single discount rate at the end of the
current year (see Appendix 1 of the thesis). The following hypothesis is
developed both in a null form and an alternate form:
H15B-Null: Ceteris paribus, there is no significant association between
companies‘ decisions in reporting goodwill impairment losses and
the application of multiple discount rates (DISCMULTIPLE).
H15B-Alternative: Ceteris paribus, there is a significant association between
companies‘ decisions in reporting goodwill impairment losses and
the application of multiple discount rates (DISCMULTIPLE).
5.8.2.3 Discount rate – Disclosed/Not disclosed (DISCRATEDisclosed/Not)
Thus far, the only published study analysing the disclosure of goodwill
impairment after the implementation of FRS 3 in Malaysia is carried out by
Carlin et al. (2009: 91). Specifically, Carlin et al. (2009: 91) analyse the
disclosure of goodwill impairment by 36 listed companies in Malaysia for the
financial year ended December 2006. They found (p. 91) that of the 36 listed
companies examined, 40% of the companies do not disclose the discount
rates. The finding of Carlin et al. (2009: 91) leads the researcher to explore

131
whether a company‘s decision not to disclose the discount rate, has any
influence on their decisions with regard to reporting goodwill impairment
losses. To explore this issue, a dichotomous variable DISCRATEDisclosed/Not is
created, which is equal to one if a company does not discloses the discount
rate, and zero otherwise (see Appendix 1 of the thesis). The following
hypothesis is developed both in a null form and an alternate form:
H15C-Null: Ceteris paribus, there is no significant association between
companies‘ decisions in reporting goodwill impairment losses and
the decision not to disclose the discount rates
(DISCRATEDisclosed/Not).
H15C-Alternative: Ceteris paribus, there is a significant association between
companies‘ decisions in reporting goodwill impairment losses and
the decision not to disclose the discount rates
(DISCRATEDisclosed/Not).
Finding a significant association between companies‘ decisions in reporting
goodwill impairment losses and the decision not to disclose the discount rates
employed (DISCRATEDisclosed/Not) points to the possibility of accounting choices
related to goodwill impairment being exercised as these companies appear to
hide the discount rate that they employed in the estimation of the
recoverable amount of the CGUs containing goodwill.
5.9 Control variables
Four variables are included in this thesis to control for the effect of company-
specific factors (see Sections 5.9.1 to 5.9.4).
5.9.1 Size of company (SIZE)
SIZE variable is included to control for any differential size effects on
companies‘ decisions in reporting goodwill impairment losses. Prior studies
suggested that large companies might receive more public exposure, e.g.
through a high level of scrutiny from analysts (Guler, 2007; Zang, 2008). As a

132
result, studies analysing companies‘ decisions in reporting goodwill
impairment losses argue that managers of large companies might be less likely
to manipulate reported earnings through reporting goodwill impairment losses
(Zang, 2008).
On the other hand, prior studies examining accounting method choice argue
that in an attempt to avoid political costs, managers of large companies have
greater incentives to reduce reported earnings by selecting an income-
decreasing accounting method (Lilien and Pastena, 1982: 158; Watts and
Zimmerman, 1990: 140; Jeter et al., 2008: 166). Applying this argument in the
context of goodwill impairment losses, it is possible for large companies to
reduce reported earnings by taking large goodwill impairment losses. Thus, in
this case, increase in companies‘ size may lead to an increase in the
likelihood or magnitude of goodwill impairment losses reported.
The empirical evidence analysing companies‘ decisions in reporting goodwill
impairment losses and companies‘ size documented either a positive
association between the two variables (e.g. Francis et al., 1996: 125-126;
Beatty and Weber, 2006: 281; Guler, 2007: 73; Zang, 2008: 52; Omar and
Mohd-Saleh, 2011: 403) or no significant association (e.g. Ramanna and Watts,
2012; AbuGhazaleh et al., 2011: 190).
In this thesis, similar to AbuGhazaleh et al. (2011: 179), SIZE is defined as the
natural logarithm of total assets at the end of the prior period (see Appendix
1 of the thesis). In view of the mixed results discussed above, no prediction
sign is formed on the association between SIZE and companies‘ decisions in
reporting goodwill impairment losses. The following hypothesis is developed
both in a null form and an alternate form:
H16-Null: Ceteris paribus, there is no significant association between
companies‘ decisions in reporting goodwill impairment losses and
size of companies (SIZE).
H16-Alternative: Ceteris paribus, there is a significant association between
companies‘ decisions in reporting goodwill impairment losses and
size of companies (SIZE).

133
5.9.2 Types of industry (INDUSTRYG5)
Watts and Zimmerman (1990: 152) argue that accounting numbers are applied
in different ways across industries. Accordingly, differences in the
opportunities afforded to different types of industry might influence
accounting method choice (Watts and Zimmerman, 1990: 152). Industry
effects might include competition (Bens, 2006: 292) and deterioration within
an industry (Zang, 2008: 48). To control for the industry effect, this thesis
incorporates industry variable in the statistical model.
To date, empirical studies examining industry effect as a control variable
found no statistically significant association between companies‘ decisions in
reporting goodwill impairment losses and the industry variable (e.g. Beatty
and Weber, 2006; Zang, 2008; AbuGhazaleh et al., 2011: 195).
In this thesis, the industry variable is initially measured as a dummy variable
across 10 industry categories based on Datastream Industrial classification
level 2. However, due to the lack of data in five industries, this industry group
is reduced to five (see Section 8.2.2.3). The baseline for the INDUSTRYG5 is
Industrial and basic materials (see Appendix 1 of the thesis). Because of the
mixed evidence presented by prior studies, no prediction sign is formed on
the association between INDUSTRYG5 and their companies‘ decisions in
reporting goodwill impairment losses. The following hypothesis is developed
both in a null form and an alternate form:
H17-Null: Ceteris paribus, there is no significant association between
companies‘ decisions in reporting goodwill impairment losses and
industry (INDUSTRYG5).
H17-Alternative: Ceteris paribus, there is a significant association between
companies‘ decisions in reporting goodwill impairment losses and
industry (INDUSTRYG5).

134
5.9.3 Financial year-end (YEND)
Financial year-end45 dummy variable is created to control for the time period,
especially when this thesis investigates accounting choices related to goodwill
impairment covering a three year period beginning from the first year of the
implementation of FRS 3. DeAngelo (1988: 24), in her investigation of
accounting performance measures in 86 proxy contests of US listed
companies, explains that learning opportunities potentially affect the degree
of income manipulation. With time, outsiders have a chance to learn about
the scope of accounting discretion available to management (DeAngelo, 1988:
24).
Applying the argument of learning opportunities provided by DeAngelo (1988),
this thesis argues that within a three-year period, managers might have
opportunities to learn about the available degree of discretion in performing
an impairment test of goodwill. Alternatively, it might also provide learning
opportunities for auditors to learn about the available discretion exercised by
managers.
AbuGhazaleh et al. (2011: 179) control the two-year period in their study by
creating a year dummy variable for each financial year-end. Their empirical
result shows that the financial year-end of companies is non-significant in
explaining the measurement of goodwill impairment (p. 191).
In this thesis, a financial year-end dummy variable (YEND) is measured as a
dummy variable across three financial year-end categories (i.e. 2006, 2007,
and 2008) based on Datastream classification. The baseline for the YEND is
financial year ended 2006 (see Appendix 1 of the thesis). The following
hypothesis is developed both in a null form and an alternate form:
45 There is no statutory prescription of the date for a year end. Year ends vary from company to company in Malaysia as there are companies with December year-end and also companies with other than December year-end, such as February year-end (see Figure 6.1 in Section 6.3 for detailed description of the year ends).

135
H18-Null: Ceteris paribus, there is no significant association between
companies‘ decisions in reporting goodwill impairment losses and
their financial year-end (YEND).
H18-Alternative: Ceteris paribus, there is a significant association between
companies‘ decisions in reporting goodwill impairment losses and
their financial year-end (YEND).
5.9.4 Additions to goodwill (ADD)
AbuGhazaleh et al. (2011: 183) employ a dummy variable which captures any
additions to goodwill arising from business acquisition within the financial
year. They (p. 183) explain that the variable may proxy for merger and
acquisition activities carried out by companies. With an annual impairment
review of goodwill, companies which are involved in an acquisition that
creates goodwill are more likely to identify and write-off any overpayment
related to the acquisition (AbuGhazaleh et al., 2011: 183). Accordingly,
AbuGhazaleh et al. (2011: 190) predict a positive association between
companies‘ decisions in reporting goodwill impairment losses and additions to
goodwill. Their multivariate analysis reveals a statistically significant positive
association between the two variables at p-value less than 0.05 (AbuGhazaleh
et al., 2011: 190). Apart from AbuGhazaleh et al. (2011), none of the prior
studies analysing goodwill impairment has explored companies‘ additions to
goodwill.
Similar to AbuGhazaleh et al. (2011: 179), this thesis employs a dummy
variable which measure companies‘ additions to goodwill. The variable (ADD)
is defined as a dichotomous variable, equal to one if a company has additions
to its goodwill arising from business acquisitions during the financial year, and
zero if there is no addition (see Appendix 1 of the thesis). Following the
findings of AbuGhazaleh et al. (2011), this thesis predicts a positive
association between companies‘ decisions in reporting goodwill impairment
losses and the additions to its goodwill (ADD). The following hypothesis is
developed both in a null form and an alternate form:

136
H19-Null: Ceteris paribus, there is no significant association between
companies‘ decisions in reporting goodwill impairment losses and
additions to goodwill (ADD).
H19-Alternative: Ceteris paribus, there is a significant positive association
between companies‘ decisions in reporting goodwill impairment
losses and additions to goodwill (ADD).
5.10 Summary
This chapter has developed hypotheses to test both the measurement and the
recognition studies related to goodwill impairment exercised by Malaysian
listed companies after the implementation of FRS 3. The choice of these
hypotheses has been driven by several aims, namely to: compare Malaysian
findings with those of a prior study analysing UK data (i.e. AbuGhazaleh et
al., 2011); incorporate variables that capture the characteristics of listed
companies in Malaysia; include variables which are pertinent to understanding
the measurement of goodwill impairment but which are not tested by
AbuGhazaleh et al. (2011); and as part of the robustness test by replacing
EarningsPrior as employed by AbuGhazaleh et al. (2011) with
EarningsPreGWILcurrent and ∆EARNINGSpreGWIL (see Section 5.3).
The dependent variable for the measurement study is the magnitude of
goodwill impairment losses divided by prior year total assets (including
goodwill), and zero otherwise reported on the income statement (see Table
5.1 in Section 5.2). The dependent variable for the recognition study is a
dichotomous variable, equal to one when companies are considered as
exercising a recognition choice related to reporting zero goodwill impairment,
and zero otherwise.
To test the measurement and the recognition studies, factors potentially
influencing the accounting choices related to goodwill impairment are
grouped into six categories. These are: economic factors (see Section 5.4),
contracting perspective (see Section 5.5), opportunistic behaviour perspective
(see Section 5.6), ownership structures (see Section 5.7), and discretion

137
available in performing an impairment test of goodwill (see Section 5.8).
Company-specific factors are included as control variables (see Section 5.9).

138
Chapter 6: Research Design and Methods
6.1 Introduction
This chapter has three main purposes. Firstly, it discusses the methodological
position adopted by this thesis. Secondly, it describes the total population of
Malaysian listed companies which implemented FRS 3 in the first three years
of the standard taking effect (from 2006/7 to 2008/9), and discusses the
process of validating the Datastream source data. At the end of the
discussion, the final number of Malaysian listed companies which are available
for the analysis of accounting choices related to goodwill impairment is
specified. Thirdly, it outlines the research design and the statistical tests for
the three empirical chapters - disclosure, measurement, and recognition
studies of goodwill impairment.
This chapter is structured into ten sections including the introduction. Section
6.2 discusses the underlying methodological position of this thesis. Section 6.3
outlines the total population of Malaysian listed companies which
implemented FRS 3 from 2006/7 to 2008/9. Section 6.4 describes the
procedures involved in validating the Datastream source data. Section 6.5
describes the research design including the data specification and research
method for the disclosure study. Section 6.6 discusses the descriptive
statistics and various statistical tests for both the measurement and
recognition studies. Sections 6.7 and 6.8 discuss the multivariate analyses for
the measurement study and recognition study respectively. Section 6.9
describes the test statistics to be conducted in order to assess the goodness-
of-fit of the regression models for the measurement study and recognition
study. Section 6.10 summarises the chapter.
6.2 Methodological position
Burrell and Morgan (1979: 22) propose four paradigms for the analysis of social
theory. These are: radical humanist, radical structuralist, functionalist, and
interpretive. They (p. 1) argue that these paradigms are built upon different

139
sets of assumptions about the nature of social science and the nature of
society. In the terminology of Burrell and Morgan (1979), this thesis fits within
the functionalist paradigm. To Burrell and Morgan (1979: 22), the functionalist
paradigm is ‗rooted in the tradition of sociological positivism‘. Therefore, this
thesis takes a positivist research approach in analysing accounting choices
related to goodwill impairment by Malaysian listed companies. Before
discussing the rationale for adopting such approach, the following paragraphs
first discuss the four sets of assumptions related to ontology, epistemology,
human nature, and methodology, as underlined by Burrell and Morgan (1979),
and then explain how these assumptions are applied in this thesis.
Firstly, Burrell and Morgan (1979: 1) explain that assumptions of an
ontological nature relate to the very essence of the issue investigate. A basic
ontological question includes whether ‗reality‘, which is to be investigated is
external to the researcher, or is it a product of individual consciousness (ibid,
p.1). For positivists, their ontological assumption is that reality is external
and objective (Easterby-Smith et al., 2002: 28). In the context of this thesis,
the ontological approach is mainly based on objective information. The
primary source of information applied in the analysis of accounting choices
related to goodwill impairment by Malaysian listed companies are based on
factual data obtained from companies‘ annual reports and the Datastream
database.
Secondly, Burrell and Morgan (1979: 1) state that assumptions of
epistemological nature concern the ground of knowledge, i.e. how a
researcher begins to understand the world and convey this understanding as
knowledge to others. For positivists, their epistemological assumption is that
knowledge is only significant if it is based on observations of external reality
(Easterby-Smith et al., 2002: 28). With this epistemology, positivists attempt
to ‗explain and predict what happens in the social world by looking for
regularities and causal relationship between its constituents elements‘
(Burrell and Morgan, 1979: 5). They view the development of knowledge as a
cumulative process whereby new insights are added to the existing knowledge
and false hypotheses are eliminated (Burrell and Morgan, 1979: 5). This view
is in sharp contrast with anti-positivists, who see social world as relativistic by

140
its nature, and can only be understood from the perspective of individuals
who are directly involved with the issue under investigation (Burrell and
Morgan, 1979: 5). In the context of this thesis, it is the researcher‘s belief
that adopting the positivist approach does not in itself preclude perspectives
of individuals who are directly involved with the implementation decisions
related to reporting goodwill impairment. For this reason, information
gathered from semi-structured interviews with key personnel who were
involved with the implementation of FRS 3 assisted the researcher in the
collection of data (see Section 5.8.1) and in designing a specific research
setting (see Section 9.2.1), prior to the analysis of data using the positivist
approach.
Thirdly, according to Burrell and Morgan (1979: 1), assumptions of human
nature involve the relationship between human being and their environment,
i.e. how human beings respond to situations faced in the external world. Two
extreme perspectives of this model of human nature are discussed by Burrell
and Morgan (1979: 2), namely, determinism and voluntarism. From a
deterministic viewpoint, human beings and their experiences are seen as
products of the environment (ibid, p.2). On the other hand, advocates of
voluntarism see human beings as having free-will and creators of their
environment (ibid, p.2). This thesis neither supports the assumption of
determinism nor the idea of voluntarism. Instead, it takes a middle position
between these two perspectives by assuming that top managers of Malaysian
listed companies exercise some control over the corporate environment based
on their high position. However, due to the existence of regulatory bodies in
Malaysia, their control might be limited.
Burrell and Morgan (1979: 2) clarify that the three sets of assumptions related
to ontology, epistemology, and human nature have a direct implication of a
methodological nature. They (p. 2) elaborate that, with different ontologies,
epistemologies, and models of human nature, social scientists would have
different methodologies.
As noted earlier, a positivist research approach is adopted in analysing
accounting choices related to goodwill impairment by Malaysian listed
companies. The approach is considered appropriate as this thesis is concerned

141
with testing theory. With the positivist research approach, two perspectives
of accounting choice (i.e. the contracting perspective and the opportunistic
behaviour perspective) are outlined at the outset (in Chapter 2). Hypotheses
are then formulated (in Chapter 5) from these perspectives and the
characteristics of Malaysian listed companies (in Chapter 3) plus the discretion
related to impairment test of goodwill (such as CGUs and discount rates,
discussed in Chapter 4). Rigorous tests are conducted (in Chapters 8 and 9) in
an attempt to falsify these hypotheses through a large empirical observation.
An advantage of the positivist research approach is that by requiring a large
empirical observation, it allows a researcher to answer the ‗what‘ questions
which cover many situations (e.g. RQ 4: To what extent do the decisions of
Malaysian listed companies in measuring goodwill impairment indicate that
they reflect the underlying economic values of cash-generating-units
containing goodwill?; RQ 5: To what extent do the decisions of Malaysian
listed companies in measuring goodwill impairment support the contracting
perspective? – see Section 1.3 for detail). In addition, the positivist research
approach necessitates a clearly specified research method with well-defined
variables. This makes it easier for other researchers to replicate the study.
Therefore, claims made by the researcher can be publicly scrutinised. This
might be of relevance to standard setters, in particular the MASB and the
IASB, who might be interested to see the overall influence of the
implementation of (I)FRS 3 related to goodwill impairment. Moreover, this is a
practical approach due to the difficulties in getting access to top managers of
Malaysian listed companies (see Section 3.2.5).
6.3 Total population of Malaysian listed companies which implemented FRS 3 Business Combinations from 2006/7-2008/9
As noted in Section 4.2 (see Figure 4.1), in Malaysia, FRS 3 was effective for
listed companies with business combinations on or after January 1, 2006. This
thesis focuses on Malaysian listed companies which implemented FRS 3 for the
first three years of the standard taking effect. Figure 6.1 specifies the three-
year period of investigation with the respective dates of the business
combinations and companies‘ financial year-ends.

142
Data analysed in this thesis has been obtained from Datastream, and from
companies‘ annual reports, which are available at the website of Bursa
Malaysia (See Appendix 1 of the thesis for detailed of the data sources). To
identify companies which implemented FRS 3 in the first three years, these
companies must either have goodwill balances or reported goodwill
impairment losses, in any of the three years. Table 6.1 presents the total
number of companies which implemented FRS 3 within three-years of the
standard taking effect. The table shows that 556 companies implemented FRS
3 in the first year, 516 companies implemented FRS 3 in the second year, and
491 companies implemented FRS 3 in the third year. There are different
numbers of companies in different years because some companies have fully
impaired their goodwill or have goodwill balance for the first time in the year
of analysis. 381 companies were present throughout the three-year period of
investigation.
Figure 6.1: The first three years of the implementation of FRS 3
Financial year-end (FYE)
Date of business combinations
Year of FRS 3 implementation
December 2006
1/1/2006-31/12/2006
Initial year
From January to November 2007
Within the relevant financial year e.g. For FYE February 2007, the date of business combinations is from 1/2/2006-31/1/2007
Initial year
December 2007
1/1/2007-31/12/2007
Second year
From January to November 2008
Within the relevant financial year e.g. For FYE February 2008, the date of business combinations is from 1/2/2007-31/1/2008
Second year
December 2008
1/1/2008-31/12/2008
Third year
From January to November 2009
Within the relevant financial year e.g. For FYE February 2009, the date of business combinations is from 1/2/2008-31/1/2009
Third year

143
Table 6.1: Total number of companies available for analysis of accounting choices related to goodwill impairment for the first three years of the implementation of FRS 3
Panel A: Total no. of companies Initial year Second year Third year Total no. of firm-years
FYE-Dec-2006
FYE –From Jan. to
Nov. 2007
Total 2006/7
FYE -Dec-2007
FYE –From Jan. to
Nov. 2008
Total 2007/8
FYE -Dec-2008
FYE –From Jan. to
Nov. 2009
Total 2008/9
Companies which have goodwill balance at the end of the year or companies which reported goodwill impairment losses during the financial year
313
243
556
300
216
516
298
193
491
1563
Elimination causes:
Companies with no data for market capitalisation
8
0
8
4
2
6
1
0
1
15
Companies with no data on the book values of their net assets
1
0
1
0
5
5
6
0
6
12
Companies with no data for the prior year total assets
0 2 2 1 3 4 0 5 5 11
Companies with negative book value of net assets
9 6 15 2 1 3 5 1 6 24
Companies with no annual reports between 2006/7-2008/9
1 0 1 1 0 1 1 0 1 3
Final no. of companies 294 235 529 292 205 497 285 187 472 1498
Panel B: Partition into
Goodwill impairment losses 77 58 135 69 54 123 67 44 111 369
Zero goodwill impairment 217 177 394 223 151 374 218 143 361 1129
Total 294 235 529 292 205 497 285 187 472 1498

144
From the total population of companies meeting the eligibility criterion,
Table 6.1 indicates those that were excluded from the analysis due to a lack
of data on: the market capitalisation, the book values of the net assets, and
prior year total assets. Also, in the table, there were companies excluded
because of the negative book values of their net assets, and companies which
did not provide annual reports to Bursa Malaysia within the period of
investigation. The exclusion of these companies resulted in the total number
of companies available for analysis being reduced to 529, 497, and 472 in the
first, second and third year of the FRS 3 implementation respectively.
Unlike AbuGhazaleh et al. (2011: 184), the present study does not exclude
companies in the finance industry from the total population of companies
which implemented FRS 3. This approach of including the finance industry is
similar to the majority of studies analysing goodwill impairment by US listed
companies, such as Beatty and Weber (2006), Guler (2007), Lapointe-Antunes
et al. (2008), Zang (2008), and Ramanna and Watts (2012). More importantly,
this approach is adopted because, in Malaysia, there is no additional reporting
requirement regarding goodwill impairment imposed by the Central Bank of
Malaysia under its reporting guideline.
Table 6.1 shows that out of the total number of companies which
implemented FRS 3, less than 30% of them reported goodwill impairment
losses. For example, in the initial implementation year, 26% of the companies
(i.e. 135 out of 529 companies) reported goodwill impairment losses while the
remaining 74% of the companies (i.e. 394 out of 529 companies) reported zero
goodwill impairment. This large proportion of companies reporting zero
goodwill impairment is quite similar to the analysis of AbuGhazaleh et al.
(2011: 184), where 79% of the UK listed companies reported zero goodwill
impairment. The substantial number of observations with zero values observes
lead to a discussion of the tobit model (see Section 6.7.1) and the application
of random-effects tobit model (see Section 6.7.2) for the measurement study
of this thesis.

145
6.4 Validation of Datastream source data
The validation of Datastream source data is carried out with regards to two
main issues. These are: the accuracy of the amount of goodwill impairment
losses, and zero goodwill impairment recorded by Datastream (see Section
6.4.1), and the gap of information concerning the opening goodwill balance at
the initial year of the implementation of FRS 3 (see Section 6.4.2).
6.4.1 Accuracy of the amount of goodwill impairment recorded by Datastream
The accuracy of the amount of goodwill impairment losses and zero goodwill
impairment extracted from Datastream is validated by cross-checking these
figures with those contained in the annual reports. The direction of checking
is from Datastream to the annual reports.
For companies reporting goodwill impairment losses, the validation of data is
carried out for all of the 369 annual reports of companies which reported
goodwill impairment losses within the first three-year period of FRS 3
implementation (see Table 6.1). Of the 369 annual reports examined, 10
errors made by Datastream, were found in respect of different companies.
The errors were: goodwill impairment losses wrongly charged as other
impairment (two companies), other impairment wrongly treated as goodwill
impairment losses (one company), understated goodwill impairment losses
(two companies), and offsetting goodwill impairment losses with negative
goodwill (five companies).
For companies reporting zero goodwill impairment, the validation of data
recorded by Datastream was checked for 217 companies with the financial
year ended December 2006 and for 218 companies with the financial year
ended December 2008 (see Table 6.1). The financial year ended December
2006 is selected as it represents the first group of companies which
implemented FRS 3 for the first time in 2006. If there is any inaccuracy in the
figures recorded by Datastream, it would be likely to occur in this group. If
the inaccuracy of the figures recorded by Datastream is minimal in this group,
it is likely that a similar situation will also apply to other groups. Additionally,

146
to ensure Datastream recording of goodwill data is consistent over time,
companies which reported zero goodwill impairment in the financial year
ended December 2008 are also examined. With respect to the companies
reporting zero goodwill impairment, two errors were found in two different
companies. The errors made by Datastream were both due to wrongly
recorded goodwill impairment losses in a Datastream mnemonic assigned for
an intangible asset instead of Datastream mnemonic for goodwill impairment.
As a result these two companies are shown by Datastream to be reporting zero
goodwill impairment when in reality they have reported impairment losses.
All of the relevant data were adjusted and it was concluded that Datastream
was sufficiently reliable to continue using it.
6.4.2 Gap of information concerning the opening goodwill balance at the initial year of the implementation of FRS 3
Under IAS 22 Business Combinations (i.e. prior to the issuance of FRS 3
Business Combinations), any excess of the acquirer‘s interest in the fair
values of the identifiable assets and liabilities acquired over the cost of the
acquisition is recognised as negative goodwill (IASC, 2000: IAS 22, paragraph
5946). IAS 22 specifies that the negative goodwill should be presented as a
deduction from the assets in the same balance sheet classification as goodwill
(IASC, 2000: IAS 22, paragraph 64). When FRS 3 was implemented (i.e. in 2006
in Malaysia), the standard required the excess of acquirer‘s interest (i.e.
previously known as negative goodwill under IAS 22) to be recognised
immediately in profit or loss [MASB, 2006a: FRS 3, paragraph 56(b)]. To
achieve the transition from IAS 22 to FRS 3, companies were required to de-
recognise their previously recognised negative goodwill balances at the
beginning of the period by transferring them to equity (MASB 2006a: FRS3,
paragraph 81).
46 This study refers to IAS 22 instead of FRS 1222004 since FRS 1222004 does not deal with detailed treatment of accounting for goodwill or negative goodwill (MASB, 2004: FRS 1222004, paragraph 6).

147
An issue which materialises is that there was an information gap concerning
the opening goodwill balance at the initial year of the implementation of FRS
3 provided by Datastream. Datastream at the end of 2005 (i.e. the year
before the implementation of FRS 3) reported closing goodwill balance as per
IAS 22; Datastream at the end of 2006 (i.e. the first year of the FRS 3
implementation) reported closing goodwill balance as per the new FRS 3.
However, the database did not provide an opening goodwill balance in 2006
on the new basis.
It is important to assess the number of companies which were affected by this
gap in information provided by Datastream. This is because in the
measurement and recognition studies of goodwill impairment, one variable
(i.e. relative size of goodwill balance – GWB in H6, see detailed discussion in
Section 5.4.5) employs the opening goodwill balance. If the information gap
involves a large number of companies, the unadjusted opening goodwill
balance (based on the IAS 22) would lead to a misleading result for the
variable computed.
To identify the number of companies affected, all 294 companies with
financial year ended December 2006 (i.e. companies that implemented FRS 3
in the initial year) are selected for scrutiny (see Table 6.1). The examination
is done by comparing these companies‘ closing goodwill balances in 2005 (pre-
FRS 3), extracted from Datastream, with the opening goodwill balances in
2006 (post-FRS 3) as disclosed in the annual reports. The direction of checking
is from Datastream to the annual reports.
Of the 294 companies, seven companies had both positive and negative
goodwill balances in 2005, with five (from the 7) companies offsetting their
negative and positive goodwill balances. When Datastream recorded the
closing goodwill balance in 2005, it followed the companies‘ practices by
recording the net figure of goodwill balances for the five companies. As a
result, for these companies, their opening goodwill balances and opening total
assets in 2006 were incorrect. All of the incorrect figures for the five
companies were adjusted for the purpose of this study by excluding the
negative goodwill balances from the total balances. Due to the small number
of companies with incorrect opening goodwill balances (i.e. 1.7% or five of the

148
294 companies examined), it was concluded that Datastream was sufficiently
reliable to continue using, without further checking the 235 companies having
financial years ended from January to November 2007 (see Table 6.1).
The adjustments of goodwill data discussed in Sections 6.4.1 and 6.4.2 have
resulted in a minor amendment to Table 6.1 to give the breakdown of the
number of companies which reported zero goodwill impairment and goodwill
impairment losses (see Table 6.2).

149
Table 6.2: The final number of companies available for the analysis of accounting choices related to goodwill impairment in the first three years of the implementation of FRS 3
Initial year Second year Third year Total no.
of firm-years
FYE-Dec-2006
FYE –Between Jan. to
Nov. 2007
Total 2006/7
FYE -Dec-2007
FYE –Between Jan. to
Nov. 2008
Total 2007/8
FYE -Dec-2008
FYE –Between Jan. to
Nov. 2009
Total 2008/9
Goodwill impairment losses
77 58 135 70 531
123 67 44 111 369
Zero goodwill impairment
217 177 394 222 152 374 218 143 361 1129
Total 294 235 529 292 205 497 285 187 472 1498
Note:
FYE refers to financial year-end
1 The adjustments of goodwill data as discussed in Sections 6.4.1 and 6.4.2 have resulted in a minor change to the breakdown of the number of companies which reported zero goodwill impairment and goodwill impairment losses in the second year of the FRS 3 implementation. Nevertheless, as seen in Table 6.2, the total number of companies in each of the financial years remained the same. To illustrate, in the financial years ended between January and November 2008, the number of companies which reported goodwill impairment losses have been reduced from 54 companies (see Table 6.1) to 53 companies (see Table 6.2), the number of companies which reported zero goodwill impairment have been increased from 151 companies (see Table 6.1) to 152 companies (see Table 6.2).

150
6.5 Research design: Disclosure study of goodwill impairment
The purpose of the disclosure study is to explore, via the annual reports of
companies, types of accounting choice related to goodwill impairment
exercised by Malaysian listed companies after the implementation of FRS 3
(see Section 1.3). The exploration of the types of accounting choice is
conducted in two parts. Next, Sections 6.5.1 to 6.5.2 discuss the research
designs for these two parts.
6.5.1 Research design: Part one of the disclosure study
In exploring the types of accounting choice, as a starting point, the disclosure
study makes use of the market capitalisation indication (see Section 4.3) as
one of the potential drivers of goodwill impairment. The aim of the first part
of the disclosure study is to examine the appropriateness of the market
capitalisation indication as an indication that goodwill may be impaired (see
Research Question 2 in Section 1.3). The next sections, 6.4.1.1 to 6.4.1.2,
provide the data specification and research methods for this part.
6.5.1.1 Data specification
The first part of the disclosure study is carried out by comparing two types of
information, which represent the observed practice vs. stated explanation
(see Section 6.5.1.2). This comparison is carried out in two ways. Firstly, it is
performed across companies within one year of implementing FRS 3. From
Table 6.2, this covers 294 companies with financial year ended December
2006 and a further 235 companies with financial years ended between January
and November 2007. Secondly, the comparison is conducted on the same
companies over a period of two years. This includes 258 companies with data
available for the financial years ended December 2006 and December 2007. At
this point, the numbers of companies included in the analysis (i.e. 258
companies) do not tally with the number of companies shown in Table 6.2

151
(i.e. 294 companies for financial-year ended December 2006 with 292
companies for financial year ended December 2007) due to the exclusion of
companies with no pairs as they have either fully impaired the goodwill or
have goodwill balance for the first time in 2007.
6.5.1.2 Research method
In analysing the appropriateness of the market capitalisation indication as an
indication that goodwill may be impaired, the disclosure study compares two
types of information, which represent the observed practice vs. stated
explanation. The data compared are: (i) the market capitalisation indication
of companies (i.e. where market values are lower than the book values of net
assets at the balance sheet date), which is obtained from Datastream, and (ii)
reasons for companies reporting goodwill impairment (both zero, and goodwill
impairment losses) disclosed in the Notes to the Financial Statement (see
Section 1.4.1). The comparison of these two types of information (conducted
in the disclosure study – see Section 7.2) leads to observation of three groups
as follow:
Group 1 – Companies with poor disclosure, which do not provide
reasons for reporting goodwill impairment in the Notes to the Financial
Statement.
Group 2 – Companies whose market capitalisation indications conflicts
with their stated reasons for reporting goodwill impairment as disclosed
in the Notes to the Financial Statement.
Group 3 – Companies whose market capitalisation indications reflect
their stated reasons for reporting goodwill impairment as disclosed in
the Notes to the Financial Statement.
To determine whether the market capitalisation indication is an appropriate
proxy for an indication that goodwill may be impaired, the number of
companies in each of the three groups is computed. If the number of
companies in Group 3 greatly exceeds the other groups, this suggests that the
market capitalisation indication is an appropriate proxy as it reflects
companies‘ reasons for reporting goodwill impairment. Alternatively, if the

152
number of companies in Group 2 far exceeds other groups, this implies that
the market capitalisation indication is not an appropriate proxy.
6.5.2 Research design: Part two of the disclosure study
Following the results of the first part of the disclosure study, the second part
of the study is conducted. In this second part, the aim is to identify types of
accounting choice related to goodwill impairment exercised by Malaysian
listed companies after the implementation of FRS 3. Sections 6.5.2.1 to
6.5.2.2 provide the data specification and research method for this part.
6.5.2.1 Data specification
The constraint of manual data collection, limits the second part of the
disclosure study to 20 companies selected from the results of the first part of
the study. These 20 companies are from the Group 2 category (i.e.,
companies whose their market capitalisation indication conflicts with their
stated reasons for reporting goodwill impairment as disclosed in the Notes to
the Financial Statement) (see Section 6.5.1.2). FRS 136 requires companies to
disclose detailed information regarding material goodwill impairment losses
(MASB, 2006c: FRS 136, paragraph 130). Thus, the 20 companies selected are
those companies which reported goodwill impairment losses (companies which
reported zero goodwill impairment are excluded from the analysis). By
focusing on these companies, it is expected that there will be higher chances
for these companies to provide detailed disclosure, particularly if they
considered the impairment losses reported to be material.
6.5.2.2 Research method
To identify the types of accounting choice related to goodwill impairment
exercised by Malaysian listed companies, a disclosure framework is
constructed. As shown in Figure 6.2, the disclosure framework takes into
account six key items of data. The first item of information to be analysed is
the goodwill data. From this, a CGU containing goodwill that was impaired is
identified. Focusing on the CGU, the second item of information to be

153
analysed is the segment result of the CGU (obtained from segment reporting).
The segment result is included in the analysis in order to reflect the
performance of the CGUs (see Section 4.4.2). By incorporating this, the
disclosure study will be able to provide indirect empirical evidence on
whether it is possible to employ the segment result as an additional proxy for
an indication that goodwill may be impaired (see Section 7.3.3). The third key
item of data which is required is financial performance, including net income
(after adding back goodwill impairment loss) available to equity holders, and
basic earnings per share (EPS). The fourth item of information is the market
capitalisation indication. The fifth item of information is reasons for reporting
goodwill impairment loss disclosed in the Notes to the Financial Statement.
The last item of information is any comment in the audit report relating to
goodwill. All of the information required is obtained from annual reports.
Figure 6.2: A self-constructed disclosure framework for identifying types of accounting choice related to goodwill impairment exercised by
Malaysian listed companies
1. Goodwill data
(a) Opening goodwill balance (b) Additions47 (c) Miscellaneous – e.g. Dilution of equity interest in
subsidiaries (d) Goodwill impairment losses (e) Disposed (f) Closing goodwill balance (g) Allocation of goodwill to CGUs (h) Basis of recoverable amount (i) Accounting policy – Goodwill
2. Segment result (a) Number of segments (b) Segment result of an impaired goodwill
3. Financial performance (a) Net income (after adding back goodwill impairment loss)
available to equity holders (b) Basic EPS (cents)
4. The market capitalisation indication
Companies‘ market values lower than the book values of their net assets at the balance sheet date
5. Reasons for reporting goodwill impairment loss disclosed in
47 When companies disclosed detailed information concerning their newly acquired goodwill,
this information will also be analysed by the researcher [e.g. see Table 7.6(b)].

154
the Notes to the Financial Statement
6. Audit report – any comment concerning goodwill
To ensure consistency in collecting and analysing the data, the six key items
of data as shown in Figure 6.2 are compiled into a table for each of the 20
companies (for e.g. see Table 7.3 for an application of this disclosure
framework in one company). Using the tabulated information, an analysis will
be carried out in Chapter 7 for each of the 20 companies selected over several
years (depending on the traceability of goodwill impairment losses backward
from the write-off year to the acquisition year).
6.6 Statistical tests to be carried out for both the measurement and recognition studies of goodwill impairment
Statistical tests discuss in this section cover three aspects, namely,
descriptive statistics (in Section 6.6.1), missing value analysis (in Section
6.6.2), and detecting multicollinearity (in Section 6.6.3).
6.6.1 Descriptive statistics
The descriptive statistics discuss in this section include the normality test (see
Section 6.6.1.1) and univariate analysis (see Section 6.6.1.2). These
descriptive statistics are applied in the measurement study and recognition
study (see Section 1.3 for the specific research question developed for these
two studies).
6.6.1.1 Normality test
The normality test for the dependent variable of the measurement study is
conducted in two ways. Firstly, the skewness and kurtosis values of the
dependent variable are computed. According to Field (2005: 73), skewness of
+/- 1.96 and Kurtosis of +/- 3.29 are within the normality threshold. Secondly,
the Kolmogorov-Smirnov test and Shapiro-Wilk test are performed. For the
data to be normally distributed, the Kolmogorov-Smirnov test and Shapiro-

155
Wilk test carried out will produce a p-value which is non-significant, that is,
p-value greater than 0.05 (Pallant, 2001: 58). A significance of p-value less
than 0.05 suggests that the assumption of normality is violated (Pallant, 2001:
58).
6.6.1.2 Univariate analysis
To understand the distribution of data for each of the independent variables
and control variables, descriptive statistics such as mean, median and
standard deviation will be examined. The descriptive statistics will assist in
identifying whether the data is skewed and in detecting any variables that
suffer from high frequency of missing values.
In addition, univariate analysis will be conducted in order to evaluate the
relationship between each of the independent variables and the dependent
variable for the measurement study (see Section 8.2.2) and the recognition
study (see Section 9.2.2). Both parametric and non-parametric tests are
employed. For the parametric test, a t-test is employed, which assesses the
difference in the mean scores. For the non-parametric test, Mann-Whitney U
test is employed, which assesses the difference in the median score. For the
categorical variables, the Chi-square test of independence is applied. The Chi-
square test of independence examines the relationship between two
categorical variables (Tabachnick and Fidell, 2007: 58).
6.6.2 Missing values analysis
Tabachnick and Fidell (2007: 62-63) explain that there are three types of
missing value which could occur in any research. These are: missing
completely at random (MCAR), missing at random (MAR), and missing not at
random (MNAR). If the missing values are non-random, the generalisability of
results will be affected (Tabachnick and Fidell, 2007: 62).
To detect the type of missing values, missing values analysis is conducted (see
Sections 8.2.2.2, and 9.2.1). The analysis includes Little‘s MCAR test and

156
Separate Variance t tests. The Little‘s MCAR test is performed in order to see
whether the data are missing completely at random (Tabachnick and Fidell,
2007: 63). The null hypothesis for the Little‘s MCAR test is that the data are
missing completely at random (ibid., p. 63). If the test produces statistically
non-significant p-value (i.e. p-value greater than 0.05), the null hypothesis
cannot be rejected, hence the data are missing completely at random (ibid.,
p. 63). Alternatively, if the test generates a statistically significant result (i.e.
p-value less than 0.05), suggesting that the data are not missing completely at
random, Separate Variance t tests are carried out (ibid., p. 63).
The Separate Variance t tests aim to identify whether the missing value is
related to any other variables (ibid., p. 63). The test is performed by SPSS
only for variables with at least 5% of data missing (ibid., p. 63). Focusing on
each of the selected variables, the Separate Variance t tests define two
groups of cases, a group with missing value and another group with non-
missing value (ibid., p. 63). A test of mean differences between the two
groups is conducted in order to examine whether the two groups are different
from each other on a series of variables (both the dependent and independent
variables) (ibid., p. 63). If the t test shows that the missing values are related
to the dependent variable, then the missing values are inferred as non-
random (ibid., p. 63). On the other hand, if the missing value is predictable
from variables other than the dependent variable, the data are inferred as
missing at random (MAR) (ibid., p. 63).
6.6.3 Detecting multicollinearity
To examine the issue of multicollinearity between the independent variables,
Pearson‘s product-moment correlation coefficient test and Variance inflation
factor (VIF) are performed in the measurement study (see Section 8.3.2) and
the recognition study (see Section 9.3). As a rule of thumb, Gujarati and
Porter (2009: 338) suggest that a high pair-wise correlation coefficient
between two regressors, i.e. in excess of 0.8, indicates an issue of
multicollinearity. According to Gujarati and Porter (2009: 340) if the VIF of a
variable exceeds 10, the variable is said to be highly collinear.

157
6.7 Multivariate analysis to be carried out for the measurement study of goodwill impairment
Multivariate analysis evaluates the relationship of an independent variable to
both the dependent variable and other independent variables in one
regression model (Norusis 2000: 464). The multivariate analysis discusses in
this section covers two aspects – the tobit model (see Section 6.7.1) and the
random-effects tobit model (see Section 6.7.2).
6.7.1 Censored regression model: Tobit model and the random-effects tobit model
The dependent variable for the measurement study is the magnitude of
goodwill impairment losses divided by prior year total assets (including
goodwill), and zero otherwise reported on the income statement (see Table
5.1). This dependent variable possesses four characteristics. Firstly, it is
referred to as a limited dependent variable because its value is limited in its
range to non-negative values. Maddala (1996: 1) explains that a limited
dependent variable is a variable which is ‗limited in its range because of some
underlying stochastic choice mechanism‘. Secondly, from Table 6.2, it is
observed that the dependent variable comprises a substantial number of
observations with zero values. Thirdly, the remaining observations take on a
wide range of values above the limit. Finally, there are repeated
observations. These four characteristics of the dependent variable necessitate
the measurement study of this thesis to employ a censored regression model,
known as random-effects tobit model, with the censoring at zero value.
Section 6.7.2 discusses in detail the random-effects tobit model. However,
before discussing the random-effects tobit model in Section 6.7.2, a brief
discussion of the tobit model is presented in the following paragraphs.
The tobit model was first studied in economics by Tobin (1958) (Amemiya,
1984; Maddala, 1996: 151). The model is applied to a dependent variable with
the following three criteria: (i) the dependent variable has a lower or upper
limit, (ii) a substantial number of observations take on the limiting value, and
(iii) the remaining observations take on a wide range of value above (or

158
below) the limit (Tobin, 1958: 24; Amemiya, 1973; 998). Tobin (1958: 25)
explains that the concentration of observations at the limiting value resulted
in an application of Ordinary Least Square (OLS) being inappropriate, as the
assumption of linearity required in the OLS is not met (Tobin, 1958: 25).
Consequently, employing OLS leads to bias and inconsistent estimates of the
parameters (Gujarati and Sangeetha, 2007: 629).
The tobit regression model is estimated using the method of maximum
likelihood (Gujarati, 1995: 573). The maximum likelihood function consists of
two terms (Greene, 2008: 875). The first term is the non-censored
observations, which the maximum likelihood estimation treats in the same
way as a linear regression model (Greene, 2008: 875). The second term is the
censored observations with its value based on the probability of being
censored and using this value in the likelihood equation (Greene, 2008: 875).
6.7.2 Random-effects tobit model
As noted in Section 1.4.2, the measurement study tests the total population
of Malaysian listed companies which implemented FRS 3 in the first three
years of the standard taking effect. From Table 6.2, this includes 1498 firm-
years with 369 firm-years reporting goodwill impairment losses and 1129 firm-
years reporting zero goodwill impairment from 2006/7 to 2008/9. Of the total
companies which reported goodwill impairment losses within the three-year
period, 19 companies (or 57 firm-years) reported the impairment losses
repeatedly three times, 49 companies (or 98 firm-years) reported the
impairment losses twice, and the remaining 214 companies reported the
impairment losses once. The presence of the repeated impairers raises the
question of whether it is appropriate to run a pooled regression of all the 1498
firm-years (in the case of this study - the tobit model). Ward and Leigh (1993:
646) argue that to run a single regression on the pooled observations with
repeated observations lead to regression estimates that may be biased. They
(p. 646) reason that this approach does not recognise that some observations
are not independent. Consequently, they opine the test of significance may
produce unreliable findings (Ward and Leigh, 1993: 646). In addition, by

159
pooling of time series and cross-sectional observations, there are implicit
assumptions that the regression parameters (i.e. intercepts and slope
coefficients) are constant over time and that these do not differ between
numerous cross-sectional units (Gujarati, 1995: 524). Therefore, pooling of
data does not allow heterogeneity across units (Baum, 2006: 220).
Two solutions to this problem of pooling time series and cross-sectional
observations have been proposed by prior studies, namely, a fixed-effects
model and a random-effects model (Ward and Leigh, 1993: 647; Gujarati and
Sangeetha, 2007: 666). In the case of a limited dependent variable, the
estimation techniques which are required to address the issue of pooled data
are a fixed-effects tobit and a random-effects tobit (Honore et al., 2008: 394
and 399). The fixed-effects model relaxes the assumption that the regression
parameters are constant over time and space (Baum, 2006: 221). It allows
each cross-sectional unit to have its own intercept while the slope of the
coefficients remains constant across companies (Baum, 2006: 221). Therefore,
the fixed-effects model considers the individual-specific intercept as the
fixed-effects of that unit (Baum, 2006: 222).
Similar to the fixed-effects model, the random-effects model also allows for
heterogeneity across units (Baum, 2006: 219). However, unlike the fixed-
effects model which allows individual heterogeneity (unobserved individual
effects) to be correlated with the included variables (Greene, 2008: 200), the
random-effects model specifies the individual heterogeneity as a random
draw that is uncorrelated with all explanatory variables (Wooldridge, 2009:
485). Therefore, the random-effects model treats the individual
heterogeneity as purely random across cross-sectional units. When the
unobserved individual effects are not correlated with everything else in the
model, the individual-level effects are parameterized as additional random
disturbances (Baum, 2006: 220). Hence, in the random-effects model, the
individual heterogeneity is captured in the composite-error term (a
combination of the individual-level effect and the disturbance term) (Baum,
2006: 220 and 227).

160
As noted in Section 6.7.1, in the measurement study of this thesis, a pooled
regression using the random-effects tobit will be employed. The random-
effects model is selected instead of the fixed-effects model because
according to Gujarati (2003: 642), to perform the fixed-effects model would
require an inclusion of dummy variables for each of the observations (minus
one to avoid the dummy trap). In the case of the measurement study of this
thesis, the number of observation is large while the number of years to be
analysed is small (i.e. maximum of three years). Thus, the application of the
fixed-effects model would require a large number of dummy variables.
Gujarati (2003: 646) explains that too many dummy variables may lead to loss
of many degrees of freedom, and the possibility of multicollinearity. These
problems may create difficulty in generating precise estimation of one or
more parameters (Gujarati, 2003: 646). Hence, the fixed-effects model is not
practical for pooled data with many cross-sectional observations (Wooldridge,
2009: 485). Therefore, using a random-effects tobit model, the measurement
study of this thesis estimates the likelihood of reporting goodwill impairment
and the extent (i.e. intensity) of goodwill impairment losses divided by prior
year total assets reported.
See Section 8.3.1 for an overall regression model for the measurement study
and Table 8.3 in Section 8.3.3 for the detailed model specifications.
6.8 Multivariate analysis to be carried out for the recognition study of goodwill impairment
The dependent variable for the recognition study is a dichotomous variable,
equal to one when companies are considered as exercising a recognition
choice related to reporting zero goodwill impairment, and zero otherwise (see
Table 5.1). The binary nature of this dependent variable has led to the
application of a binary logistic regression in the recognition study of this
thesis. Logistic regression is a multiple regression with a dependent variable
that is a categorical dichotomy and independent variables that are continuous
or categorical (Field, 2005: 218). When the dependent variable is
dichotomous, the assumption of linearity is normally violated (Field, 2005:
220). Thus, the Ordinary least squares (OLS) regression, which assumes that
161
the relationship between the dependent variable and the independent
variables is linear, cannot be applied (Field, 2005: 220). Menard (1995: 6-7)
argues that applying an OLS when the dependent variable is dichotomous may
lead to the predicted values for the dependent variable being higher or lower
than the possible values of zero and one (p. 6). This then resulted in the issue
of heteroskedasticity (p. 7). Also, because the residuals are not normally
distributed, the use of OLS may lead to invalid results of the hypothesis
testing (Menard, 1995: 7).
According to Field (2005: 220), one solution to the non-linear relationship is to
transform the data using logarithmic transformation. This is the principle that
is applied in the logistic regression equation – it expresses the multiple linear
regression equation in logarithmic terms (Field, 2005: 220). By doing so, the
problem of violating the assumption of linearity is overcome (Field, 2005:
220). Therefore, using the logistic regression, the recognition study of this
thesis models the probability of recognition choice related to reporting zero
goodwill impairment by Malaysian listed companies which have their market
values lower than the book values of net assets for three consecutive years.
See Figure 9.4 in Section 9.3 for the detailed regression model of the
recognition study related to reporting zero goodwill impairment.
6.9 Goodness-of-fit of the regression models to be conducted on the measurement and recognition studies
A goodness-of-fit measure is a statistical summary which indicates the
accuracy with which a regression model approximates the observed data
(Maddala, 1996: 37). In the case of the measurement study of this thesis, the
overall goodness-of-fit of the random effects tobit model is assessed using the
log-likelihood and the overall Wald test (Baltagi, 2008: 345; Cameron and
Trivedi, 2009: 390). When the value of Wald is large and statistically
significant (p-value less than 0.05), the regression model constructed is
considered better than the null model (i.e. when all of the independent

162
variables and control variables are omitted) (Cameron and Trivedi, 2009: 390-
391).
For the recognition study, the overall goodness-of-fit of the logistic regression
model is assessed using -2 Log Likelihood, Hosmer-Lemeshow statistic, Cox
and Snell‘s R Square and Nagelkerke R Square. The -2 Log Likelihood
(commonly abbreviated as -2LL) evaluates the lack of fit of the logistic model,
which is based on the variation unexplained by the logistic regression model
(Menard, 2002: 21). The -2LL is analogous to the error sum of squares in linear
regression (Menard, 2002: 21). Larger values of -2LL indicates a significant
lack of fit for the logistic model (Menard, 2002: 21). Meanwhile, the Hosmer-
Lemeshow goodness-of-fit tests the null hypothesis that the model provides a
good fit to the data (Cary, 1995: 72). When the p-value of the Hosmer-
Lemeshow statistic is greater than 0.05, the null hypothesis cannot be
rejected, suggesting that the logistic regression model fits the data well
(Menard, 2010: 58). In addition, the Cox and Snell‘s R Square is based on the
log likelihood for the model compared to the log likelihood for a baseline
model, while the Nagelkerke R Square is an adjusted version of the Cox and
Snell R-square, that is an adjusted coefficient to cover the full range from
zero to one (Cary, 1995: 68).
6.10 Summary
This chapter has discussed the procedures involved in validating the
Datastream source data. It has also outlined the research design and research
methods required for the empirical chapters on disclosure, measurement, and
recognition studies of goodwill impairment.

163
Chapter 7: Disclosure Study of Goodwill Impairment - Results and Analysis
7.1 Introduction
The overall aim of this chapter is to explore, via the annual reports of
companies, types of accounting choice related to goodwill impairment
exercised by Malaysian listed companies after the implementation of FRS 3
(see Section 1.3). This disclosure study is intended to gain more insight into
the degree of discretion managers of Malaysian listed companies have in
reporting goodwill impairment after the implementation of FRS 3.
To accomplish this aim, the disclosure study is organised into two parts. The
first part of the disclosure study aims to examine the appropriateness of the
market capitalisation indication (i.e. companies‘ market values lower than
the book values of their net assets at the balance sheet date) as an indication
that goodwill may be impaired (see Section 7.2). Following from the findings
in the first part, the second part of the disclosure study aims to identify types
of accounting choice related to goodwill impairment exercised by Malaysian
listed companies after the implementation of FRS 3 (see Section 7.3).
Section 7.2 reports the findings and analysis of the first part; Section 7.3
discusses the results and analysis of the second part of the disclosure study.
Section 7.4 summarises and concludes the chapter.
7.2 Part one of the disclosure study: The appropriateness of the market capitalisation indication
The first part of the disclosure study addresses the following research
question (see Section 1.3):

164
Research Question 2:
To what extent is the market capitalisation indication (i.e. companies‘
market values lower than the book values of their net assets at the
balance sheet date) an appropriate proxy for an indication that goodwill
may be impaired?
The appropriateness of the market capitalisation indication as a proxy for an
indication that goodwill may be impaired (see Section 4.3 for detail) is
examined by comparing two types of information which represent the
observed practice vs. the stated explanation. The data compared are: (i) the
market capitalisation indication of companies (i.e. where market values are
lower than the book values of net assets at the balance sheet date), which is
obtained from Datastream, and (ii) reasons for companies reporting goodwill
impairment (both zero, and goodwill impairment losses) disclosed in the Notes
to the Financial Statement (see Section 6.5.1.2). The comparison of these two
types of information leads to observation of three groups as follow:
Group 1 – Companies with poor disclosure, as they do not provide
reasons for reporting goodwill impairment in the Notes to the Financial
Statement.
Group 2 – Companies whose market capitalisation indications conflict
with their stated reasons for reporting goodwill impairment as disclosed
in the Notes to the Financial Statement.
Group 3 – Companies whose market capitalisation indications reflect
their stated reasons for reporting goodwill impairment as disclosed in
the Notes to the Financial Statement.
The first part of the disclosure study is carried out in two ways. Firstly, the
analysis is performed across companies within one year of their implementing
FRS 3. This covers 294 companies with financial year ended December 2006
and a further 235 companies with financial years ended between January and
November 2007 (see Table 7.1). Secondly, the analysis is conducted on a
subset of companies over a period of two years. This covers 258 companies
with data available for the financial years ended December 2006 and
December 2007 (see Table 7.2) (see Section 6.5.1.1 for detailed discussion).

165
The first comparison provides the potential to identify a learning aspect
within the first year of operation. It is possible that those reporting later in
the first year learn from those reporting in the initial stage. The second
comparison helps to assess the relative disclosure of goodwill impairment over
time.

166
Table 7.1: The first part of the disclosure study conducted across companies within one year of implementing FRS 3
No. of companies
December-2006 Between January and November 2007
All GWIL(IL) 1 GWIL(0) All GWIL(IL) GWIL(0)
Panel A No Annual reports
12 4% 3 4% 9 4% 11 5% 4 7% 7 4%
Reason for reporting goodwill impairment not disclosed (Group 1)
93 32% 21 27% 72 33% 68 29% 20 34% 48 27%
Reason for reporting goodwill impairment disclosed (Groups 2 and 3)
189 64% 53 69% 136 63% 156 66% 34 59% 122 69%
Total 294 77 217 235 58 177
Panel B: Reasons Disclosed
No conflict between the market capitalisation indication and Notes to the Financial Statement (Group 3)
84 44% 33 62% 51 37% 83 53% 21 62% 62 51%
Conflict between the market capitalisation Indication and Notes to the Financial Statement (Group 2)
105 56% 20 38% 85 63% 73 47% 13 38% 60 49%
Total 189 53 136 156 34 122
1 GWIL(IL) denotes reporting goodwill impairment loss; GWIL(0) denotes reporting zero goodwill impairment.

167
Table 7.2: The first part of the disclosure study conducted on a subset of companies over a period of two years implementing FRS 3
No. of companies
December-2006 December-2007
All GWIL(IL) 1 GWIL(0) All GWIL(IL) GWIL(0)
Panel A No Annual reports
10 4% 2 4% 8 4% 3 1% 0 0% 3 2%
Reason for reporting goodwill impairment not disclosed (Group 1)
78 30% 6 12% 72 35% 49 19% 9 15% 40 20%
Reason for reporting goodwill impairment disclosed (Groups 2 and 3)
170 66% 43 84% 127 61% 206 80% 52 85% 154 78%
Total
258 51 207 258 61 197
Panel B: Reasons Disclosed No conflict between the market capitalisation indication and Notes to the Financial Statement (Group 3)
77 45% 28 65% 49 39% 93 45% 26 50% 67 44%
Conflict between the market capitalisation indication and Notes to the Financial Statement (Group 2)
93 55% 15 35% 78 61% 113 55% 26 50% 87 56%
Total 170 43 127 206 52 154
1 GWIL(IL) denotes reporting goodwill impairment loss; GWIL(0) denotes reporting zero goodwill impairment.

168
From Table 7.1 (panel A), it is observed that of the 294 total number of
companies with financial year ended December 2006, 4% of the companies (12
companies) do not provide annual reports. A closely similar situation is found
for companies with financial years ended between January and November
2007, whereby 5% of the companies (11 companies) have no annual reports
uploaded on the website of the Bursa Malaysia, or their own websites. These
companies are excluded from the analysis.
Table 7.1 (panel A) shows that out of the total number of companies with
financial year ended December 2006 (i.e. 294 companies), 32% (93 companies)
do not disclose their reasons for reporting either zero goodwill impairment or
goodwill impairment losses (companies in Group 1). For companies having
financial years ended between January and November 2007, the percentage
of companies falling into Group 1 is slightly lower (i.e. 29% or 68 companies)
than those companies having a December 2006 financial year-end. Table 7.2
(panel A) shows that the lack of disclosure reduces over time as the
proportion of companies which fall into Group 1 (i.e. poor disclosure)
decreases from 30% (in 2006) to 19% (in 2007). Perhaps, this reflects increased
understanding of the standard.
Groups 2 and 3 comprise those companies who disclosed their reasons for
reporting goodwill impairment in the Notes to the Financial Statement. For
Group 2, their disclosed reasons conflicted with the companies‘ market
capitalisation indication48. For companies with financial year ended December
2006, of the 189 companies that disclosed their reasons for reporting goodwill
impairment, 56% of the companies fall into Group 2 (see Panel B of Table7.1).
For companies with financial years ended between January and November
2007, the percentage of companies that fall into Group 2 is slightly lower
(47%) than the companies with the December year-end. The comparison of
companies in Group 2 over a period of two years shows similar result, in that
in both of the financial years ended December 2006 and 2007, 55% of
companies fall into Group 2 (see Panel B in Table 7.2).
48 For example, see Table 7.6(a) in Section 7.3.2.

169
For Group 3, companies‘ reasons for reporting goodwill impairment disclosed
in the Notes to the Financial Statement coincide with their market
capitalisation indication. Table 7.1 (panel B) shows that of the 189 companies
with financial year ended December 2006, 44% of the companies are classified
into Group 3. This proportion is slightly increase (53%) for companies with
financial years ended between January and November 2007. The comparison
of the proportion of total companies in Group 3 over time shows that similar
result (45%) is observed in both of the financial years ended December 2006
and 2007 (see Panel B in Table 7.2).
The findings that nearly equal proportions of companies are classified into
Groups 2 and 3 suggest that the companies‘ market capitalisation indication is
an appropriate proxy for goodwill impairment for approximately half of the
companies that disclosed their reasons; it is not an appropriate proxy for the
remaining half of the companies. Assuming that the disclosed reasons reflect
the true and fair view of the companies‘ goodwill reported on the balance
sheet as they have been audited, the findings for Groups 2 and 3 imply that
companies‘ market capitalisation indication is not an ideal proxy for an
indication that goodwill may be impaired. This is because for approximately
half of the companies that disclosed their reasons (i.e. companies in Group 2),
their market capitalisation indication does not fully reflect the condition of
the cash-generating-units containing goodwill, disclosed in the Notes to the
Financial Statement. Because market capitalisation indication is not an ideal
measure, this finding suggests that to identify types of accounting choice
related to goodwill impairment, further information, in addition to the
market capitalisation indication, is needed, such as companies‘ financial
performances and segment results containing goodwill.
7.3 Part two of the disclosure study: Types of accounting choice related to goodwill impairment
Part two of the disclosure study addresses the following research question
(see Section 1.3):

170
Research Question 3:
What are the types of accounting choice related to goodwill impairment
exercised by Malaysian listed companies which can be identified through
detailed analysis of annual reports?
This research question is addressed by selecting 20 companies from Group 2
(companies where their disclosed reasons conflicted with the market
capitalisation indication) and reported goodwill impairment losses (see
Section 6.5.2.1). Altogether, there are 59 companies which reported goodwill
impairment losses and are classified into Group 2 (i.e. 20 companies with
financial years ended December 2006, 13 companies with financial years
ended between January and November 2007 - see panel B of Tables 7.1, and
26 companies with financial years ended December 2007 – see panel B of
Table 7.2). Thus, the 20 companies selected represent one-third of all of the
companies which reported goodwill impairment losses and are classified into
Group 2.
These 20 companies comprise seven companies with financial years ended
December 2006, seven companies with financial years ended between January
and November 2007, and six companies with financial years ended December
2007. The 20 companies selected not only fall into Group 2 and have reported
goodwill impairment losses; they also have annual reports available
throughout the period of investigation. These criteria are imposed because in
order to identify the types of accounting choice related to goodwill
impairment exercised, the researcher has to trace the goodwill impairment
losses back from the write-off year to the acquisition year (i.e. the year the
goodwill was acquired). Consequently, the number of years analysed varies
for each of the companies. As an illustration, the analysis of goodwill
movement for ABC349 Bhd stretches over six years from 2003 to 2008 (see
Table 7.5 in Section 7.3.1) whereas for DEF1 Bhd, it is spread over two years
from 2007 to 2008 (see Table 7.6(a) in Section 7.3.2).
49 In this thesis, the name of companies are anonymised because of the critical comments
made about them, which could be price sensitive if quoted out of context of the thesis.
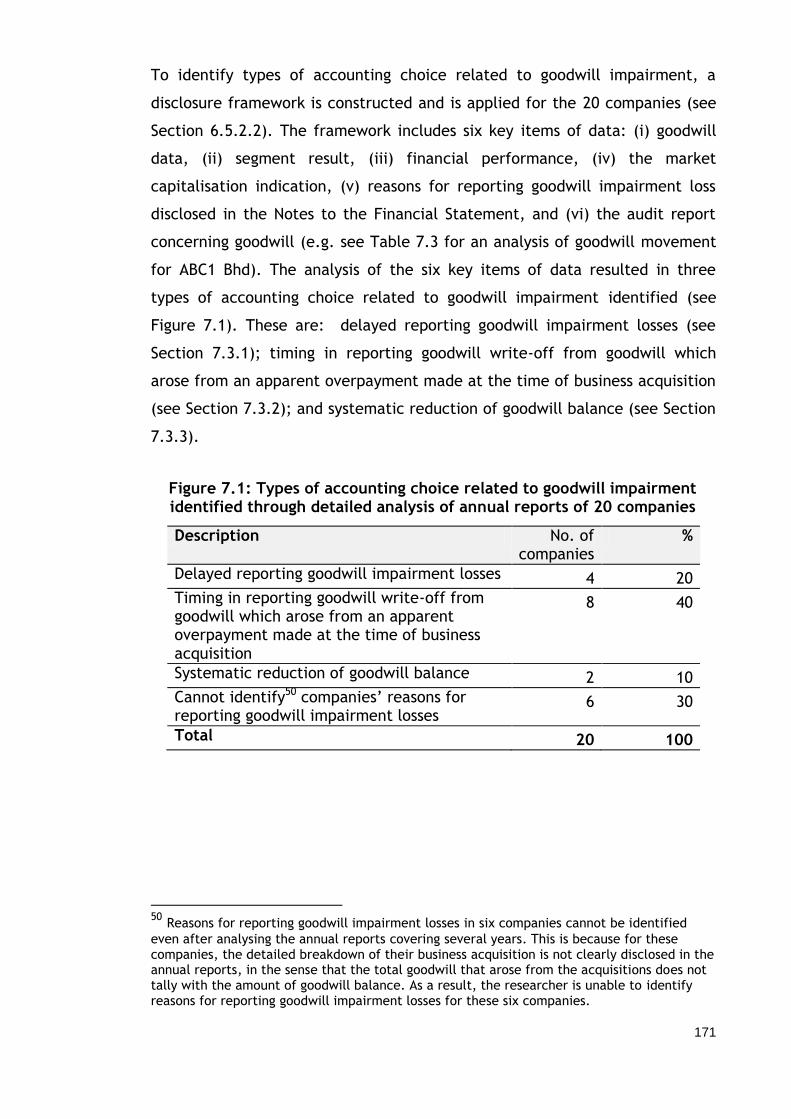
171
To identify types of accounting choice related to goodwill impairment, a
disclosure framework is constructed and is applied for the 20 companies (see
Section 6.5.2.2). The framework includes six key items of data: (i) goodwill
data, (ii) segment result, (iii) financial performance, (iv) the market
capitalisation indication, (v) reasons for reporting goodwill impairment loss
disclosed in the Notes to the Financial Statement, and (vi) the audit report
concerning goodwill (e.g. see Table 7.3 for an analysis of goodwill movement
for ABC1 Bhd). The analysis of the six key items of data resulted in three
types of accounting choice related to goodwill impairment identified (see
Figure 7.1). These are: delayed reporting goodwill impairment losses (see
Section 7.3.1); timing in reporting goodwill write-off from goodwill which
arose from an apparent overpayment made at the time of business acquisition
(see Section 7.3.2); and systematic reduction of goodwill balance (see Section
7.3.3).
Figure 7.1: Types of accounting choice related to goodwill impairment identified through detailed analysis of annual reports of 20 companies
Description No. of companies
%
Delayed reporting goodwill impairment losses
4
20
Timing in reporting goodwill write-off from goodwill which arose from an apparent overpayment made at the time of business acquisition
8
40
Systematic reduction of goodwill balance
2
10
Cannot identify50 companies‘ reasons for reporting goodwill impairment losses
6
30
Total
20
100
50 Reasons for reporting goodwill impairment losses in six companies cannot be identified
even after analysing the annual reports covering several years. This is because for these companies, the detailed breakdown of their business acquisition is not clearly disclosed in the annual reports, in the sense that the total goodwill that arose from the acquisitions does not tally with the amount of goodwill balance. As a result, the researcher is unable to identify reasons for reporting goodwill impairment losses for these six companies.

172
7.3.1 Delayed reporting goodwill impairment losses
Of the 20 companies analysed, four companies are found to delay reporting
goodwill impairment losses (see Figure 7.1). These companies are ABC1 Bhd,
ABC2 Bhd, ABC3 Bhd, and ABC4 Bhd. In this thesis, delay in reporting goodwill
impairment losses is said to occur when all three conditions are met: the
company‘s market value is lower than the book values of the net assets, the
segment to which goodwill is allocated has experienced a loss, and the
company‘s financial performance [measure as net income available to equity
holders (after adding back goodwill impairment losses)] is lower than that of
previous year. Yet in all the three conditions, managers do not report goodwill
impairment losses immediately in the income statement.
Of the four companies which were identified as delaying in reporting goodwill
impairment losses, three companies (i.e. ABC1 Bhd, ABC2 Bhd, and ABC3 Bhd)
will be discussed in this section. This is because each of these companies
illustrate additional issues for companies that delayed reporting goodwill
impairment losses. ABC4 Bhd is not discussed as its case is similar to that of
ABC1 Bhd. Tables 7.3 to 7.5 present the analyses of goodwill movement for
these three companies.
Table 7.3: Analysis of goodwill movement for ABC1 Bhd from 31 December 2003-2007
Pre-FRS 3 Post-FRS 3
Year 2003 2004 2005 2006 2007
1. Goodwill data
(a) Opening goodwill balance
- 587,872 587,872 589,88951 393,950
(b) Additions 587,872 - 109,196 - -
(c) Miscellaneous - - - - -
(d)Goodwill impairment losses
- - (109,196)52 (195,939) (393,950)
51 The company has restated its opening goodwill balance in 2006 from RM587,872 to RM589,889 without any information on the difference of RM2,017 disclosed in the Notes to the Financial Statement.
52 Goodwill impairment loss of RM109,196 is because of a subsidiary acquired [see item 1(b)], which created goodwill upon acquisition (Annual report, 2005: 62). Thus, this is a case of goodwill written-off immediately upon acquisition; it is not an impairment of goodwill which was acquired in 2003 [see item 1(b)] and not a case of delay in reporting goodwill write-off.

173
(e) Disposed - - - - -
2003 2004 2005 2006 2007
(f) Closing goodwill balance
587,872 587,872 587,872 393,950 -
(g) Allocation of goodwill to CGUs
Not stated Electrical and
mechanical engineering
(h) Basis of recoverable amount
Not stated Value in use
(i) Accounting policy -Goodwill
Purchased goodwill is stated at cost and not amortise
Annual impairment test of goodwill
2. Segment result
(a) Number of segments
3 3 3 3 3
(b)Segment result of an impaired goodwill (CGU – Elect. and Mechanical engineering)
4,505,161
4,098,834
(16,222,151)
(14,152,837)
408,468
3. Financial performance
(a) Net income (after adding back goodwill impairment loss) available to equity holders
11,220,000
(1,524,000)
(38,574,000)
(20,577,000)
4,013,000
(b) Basic EPS (cents)
70.12 (2.93) (74.39) (38.89) 5.01
4. The Market capitalisation
(MV1 vs. BV)
MV>BV
2.05
MV<BV
0.80
MV<BV
0.81
MV>BV
2.28
MV>BV
2.17
5. Reasons for reporting goodwill impairment losses disclosed in the Notes to the Financial Statement
2006
Reason for reporting goodwill impairment loss was not
disclosed (see ABC1 Bhd, 2006: 43).
2007
Goodwill is allocated to the Group‘s electrical and mechanical engineering division. The recoverable amount of the goodwill was based on its value in use, which was determined by discounting the future cash flows generated from the continuing use of the unit (ABC1 Bhd, 2007: 48).
6. Audit report concerning goodwill
2006 and 2007
Unqualified opinion (ABC1 Bhd, 2006: 24; 2007: 28).
Types of accounting choice identified
2006 and 2007
This is the case of delayed reporting goodwill impairment losses.
1
MV denotes companies‘ market values ; BV denotes book values of the net assets of companies

174
Table 7.3 shows that ABC1 Bhd acquired goodwill in 2003 amounted to
RM587,872 [see item 1(b)]. In 2004, the company‘s financial performance
declines (see item 3) with its net income available to common equity holders
(pre-goodwill impairment loss) reduces to negative RM1,524,000 and its basic
EPS falls to negative 2.93 cents. Likewise, the company‘s market values fall
below the book values of the net assets (see item 4). In 2005, at the end of
the third year of acquiring the goodwill, the decline in the company‘s
financial performance and its market value affected the segment reporting
containing goodwill (i.e. Electrical and mechanical engineering) [see item
2(b)].
Seeing that segment result is performing poorly with company‘s financial
performance deteriorates, and the company‘s market value falling below the
book value of the net assets for two consecutive years (2004 and 2005), it
would be expected that the company would report a goodwill impairment loss
in 2005. Nonetheless, goodwill which was acquired in 2003 was not impaired
in 2005. Instead, it was impaired partly (33%) in 2006 and partly (67%) in 2007
[see item 1(d)]. In these two years, the company‘s market values were higher
than the book values of the net assets and its financial performance was
better than the previous year. When the company reported a goodwill
impairment loss in 2006, its reason for reporting such a loss was not disclosed
in the Notes to the Financial Statement (see item 5). In 2007, although the
company disclosed its reason for the impairment loss (see item 5), the
disclosure lacked content, in the sense that there was no specific reason for
the impairment loss. The audit reports in 2006 and 2007 provided clean
opinions regarding the company‘s goodwill (see item 6).
From the analysis of goodwill movement from 2003 to 2007, presented in
Table 7.3, it appears that managers of ABC1 Bhd waited until the company‘s
performance was getting better than the previous year before reporting
goodwill impairment losses. Thus, the impairment losses reported by ABC1
Bhd in 2006 and 2007 are considered as delay in reporting goodwill
impairment.

175
Table 7.4 shows another case of a company, ABC2 Bhd that delayed reporting
goodwill impairment losses. This company acquired goodwill in 2003, yet in
2005, its segment reporting [see item 2(b)] and financial performances [see
item 3(a)] reported negative results. Similarly, the company‘s market value
fell below the book values of the net assets (see item 4). The company‘s poor
performances imply that it should have reported goodwill impairment loss in
2005. Yet, the amount of impairment loss reported was relatively small [i.e.
RM46,000 in 2005 compared to RM623,00 in 2007 - see item 1(d)]. The
company reported a larger amount of goodwill impairment loss in 2007 [see
item 1(d)] when its market value rose above the book value of the net assets
(see item 4) and its financial performance was better than that of the
previous year (see item 3). In 2007, when the company reported goodwill
impairment loss, the reason disclosed in the Notes to the Financial Statement
was that the impairment loss was based on the management assessment of
the future trends in the semiconductor division (see item 5). If the decision to
report goodwill impairment loss was based on the future trend of the
semiconductor division, no impairment should have been reported in 2007 as
the segment result for the division showed a positive amount both in 2007 and
2008 [see item 2(b)]. Item 6 shows that in 2007, the audit report provided
clean opinions regarding company‘s goodwill. Therefore, it is deduced that
the reporting of goodwill impairment loss by ABC2 Bhd in 2007 may be
regarded as delay in reporting goodwill impairment loss in 2005.
Table 7.4: Analysis of goodwill movement for ABC2 Bhd from 31 December 2003-2008
Pre-FRS 3 (RM’000) Post-FRS 3 (RM’000)
Year 2003 2004 2005 2006 2007 2008
1. Goodwill data
(a)Opening goodwill balance
- 63,916 5,755 5,709 5,709 5,088
(b) Additions 63,916 - - - 2 -
(c) Miscellaneous - Dilution of equity interest in subsidiaries
- (49,218) - - - -
(d) Goodwill impairment losses
- (8,943) (46) - (623) -
(e) Disposed - - - - - (762)
(f) Closing goodwill balance
63,916
5,755 5,709 5,709 5,088 4,326

176
(g) Allocation of goodwill to CGUs
Not stated Substantially to semiconductor division
(h) Basis of recoverable amount
Not stated VIU based on semiconductor‘s projected results and cash
flows
(i) Accounting policy - Goodwill
Goodwill is taken up in the balance
sheet as a permanent item
Goodwill is tested
annually for impairment
Goodwill is reviewed for impairment annually or more
frequently
2003 2004 2005 2006 2007 2008
2. Segment result
(a) Number of segments
7 6 4 4 4 5
(b) Segment result of an impaired goodwill - Semiconductor division
(10,388) 82 (14,960) 3,956 11,476 7,336
3. Financial performance
(a) Net income (after adding back goodwill impairment loss) available to equity holders
(11,207)
(9,029)
(41,519)
(60,752)
(3,608)
(1,392)
(b) Basic EPS (cents) (16.47) (17.00) (40) (58) (5) 0.9
4. The market capitalisation (MV vs. BV)
MV>BV
1.58
MV>BV
1.03
MV<BV
0.94
MV>BV
1.04
MV>BV
1.24
MV<BV
0.77
5. Reasons for reporting goodwill impairment losses disclosed in the Notes to the Financial Statement
2007: Goodwill is substantially allocated to the business of the semiconductor division. Goodwill impairment test was based on value in use and was determined by the management by assessing the semiconductor division‘s budget. The values assigned to the key assumptions used in preparing the budget represent management‘s assessment of future trends in the semiconductor division and are based on internal sources (historical data)( ABC2 Bhd, 2007: 50).
6. Audit report concerning goodwill
2007: Unqualified opinion (ABC2 Bhd, 2007:29).
Types of accounting choice identified
2007 Delayed reporting goodwill impairment loss
ABC2 Bhd brings in an additional case for companies that delayed reporting
goodwill impairment losses. Table 7.4 shows that in 2006, the company‘s
market value is higher than the book value of the net assets (see item 4). As
discussed in ABC1 Bhd, when the company‘s market value is above the book
value of the net assets, this is when the company reported goodwill
impairment loss that has become overdue. However, for ABC2 Bhd, there was
no goodwill impairment loss reported. There are two possible reasons for the
managers not to report goodwill impairment loss in 2006. Firstly, the

177
managers might perceived the increment in the market value above the book
value of the net asset to be small (i.e. the market value rises from 0.94 to
1.04 – see item 4). Secondly, the company‘s financial performance was still
not improving compared to its previous year (see item 3). The loss was worse
than that of the previous year. Hence, Table 7.4 illustrates that in deciding
when to report goodwill impairment loss that has become overdue, the
managers would wait for the increment in the market values above the book
values to be large, and for the company‘s financial performance to be better
than the previous year.
ABC3 Bhd is the third case of a company that delayed reporting goodwill
impairment loss. Table 7.5 shows that the company acquired goodwill
amounting to RM40,876 in 2004 [see item1(b)]. At the end of the year, the
segment to which the goodwill is allocated reported a negative result [see
item 2(b)]. Likewise, the company‘s market value fell below the book value of
the net asset (see item 4). The company‘s performance deteriorated in 2006
(see item 3). Within 2005 to 2006, ABC3 Bhd might have been expected to
report goodwill impairment losses, yet none were reported. In 2007, the
company‘s market value was greater than the book value of the net assets
and its financial performance improved compared to the previous year; in this
year, the company reported goodwill impairment loss amounting to
RM13,000,000 [see item 1(d)]. Again, in 2008, the same amount of goodwill
impairment loss was reported.
When the company reported goodwill impairment losses in 2007 and 2008, the
reason disclosed in the Notes to the Financial Statement (see item 5) was that
the impairment loss was based on the assessment of future trends in the bio-
healthcare industry (i.e. the CGU containing goodwill). If this is the case, the
company should have reported goodwill impairment loss from 2005 to 2006 as
the CGU was not performing in these years. Thus, ABC3 Bhd illustrates a
company delaying in reporting goodwill impairment losses. What is interesting
for ABC3 Bhd is that in 2008, the company disclosed the sensitivity analysis
(see item 5 for year 2008) stating that if the discount rates were to increase
by 2% or the future planned revenues were to reduce by 2%, an additional
goodwill impairment loss of RM14,876,000 would be recognised. It appears

178
that the company plan to fully impair its goodwill in the next year (i.e. 2009)
because by recognising goodwill impairment loss amounted to RM14,876,000,
the goodwill balance becomes nil [see item 1(f)]. ABC3 Bhd is added as part of
the discussion in this thesis because this company demonstrates that the
goodwill impairment losses reported were small and too late. On 7/5/2009,
the company was de-listed by Bursa Malaysia pursuant to Paragraph 8.15(6) of
the Listing Requirements (compliance with the shareholding spread
requirement due to take-over offer) (Bursa Malaysia, 200953). The case of
delay in reporting goodwill impairment losses for ABC3 Bhd has not captured
the external auditor‘s attention, as in the audit report for 2007 and 2008, the
auditors provided clean opinions regarding the company‘s goodwill (see item
6).
Table 7.5: Analysis of goodwill movement for ABC3 Bhd from 31 December 2003-2008
Pre-FRS 3 (RM’000) Post-FRS 3 (RM’000)
Year 2003 2004 2005 2006 2007 2008
1. Goodwill data
(a) Opening goodwill balance
400 402 40,876 40,876 40,876 27,876
(b) Additions 2 40,876 - - - -
(c) Miscellaneous - Dilution of equity interest in subsidiaries
- - - - - -
(d) Goodwill impairment losses
- (402) - - (13,000) (13,000)
(e) Disposed - - - - - -
(f) Closing goodwill balance 402 40,876 40,876 40,876 27,876 14,876
(g) Allocation of goodwill to CGUs
Not stated Not stated
Bio-healthcare
(h) Basis of recoverable amount
Not stated VIU VIU
(i) Accounting policy – Goodwill
Goodwill amortisa
tion
Impairment only approach
Annual impairment review
2. Segment result
(a) Number of segments 8 8 8 8 8 8
(b) Segment result of an impaired goodwill (CGU– Bio-healthcare)
-
(1,381)
(3,462)
(6,214)
(6,027)
(5,364)
3. Financial performance
(a) Net income (after adding back goodwill
5,807
18,293
4,962
(41,642)
(19,422)
15,835
53
Bursa Malaysia (2009), retrieved on November 5, 2011 from http://www.thgroup.com.my/News/070509.html

179
impairment loss) available to equity holders
2003 2004 2005 2006 2007 2008
(b) Basic EPS (cents) 1.63 4.83 1.28 (10.93) (8.39) 0.73
4. The market capitalisation (MV vs. BV)
MV>BV 1.22
MV<BV 0.83
MV<BV 0.63
MV<BV 0.79
MV>BV 1.26
MV>BV 1.04
5. Reasons for reporting goodwill impairment losses disclosed in the Notes to the Financial Statement
2007
Goodwill is allocated to the bio-healthcare division.
The impairment test was based on its value-in-use. The value-in-use calculation applies a discounted cash flow model using the bio-healthcare division‘s pre-tax cash flow projections based on financial forecasts covering a five-year period.
The values assigned to the key assumptions represent the Group‘s assessment of future trends in the bio-healthcare industry and are based on both external sources and internal sources (historical data) (ABC3 Bhd, 2007: 73).
2008
Company‘s reasons for reporting goodwill impairment loss is quite similar to the Notes to the Financial Statement as stated in 2007. Additional information concerning the sensitivity of the estimation made is disclosed as follows: ‗The estimates are particularly sensitive in respect
of the following:- 1. An increase of 2 per cent point in the discount rate used would have rendered an impairment loss of RM14,876,000. 2. A 2 per cent decrease in future planned revenues would have rendered an impairment loss of RM14,876,000 (ABC3 Bhd, 2008: 59)‘.
6. Audit report concerning goodwill
Unqualified opinion both in 2007 and 2008 (ABC3 Bhd, 2007: 43; 2008: 12-13).
Types of accounting choice identified
2007 and 2008
Delayed reporting goodwill impairment loss
All of the three companies discussed in this section (i.e. ABC1 Bhd, ABC2 Bhd,
and ABC3 Bhd) provide evidence of companies which delayed reporting
goodwill impairment losses. Such delayed reflect the exercise of managerial
discretion in terms of timing their reporting of impairment losses. This finding
is consistent with Hayn and Hughes (2006: 226), who find that goodwill write-
off of 1,276 acquisitions by US listed companies from 1988-1998, lag behind
the economic impairment of goodwill. However, in their study, the lag is
between three to four years. Hilton and O‘Brien (2009: 180) opine that one of

180
the reasons for companies to inflate the asset values (by not reporting the
impairment losses when they are due) is because of the desire to create an
‗illusion of financial strength‘. Perhaps, this is also what drives the three
companies discussed in this section to delay in reporting goodwill impairment
losses.
Following analysis of the three companies, discussed above, a scenario which
captures the accounting choice of delay in reporting goodwill impairment loss
is constructed (see Figure 7.2).
Figure 7.2: A scenario of companies that delayed reporting goodwill impairment losses
Selection criteria:
(i) In years 1 and 2 of the implementation of FRS 3, companies that have their
market values lower than the book values of their net assets, their change
in net income available to equity holders (pre goodwill impairment losses)
from prior year to current year is negative, and they reported zero
goodwill impairment.
(ii) In year 3, these companies have their market values greater than the book
values of their net assets, positive change in net income available to
equity holders (pre goodwill impairment losses) from the prior year to
current year, and they reported goodwill impairment losses.
These companies will be regarded as companies that delayed reporting
goodwill impairment losses. For the future study, these companies shall be
tested in year 3 against a control group of companies which also have their
market values greater than the book values of their net assets, and a positive
change in net income available to equity holders (pre-goodwill impairment
losses) from prior year to current year. However, this control group of
companies reported zero goodwill impairment.
As noted in Figure 7.2, Year 2 is included in the scenario in order to ensure
that the decline in the financial performance of companies is not temporary,
and to demonstrate that the managers waited for more than a year (i.e. years
1 and 2) before reporting goodwill impairment losses in the third year.

181
However, because only a small number of companies fulfilled the selection
criteria shown in Figure 7.2, this scenario is set aside for future study since
the number of companies which implement FRS 3 will increase with the
expansion of years of analysis.
7.3.2 Timing in reporting goodwill write-off from goodwill which arose from an apparent overpayment made at the time of business acquisition
Figure 7.1 (in Section 7.3) shows that of the 20 companies analysed, eight
companies were found to report goodwill impairment losses because of the
goodwill which arose from an apparent overpayment made at the time of
business acquisition. Hayn and Hughes (2006: 234) explained that
‗overpayment is more likely, the higher the proportion of the acquisition price
assigned to goodwill‘. Therefore, in this thesis, an apparent overpayment is
identified based on the significant amount of goodwill relative to the
acquisition price. In their study, Hayn and Hughes (2006: 241) found that for
the US listed companies that they examined, their goodwill balance, on
average, represented 58% of the acquisition price.
Of the eight companies that reported goodwill impairment losses as a result of
the apparent overpayment, only three of them will be discussed in this
section (see Tables 7.6 to 7.8). These three companies (i.e. DEF1 Bhd, DEF2
Bhd, and DEF3 Bhd) are selected to demonstrate three different timings in
reporting goodwill impairment losses arising from the apparent overpayment.
From Tables 7.6(b), 7.7(b) and 7.8(b) (see item 1), it is observed that for each
of the three companies, goodwill represents more than 65% of the acquisition
price.
Hayn and Hughes (2006: 233) consider overpayment by the acquiring company
as one of the characteristics of business acquisition that is associated with
goodwill impairment. Therefore, in the context of goodwill impairment, the
apparent overpayment itself is not an accounting choice. The accounting
choices related to goodwill impairment emerges when the managers decided

182
to fully impair the goodwill (i.e. the timing in reporting the impairment
losses). To illustrate, all of the three companies shown in Tables 7.6 to 7.8
have a significant amount of goodwill relative to acquisition price, and all of
them appear to plan to get rid of the apparent overpayment by reporting
goodwill impairment losses as soon as possible. DEF1 Bhd fully impaired the
goodwill immediately in the year of acquisition [see Table 7.6(a), item 1(b)
and (d)], DEF2 Bhd fully impaired the goodwill in the year subsequent to
acquisition [see Table 7.7(a), item 1(c) and 1(d) in 2007], and DEF3 Bhd
impaired the goodwill partially within a period of two years [see Table 7.8(a),
item 1(b) and (d)]. 57% of the goodwill was impaired in the year of acquisition
and the remaining 43% of the goodwill was impaired in the subsequent year
[see Table 7.8(b)].
Table 7.6(a): Analysis of goodwill movement for DEF1 Bhd from 31 December 2007-2008
Post-FRS 3
Year 2007 2008 1. Goodwill data (a) Opening goodwill balance 1,045,850 1,045,850
(b) Additions 1,635,192 7,705,039
(c) Miscellaneous - Dilution of equity interest in subsidiaries
-
(d) Goodwill impairment losses (1,635,192) (see Table 7.6b)
(603,788)
(e) Disposed - (f) Closing goodwill balance 1,045,850 8,147,101
(g) Allocation of goodwill to CGUs (i) Manpower consultancy, and (ii) Rig services.
(i) Manpower consultancy, (ii) Rig services, and (iii) Trading, maint.
(h) Basis of recoverable amount Value in use
(i) Accounting policy – Goodwill
Annual impairment review
2. Segment result (a) Number of segments 6 7
(b) Segment result of an impaired goodwill
- -
3. Financial performance
(a) Net income (after adding back goodwill impairment loss) available to equity holders
29,667,000 31,103,000
(b) Basic EPS (cents) 48.63 4.89
4. The market capitalisation (MV vs. BV)
MV>BV 2.47
MV<BV 0.71
5. Reasons for reporting goodwill impairment losses disclosed in the
2007 - The Group recognised goodwill

183
Notes to the Financial Statement impairment loss of RM1,635,192 during the financial year based on the discounted cash flows in arriving at the value in use (DEF1 Bhd, 2007: 97-98).
6. Audit report concerning goodwill Unqualified opinion (DEF1 Bhd, 2007:44).
Types of accounting choice identified
Timing in reporting goodwill write-off from goodwill which arose from an apparent overpayment made at the time of the business acquisition [see Table 7.6(b)].
Table 7.6(b): Detail analysis of an addition of goodwill for DEF1 Bhd - 31
December 2007
Date RM %
2007 Addition:
Group‘s share of net assets 91,464 5%
Item 1 Goodwill arising from acquisition 1,635,192 95%
Cost of acquisition 1,726,656
31/12/2007 Goodwill impairment 1,635,192 Fully impaired
Table 7.7(a): Analysis of goodwill movement for DEF2 Bhd from 31
December 2006-2007
Post-FRS 3
Year 2006 2007
1. Goodwill data
(a) Opening goodwill balance 3,524,072 2,808,856
(b) Additions 160,809 -
(c) Miscellaneous-Foreign exch. difference
- (443) See Table 7.7(b)
(d) Goodwill impairment losses - (160,366) See Table 7.7(b)
(e) Disposed (876,025) -
(f) Closing goodwill balance 2,808,856 2,648,047
(g) Allocation of goodwill to CGUs
Singapore segment
(h) Basis of recoverable amount Value in use
(i) Accounting policy - Goodwill Goodwill impairment
2. Segment result of an impaired CGU
(a) Number of segments Four CGUs – Malaysia, Singapore, Philippines, and others
(b) Segment result – Singapore segment
2,347,104 3,964,037
3. Financial performance
(a) Net income (after adding back goodwill impairment loss) available to equity holders
21,709,000
29,046,000
(b) Basic EPS (cents) 10.73 9.44
4. The market capitalisation (MV vs. BV)
MV>BV 5.97
MV>BV 6.24

184
5. Reasons for reporting goodwill impairment losses disclosed in the Notes to the Financial Statement
2007
For the purpose of impairment testing, goodwill is allocated to the Group‘s geographical segments. The recoverable amount of each CGU has been determined based on its value-in-use by discounting future cash flows generated from the CGUs.
The values assigned to the key assumption represent management‘s assessment of future trends in the Company‘s and the CGU‘s principal activities and are based on internal sources (historical data) (DEF2 Bhd, 2007: 51).
6. Audit report concerning goodwill
2007 - Unqualified opinion (DEF2 Bhd, 2007: 31).
Types of accounting choice identified
2007 - Timing in reporting goodwill write-off from goodwill which arose from an apparent overpayment made at the time of the business acquisition [see Table 7.7(b)]
Table 7.7(b): Detail analysis of an addition of goodwill for DEF2 Bhd from
2006-2007
Date RM %
26/12/2006 Addition:
Group‘s share of net assets 69,182 30
Item 1 Goodwill arising from acquisition 160,809 70
Cost of acquisition 229,991
31/12/2006 Goodwill impairment -
31/12/2007 Goodwill impairment 160,809 Fully impaired
Table 7.8(a): Analysis of goodwill movement for DEF3 Bhd from 31
December 2006 to 2007 Post-FRS 3
Year 2006 2007
1. Goodwill data
(a) Opening goodwill balance - 42,918
(b) Additions 100,701
(c) Miscellaneous - Dilution of equity interest in subsidiaries
- 33,000
(d) Goodwill impairment losses (57,783) See Table 7.8(b)
(42,918) See Table 7.8(b)
(e) Disposed
-
(f) Closing goodwill balance 42,918 33,000
(g) Allocation of goodwill to CGUs
No information disclosed
(h) Basis of recoverable amount
Based on the estimation of VIU
(i) Accounting policy - Goodwill Impairment
2. Segment result
(a) Number of segments The company does not disclose the basis of

185
(b) Segment result goodwill allocation. Thus, cannot determine whether the goodwill is allocated to business
segment, subsidiaries acquired, or etc. Moreover, there is no information on segment
results. Hence, segment result is not applicable.
2006 2007
3. Financial performance
(a) Net income (after adding back goodwill impairment loss) available to equity holders
499,000
356,000
(b) Basic EPS (cents)
1.1 0.7
4. The market capitalisation (MV vs. BV)
MV>BV 2.18
MV>BV 1.71
5. Reasons for reporting goodwill impairment losses disclosed in the Notes to the Financial Statement
Although in the Notes to the Financial Statement, the company disclosed the amount of goodwill impairment loss recognised in 2006 and 2007, reasons for such impairment loss was not disclosed both in 2006 and 2007 (DEF3 Bhd, 2006: 49; 2007: 48).
6. Audit report concerning goodwill
Unqualified opinion in 2006 and 2007 (DEF3 Bhd, 2006: 26; 2007: 24).
Types of accounting choice identified
Timing in reporting goodwill write-off from goodwill which arose from an apparent overpayment made at the time of the business acquisition [see Table 7.8(b)]
Table 7.8(b): Detail analysis of an addition of goodwill for DEF3 Bhd
from 2006 to 2007
Date RM %
10/1/2006 Addition:
Group‘s share of net assets 52,434 34%
Item 1 Goodwill arising from acquisition 100,701 66%
Cost of acquisition 153,135
31/12/2006 Goodwill impairment 57,783 57%
31/12/2007 Goodwill impairment 42,918 43%
Total 100,701
When the three companies write-off their goodwill, the reasons for the write-
off is either not clearly disclosed in the Notes to the Financial Statement (i.e.
DEF1 Bhd, and DEF2 Bhd – see Tables 7.6(a) and 7.7(a), item 5) or not
disclosed at all (i.e. DEF3 Bhd - see Table 7.8(a) item 5). For DEF1 Bhd and
DEF2 Bhd, the reasons disclosed in the Notes to the Financial Statement seem
to inform the shareholders that the goodwill impairment losses occur as a

186
result of the impairment test of goodwill [see item 5 in Tables 7.6(a) and
7.7(a)]. Nevertheless, from the analyses of goodwill movement for these three
companies, it appears that the managers have already decided to fully impair
the goodwill and that they chose the timing of the write-off. Therefore, the
reporting of goodwill impairment losses for these companies provides
evidence of the exercise of managerial discretion in terms of timing in
reporting the write-off.
The timing in reporting the write-off discussed above is captured into a
scenario (see Figure 7.3). However, because of the extensive manual efforts
require to identify companies that have goodwill arising from an apparent
overpayment made at the time of business acquisition, this scenario will be
set aside for future research.
Figure 7.3: A scenario of companies exercising discretion in timing the goodwill write-off due to an apparent overpayment made at the time of
business acquisition
Selection criteria:
(i) Companies that acquired goodwill within the current year.
(ii) Group the companies into two. Group 1 (control group) are those
companies that fully impair the goodwill acquired immediately. Group
2 (test group) are those companies that reported the impairment
losses in the subsequent year.
Companies in Group 2 will be regarded as companies which exercise an
accounting choice in terms of timing in reporting goodwill write-off from
goodwill which arose from an apparent overpayment made at the time of
acquisition. In the future research, they will be tested in year 1 and
against Group 1.
7.3.3 Systematic reduction of goodwill balance
As noted in Figure 7.1 (in Section 7.3), two of the 20 companies analysed
reduced their goodwill balance systematically annually (see Tables 7.9 and
7.10). Table 7.9 [see item 1(i)] shows that XYZ1 Bhd had a goodwill

187
amortisation policy prior to the implementation of FRS 3 in 2007. From 2007
onwards, the company implemented FRS 3, which prohibited the annual
amortisation of goodwill. Instead, the company is required to perform an
annual impairment test of goodwill. However, Table 7.9 [see item 1(c) and
1(d)] reveals that XYZ1 Bhd continued the process of reducing the goodwill
balance systematically. Instead of recording the amount as an amortisation of
goodwill [see item 1(c)], it was renamed as goodwill impairment loss [see
item 1(d)]. From the table, it is seen that there is no reason for the company
to report goodwill impairment losses from 2007 to 2009 when it is
experiencing good financial performance (see item 3) and the company‘s
market value is higher than the book value of the net assets from 2003 to
2009 (see item 4).
Table 7.9: Analysis of goodwill movement for XYZ1 Bhd from 31 March 2002-2009
Pre-FRS 3 (RM’000) Post-FRS 3 (RM’000)
Year 2003 2004 2005 2006 2007 2008 2009
1. Goodwill data
(a) Opening goodwill balance
- 21,902 29,297 27,823 26,349 24,874 23,400
(b) Additions 22,166 8,536 - - - - -
(c) Miscellaneous - Goodwill amortisation
(264) (1,141) (1,474) (1,474) - - -
(d) Goodwill impairment losses
- - - - (1,475) (1,474) (1,474)
(e) Disposed - - - - - - -
(f) Closing goodwill balance
21,902 29,297 27,823 26,349 24,874 23,400 21,926
(g) Allocation of goodwill to CGUs
The group operates mainly in Malaysia and involved principally in the domestic marketing of petroleum products
(h) Basis of recoverable amount
Not stated
(i) Accounting policy – Goodwill
Goodwill is amortised from the date of initial recognition
Goodwill is reviewed for impairment annually or
more frequently
2. Segment result The group does not present financial information by segmental information as it is principally involved in the domestic marketing
of petroleum products in Malaysia (p. 133).
3. Financial performance
(a) Net income (after adding back goodwill impairment loss) available to equity holders
149,101
381,198
210,731
505,964
641,782
663,139
580,145

188
2003 2004 2005 2006 2007 2008 2009
(b) Basic EPS (cents)
30.0 76.7 21.2 50.9 64.5 66.6 58.2
4. The market capitalisation (MV vs. BV)
MV>BV 1.24
MV>BV 1.46
MV>BV 1.51
MV>BV 1.33
MV>BV 1.75
MV>BV 2.03
MV>BV 1.89
5. Reasons for reporting goodwill impairment losses disclosed in the Notes to the Financial Statement
Similar reasons for reporting goodwill impairment losses disclosed in the Notes to the Financial Statement in 2007 to 2009 as follows:
Goodwill arose from the acquisition of certain service stations in previous years (XYZ1 Bhd, 2007: 87; 2008: 98; 2009: 119).
6. Audit report concerning goodwill
Unqualified opinion for 2007 to 2009 (XYZ1 Bhd, 2007: 66; 2008: 75; 2009:91).
Types of accounting choice identified
2007-2009
Systematic reduction of goodwill balance.
Another case of a company which reduced its goodwill balance systematically
is XYZ2 Bhd (see Table 7.10). Unlike XYZ1 Bhd that reduced its goodwill
balance by the same amount annually (i.e. using the straight-line method),
XYZ2 Bhd reduced its goodwill balance with the same percentage in 2006 and
2007 (i.e. using the reducing balance method). Table 7.10 shows that both in
2006 and 2007, the company reduced 10% of its beginning goodwill balance
[see item 1(d)]. In 2008, the company‘s financial performance declined
further (see item 3) and its market value fell below the book value of the net
assets (see item 3), which led the company to reduce its beginning goodwill
balance by a larger percentage (10% reduction of goodwill balance for the
newly acquired goodwill and 20% reduction of beginning goodwill balance for
the previously acquired goodwill) [see item 1(d)]. The analyses of goodwill
movement presented in Tables 7.9 and 7.10 seem to imply that the managers
who were accustomed to the amortisation of goodwill prior to the
implementation of FRS 3 were perpetuating this old system by reporting
goodwill impairment losses systematically annually.
The practice of reducing goodwill balance via the straight-line method as
found with XYZ1 Bhd [see item 1(c) and (d) in Table 7.9] can be easily
identified for other listed companies. However, the reducing balance method
as applied by XYZ2 Bhd [see item 1(d) in Table 7.10] might be challenging to

189
detect if there is an addition of goodwill and the managers alter the
percentage of goodwill to be reduced. Therefore, the researcher could not
easily devise a program that would identify which of these companies had
applied a reducing balance method prior to the implementation of FRS 3. The
only way to distinguish these companies is through manual analysis of goodwill
movement as has been demonstrated for XYZ1 Bhd and XYZ2 Bhd. The amount
of manual efforts required to test companies which have reduced their
goodwill balances systematically makes its impractical to continue further
within the scope of this thesis. Hence, this type of accounting choice will not
be explored further.
Table 7.10: Analysis of goodwill movement for XYZ2 Bhd from 31 December 2004-2008
Pre-FRS3 Post-FRS3
Year 2004 2005 2006 2007 2008
1. Goodwill data
(a) Opening goodwill balance
2,269,870 2,247, 171 2,156,375 1,940,738 1,746,664
(b) Additions - - - - 1,172,691
(c) Miscellaneous - Goodwill amortisation policy for 25 years
(22,699) = 1% of GW(o/b) - Not following the GW-amor(1).
(90,796) = 2,269,870/25 years - As per the GW-amor.
-
-
-
(d) Goodwill impairment loss
(215,637) = 10% x GW(2) (o/b). - GWIL(IL)(3)
is a reduction of 10% of the GW balance.
(194,074) = 10% x GW (o/b). - GWIL(IL) is a reduction of 10% of the GW balance.
(466,602) = (10% x new GW) + (20%x GW-o/b) = (10%x1,172, 691) + (20% x 1,746,664) = 349,333+117,269 =466,602.
(e) Disposed - - - - -
(f) Closing goodwill bal.
2,247,171 2,156,375 1,940,738 1,746,664 2,452,753
(g) Allocation of goodwill to CGUs
Not stated Business application software
(h) Basis of recoverable amount
The higher of Net selling price and value-in-use.
The higher of fair values less costs to sell and value-in-use.
(i) Accounting policy - Goodwill
2. Segment result
None- the group principally involved in information technology related business.
(1) GW-amor denotes amortisation of goodwill (2) GW denotes goodwill (3) GWIL(IL) denotes impairment losses of goodwill

190
Table 7.10 (continue): Analysis of goodwill movement for XYZ2 Bhd from 31 December 2004-2008
Pre-FRS3 Post-FRS3
Year 2004 2005 2006 2007 2008
3. Financial performance
(a) Net income (after adding back goodwill impairment loss) available to equity holders
408,000
414,000
(1,106,000)
(959,000)
(2,972,000)
(b) Basic EPS (cents)
1.62 0.44 (1.42) (1.08) (3.69)
4. The market capitalisation (MV vs. BV)
MV>BV 5.25
MV>BV 1.03
MV>BV 1.06
MV>BV 1.18
MV<BV 0.71
5. Reasons for reporting goodwill impairment losses disclosed in the Notes to the Financial Statement
Similar reasons for reporting goodwill impairment losses disclosed in the Notes to the Financial Statement in 2006 to 2008 as follows:
The Group tests goodwill for impairment annually or more frequently if there are indications that goodwill might be impaired (XYZ2 Bhd, 2006: 42; 2007: 47; 2008: 54).
6. Audit report concerning goodwill
Unqualified opinion in all of the three years 2006-
2008 (XYZ2 Bhd, 2006: 29; 2007: 35; 2008: 41).
Types of accounting choice identified
Systematic reduction of goodwill balance
As noted in Sections 4.4.2 and 6.4.2.2, in an attempt to explore whether
segment result could be employed as a proxy for an indication that goodwill
may be impaired, information concerning segment result is included in the
disclosure framework (for e.g. see item 2 of Table 7.3). The result of the
disclosure study illustrates that it is challenging to apply the segment result as
another proxy for an indication that goodwill may be impaired, especially on a
large scale basis. There are two reasons for this. Firstly, though companies
have a number of business segments, not all of these segments contain
goodwill. Moreover, not all of the segments containing goodwill reported
goodwill impairment losses. Therefore, to identify the business segment which
reported goodwill impairment losses, a researcher needs to inspect the annual
reports for each of the companies. To illustrate, ABC1 Bhd (see Table 7.3) has
three business segments. Nevertheless, there is only one business segment
(i.e. electrical and mechanical engineering) which reported goodwill

191
impairment losses. Secondly, not all of the companies allocated their goodwill
as per the segment reporting (either business segments or geographical
segments). Companies also allocated their goodwill to subsidiaries acquired.
7.4 Summary and conclusions
This chapter has addressed two research questions for the disclosure study
(i.e. Research Questions 2 and 3).
Research Question 2 asks about the appropriateness of the market
capitalisation indication (i.e. companies‘ market values lower than the book
values of their net assets at the balance sheet date) as a proxy for an
indication that goodwill may be impaired. The first part of the disclosure
study has revealed that as a stand-alone, the market capitalisation indication
is not an ideal proxy for an indication that goodwill may be impaired (see
Section 7.2). This is because it does not fully reflect the condition of the cash-
generating-units containing goodwill, disclosed in the Notes to the Financial
Statement.
Research Question 3 concerns types of accounting choice related to goodwill
impairment exercised by Malaysian listed companies. Through an in-depth
analysis of the annual reports of 20 companies over a number of years, and
using the self-constructed disclosure framework, the second part of the
disclosure study has provided evidence of opportunistic timing in reporting
goodwill impairment losses (see Section 7.3). This opportunistic timing is
evidenced through the four companies which were found to have delayed
reporting goodwill impairment losses (see Section 7.3.1) and eight companies
that chose when to fully impair its goodwill which arose from an apparent
overpayment made at the time of business acquisition (see Section 7.3.2). In
addition, this disclosure study has revealed two companies which reduced
their goodwill balance systematically every year, suggesting that the
managers are perpetuating the old system of amortising their goodwill (see
Section 7.3.3).
192
Two scenarios are constructed to capture the opportunistic timing (see
Figures 7.2 and 7.3). However, because of the small number of companies and
the extensive manual efforts require, these scenarios are set aside for future
research. The deferment of these two scenarios for further research does not
affect the quality of this thesis because the measurement study of this thesis
(see Chapter 8) analyses the total population of companies which implement
FRS 3 for the first three years the standard taking effect. The two scenarios
which are constructed to capture the opportunistic timing represent an
extension of the measurement study as they attempt to analyse companies‘
motives in reporting goodwill impairment losses that have become overdue.
In conclusion, by answering Research Question 2, the disclosure study has
revealed that as a stand-alone, the market capitalisation indication is not an
ideal proxy for an indication that goodwill may be impaired. By answering
Research Question 3, the disclosure study has illustrated that when the
market capitalisation indication is coupled with the financial performance of
companies, and their segment results, it becomes a useful starting point in
identifying the accounting choices related to goodwill impairment exercised
by Malaysian listed companies. Therefore, the disclosure study contributes to
the wider thesis by providing evidence of the degree of discretion managers
have in determining the timing and amount of goodwill impairment losses
reported by Malaysian listed companies after the implementation of FRS 3.

193
Chapter 8: Measurement Study of Goodwill Impairment - Results and Analysis
8.1 Introduction
The measurement study of goodwill impairment, presented in this chapter,
analyses factors influencing managers‘ decisions when determining the
magnitude of goodwill impairment losses divided by prior year total assets
(including goodwill), and zero otherwise reported on the income statement
(see Section 1.4.2). This study answers the research questions listed in Figure
8.1 (see Sections 1.3 and 5.2):
Figure 8.1: Summary of research questions (RQ) for the measurement study of goodwill impairment by Malaysian listed companies
Theoretical research question
RQ 1
:
How can an investigation of FRS 3, focusing on goodwill impairment by Malaysian listed companies, contribute to the theories of accounting choice?
Specific research questions
RQ 4 : Economic factors
To what extent do the decisions of Malaysian listed companies in measuring goodwill impairment indicate that they reflect the underlying economic values of cash-generating-units containing goodwill?
RQ 5 : Contracting perspective
To what extent do the decisions of Malaysian listed companies in measuring goodwill impairment support the contracting perspective?
RQ 6 : Opportunistic behaviour perspective
To what extent do the decisions of Malaysian listed companies in measuring goodwill impairment support the opportunistic behaviour perspective?
RQ 7 : Ownership structures
To what extent do the decisions of Malaysian listed companies in measuring goodwill impairment indicate that they reflect companies‘ ownership structures?
RQ 8 : To what extent do the decisions of Malaysian listed companies in measuring goodwill impairment indicate that they reflect the discretion available in FRS 136 Impairment of Assets?

194
This chapter is structured as follows. Section 8.2 describes the dependent
variable, and the distribution of data. Section 8.3 outlines an overall
regression model, discusses the issues of multicollinearity, and specifies
variables included in the regression models. Section 8.4 analyses the result of
the regression Model 1. Section 8.5 reports the results of the overall
regression Model 2 and the sensitivity analyses. Sections 8.6 to 8.12.2 discuss
the findings for each of the research questions, the control variables, and the
overall results. Section 8.13 summarises and concludes the chapter.
8.2 Descriptive analysis
The descriptive analysis discussed in this section describes the dependent
variable (see Section 8.2.1) and the distribution of data (see Section 8.2.2).
8.2.1 Dependent variable
Two issues concerning the dependent variable of the measurement study are
discussed – the distribution of data (see Section 8.2.1.1) and the skewed data
(see Section 8.2.1.2).
8.2.1.1 Dependent variable: Distribution of data
Table 8.1 presents the distribution of data for the dependent variable, i.e.
the magnitude of goodwill impairment losses divided by prior year total assets
(including goodwill), and zero otherwise reported on the income statement in
the first three years of the implementation of FRS 3. The table consists of
three panels – Panel A reports the number of firm-years observation reporting
goodwill impairment losses and zero goodwill impairment, Panel B focuses on
companies which reported goodwill impairment losses only, and Panel C takes
a closer look at the companies reported in Panel B by segregating them into
three groups.

195
Table 8.1: Distribution of data for the dependent variable of the measurement study
Initial year
Second year
Third year
All observations
Panel A: Number of firm-years observation reporting goodwill impairment losses and zero goodwill impairment
No. of observations
- Goodwill impairment loss
135 123 111 369
- Zero goodwill impairment
394 374 361 1129
Total 529 497 472 1498
Panel B: Relative magnitude of goodwill impairment losses(1)
Minimum(2)
0.000 0.000 0.000 0.000
Maximum 0.281 0.257 0.183 0.281
Mean 0.009 0.013 0.014 0.012
Median 0.002 0.002 0.002 0.002
Std. Deviation 0.031 0.036 0.029 0.032
Skewness 7.144 4.325 3.573 5.055
Kurtosis 56.134 21.552 15.055 30.429
Kolmogorov-Smirnov test (Sig.)
0.000 0.000 0.000 0.000
Initial year Second year Third year All observations
N % N % N % N % Panel C: Grouping of the relative magnitude of goodwill impairment losses (from Panel B)
<1% 113 83.7% 99 80.5% 80 72.1% 292 79.1%
1% to <10% 20 14.8% 18 14.6% 27 24.3% 65 17.6%
10% and more 2 1.5% 6 4.9% 4 3.6% 12 3.3%
Total
135
123
111 369
Panel A shows that, in each of the years, the majority of the companies
reported zero goodwill impairment (see Section 6.3 for detailed illustration).
Panel B shows that for observations which reported goodwill impairment
(1) Relative magnitude of goodwill impairment losses refer to magnitude of goodwill impairment losses divided by prior year total assets (inclusive of goodwill) reported on the income statement. It excludes zero goodwill impairment.
(2) Zero amount shown, because the amount of goodwill impairment losses reported by 17 companies is very small that when they are scaled by large amount of prior year total assets
inclusive of goodwill, they reach around zero.

196
losses only (excluding zero goodwill impairment), the relative magnitude of
goodwill impairment losses reported on the income statement ranges from
0.000 to 0.281 with a mean value of 1.2% and a median value of 0.2% (see
Section 8.2.1.2 for the issue of skewness). In comparing this result with prior
studies (e.g. Francis et al., 1996; Lapointe-Antunes et al., 2008; AbuGhazaleh
et al., 2011) who employ exactly the same measure, it is observed that the
mean and median values presented in Panel B of Table 8.1 are lower than
AbuGhazaleh et al., (2011: 186) who reported a mean goodwill write-off of
1.8% (median 0.3%). Further, this result is much lower than Lapointe-Antunes
et al. (2008) and Francis et al., (1996: 120). Lapointe-Antunes et al. (2008:
45) documented a mean goodwill write-off of 6.34% (median 3.57%), and
Francis et al., (1996: 120) showed a mean goodwill write-off of 10.1% (median
4.4%).
Panel C reveals that for companies which reported goodwill impairment losses
only, the amount of impairment losses reported for the majority of them (e.g.
83.7% in the initial year) is less than 1% of the prior year total assets (inclusive
of goodwill). To see whether the relative magnitude of goodwill impairment
losses would differ between companies which reported the impairment losses
once and those that reported the losses repeatedly, a comparison of the
extent of relative magnitude of goodwill impairment losses by these
companies is undertaken. The comparison shows that the majority of
companies (e.g. 82 of the 135 companies in the initial year - see Appendix
8.1) reported goodwill impairment losses once during the three-year period of
investigation, while nineteen companies reported losses thrice. Nonetheless,
detailed inspection of the nineteen companies reveals no obvious pattern in
reporting the impairment losses.
The high skewness54 and kurtosis values portrayed in Panels A and B suggest
that the dependent variable is not normally distributed - not only for the total
observations (Panel A) but also for companies which reported goodwill
impairment losses only (Panel B). From Panel B, it is observed that the non-
normality of the relative magnitude of goodwill impairment losses reported on
54
According to Field (2005: 73), skewness of +/- 1.96 and Kurtosis of +/- 3.29 are within the normality threshold (see Section 6.6.1.1).

197
the income statement is further supported by the result of the Kolmogorov-
Smirnov55 test with significant p-value of less than 0.01.
8.2.1.2 Dependent variable: Skewed data for the relative
56 magnitude of goodwill impairment
losses
As noted in Section 6.7.1, the dependent variable for the measurement study
comprises zero values and a range of the relative magnitude of goodwill
impairment losses. The latter reported high skewness and kurtosis values (see
Section 8.2.1.1). According to Cameron and Trivedi (2009: 525), with high
skewness and kurtosis, there is a possibility for tobit maximum likelihood
estimation to be a flawed estimator for the model. To overcome this issue,
two approaches have been considered57 by the researcher.
The first approach is based on the suggestion made by Cameron and Trivedi
(2009: 525 and 532-534), which is to transform the relative magnitude of
goodwill impairment losses through natural logarithm, and to use the zero
values as they are. Therefore, in this case, the dependent variable would
consist of zero values and natural logarithm of the relative magnitude of
goodwill impairment losses. The researcher has attempted to follow this
suggestion. A random-effects tobit regression is run using the revised
dependent variable.
However, because the relative magnitude of goodwill impairment losses
comprises many values that are close to zero (e.g. 0.01) (see Panel C of Table
8.1), the natural logarithm of these values produces negative values, which
55 Kolmogorov-Smirnov with p-value less than 0.05 suggests violation of the assumption of normality (Pallant, 2001: 58) (see Section 6.6.1.1).
56 The relative magnitude of goodwill impairment losses refer to magnitude of goodwill impairment losses divided by prior year total assets (inclusive of goodwill) reported on the income statement. It excludes zero goodwill impairment.
57 In considering these two approaches, the researcher has carried out a discussion with Mr Darryl Holden, the author of ‗Testing the normality assumption in the tobit model‘, Journal of Applied Statistics, at his office at the University of Strathclyde, Glasgow, Scotland. The researcher would like to take this opportunity to thanks Mr Darryl Holden for his advices and suggestions.

198
together with the lower limit censoring (at zero values), resulted in STATA not
being able to generate the regression output. To solve this technical problem,
the researcher could alter the censoring limit from the lower limit (at zero
value) to the upper limit (at zero value), and then run the regression again
with the revised dependent variable. However, theoretically, this would be
incorrect because goodwill impairment losses cannot be negative. Therefore,
the approach of applying natural logarithm to the relative magnitude of
goodwill impairment losses, is unsuited to the present measurement study.
The second approach in solving the high skewness and kurtosis values is to
replace the denominator of the dependent variable from prior year total
assets inclusive of goodwill to goodwill balance at the beginning of the year.
This approach has been applied by Beatty and Weber (2006: 273) where their
dependent variable is the magnitude of goodwill impairment losses divided by
goodwill balance at the beginning of the year, and zero otherwise reported on
the income statement. However, when adopting this approach in the present
study, the issue of high skewness and kurtosis is not resolved. With the
beginning goodwill balance as the new denominator, the skewness and
kurtosis values are even higher than when the denominator is the prior year
total assets inclusive of goodwill. Therefore, this approach is also unsuitable
for the present measurement study.
As the two approaches discussed above cannot be applied in the present
measurement study, the researcher has referred back to prior studies
analysing goodwill impairment (e.g. Lapointe-Antunes et al., 2008;
AbuGhazaleh et al., 2011). However, none of these studies discusses the
normality test and the issue of whether the tobit maximum likelihood
estimation may be flawed. Therefore, the way forward is for the researcher
to employ the initial dependent variable, that is, the dependent variable
which comprises zero values and a range of the relative magnitude of goodwill
impairment losses. Also, to acknowledge that with the high skewness and
kurtosis values, there is a possibility that the tobit maximum likelihood
estimation may be a flawed estimator for the model in this measurement
study.

199
8.2.2 Distribution of data for the independent variables and control variables
The descriptive statistics for the continuous and categorical variables
employed in the present measurement study are displayed in Appendices 8.2
and 8.3. The appendices highlight three issues concerning the distribution of
data. Firstly, ∆SALES is positively skewed with its mean value differing
significantly from the median (see Appendix 8.2). Secondly, a number of
variables suffer from high frequencies of missing values (see Appendices 8.2
and 8.3 – e.g. DISCRATE). Thirdly, there is a lack of data for the industry
dummy (see Appendix 8.3). These three issues will be discussed in Sections
8.2.2.1 to 8.2.2.3 respectively.
8.2.2.1 Skewed data for the independent variables
The mean p-value for change in sales (∆SALES) is greater than its median and
the difference is statistically significant, suggesting that the variable is
positively skewed (see Appendix 8.2). Detailed inspection revealed that
∆SALES reports skewness value of 4.418 and kurtosis value of 57.204.
According to Field (2005: 73), skewness of +/- 1.96 and Kurtosis of +/- 3.29
are within the normality threshold (see Section 6.6.1.1). For a variable which
has a substantially positive skewness with zero values, Tabachnick and Fidell
(2007) suggest transforming the variable into logarithmic plus constant value,
such as logarithmic plus 1. Following this suggestion, ∆SALES is transformed
into Log(∆SALES+1). Accordingly, the skewness value for Log(∆SALES+1) is
reduced to -0.673.
8.2.2.2 Missing values
The descriptive analysis presented in Appendices 8.2 and 8.3 shows that the
variables for testing the discretion available in performing impairment test of
goodwill (i.e. CGU01, CGUContinuous, DISCRATE, and DISCMULTIPLE) suffer from
high frequency of missing values. These variables were not disclosed by more
than half of the total firm-years analysed. The missing value analysis is
carried out using Little‘s MCAR test and Separate Variance t tests (see Section

200
6.6.2). The Little‘s MCAR test produces a Chi-Square value of 1527.70 and is
statistically significant at p-value of less than 0.01 (see Appendix 8.4),
suggesting that the null hypothesis that the data are missing completely at
random is rejected. Hence, it is inferred that the data are not missing
completely at random.
Separate Variance t tests are carried out by SPSS only for variables where at
least 5% of data missing (see Section 6.6.2). Accordingly, the Separate
Variance t tests are conducted on eight variables - GWB, DEBTRATIO,
∆CEOCurrent/prior, CEOTENURE, CGU01, CGUcontinuous, DISCRATE, and DISCMULTIPLE
(see Appendix 8.4). In all of the eight variables tested, the Separate Variance
t tests show that the dependent variable is not statistically significant (see
Appendix 8.4). This means that there is no systematic relationship between
the missing values faced by each of these eight variables and the dependent
variable. This result suggests that the missing values encountered by these
eight variables are not related to the dependent variable.
Instead, the missing value is predictable from other independent variables.
For example, in Model 1 (see Section 8.4), the total population of firm-years
analysed is reduced from 1498 to 538 because of the missing values for CGU01.
From Appendix 8.4, it is seen that the missing data on CGU01 is more likely to
differ, for example, in their EARNINGSPrior. Because the missing data is not
related to the dependent variable, the result of Separate Variance t tests
indicates that the data is missing at random (Tabachnick and Fidell, 2007:
63). Consequently, it is inferred that the missing values, which occur at
random will not affect the generalisability of results.
Tabachnick and Fidell (2007: 63-71) offer a few solutions to the problem of
missing values, such as imputing the missing values, treating missing values as
data, deletion of cases, and deletion of variables. In the present study, the
high frequency of missing values for the four out of the eight variables (i.e.
CGU01, CGUcontinuous, DISCRATE, and DISCMULTIPLE - see Appendix 8.4) makes it
impractical to adopt the first two solutions. For example, imputing the data,
by replacing the missing score with average score for the related variables
may suppress the true value of the standard deviation and the standard error.

201
Field (2005: 184) explains that the standard deviation will be suppressed
because for any replaced case, there will be no difference between the mean
value and the score value. If there are many missing values, imputing the data
is potentially dangerous as smaller standard errors are more likely to lead to
significant results that are a product of replacement rather than a genuine
effect (Field, 2005:184).
Because the Separate Variance t tests indicate that the missing values occur
at random, the issue of missing values is solved by constructing Model 2(h)(i)
and (ii), which is a subcategory of Model 2 (see Section 8.3.3 and Table 8.3).
The model retains those variables testing economic factors, contracting
perspective, opportunistic behaviour perspective, ownership structures, and
control variables. However, it excludes all of the variables testing the
discretion (see Table 8.3). Thus, Models 2(h) (i) and (ii) solve the problem of
missing values by deleting variables testing the discretion such as CGUs and
discount rates that suffer from a high frequency of missing values.
8.2.2.3 Lack of data for industry variable
Due to the small number of companies involved, the industry group
classification is reduced from 10, by combining these into five groups as
follows: (i) industrials and basic materials, (ii) consumer goods and services,
(iii) financials, (iv) utilities, healthcare and oil and gas, and (v) technology
and telecommunication (see Appendix 8.3). The reduction of 10 industries to
five industries follows as closely as possible the industry classification as
provided by Bursa Malaysia, which is also applied by Haniffa (1999: 295).
8.3 Multivariate analyses
The multivariate analyses discuss in this section include an overall regression
model (see Section 8.3.1), the issue of multicollinearity (see Section 8.3.2),
and model specifications (see Section 8.3.3).

202
8.3.1 An overall regression model
An overall regression model (see Appendix 1 of the thesis for detailed
definitions of these variables) is applied in this section as follows:
GWIL = f(Economic factors, Contracting perspective, Opportunistic behaviour
perspective, Ownership structures, Discretion available in performing
impairment test of goodwill, Control variables) + ε
Where;
Variable Description
GWIL = The magnitude of goodwill impairment losses, divided by prior year total assets (including goodwill), and zero otherwise reported on the income statement.
Economic factors
∆SALES (H1) Change in sales divided by total assets at the end of prior year
= (Salest - Salest-1) Total assetst-1
The variable is transformed into Log(∆SALES+1) (see Section 8.2.2.1).
EARNINGSPrior58
(H2A) Prior year earnings divided by total assets at the end of prior year.
EARNINGSPreGWILcurrent
(H2B)
Current year pre-write-off earnings divided by total assets at the end of prior year.
∆EARNINGSpreGWIL(H3)
Change in pre-write-off earnings divided by total assets at the end of prior year
= [EARNINGSt + GWIL(IL)t]- [EARNIINGSt-1 + GWIL(IL) t-1] Total assetst-1
∆OCF (H4)
Change in operating cash flows divided by total assets at the end of prior year
= (OCFt - OCFt-1)/Total assetst-1
BTM (H5)
Book-to-market ratio
= Company i‘s book value of equity divided by market value of equity at the end of current year.
GWB (H6)
Relative size of goodwill balance
= Opening goodwill balancet Total assets t-1
Contracting perspective
DEBTRATIO (H7)
Debt contracting
= Total Debtst-1 Total assetst-1
Opportunistic behaviour perspective
58 EARNINGSPrior and EARNINGSPreGWILcurrent are not tested in the same regression model (see Section 8.3.3 for the detailed of the model specifications).
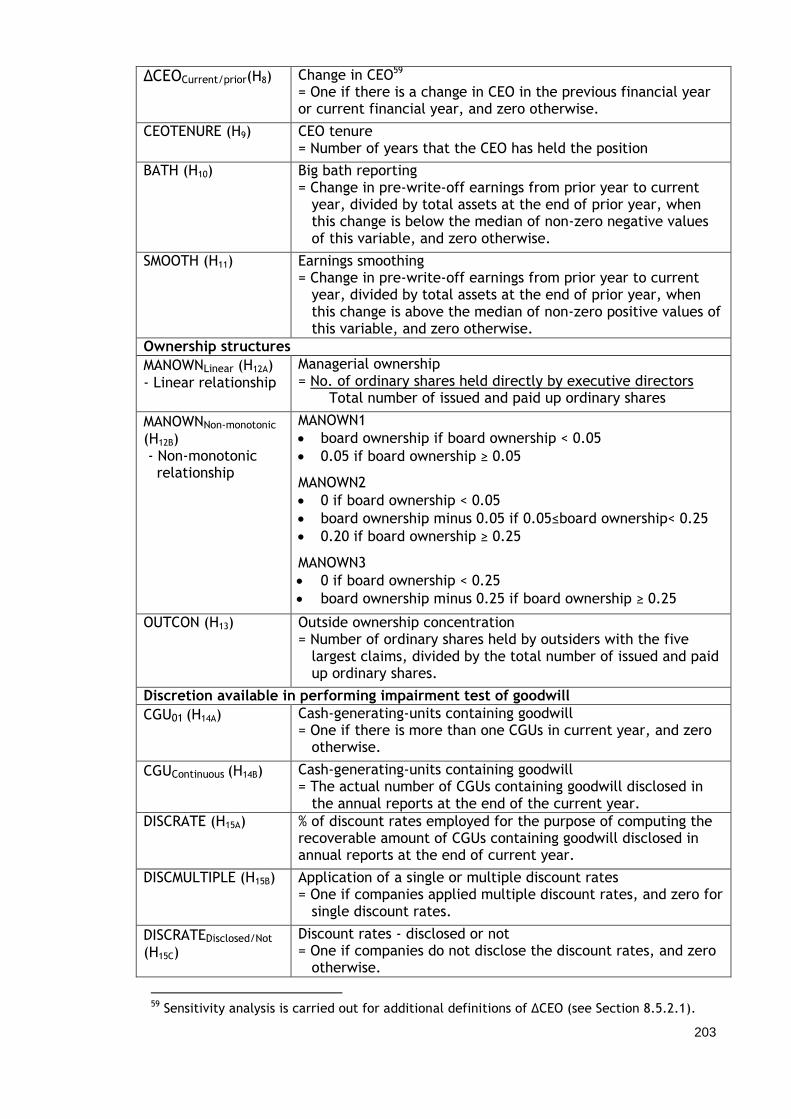
203
∆CEOCurrent/prior(H8) Change in CEO59 = One if there is a change in CEO in the previous financial year or current financial year, and zero otherwise.
CEOTENURE (H9) CEO tenure = Number of years that the CEO has held the position
BATH (H10) Big bath reporting = Change in pre-write-off earnings from prior year to current year, divided by total assets at the end of prior year, when this change is below the median of non-zero negative values of this variable, and zero otherwise.
SMOOTH (H11) Earnings smoothing = Change in pre-write-off earnings from prior year to current year, divided by total assets at the end of prior year, when this change is above the median of non-zero positive values of this variable, and zero otherwise.
Ownership structures
MANOWNLinear (H12A)
- Linear relationship
Managerial ownership = No. of ordinary shares held directly by executive directors Total number of issued and paid up ordinary shares
MANOWNNon-monotonic (H12B) - Non-monotonic relationship
MANOWN1
board ownership if board ownership < 0.05
0.05 if board ownership ≥ 0.05
MANOWN2
0 if board ownership < 0.05
board ownership minus 0.05 if 0.05≤board ownership< 0.25
0.20 if board ownership ≥ 0.25
MANOWN3
0 if board ownership < 0.25
board ownership minus 0.25 if board ownership ≥ 0.25
OUTCON (H13) Outside ownership concentration = Number of ordinary shares held by outsiders with the five largest claims, divided by the total number of issued and paid up ordinary shares.
Discretion available in performing impairment test of goodwill
CGU01 (H14A) Cash-generating-units containing goodwill = One if there is more than one CGUs in current year, and zero otherwise.
CGUContinuous (H14B) Cash-generating-units containing goodwill = The actual number of CGUs containing goodwill disclosed in the annual reports at the end of the current year.
DISCRATE (H15A) % of discount rates employed for the purpose of computing the recoverable amount of CGUs containing goodwill disclosed in annual reports at the end of current year.
DISCMULTIPLE (H15B) Application of a single or multiple discount rates = One if companies applied multiple discount rates, and zero for single discount rates.
DISCRATEDisclosed/Not (H15C)
Discount rates - disclosed or not = One if companies do not disclose the discount rates, and zero otherwise.
59 Sensitivity analysis is carried out for additional definitions of ∆CEO (see Section 8.5.2.1).

204
Control variables
SIZE (H16) Natural logarithm of total assets at the end of prior year.
INDUSTRYG5 (H17) Types of industry = A dummy variable across five industry categories.
YEND (H18) Financial year-end = A dummy variable across three financial year-end categories (i.e. 2006, 2007, and 2008).
ADD (H19) Additions to goodwill = One if there is a newly acquired goodwill, and zero otherwise.
Ε = Error term
8.3.2 Multicollinearity
Multicollinearity is assessed using Pearson‘s product-moment correlation
coefficient test and variance inflation factor (VIF) computed by regression
analysis (see Section 6.6.3). This section discusses the result of the Pearson‘s
product-moment correlation coefficient test. The result of VIF is shown in
Section 8.4 after running the regression analysis.
Table 8.2 shows the result of the Pearson‘s product-moment correlation
coefficient test performed on the continuous variables60. Gujarati and Porter
(2009: 338) suggested that if the pair-wise correlation coefficient between
two regressors is in excess of 0.8, it indicates an issue of multicollinearity (see
Section 6.6.3). Following this suggestion, Table 8.2 shows that for the most
part, the independent variables are not significantly correlated with one
another or with the control variables. Exceptions include the correlations
between: (1) MANOWNLinear and MANOWN1, and (2) MANOWNLinear and
MANOWN2, which are correlated by construction, and (3) ∆EARNINGSpreGWIL
and SMOOTH. Multicollinearity is not an issue in practice for the first two
correlations because these variables are included in different regression
models (see Section 8.3.3 for the model specification).
60 Pearson‘s correlation is not performed on the categorical variables because according to Field (2005: 125), the correlation requires data which are measured at an interval or ratio level for the result to be meaningful.

205
Table 8.2: Pearson product-moment correlation coefficients
Variable 1 2 3 4 5 6 7 8 9 10
1 GWIL 1.00
2 Log(∆SALES+1)(H1) -0.02 1.00
3 EARNINGSPrior (H2A) -0.14** 0.10** 1.00
4 EARNINGSPreGWILCurrent(H2B) -0.17**
0.22** 0.59** 1.00
5 ∆EARNINGSpreGWIL(H3) -0.02 0.15** -0.26** 0.54** 1.00
6 ∆OCF (H4) -0.00 0.18** -0.04 0.18** 0.22** 1.00
7 BTM (H5) -0.02 -0.15** -0.19** -0.22** -0.08** -0.03 1.00
8 GWB (H6) -0.04 0.05 -0.01 -0.02 -0.01 0.07* -0.02 1.00
9 DEBTRATIO (H7) 0.10 -0.04 -0.24** -0.16** 0.09** 0.02 0.07* -0.02 1.00
10 CEOTENURE (H9) 0.03 -0.04 0.04 0.05* 0.04 -0.02 0.08** -0.17** 0.07** 1.00
11 BATH (H10) -0.10** 0.13** -0.02 0.48** 0.66** 0.04 0.02 -0.05 0.13** 0.07**
12 SMOOTH (H11) 0.04 0.10** -0.34** 0.35** 0.82** 0.27** -0.11** 0.04 -0.04 0.07**
13 MANOWNLinear (H12A) -0.04 0.02 0.04 0.01 -0.01 0.00 -0.02 0.03 -0.05 -0.01
14 MANOWN1 (H12B1) -0.03 -0.00 -0.01 -0.03 -0.01 0.01 0.07* -0.00 0.06* -0.01
15 MANOWN2 (H12B2) -0.01 0.05* 0.02 0.01 -0.00 0.01 -0.02 0.02 -0.03 -0.01
16 MANOWN3 (H12B3) -0.00 0.07* 0.10** 0.04 -0.05 -0.02 -0.03 0.03 -0.09** -0.07*
17 OUTCON (H13) -0.05 0.01 0.12** 0.12** 0.01 0.00 -0.09** -0.04 -0.01 -0.12**
18 CGUcontinuous (H14B) 0.12** 0.01 0.02 -0.01 -0.01 0.03 -0.11** -0.00 0.05 -0.08*
19 DISCRATE (H15A) 0.01 0.07 0.07 0.01 -0.06 -0.00 -0.10* 0.03 -0.11** -0.13**
20 SIZE (H16) 0.06* -0.03 0.06* 0.08** 0.03 -0.01 -0.08** -0.06* 0.11** 0.19**
Variable 11 12 13 14 15 16 17 18 19 20
12 SMOOTH (H11) 0.12** 1.00
13 MANOWNLinear (H12) -0.06* 0.04 1.00
14 MANOWN1 (H12B1) -0.06* 0.04 0.94** 1.00
15 MANOWN2 (H12B2) -0.06** 0.04 0.89** 0.69** 1.00
16 MANOWN3 (H12B3) -0.04 -0.04 0.59** 0.37** 0.67** 1.00
17 OUTCON (H13) 0.08** -0.06* -0.62** -0.62** -0.60** -0.47** 1.00
18 CGUcontinuous (H14B) 0.07 -0.05 -0.09* -0.09* -0.08 -0.07 0.02 1.00
19 DISCRATE (H15A) -0.16** 0.04 -0.04 -0.04 -0.02 -0.04 -0.04 0.05 1.00
20 SIZE (H16) 0.16** -0.08** -0.38** -0.38** -0.33** -0.25** 0.28** 0.42** 0.11** 1.00
*, ** denote significance at the 0.05, and 0.01 level, respectively (two-tailed)

206
The high correlation (0.82) between ∆EARNINGSpreGWIL and SMOOTH at p-value
less than 0.01 is similar to Riedl (2004: 841). In his study, Riedl (2004: 841)
found ∆EARNINGSpreGWIL and SMOOTH to be correlated at 0.786 with p-value
less than 0.01. He (p. 832) reasoned that since the variance inflation factors
(VIF) for the two variables are less than 561, multicollinearity does not appear
to be significant. On the other hand, for the present measurement study, VIF
for ∆EARNINGSpreGWIL and SMOOTH are high. The VIF for ∆EARNINGSpreGWIL is
52.68 and for SMOOTH is 25.19. To overcome the issue of multicollinearity,
∆EARNINGSpreGWIL and SMOOTH are analysed separately (see Section 8.3.3 for
the model specification).
8.3.3 Model specifications
Two main random-effects tobit regression models have been constructed –
Model 1, and Model 2. Model 1 has been constructed with the aim of
comparing the result of the present measurement study with AbuGhazaleh et
al. (2011) (see Section 5.3 for detailed explanation). With the exceptions of
corporate governance variables, and a cross-listing variable which are not
included in the model (see Section 5.3), variables presented in Model 1 are
similar to those of AbuGhazaleh et al. (2011).
Model 2 has been developed with three purposes (see Table 8.3 for the model
specifications). Firstly, to incorporate variables which capture the ownership
structures of Malaysian listed companies, i.e. managerial ownership, and
outside ownership concentration [see Model 2(a)(i) and (ii) in Table 8.3].
Model 2(a)(i) tests the linear relationship between managerial ownership and
reporting goodwill impairment losses while Model 2(a)(ii) tests the non-
monotonic relationship between the two variables.
61 VIF of a variable which exceed 10 is regarded as highly collinear by Gujarati and Porter (2009: 340) (see Section 6.6.3).

207
Table 8.3: Models specification for the analysis of the measurement of goodwill impairment
Model Specifications of the variables
Model 1 = α + Log(∆SALES+1) + EARNINGSPrior + ∆OCF + BTM + GWB + DEBTRATIO
+ ∆CEOCurrent/prior + BATH + SMOOTH + CGU01 + SIZE + YEND + ADD + ε
Model 2(a)(i) = Model 1 + Ownership variables (i.e. MANOWNLinear, and OUTCON)
Model 2(a)(ii) = Model 1 + MANOWN1 + MANOWN2 + MANOWN3 + OUTCON
Model 2(b) = Model 1- CGU01 + Discretion (i.e. CGUContinuous, DISCRATE, DISCMULTIPLE, and DISCRATEDisclosed/Not)
Model 2(c) = Model 1 + CEO tenure (i.e. CEOTENURE)
Model 2(d) = Model 1 + Industry variable (i.e. INDUSTRYG5)
Model 2(e) = Model 1 – EARNINGSPrior + EARNINGSPreGWILCurrent
Model 2(f) = Model 1 – EARNINGSPrior + ∆EARNINGSpreGWIL – SMOOTH
Model 2(g)(i) = Model 1 + MANOWN1 + MANOWN2 + MANOWN3 + OUTCON - CGU01 + CGUContinuous + DISCRATE
+ DISCMULTIPLE + DISCRATEDisclosed/Not + CEOTENURE + INDUSTRYG5 - EARNINGSPrior + EARNINGSPreGWILcurrent
Model 2(g)(ii) = Model 1 + MANOWN1 + MANOWN2 + MANOWN3 + OUTCON - CGU01 + CGUContinuous + DISCRATE
+ DISCMULTIPLE + DISCRATEDisclosed/Not + CEOTENURE + INDUSTRYG5 - EARNINGSPrior + ∆EARNINGSpreGWIL - SMOOTH
Model 2(h)(i) = Model 2(g)(i) - Discretion (i.e. CGUContinuous, DISCRATE, DISCMULTIPLE, and DISCRATEDisclosed/Not)
Model 2(h)(ii) = Model 2(g)(ii) - Discretion (i.e. CGUContinuous, DISCRATE, DISCMULTIPLE, and DISCRATEDisclosed/Not)

208
Secondly, to include variables which are pertinent to understanding the
measurement of goodwill impairment but are not tested by AbuGhazaleh et
al. (2011). These variables are categorised into three groups: (i) variables
testing the discretion such as CGUs available to managers in performing an
impairment test of goodwill (i.e. CGUContinuous, DISCRATE, DISCMULTIPLE, and
DISCRATEDisclosed/Not) [see Model 2(b)], (ii) CEO tenure [see Model 2(c)], and
(iii) industry variable which has been tested by prior studies (e.g. Beatty and
Weber, 2006: 283; Lapointe-Antunes et al., 2008: 44; AbuGhazaleh62 et al.,
2011: 195) [see Model 2(d)].
Thirdly, to improve prior year earnings (EARNINGSPrior) as employed by
AbuGhazaleh et al. (2011) by replacing the variable with current year pre-
write-off earnings in Model 2(e) and change in pre-write-off earnings from
prior year to current year in Model 2(f). In Model 2(f), because of the high
correlation between ∆EARNINGSpreGWIL and SMOOTH (see Section 8.3.2),
SMOOTH is dropped from the model (see Table 8.3).
To see the effect of incorporating and changing variables moving away from
the model of AbuGhazaleh et al. (2011), Model 2 is developed in a number of
stages starting from Model 2(a)(i) to Model 2(h)(ii) (see Table 8.3).
Specifically, Models 2(a)(i) to Model 2(f) replicate Model 1 and incorporate
additional variable(s) as discussed above. Further, Model 2(g)(i) is a
combination of all of the variables included in Model 2(a)(ii) to 2(e) (see Table
8.3). Meanwhile, Model 2(g)(ii) is a combination of all of the variables
included in Models 2(a)(ii) to 2(d) and 2(f). The model is developed separately
from Model 2(g)(i) because of the issue of multicollinearity between
∆EARNINGSpreGWIL and SMOOTH (see Section 8.3.2). Additionally, because of
the high frequency of missing values for variables testing the discretion (see
Section 8.2.2.2), Models 2(h)(i) and (ii) are added in. Model 2(h) retains the
variables testing economic factors, contracting perspective, opportunistic
62
AbuGhazaleh et al. (2011: 195) tested industry variable as part of an additional analysis
(not reported in the main regression model), and the study found the variable as non-significant.

209
behaviour perspective, ownership structures, and control variables. However,
it excludes all of the variables testing the discretion. Therefore, with the
exception of variables testing the discretion, Model 2(h)(i) replicates Model
2(g)(i) while Model 2(h)(ii) replicates Model 2(g)(ii).
8.4 Regression result for Model 1
This section reports the random-effects tobit regression Model 1 (see Sections
6.7.1 and 6.7.2 for the rationale of using random-effects tobit). Table 8.4
summarises the result of Model 1 and how it compares to AbuGhazaleh et al.
(2011: 190). It is noted that the analysis of Model 1 is based on 538
observations, which are fewer than the total population of 1498 due to
missing values (see Section 8.2.2.2 for detailed discussion of the missing
values analysis). Also, the model reveals that the largest variance inflation
factor (VIF) is 1.62 and that the VIFs for all of the variables are below 2.
Multicollinearity becomes an issue when VIF exceeds 10 (Gujarati and Porter,
2009: 340) (see Section 6.6.3). Thus, the VIF results further reinforce the lack
of multicollinearity issue in the random-effect tobit regression Model 1 (see
Section 8.3.2).
The goodness-of-fit for the random-effects tobit model is evaluated using the
log-likelihood and the overall Wald test (see Section 6.9). Table 8.4 shows
that Model 1, which incorporates 10 independent variables and three control
variables, is significant (at p-value less than 0.05) with Wald Chi-square of
27.69 and log likelihood of 186.398. This means that the model as a whole fit
significantly better than an empty model (i.e. a model with no predictor). The
goodness-of-fit for the model cannot be compared with AbuGhazaleh et al.
(2011) as this prior study pooled all of the observations from two years and
then ran a tobit model.

210
Table 8.4: Factors influencing managerial decisions on the measurement of goodwill impairment - Comparison of the regression results between Model
1 and AbuGhazaleh et al. (2011)
Sign
Model 1 - Random-effects tobit
AbuGhazaleh et al. (2011: 190)
- Tobit model
Coefficient
z-statistics VIF Coefficient
t-statistics
No. of observations 538 528
Intercept -0.057 -3.74*** -0.169 6.28***
Economic factors
Log(∆SALES+
1) (H1) - -0.019 -1.03 1.16 0.006 0.94
EARNINGSPrior
(H2A) - -0.042 -1.71* 1.52 -0.053 -1.82*
∆OCF (H4) - 0.002 0.29 1.09 -0.059 -1.76*
BTM (H5) + 0.001 0.79 1.36 0.020 1.96**
GWB (H6) + 0.030 1.17 1.10 0.022 1.36
Contracting perspective
DEBTRATIO (H7)
? 0.005 0.52 1.16 -0.012 -0.71
Opportunistic behaviour perspective
∆CEOCurrent/prior (H8)
+ 0.010 2.17** 1.06 0.011 1.73*
BATH (H10) - -0.085 -2.35** 1.09 -0.094 -3.38***
SMOOTH (H11)
+ 0.068 1.68* 1.32 0.102 2.14**
Discretion in an impairment test
CGU01 (H14A) ? 0.003 0.71 1.15 0.013 1.46
Corporate governance
BINDEP - - 0.046 2.13**
SEPCHAIR - - 0.006 0.48
BACTIVITY - - 0.003 3.85***
BLOCK - - 0.001 2.68***
EXEOWN - - 0.060 2.05**
NONEXEOWN - - 0.110 2.39**
Control variables
SIZE (H16) ? 0.002 2.03** 1.23 0.003 1.18
YEND (H18) - Year 1
?
- Year 2 0.001 0.26 1.49 0.010 1.65
- Year 3 0.000 0.05 1.62
ADD (H19) + -0.001 -0.39 1.17 0.017 2.28**
USCLIST - - 0.020 1.96**
Log likelihood 186.398 -
Wald Chi-square 27.69** -
*, **, *** denote significance at the 0.10, 0.05, and 0.01 level, respectively (two-tailed)

211
As for the variables tested in Model 1, similarities between the result of Model
1 and AbuGhazaleh et al. (2011) occur in four areas. Firstly, with regards to
an opportunistic behaviour perspective, consistent with AbuGhazaleh et al.
(2011), in Model 1 of the present study, three variables are found to be
statistically significant, as predicted, in the measurement of goodwill
impairment by Malaysian listed companies. These are ∆CEOCurrent/prior, BATH,
and SMOOTH (see Table 8.4). Nevertheless, the level of significance found in
the present study differs from AbuGhazaleh et al. (2011) (see Section 8.8 for
detailed discussion of these variables).
Secondly, in terms of the contracting perspective, similar to AbuGhazaleh et
al. (2011), Model 1 shows that debt ratio is non-significant in the
measurement of goodwill impairment (see Section 8.7 for detail).
Thirdly, in terms of the discretion available to managers in performing an
impairment test of goodwill, consistent with AbuGhazaleh et al. (2011), Model
1 of the present study reports non-significance of CGU01 (see Section 8.10.1
for detailed discussion of the CGU).
Fourthly, three variables that are grouped under the economic factors also
provide results consistent with AbuGhazaleh et al. (2011). Similar to
AbuGhazaleh et al. (2011), prior year earnings (EARNINGSPrior) is found
marginally significant (at p-value less than 0.10). In addition, relative size of
goodwill balance (GWB) and change in sales [Log(∆SALES+1)] are found non-
significant in the present measurement study and also in AbuGhazaleh et al.
(2011).
Key differences between the result of Model 1 and AbuGhazaleh et al. (2011)
relate to control variables and the remaining variables testing the economic
factors. For the control variable, Model 1 shows SIZE to be statistically
significant; which is not the case for AbuGhazaleh et al. (2011). Alternatively,
AbuGhazaleh et al. (2011) document additions to goodwill (ADD) as a
significant factor in explaining the measurement of goodwill; Model 1 does not
report similar result.

212
For the economic factors, AbuGhazaleh et al. (2011) reported ∆OCF and BTM
as significant in explaining the measurement of goodwill impairment.
However, in Model 1, none of these variables is statistically significant.
Because of the similarities with respect to three variables proxying for an
opportunistic behaviour perspective (∆CEOCurrent/prior, BATH, and SMOOTH), the
comparison of results between Model 1 and AbuGhazaleh et al. (2011),
presented in Table 8.4, seems to suggest that the opportunistic behaviour
perspective is applicable among Malaysian listed companies as it is applied
when explaining the measurement of goodwill impairment among UK listed
companies. Moreover, studies analysing goodwill impairment by US listed
companies (e.g. Beatty and Weber, 2006; Guler, 2007; Zang, 2008) and
Canadian listed companies (e.g. Lapointe-Antunes et al., 2008) also found
that an opportunistic behaviour perspective helps explained the measurement
of goodwill impairment (see Section 5.6). Yet, all of these studies have
focused on listed companies in developed economies with ownership
structures that differ from Malaysian listed companies (see Section 2.3.3).
Prior studies document that compared to listed companies in developed
economies, such as the UK and US, listed companies in Malaysia are managed
by their owners and that they have concentrated ownership (see Section 3.4).
In addition, La Porta et al. (1998: 471) and Claessens et al. (2000: 82)
believed that the theoretical study of Jensen and Meckling (1976) was
developed around the image of companies with disperse ownership (see
Section 2.3.3). Therefore, before making any inferences on the applicability
of an opportunistic behaviour perspective, it is important to explore the
influence of ownership structures on the measurement of goodwill impairment
by Malaysian listed companies. This is undertaken in Model 2 (see Section
8.5).
8.5 Overall regression results for Model 2: Malaysian context
This section discusses the result of the overall model (see Section 8.5.1) and
the sensitivity analyses carried out for three variables (see Section 8.5.2).

213
8.5.1 Results of the overall models
Model 2 comprises eleven subcategories starting from Model 2(a)(i) to Model
2(h)(ii) (see Table 8.5). In term of the goodness-of-fit for Model 2, Table 8.5
shows that of the eleven models constructed, eight models [i.e. Model 2 (a)(i)
and (ii),(c), (d), (e), (f), (h)(i), and (h)(ii)] reported high Wald Chi-square
values and are statistically significant while three models [i.e. Model 2 (b),
(g)(i), and (g)(ii)] reported low Wald Chi-square values and are non-
significant.
The goodness-of-fit of the models constructed in the present study, which is
based on log-likelihood and the Wald test generated by a random-effects tobit
model, cannot be compared with prior studies examining either goodwill
impairment (e.g. Beatty and Weber, 2006; Guler, 2007; Lapointe-Antunes et
al., 2008; Zang, 2008; AbuGhazaleh et al., 2011) or asset write-offs (e.g.
Francis et al., 1996; Riedl, 2004). This is because none of these studies
applied a random-effects tobit model. For example, Beatty and Weber (2006),
Guler (2007), Lapointe-Antunes et al. (2008), and Zang (2008) analysed
goodwill impairment within a one year period (without analysing a
combination of cross-sectional and time-series data). Hence they were using
tobit regression model.
8.5.2 Sensitivity analyses
Sensitivity analyses are performed on three variables, namely, change in CEO
(see Section 8.5.2.1), managerial ownership (see Section 8.5.2.2), and prior
year earnings (see Section 8.5.2.3). The sensitivity analyses for the first two
variables are tested in Model 2(h)(i) and Model 2(h)(ii). These two models are
selected because they produce the highest Wald Chi-squares with statistically
significant p-values, suggesting that these models can better explain the
overall factors influencing managerial decisions on the measurement of
goodwill impairment than the other models shown in Table 8.5. The
sensitivity analysis for prior year earnings is tested in Model 1, and Models
2(a)(i) to (d) because the variable is not included in Models 2(h)(i) and (ii).

214
Table 8.5: Random-effects tobit regression Model 2: Factors influencing managerial decisions on the measurement of goodwill impairment
Sign
The results of coefficients (Z statistics) for Model 2
(a)(i) (a)(ii) (b) (c) (d) (e) (f) (g)(i) (g)(ii) (h)(i) (h)(ii)
Observations (N) 518 518 374 531 537 537 537 358 358 1124 1124
Intercept -0.047
(-2.75)***
-0.054
(-2.82)***
-0.050
(-2.75)***
-0.060
(-3.87)***
-0.057
(-3.56)***
-0.054
(-3.58)***
-0.061
(-3.95)***
-0.044
(-1.77)*
-0.052
(-2.16)**
-0.038
(-2.76)***
-0.008
(-2.67)***
Economic factors
Log(∆SALES
+1) (H1)
- -0.016
(-0.86)
-0.021
(-1.11)
-0.007
(-0.30)
-0.018
(-0.97)
-0.017
(-0.95)
-0.016
(-0.88)
-0.026
(-1.43)
-0.004
(-0.15)
-0.007
(-0.31)
-0.003
(0.21)
-0.007
(-0.55)
EARNINGSPr
ior (H2A)
- -0.049
(-2.15)**
-0.044
(-1.78)*
-0.049
(-1.45)
-0.041
(-1.63)
-0.040
(-1.62)
- - - - - -
EARNINGSPr
eGWILcurrent
(H2B)
- - - - - - -0.080
(-2.72)***
- -0.064
(-1.48)
- -0.090
(-4.87)***
-
∆EARNINGS
preGWIL (H3)
- - - - - - - 0.104
(2.97)***
- 0.140
(2.52)**
- 0.062
(2.89)***
∆OCF (H4) - 0.002
(0.31)
0.003
(0.37)
-0.007
(-0.41)
0.001
(0.19)
0.002
(0.25)
0.001
(0.20)
0.004
(0.54)
-0.004
(-0.24)
-0.006
(-0.37)
0.002
(0.20)
0.001
(0.10)
BTM (H5) + 0.000
(0.31)
0.001
(1.02)
0.001
(0.33)
0.001
(0.88)
0.001
(0.70)
0.001
(0.62)
0.001
(1.15)
0.000
(0.42)
0.002
(0.98)
-0.001
(-0.56)
-0.000
(0.26)
GWB (H6) + 0.016
(0.70)
0.024
(0.93)
0.010
(0.32)
0.035
(1.32)
0.031
(1.17)
0.034
(1.31)
0.029
(1.11)
0.014
(0.44)
0.003
(0.11)
0.021
(1.31)
0.021
(1.32)
Contracting perspective
DEBTRATIO
(H7)
? 0.002
(0.20)
0.004
(0.36)
-0.005
(-0.40)
0.004
(0.38)
0.006
(0.63)
-0.000
(-0.02)
0.010
(1.06)
-0.006
(-0.51)
0.001
(0.10)
-0.014
(-1.86)*
-0.005
(-0.65)
*, **, *** denote significance at the 0.10, 0.05, and 0.01 level, respectively (two-tailed)

215
Table 8.5 (continue): Random-effects tobit regression Model 2: Factors influencing managerial decisions on the measurement of
goodwill impairment
Sign
The results of coefficients (Z statistics) for Model 2
(a)(i) (a)(ii) (b) (c) (d) (e) (f) (g)(i) (g)(ii) (h)(i) (h)(ii)
Opportunistic behaviour perspective
∆CEOCurrent/prio
r (H8)
+ 0.011
(2.43)**
0.011
(2.42)**
0.015
(2.60)***
0.012
(2.37)**
0.010
(2.23)**
0.009
(2.07)**
0.010
(2.22)**
0.019
(2.82)***
0.019
(2.79)***
0.011
(2.49)**
0.012
(2.63)***
CEOTENUR
E (H9)
- - - - 0.000
(1.13)
- - - 0.000
(0.85)
0.000
(0.65)
0.000
(1.67)*
0.000
(1.24)
BATH (H10) - -0.091
(-2.53)**
-0.079
(-2.13)**
-0.096
(-1.93)*
-0.088
(-2.41)**
-0.082
(-2.25)**
-0.009
(-0.22)
-0.181
(-3.20)***
-0.032
(-0.50)
-0.233
(-2.76)***
-0.052
(-1.96)*
-0.194
(-5.87)***
SMOOTH
(H11)
+ 0.052
(1.36)
0.058
(1.41)
0.09
(1.59)
0.072
(1.78)*
0.066
(1.64)
0.128
(3.51)***
- 0.147
(2.52)**
- 0.080
(3.66)***
-
Ownership structure
MANOWNLine
ar (H12A)
? -0.002
(-0.53)
- - - - - -
MANOWN1
(H12B1)
? - -0.002
(-1.48)
-0.002
(-1.14)
-0.002
(-1.12)
-0.002
(-2.31)**
-0.002
(-2.44)**
MANOWN2
(H12B2)
? - 0.000
(0.97)
0.000
(0.18)
-0.002
(0.30)
0.000
(0.40)
0.000
(0.71)
MANOWN3
(H12B3)
? - 0.000
(0.77)
0.000
(1.15)
0.000
(1.09)
0.000
(0.93)
0.000
(0.33)
OUTCON
(H13)
? -0.000
(-1.75)*
-0.000
(-0.89)
- - - - - -0.000
(-1.21)
-0.000
(-1.10)
-0.000
(-1.87)*
-0.000
(-2.22)**
*, **, *** denote significance at the 0.10, 0.05, and 0.01 level, respectively (two-tailed)

216
Table 8.5 (continue): Random-effects tobit regression Model 2: Factors influencing managerial decisions on the measurement of goodwill impairment
Sign
The results of coefficients (Z statistics) for Model 2
(a)(i) (a)(ii) (b) (c) (d) (e) (f) (g)(i) (g)(ii) (h)(i) (h)(ii)
Discretion - impairment test
CGU01
(H14A)
? 0.005
(1.49)
0.003
(0.81)
- 0.003
(0.75)
0.003
(0.76)
0.002
(0.64)
0.002
(0.51)
- - - -
CGUContinuous
(H14B)
? - - 0.001
(1.26)
- - - - 0.001
(1.22)
0.001
(1.35)
- -
DISCRATE
(H15A)
? - - -0.001
(-1.20)
- - - - -0.001
(-1.01)
-0.001
(-1.12)
- -
DISCMULTI
PLE (H15B)
? - - 0.004
(0.80)
- - - - 0.002
(0.58)
0.003
(0.68)
- -
Control variables
SIZE (H16) ? 0.002
(2.25)**
0.002
(2.05)**
0.002
(1.63)
0.002
(2.03)**
0.002
(1.86)*
0.002
(2.08)**
0.002
(2.06)**
0.002
(1.46)
0.002
(1.58)
0.002
(2.05)**
0.001
(1.45)
INDUSTRYG
5 (H17) 1 –
Indust. and
B.m
?
- - - - - -
2 - Consumer
goods and
serv.
-0.001
(-0.28)
-0.000
(-0.09)
-0.000
(-0.18)
0.002
(0.42)
0.000
(0.08)
3 – Financials 0.000
(0.01)
-0.001
(-0.11)
0.000
(0.09)
-0.000
(-0.22)
0.000
(0.01)
4 - Utilities,
health, Oil
and Gas
-0.004
(-0.65)
-0.004
(-0.72)
-0.005
(-0.76)
-0.004
(-0.75)
-0.005
(-0.96)
*, **, *** denote significance at the 0.10, 0.05, and 0.01 level, respectively (two-tailed)

217
Table 8.5 (continue): Random-effects tobit regression Model 2: Factors influencing managerial decisions on the measurement of goodwill impairment
Sign
The results of coefficients (Z statistics) for Model 2
(a)(i) (a)(ii) (b) (c) (d) (e) (f) (g)(i) (g)(ii) (h)(i) (h)(ii)
5 – Tech. and
Telecom.
0.001
(0.12)
0.000
(0.07)
0.002
(0.29)
0.003
(0.63)
0.003
(0.69)
YEND - Year
1 (H18)
?
- Year 2 0.000
(0.05)
0.001
(0.33)
0.003
(0.72)
0.001
(0.22)
0.001
(0.27)
0.001
(0.27)
0.000
(0.14)
0.003
(0.66)
0.003
(0.68)
0.003
(0.95)
0.002
(0.75)
- Year 3 0.000
(0.01)
-0.000
(-0.08)
0.003
(0.52)
-0.000
(-0.00)
0.000
(0.09)
0.000
(0.13)
-0.001
(-0.17)
0.002
(0.31)
0.001
(0.21)
0.001
(0.40)
-0.000
(-0.13)
ADD (H19) + -0.004
(-1.08)
-0.001
(-0.28)
-0.003
(-0.64)
-0.001
(-0.41)
-0.001
(-0.40)
-0.001
(-0.21)
-0.002
(-0.52)
-0.003
(-0.56)
-0.004
(-0.85)
-0.007
(-2.23)**
-0.008
(-2.67)***
Log
likelihood
225.45 186.86 146.15 185.54 186.66 188.79 185.19 156.73 164.72 378.85 354.86
Wald chi-
square
36.43*** 33.63** 23.09 27.96** 28.20* 31.52*** 24.93** 24.71 24.01 101.49*** 78.91***
*, **, *** denote significance at the 0.10, 0.05, and 0.01 level, respectively (two-tailed)

218
8.5.2.1 Sensitivity analyses – Change in CEO
∆CEOCurrent/prior is defined as a change in CEO which occurs in the previous
financial year or the current financial year (see Appendix 1 of the thesis).
Sensitivity analyses for the ∆CEOCurrent/prior are conducted in order to assess
whether empirical result of the change in CEO would be sensitive to: (i) the
specification of the CEO change year, and (ii) to an additional definition of
CEO change as a change in one of the top five executive positions (hereafter
referred to as top management) - i.e. CEO, President, Chief Executive,
Managing Director, or Chairman, occurring in the previous financial year or
the current financial year (see Section 5.6.1). Accordingly, five additional
definitions of change in CEO are tested. These are:
(i) Change in CEO occurring in the previous financial year (∆CEOPrior),
(ii) Change in CEO occurring in the current financial year(∆CEOCurrent),
(iii) Change in top management occurring in the previous financial year or
the current financial year (∆TopMgtCurent/prior),
(iv) Change in top management occurring in the previous financial
year(∆TopMgtPrior), and
(v) Change in top management occurring in the current financial year
(∆TopMgtCurent).
The results of the sensitivity analyses for ∆CEOCurrent, ∆TopMgtCurent/prior, and
∆TopMgtCurent tested in Models 2(h)(i) and (ii) (see Appendix 8.5) are similar to
∆CEOCurrent/prior as reported in Table 8.5. That is, these variables are found
statistically significant, in a positive direction, in the measurement of
goodwill impairment. The results for all other variables in the models are
almost63 similar to those reported prior to the sensitivity analyses (see
Appendix 8.5). Variables which are found statistically significant (non-
significant) in Models 1 and 2 are found statistically significant (non-
significant) in the sensitivity analyses.
63
There are few variables where the level of significant change. For example, the level of
significant for debt ratio change from p-value less than 0.10 to p-value less than 0.05 (in Model 2(h)(i)-TopMgtprior).

219
When the change in CEO or top management is defined as a change occurring
in the previous financial year (i.e. ∆CEOPrior , and ∆TopMgtPrior), these
variables are found non-significant in the measurement of goodwill
impairment (see Appendix 8.5).
The results of the sensitivity analyses discussed above suggest that the
incoming CEO‘s or top managers took the goodwill write-off soon after joining
their companies; they have not waited a year before deciding to report the
write-off.
8.5.2.2 Sensitivity analyses – Managerial ownership
The sensitivity analysis for managerial ownership is performed into two ways.
Firstly, the sensitivity analysis for the linear relationship between managerial
ownership and the dependent variable is conducted using large data, i.e. in
Model 2(h)(i) and Model 2(h)(ii). The results (see Appendix 8.6 in the last two
columns) reveal that MANOWNLinear is found non-significant in Model 2(h)(i) and
marginally significant (at p-value less than 0.10) in Model 2(h)(ii). Thus, the
result of the sensitivity analysis confirmed the result of Model 2(a)(i) (see
Table 8.5), that is, in a linear relationship, managerial ownership plays less or
no influential role in explaining the measurement of goodwill impairment by
Malaysian listed companies.
Secondly, for the non-linear relationship between managerial ownership and
the dependent variable, the sensitivity analyses are performed by re-defining
the cut-off points from 25% to 20% and from 25% to 30% (see Section 5.7.1). In
both cut-off points, the inferences on managerial ownership, as well as other
variables, are consistent with those in the primary analysis as shown in Table
8.5. Thus, the sensitivity analysis (see Appendix 8.6 in the first four columns)
indicates that the result of the managerial ownership is not sensitive to the
specification of the cut-off point from 25% to 20% and from 25% to 30%.

220
8.5.2.3 Sensitivity analysis – Prior year earnings
The sensitivity analysis for prior year earnings (EARNINGSPrior) is performed by
constructing a new variable, that is, prior year pre-write-off earnings
(EARNINGSPreGWILprior), which is EARNINGSprior after adjusting for (adding back)
goodwill write-off. The results of the sensitivity analysis for
EARNINGSPreGWILprior tested in Models 1, 2(a)(i) to 2(d) reveal that the new
variable is statistically significant (at p-value less than 0.01) in five of the six
models tested (see Appendix 8.7). Thus, the result of the sensitivity indicates
that compared to EARNINGSprior which is found marginally significant (at p-
value less than 0.10) (see Table 8.4), EARNINGSPreGWILprior is more appropriately
employed in the regression model, explaining the measurement of goodwill
impairment by Malaysian listed companies.
Next, Sections 8.6 to 8.10 discuss the regression results for each of the
research questions.
8.6 Research Question 4: Economic factors
In the studies of asset write-off (including goodwill impairment losses),
economic factors refer to factors which may affect the underlying
performance of companies‘ assets (inclusive of goodwill) (Riedl, 2004: 830)
(see Section 5.4). Seven variables are employed in the present measurement
study to test the influence of the economic factors on the measurement of
goodwill impairment by Malaysian listed companies. These are: Log(∆Sales+1),
∆OCF, BTM, GWB, EARNINGSprior, EARNINGSPreGWILCurrent, and ΔEARNINGSpreGWIL
(see Table 8.5).
Of the seven variables tested, two variables, i.e., EARNINGSPreGWILcurrent and
∆EARNINGSpreGWIL are found statistically significant in nearly all of the models.
In addition, EARNINGSprior is found statistically significant in Model 1 and Model
2(a)(i) and (ii). Other variables are found non-significant in the measurement
of goodwill impairment by Malaysian listed companies. The results suggest
that the main economic factors driving the measurement of goodwill

221
impairment are pre-write-off earnings, specifically, current year pre-write-off
earnings (EARNINGSPreGWILcurrent) and change in pre-write-off earnings from
prior year to current year (∆EARNINGSpreGWIL). Next, Sections 8.6.1 to 8.6.5
provide detailed discussion of these results.
8.6.1 Change in sales [Log(∆Sales+1)]
Log(∆Sales+1) is found non-significant in Model 1 (see Table 8.4) and Model 2
(see Table 8.5). Thus, the null hypothesis for H1-Null (see Section 5.4.1) cannot
be rejected. The results in Models 1 and 2 are consistent with Riedl (2004: 843
for post-SFAS121), Guler (2007: 73), and AbuGhazaleh et al. (2011: 190). This
result implies that managers do not take into account the decline in the sales
performance (from prior year to current year) in the measurement of goodwill
impairment losses by Malaysian listed companies.
8.6.2 Companies’ pre-write-off earnings
Three variables are employed to measure company earnings, namely, prior
year earnings (see Section 8.6.2.1), current year pre-write-off earnings (see
Section 8.6.2.2), and change in pre-write-off earnings from prior year to
current year (see Section 8.6.2.3).
8.6.2.1 Prior year earnings (EARNINGSPrior)
Prior year earnings (i.e. EARNINGSPrior) is found marginally significant (at p-
value less than 0.10) in Model 1 and Model 2(a)(ii), in a negative direction as
predicted, in explaining the measurement of goodwill impairment (see Tables
8.4 and 8.5). This result is consistent with AbuGhazaleh et al. (2011: 190) who
documented a marginally significant result (at p-value less than 0.10) for the
EARNINGSPrior. In Model 2(a)(i), the variable is found statistically significant (at
p-value less than 0.05) as predicted. The marginally significant and non-
significant results of the variable in the majority of the models tested are
because the prior year earnings (i.e. EARNINGSPrior) is applied without
adjusting for (adding back) goodwill impairment losses. This is evidenced in
the sensitivity analysis for EARNINGSprior where the variable is redefined as

222
EARNINGSPreGWILprior (prior year pre-write-off earnings) and is found strongly
significant (at p-value less than 0.01) as predicted in five of the six models
tested (see Section 8.5.2.3 and Appendix 8.7).
The statistically significant result for prior year pre-write-off earnings, in a
negative direction, suggests that the poorer the prior year pre-write-off
earnings, the greater the magnitude of goodwill impairment losses reported
by Malaysian listed companies. By reporting goodwill impairment losses when
the prior year pre-write-off earnings are low, managers are reflecting
company economic factors at a firm-level. In this case, it indicates no
accounting choice that is contrary to the economic factors, exercised by
Malaysian listed companies.
8.6.2.2 Current year pre-write-off earnings (EARNINGSPreGWILcurrent)
Current year pre-write-off earnings (EARNINGSPreGWILcurrent) is found statistically
significant in two of the three models tested, in a negative direction as
predicted (see Table 8.5). This result provides support for the alternative
hypothesis set in H2B-Alternative1 (see Section 5.4.2.2). The results suggest that
the poorer the current year pre-write-off earnings, the greater the magnitude
of goodwill impairment losses reported by Malaysian listed companies. By
reporting goodwill impairment losses when the current year pre-write-off
earnings are low, managers are reflecting their expectations of future
performance of the asset (based on past performance) at a firm-level. In this
case, it indicates no accounting choice that is contrary to the expected
impact of economic factors, exercised by Malaysian listed companies.
Thus far, no prior studies have examined the current year pre-write-off
earnings. Hence, comparison of the finding of the present study with prior
studies cannot be made.

223
8.6.2.3 Change in pre-write-off earnings (∆EARNINGSpreGWIL)
In separate random-effects tobit regression models, change in pre-write-off
earnings from prior year to current year (∆EARNINGSpreGWIL) is also statistically
significant in explaining the measurement of goodwill impairment in all of the
models tested (see Table 8.5). However, the variable is found statistically
significant in a positive direction, which is contrary to the prediction for the
economic factors set in the alternative hypothesis H3-Alternative1. The result
suggests that the poorer the company‘s performance, which is reflected as a
negative value for ∆EARNINGSpreGWIL, the lower the magnitude of goodwill
impairment losses reported. In this case, it is possible that the managers are
attempting to avoid reporting goodwill impairment losses, or reporting a small
magnitude of goodwill impairment losses, hoping that the company‘s
performance will improve in the future. Accordingly, managers‘ decisions in
reporting goodwill impairment losses do not reflect their expectations of the
future performance of the asset at a firm-level (based on past performance),
which may point to the possibility of accounting choices being exercised. This
result is inconsistent with Riedl (2004: 843) and Guler (2007: 73). Riedl (2004:
843) documented a non-significance of ∆EARNINGSpreGWIL and the asset write-
offs post-SFAS121. Meanwhile, Guler (2007: 73) reported ∆EARNINGSpreGWIL as
statistically significant in a negative direction in the measurement of goodwill
impairment.
The two conflicting results for pre-write-off earnings as discussed above, i.e. -
(i) pre-write-off earnings, measured at one specific point in time (i.e.
EARNINGSPreGWILprior, and EARNINGSPreGWILcurrent) and (ii) the change in pre-write-
off earnings from prior year to current year (i.e. ∆EARNINGSpreGWIL) will be
discussed further in Section 8.12.1 by positioning them in context of the
overall results of the measurement study.
8.6.3 Change in operating cash flows (∆OCF)
Consistent with Riedl (2004: 843), who examined asset write-offs, in the
present study, ∆OCF is non-significant in explaining the measurement of

224
goodwill impairment (see Tables 8.4 and 8.5). Thus, the null hypothesis for H4-
Null (see Section 5.4.3) cannot be rejected. This result implies that changes in
operating cash flows do not play an influential role in the measurement of
goodwill impairment by Malaysian listed companies.
8.6.4 Book-to-market ratio (BTM)
Consistent with Francis et al. (1996: 126), BTM is found non-significant in all
of the models tested (see Tables 8.4 and 8.5). Thus, the null hypothesis for
H5-Null (see Section 5.4.4) cannot be rejected. However, this result is in
contrast with the results of Beatty and Weber (2006: 281), Guler (2007: 73)
and AbuGhazaleh et al. (2011: 190) who documented statistically significant
results for BTM in their analyses of the measurement of goodwill impairment.
The non-significance of BTM implies that the intensity of expected economic
impairment of goodwill has no impact on the measurement of goodwill
impairment. Possibly, this occurs when companies‘ market values fall below
the book values of their net assets due to a short-term volatility in the stock
market.
8.6.5 Relative size of goodwill balance (GWB)
Consistent with AbuGhazaleh et al. (2011: 190), relative size of goodwill
balance (GWB) is found non-significant in all of the models tested in the
present study (see Tables 8.4 and 8.5). Thus, the null hypothesis for H6-Null
(see Section 5.4.5) cannot be rejected. The non-significance of GWB implies
that the exposure of goodwill balance, measured in terms of the amount of
goodwill balance in their asset composition, has no influence on the
measurement of goodwill impairment.
8.7 Research Question 5: Contracting perspective (DEBTRATIO)
The contracting perspective, in particular, the debt hypothesis is tested using
debt ratio (see Section 5.5). The variable is found marginally significant in
Model 2(h)(i) and non-significant in the remaining models tested (see Tables

225
8.4 and 8.5). Thus, the null hypothesis for H7-Null (see Section 5.5) cannot be
rejected. Accordingly, the present study could not provide support to the
contracting perspective in explaining the measurement of goodwill
impairment by Malaysian listed companies. This result is consistent with Guler
(2007: 73) and AbuGhazaleh et al. (2011: 190). The non-significance of
DEBTRATIO found in the majority of the models is possibly because as noted
by Lys (1984), Fields et al., (2001) and Dichev and Skinner (2002), leverage
(i.e. DEBTRATIO) does not fully capture the default risk of debt (see Section
2.3.1.2).
8.8 Research Question 6: Opportunistic behaviour perspective
Four variables are employed to test an opportunistic behaviour perspective,
namely, change in CEO (see Section 8.8.1), CEO tenure (see Section 8.8.2),
big bath reporting (see Section 8.8.3), and earnings smoothing (see Section
8.8.4).
8.8.1 Change in CEO (∆CEOCurrent/prior)
Consistent with Lapointe-Antunes et al. (2008: 48), Zang (2008: 53), and
AbuGhazaleh et al. (2011: 190), change in CEO (∆CEOCurrent/prior) is found
statistically significant in a positive direction in all of the models tested in the
present study (see Tables 8.4 and 8.5). This result provides support for the
alternative hypothesis set in H8-Alternative (see Section 5.6.1), suggesting that
incoming CEOs reported larger magnitude of goodwill impairment losses than
continuing CEOs. The sensitivity analyses performed on ∆CEOCurrent/prior provide
additional evidence that the incoming CEOs took the goodwill write-off as
soon as joining the companies (i.e. in the current year) instead of waiting for
a year (see Section 8.5.2.1 for the discussion of the sensitivity analyses).
The conclusion reached is that, to the extent that the economic factors
control for the underlying performance of the companies, change in CEO may
capture additional incentives for the incoming CEOs to expedite future
charges in the hope of improving investors‘ perceptions of the companies‘

226
future performances. Accordingly, similar to prior studies (i.e. Elliott and
Shaw, 1988; Francis et al., 1996; Riedl, 2004), this result provides support to
an opportunistic behaviour perspective.
8.8.2 CEO tenure (CEOTENURE)
CEO tenure, a variable proxying for whether a CEO is responsible in business
acquisitions leading to an existence of goodwill (Beatty and Weber, 2006:
266), is non-significant in all of the subcategories of Models 2 tested [except
in Model 2(h)(i) where the variable is found marginally significant] (see Table
8.5). Thus, the null hypothesis for H9-Null (see Section 5.6.2) cannot be
rejected. This result could not provide support to the opportunistic behaviour
perspective.
The non-significance of CEOTENURE, which is inconsistent with Beatty and
Weber (2006: 280) and Ramanna and Watts (2012), suggests that for a large
number of Malaysian listed companies, the number of years a CEO held a
position is an indirect proxy for whether the CEO was responsible with an
existence of goodwill. This result could partly be explained by looking at the
relationship between CEOTENURE and the ratio of the number of companies
which have newly acquired goodwill (i.e. ADD64 in H19) (see Figure 8.2).
Figure 8.2: The relationship between CEO tenure and companies’ addition to their goodwill
64
A dichotomous variable, equal to one if company i has additions to its goodwill due to
acquisitions during the financial year, and zero when there is no addition (see Section 5.9.4).
CEO Tenure

227
Figure 8.2 shows that companies that have CEOs with short tenure (e.g. below
five years) have more addition to its goodwill than companies that have CEOs
with longer tenure (e.g. five years and more). This means that CEOs with
short tenure acquired more goodwill in the current year compared to CEOs
with long tenure. Ramanna and Watts (2012) argues that CEOs with longer
tenure are less likely to take goodwill impairment losses in order to shield
their reputations from the implications of the write-offs. The figure
demonstrates that this argument could also apply to CEOs with short tenure.
Hence, in the present study, the argument that a CEO who acquired goodwill
is reluctant to impair it, can apply to both CEOs with short tenure and CEOs
with long tenure.
8.8.3 Big bath reporting (BATH)
BATH is found statistically significant, in a negative direction, in Model 1 (see
Table 8.4) and in nearly all of the subcategories of Models 2 tested (see Table
8.5). This result provides support for the alternative hypothesis set in H10-
Alternative (see Section 5.6.3), suggesting that the stronger the downward trend
in companies‘ change in pre-write-off earnings from prior year to current
year, the higher the magnitude of goodwill impairment losses reported. This
finding is consistent with AbuGhazaleh et al. (2011: 190) and Riedl (2004:
843).
To the extent that change in pre-write-off earnings (∆EARNINGSpreGWIL- one of
the variables testing the economic factors, see Section 8.6.2.3) controls for
the performance of the underlying economic values of the assets, the
statistically significant negative association between BATH and reporting
goodwill impairment losses found in the present study may capture an
incremental effect relating to the big bath reporting incentives. Thereby,
similar to Riedl (2004: 833), this finding provides supports to the opportunistic
behaviour perspective.
It is noted that there is an alternative interpretation of this result provided by
prior study (i.e. AbuGhazaleh et al., 2011: 194) (see Section 5.6.3,). That is,
the larger negative pre-write-off earnings surprise could also imply that

228
managers are taking a big bath to reveal private information about the
company‘s true value (AbuGhazaleh et al., 2011: 194). However, the tests
conducted in this thesis do not distinguish between these two interpretations.
8.8.4 Earnings smoothing (SMOOTH)
SMOOTH is marginally significant (at p-value less than 0.10) in Model 1 (see
Table 8.4) and statistically significant in Models 2 (e), (g)(i), and (h)(i) (see
Table 8.5). This result provides support for the alternative hypothesis set in
H11-Alternative (see Section 5.6.4). The significantly positive association between
SMOOTH and the magnitude of goodwill impairment losses suggests that the
stronger the upward trend in companies‘ earnings (measured in term of above
the median of non-zero positive values in the change in pre write-off
earnings, and zero otherwise), the higher the magnitude of goodwill
impairment losses reported. Accordingly, this finding provides support to the
smoothing hypothesis, which is consistent with the findings reported by
Francis et al. (1996: 125)65, Guler (2007: 73), and AbuGhazaleh et al. (2011:
190). Hence, the result provides support to an opportunistic behaviour
perspective, suggesting that Malaysian listed companies make use of goodwill
impairment losses as a tool to smooth earnings.
8.9 Research Question 7: Ownership structures
Two variables, i.e. managerial ownership, and outside ownership
concentration are employed to test the influence of companies‘ ownership
structures on the measurement of goodwill impairment. The descriptive
analysis reported in Appendix 8.2 shows that the ownership structures of
65 The definition of SMOOTH provided by Francis et al. (1996: 126) and Guler (2007: 22) differ from Riedl (2004: 843), AbuGhazaleh et al. (2011: 190) and this thesis. Francis et al. (1996: 126) defines SMOOTH as ‗operating earnings in the current year less operating earnings in the previous year]/total assets at the end of year-1‘. In this thesis, SMOOTH is defined in a similar way to Riedl (2004: 843) and AbuGhazaleh et al. (2011: 190) as ‗change in company i‘s pre-write-off earnings from t-1 to t divided by total assets at the end of t-1, when this change is above the median of non-zero positive values of this variable, and zero otherwise‘. Hence, SMOOTH in the present study focused on companies which are more likely to have an incentive to engage in earnings smoothing.

229
Malaysian listed companies which implement FRS 3 is concentrated, in that
the five largest outside shareholders (OUTCON) hold on average 46.8% of the
companies‘ shares. Sections 8.9.1 and 8.9.2 discuss the result of these
variables.
8.9.1 Managerial ownership (MANOWNLinear and MANOWNNon-monotonic)
The influence of managerial ownership on the measurement of goodwill
impairment is tested in two ways – linear relationship and non-monotonic
relationship (see Section 5.7.1). For the linear relationship, the result shows
that managerial ownership is non-significant in Model 2(a)(i) (see Table 8.5)
and Model 2(h)(i) (see Appendix 8.6). It is marginally significant (at p-value
less than 0.10) in model 2(h)(ii) (see Appendix 8.6). This finding suggests that
in a linear relationship, managerial ownership plays less or no influential role
in the measurement of goodwill impairment by Malaysian listed companies.
The non-monotonic relationship between managerial ownership and the
measurement of goodwill impairment is tested using three variables which
reflect three cut-off points. These are: (i) MANOWN1 when the managerial
ownership is between 0% and less than 5%, (ii) MANOWN2 when the managerial
ownership is between 5% to less than 25%, and (iii) MANOWN3 when the
managerial ownership is from 25% onwards (see Section 5.7.1). The results
show that at the outset, in Model 2(a)(ii), managerial ownership (i.e.
MANOWN1, MANOWN2, and MANOWN3) is found non-significant in the
measurement of goodwill impairment by Malaysian listed companies.
However, in Model 2(h)(i) and Model 2(h)(ii), with the exclusion of variables
testing the discretion, such as CGUs and discount rates that suffer from high
frequency of missing values, MANOWN1 is found statistically significant (at p-
value less than 0.05) in a negative direction, in explaining the measurement
of goodwill impairment. MANOWN2 and MANOWN3 independently are
positively associated with the magnitude of goodwill impairment losses.
However, they are non-significant in the measurement of goodwill
impairment. These results suggest that as the managerial ownership increases
from 0% to less than 5% (in MANOWN1), the magnitude of goodwill impairment

230
losses reduces. Nevertheless, when the managerial ownership is at 5% and
beyond (i.e. as in MANOWN2 or MANOWN3), managerial ownership has no
influential role in the measurement of goodwill impairment. The sensitivity
analysis carried out by altering the cut-off points from 25% to 20% and from
25% to 30% (see Section 8.5.2.2 and Appendix 8.6) shows that the result of the
managerial ownership remained similar, in that, MANOWN1 is found
statistically significant in a negative direction while MANOWN2 and
MANOWN3, individually, is non-significant in the measurement of goodwill
impairment by Malaysian listed companies.
Carlson and Bathala (1997: 191), in their study of managerial ownership and
income smoothing, explained that in companies where managers hold less or
no shares (i.e. management-controlled companies), the managers are more
likely to present the companies‘ operating results in the most favourable
manner as a job preserving strategy. Applying this explanation to the result
discussed above, it makes sense to observe a negative association between
managerial ownership (MANOWN1) and the magnitude of goodwill impairment
losses by Malaysian listed companies when the managerial ownership from is
0% to less than 5%. This is because reporting goodwill impairment losses
reduce companies‘ earnings. Therefore, in reporting goodwill impairment
losses, the managers might not be able to present the operating result of the
companies in the best possible manner to the shareholders. Hence, as the
managerial ownership increases, lower magnitude of goodwill impairment
losses are reported by companies in which the managers hold between 0% and
less than 5% of the shares. Thus, the result for MANOWN1 provides support to
the incentives effect (see Section 5.7.1), in that, as managerial ownership
increases from 0% to less than 5%, managers‘ incentives become closely
aligned with shareholders.
8.9.2 Outside ownership concentration (OUTCON)
OUTCON is found statistically significant, in a negative direction, in Model
2(h)(ii) and marginally significant in (at p-value less than 0.10) in Models
2(a)(i) and (h)(i) (see Table 8.5). This finding suggests that as the level of

231
outside ownership concentration increases, less magnitude of goodwill
impairment losses is reported. Prior studies (e.g. Niehaus, 1989: 271-272;
Astami and Tower, 2006: 8) associate an increase in outside ownership
concentration (OUTCON) with an increase in shareholders monitoring of the
management (see Section 5.7.2). Following this explanation, the result of the
present study suggests that as the level of outside ownership concentration
increases, indicating an increase in outside monitoring, lower goodwill
impairment losses are reported.
8.10 Research Question 8: Discretion available in performing an impairment test of goodwill
None of the variables testing the discretion, including CGUs (see Section
8.10.1) and discount rates (see Section 8.10.2) employed in performing
impairment test of goodwill is significant in explaining the measurement of
goodwill impairment by Malaysian listed companies.
8.10.1 Cash-generating-units containing goodwill (CGU01 and CGUContinuous)
Two variables, namely, CGU01 and CGUContinuous are employed in a separate
model to test the influence of managerial discretion with regard to CGUs on
the measurement of goodwill impairment – (see Section 5.8.1). None of these
variables is found statistically significant in explaining the measurement of
goodwill impairment by Malaysian listed companies. Accordingly, the null
hypotheses set in H14A-Null for CGU01 and H14B-Null for CGUContinuous cannot be
rejected. For CGU01, the result is consistent with AbuGhazaleh et al. (2011:
190) who also found the variable to be non-significant in the measurement of
goodwill impairment by UK listed companies. Thus, the result suggests that
the number of CGUs plays no influential role in the measurement of goodwill
impairment.

232
8.10.2 Discount rates (DISCRATE, DISCMULTIPLE, and DISCRATEDisclosed/Not )
Three variables are employed to test the influence of managerial discretion
with regard to discount rates on the measurement of goodwill impairment by
Malaysian listed companies. These are DISCRATE, DISCMULTIPLE, and
DISCRATEDisclosed/Not (see Section 5.8.2). DISCRATEDisclosed/Not is excluded from
the regression analysis because of the multicollinearity between the variable
and DISCRATE. Similar to managerial discretion relating to CGUs, all of the
variables testing discount rates are found non-significant in explaining the
measurement of goodwill impairment. Therefore, the null hypothesis for H15A-
Null (for DISCRATE), and H15B-Null (for DISCMULTIPLE) cannot be rejected. Thus
far no prior studies have explored the application of discount rates in the
measurement of goodwill impairment (see Section 5.8.2). Accordingly, the
result of the present study cannot be compared with prior studies.
The non-significance of the discount rates suggests that there is little
variation in the discount rate applied by companies. In estimating the
recoverable amount of CGUs containing goodwill, managers could reflect their
expectation concerning possible variation in the recoverable amount, in
particular, the value-in-use, either through adjustment to the forecasted cash
flow or adjusted to the discount rate (FRS 136, paragraph 30-32) (see Section
4.4.2). Possibly, in the case of Malaysian listed companies examined in the
present chapter, the expectation about possible variation in the value-in-use
is reflected in the forecasted cash flow rather than the discount rates. Hence,
the application of discount rates has no influence on the measurement of
goodwill impairment.
8.11 Company-specific factors (control variables)
Four variables are included in the regression model in controlling for
company-specific factors. These are SIZE (see Section 8.11.1), INDUSTRYG5
(see Section 8.11.2), YEND (see Section 8.11.3), and ADD (see Section 8.11.4).
233
8.11.1 Size of company (SIZE)
SIZE is found statistically significant in a positive direction, in the majority of
the models tested (see Tables 8.4 and 8.5). This result provides support for
the alternative hypothesis set in H16-Alternative (see Section 5.9.1), suggesting
that as company size increases, larger magnitude of goodwill impairment
losses is reported. This finding is consistent with Francis et al. (1996: 125-
126), Beatty and Weber (2006: 281), Guler (2007: 73), and Zang (2008: 52).
However, it differs with AbuGhazaleh et al. (2011: 190) possibly because their
study focused on the top 500 UK listed companies, where, there is not much
variation of SIZE resulting in the variable being found to be non-significant.
8.11.2 Types of industry (INDUSTRYG5)
Consistent with Beatty and Weber (2006: 283), and AbuGhazaleh et al. (2011:
195), types of industry (INDUSTRYG5), which is an industry classification based
on five groups (see Appendix 8.3) is found non-significant in all of the models
tested (see Table 8.5). Thus, the null hypothesis for H17-Null (see Section 5.9.2)
cannot be rejected, suggesting that types of industry play no influential role
in the measurement of goodwill impairment by Malaysian listed companies.
8.11.3 Financial year-end (YEND)
YEND, a dummy variable created to control for the three-year period of study,
is found non-significant in all of the models tested (see Tables 8.4 and 8.5).
This result is consistent with AbuGhazaleh et al. (2011: 190) who reported
non-significant results for their year dummy. Thus, the null hypothesis for H18-
Null (see Section 5.9.3) cannot be rejected. This finding suggests that different
financial year-ends have no influence on the measurement of goodwill
impairment by Malaysian listed companies.

234
8.11.4 Addition to goodwill (ADD)
ADD, a dummy variable capturing an addition to company goodwill, is found
non-significant in Model 1 (see Table 8.4), and Model 2 (see Table 8.5). In
Model 2(h)(i) and (ii), the variable is found statistically significant, in a
negative direction, which is contrary to the prediction set in H19-Alternative (see
Section 5.9.4). This is possibly because Malaysian listed companies do not
impair their newly acquired goodwill. This result is inconsistent with the
finding of AbuGhazaleh et al. (2011: 190) who documented ADD to be
statistically significant, but in a positive direction.
8.12 Overall results of the measurement study
Overall, the results of the random-effects tobit regression Models 1 and 2
show that after controlling for company-specific factors, three main factors
play influential roles in the measurement of goodwill impairment by Malaysian
listed companies during the first three years of the FRS 3 implementation.
These factors are: economic factors (in particular, companies‘ pre-write-off
earnings), an opportunistic behaviour perspective (i.e. BATH, SMOOTH, and
∆CEOCurrent/prior), and ownership structures (i.e. outside ownership
concentration, and managerial ownership). The remaining two factors,
namely, contracting perspective, and discretion, such as CGUs and discount
rates available to managers in performing impairment test of goodwill are
found non-significant in the measurement of goodwill impairment by
Malaysian listed companies.
Two points are worth further discussion. These are conflicting results for
types of pre-write-off earnings employed (see Section 8.12.1), and the
interpretation of the findings of the measurement study using the self-
constructed disclosure framework (see Section 8.12.2).

235
8.12.1 Conflicting results for two different measures of pre-write-off earnings
For the economic factors, conflicting results are obtained depending on the
measures of pre-write-off earnings that are selected in a particular model
(see Section 8.6.2.3). When regression models employ company earnings at
one specific point in time (i.e. prior year earnings in Section 8.6.2.1, prior
year pre-write-off earnings in Appendix 8.7, and current year pre-write-off
earnings in Section 8.6.2.2), the findings show for example, that as the
current year pre-write-off earnings increase, the magnitude of goodwill
impairment losses reported decreases. The results for these variables imply
that managers are reporting goodwill impairment losses to reflect the
underlying economic values of the company. On the other hand, when
regression models employ a change in pre-write-off earnings from prior year
to current year (i.e. ∆EARNINGSpreGWIL in Section 8.6.2.3), the positive
association between the variable and the magnitude of goodwill impairment
losses seems to point to the possibility of companies exercising accounting
choices related to goodwill impairment. The result for change in pre-write-off
earnings seems to be in line with that of the opportunistic behaviour
perspective. This is because for the opportunistic behaviour perspective,
regardless of the models employed, a change in CEO (∆CEOCurrent/prior) (see
Section 8.8.1), big bath reporting (BATH) (see Section 8.8.3), and earnings
smoothing (SMOOTH) (see Section 8.8.4) provide consistent results supporting
the perspective, suggesting that there is a possibility for companies exercising
the accounting choice.
The results discussed in the above paragraph seem rather perplexing, as they
suggest that in one random-effects tobit regression model, the economic
factors (in particular earnings which is measured at one specific point in time)
and the opportunistic behaviour perspective (i.e. change in CEO, BATH, and
SMOOTH) work in an opposite direction in explaining the measurement of
goodwill impairment by Malaysian listed companies. To further understand the
two conflicting results, detailed investigation of 30 companies has been
carried out. These 30 companies comprise three groups: (i) 10 companies with
the highest change in pre-write-off earnings (i.e. ΔEARNINGSpreGWIL), (ii) 10

236
companies with the lowest change in pre-write-off earnings (i.e.
ΔEARNINGSpreGWIL), and (iii) 10 companies with a change in pre-write-off
earnings (i.e. ΔEARNINGSpreGWIL) which falls in the middle.
Detailed investigation of these three groups of company, together with their
current year pre-write-off earnings, earnings smoothing, and big bath
reporting, reveals that the number of companies which reported goodwill
impairment losses is greater for the two groups of company which have the
highest and the lowest change in pre-write-off earnings rather than for the
middle group. This result suggests that companies are behaving differently
with regard to the relative magnitude of goodwill impairment losses reported
depending on their level of pre-write-off earnings. As the companies‘ current
year pre-write-off earnings increase, lower relative magnitude of goodwill
impairment losses reported. However, as the gap between the current year
pre-write-off earnings and the prior year pre-write-off earnings is large
(leading to companies‘ engaging in big bath reporting or earnings smoothing),
higher relative magnitude of goodwill impairment losses is reported. This
finding corroborates the finding of McNichols and Wilson (1988: 4) who found
that companies with extreme earnings (either unusually high or low66) chose
an income-decreasing accounting choice (in their case the discretionary
component of the provision for bad-debts). Therefore, in the context of the
present measurement study, in one random-effects tobit regression model, it
is possible that an opportunistic behaviour perspective and economic factors
work in opposite directions, as companies are behaving in a different way
depending on their level of pre-write-off earnings.
8.12.2 Interpretation of the findings of the measurement study using the self-constructed disclosure framework
The second point for discussion is that in an attempt to further understand
the result of the measurement study discussed in this chapter, the researcher
has re-applied the disclosure framework which has been constructed in the
66 The definition of extreme earnings provided by McNichols and Wilson (1988: 13) is the comparison of the current year with prior year earnings which is deflated by total assets.

237
disclosure study (in Chapter 7) to the result of the measurement study (in
Chapter 8). Specifically, from the result of the measurement study, the
researcher has selected 10 companies found to be engaging in earnings
smoothing, with no change in their CEOs, and where the management hold
the top 10 highest proportion of shares (i.e. ranging from 31.78% to 51.70%).
The aim here is to understand why continuing CEOs, or top managers holding a
large proportion of company shares, would reduce the goodwill balance (by
reporting goodwill impairment losses) merely for the purposes of earnings
smoothing.
Using the self-constructed disclosure framework (discussed in Chapter 7 – see
e.g. Table 7.3 in Section 7.3.1), the goodwill data, segment result, financial
performance, the market capitalisation indication, reasons for reporting
goodwill impairment loss disclosed in the Notes to the Financial Statement,
and audit report concerning goodwill of these companies are scrutinised.
Detailed investigation reveals that of the 10 companies selected, four67
companies are found to report goodwill impairment losses because of the
characteristic of the goodwill. Two companies impaired goodwill which arose
from an apparent overpayment made at the time of acquisition (see Section
7.3.2 for discussion of the apparent overpayment) and another two companies
impaired goodwill immediately upon acquisition. In the case of these four
companies, these results suggest that the managers have already decided on
the amount of goodwill impairment losses to be reported. When changes in
pre-write-off earnings are large68, the managers take the opportunity to
eliminate the goodwill. Although the investigation discussed above involved a
small number of companies (10 companies), the result helps contextualise one
of the motives of Malaysian listed companies for engaging in earnings
smoothing by reporting goodwill impairment losses.
67 For the remaining six companies, their reasons could not be identified by the researcher.
68 Earnings smoothing is defined as a change in pre-write-off earnings from prior period to current period, divided by total assets at the end of prior period, when this change is above the median of non-zero positive value for the variable, and zero otherwise.

238
8.13 Summary and conclusions
This chapter has analysed factors influencing managerial decisions on the
measurement of goodwill impairment by Malaysian listed companies in the
first three years of the implementation of FRS 3 Business Combinations. The
factors are grouped into economic factors (see Section 8.6), contracting
perspective (see Section 8.7), opportunistic behaviour perspective (see
Section 8.8), ownership structures (see Section 8.9), discretion available to
managers in performing an impairment test of goodwill (see Section 8.10),
and company-specific factors (see Section 8.11). In analysing these factors,
two main random-effects tobit regression models have been constructed, i.e.
Model 1, and Models 2(a)(i) to 2(h)(ii) (see Section 8.3.3).
The analysis of the measurement of goodwill impairment by Malaysian listed
companies began with Model 1, by testing as closely as possible the variables
tested by AbuGhazaleh et al. (2011) (exceptions include corporate governance
variables and a cross listing variable) (see Section 8.3.3). The comparison of
results reported in Model 1 of the present chapter with the study of UK listed
companies as undertaken by AbuGhazaleh et al. (2011) (see Table 8.4 in
Section 8.4), shows that Malaysian listed companies behave similarly to UK
listed companies with respect to a variable testing the economic factors (i.e.
prior year earnings), a variable testing the contracting perspective (i.e. debt
ratio), and three variables testing the opportunistic behaviour perspective
(i.e. change in CEO, big bath reporting, and earnings smoothing). They also
behave similarly to UK listed companies with respect to a variable testing the
discretion available to managers in performing impairment test of goodwill
(i.e. CGU01 - the only discretion that is tested by AbuGhazaleh et al., 2011). In
contrast, Malaysian listed companies differ from UK listed companies with
regard to two variables testing companies‘ economic factors (BTM, and ΔOCF)
and two variables testing company-specific factors (i.e. ADD and SIZE).
In regression Model 2, the present measurement study goes beyond
AbuGhazaleh et al. (2011) in the following three ways. Firstly, it introduces
variables that are specific to Malaysian listed companies, i.e. ownership

239
structures - managerial ownership, and outside ownership concentration (see
Section 8.9). Secondly, it brings in variables that are pertinent to
understanding the measurement of goodwill impairment but are not tested by
AbuGhazaleh et al. (2011), namely CEO tenure and industry variable (see
Section 8.3.3). Thirdly, it explores companies‘ earnings with three different
definitions, namely, prior year earnings (see Section 8.6.2.1), current year
pre-write-off earnings (see Section 8.6.2.2), and change in pre-write-off
earnings from prior year to current year (see Section 8.6.2.3).
The main conclusions of the chapter are as follows:
Firstly, with regard to the theoretical contributions, the present measurement
study has provided support for the opportunistic behaviour perspective in
explaining the measurement of goodwill impairment by Malaysian listed
companies (see Section 8.8). The applicability of the opportunistic behaviour
perspective is based on the statistically significant results for ∆CEOCurrent/prior,
BATH and SMOOTH. However, the present study could not provide support for
the contracting perspective in explaining the measurement of goodwill
impairment (see Section 8.7).
Secondly, although the opportunistic behaviour perspective is applicable in
explaining the measurement of goodwill by Malaysian listed companies, the
results generated from Model 2 have shown that not all of the companies‘
decisions in reporting goodwill impairment losses are driven solely by the
opportunistic behaviour perspective. The conflicting results for the economic
factors, in particular, the companies‘ pre-write-off earnings suggest that
companies behave differently depending on their level of earnings (see
Section 8.12.1). As the current year pre-write-off earnings increase, lower
magnitude of goodwill impairment losses are reported. However, as there is a
larger earnings surprise69 between the current year pre-write-off earnings and
69 Larger refers to BATH, and SMOOTH. As shown in Appendix 1 of the thesis, BATH is defined as a change in pre-write-off earnings from prior year to current year, divided by total assets at the end of prior year, when this change is below the median of non-zero negative values of this variable, and zero otherwise. Meanwhile, SMOOTH is defined as a change in pre-write-off earnings from prior year to current year, divided by total assets at the end of prior year, when this change is above the median of non-zero positive values of this variable, and zero otherwise.

240
the prior year pre-write-off earnings, higher magnitude of goodwill
impairment losses is reported.
Thirdly, with regard to the ownership structures, the present study has shown
that Malaysian listed companies have concentrated ownership, in that, the
five largest outside shareholders (OUTCON) hold on average 46.8% of the
companies‘ shares (see Section 8.9). This finding suggests that concentrated
ownership of companies does not prevent managerial opportunism. Unlike
listed companies located in developed economies where the opportunistic
behaviour occurs due to an agency conflict between shareholders and
managers (see Section 2.3.2), for the Malaysian listed companies which
implement FRS 3, managerial opportunism most probably occurs because of an
agency conflict between the controlling shareholders (shareholders outside of
the companies) and the minority shareholders. Within this conflict, managers
would possibly act on behalf of the controlling shareholders at the expense of
the minority shareholders.
Finally, the present measurement study has tested the non-monotonic
relationship between managerial ownership and the magnitude of goodwill
impairment losses (see Section 8.9.1). In doing so, the study has provided
evidence on the influence of managerial ownership on the measurement of
goodwill impairment when the executive directors collectively hold less than
5% of a company‘s shares. However, where executive directors collectively
hold 5% or more of the shares, managerial ownership has no influential role on
the measurement of goodwill impairment by Malaysian listed companies.
Thus, this finding highlights the need to incorporate managerial ownership
(using a non-monotonic approach - see Section 5.7.1) in order to provide a
more comprehensive model of accounting choices related to goodwill
impairment by Malaysian listed companies.

241
Appendix 8.1: Break down of companies which have reported goodwill impairment losses into one time impairers and repeated impairers and their mean and median values of the ratio of
goodwill write-off to prior year total assets (including goodwill)
Initial year Second year Third year
Impairers N Mean Median N Mean Median N Mean Median
One time impairment 82
0.0048
0.0010 67
0.0173
0.0015 65
0.0179
0.0044
Repeated impairers
- Twice 12 0.0115 0.0030 - - - 12 0.0174 0.0031
- Consecutively (years 1 and 2) 22 0.0041 0.0027 22 0.0098 0.0018 - - -
- Consecutively (years 2 and 3) 15 0.0032 0.0003 15 0.0022 0.0003
- Thrice 19 0.0321 0.0061 19 0.0107 0.0046 19 0.0126 0.0063
Total 135 123 111

242
Appendix 8.2: Descriptive statistics for the continuous variables for total firm-years within the three years period of study
All observations Write-off group
GWIL(IL)
Non-Write-off group
GWIL(0)
Test of differences (write-
off vs. Non-write-off)
N Missing
values
Mean Median
SD Mean Median
SD Mean Median
SD Mean
p-value
Median
p-value
Dependent variable GWIL 1498 - 0.003 0.000 0.017 0.012 0.002 0.032 - - - - -
Economic factors
∆SALES (H1) 1498 - 0.092 0.047 0.297 0.080 0.030 0.292 0.096 0.056 0.299 0.387 0.027
EARNINGSPrior (H2A) 1486 12 0.042 0.043 0.107 0.015 0.028 0.120 0.050 0.048 0.101 0.000 0.000
EARNINGSPreGWILcurrent (H2B) 1486 12 0.039 0.036 0.102 0.011 0.025 0.110 0.048 0.038 0.098 0.000 0.000
∆EARNINGSpreGWIL (H3) 1486 12 0.008 0.005 0.092 0.004 0.005 0.109 0.009 0.006 0.085 0.406 0.769
∆OCF (H4) 1489 9 0.014 0.010 0.157 0.015 0.007 0.197 0.014 0.011 0.142 0.897 0.565
BTM (H5) 1498 - 1.585 1.280 1.301 1.622 1.410 1.256 1.573 1.240 1.315 0.526 0.143
GWB (H6) 1309 189 0.051 0.019 0.081 0.046 0.017 0.072 0.053 0.019 0.084 0.176 0.144
Contracting perspective
DEBTRATIO (H7) 1422 76 0.252 0.237 0.173 0.255 0.238 0.177 0.251 0.237 0.171 0.720 0.915
Opportunistic behaviour perspective
CEOTENURE (H9) 1389 109 7.307 5.000 7.244 7.733 5.000 8.034 7.167 5.000 6.962 0.208 0.682
BATH (H10) 1486 12 (0.018) 0.000 0.052 (0.026) 0.000 0.070 (0.015) 0.000 0.044 0.000 0.015
SMOOTH (H11) 1486 12 0.024 0.000 0.069 0.029 0.000 0.073 0.023 0.000 0.068 0.108 0.295
Ownership structure
MANOWNLinear (H12A) 1434 64 10.189 2.745 14.756 10.348 2.335 15.156 10.137 2.895 14.628 0.794 0.459
MANOWN1 (H12B1) 1434 64 2.624 2.760 2.286 2.509 5.371 2.497 2.662 2.895 2.283 0.274 0.208
MANOWN2 (H12B2) 1434 64 5.201 0.000 7.815 2.350 0.000 0.000 5.145 0.000 7.720 0.636 0.696
MANOWN3 (H12B3) 1434 64 2.372 0.000 6.725 2.296 8.104 6.820 2.331 0.000 6.697 0.686 0.365
OUTCON (H13) 1434 64 46.816 46.620 20.208 45.123 44.465 19.613 47.379 47.105 20.379 0.067 0.066

243
Appendix 8.2 (continue): Descriptive statistics for the continuous variables for total firm-years within the three years period of study
All observations Write-off group
GWIL(IL)
Non-Write-off group
GWIL(0)
Test of differences (write-
off vs. Non-write-off)
N Missing
values
Mean Median
SD Mean Median
SD Mean Median
SD Mean
p-value
Median
p-value
Discretion in performing an impairment test of goodwill
CGUcontinuous (H14B) 659 839 2.387 2.000 1.769 2.759 2.000 2.237 2.265 2.000 1.570 0.002 0.006
DISCRATE (H15A) 726 772 8.736 8.000 3.172 8.766 8.000 2.896 8.726 8.000 3.257 0.885 0.745
Control variables
SIZE (H16) 1498 - 12.877 12.671 1.635 13.039 12.828 1.753 12.824 12.634 1.592 0.0284 0.043

244
Appendix 8.3: Descriptive statistics for the categorical variables for the total firm-years within the three years period of study
Variables
Number of observations (count) Chi-square test of
independence
(write-off vs. Non-
write-off)
All Missing values
Write-off
group
Non-write-off group
Value Sig. (2-tailed test)
Contracting perspective
1.793
0.181
∆CEOCurrent/prior (H8) 1402 96
- Change 40 95
- No Change 309 958
Discretion in an impairment test of goodwill
CGU01 (H14A) 659 839 4.851
0.028 - More than one CGU 118 315
- One CGU 44 182
DISCMULTIPLE (H15B) 72770 771 7.188
0.007 - Multiple 45 91
- Single 131 460
DISCRATEDisclosed/Not (H15C) 1498 -
0.137
0.712
- Disclosed 176 551
- Not disclosed 193 578
ADD (H19) 1480 18 22.626
0.000 - Yes 77 387
- No 285 731
YEND (H18) 1498 - 0.544
0.762 - Year 1 135 394
- Year 2 123 374
- Year 3 111 361
INDUSTRYG5 (H17)71 1495 3
(1) Industrials and Basic materials
153 451
(2) Consumer goods and services
94 332 6.251
0.181
(3) Financials 60 138
(4) Utilities, healthcare, Oil and gas
24 92
(5) Technology and Telecommunication
35 116
366 1129
70
A difference of one between DISCMULTIPLE (H15B) and DISCRATE (H15A) (see Appendix 8.2) as one company stated that it has applied multiple discount rates without providing the actual rate applied.
71The industry group is reduced from 10 to five by combining these industries because of the small number of companies in five industries (see Section 8.2.2.3).

245
Appendix 8.4: Missing value analysis: The result of Little’s MCAR test and Separate Variance t tests
Variables tested for
missing values
GWB (H6)
DEBTRATIO (H7)
∆CEOCurrent/prior (H8)
CEOTENURE (H9)
CGU01
(H14A) CGUcontinuous
(H14B) DISCRATE
(H15A) DISCMULTIP
LE (H15B)
Series of variables
1. Dependent variable GWIL
- t
- df
- P (2-tail)
- Mean (Present)
- Mean (Missing)
(1.10)
206
0.27
0.00
0.00
(1.05)
76
0.29
0.00
0.01
(0.65)
101
0.52
0.00
0.00
(0.89)
116
0.38
0.00
0.00
(1.30)
1494
0.19
0.00
0.00
(1.30)
1494
0.19
0.00
0.00
(0.73)
1471
0.47
0.00
0.00
(0.72)
1469
0.47
0.00
0.00
2. Log(∆SALES+1) (H1) - t
- df
- P (2-tail)
- Mean (Present)
- Mean (Missing)
(3.74)
202
0.00
0.07
0.21
0.61
80.95
0.55
0.09
0.07
(0.33)
98
0.75
0.09
0.11
(0.23)
113
0.82
0.09
0.10
0.25
1496
0.80
0.09
0.09
0.25
1496
0.80
0.09
0.09
0.08
1489
0.94
0.09
0.09
0.07
1488
0.94
0.09
0.09
3. EARNINGSPrior (H2A)
- t
- df
- P (2-tail)
- Mean (Present)
- Mean (Missing)
(1.59)
223
0.11
0.04
0.05
(3.28)
71
0.00
0.04
0.10
3.73
105
0.00
0.04
0.00
3.70
120
0.00
0.05
0.00
1.78
1484
0.08
0.05
0.04
1.78
1484
0.08
0.05
0.04
2.97
1416
0.00
0.05
0.03
2.90
1415
0.00
0.05
0.03
4. EARNINGSPreGWILCurrent
(H2B)
- t
- df
- P (2-tail)
- Mean (Present)
- Mean (Missing)
(3.60)
200
0.00
0.03
0.07
(2.51)
68
0.01
0.04
0.10
3.98
108
0.00
0.04
0.00
4.14
125
0.00
0.04
0.00
3.41
1442
0.00
0.05
0.03
3.41
1442
0.00
0.05
0.03
2.99
1484
0.00
0.05
0.03
3.09
1484
0.00
0.05
0.03
*, **, *** denote significance at the 0.10, 0.05, and 0.01 level, respectively (two-tailed)

246
Appendix 8.4 (continue): Missing value analysis: The result of Little’s MCAR test and Separate Variance t tests
Variables tested for
missing values
GWB (H6)
DEBTRATIO (H7)
∆CEOCurrent/prior (H8)
CEOTENURE (H9)
CGU01
(H14A) CGUcontinuous
(H14B) DISCRATE
(H15A) DISCMULTIP
LE (H15B)
Series of variables
5. ∆EARNINGSpreGWIL
(H3) - t
- df
- P (2-tail)
- Mean (Present)
- Mean (Missing)
(2.87)
200
0.00
0.00
0.03
(0.54)
68
0.59
0.01
0.02
1.01
111
0.31
0.01
0.00
0.95
131
0.34
0.01
0.00
1.55
1466
0.12
0.01
0.00
1.55
1466
0.12
0.01
0.00
0.28
1478
0.78
0.01
0.01
0.43
1478
0.67
0.01
0.01
6. ∆OCF (H4) - t
- df
- P (2-tail)
- Mean (Present)
- Mean (Missing)
(1.29)
195
0.20
0.01
0.04
(1.14)
69
0.26
0.01
0.05
0.72
101
0.47
0.02
0.00
0.56
116
0.58
0.01
0.00
0.96
1250
0.34
0.02
0.01
0.96
1250
0.34
0.02
0.01
(0.15)
1435
0.88
0.01
0.01
(0.17)
1433
0.87
0.01
0.01
7. BTM (H5)
- t
- df
- P (2-tail)
- Mean (Present)
- Mean (Missing)
5.80
335
0.00
1.64
1.21
7.69
103
0.00
1.62
0.92
(1.04)
107
0.30
1.58
1.73
(1.54)
122
0.13
1.57
1.79
(1.72)
1428
0.09
1.52
1.64
(1.72)
1428
0.09
1.52
1.64
1.04
1475
0.30
1.62
1.55
1.05
1477
0.29
1.62
1.55
8. GWB (H6) - t
- df
- P (2-tail)
- Mean (Present)
- Mean (Missing)
.
.
.
0.35
54
0.72
0.05
0.05
(1.46)
82
0.15
0.05
0.07
(1.22)
97
0.22
0.05
0.06
(1.29)
1298
0.20
0.05
0.05
(1.29)
1298
0.20
0.05
0.05
4.26
1250
0.00
0.06
0.04
4.27
1252
0.00
0.06
0.04
Little‘s MCAR test:
Chi-Square = 1527.70 DF = 769 Sig. = 0.000

247
Appendix 8.5: The result of sensitivity analyses for ∆CEOCurrent/prior
Sign
The results of coefficients (Z statistics)
∆CEOPrior ∆CEOCurrent ∆TopMgtCurrent/prior ∆TopMgtPrior ∆TopMgtCurrent
Model 2
(h)(i)
Model 2
(h)(ii)
Model 2
(h)(i)
Model 2
(h)(ii)
Model 2
(h)(i)
Model 2
(h)(ii)
Model 2
(h)(i)
Model 2
(h)(ii)
Model 2
(h)(i)
Model 2
(h)(ii)
Observations (N) 1124 1124 1124 1124 1124 1124 1124 1124 1124 1124
Intercept -0.038
(-2.60)***
-0.036
(-2.59)**
-0.037
(-2.73)***
-0.034
(-2.50)**
-0.039
(-2.82)***
-0.036
(-2.60)***
-0.039
(-2.82)***
-0.036
(-2.59)***
-0.038
(-2.59)***
-0.036
(-2.59)***
Economic factors
Log(∆SALES+1) (H1)
- 0.004
(0.33)
-0.005
(-0.40)
0.004
(0.32)
-0.005
(-0.43)
0.004
(0.30)
-0.006
(-0.44)
0.005
(0.38)
-0.005
(-0.39)
0.005
(0.35)
-0.005
(-0.36)
EARNINGSPreG
WILCurrent (H2B) - -0.091
(-4.66)***
-0.090
(-4.86)***
- -0.089
(-4.79)***
- -0.093
(-4.94)***
- -0.087
(-4.50)***
-
∆EARNINGSpre
GWIL (H3) - - 0.061
(2.82)***
- 0.062
(2.92)***
- 0.061
(2.83)***
- 0.06
(2.82)***
- 0.060
(2.82)***
∆OCF (H4)
- 0.003
(0.35)
0.002
(0.21)
0.000
(0.05)
-0.000
(-0.06)
0.002
(0.21)
0.001
(0.10)
0.002
(0.31)
0.002
(0.21)
0.001
(0.08)
-0.000
(-0.05)
BTM (H5)
+ -0.000
(-0.20)
0.000
(0.51)
-0.000
(-0.47)
0.000
(0.35)
-0.000
(-0.46)
0.000
(0.33)
-0.000
(-0.30)
0.000
(0.53)
-0.000
(-0.25)
0.000
(0.42)
GWB (H6)
+ 0.021
(1.22)
0.022
(1.35)
0.020
(1.22)
0.020
(1.26)
0.022
(1.37)
0.022
(1.40)
0.020
(1.26)
0.022
(1.34)
0.021
(1.23)
0.022
(1.37)
Contracting perspective
DEBTRATIO (H7)
? -0.014
(-1.76)*
-0.006
(-0.75)
-0.014
(-1.86)*
-0.005
(-0.63)
-0.015
(-1.91)*
-0.005
(-0.71)
-0.015
(-1.98)**
-0.005
(-0.75)
-0.013
(-1.65)*
-0.005
(-0.69)
Opportunistic behaviour perspective
∆CEOCurrent/prio
r (H8) + 0.000
(0.03)
0.000
(0.04)
0.017
(3.19)***
0.018
(3.33)***
0.008
(1.94)*
0.009
(2.29)**
-0.003
(-0.49)
-0.001
(-0.25)
0.016
(3.13)***
0.016
(3.26)***
CEOTENURE (H9)
- 0.000
(0.85)
0.000
(0.47)
0.000
(1.68)*
0.000
(1.23)
0.000
(1.47)
0.000
(1.10)
0.000
(0.90)
0.000
(0.43)
0.000
(1.58)
0.000
(1.26)
*, **, *** denote significance at the 0.10, 0.05, and 0.01 level, respectively (two-tailed)

248
Appendix 8.5 (continue): The result of sensitivity analyses for ∆CEOCurrent/prior
Sign
The results of coefficients (Z statistics)
∆CEOPrior ∆CEOCurrent ∆TopMgtCurrent/prior ∆TopMgtPrior ∆TopMgtCurrent
Model 2
(h)(i)
Model 2
(h)(ii)
Model 2
(h)(i)
Model 2
(h)(ii)
Model 2
(h)(i)
Model 2
(h)(ii)
Model 2
(h)(i)
Model 2
(h)(ii)
Model 2
(h)(i)
Model 2
(h)(ii)
Opportunistic behaviour perspective
BATH (H10)
- -0.052
(-1.89)*
-0.195
(5.83)***
-0.054
(-2.05)**
-0.196
(-5.97)***
-0.053
(-1.98)**
-0.193
(-5.82)***
-0.051
(-1.92)*
-0.195
(-5.84)***
-0.055
(-2.03)**
-0.194
(-5.87)***
SMOOTH (H11)
+ 0.066
(2.84)***
- 0.080
(3.67)***
- 0.079
(3.59)***
- 0.079
(3.61)***
- 0.064
(2.79)***
-
Ownership structure
MANOWN1
(H12B1)
? -0.002
(-2.54)**
-0.002
(-2.67)***
-0.002
(-2.33)**
-0.002
(-2.48)**
-0.002
(-2.28)**
-0.002
(-2.38)**
-0.002
(-2.55)**
-0.002
(2.69)***
-0.002
(-2.31)**
-0.002
(-2.43)**
MANOWN2
(H12B2)
? 0.000
(0.56)
0.000
(0.73)
0.000
(0.41)
0.000
(0.72)
0.000
(0.37)
0.000
(0.67)
0.000
(0.43)
0.000
(0.74)
0.000
(0.51)
0.000
(0.67)
MANOWN3
(H12B3)
? 0.000
(0.72)
0.000
(0.23)
0.000
(0.91)
0.000
(0.30)
0.000
(0.94)
0.000
(0.36)
0.000
(0.83)
0.000
(0.22)
0.000
(0.83)
0.000
(0.38)
OUTCON (H13)
? -0.000
(-1.66)*
-0.000
(-2.18)**
-0.000
(-1.93)*
-0.000
(-2.28)**
-0.000
(-1.80)*
-0.000
(-2.15)**
-0.000
(-1.83)*
-0.000
(-2.18)**
-0.000
(-1.75)*
-0.000
(-2.24)**
Control variables
SIZE (H16)
? 0.002
(2.02)**
0.002
(1.68)*
0.002
(2.01)**
0.001
(1.40)
0.002
(2.10)**
0.001
(1.49)
0.002
(2.31)**
0.002
(1.70)*
0.002
(1.81)*
0.001
(1.47)
INDUSTRYG5 (H17) 1 -Ind. ?
2 - Consumer
goods and
serv.
0.001
(0.46)
0.000
(0.20)
0.001
(0.41)
0.000
(0.08)
0.002
(0.51)
0.001
(0.18)
0.002
(0.51)
0.001
(0.20)
0.001
(0.35)
0.000
(0.09)
3 – Financials -0.000
(-0.15)
0.001
(0.14)
-0.000
(-0.13)
0.000
(0.11)
0.000
(-0.11)
0.000
(0.12)
-0.000
(-0.10)
0.001
(0.14)
-0.001
(-0.15)
0.001
(0.14)
4 - Util.health.,
Oil and Gas
-0.003
(-0.62)
-0.004
(-0.82)
-0.004
(-0.74)
-0.005
(-0.96)
-0.003
(-0.63)
-0.004
(-0.84)
-0.003
(-0.61)
-0.004
(-0.82)
-0.004
(-0.71)
-0.005
(-0.91)
*, **, *** denote significance at the 0.10, 0.05, and 0.01 level, respectively (two-tailed)

249
Appendix 8.5 (continue): The result of sensitivity analyses for ∆CEOCurrent/prior
Sign
The results of coefficients (Z statistics)
∆CEOPrior ∆CEOCurrent ∆TopMgtCurrent/prior ∆TopMgtPrior ∆TopMgtCurrent
Model 2
(h)(i)
Model 2
(h)(ii)
Model 2
(h)(i)
Model 2
(h)(ii)
Model 2
(h)(i)
Model 2
(h)(ii)
Model 2
(h)(i)
Model 2
(h)(ii)
Model 2
(h)(i)
Model 2
(h)(ii)
5 - Technology
and Telecom.
0.004
(0.73)
0.004
(0.77)
0.003
(0.66)
0.003
(0.72)
0.003
(0.63)
0.003
(0.69)
0.003
(0.72)
0.004
(0.78)
0.003
(0.58)
0.003
(0.61)
YEND–1 (H18) ?
- Year 2 0.003
(1.12)
0.002
(0.78)
0.003
(1.10)
0.003
(0.92)
0.003
(0.97)
0.002
(0.78)
0.003
(1.00)
0.002
(0.80)
0.004
(1.31)
0.003
(0.98)
- Year 3 0.002
(0.51)
-0.000
(-0.13)
0.002
(0.59)
0.000
(0.09)
0.001
(0.41)
0.000
(-0.10)
0.001
(0.43)
-0.000
(-0.11)
0.002
(0.69)
0.000
(0.08)
ADD (H19) + -0.007
(-2.17)**
-0.008
(-2.70)***
-0.007
(-2.24)**
-0.008
(-2.67)***
-0.006
(-2.19)**
-0.008
(-2.61)***
-0.007
(-2.26)**
-0.008
(-2.71)***
-0.006
(-2.12)**
-0.008
(-2.62)***
Log likelihood 289.36 316.27 349.78 332.74 355.88 295.43 330.43 338.64 294.09 320.97
Wald Chi-square 87.03*** 72.09*** 105.62*** 83.33*** 99.10*** 77.26*** 95.48*** 72.19*** 96.42*** 82.81***
*, **, *** denote significance at the 0.10, 0.05, and 0.01 level, respectively (two-tailed)

250
Appendix 8.6: The result of sensitivity analyses for Managerial ownership
Sign
The results of coefficients (Z statistics)
MANOWNNon-monotonic MANOWNLinear Changing the cut-off point
from 25% to 20%
Changing the cut-off point
from 25% to 30%
Model 2(h)(i) Model 2(h)(ii) Model 2(h)(i) Model 2(h)(ii) Model 2 (h)(i) Model 2 (h)(ii)
Observations (N) 1124 1124 1124 1124 1124 1124
Intercept -0.038
(-2.79)***
-0.035
(-2.56)**
-0.038
(-2.75)***
-0.035
(-2.56)**
-0.037
(-2.50)**
-0.035
(-2.54)**
Economic factors
Log(∆SALES+1) (H1) - -0.002
(0.21)
-0.007
(-0.55)
0.003
(0.21)
-0.007
(-0.55)
0.003
(0.25)
-0.006
(-0.47)
EARNINGSPreGWILCurrent (H2B) - -0.091
(-4.90)***
- -0.090
(-4.86)***
-0.086
(-4.49)***
∆EARNINGSpreGWIL (H3) - - 0.063
(2.93)***
- 0.063
(2.93)***
- 0.061
(2.85)***
∆OCF (H4)
- 0.002
(0.21)
0.001
(0.10)
0.001
(0.20)
0.001
(0.10)
0.002
(0.24)
0.001
(0.11)
BTM (H5)
+ -0.001
(-0.59)
0.000
(0.24)
-0.001
(-0.55)
0.000
(0.24)
-0.001
(-0.65)
0.000
(0.03)
GWB (H6)
+ 0.021
(1.31)
0.021
(1.32)
0.021
(1.31)
0.021
(1.32)
0.022
(1.31)
0.022
(1.37)
Contracting perspective
DEBTRATIO (H7) ? -0.014
(-1.84)*
-0.005
(-0.61)
-0.014
(-1.86)*
-0.005
(-0.61)
-0.014
(-1.69)*
-0.005
(-0.69)
*, **, *** denote significance at the 0.10, 0.05, and 0.01 level, respectively (two-tailed

251
Appendix 8.6 (continue): The result of sensitivity analyses for Managerial ownership
Sign
The results of coefficients (Z statistics)
MANOWNNon-monotonic MANOWNLinear Changing the cut-off point
from 25% to 20%
Changing the cut-off point
from 25% to 30%
Model 2(h)(i) Model 2(h)(ii) Model 2(h)(i) Model 2(h)(ii) Model 2 (h)(i) Model 2 (h)(ii)
Opportunistic behaviour perspective
∆CEOCurrent/prior (H8)
+ 0.011
(2.51)**
0.012
(2.64)***
0.011
(2.49)**
0.012
(2.64)***
0.012
(2.66)***
0.011
(2.65)***
CEOTENURE (H9) - 0.000
(1.69)*
0.000
(1.25)
0.000
(1.67)*
0.000
(1.25)
0.000
(1.37)
0.000
(1.05)
BATH (H10)
- -0.051
(-1.94)*
-0.195
(-5.91)***
-0.052
(-1.97)**
-0.192
(-5.91)***
-0.055
(-2.00)**
-0.193
(-5.87)***
SMOOTH (H11)
+ 0.080
(3.69)***
- 0.080
(3.65)***
- 0.063
(2.75)***
-
Ownership structure
MANOWNLinear (H12A)
? -0.004
(-1.53)
-0.005
(-1.73)*
MANOWN1 (H12B1) ? -0.002
(-2.02)**
-0.002
(-2.19)**
-0.002
(-2.42)**
-0.002
(-2.19)**
- -
MANOWN2 (H12B2) ? -0.000
(-0.14)
0.000
(0.22)
0.000
(0.64)
0.000
(0.22)
- -
MANOWN3 (H12B3) ? -0.000
(-1.36)
0.000
(0.77)
0.000
(0.76)
0.000
(0.77)
- -
OUTCON (H13) ? -0.000
(-1.86)*
-0.000
(-2.22)**
-0.000
(-1.87)*
-0.000
(-2.22)**
-0.000
(-2.18)**
-0.000
(-2.63)***
*, **, *** denote significance at the 0.10, 0.05, and 0.01 level, respectively (two-tailed

252
Appendix 8.6 (continue): The result of sensitivity analyses for Managerial ownership
Sign
The results of coefficients (Z statistics)
MANOWNNon-monotonic MANOWNLinear Changing the cut-off point
from 25% to 20%
Changing the cut-off point
from 25% to 30%
Model 2(h)(i) Model 2(h)(ii) Model 2(h)(i) Model 2(h)(ii) Model 2 (h)(i) Model 2 (h)(ii)
SIZE (H16)
? 0.002
(2.07)**
0.001
(1.47)
0.002
(2.05)**
0.001
(1.47)
0.002
(1.83)*
0.001
(1.55)
INDUSTRYG5 (H17) 1 – Indust. ?
2 - Consumer goods and
services
0.001
(0.45)
0.000
(0.11)
0.001
(0.41)
0.000
(0.11)
0.002
(0.55)
0.001
(0.29)
3 – Financials -0.001
(-0.22)
0.000
(0.01)
-0.000
(-0.21)
0.000
(0.01)
-0.000
(-0.04)
0.001
(0.22)
4 - Utilities, healthcare,
Oil and Gas
-0.004
(-0.79)
-0.005
(-1.01)
-0.004
(-0.74)
-0.005
(-1.01)
-0.004
(-0.67)
-0.005
(-0.94)
5 - Technology and Telecom.
0.003
(0.64)
0.003
(0.71)
0.003
(0.62)
0.003
(0.71)
0.004
(0.76)
0.004
(0.81)
YEND – Year 1 (H18) ?
- Year 2 0.003
(0.95)
0.002
(0.75)
0.003
(0.95)
0.002
(0.75)
0.003
(0.95)
0.002
(0.62)
- Year 3 0.001
(0.41)
-0.000
(-0.12)
0.001
(0.39)
-0.000
(-0.12)
0.002
(0.52)
-0.003
(-0.09)
ADD (H19) + -0.007
(-2.20)**
-0.007
(-2.64)***
-0.007
(-2.24)**
-0.008
(-2.64)***
-0.007
(-2.21)**
-0.008
(-2.69)***
Log likelihood 354.81 314.57 300.24 314.57 290.34 309.43
Wald chi-square 101.86*** 78.96*** 101.43*** 78.96*** 89.41*** 75.67***
*, **, *** denote significance at the 0.10, 0.05, and 0.01 level, respectively (two-tailed

253
Appendix 8.7: The result of sensitivity analyses for EARNINGSprior by replacing it with EARNINGSPreGWILprior
Sign
The results of coefficients (Z statistics)
Model 1 Model 2(a)(i) Model 2(a)(ii) Model 2(b) Model 2(c) Model 2(d)
Observations (N) 538 518 518 374 531 537
Intercept -0.055
(-3.58)***
-0.044
(-2.59)***
-0.051
(-2.66)***
-0.047
(-2.59)***
-0.057
(-3.68)***
-0.055
(-3.41)***
Economic factors
Log(∆SALES+1) (H1)
- -0.017
(-0.93)
-0.015
(-0.78)
-0.020
(-1.03)
-0.007
(-0.29)
-0.016
(-0.88)
-0.016
(-0.87)
EARNINGSPreGWILprior - -0.082
(-2.78)***
-0.074
(-2.79)***
-0.085
(-2.86)***
-0.069
(-1.70)*
-0.083
(-2.72)***
-0.080
(-2.70)***
∆OCF (H4)
- 0.002
(0.21)
0.002
(0.25)
0.002
(0.28)
-0.004
(-0.23)
0.001
(0.12)
0.001
(0.18)
BTM (H5)
+ 0.001
(0.61)
0.000
(0.14)
0.001
(0.81)
0.000
(0.19)
0.001
(0.66)
0.001
(0.52)
GWB (H6)
+ 0.035
(1.32)
0.019
(0.83)
0.028
(1.07)
0.012
(0.41)
0.039
(1.46)
0.035
(1.31)
Contracting perspective
DEBTRATIO (H7) ? 0.000
(0.01)
-0.001
(-0.15)
-0.001
(-0.14)
-0.007
(-0.59)
-0.001
(-0.12)
0.001
(0.11)
Opportunistic behaviour perspective
∆CEOCurrent/prior (H8)
+ 0.010
(2.07)**
0.011
(2.35)**
0.011
(2.31)**
0.015
(2.61)***
0.012
(2.31)**
0.010
(2.12)**
*, **, *** denote significance at the 0.10, 0.05, and 0.01 level, respectively (two-tailed)

254
Appendix 8.7 (continue): The result of sensitivity analyses for EARNINGSprior by replacing it with EARNINGSPreGWILprior
Sign
The results of coefficients (Z statistics)
Model 1 Model 2(a)(i) Model 2(a)(ii) Model 2(b) Model 2(c) Model 2(d)
CEOTENURE (H9) - - - - - 0.000
(1.23)
-
BATH (H10)
- -0.091
(-2.51)**
-0.096
(-2.66)***
-0.086
(-2.33)**
-0.099
(-1.99)**
-0.094
(-2.58)***
-0.089
(-2.43)**
SMOOTH (H11)
+ 0.048
(1.20)
0.043
(1.12)
0.039
(0.96)
0.082
(1.42)
0.052
(1.28)
0.047
(1.18)
Ownership structure
MANOWNLinear (H12A) ? -0.002
(-0.66)
- - - -
MANOWN1 (H12B1) ? - - -0.001
(-1.50)
- - -
MANOWN2 (H12B2) ? - - 0.000
(0.75)
- - -
MANOWN3 (H12B3) ? - - 0.000
(0.97)
- - -
OUTCON (H13)
? - -0.000
(-1.75)*
-0.000
(-0.83)
- - -
Discretion - impairment test
CGU01 (H14A)
? 0.002
(0.62)
0.005
(1.45)
0.003
(0.71)
- 0.002
(0.65)
0.003
(0.65)
CGUcontinuous (H14B)
? - - - 0.001
(1.20)
- -
*, **, *** denote significance at the 0.10, 0.05, and 0.01 level, respectively (two-tailed)

255
Appendix 8.7 (continue): The result of sensitivity analyses for EARNINGSprior by replacing it with EARNINGSPreGWILprior
Sign
The results of coefficients (Z statistics)
Model 1 Model 2(a)(i) Model 2(a)(ii) Model 2(b) Model 2(c) Model 2(d)
DISCRATE (H15A) ? - - - -0.001
(-1.13)
- -
DISCMULTIPLE (H15B)
? - - - 0.004
(0.82)
- -
Control variables
SIZE (H16)
? 0.002
(2.08)**
0.022
(2.22)**
0.002
(2.04)**
0.002
(1.58)
0.002
(2.04)**
0.002
(1.90)*
INDUSTRYG5 (H17) 1 - Indus. And
B.materials
?
2 - Consumer goods and
services
- - - - - -0.001
(-0.24)
3 – Financials - - - - - -0.000
(-0.04)
4 - Utilities, healthcare,
and Oil and Gas
- - - - - -0.003
(-0.54)
5 - Technology and
Telecom.
- - - - - -0.000
(-0.00)
YEND – Year 1 (H18) ?
- Year 2 0.001
(0.28)
0.000
(0.03)
0.001
(0.34)
0.003
(0.67)
0.001
(0.20)
0.001
(0.28)
- Year 3 0.001
(0.16)
0.000
(0.06)
0.000
(0.03)
0.003
(0.52)
0.000
(0.09)
0.001
(0.20)
*, **, *** denote significance at the 0.10, 0.05, and 0.01 level, respectively (two-tailed)

256
Appendix 8.7 (continue): The result of sensitivity analyses for EARNINGSprior by replacing it with EARNINGSPreGWILprior
Sign
The results of coefficients (Z statistics)
Model 1 Model 2(a)(i) Model 2(a)(ii) Model 2(b) Model 2(c) Model 2(d)
ADD (H19) + -0.001
(-0.22)
-0.003
(-0.98)
-0.000
(-0.08)
-0.003
(-0.63)
-0.001
(-0.24)
-0.001
(-0.23)
Log likelihood 188.99 222.43 189.58 154.13 188.07 189.15
Wald chi-square 31.82*** 39.43*** 37.63*** 23.92* 32.02*** 32.16**
*, **, *** denote significance at the 0.10, 0.05, and 0.01 level, respectively (two-tailed)

257
Chapter 9: Recognition Study of Goodwill Impairment - Results and Analysis
9.1 Introduction
The measurement study in Chapter 8 has provided empirical evidence on factors
influencing the managers‘ decisions when determining the magnitude of goodwill
impairment losses divided by prior year total assets (including goodwill), and
zero otherwise reported on the income statement (see Section 1.4.2). In their
review of studies on asset write-offs, Alciatore et al. (1998: 33) highlighted the
lack of research on the motives of companies that ‗have impaired assets but have
not written them down‘ (see Section 2.2.2). In the context of goodwill
impairment, the gap identified is timely, as one of the concerns raised by the
IASB board members via the dissenting opinion of IAS 36 Impairment of Assets
was the lack of a rigorous impairment test of goodwill, given that the focus of
the IASB is in preventing excessive assets write-offs (see Section 4.5).
In response to the gap highlighted by Alciatore et al. (1998: 33), the present
chapter takes a step beyond the measurement study by examining factors
influencing the recognition choice related to reporting zero goodwill impairment
exercised by Malaysian listed companies in a situation where their market values
are below the book values of their net assets for three consecutive years. By
analysing the recognition choice related to reporting zero goodwill impairment,
this chapter aims to address the research questions summarised in Figure 9.1 (see
Sections 1.3 and 5.2 for detailed discussion):

258
Figure 9.1: Summary of research questions (RQ) for the recognition study of goodwill impairment by Malaysian listed companies
Theoretical research question
RQ 1
:
How can an investigation of FRS 3, focusing on goodwill impairment by Malaysian listed companies, contribute to the theories of accounting choice?
Specific research questions
RQ 9 : Economic factors
To what extent does the recognition choice72 related to reporting zero goodwill impairment exercised by Malaysian listed companies reflect the underlying economic values of cash-generating-units containing goodwill?
RQ 10 : Contracting perspective
To what extent does the recognition choice related to reporting zero goodwill impairment exercised by Malaysian listed companies support the contracting perspective?
RQ 11 : Opportunistic behaviour perspective
To what extent does the recognition choice related to reporting zero goodwill impairment exercised by Malaysian listed companies support the opportunistic behaviour perspective?
RQ 12 : Ownership structures
To what extent does the recognition choice related to reporting zero goodwill impairment exercised by Malaysian listed companies indicate that they reflect companies‘ ownership structures?
The chapter is structured as follows. Section 9.2 describes the setting which is
constructed to capture evidence of a recognition choice related to reporting zero
goodwill impairment, and the distribution of data. Section 9.3 outlines two main
binary logistic models employed, and discusses the issue of multicollinearity.
Section 9.4 discusses the regression diagnostics tests carried out, the overall
goodness-of-fit of the models, and the sensitivity analysis performed. Section 9.5
discusses the results for each of the research questions and the control variables.
Section 9.6 summarises and concludes the chapter.
72
The recognition choice related to reporting zero goodwill impairment focuses on companies which their market values lower than the book values of the net assets for three consecutive years and which reported zero goodwill impairment.

259
9.2 Descriptive analysis
The descriptive analysis discussed in this section serves two purposes: firstly, to
describe the setting which is designed to capture evidence of a recognition
choice related to reporting zero goodwill impairment (see Section 9.2.1);
secondly, to describe the distribution of data (see Section 9.2.2).
9.2.1 Setting designed to capture evidence of a recognition choice related to reporting zero goodwill impairment
This chapter seeks to explore the motives of companies in recognising zero
goodwill impairment. To explore these motives, companies which have market
values below the book values of their net assets for three consecutive years are
selected since (as discussed in Section 4.3) this condition is one of the indications
that goodwill may be impaired. Interviews with the senior manager of a big-4
audit firm, a financial analyst, a former standard setter, and a finance manager
with Malaysian listed companies were carried out by the researcher in Malaysia at
an early stage of this PhD study (see Section 3.2.5). Results from these interviews
suggest that for Malaysian listed companies, market capitalisation indication
occurring within a single year, could be considered to be a temporary situation.
Accordingly, such companies may not consider undertaking goodwill write-off.
Therefore, focusing on companies which have market values below the book
values of their net assets for three consecutive years, provides a stronger market
capitalisation indication that goodwill may be impaired. Moreover, this provides
a setting to test why companies in a condition that appears to indicate goodwill
may be impaired, would recognise zero goodwill impairment, while other
companies in a similar condition would recognise goodwill impairment losses.
In this setting, companies which recognise zero goodwill impairment throughout
the three years are considered as exercising a recognition choice related to
reporting zero goodwill impairment. These companies are referred to as a test

260
group; and are tested against a control group of companies (see Figure 9.2). The
control group is a group of companies which experience similar condition (i.e.
their market values are below the book values of their net assets for three
consecutive years); however, these companies report goodwill impairment losses
at the end of the third year. To perform the analysis, the test group is coded as
one and the control group is coded as zero (see Figure 9.2). Accordingly, the
dependent variable is a dichotomous variable, equal to one for the test group,
and zero for the control group. The setting comprises 132 companies (before
missing values) of which 96 companies are regarded as the test group and 36
companies are considered as the control group (see Figure 9.3).
Figure 9.2: Summary of a setting designed to capture evidence of a recognition choice related to reporting zero goodwill impairment
Description Recognition choice examined
Selection criteria Dependent variable
Year of analysis
A situation where companies‘ market values are lower than the book values of their net assets for three consecutive years
The recognition choice for companies which recognise zero goodwill impairment when their market values are below the book values of their net assets for three consecutive years
Test group: Companies which reported zero goodwill impairment when their market values are lower than the book values of their net assets for three consecutive years.
Control group: Companies which reported goodwill impairment losses at the end of the third year when their market values are below the book values of their net assets for three consecutive years.
Is a dichotomous variable, equal to one for the test group; zero for the control group
The analysis of the recognition choice is carried out in year 3.

261
Figure 9.3: Number of companies tested for the test group and the control group
Before missing values
After missing values
Test group: Market values less than the book values of the net assets for three consecutive years and reported zero goodwill impairment
96
7773
Control group: Market values less than the book values of the net assets for three consecutive years and reported goodwill impairment losses at the end of year 3
36
31
Total 132 10874
9.2.2 Distribution of data
The descriptive statistics for both the continuous and categorical variables tested
in the present chapter are displayed in Appendices 9.1 to 9.2. The appendices
highlight two issues concerning the distribution of data. Firstly, current year pre-
write-off earnings (i.e. EARNINGSPreGWILCurrent) are highly skewed (see Appendix
9.1). The transformation of this variable into logarithm [i.e. Log10(0.475-
EARNINGSPreGWILCurrent] solves the issue of skewness as the skewness value of the
variable reduces from -2.827 to 1.242. Therefore, in the present chapter,
73 An alternative approach would to be to test the two groups of companies using the match-pair based on size of a company. However, in doing so more than half of the companies in the test group would be lost. Therefore, to get a comprehensive analysis of companies which recognised zero goodwill impairment when their market values are lower than the book values of their net assets for three consecutive years, the match-pair analysis is not undertaken.
74 The missing value analysis is carried out using Little‘s MCAR test (see Section 6.6.2). The test produces a Chi-Square value of 74.875 and is non-significant (i.e. p-value greater than 0.05), suggesting that the null hypothesis that the data are missing completely at random cannot be rejected. Hence, it is inferred that the data are missing completely at random. According to Tabachnick and Fidell (2007: 63), when this is the case, then there is no serious problem with the data as the missing values are not related to the dependent variable or the independent variables. 75 Although Log10(EARNINGSPreGWILCurrent) solves the issue of skewness of the variable, Log10(0.4- EARNINGSPreGWILCurrent) is employed. This is because the former would lead to loss of 25 companies which reported negative current year pre-write-off earnings (see Footnote 1 of Table 9.2 for the interpretation of the coefficient).

262
Log10(0.4-EARNINGSPreGWILCurrent) will be applied in testing the recognition choice
related to reporting zero goodwill impairment.
The second issue regarding the distribution of data is the lack of companies for
three variables, i.e. ∆CEOCurrent/prior, ADD, and INDUSTRYG5 (see Appendix 9.2).
For example, for ∆CEOCurrent/prior, there are five companies in the control group
which experienced change in CEO (the expected cell frequency is 3). Peers
(1996: 167) argues that the Chi-square test should not be used when any
expected cell frequencies are small because the probability distribution of the
Chi-square gives a poor approximation to the sampling distribution of the Chi-
square statistic. For this reason, these variables are excluded in the regression
diagnostics tests I and II (see Section 9.4.1 and Table 9.2).
9.3 Binary logistic regression models
In the present chapter, the binary nature of the dependent variable (see Figure
9.2) leads to the application of a binary logistic regression (see Section 6.8).
Accordingly, the recognition study is modelling the probability of a recognition
choice related to reporting zero goodwill impairment exercised by Malaysian
listed companies. Two models constructed in the measurement study (see
Section 8.3.3) are adapted in the present chapter to test the recognition choice
related to reporting zero goodwill impairment. These models are Model 2(h)(i)
and Model 2(h)(ii) (see Figure 9.4). The two models are selected as they produce
the highest Wald Chi-square with statistically significant p-values, suggesting that
these models can better explain the overall factors influencing managers‘
decisions related to goodwill impairment. Hence, compared to the other models
specified in Section 8.3.3, they are expected to best model the recognition
choice related to reporting zero goodwill impairment.

263
Figure 9.4: Models specification for the analysis of the recognition choice related to reporting zero goodwill impairment
Model Specifications of the variables
Model A
- Adapted from Model 2(h)(i) in the measurement study
= α + β1∆SALES+β2EARNINGSPreGWILCurrent +β4∆OCF+β5BTM + β6GWB + β7DEBTRATIO +β8∆CEOCurrent/prior
+ β9CEOTENURE+ +β10BATH +β11SMOOTH + β12B1MANOWN1 + β12B2MANOWN2 + β12B3MANOWN3 + β13OUTCON+β16SIZE
+ β17INDUSTRYG5 +β19ADD +ε
Model B
- Adapted from Model 2(h)(ii) in the measurement study
= α + β1∆SALES+β3∆EARNINGSpreGWIL+β4∆OCF+β5BTM +β6GWB + β7DEBTRATIO + β8∆CEOCurrent/prior
+β9CEOTENURE+ β11SMOOTH +β12B1MANOWN1 + β12B2MANOWN2 + β12B3MANOWN3
+β13OUTCON+β16SIZE +β17INDUSTRYG5 +β19ADD +ε
Where;
Variable Description (see Appendix 1 of the thesis for detail)
GWIL(0,1) = A dichotomous variable, equal to one when companies are considered as exercising a recognition choice related to reporting zero goodwill impairment, and zero otherwise.
Economic factors
∆SALES (H1) Change in sales = (SALESt - SALESt-1) Total assetst-1
EARNINGSPreGWILCurrent (H2B)
Current year pre-write-off earnings
= (EARNINGSt + GWIL(IL)t) Total assetst-1
The variable is transformed into logarithm [i.e. Log10(0.4- EARNINGSPreGWILCurrent] (see Section 9.2.2).
∆EARNINGSpreGWIL
(H3)
Change in pre-write-off earnings = [EARNINGSt + GWIL(IL)t]- [EARNINGSt-1 + GWIL(IL)76
t-1] Total assetst-1
∆OCF (H4) Change in operating cash flows = (OCFt - OCFt-1)/Total assetst-1
BTM (H5) Book-to-market ratio
= Company i‘s book value of equity divided by market value of equity at the end of t.
GWB (H6) Relative size of goodwill balance
= Opening goodwill balancet Total assetst-1
Contracting perspective
DEBTRATIO (H7) Debt contracting = Total Debtst-1
76 GWIL(IL) refers to reporting goodwill impairment losses.

264
Total assetst-1
Opportunistic behaviour perspective
∆CEOCurrent/prior
(H8)
Change in CEO = One if there is a change in CEO in t-1 or t, and zero otherwise.
CEOTENURE (H9) CEO tenure = The number of years that the CEO has held the position
BATH (H10) Big bath reporting = Change in pre-write-off earnings from t-1 to t divided by total assets at the end of t-1, when this change is below the median of non-zero negative values of this variable, and zero otherwise.
SMOOTH (H11) Earnings smoothing = Change in pre-write-off earnings from t-1 to t divided by total assets at the end of t-1, when this change is above the median of non-zero positive values of this variable, and zero otherwise.
Ownership structure
MANOWNNon-
monotonic (H12B)
MANOWN1 = board ownership if board ownership < 0.05 = 0.05 if board ownership ≥ 0.05
MANOW 2 = 0 if board ownership < 0.05 = board ownership minus 0.05 if 0.05≤board
ownership< 0.25 = 0.20 if board ownership ≥ 0.25
MANOWN3 = 0 if board ownership < 0.25 = board ownership minus 0.25 if board
ownership ≥ 0.25
OUTCON (H13) Outside ownership concentration = (No. of ordinary shares held by outsiders with the five largest claims)/ (Total no. of issued and paid up ordinary shares)
Control variables
SIZE (H16) Size of company = Ln(Total assetst-1)
INDUSTRYG5 (H17) Type of industry = A dummy variable across five industry categories.
ADD (H19) Addition to goodwill = One if there is a newly acquired goodwill, and zero otherwise.
ε = Error term
The two models presented in Figure 9.4 differ from Models 2(h)(i) and 2(h)(ii) of
the measurement study. The changes from the measurement study are now
explained. In the measurement study, models 2(h)(i) and 2(h)(ii) test the
magnitude of goodwill impairment losses divided by prior year total assets

265
(including goodwill), and zero otherwise reported on the income statement. In
the present chapter, i.e. the recognition study, the dependent variable is a
dichotomous variable (see Table 5.1 in Section 5.2). For this reason, Model 2(h)(i)
is referred to as Model A, and Model 2(h)(ii) is referred to as Model B (see Figure
9.4). In both models, financial year-end (YEND) is excluded as the analysis of
data is undertaken in the third year.
Secondly, multicollinearity is assessed using Pearson‘s product-moment
correlation coefficient test. Table 9.1 shows that for the most part, the
independent variables are not significantly correlated with one another or with
the control variables, except the correlations between BATH and
∆EARNINGSpreGWIL at 0.86 with p-value less than 0.01. To overcome the issue of
multicollinearity, ∆EARNINGSpreGWIL is analysed separately from BATH.
Accordingly, BATH which is included in Model 2(h)(ii) is excluded from Model B.
Additionally, because there is no issue of multicollinearity between SMOOTH and
∆EARNINGSpreGWIL, Model B incorporates SMOOTH. Therefore, Model B differs
slightly from Model 2(h)(ii) as it excludes BATH and includes SMOOTH (see Figure
9.4 in Section 9.3, and Table 8.3 in Section 8.3.3).
Thirdly, in the present chapter, the effects of variables such as CGUs and
discount rates, testing the discretion available to managers in performing an
impairment test of goodwill, are not examined. This is because these variables
suffer from a high frequency of missing values, and including these variables
would reduce the number of observations significantly.

266
Table 9.1: Pearson product-moment correlation coefficients
Variable 1 2 3 4 5 6 7 8 9
1 GWIL(0,1) 1.00
2 ∆SALES (H1) 0.11 1.00
3 EARNINGSPriorPreGWIL (H2A) 0.12 0.20* 1.00
4 Log10(0.4-
EARNINGSPreGWILCurrent) (H2B)
0.26** -0.20* -0.42** 1.00
5 ∆EARNINGSpreGWIL (H3) 0.18* -0.01 -0.41** -0.64** 1.00
6 ∆OCF (H4) -0.06 0.17 0.03 -0.12 0.09 1.00
7 BTM (H5) 0.01 -0.12 -0.31** 0.27** 0.02 0.04 1.00
8 GWB (H6) -0.07 -0.13 -0.25** 0.25** -0.05 -0.08* 0.06 1.00
9 DEBTRATIO (H7) -0.02 -0.05 -0.26** 0.22* 0.05 0.13 0.27** -0.01 1.00
10 CEOTENURE (H9) 0.10 0.06 0.10 -0.16 0.09 0.00 0.13 -0.18* -0.06
11 BATH (H10) 0.20 0.04 0.15 0.66** -0.86** 0.11 0.09 -0.12 0.05
12 SMOOTH (H11) 0.04 -0.10 -0.55** -0.20* 0.60** -0.01 -0.10 0.08 0.05
13 MANOWN1 (H12B1) -0.04 -0.06 -0.06 0.01 0.06 0.14 0.01 -0.13 0.09
14 MANOWN2 (H12B2) -0.13 -0.20* -0.02 0.05 -0.02 0.01 -0.07 -0.04 0.04
15 MANOWN3 (H12B3) -0.16 -0.23* 0.08 -0.07 0.02 0.03 -0.06 -0.05 0.03
16 OUTCON (H13) 0.12 0.21* 0.18* -0.04 -0.13 0.09 -0.12 0.10 -0.29**
17 SIZE (H16)
-0.08 0.04 0.21* 0.06 -0.20* -0.12 -0.10 -0.00 0.06
*, ** denote significance at the 0.05, and 0.01 level, respectively (two-tailed).

267
Table 9.1 (continue): Pearson product-moment correlation coefficients
Variable 10 11 12 13 14 15 16 17
10 CEOTENURE (H9) 1.00 0.13** -0.04 0.06* -0.03 -0.09** -0.00 0.11**
11 BATH (H10) 1.00 0.12** -0.06* -0.06* -0.04 0.08** 0.16**
12 SMOOTH (H11) 1.00 0.04 0.04 0.04 -0.06* -0.08**
13 MANOWN1 (H12B1) 1.00 0.69** 0.37** -0.54** -0.42**
14 MANOWN2 (H12B2) 1.00 0.67** -0.60** -0.33**
15 MANOWN3 (H12B3) 1.00 -0.47** -0.25**
16 OUTCON (H13) 1.00 0.28**
17 SIZE (H16) 1.00
*, ** denote significance at the 0.05, and 0.01 level, respectively (two-tailed).

268
9.4 Regression results: Recognition choice related to reporting zero goodwill impairment
Table 9.2 reports the results of binary logistic regression for Model A and Model
B. Initially, the analysis of the two models, i.e. the full model is based on 108
companies (see Table 9.2). However, as shown in Table 9.2, the full models, both
for Model A and Model B, are non-significant with p-values greater than 0.10. The
Chi-square values for Model A and Model B are 21.866 and 17.977 respectively.
According to Menard (1995: 56), a non-significant regression model indicates that
the explanatory variables of the model contribute no more than chance to the
explanation of the dependent variable. This occurs for two reasons, namely, a
small number of observations, and a large number of variables in the model
(Menard, 1995: 56-57).
From Table 9.2, it is observed that the small number of observations and the
large number of variables tested in the present chapter have resulted in the full
model not representing the best fit model to explain companies‘ motives in
recognising zero goodwill impairment when their market values are below the
book values of their net assets for three consecutive years. Section 9.4.1
discusses these two issues and the regression diagnostic test executed to solve
the issue. Section 9.4.2 continues with the second regression diagnostic test.
Section 9.4.3 discusses the overall goodness-of-fit of the models and, finally,
Section 9.4.4 discusses the sensitivity analysis carried out.

269
Table 9.2: Binary logistic regression models: Factors influencing the recognition choice related to reporting zero goodwill impairment
Predicted Sign
The results of coefficients (Wald statistics)
Model A Model B
Full model (as in Section
9.3)
Diagnostics tests Full model (as in
Section 9.3)
Diagnostics tests
Test I Test II Test I Test II
Observations (N) 108 116 113 108 116 114
Intercept 1.154 (0.063)
-1.570 (0.176)
0.048 (0.000)
5.823 (2.292)
3.456 (1.572)
5.322 (3.275)*
Economic factors
∆SALES (H1) + -0.177 (0.013)
0.910 (0.436)
1.823 (1.329)
0.513 (0.118)
1.269 (0.894)
2.361 (2.404)
Log10(0.4-
EARNINGSPreGWILcurrent)1 (H2B)
+ -11.800 (3.156)*
-10.726 (3.863)**
-12.190 (4.137)**
- - -
∆EARNINGSpreGWIL(H3) + -
- - 6.104 (1.848)
5.999 (3.080)*
7.626 (4.339)**
∆OCF (H4) + -3.657 (2.715)*
-2.639 (1.970)
-6.176 (5.894)**
-3.809 (3.035)*
-2.660 (2.084)
-5.654 (6.021)**
BTM (H5) - 0.007 (0.003)
0.064 (0.273)
0.112 (0.664)
-0.084 (0.410)
- -
GWB (H6) - -0.798 (0.054)
- - -2.412 (0.561)
-2.245 (0.812)
-3.054 (1.367)
Contracting perspective
DEBTRATIO (H7) ? 2.039 (1.209)
1.608 (1.048)
1.535 (0.793)
0.812 (0.230)
0.631 (0.205)
0.772 (0.265)
1
When EARNINGSPreGWILCurrent is transformed into Log10(0.4- EARNINGSPreGWILCurrent], the direction of the current year pre-write-off earnings
changes. The negative current year pre-write-off earnings are transformed to positive current year pre-write-off earnings, while the positive current year pre-write-off earnings are transformed to negative current year pre-write-off earnings. For this reason, the beta coefficients for Log10(0.4- EARNINGSPreGWILCurrent] is negative. In interpreting the result, this direction is changed back to its initial direction, which is positive.

270
Table 9.2 (continue): Binary logistic regression models: Factors influencing the recognition choice related to reporting zero goodwill impairment
Predicted Sign
The results of coefficients (Wald statistics)
Model A Model B
Full model (as in Section
9.3)
Diagnostics tests Full model (as in
Section 9.3)
Diagnostics tests
Test I Test II Test I Test II
∆CEOCurrent/prior (H8)
- 0.196 (0.033)
- - -0.057 (0.003)
- -
CEOTENURE (H9) + -0.016 (0.142)
- - -0.008 (0.039)
- -
BATH (H10) + -1.763 (0.071)
-1.445 (0.070)
-0.369 (0.004)
- - -
SMOOTH (H11) - -3.081 (0.165)
- - -7.848 (0.696)
-6.000 (0.628)
-9.124 (1.368)
Ownership structure
MANOWN1 (H12B1) ? 0.043 (0.079)
- - 0.040 (0.069)
- -
MANOWN2 (H12B2) ? 0.029 (0.252)
- - 0.022 (0.148)
- -
MANOWN3 (H12B3) ? -0.102 (2.642)
- - -0.079 (1.946)
- -
OUTCON (H13) ? 0.021 (1.168)
0.025 (4.049)**
0.038 (6.716)***
0.017 (0.877)
0.023 (3.318)*
0.029 (4.726)**
*, ** denote significance at the 0.05, and 0.01 level, respectively (two-tailed).

271
Table 9.2 (continue): Binary logistic regression models: Factors influencing the recognition choice related to reporting zero goodwill impairment
Predicted Sign
The results of coefficients (Wald statistics)
Model A Model B
Full model (as in Section
9.3)
Diagnostics tests Full model (as in Section
9.3)
Diagnostics tests
Test I Test II Test I Test II
SIZE (H16) ? -0.509 (2.700)
-0.293 (1.865)
-0.497 (4.314)**
-0.405 (1.846)
-0.272 (1.553)
-0.422 (3.263)*
INDUSTRYG5 (H17) – Industrial and basic materials
?
- - - -
2 - Consumer goods and services
-0.323 (0.277)
- - -0.468 (0.620)
- -
3 – Financials 0.899 (0.821)
- - 0.365 (0.169)
- -
4 - Utilities, health, Oil and Gas
-1.381 (0.961)
- - -1.307 (0.939)
- -
5 - Technology and Telecom.
-2.104 (3.039)*
- - -2.115 (3.229)*
- -
ADD (H19) - 0.822 (0.732)
- - 0.703 (0.593)
- -
-2 Log likelihood 109.396 125.664 108.309 113.284 129.723 116.740
Chi-square 21.866 NS 14.674* 24.472*** 17.977NS 10.615 NS 18.604**
Hosmer-Lemeshow 0.707 0.658 0.315 0.854 0.447 0.342
Cox and Snell R Square 0.183 0.119 0.195 0.153 0.087 0.151
Nagelkerke R Square 0.261 0.169 0.282 0.218 0.125 0.217
*, ** denote significance at the 0.05, and 0.01 level, respectively (two-tailed).
272
9.4.1 Regression diagnostic test I: Small number of observations
The first regression diagnostic test is carried out because of the small number of
observations. Long (1997: 53-54) explains that it is risky to apply the maximum
likelihood (the estimation procedure in logistic regression model) if the number
of observations is smaller than 100. This is because the maximum likelihood
estimators may not necessarily be good estimators in a small observation (Long,
1997: 53-54). He (p. 54) added that if there are many parameters in the model,
then more observations are needed. As a rule of thumb, Green (1991: 508) and
Field (2009: 222) suggested that the minimum number of observation should be
50 + 8k, where k is the number of variables tested.
In the present chapter, the number of observations cannot be increased. This is
because the 108 companies analysed in the full model represent the total
population of companies which fulfil the selection criteria (see Figure 9.2). Thus,
to reduce the risk of flawed estimators, the number of variables tested needs to
be reduced. Following the suggestion made by Greene (1991), in the Diagnostic
test I, the number of variables to be included in the regression model is reduced
to eight (i.e. applying Greene (1991)‘s formula of 50 + 8k = 108). Using the
general to specific modelling strategy as explained by Field (2009: 213), variables
are dropped from the full model (as shown in Table 9.2) one at a time until the
number of variables is reduced to 8. At the same time, because of the lack of
companies for ∆CEO, ADD, and INDUSTRYG5, these variables are also dropped
from the model (see Section 9.2.2). In dropping these variables, two criteria
apply. Firstly, these are the least significant variables, and secondly, the
dropping of these variables does not lead to a failure in addressing any of the
five research questions specified in Section 9.1. As an example, although debt
ratio is non-significant, it is retained in the model as it is the only variable
employed to test the debt hypothesis. Thus, as shown in Table 9.2, in Model A
and Model B, the Diagnostic test I consists of 116 observations with eight test
variables. Reducing the number of variables tested has improved Model A as its

273
Chi-square value is 14.674 and is marginally significant at p-value less than 0.10.
However, the Chi-square value for Model B is non-significant.
9.4.2 Regression diagnostic test II: Influential observations
The second diagnostic test carried out is based on the argument put forward by
Menard (2002) that influential observations may mislead the result of the binary
logistic regression. Therefore, in Diagnostic test II, using the model derived from
the Diagnostic test I, influential observations are excluded from the analysis. This
is done using the Casewise listing of residuals in SPSS where standardised
residuals which are greater than two are identified (Tarling, 2009: 75). In Model
A under the Diagnostic test I, three cases which reported standardised residuals
greater than two are deleted; in Model B under the Diagnostic test I, two cases
which reported standardised residuals greater than two are deleted. Accordingly,
as shown in Table 9.2, in Model A under the Diagnostic test II, the number of
observation is based on 113 companies, and in Model B under the Diagnostic test
II, the number of observation is based on 114 companies.
9.4.3 Assessing the overall model
Comparing the overall fit of the full model, Diagnostic test I, and Diagnostic test
II (see Table 9.2), it is observed that in Model A under Diagnostic test I, by
reducing the number of test variables, the overall fit of the model is improved.
Additionally, by solving the issue of influential observations under Diagnostic test
II, the overall fit for both Model A and Model B has greatly improved. Thus,
because of the small number of observations analysed and the issue of influential
observations, Model A and Model B (derived from Diagnostics test II) are the two
best models which could help explain companies‘ motives in recognising zero
goodwill impairment in a situation where their market values are below the book
values of their net assets for three consecutive years.

274
9.4.4 Sensitivity analysis – Current year pre-write-off earnings
Sensitivity analysis for current year pre-write-off earnings (EARNINGSPreGWILcurrent)
is conducted in order to assess whether empirical result of the variable would be
sensitive to the specific year of analysis. This is done by substituting the variable
with prior year pre-write-off earnings (EARNINGSPreGWILprior) (see Appendix 9.3).
The results of the sensitivity analysis reveal that the new variable is statistically
significant in Model A and the Diagnostic test II; the variable is marginally
significant (at p-value less than 0.10) in the Diagnostic test I. This point will be
discussed further in Section 9.5.1.1.
9.5 Discussion of the result for a recognition choice related to reporting zero goodwill impairment
This section discusses results of the five factors which have been employed to
test the recognition choice related to reporting zero goodwill impairment. These
factors are: economic factors (see Section 9.5.1), the contracting perspective
(see Section 9.5.2), the opportunistic behaviour perspective (see Section 9.5.3),
ownership structures (see Section 9.5.4), and company-specific factors (see
Section 9.5.5).
As noted in Section 2.2.2, Omar and Mohd-Saleh (2011) conducted a recognition
study related to goodwill impairment by Malaysian listed companies. However,
the result of the present chapter could not be compared with them because the
focus of their study differs from the present study. Omar and Mohd-Saleh (2011:
400 and 402) examined the recognition of goodwill impairment by the total
population of Malaysian listed companies during the initial year of implementing
FRS 3 (see Section 2.2.2 for detail), whereas the present recognition study
focuses on companies which recognise zero goodwill impairment in a specific
setting (i.e. companies‘ market values lower than the book values of their net
assets for three consecutive years).

275
9.5.1 Research Question 9: Economic factors
Variables employed to test for the influence of the economic factors on the
recognition choice related to reporting zero goodwill impairment are: ∆SALES,
∆OCF, BTM, GWB, EARNINGSPreGWILcurrent, ∆EARNINGSpreGWIL, and EARNINGSPreGWILPrior
(see Sections 5.4 to 5.4.5). The results reveal that four variables –
EARNINGSPreGWILcurrent, EARNINGSPreGWILprior, ∆EARNINGSpreGWIL, and ∆OCF - are found
statistically significant in explaining the recognition choice related to reporting
zero goodwill impairment in companies which have market values below the book
values of their net assets for three consecutive years. The remaining three
variables - ∆SALES, BTM and GWB - are found non-significant in all of the models
tested (see Table 9.2). Therefore, the null hypotheses set in H1-Null for ∆SALES
(see Section 5.4.1), in H5-Null for BTM (see Section 5.4.4), and in H6-Null for GWB
(see Section 5.4.5) cannot be rejected.
Next, Sections 9.5.1.1 to 9.5.1.3 discuss the statistically significant result for the
pre-write-off earnings (i.e. EARNINGSPreGWILcurrent and EARNINGSPreGWILprior), change
in pre-write-off earnings from prior year to current year (∆EARNINGSPreGWIL), and
change in operating cash flows from prior year to current year (∆OCF),
respectively.
9.5.1.1 Companies’ pre-write-off earnings (EARNINGSPreGWILcurrent and EARNINGSPreGWILprior)
Current year pre-write-off earnings (EARNINGSPreGWILcurrent) is found statistically
significant in Model A (i.e. the full model, Diagnostics test I, and Diagnostics test
II) in a positive direction as predicted (see Table 9.2). The result of the
sensitivity analysis also shows a statistically significant positive relationship
between prior year pre-write-off earnings (EARNINGSPreGWILprior) and the
recognition choice related to reporting zero goodwill impairment (see Appendix
9.3).

276
The positive direction observed for the current year pre-write-off earnings
provides support to the economic factors (see H2B in Appendix 1 of the thesis),
suggesting that the higher the current year pre-write-off earnings, the more
likely it is that the companies will recognise zero goodwill impairment. This
result indicates that when comparing two groups of companies, i.e. the test
group vs. the control group, which experienced similar market capitalisation
indication (i.e. their companies market values are lower than the book values of
their net assets at the balance sheet date) for three consecutive years, the test
group of companies recognised zero goodwill impairment because their current
year pre-write-off earnings are higher than the control group of companies. This
result suggests that the test group chose to go against the market capitalisation
indication which exists for three consecutive years (by recognising zero goodwill
impairment) because their current year pre-write-off earnings are better than
the control group. Therefore, in the case of the current year pre-write-off
earnings, this finding indicates that the recognition choice related to reporting
zero goodwill impairment exercised by the test group reflects the economic
factors.
9.5.1.2 Change in pre-write-off earnings (∆EARNINGSpreGWIL)
Change in pre-write-off earnings from prior year to current year
(∆EARNINGSpreGWIL) is found marginally significant (at p-value less than 0.10) in
Model B - Diagnostics test I, and statistically significant in Model B - Diagnostics
test II (see Table 9.2). The positive direction observed for ∆EARNINGSpreGWIL
provides support to the economic factors (see H3 in Appendix 1 of the thesis).
This result suggests that the better the performance of a company, which is
reflected as positive value for ∆EARNINGSpreGWIL, the higher the likelihood they
will exercise recognition choice related to reporting zero goodwill impairment. In
this context, when comparing two groups with similar experiences of market
capitalisation indication for three consecutive years, the test group of companies
are found to have recognised zero goodwill impairment in order to reflect the

277
companies‘ better performance. This result suggests that the test group chose to
go against the market capitalisation indication which exists for three consecutive
years (by recognising zero goodwill impairment) because their change in pre-
write-off earnings are better than the control group. Therefore, for the change in
pre-write-off earnings, this finding indicates that the recognition choice related
to reporting zero goodwill impairment exercised by the test group reflects the
economic factors.
9.5.1.3 Change in operating cash flows (∆OCF)
Change in operating cash flows from prior year to current year (∆OCF) is found
statistically significant in explaining the recognition choice related to reporting
zero goodwill impairment in Model A - Diagnostic test II, and in Model B -
Diagnostic test II (see Table 9.2). However, the variable is found significant in a
negative direction, which is contrary to the prediction set for the economic
factors (see H4 in Appendix 1 of the thesis). This result indicates that in
comparing two groups of companies - the test group vs. the control group, the
test group of companies recognised zero goodwill impairment because changes in
their operating cash flows from prior year to current year are lower than those of
the control group. Thus, this result suggests that the test group chose to go
against the market capitalisation indication which exists for three consecutive
years (by recognising zero goodwill impairment) because their change in
operating cash flows from prior year to current year are worse than the control
group.
The result for the change in operating cash flows from prior year to current year
discussed in the above paragraph conflicts with the results for the current year
pre-write-off earnings (discussed in Section 9.5.1.1) and change in pre-write-off
earnings from prior year to current year (discussed in Section 9.5.1.2). To
understand these conflicting results, a detailed inspection of the change in
operating cash flows for all of the 108 companies is carried out. The inspection
reveals no unusual pattern of the operating cash flows. Companies which

278
recognised zero goodwill impairment have lower change in operating cash flows
from prior year to current year than companies which recognised goodwill
impairment losses. Accordingly, the result of the change in operating cash flows
indicates that the recognition choice related to reporting zero goodwill
impairment exercised by the test group do not reflects the economic factors.
Because change in operating cash flows measures the cash-related performance
attributes (see Section 5.4.3), it is possible that the managers are recognising
zero goodwill impairment in the belief that the company‘s performance (i.e. in
terms of its operating cash flows) will improve in the future.
9.5.2 Research Question 10: Contracting perspective
Debt ratio, the only variable testing the contracting perspective is non-significant
in explaining the recognition choice related to reporting zero goodwill
impairment (see Table 9.2). Therefore, the null hypothesis for H7-Null (see Section
5.5) cannot be rejected. As discussed in Section 8.7, the non-significance of
DEBTRATIO in the measurement study could be due to the indirect proxy
employed. Thus, similar to the measurement study, the recognition study also
could not provide evidence on the applicability of the contracting perspective in
explaining the recognition choice related to reporting zero goodwill impairment
for companies which have their market values lower than the book values of their
net assets for three consecutive years.
9.5.3 Research Question 11: Opportunistic behaviour perspective
Four variables are employed to test the applicability of an opportunistic
behaviour perspective in explaining the recognition choice related to reporting
zero goodwill impairment. These variables are: change in CEO, CEO tenure, big
bath reporting behaviour, and earnings smoothing activities (see Sections 5.6.1 to
5.6.4). Table 9.2 shows that none of these variables is statistically significant in
the binary logistic regression models employed - Model A and Model B. Therefore,

279
the null hypothesis set in H8-Null for change in CEO (see Section 5.6.1), H9-Null for
CEO tenure (see Section 5.6.2), H10-Null for big bath reporting (see Section 5.6.3),
and H11-Null for earnings smoothing (see Section 5.6.4) cannot be rejected. Hence,
the results of the present chapter could not provide evidence that managers
exercised recognition choice related to reporting zero goodwill impairment for
opportunistic reporting.
There are two possible reasons for the non-significance of these variables.
Firstly, for the CEO tenure, as discussed in detail in Section 8.8.2, the variable
which measured the number of years a CEO held a position is an indirect proxy
for whether a CEO is responsible in business acquisitions which lead to an
existence of goodwill.
Secondly, for ∆CEO, the non-significance of this variable means that the null
hypothesis cannot be rejected. This could occur because the small number of
observations and less variation in the test group and the control group. As shown
in Appendix 9.2, only 10 CEO changes took place of which five are from the test
group and five from the control group.
A point for discussion is that big bath reporting (BATH) is found non-significant in
Models A and B (see Table 9.2). However, in the sensitivity analysis using prior
year pre-write-off earnings (see Appendix 9.3), the variable is found statistically
significant, in a positive direction, in the recognition choice related to reporting
zero goodwill impairment. The positive direction observed suggests that
companies which recognised zero goodwill impairment (the test group) reported
lower BATH than companies which recognised goodwill impairment losses (the
control group). This result indicates that the variable, BATH, test companies‘
motives in reporting goodwill impairment losses and not companies‘ motives in
reporting zero goodwill impairment.

280
9.5.4 Research Question 12: Ownership structures
Two variables are employed to test the influence of company ownership
structures, i.e., managerial ownership (MANOWNNon-monotonic) and outside
ownership concentration (OUTCON). Table 9.2 reports that MANOWNNon-monotonic
(i.e. MANOWN1, MANOWN2, and MANOWN3) is non-significant in the recognition
choice related to reporting zero goodwill impairment. Accordingly, the null
hypothesis for H12B-Null (see Section 5.7.1) cannot be rejected.
Meanwhile, outside ownership concentration (OUTCON) is statistically significant
in Models A and B, for both Diagnostics test I and Diagnostics test II. The
statistically significant result, in a positive direction, suggests that the higher the
outside ownership concentration, the more likely it is for the companies to
recognise zero goodwill impairment. This result indicates that outside ownership
concentration play an influential role in recognition choice related to reporting
zero goodwill impairment in companies which have market values below the book
values of their net assets for three consecutive years. Hence, the result suggests
that the test group chose to go against the market capitalisation indication which
exists for three consecutive years (by recognising zero goodwill impairment)
because their outside ownership concentration is higher than the control group.
The descriptive analysis in Appendix 9.1 shows the outside ownership
concentration for the test group has a mean value of 0.47 (median value of 0.49)
while the control group has a mean value of 0.42 (median value of 0.45). Looking
at the descriptive analysis and the regression result from another perspective,
the finding suggests that despite an indication that goodwill may be impaired
which prevail for three consecutive years in these companies, the managers
choose to go against the market capitalisation indication by recognising zero
goodwill impairment because of the high concentration of outside ownership.
This implies that in companies with high outside ownership concentration, when
recognising zero goodwill impairment, the managers are less influenced by the
market capitalisation indication which exists for three consecutive years.

281
9.5.5 Company-specific factors (control variables)
Three variables are employed to control for company-specific factors, i.e. SIZE,
Industry (INDUSTRYG5), and addition of goodwill (ADD). Apart from SIZE, the
other two variables are found non-significant in the recognition choice related to
reporting zero goodwill impairment. Accordingly, the null hypotheses set in H17-
Null for INDUSTRYG5 (see Section 5.9.2) and H19-Null for ADD (see Section 5.9.4)
cannot be rejected.
Because of the mixed results documented by prior studies, there is no prediction
sign formed on the association between SIZE and the recognition choice related
to reporting zero goodwill impairment (see Appendix 1 of the thesis). The
regression result reported in Table 9.2 shows that size is statistically significant
in a negative direction, suggesting that the greater the company size, the lower
the likelihood of recognising zero goodwill impairment.
9.6 Summary and conclusions
This chapter has analysed factors influencing the recognition choice related to
reporting zero goodwill impairment in a specific setting whereby companies have
their market values lower than the book values of their net assets for three
consecutive years. In this setting, companies which recognise zero goodwill
impairment are considered as exercising a recognition choice related to reporting
zero goodwill impairment. They are referred to as a test group and are being
tested against a control group of companies. The control group is a group of
companies which experience similar condition (i.e. their market values are below
the book values of the net assets for three consecutive years); however, they
report goodwill impairment losses at the end of the third year.
Factors influencing the recognition choice are grouped into economic factors (see
Section 9.5.1), contracting perspective (see Section 9.5.2), opportunistic
behaviour perspective (see Section 9.5.3), ownership structures (see Section
282
9.5.4), and company-specific factors (see Section 9.5.5). In analysing these
factors, two binary logistic models have been constructed (i.e. Model A, and
Model B) with two regression diagnostics tests undertaken (see Sections 9.4.1 to
9.4.2).
Overall, by recognising zero goodwill impairment when companies‘ market values
are below the book values of their net assets for three consecutive years, the
managers of such companies chose to go against the market capitalisation
indication which is stated in FRS 136 Impairment of Assets. This choice can be
explained partly by three main factors. These are: (i) economic factors (i.e.
current year pre-write-off earnings, prior year pre-write-off earnings, change in
pre-write-off earnings from prior year to current year, and change in operating
cash flows from prior year to current year), (ii) ownership structures (i.e. outside
ownership concentration), and (iii) size of company.
The results for the current year pre-write-off earnings, prior year pre-write-off
earnings, and change in pre-write-off earnings from prior year to current year
suggest that the recognition choice exercised reflect the economic factors. On
the other hand, the result for the change in operating cash flows from prior year
to current year suggests that the recognition choice exercised does not reflect
the economic factors. Similarly, for the outside ownership concentration, the
result suggests that companies in the test group chose to go against the market
capitalisation indication which exists for three consecutive years (by recognising
zero goodwill impairment) because of their higher outside ownership
concentration compared to companies in the control group.
At the same time, the binary logistic regression results could not provide
evidence on the applicability of the contracting perspective, or the opportunistic
behaviour perspective, in explaining the recognition choice related to reporting
zero goodwill impairment.

283
The results of the present chapter, therefore, contribute to the literature of
accounting choices related to goodwill impairment in three ways.
Firstly, as discussed in the above paragraphs, the recognition study provides
empirical evidence on the influence of the economic factors (i.e. companies‘
pre-write-off earnings, and change in operating cash flows) and size of company
on the recognition choice related to reporting zero goodwill impairment.
Secondly, it provides new empirical evidence on the influence of outside
ownership concentration on the recognition choice related to reporting zero
goodwill impairment. The result reveals that the higher the outside ownership
concentrated, the more likely it is for the companies to exercise the recognition
choice related to reporting zero goodwill impairment.
Thirdly, it provides Malaysian literature, for the first time, with a research
setting designed to capture evidence of a recognition choice related to reporting
zero goodwill impairment exercised by Malaysian listed companies after the
implementation of FRS 3. This setting could also be tested in listed companies in
other countries which have concentrated ownership, such as the Asian developing
countries.

284
Appendix 9.1: Descriptive statistics for the continuous variables
All observations (N = 132 companies)
Test group Choice
(N = 96)
Control group No choice (N = 36)
Test of
differences
N Missi
ng
values
Mean Median
SD Mean Median
SD Mean Median
SD Mean
p-
value
Median p-value
Economic factors
∆SALES (H1) 130 2 0.025 0.005 0.182 0.037 0.014 0.160 (0.007) (0.005) 0.230 0.302 0.234
EARNINGSPriorPreGWIL 130 2 0.023 0.028 0.058 0.028 0.031 0.057 0.010 0.019 0.059 0.122 0.144
EARNINGSPreGWILCurrent
(H2B) 130 2 0.017 0.022 0.073 0.029 0.024 0.046 (0.017) 0.019 0.112 0.022 0.120
∆EARNINGSpreGWIL(H3) 130 2 (0.006) 0.001 0.074 0.002 0.001 0.055 (0.027) 0.003 0.107 0.135 0.517
∆OCF (H4) 131 1 0.009 0.015 0.134 0.003 0.018 0.127 0.024 0.012 0.152 0.436 0.892
BTM (H5) 132 0 3.149 2.550 1.979 3.154 2.545 1.989 3.136 2.600 1.982 0.963 0.818
GWB (H6) 131 1 0.044 0.016 0.082 0.040 0.014 0.084 0.054 0.019 0.074 0.385 0.162
Contracting perspective
DEBTRATIO (H7) 128 4 0.257 0.260 0.166 0.254 0.251 0.162 0.266 0.265 0.177 0.716 0.783
Opportunistic behaviour perspective
CEOTENURE (H9) 123 9 8.894 7.000 6.792 9.281 7.000 6.695 7.882 6.000 7.040 0.309 0.141
BATH (H10) 130 2 (0.019) 0.000 0.059 (0.012) 0.000 0.034 (0.039) 0.000 0.097 0.110 0.204
SMOOTH (H11) 130 2 0.013 0.000 0.037 0.014 0.000 0.038 0.011 0.000 0.034 0.680 0.576
Ownership structure
MANOWN1 (H12B1) 120 12 3.027 4.650 2.238 2.965 4.235 2.241 3.182 5.000 2.258 0.635 0.541
MANOWN2 (H12B2) 120 12 5.158 0.000 7.557 4.538 0.000 7.001 6.726 1.055 8.727 0.154 0.349
MANOWN3 (H12B3) 120 12 1.927 0.000 5.809 1.361 0.000 4.246 3.360 0.000 8.502 0.198 0.195
OUTCON (H13) 121 11 45.751 47.050 19.780 47.105 49.130 19.669 42.286 45.485 19.932 0.230 0.235
Control variables
SIZE (H16) 132 0 12.647 12.545 1.039 12.601 12.525 1.105 12.770 12.555 0.839 0.408 0.300

285
Appendix 9.2: Descriptive statistics for the categorical variables
Variables
Number of observations (count) Chi-square test of
independence (Choice
vs. No choice) All Missing
values Test group
- Choice
Control group
- No choice Value Sig. (2-tailed
test) Contracting perspective
2.482
0.115
∆CEOCurrent/prior (H8) 123 9
- Change 5 5
- No Change 83 30
Control variables
ADD (H19) 132 - 0.016
0.901 - Yes 11 4
- No 84 33
INDUSTRYG5 (H17) - (1) Industrials and Basic materials
42
14
3.621
0.460
(2) Consumer goods and services
32 12
(3) Financials 15 4
(4) Utilities, healthcare,Oil and gas
3 1
(5) Technology and Telecommunication
4 4
Total 131 1 96 35

286
Appendix 9.3: Sensitivity analysis for current year pre-write-off earnings by replacing it with prior year pre-write-off earnings
Sign
The results of coefficients (Wald statistics) Model A
Full model (as in Section 9.3)
Diagnostics tests
Test I Test II
Observations (N) 108 116 113 Intercept 6.334
(2.591)
4.174
(2.292) 6.718
(4.802)**
Economic factors ∆SALES (H1) + -0.119
(0.006) 0.994
(0.529)
1.838
(1.367) EARNINGSPreGWILprior + 16.611
(4.847)**
7.710
(3.625)*
9.151
(4.469)** ∆OCF (H4) + -0.119
(2.557)
-2.814
(2.192) -6.492
(6.465)** BTM (H5) - 16.611
(0.139)
0.024
(0.043)
0.065
(0.248) GWB (H6) - -0.295
(0.007)
- -
Contracting perspective DEBTRATIO (H7) ? 2.224
(1.472)
1.276
(0.706)
1.213
(0.552)
Opportunistic behaviour perspective ∆CEOCurrent/prior (H8) - 0.217
(0.038)
- -
CEOTENURE (H9) + -0.021
(0.257)
- -
BATH (H10) + 9.514
(3.125)*
8.157
(4.662)**
10.589
(6.812)*** SMOOTH (H11) - 13.840
(1.745)
- -
Ownership structure MANOWN1 (H12B1) ? 0.037
(0.056)
- -
MANOWN2 (H12B2) ? 0.027
(0.207)
MANOWN3 (H12B3) ? -0.108
(2.781)*
OUTCON (H13) ? 0.022
(1.243) 0.022
(3.145)*
0.034
(5.756)**
Control variables SIZE (H16) ? -0.572
(3.324)*
-0.362
(2.702) -0.590
(5.622)** INDUSTRYG5 (H17) 1 - Indust and basic mat.
?
- - -

287
Sign
The results of coefficients (Wald statistics) Model A
Full model (as in Section 9.3)
Diagnostics tests
Test I Test II
2 - Consumer goods and
services
-0.226
(0.132)
- -
3 – Financials 1.099
(1.196)
- -
4 - Utilities, health, Oil and
Gas -1.495
(1.112)
- -
5 - Technology and Telecom.
-2.013
(2.747)*
- -
ADD (H19) - 0.910
(0.839)
- -
-2 Log likelihood 106.917 125.873 107.793
Chi-square 24.34 NS 14.465* 24.987***
Hosmer-Lemeshow 0.736 0.488 0.485
Cox and Snell R Square 0.202 0.117 0.198
Nagelkerke R Square 0.287 0.167 0.287
*, **, *** denote significance at the 0.10, 0.05, and 0.01 level, respectively (two-tailed)
NS denotes Not significant

288
Chapter 10: Discussion and Conclusion
10.1 Introduction
This concluding chapter has two main purposes. Firstly, it reviews briefly the
achievement of the four research objectives, which have been formulated at the
outset of this thesis (see Section 1.3). Secondly, it discusses the contributions of
the study in relation to the research objectives and extant literatures, explains
its limitations, and offers suggestions for future research.
This chapter is structured into six sections including the introduction. Section
10.2 reiterates the overall aim of this thesis and the four research objectives.
Section 10.3 describes briefly the achievement of the four research objectives.
At the end of the section, a synthesis of accounting choices related to goodwill
impairment is presented. Section 10.4 discusses the contributions of the thesis.
Section 10.5 explains the limitations of the study. Section 10.6 concludes the
chapter by offering suggestions for future research.
10.2 Research aim and objectives
This thesis has sought to analyse accounting choices related to goodwill
impairment exercised by listed companies in Malaysia in the first three years of
the implementation of FRS 3 Business Combinations (i.e. 2006/7 to 2008/9) (see
Section 1.3). Table 10.1 reiterates the four research objectives of the thesis as
set out in Section 1.3. Next, Section 10.3 describes briefly the achievement of
the four research objectives.

289
Table 10.1: Summary of research objectives
Theoretical research objective
1.
To assess the applicability of theories of accounting choice in explaining the implementation decisions related to goodwill impairment by Malaysian listed companies.
Specific research objectives Empirical chapters
2.
To explore, via the annual reports of companies, types of accounting choice related to goodwill impairment exercised by Malaysian listed companies after the implementation of FRS 3.
Disclosure study - Chapter7
3. To analyse factors influencing managers‘ decisions when determining the magnitude of goodwill impairment losses divided by prior year total assets (including goodwill), and zero otherwise reported on the income statement.
Measurement study - Chapter 8
4. To analyse factors influencing the recognition choice related to reporting zero goodwill impairment exercised by Malaysian listed companies in a situation where companies‘ market values are lower than the book values of their net assets for three consecutive years.
Recognition study - Chapter 9
10.3 Achievement of the four research objectives
This section describes briefly77 how the four research objectives of this thesis
(see Table 10.1) have been achieved by answering 12 research questions (see
Section 1.3). At the end of the section, a synthesis of accounting choices related
to goodwill impairment exercised by Malaysian listed companies is presented (see
Section 10.3.5).
10.3.1 Objective 1: Theoretical research question
The first research objective has sought to assess the applicability of theories of
accounting choice in explaining the implementation decisions related to goodwill
77 Detailed discussions of these findings in relation to the extant literature have been carried in
each of the empirical chapters (see Chapters 7-9).

290
impairment by Malaysian listed companies (see Table 10.1), focusing on Research
Question 1:
How can an investigation of FRS 3, focusing on goodwill impairment by
Malaysian listed companies, contribute to the theories of accounting
choice?
Two perspectives of accounting choices have been tested in this thesis, i.e. the
opportunistic behaviour perspective (see Sections 8.8 and 9.5.3), and the
contracting perspective (see Sections 8.7 and 9.5.2). For the opportunistic
behaviour perspective, the measurement study has provided empirical evidence
on the applicability of this perspective in explaining the measurement of
goodwill impairment by Malaysian listed companies. The evidence is presented
through the statistically significant results for three variables, i.e. change in
CEO, big bath reporting, and earnings smoothing (see Section 10.3.3 for detail
discussion). However, in the recognition study, the non-significance results of
these three variables could not provide evidence on the applicability of the
opportunistic behaviour perspective in explaining the recognition choice related
to reporting zero goodwill (see Section 10.3.4 for detailed discussion).
For the contracting perspective, the non-significance of the debt ratio, a variable
testing the debt hypothesis, both in the measurement and recognition studies
suggest that the two studies could not provide evidence on the applicability of
the debt hypothesis in explaining the implementation decisions related to
goodwill impairment by Malaysian listed companies (see Section 10.4.1.1 for
detail).
See Sections 10.4.1 to 10.4.1.2 for detailed discussion of the applicability of
these two perspectives of accounting choice.
10.3.2 Objective 2: Disclosure study of goodwill impairment
The second research objective has aimed to explore, via the annual reports of
companies, types of accounting choice related to goodwill impairment exercised

291
by Malaysian listed companies after the implementation of FRS 3 (see Table
10.1). This aim has been achieved in the disclosure study of goodwill impairment
by answering two research questions - Research Question 2 and Research
Question 3 (detailed below).
Research Question 2:
To what extent is the market capitalisation indication (i.e. companies’
market values lower than the book values of their net assets at the
balance sheet date) an appropriate proxy for an indication that
goodwill may be impaired?
Research Question 2 has been addressed in part one of the disclosure study (see
Section 7.2) by comparing two types of information, which represent the
observed practice with stated explanation. The data compared are: (i) the
market capitalisation indication of companies (i.e. where market values are
lower than the book values of net assets at the balance sheet date), and (ii)
reasons for companies reporting goodwill impairment (both zero, and goodwill
impairment losses) disclosed in the Notes to the Financial Statement (see Section
1.4.1).
The results of part one of the disclosure study show that the market
capitalisation indication can be employed as a starting point in identifying types
of accounting choice related to goodwill impairment exercised by Malaysian
listed companies (see Sections 7.2 and 7.4). However, it cannot be applied as a
stand-alone indicator that goodwill might be impaired. This is because the
market capitalisation indication does not fully reflect the condition of the cash-
generating-units containing goodwill, disclosed in the Notes to the Financial
Statement. This finding suggests that to identify the types of accounting choice,
further information, in addition to the market capitalisation indication, is
needed, such as companies‘ financial performances and segment results
containing goodwill.

292
Following on from this suggestion, a disclosure framework has been constructed.
The disclosure framework takes into account six key items of data: (i) goodwill
data, (ii) segment result, (iii) financial performance, (iv) the market
capitalisation indication, (v) reasons for reporting goodwill impairment loss
disclosed in the Notes to the Financial Statement, and (vi) audit report
concerning goodwill (see Figure 6.2 in Section 6.5.2.2).
Using the self-constructed disclosure framework, Research Question 3 has been
answered in part two of the disclosure study (see Section 7.3).
Research Question 3:
What are the types of accounting choice related to goodwill impairment
exercised by Malaysian listed companies which can be identified
through detailed analysis of annual reports?
From the result of part one of the disclosure study, 20 companies which are
categorised into Group 2 and reported goodwill impairment losses have been
selected. Using the self-constructed disclosure framework, an in-depth analysis
of goodwill movement of these 20 companies for the past several years
(depending on the traceability of goodwill impairment losses backward from the
write-off year to the acquisition year) has been undertaken (see Section 7.3).
The result reveals three types of accounting choice related to goodwill
impairment exercised by Malaysian listed companies (see Section 7.3). These are,
delayed reporting goodwill impairment losses for four companies (see Section
7.3.1), timing in reporting goodwill write-off from goodwill which arose from an
apparent overpayment made at the time of business acquisition for eight
companies (see Section 7.3.2), and systematic reduction of goodwill balance for
two companies (see Section 7.3.3). The first two types of accounting choice
reflect the exercise of managerial discretion in terms of timing in reporting the
impairment losses. The last type of accounting choice reflects companies‘
attempt in perpetuating the old system of amortising its goodwill balance
systematically every year (see Section 7.4).

293
10.3.3 Objective 3: Measurement study of goodwill impairment
The third research objective has sought to analyse factors influencing managers‘
decisions when determining the magnitude of goodwill impairment losses divided
by prior year total assets (including goodwill), and zero otherwise reported on
the income statement (see Table 10.1). Using the total population of Malaysian
listed companies implementing FRS 3 in the first three years of the standard
taking effect (i.e. 2006/7 to 2008/9), this aim has been achieved in the
measurement study of goodwill impairment by answering five research questions
(i.e. Research Question 4 to Research Question 8). The following paragraphs
specify each of these research questions and briefly review their key findings.
Research Question 4 tests the influence of the economic factors on the
measurement of goodwill impairment as follows:
To what extent do the decisions of Malaysian listed companies in
measuring goodwill impairment indicate that they reflect the
underlying economic values of cash-generating-units containing
goodwill?
The key finding for the economic factors is that there is consistent evidence of
pre-write-off earnings (EARNINGSPreGWILprior, EARNINGSPreGWILCurrent, and
ΔEARNINGSpreGWIL) influencing the measurement of goodwill impairment by
Malaysian listed companies (see Section 8.6).
When pre-write-off earnings are measured at one specific point in time (as in
EARNINGSPreGWILprior in Section 8.6.2.1, and EARNINGSPreGWILCurrent in Section
8.6.2.2), the statistically significant negative association between the pre-write-
off earnings and the reporting of goodwill impairment losses shows that as the
pre-write-off earnings increase, lower goodwill impairment losses are reported.
This suggests that the managers‘ decisions when determining the impairment
losses reflect companies‘ economic factors.

294
However, when the earnings of companies are measured as a change in pre-
write-off earnings from prior year to current year (as in ΔEARNINGSpreGWIL – see
Section 8.6.2.3), the statistically significant positive association between the
change in pre-write-off earnings and the reporting of goodwill impairment losses
shows that as change in pre-write-off earnings increase, higher goodwill
impairment losses are reported. This result points to the possibility of companies
exercising an accounting choice. This is because the decisions when determining
the impairment losses do not reflect companies‘ economic factors.
Detailed discussion of the two conflicting results for companies‘ pre-write-off
earnings is presented in Section 10.4.2.2.
Research Question 5 deals with the contracting perspective as follows:
To what extent do the decisions of Malaysian listed companies in
measuring goodwill impairment support the contracting perspective?
In the present study, due to the unavailability of data relating to actual debt
covenants, debt ratio (leverage) has been employed as a proxy for companies‘
closeness to the debt covenant violations (see Section 5.5). The result shows that
debt ratio is non-significant in nearly all of the regression models in explaining
the measurement of goodwill impairment by Malaysian listed companies (see
Section 8.7). Thus, the present study could not provide evidence to support the
contracting perspective, in particular, the debt hypothesis.
Detailed discussion of the contracting perspective is presented in Section
10.4.1.1.
Research Question 6 deals with the opportunistic behaviour perspective:
To what extent do the decisions of Malaysian listed companies in
measuring goodwill impairment support the opportunistic behaviour
perspective?
Four variables have been employed to test the opportunistic behaviour
perspective, i.e. CEO tenure, change in CEO, big bath reporting, and earnings

295
smoothing (see Section 5.6). CEO tenure is found non-significant while the last
three variables are found statistically significant in explaining the measurement
of goodwill impairment by Malaysian listed companies (see Sections 8.8.1 to
8.8.4). The statistically significant results for these three variables provide
evidence to support the opportunistic behaviour perspective.
See Section 10.4.1.2 for the detailed discussion of the opportunistic behaviour
perspective.
Research Question 7 tests the influence of ownership structures of companies on
the measurement of goodwill impairment:
To what extent do the decisions of Malaysian listed companies in
measuring goodwill impairment indicate that they reflect companies’
ownership structures?
Two variables are employed to test the ownership structures of companies, i.e.
managerial ownership, and outside ownership concentration (see Section 8.9).
Both of these variables are found to play influential roles in the measurement of
goodwill impairment by Malaysian listed companies.
For managerial ownership, when the board of executive directors collectively
increase their shareholding from 0% to less than 5%, lower goodwill impairment
losses are reported. However, once the board of directors collectively owns 5% or
more of the shares, managerial ownership is statistically non-significant in
explaining the measurement of goodwill impairment by Malaysian listed
companies (see Section 10.4.2.1 for detailed).
For outside ownership concentration, as the top five outside shareholders (i.e.
institutions, blockholders, and other individuals outside the company) increase
the proportion of shares held, lower goodwill impairment losses are reported
(see Section 8.9.2). Prior studies (e.g. Niehaus, 1989: 271-272; Astami and
Tower, 2006: 8) associate an increase in outside ownership concentration with an
increase in the monitoring of management by shareholders (see Section 5.7.2).

296
Following this explanation, the negative association between outside ownership
concentration and reporting goodwill impairment losses suggests that as the level
of outside ownership concentration increases, indicating increases in outside
monitoring, lower goodwill impairment losses are reported.
The final research question for the measurement study, Research Question 8 is as
follows:
To what extent do the decisions of Malaysian listed companies in
measuring goodwill impairment indicate that they reflect the discretion
available in FRS 136 Impairment of Assets?
All of the variables testing the discretion related to CGUs and discount rates (i.e.
CGU01, CGUContinuous, DISCRATE, DISCMULTIPLE, and DISCRATEDisclosed/Not) are found
non-significant in the measurement of goodwill impairment by Malaysian listed
companies (see Section 8.10). Thus, the present study could not find evidence to
support the arguments made by prior studies (e.g. Guler, 2007: 11; AbuGhazaleh
et al., 2011: 169 and 180), that if managers have an incentive to overstate or
understate goodwill impairment losses, they can be selective in applying
estimates and judgements while performing an impairment test of goodwill (see
Section 4.4).
The non-significance of these variables could be due to managers not exploiting
the discretion they have in reporting goodwill impairment losses. Alternatively,
because the discretion (e.g. CGUs and discounts rates) is part of the disclosure
requirements of FRS 136, and thus readily observable, managers might not make
use of this discretion. Instead, they might exercise their discretion through cash
flows projections, which companies are not required to disclose in the Notes to
the Financial Statement.
10.3.4 Objective 4: Recognition study of goodwill impairment
The fourth research objective has aimed to analyse factors influencing the
recognition choice related to reporting zero goodwill impairment exercised by

297
Malaysian listed companies in a situation where companies‘ market values are
lower than the book values of their net assets for three consecutive years (see
Table 10.1). This objective has been addressed in the recognition study of
goodwill impairment by focusing on 77 companies (after missing values) which
recognised zero goodwill impairment when market values are lower than the
book values of their net assets for three consecutive years (see Figure 9.3 in
Section 9.2.1). These companies are tested against a control group of companies
(31 companies) which experienced a similar condition (i.e. companies which have
market values below the book values of their net assets for three consecutive
years) but who reported goodwill impairment losses at the end of the third year.
The aim of the recognition study has been accomplished by answering four
research questions (Research Questions 9 to 12 – see Section 1.3).
Specifically, Research Questions 9 to 12 cover four factors which potentially
influence the recognition choice related to reporting zero goodwill impairment.
These are: economic factors (in Research Question 9), the contracting
perspective (in Research Question 10), the opportunistic behaviour perspective
(in Research Question 11), and the ownership structures of companies (in
Research Question 12) (see Figure 5.1 in Section 5.2). Overall, the results show
that two main factors play influential roles in the recognition choice related to
reporting zero goodwill impairment in companies which have market values
below the book values of their net assets for three consecutive years. These are:
(i) economic factors (i.e. increase in the current year pre-write-off earnings, or
increase in change in pre-write-off earnings from prior year to current year, and
a decrease in change in operating cash flows from prior year to current year),
and (ii) ownership structures (i.e. increase in outside ownership concentration).
Also, the recognition study found that the greater the company size (measured in
terms of total assets), the lower the likelihood of recognising zero goodwill
impairment. However, the recognition study could not provide evidence on the
applicability of the contracting perspective and the opportunistic behaviour
perspective in explaining the recognition choice related to reporting zero
goodwill impairment.

298
10.3.5 Synthesis of accounting choices related to goodwill impairment exercised by Malaysian listed companies
This thesis has analysed accounting choices related to goodwill impairment
exercised by Malaysian listed companies in the first three years of the
implementation of FRS 3. The accounting choices are identified by the
implementation decisions made by managers (see Section 1.1). Three aspects of
the implementation decisions are examined, namely, disclosure, measurement,
and recognition of goodwill impairment. In the disclosure study, using a self-
constructed disclosure framework, types of accounting choice related to goodwill
impairment are identified (see Section 7.3). In the measurement study,
accounting choices related to goodwill impairment losses are inferred based on
companies‘ hypothesised motives in reporting goodwill impairment losses (see
Section 8.13). In the recognition study, evidence of a recognition choice related
to reporting zero goodwill impairment is captured in a specific setting, and
factors influencing this choice are analysed (see Section 9.6).
An attempt has been made to synthesise accounting choices related to goodwill
impairment exercised by Malaysian listed companies (see Section 8.12.2 for
detail). This is done by selecting 10 companies found to be engaging in earnings
smoothing, with no change in their CEO, and where the management hold the
top 10 highest proportion of shares (i.e. ranging from 31.78% to 51.70%). These
10 companies are then analysed in detail using the self-constructed disclosure
framework. The purpose is to understand the reasons why continuing CEOs, or
top managers holding a large proportion of company shares, would reduce the
goodwill balance by reporting goodwill impairment losses, merely for earnings
smoothing purposes. The result reveals that four78 companies reported goodwill
impairment losses because of the characteristic of the goodwill - two companies
impaired goodwill which arose from an apparent overpayment made at the time
of acquisition, and a further two companies impaired goodwill immediately upon
acquisition. These results suggest that managers of these four companies had
78 The remaining six companies‘ reasons could not be identified by the researcher.

299
already decided on the amount of goodwill impairment losses to be reported.
When their companies encountered a larger positive pre-write-off earnings
surprise (i.e. existence of earnings smoothing – see Section 10.4.1.2 for detail),
the managers take the opportunity to eliminate the goodwill by reporting the
impairment loss.
The results discussed above, despite involving a small number of companies (10
companies), help contextualise one of the motives of Malaysian listed companies
for engaging in earnings smoothing by reporting goodwill impairment losses. By
undertaking different approaches in analysing accounting choices related to
goodwill impairment, this thesis demonstrates that a wider picture in
understanding accounting choices related to goodwill impairment exercised by
Malaysian listed companies can be provided. Specifically, the disclosure study
discovers characteristics of goodwill that are most likely to be impaired, such as
goodwill that arose from an apparent overpayment made at the time of
acquisition (see Section 7.3.2), or goodwill that has been overdue (in the case of
companies that delayed reporting goodwill impairment losses - see Section
7.3.1). In addition, the measurement study reveals when companies would impair
these types of goodwill (e.g. when there is larger pre-write-off earnings
surprise).
In summary, three conclusions are reached from the empirical studies related to
goodwill impairment conducted in this thesis. Firstly, the three empirical
chapters have provided evidence of managers making accounting choices related
to goodwill impairment that conflict with companies‘ economic factors. These
choices are seen in terms of timing in reporting goodwill impairment losses on
the income statement, companies‘ motives in measuring goodwill impairment
losses, and companies‘ motives in recognising zero goodwill impairment when
their market values are lower than the book values of their net assets for three
consecutive years.
Secondly, based on the motives of companies for reporting goodwill impairment
losses derived from the measurement study, it is found that the number of

300
companies which are inferred to exercise accounting choices related to goodwill
impairment losses in Malaysia is not large. Table 10.2 groups the motives in
reporting goodwill impairment losses for the total population of companies (i.e.
1498 firm-years) which implemented FRS 3 in the first three years of the
standard taking effect. The table shows that, of the 1498 firm-years, 14% of
these firm-years (192 companies or 210 firm-years) motives for reporting
goodwill impairment losses provide evidence of managerial opportunism.
Table 10.2: Companies' motives in reporting goodwill impairment losses derived from the measurement study which examined the total
population of companies from 2006/7 to 2008/7
Motives No. of companies
No. of firm-years
1. Earnings smoothing only 85 97
2. Big bath reporting only 70 73
3. Change in CEO
a. Change in CEO only 16 19
b. Change in CEO and Earnings smoothing 10 10
c. Change in CEO and Big bath reporting behaviour
11 11
Total 192 210
Total population of firm-years analysed
1498
Percentage of accounting choices related to goodwill impairment losses
14%
Thirdly, the accounting choices related to goodwill impairment are mostly
exercised by different companies with different motives. For example, in the
measurement study (see Table 10.2), the decisions of a group of companies in
reporting goodwill impairment losses are driven by earnings smoothing, while
another group of companies are influenced by an incidence of a change in CEO.
This explanation is supported by the non-significant result of Pearson product-
moment correlation between change in CEO and earnings smoothing variable,
and the change in CEO and big bath reporting variable (result not reported). In
only a few cases were the same companies found to have more than one motive
for reporting goodwill impairment losses (e.g. 10 companies which have two
motives - change in CEO and earnings smoothing shown in Table 10.2).

301
10.4 Research contributions
This section discusses the contributions of this thesis in relation to the research
objectives and extant literature. The discussion is structured into four main
areas, i.e. theoretical contributions (see Section 10.4.1), empirical contributions
(see Section 10.4.2), contribution to research design (see Section 10.4.3), and its
policy implications (see Section 10.4.4).
10.4.1 Contribution to theories of accounting choice (Objective 1)
The review of literature in Chapter 2 (see Section 2.2.2) has highlighted a
number of studies analysing goodwill impairment after the impairment-only
approach in accounting for goodwill. The impairment-only approach was required
by the IASB and the US FASB as part of their joint initiative on accounting for
business combinations (see Section 4.2). Two perspectives of accounting choice
that have been applied by these studies are the contracting perspective, and the
opportunistic behaviour perspective. The review has illustrated that the majority
of these studies focused on listed companies in developed economies, mainly in
the US (e.g. Beatty and Weber, 2006; Guler, 2007; Zang, 2008; Ramanna and
Watts, 2012) and also in Canada (i.e. Lapointe-Antunes et al., 2008) and the UK
(i.e. AbuGhazaleh et al., 2011). However, there is a lack of studies focusing on
goodwill impairment by listed companies in developing economies.
The review of literature in Chapter 2 (see Section 2.3.3) has also revealed that
listed companies in developed economies, such as the US and UK are found to
have dispersed ownership whereas listed companies in developing economies,
such as Malaysia are reported to have concentrated ownership (Leuz et al., 2003:
516-517). In listed companies with concentrated ownership, the literature review
has highlighted that the nature of agency problem might differ from those with
dispersed ownership, in the sense that there are two potential agency problems.
Firstly, there could be fewer agency problems, which arise from the separation
of ownership and management (Shleifer and Vishny, 1997: 754; Fan and Wong,

302
2002: 405). Secondly, when shareholders obtain a substantial portion of company
shares, to the point at which they obtain an effective control of the company,
the nature of the agency problem shifts (Fan and Wong, 2002: 405). Instead of a
conflict of interest between managers and shareholders, the conflict is between
controlling owners and minority shareholders (Fan and Wong, 2002: 405) (see
Section 2.3.3). The potentially different nature of the agency problem might
affect the applicability of both the contracting perspective and the opportunistic
behaviour perspective (which rely on the agency theory model of Jensen and
Meckling, 1976) in explaining the accounting choices related to goodwill
impairment by companies with concentrated ownership.
The present thesis tests the contracting perspective and the opportunistic
behaviour perspective in Malaysian listed companies with concentrated
ownership, neither of which have been explored comprehensively in prior studies
analysing goodwill impairment. In doing so, this thesis makes a theoretical
contribution by providing support for the opportunistic behaviour perspective in
explaining the measurement of goodwill impairment by Malaysian listed
companies. Next, Sections 10.4.1.1 to 10.4.1.2 discuss the results of the
contracting perspective and the opportunistic behaviour perspective
respectively.
10.4.1.1 Contracting perspective
Because of the unavailability of data on management compensation plans, the
only contracting perspective tested in this thesis is the debt hypothesis. In the
context of goodwill impairment, the debt hypothesis suggests that companies
which are close to violating their debt covenants are less likely to report goodwill
impairment losses (see Section 5.5). In this thesis, due to an inability to
investigate actual debt covenants (due to lack of data), debt ratio (leverage) has
been employed as a proxy for companies‘ closeness to the debt covenant
violations (see Section 5.5). The result shows that debt ratio is non-significant in
nearly all of the regression models in explaining both the measurement and the
recognition of goodwill impairment by Malaysian listed companies (see Sections
303
8.7 and 9.5.2). The non-significance of the variable is possibly because of the
indirect proxy employed (see Section 10.5 for the limitations of the study). Thus,
the present study could not provide evidence on the applicability of the
contracting perspective, in particular, the debt hypothesis in explaining both the
measurement and the recognition of goodwill impairment by Malaysian listed
companies.
10.4.1.2 Opportunistic behaviour perspective
The development of hypotheses in Chapter 5 (see Section 5.6) noted that four
variables have been employed in this thesis to test the opportunistic behaviour
perspective, i.e. CEO tenure, change in CEO, big bath reporting, and earnings
smoothing. In the measurement study, the last three variables are found
statistically significant in the measurement of goodwill impairment by Malaysian
listed companies (see Sections 8.8.1, 8.8.3, and 8.8.4). In the recognition study,
all the four variables are found non-significant (see Section 9.5.3). The next
paragraphs discuss the applicability of the opportunistic behaviour perspective,
based on the statistically significant results of these three variables - change in
CEO, big bath reporting, and earnings smoothing respectively.
Change in CEO attempts to capture the opportunistic behaviour of incoming CEOs
in reporting goodwill impairment losses as soon as they join their new companies
(see Section 5.6.1). To capture this behaviour, a dummy variable is created
which is equal to one when there is a change in a CEO in the previous financial
year or current financial year, and zero otherwise (see Appendix 1 of the thesis).
The argument raised by prior studies (e.g. Riedl, 2004: 832; Francis, 2008: 628;
AbuGhazaleh et al., 2011: 175) is that the newly appointed CEOs have the ability
to attribute current losses to some aspect of the preceding CEO‘s poor
management (see Section 5.6.1). This gives them the opportunity to take large
asset write-offs and goodwill impairment losses as soon as joining new
companies. Among the reporting incentives faced by the newly appointed CEOs
are to reduce the benchmark against which their future performance will be
evaluated, and to release future earnings from the losses, in the hope that this

304
might improve investors‘ perceptions of the companies‘ future performance (see
Section 5.6.1).
In the present measurement study, the statistically significant positive
association between change in CEO and the reporting of goodwill impairment
losses shows that incoming CEOs reported higher goodwill impairment losses than
the continuing CEOs (see Section 8.8.1). The conclusion reached is that, to the
extent the economic factors control for the performance of the underlying
economic values of the assets, change in CEO may capture additional incentives
for the new top managers to expedite future charges. Therefore, similar to prior
studies (i.e. Elliott and Shaw, 1988; Francis et al., 1996; Riedl, 2004), the result
for the change in CEO provides support to an opportunistic behaviour
perspective.
From an opportunistic behaviour perspective, both big bath reporting hypothesis
and earnings smoothing hypothesis related to asset write-offs shared a similar
concept, in that managers have the ability to reduce the pre-write-off earnings
because of the larger pre-write-off earnings surprise experienced by the
companies. This gives them the opportunity to report asset write-offs or goodwill
impairment losses (Riedl, 2004: 832-833; AbuGhazaleh et al., 2011: 174-175). For
the big bath hypothesis, larger pre-write-off earnings surprise refers to
negative79 pre-write-off earnings surprise (see Section 5.6.3) whereas for
earnings smoothing hypothesis, it refers to positive80 pre-write-off earnings
surprise (see Section 5.6.4). Unlike change in CEO which emphasises the
behaviour of incoming CEOs, prior studies of asset write-offs and goodwill
impairment losses testing big bath hypothesis and earnings smoothing hypothesis
do not differentiate between the behaviour of incoming CEOs and the existing
CEOs.
79 BATH is defined as a change in company‘s pre-write-off earnings from prior period to current period, divided by total assets at the end of prior period, when this change is below the median of non-zero negative values of this variable, and zero otherwise.
80 SMOOTH is defined as a change in company pre-write-off earnings from prior period to current period, divided by total assets at the end of prior period, when this change is above the median of non-zero positive values of this variable, and zero otherwise.

305
With regard to big bath hypothesis, the statistically significant negative
association between BATH and the reporting of goodwill impairment losses found
in the present measurement study shows that the stronger the downward trend
in companies‘ pre-write-off earnings, the higher the magnitude of goodwill
impairment losses reported (see Section 8.8.3). The conclusion reached for the
big bath reporting behaviour is that to the extent that change in pre-write-off
earnings (one of the variables testing the economic factors - see Section 5.4.2.3)
controls for the performance of the underlying economic values of the assets,
BATH (i.e. change in pre-write-off earnings below the median of non-zero
negative values) may capture an incremental effect relating to the big bath
reporting incentives (see Section 8.8.3). Thus, similar to Riedl (2004: 833), the
statistically significant result for BATH provides evidence of managerial
opportunism in the measurement of goodwill impairment by Malaysian listed
companies. It is noted that there is an alternative interpretation of this result
provided by prior study (e.g. AbuGhazaleh et al., 2011: 194). As discussed in
Section 5.6.3, the larger negative pre-write-off earnings surprise could also imply
that managers are taking a big bath to reveal private information about the
company‘s true value (AbuGhazaleh et al., 2011: 194). However, the tests
conducted in the present measurement study do not distinguish between these
two interpretations.
As for the earnings smoothing hypothesis, the statistically significant positive
association between SMOOTH and the reporting of goodwill impairment losses
found in the present measurement study shows that the stronger the upward
trend in the pre-write-off earnings, the higher the magnitude of goodwill
impairment losses reported (see Section 8.8.4). The conclusion reached for the
earnings smoothing is that to the extent the change in pre-write-off earnings (a
variable testing the economic factors - see Section 5.4.2.3) control for the
performance of the underlying economic values of the assets, SMOOTH (i.e.
change in pre-write-off earnings above the median of non-zero positive values)
may capture an incremental effect relating to the earnings smoothing incentives.
Hence, the statistically significant result for SMOOTH in the present study
provides support for an opportunistic behaviour perspective, indicating that

306
managers of Malaysian listed companies make use of goodwill impairment losses
as a tool to smooth earnings (see Section 8.8.4).
The result of the three variables testing the opportunistic behaviour perspective
discussed above is consistent with those of prior studies investigating US (e.g.
Francis et al., 1996: 125; Riedl, 2004: 843) and UK (i.e. AbuGhazaleh et al.,
2011: 190) listed companies. Specifically, this result revealed that even though
Malaysian listed companies have concentrated ownership, in that the five largest
outside shareholders (OUTCON) hold on average 46.816% of company shares (see
Section 8.9), an opportunistic behaviour perspective is still applicable in
explaining the measurement of goodwill impairment. With regard to these three
variables, the result suggests that Malaysian listed companies which are found to
have concentrated ownership behave similarly to listed companies in developed
economies, such as the US and UK which are documented to have dispersed
ownership. This result implies that concentrated ownership of companies does
not prevent managerial opportunism.
As discussed in Section 2.3.3, the nature of agency problem faced by listed
companies with concentrated ownership might differ from those with dispersed
ownership. That is, whether there is less agency problem arising from the
separation of ownership and management (Shleifer and Vishny, 1997: 754), or
whether there is different nature of agency conflict that have existed (i.e. a
conflict between controlling owners and minority shareholders) (Fan and Wong,
2002: 405). Focusing on goodwill impairment reported by listed companies in
Malaysia, the results of change in CEO, big bath reporting behaviour, and
earnings smoothing activities suggest that with high outside ownership
concentration, the opportunistic behaviour most probably occurs due to an
agency conflict between the controlling shareholders and the minority
shareholders.
Fan and Wong (2002: 405), in explaining the conflict between the controlling
shareholders and the minority shareholders, seem to associate the controlling
shareholders with the managers of the companies (see Section 2.3.3). However,

307
this is not the case for Malaysian listed companies. This is because on average,
managers of Malaysian listed companies hold 10.189%81 of shares (median 2.745%)
(see Appendix 8.2 in Chapter 8). Moreover, the Pearson product moment-
correlation shows a negative correlation between outside ownership
concentration and managerial ownership (see Table 8.2 in Section 8.3.2),
suggesting that as outside ownership concentration increases, managerial
ownership decreases. For the Malaysian listed companies analysed in this thesis,
the concentration of ownership is with shareholders outside of the companies82.
Therefore, in the context of the measurement study examines in this thesis, the
statistically significant results for change in CEO, big bath reporting variable, and
earnings smoothing variable contribute to theories of accounting choice by
suggesting that opportunistic behaviour occurs due to an agency conflict between
controlling shareholders (shareholders outside of the companies) and the
minority shareholders. Within this conflict, managers would possibly act on
behalf of the controlling shareholders at the expense of the minority
shareholders.
10.4.2 Empirical contributions
The empirical contributions of this research relate to providing new evidence on
factors influencing managerial decisions on the measurement of goodwill
impairment by Malaysian listed companies (see Sections 10.4.2.1 to 10.4.2.2).
81 This result is quite similar to Suphakasem (2008: 214) who reported the executive directors of
Malaysian listed companies she analysed (for financial year ended 2004) hold on average 12.43% of the companies‘ shares. However, the result is lower than Ismail (2007: 131) and Mohd Ghazali (2004: 206) who documented mean executive director ownership of Malaysian listed companies they examined of 19.4% (for financial year ended 2001) and 21.42% (from 1996-2002) respectively. The lower percentage of shares owned by the executive directors reported in this thesis compared to these prior studies may be explained by the differences in the year of analysis and the categories of companies examined. 82 Thus far, prior studies analysing ownership concentration of Malaysian listed companies (e.g.
Mohd Ghazali, 2004; Astami and Tower, 2006; Suphakasem, 2008) do not differentiate between inside concentration and outside concentration. For examples, Mohd Ghazali (2004: 117) and Suphakasem (2008: 230) define ownership concentration as shares owned by the 10 largest shareholders; Astami and Tower (2006: 7) measure the ownership concentration as the ‗percentage of the sum of all the ownership representing 10% or more of the total issued share capital‘. Thus, the result of the present study could not be compared with these prior studies.

308
10.4.2.1 Managerial ownership (Objective 3)
The present thesis extends the idea of a non-monotonic relationship between
managerial ownership and companies‘ performance, which has been popularised
by Morck et al. (1988) into the field of goodwill impairment. The idea
popularised by Morck et al. (1988) has also been extended by recent studies into
other areas such as income smoothing, earnings management, and audit
committee (see Section 5.7.1). Specifically, this thesis has analysed the non-
monotonic relationship between managerial ownership and the reporting of
goodwill impairment by Malaysian listed companies (see Section 5.7.1). Similar to
Morck et al. (1988: 298), the non-monotonic relationship is analysed by
segregating the managerial ownership into three categories: (i) MANOWN1 (0% to
less than 5%), (ii) MANOWN2 (5% to less than 25%), and (iii) MANOWN3 (25% and
more) (see Section 5.7.1).
The result of the measurement study of this thesis reveals that as the managerial
ownership increases from 0% to less than 5% (in MANOWN1), lower goodwill
impairment losses are reported (see Section 8.9.1). However, when the
managerial ownership stands at 5% or more (i.e. in MANOWN2 as well as
MANOWN3), managerial ownership has no influential role in the measurement of
goodwill impairment by Malaysian listed companies. The statistically significant
result for managerial ownership (from 0% to less than 5%) provides support to the
incentives effect, in that, as managerial ownership increases from 0% to less than
5%, the incentives of managers becomes closely aligned with those of the
shareholders. Because reporting goodwill impairment losses have an impact on
companies‘ earnings, the managers might report lower goodwill impairment
losses in order to portray companies‘ operating results in the most favourable
manner to the shareholders (see Section 8.9.1 for detailed discussion of this
finding).
The result discussed above makes an empirical contribution by providing new
evidence that in Malaysian listed companies where executive directors
collectively hold a small portion of shares (below 5%), the decisions to report

309
goodwill impairment is influenced, in a negative direction, by the level of shares
owned. This result also highlights the need to incorporates managerial ownership
(using a non-monotonic approach - see Section 5.7.1) in order to provide a more
comprehensive model of accounting choices related to goodwill impairment.
10.4.2.2 Companies’ pre-write-off earnings (Objective 3)
This thesis has also added to the literature of accounting choices related to
goodwill impairment with regard to the definitions of companies‘ pre-write-off
earnings. Previous studies of asset write-off and goodwill impairment have either
employed the earnings of companies at one specific point in time (e.g. prior year
earnings in AbuGhazaleh et al., 2011: 170, see Section 8.6.2.1), or employed a
change in pre-write-off earnings from prior year to current year (e.g. Riedl,
2004: 829; Guler, 2007: 21 and 23, see Section 8.6.2.3). Instead of selecting one
of these earnings, this thesis has employed both measures of earnings and tested
them in separate random-effects tobit regression models.
By testing two different measures of earnings (i.e. earnings at one specific point
in time, and change in pre-write-off earnings from prior year to current year),
the measurement study of this thesis has improved on the previous studies (e.g.
Riedl, 2004, and AbuGhazaleh et al., 2011). Hence, the measurement study has
made an empirical contribution in terms of presenting new evidence on the
relationship between companies‘ pre-write-off earnings and the reporting of
goodwill impairment losses. The study has shown that companies are behaving
differently with regard to goodwill impairment losses reported depending on
their level of pre-write-off earnings (see Section 8.12.1). As current year pre-
write-off earnings increase, lower goodwill impairment losses are reported.
However, as the gap between the current year pre-write-off earnings and the
prior year pre-write-off earnings is large83, higher goodwill impairment losses are
83 Large refers to BATH and SMOOTH. BATH is defined as change in pre-write-off earnings from prior year to current year, divided by total assets at the end of prior year, when this change is below the median of non-zero negative values of this variable, and zero otherwise. SMOOTH is defined as a change in pre-write-off earnings from prior year to current year, divided by total assets at the end of prior year, when this change is above the median of non-zero positive values of this variable, and zero otherwise.
310
reported. This finding corroborates the finding of McNichols and Wilson (1988: 4)
who found that companies with extreme earnings (either unusually high or low84)
chose income-decreasing accounting choice (in their case the discretionary
component of the provision for bad-debts) (see Section 8.12.1).
10.4.3 Contributions to research design
Contributions to research design are discussed according to two aspects: a self-
constructed disclosure framework (see Section 10.4.3.1), and the design of a
research setting which aims to capture evidence of a recognition choice related
to reporting zero goodwill impairment (see Section 10.4.3.2).
10.4.3.1 A self-constructed disclosure framework (Objective 2)
The disclosure study of this thesis (Chapter 7) has contributed to the research
design by developing a disclosure framework (see Figure 6.2 in Section 6.5.2.2).
Using the disclosure framework, the disclosure study makes an empirical
contribution by identifying types of accounting choice related to goodwill
impairment and providing evidence on the degree of discretion managers of
Malaysian listed companies have in reporting goodwill impairment (see Section
7.4). By exploring (via annual reports) the types of accounting choice, this
research has indirectly85 responded to the suggestion offered by Fields et al.
(2001: 290) for researchers of accounting choice studies ‗to return to basics and
use our expertise as accountants to measure multi-dimensional accounting choice
directly via the financial statements‘.
Future researchers could make use of the self-constructed disclosure framework
to interpret their statistical findings related to goodwill impairment, which this
thesis has attempted to do (see Section 8.12.2). In addition, future researchers
84 One of the definitions of extreme earnings provided by McNichols and Wilson (1988: 13) is the comparison of the current year with prior year earnings which is deflated by total assets.
85 It is indirect because Fields et al. (2001: 290) were discussing about the issue of multiple method choice.

311
could identify types of accounting choice related to goodwill impairment through
the disclosure framework.
10.4.3.2 Research setting designed to capture evidence of a recognition choice related to reporting zero goodwill impairment (Objective 4)
The recognition study of this thesis (in Chapter 9) has contributed to the research
design by constructing a research setting which aims to capture evidence of a
recognition choice related to reporting zero goodwill impairment exercised by
Malaysian listed companies in a situation where companies‘ market values are
lower than the book values of the net assets for three consecutive years (see
Section 9.2.1).
Testing of this setting has allowed the study to makes a contribution by
identifying the motives of companies in recognising zero goodwill impairment,
which has received limited attention by prior studies (see Section 2.2.2).
Specifically, the recognition study has provided empirical evidence on the
influence of economic factors (i.e. higher current year pre-write-off earnings, or
higher change in pre-write-off earnings from prior year to current year, and
lower change in operating cash flows from prior year to current year) on the
recognition choice related to reporting zero goodwill impairment (see Section
9.6).
The recognition study has also provided new empirical evidence on the influence
of outside ownership concentration on the recognition choice related to
reporting zero goodwill impairment. The result shows that the higher the outside
ownership concentrated, the more likely it is for the companies to exercise the
recognition choice related to reporting zero goodwill impairment.
Information concerning the motives of companies for recognising zero goodwill
impairment is useful to the relevant regulatory bodies overseeing financial
reporting standards on goodwill in Malaysia, such as MASB, Malaysian Securities
Commission, and auditors. This information will assist these bodies to take note

312
of companies‘ impairment tests of goodwill in order to identify whether these
companies have left their goodwill on the balance sheet for a long time without
any impairment losses reported.
10.4.4 Policy implications
One of the key findings of this research is that companies‘ disclosure related to
discount rates and cash-generating-units (CGUs) is not encouraging. As noted in
Section 8.2.2.2, more than half of the firm-years examined do not disclose
information concerning CGUs and discount rates. IASB, in its Basis for Conclusion
(IASB, 2006: IAS 36, Basis for Conclusions, BC198) (see Section 4.5), relied on
companies‘ disclosure as a way of improving the reliability of the impairment
test of goodwill. In the case of Malaysian listed companies, this thesis has
provided empirical evidence that the actions of the IASB, and thus the MASB, in
relying on disclosure have not yet been successful. Issues regarding companies‘
disclosure on CGUs and discount rates are also documented by the Financial
Reporting Council (FRC) in the UK. The FRC in the UK (2008: 4) reports that even
though all of the 32 UK listed companies which they have analysed disclosed
information regarding an impairment testing of goodwill, many of these
disclosures are generic in nature and ‗inappropriately aggregated‘. They consider
such disclosures as providing little information to users of financial statement in
understanding factors influencing valuation of goodwill, and in evaluating the
estimation made by the management concerning the impairment test (FRC, 2008:
4).
Subsequent to the first phase of the implementation of IFRS 3 and IAS 36, which
is the focus of this thesis, IASB has (through an annual improvement project)
revised IAS 36 twice, in relation to an impairment test of goodwill. Firstly, in
phase two of the IAS 36, issued on 22 May 2008 (see Figure 4.1 in Section 4.2),
IASB revised the disclosure requirement for the recoverable amount of the CGUs,
computed based on fair values less costs to sell (IASB, 2008: IAS 36,
Improvements to IFRSs). Secondly, in the annual improvements for IAS 36, issued
on 16 April 2009, the IASB amended the requirement for a CGU in accordance

313
with the definition of operating segment stated in paragraph 5 of IFRS 8 (IASB,
2009: IAS 36, Improvements to IFRSs). The conclusion for this thesis is that unless
these improvements help improve disclosure related to goodwill impairment by
companies in the near future, IASB and MASB will be unable to police the
measurement rule via disclosure. This thesis suggests that, rather than relying on
companies‘ disclosure as a way of improving the reliability of an impairment test
of goodwill, it would be better for the IASB to implement a strong control
mechanism (such as the subsequent cash flow test or the two-step impairment
test as discussed in Section 4.5 ) within the standard itself.
10.5 Limitations of the study
This research project is subjected to at least two limitations.
Firstly, some variables had to be manually collected directly from annual
reports, as these were not available in any database. These include variables
testing discretion such as CGUs and discount rates, CEO tenure, change in CEO,
managerial ownership, and outside ownership concentration. By relying on
annual reports of companies, the data was constrained, not only by the
availability of the annual reports, but also by the information disclosed in the
annual reports themselves. This constraint is quite severe for variables testing
the discretion related to CGUs and discount rates where more than 50% of the
companies examined did not disclose the number of CGUs and discount rates
employed in the estimation of the recoverable amount of value-in-use containing
goodwill (see Appendix 8.2 – e.g. DISCRATE). The missing value analysis
performed was an attempt to lessen this limitation and to provide evidence that
the missing values of these variables occurred at random (see Section 8.2.2.2).
Secondly, data unavailability has hindered the researcher in conducting a
thorough test of the contracting perspective. The bonus plan hypothesis is not
tested in this research due to the lack of publicly available data on management
compensation plans. In addition, testing of the debt hypothesis is limited to the
use of leverage (DEBTRATIO) as a proxy for companies‘ closeness to their debt

314
covenant violations. Prior studies argued that leverage does not fully capture the
default risk of debt (Lys, 1984; Fields et al., 2001; Dichev and Skinner, 2002) (see
Section 2.3.1.2). Therefore, the test of the contracting perspective is
inconclusive. That is, whether the debt hypothesis is not applicable for
explaining the measurement of goodwill impairment by Malaysian listed
companies, or whether the use of the noisy proxy variable (i.e. debt ratio)
resulted in a low power test of the contracting perspective of accounting choice.
10.6 Suggestions for future research
A number of suggestions for future research emerge from this thesis.
Firstly, this study can be extended to other countries in developing economies, in
particular, East Asian developing countries which are found to have concentrated
ownership. This will improve an understanding of accounting choices related to
goodwill impairment across these countries.
Secondly, this thesis has examined abilities and motives of companies for
reporting goodwill impairment. The abilities are examined through the available
discretion, i.e. CGUs and discount rates. The motives are captured through
variables testing the contracting perspective and the opportunistic behaviour
perspective. However, this thesis has not examined factors which may act as a
monitoring mechanism to reduce the managerial opportunism. These include
strong governance mechanisms, such as an independent board and the number of
meetings held by the board of directors during the financial year. These factors
represent another potentially interesting area for future research.
Thirdly, three aspects of the implementation decisions related to goodwill
impairment have been examined in this thesis, i.e., disclosure, measurement,
and recognition of goodwill impairment. To get a more comprehensive view of
the implementation decisions, future research is suggested to explore the
presentation choice related to goodwill impairment loss. Specifically, future
work could analyse managers‘ presentation of goodwill impairment loss within

315
the financial statement, i.e., whether the manager disaggregate goodwill
impairment loss as a separate line item on the face of the income statement, or
aggregate the loss into another line item identified only via Notes to the
Financial Statement. Under both presentation choices, goodwill impairment loss
is deducted from the earnings of companies.
Finally, this study could not thoroughly test the contracting perspective of
accounting choice because of the lack of data for the management compensation
plan. To gather this data and hence test the contracting perspective extensively,
it is recommended that future studies conduct a survey questionnaire, to ask
whether such management compensation plans are being applied by Malaysian
listed companies and the parameters employed for these plans.

316
Appendix 1 of the thesis: Summary of Hypotheses Formulated and Detailed Definitions of the Variables
Employed
Note for Appendix 1:
This appendix presents a summary of all the hypotheses developed in Chapter 5.
In this thesis, two types of motive for companies to report goodwill impairment
are explored - companies‘ motives for reporting goodwill impairment losses, and
companies‘ motives for reporting zero goodwill impairment. For this reason, the
predicted sign, shown in Appendix 1 has two columns. A column labelled GWIL(IL)
predicts companies‘ motives for reporting goodwill impairment losses; a column
labelled GWIL(0) predicts companies‘ motives for reporting zero goodwill
impairment.
Further, in Appendix 1, it is observed that there are hypotheses with a predicted
sign which is labelled as ‗?‘. The sign ‗?‘ denotes unspecified predicted sign,
which occur either because of the inconclusive empirical evidences provided by
prior studies, or no prior studies testing the variable. As an example, leverage
(DEBTRATIO in H7) has a predicted sign labelled as ‗?‘. This is because of the
mixed results documented by prior studies concerning the association between
leverage and companies‘ decisions in reporting goodwill impairment losses. In
addition, DISCRATE, which refers to the percentage of discount rates disclosed by
companies in their annual reported (see H15A) has a predicted sign labelled as ‗?‘.
Nonetheless in this case, it is because there is no published works testing the
relationship between discount rates and companies‘ decisions in reporting
goodwill impairment losses. Detailed discussion of the predicted sign for each of
the hypotheses is carried out in Sections 5.4 to 5.9.

317
Appendix 1 of the thesis: Summary of hypotheses formulated and the detailed definitions of the variables employed
Variables Potential factors
Predicted sign (Alternative hypothesis)
Definition of the variables Data sources Main studies refer (Notes)
GWIL(IL) GWIL(0)
GWIL - Dependent variable for the Measurement study (see Table 5.1 in Section 5.2)
The magnitude of goodwill impairment losses, divided by prior year total assets (including goodwill), and zero otherwise reported on the income statement.
Datastream
Goodwill impairment losses – WC18225
Total assets - WC02999
AbuGhazaleh et al. (2011: 178);
Lapointe-Antunes et al. (2008: 43).
GWIL(0,1) - Dependent variable for the Recognition study (see Table 5.1 in Section 5.2)
A dichotomous variable, equal to one when companies are considered as exercising a recognition choice related to reporting zero goodwill impairment, and zero otherwise (see Table 5.1).

318
Appendix 1 of the thesis (continue): Summary of hypotheses formulated and the detailed definitions of the variables employed
Variables Potential factors
Predicted sign (Alternative hypothesis)
Definition of the variables Data sources Main studies refer (Notes)
GWIL(IL) GWIL(0)
H1 ∆SALES - Change in sales (see Section 5.4.1)
Economic factors
- + Change in sales for company i from prior period (t-1) to current period (t), divided by total assets at the end of prior period (t-1).
= (SALESt - SALESt-1) TOTAL ASSETSt-1
For the measurement study, the variable is transformed into Log(∆SALES+1) (see Sections 5.4.1 and 8.2.2.1).
Datastream
Net sales - WC01001
Total assets - WC02999
AbuGhazaleh et al. (2011: 178)
H2A EARNINGSPrior - Prior year earnings (see Section 5.4.2.1)
Economic factors
- + Prior year earnings divided by total assets at the end of prior period (t-1 ).
= EARNINGSt-1 TOTAL ASSETSt-1
Datastream
Earnings = Net income before extraordinary items or preferred dividends - WC01551
Total assets - WC02999
AbuGhazaleh et al. (2011: 178).
- Sensitivity analysis is carried out by replacing
EARNINGSPrior with
EARNINGSPreGWILpri
or (see Section 8.5.2.3).

319
Appendix 1 of the thesis (continue): Summary of hypotheses formulated and the detailed definitions of the variables employed
Variables Potential factors
Predicted sign (Alternative hypothesis)
Definition of the variables Data sources Main studies refer (Notes) GWIL(IL) GWIL(0)
H2B EARNINGSPreGWILCur
rent
- Current year pre-write-off earnings (see Section 5.4.2.2)
Economic factors
- + Current year pre-write-off earnings divided by total assets at the end of prior period (t-1).
=EARNINGSt + GWIL(IL) TOTAL ASSETSt-1
For the recognition study, the variable is transformed into Log10(0.4- EARNINGSPreGWILCurrent) (see Section 9.2.2).
Datastream
Earnings = Net income before extraordinary items or preferred dividends - WC01551
Goodwill impairment losses – WC18225
Total assets - WC02999
-
H3 ∆EARNINGSpreGWI
L - Change in pre-write-off earnings (see Section 5.4.2.3)
Economic factors
- + Change in company i‘s pre-write-off earnings from prior period (t-1) to current period (t), divided by total assets at the end of prior period (t-1).
= [(EARNINGSt + GWIL(IL)t)- (EARNINGSt-1 + GWIL(IL) t-1)]/TOTAL ASSETSt-1
Datastream
Earnings = Net income before extraordinary items or preferred dividends - WC01551
Goodwill impairment losses – WC18225
Total assets - WC02999
Riedl (2004: 829)
H4 ∆OCF - Change in operating cash flows (see Section 5.4.3)
Economic factors
- + Change in operating cash flows for company i from prior period (t-1) to current period (t), divided by total assets at the end of prior period (t-1)
= (OCFt - OCFt-1) TOTAL ASSETSt-1
Datastream
Operating cash flows -
WC04860 Total assets - WC02999
AbuGhazaleh et al. (2011: 178); Riedl (2004: 829)

320
Appendix 1 of the thesis (continue): Summary of hypotheses formulated and the detailed definitions of the variables employed
Variables Potential factors
Predicted sign (Alternative hypothesis)
Definition of the variables Data sources Main studies refer (Notes)
GWIL(IL) GWIL(0)
H5 BTM
- Book-to-market ratio (see Section 5.4.4)
Economic factors
+ - Company i‘s book value of equity divided by market value of equity at the end of current period (t).
Datastream
Book value of equity = Total shareholders‘ equity (WC03995) less Preferred stock (WC03451)
Market value of equity – WC08001.
AbuGhazaleh et al. (2011: 178)
H6 GWB - Relative size of goodwill balance (see Section 5.4.5)
Economic factors
+ - Company i‘s opening carrying value of goodwill in the current year divided by total assets at the end of prior period (t-1).
= Opening goodwill balancet/TOTAL ASSETS t-1
Datastream
Goodwill balance – WC18280
Total assets - WC02999
AbuGhazaleh et al. (2011: 178)
H7 DEBTRATIO - Leverage (see Section 5.5)
Contracting perspective
? ? Company i‘s total debts at the end of prior year (t-1), divided by total assets at the end of prior year (t-1).
= TOTAL DEBTSt-1 TOTAL ASSETSt-1
Datastream
Total debts - WC03255
Total assets - WC02999
AbuGhazaleh et al. (2011: 178);
Zang (2008: 48).

321
Appendix 1 of the thesis (continue): Summary of hypotheses formulated and the detailed definitions of the variables employed
Variables Potential factors
Predicted sign (Alternative hypothesis)
Definition of the variables Data sources Main studies refer (Notes)
GWIL(IL) GWIL(0)
H8 ∆CEOCurrent/pri
or - Change in CEO in the previous year or the current year (see Section 5.6.1)
Opportunistic behaviour perspective
+ - Change in CEO is said to occur when a company experiences a change in CEO in the previous financial year (t-1) or the current financial year (t). It is measured as a dichotomous variable, equal to one if company i experienced the CEO change, and zero otherwise.
Annual reports AbuGhazaleh et al. (2011: 178) - Sensitivity analysis is conducted for an alternative
definition of ∆CEO (see Section 8.5.2.1).
H9 CEOTENURE
- CEO tenure (see Section 5.6.2)
Opportunistic behaviour perspective
- + Number of years that the CEO has held the position.
Annual reports Beatty and Weber (2006: 274);
Ramanna and Watts (2012).
H10 BATH
- Big bath reporting (see Section 5.6.3)
Opportunistic behaviour perspective
- ? Change in company i‘s pre-write-off earnings from prior period (t -1) to current period (t), divided by total assets at the end of prior period (t -1), when this change is below the median of non-zero negative values of this variable, and zero otherwise.
Datastream
Earnings = Net income before extraordinary items or preferred dividends - WC01551
Goodwill impairment loss - WC18225
Total assets - WC02999
AbuGhazaleh et al. (2011: 178);
Riedl (2004: 829)

322
Appendix 1 of the thesis (continue): Summary of hypotheses formulated and the detailed definitions of the variables employed
Variables Potential factors
Predicted sign (Alternative hypothesis)
Definition of the variables Data sources Main studies refer (Notes)
GWIL(IL) GWIL(0)
H11 SMOOTH
- Earnings smoothing (see Section 5.6.4)
Opportunistic behaviour perspective
+ ? Change in company i‘s pre-write-off earnings from prior period (t -1) to current period (t), divided by total assets at the end of prior period (t -1), when this change is above the median of non-zero positive values of this variable, and zero otherwise.
Datastream
Earnings = Net income before extraordinary items or preferred dividends - WC01551
GWIL(IL) - WC18225
Total assets - WC02999
Riedl (2004: 829); AbuGhazaleh et al. (2011: 178);
H12A MANOWNLinear - Managerial ownership (see Section 5.7.1)
Ownership structures - Linear relationship
? ? Number of ordinary shares held directly by executive directors, divided by total number of issued and paid up ordinary shares.
Annual report - Ismail and Weetman (2007: 521).
- Sensitivity analysis is conducted for
MANOWNLinear (see Section 8.5.2.2).

323
Appendix 1 of the thesis (continue): Summary of hypotheses formulated and the detailed definitions of the variables employed
Variables Potential factors
Predicted sign (Alternative hypothesis)
Definition of the variables Data sources
Main studies refer (Notes)
GWIL(IL) GWIL(0)
H12B MANOWNNon-
monotonic - Managerial ownership (see Section 5.7.1)
Ownership structures - Non-monotonic relationship
? ? Following MANOWNLinear from
H12A , the non-monotonic relationship is measured as follows:
MANOWN1
board ownership if board ownership < 0.05
0.05 if board ownership ≥ 0.05
MANOWN2
0 if board ownership < 0.05
board ownership minus 0.05 if 0.05≤board ownership< 0.25
0.20 if board ownership ≥ 0.25
MANOWN3
0 if board ownership < 0.25
board ownership minus 0.25 if board ownership ≥ 0.25
- Morck et al. (1988: 298); McConnell and Servaes (1990: 607); adapted by Chau and Leung (2006: 7); Chau and Gray (2010: 98). - Sensitivity analysis is conducted for
MANOWNNon-monotonic (see Section 8.5.2.2).

324
Appendix 1 of the thesis (continue): Summary of hypotheses formulated and the detailed definitions of the variables employed
Variables Potential factors
Predicted sign (Alternative hypothesis)
Definition of the variables Data sources
Main studies refer (Notes)
GWIL(IL) GWIL(0)
H13 OUTCON - Outside ownership concentration (see Section 5.7.2)
Ownership structures
? ? Number of ordinary shares held by outsiders86 with the five largest claims, divided by the total number of issued and paid up ordinary shares.
Annual report
Niehaus (1989: 277)
H14A CGU01 - Cash-generating units containing goodwill (see Section 5.8.1)
Discretion available in performing an impairment test of goodwill
? ? A dichotomous variable, equal to one if company i has more than one CGUs at the end of the current year (t), and zero otherwise.
Annual reports
AbuGhazaleh et al. (2011: 178)
H14B CGUcontinuous - Cash-generating units containing goodwill (see Section 5.8.1)
Discretion available in performing an impairment test of goodwill
? ? The actual number of CGUs containing goodwill disclosed in the annual reports by Malaysian listed companies at the end of the current year (t).
Annual reports
In a regression model that is separate from
CGU01 (as in H14A)
H15A DISCRATE - Discount rates (% disclosed) (see Section 5.8.2.1)
Discretion available in performing an impairment test of goodwill
? ? The percentage of discount rate employed by companies in estimating the recoverable amount of CGUs containing goodwill which is disclosed in the annual reports at the end of the current year (t).
Annual reports
86 Following Haniffa and Hudaib (2006: 1042), outside shareholders refer to institutions, blockholders, and other individuals outside the company (see Section 5.7.2
for detail).

325
Appendix 1 of the thesis (continue): Summary of hypotheses formulated and the detailed definitions of the variables employed
Variables Potential factors
Predicted sign (Alternative hypothesis)
Definition of the variables Data sources Main studies refer (Notes)
GWIL(IL) GWIL(0)
H15B DISCMULTIPLE - Application of a single or multiple discount rates (see Section 5.8.2.2)
Discretion available in performing an impairment test of goodwill
? ? A dichotomous variable, equal to one if a company applies multiple discount rates, zero if the company applies a single discount rate at the end of the current year (t).
Annual reports
H15C DISCRATEDisclosed/
Not - Discount rates -Disclosed/Not disclosed (see Section 5.8.2.3)
Discretion available in performing an impairment test of goodwill
? ? A dichotomous variable, equal to one if a company do not disclose the discount rate, and zero otherwise.
Annual reports
H16 SIZE – Size of company (see Section 5.9.1)
Control variables
? ? Natural logarithm of total assets at the end of prior period (t-1).
= Ln(TOTAL ASSETSt-1)
Datastream
Total assets - WC02999
AbuGhazaleh et al. (2011: 179); Lapointe-Antunes et al. (2008: 44).

326
Appendix 1 of the thesis (continue): Summary of hypotheses formulated and the detailed definitions of the variables employed
Variables Potential factors
Predicted sign (Alternative hypothesis)
Definition of the variables Data sources Main studies refer (Notes)
GWIL(IL) GWIL(0)
H17 INDUSTRYG5 - Industry
dummy (see Section 5.9.2)
Control variables
? ? A dummy variable across 10 industry categories based on Datastream Industrial classification level two.
- Because of the lack of data in five industries, the industry group is reduced to five (see Section 8.2.2.3).
- The baseline for the INDUSTRYG5 is Industrial and basic materials.
Datastream
Industry classification - INDM2
AbuGhazaleh et al. (2011: 195); Zang (2008: 48).
H18 YEND
- Financial-year-end dummy [see Section 5.9.3]
Control variables
? ? A dummy variable across three financial year-end categories (i.e. 2006, 2007, and 2008) based on Datastream classification. - The baseline for the YEND is financial year-ended 2006.
Datastream
Fiscal year - WC05350
AbuGhazaleh et al. (2011: 179)
H19 ADD - Additions to goodwill (see Section 5.9.4)
Control variables
+ - A dichotomous variable, equal to one if a company has additions to its goodwill during the financial year, and zero if there is no addition.
Datastream
Goodwill balance - WC18280
AbuGhazaleh et al. (2011: 179)

327
References
Abdullah, S. N., Junaidah, H. A., & Ishak, R. (2004). Accounting treatment for goodwill among Bursa Malaysia main board companies: The case of MAS 6. Malaysian Accounting Review, 3(1), 103-122.
AbuGhazaleh, N. M, Al-Hares, O. M, & Roberts, C. (2011). Accounting discretion in goodwill impairments: UK evidence. Journal of International Financial Management & Accounting, 22 (3), 165-204.
Ahmed, A.S., & Guler, L. (2007). Evidence on the effects of SFAS 142 on the reliability of goodwill write-offs. Working paper retrieved on August 30, 2009 from http://papers.ssrn.com/sol3/papers.cfm?abstract_id=989056
Alciatore, M., Dee, C. C., Easton, P., & Spear, N. (1998). Asset write-downs: A decade of research. Journal of Accounting Literature, 17, 1-39.
Amemiya, T. (1973). Regression analysis when the dependent variable is truncated normal. Econometrica, 41(6), 997-1016.
Amemiya, T. (1984). Tobit models: A survey. Journal of Econometrics, 24, 3-61.
Astami, E.W., & Tower, G. (2006). Accounting-policy choice and firm characteristics in the Asia pacific region: An international empirical test of costly contracting theory. The International Journal of Accounting, 41, 1-21.
Astral Supreme Berhad. (2008). Astral Supreme Berhad, Annual report 2008. Retrieved on October 5, 2011 from http://www.bursamalaysia.com/market/listed-companies/company-announcements/#/?category=AR&company=7070
Azmi, C.A. (2006). The relationship between taxation and financial reporting, with special references to the case of Malaysia. Unpublished PhD thesis. University of Reading, United Kingdom.
A & M Realty Berhad. (2006). A & M Realty Berhad, Annual report 2006. Retrieved from http://www.bursamalaysia.com/market/listed-companies/
Ball, R., Robin, A., & Wu, J.S. (2003). Incentives versus standards: Properties of accounting income in four East Asian countries. Journal of Accounting and Economics, 36, 235-270.
Baltagi, B. H. (2008). Limited dependent variables. In Econometrics (pp. 323-347). Fourth edition. New York: Springer.
Baum, C. F. (2006). Panel-data models. In An introduction to modern econometrics using Stata (pp. 220-246). Texas: A Stata Press Publication.
Beattie, V., Brown, S., Ewers, D., John, B., Manson, S., Thomas, D., & Turner, M. (1994). Extraordinary items and income smoothing: A positive accounting approach. Journal of Business Finance & Accounting, 21(6), 791-11.

328
Beatty, A., & Weber, J. (2006). Accounting discretion in fair value estimates: An examination of SFAS 142 goodwill impairments. Journal of Accounting Research, 44(2), 257-288.
Bens, D. A. (2006). Discussion of Accounting Discretion in Fair Value Estimates: An Examination of SFAS 142 Goodwill Impairments. Journal of Accounting Research, 44(2), 289-296.
Burrell, G., & Morgan, G. (1979). Sociological paradigms and organisational analysis. London: Heinemann Educational Boos Ltd.
Bursa Malaysia (2009). Delisting of THG from the official list of Bursa Malaysia Securities Berhad. Retrieved on November 5, 2011 from http://www.thgroup.com.my/News/070509.html
Bursa Malaysia (Undated). Enforcement overview. Retrieved on April 17, 2011 from http://www.bursamalaysia.com/website/bm/regulation/enforcement/overview.html
Cameron, C. A., & Trivedi, P. K. (2009). Microeconometrics using stata. College station, Texas: A Stata Press Publication.
Carlin T, Finch N. & Khairi K.F. ( 2010a). Singaporean Audit Quality and the Complexity of FRS 36 Disclosures Requirements. International Review of Business Research Papers, 6(2), 81-94.
Carlin T., Finch N. & Tran D. M. (2010b). IFRS Compliance in the Year of the Pig: Hong Kong Impairment Testing. Proceedings of the 6th Asia Pacific Interdisciplinary Research in Accounting Conference APIRA 2010, University of Sydney, Australia, 13th July 2010.
Carlin, T. M., & Finch, N. (2009). Discount rates in disarray: Evidence on flawed goodwill impairment testing. Australian Accounting Review, 51(19)(4), 326-336.
Carlin, T., Finch, N., & Laili, N.H. (2009). Goodwill accounting in Malaysia and the transition to IFRS - A compliance assessment of large first year adopters. Journal of Financial Reporting & Accounting, 7(1), 75-104.
Carlin, T.M., & Finch, N. (2011). Goodwill impairment testing under IFRS - A false impossible shore? Pacific Accounting Review, 23(3), 368-392. DOI: 10.1108/01140581111185544.
Carlson, S. J., & Bathala, C. T. (1997). Ownership differences and firms‘ income smoothing behaviour. Journal of Business Finance & Accounting, 24(2), 179-196.
Carter, W. K. (1981). A benefits approach to certain accounting policy choices. The Accounting Review, LVI(1), 108-114.
Cary, N. C. (1995). Logistic regression. Using the SAS system. Version 6. North Caroline, USA: SAS Institute Inc.

329
Chau, G., & Gray, S. J. (2010). Family ownership, board independence and voluntary disclosure: Evidence from Hong Kong. Journal of International Accounting, Auditing and Taxation, 19, 93-109.
Chau, G., & Leung, P. (2006). The impact of board composition and family ownership on audit committee formation: Evidence from Hong Kong. Journal of International Accounting, Auditing and Taxation, 15, 1-15.
Christie, A. A., & Zimmerman, J. L. (1994). Efficient and opportunistic choices of accounting procedures: Corporate control contests. The Accounting Review, 69 (4), 539-566.
Claessens, S., Djankov, S., & Lang, L. H. P. (2000). The separation of ownership and control in East Asian corporations. Journal of Financial Economics, 58, 81-112.
DeAngelo, L. E. (1988). Managerial competition, information costs, and corporate governance. The use of accounting performance measures in proxy contests. Journal of Accounting and Economics, 10, 3-36.
Deegan, C., & Unerman, J. (2006). Financial accounting theory. European edition. Berkshire: McGraw-Hill Education.
DeFond, M. L., & Park, C. W. (1997). Smoothing income in anticipation of future earnings. Journal of Accounting and Economics, 23, 115-139.
DeFond, M.L., & Jiambalvo, J. (1994). Debt covenant violation and manipulation of accruals. Journal of Accounting and Economics, 17, 145-176.
Dhaliwal, D. S., Salamon, G. L., & Smith, E. D. (1982). The effect of owner versus management control on the choice of accounting methods. Journal of Accounting and Economics, 4, 41-53.
Dhaliwal, D., & Wang, S-W. (1992). The effect of book income adjustment in the 1986 alternative minimum tax on corporate financial reporting. Journal of Accounting and Economics, 15, 7-26.
Dichev, I. D., & Skinner, D. J. (2002). Large-sample evidence on the debt covenant hypothesis. Journal of Accounting Research, 40(4), 1091-1123.
Duke, J.C., & Hunt III, H.G. (1990). An empirical examination of debt covenant restrictions and accounting-related debt proxies. Journal of Accounting and Economics, 12, 45-63.
Easterby-Smith, M., Thorpe, R., & Lowe, A. (2002). Management research. An introduction. Second edition. London: SAGE Publications.
Eisenhardt, K. M. (1988). Agency- and institutional - theory explanations: The case of retail sales compensation. Academy of Management Journal, 31 (3), 488-511.
Elliott, J. A., & Shaw, W. H. (1988). Write-offs as accounting procedures to manage perceptions. Journal of Accounting Research, 26, Supplement, 91-119.

330
Ernst & Young (2007). IAS 36 Impairment testing: Practical issues. Retrieved on October 15, 2009 from http://www.ey.com/BE/en/Issues/IFRS/IFRS
Ernst & Young (2008). Impairment of fixed assets and goodwill. In International GAAP 2008. Generally Accepted Accounting Practice under International Financial Reporting Standards (pp. 1033-1108). United Kingdom: John Wiley & Sons Inc.
Ernst & Young (2010). Impairment accounting - the basics of IAS 36 Impairment of Assets. Retrieved on September 29, 2010 from http://www.ey.com/Publication/vwLUAssets/Impairment_accounting_IAS_36_GL_IFRS/$FILE/Impairment_accounting_IAS_36_GL_IFRS.pdf
Ernst & Young (2011). Impairment of fixed assets and goodwill. In International GAAP 2011. Generally Accepted Accounting Practice under International Financial Reporting Standards (pp. 1075-1166). United Kingdom: John Wiley & Sons Inc.
Fan, J. P. H., & Wong, T. J. (2002). Corporate ownership structure and the informativeness of accounting earnings in East Asia. Journal of Accounting and Economics, 33, 401-425.
Farrington, D. P., & Loeber, R. (2000). Some benefits of dichotomization in psychiatric and criminological research. Criminal Behaviour and Mental Health, 10, 100-122.
Field, A. (2005). Discovering statistics using SPSS. London: SAGE Publications.
Field, A. (2009). Discovering statistics using SPSS. Third edition. London: SAGE Publications.
Fields, T. D., Lys, T.Z. & Vincent, L. (2001). Empirical research on accounting choice. Journal of Accounting and Economics, 31, 255-307.
Francis, J. (2001). Discussion of empirical research on accounting choice. Journal of Accounting and Economics, 31, 309-319.
Francis, J. (2008). Discussion of creating a bigger bath using the deferred tax valuation allowance. Journal of Business Finance & Accounting, 35(5) & (6), 626-632.
Francis, J., Hanna, D. J., & Vincent, L. (1996). Causes and effects of discretionary asset write-offs. Journal of Accounting Research, Supplement, 34 (3), 117-134.
FRC (2008). Financial Reporting Council. Review of goodwill impairment disclosures. October 2008. Retrieved on November 5, 2008 from http://www.frc.org.uk/press/pub1744.html.
FSA (2009). Financial Services Authority. Enhancing financial reporting disclosures by UK credit institutions. Retrieved on November 1, 2011 from http://www.fsa.gov.uk/pubs/discussion/dp09_05.pdf

331
Gallery, G. (2009). Commentary. Discount rates in disarray: Evidence on flawed goodwill impairment testing. Australian Accounting Review, 51(19)(4), 337-339.
Gibson, M.S. (2003). Is corporate governance ineffective in emerging markets? Journal of Financial and Quantitative Analysis, 38(1), 232-250.
Glaum, M., & Wyrwa, S. (2009). Making acquisitions transparent. Goodwill accounting in times of crisis. Retrieved August 3, 2011 from http://download.pwc.com/ie/pubs/2011_making_acquisitions_transparent_goodwill_accounting_in_times_of_crisis.pdf
Glaum, M., Street, D., & Vogel, S. (2007). Making acquisitions transparent: An evaluation of M&A-Related IFRS disclosures by European companies in 2005. Retrieved September 9, 2008 from http://www.pwc.com/da_DK/dk/publikationer/assets/pwc-m-og-a-ifrs-survey-0307.pdf
Godfrey, J. M., & Koh, P-S. (2009). Goodwill impairment as a reflection of investment opportunities. Accounting and Finance, 49, 117-140.
Green, S. B. (1991). How many subjects does it take to do a regression analysis? Multivariate Behavioral Research, 26(3), 499-510.
Greene, W. H. (2008). Truncation, censoring, and sample selection. In Econometrics analysis (pp. 863-905). Sixth edition. New Jersey: Pearson.
Gujarati, D. N. (1995). Regression on dummy variables. In Basic econometrics (pp. 499-539). Third edition. New York: McGraw-Hill Inc.
Gujarati, D. N. (2003). Panel data regression models. In Basic econometrics (pp. 636-655). Fourth edition. International edition. New York: McGraw-Hill companies, Inc.
Gujarati, D. N., & Porter, D. C. (2009). Multicollinearity: What happens if the regressors are correlated?. In Basic econometrics (pp. 320-364). Fifth edition. New York: McGraw-Hill Irwin.
Gujarati, D. N., & Sangeetha. (2007). Qualitative response regression models. In Basic econometrics (pp. 593-647). Fourth edition. New Delhi: Tata McGraw-Hill Publishing Company Limited.
Guler, L. (2007). Goodwill impairment charges under SFAS 142: Role of executives’ incentives and corporate governance. Unpublished dissertation in partial fulfillment of the requirements for the degree of Doctor of Philosophy. Texas A & M University, U.S.A.
Hall, S.C. (1993). Determinants of goodwill amortization period. Journal of Business Finance & Accounting, 20(4), 613-621.
Hamberg, M., Paanen, M., & Noval, J. (2010). The adoption of IFRS 3: The effects of managerial discretion and stock market reactions. European Accounting Review, iFirst Article, 1-26.
Haniffa, R. M. (1999). Culture, Corporate Governance and Disclosure in

332
Malaysian Corporations. Unpublished PhD thesis. University of Exeter, United Kingdom.
Haniffa, R., & Hudaib, M. (2006). Corporate governance structure and performance of Malaysian listed companies. Journal of Business Finance & Accounting, 33(7) & (8), 1034-1062.
Hayn, C., & Hughes, P. J. (2006). Leading indicators of goodwill impairment. Journal of Accounting, Auditing & Finance, 21(3), 223-265.
Healy, P. (1996). Discussion of a market-based evaluation of discretionary accrual models. Journal of Accounting Research, 34, 107-115.
Healy, P. M., & Wahlen, J. M. (1999). A review of earnings management literature and its implications for standard setting. Accounting Horizons, 13, 365-383.
Hilton, A. S., & O‘Brien, P. (2009). Inco Ltd.: Market value, fair value, and management discretion. Journal of Accounting Research, 47(1), 179-211.
Holthausen, R. W. (1990). Accounting method choice. Opportunistic behavior, efficient contracting, and information perspectives. Journal of Accounting and Economics, 12, 207-218.
Honore, B., Vella, F., & Verbeek, M. (2008). Attrition, selection bias and censored regression. In The econometrics of panel data (pp. 385-418). Third edition. Germany: Springer-Verlag Berlin Heidelberg.
IASB (2002). Exposure Draft of Revised IAS 36. Exposure draft of proposed amendments to IAS 36, Impairment of Assets. International Accounting Standards Board (IASB), London: IASCF Publications Department.
IASB (2006a). Preface to International Financial Reporting Standards. In International Financial Reporting Standards as at 1 January 2006 (pp. 23-28). International Accounting Standards Board (IASB), London: IASCF Publications Department.
IASB (2006b). IAS 36 Impairment of Assets. In International Financial Reporting Standards as at 1 January 2006 (pp. 1449-1595). International Accounting Standards Board (IASB), London: IASCF Publications Department.
IASB (2006c). IFRS 3 Business Combinations. In International Financial Reporting Standards as at 1 January 2006 (pp. 273-394). International Accounting Standards Board (IASB), London: IASCF Publications Department.
IASB (2006d). Framework for the Preparation and Presentation of Financial Statements. In International Financial Reporting Standards as at 1 January 2006 (pp. 29-54). International Accounting Standards Board (IASB), London: IASCF Publications Department.
IASB (2006e). International Financial Reporting Standards (IFRSs) 2006. Including International Standards (IASs) and interpretations as at 1 January 2006. The full text of all International Financial Reporting Standards extant at 1 January 2006. International Accounting Standards Board (IASB), London, IASCF Publications Department.

333
IASB (2008). IAS 36 Impairment of Assets: Improvements to IFRSs. In Gaap Xtra database. Retrieved on April 18, 2011 from http://www.cchinformation.com.ezproxy.lib.gla.ac.uk/CCH/
IASB (2009). IAS 36 Impairment of Assets: Improvements to IFRSs. In Gaap Xtra database. International Accounting Standards Board (IASB), London: IASCF Publications Department. Retrieved on April 18, 2011 from http://www.cchinformation.com.ezproxy.lib.gla.ac.uk/CCH/
IASB (2010a). IFRS 3 Business Combinations. In International Financial Reporting Standards. Official pronouncements issued at 1 January 2010 (pp. A93-A139). International Accounting Standards Board (IASB), London: IASC Foundation Publications Department.
IASB (2010b). IAS 36 Impairment of Assets. In International Financial Reporting Standards. Official pronouncements issued at 1 January 2010 (pp. A753-A801). International Accounting Standards Board (IASB), London: IASC Foundation Publications Department.
IASB (Undated). Summaries of International Financial Reporting Standards. Retrieved on April 18, 2011 from http://www.iasplus.com/standard/ifrs03.htm, and http://www.iasplus.com/standard/ias36.htm
IASC. (2000). IAS 22 Business Combinations. In International Accounting Standards. The full text of all international accounting standards and SIC interpretations extant at 1 January 2000 (pp. 539-585). London: International Accounting Standards Committee (IASC).
Ismail, N. (2007). Earnings management and forecast accuracy: A study of Malaysian initial public offerings. Unpublished PhD thesis. University of Strathclyde, Scotland, United Kingdom.
Ismail, N., & Weetman, P. (2007). Forecast accuracy in initial public offerings and the impact of external constraints relative to managerial choice: a research note. Accounting and Finance, 47, 513-525.
Jensen, M.C. & Meckling, W.H. (1976). Theory of the firm: Managerial behaviour, agency costs and ownership structure. Journal of Financial Economics, 3, 305-360.
Jeter, D., Chaney, P., & Daley, M. (2008). Joint accounting choices: an examination of firms‘ adoption strategies for SFAS No. 106 and SFAS No. 109. Rev Quant Finan Acc, 30, 153-185, DOI 10.1007/s11156-007-0045-8.
Jones, J. J. (1991). Earnings management during import relief investigations. Journal of Accounting Research, 29(2), 193-228.
JUBM (2008). Spiralling construction cost - Biting the bullet for a better future? Construction News & Views. The Quarterly Newsletter of JUBM & DLS, 3, 1-4.
Kang, S-H. (1993). A conceptual framework for stock price effects of LIFO tax benefits. Journal of Accounting Research, 31(1), 50-61.

334
Kirschenheiter, M., & Melumad, N. (2002). Can ―Big bath‖ and earnings smoothing co-exist as equilibrium financial reporting strategies? Journal of Accounting Research, 40(3), 761-796.
KPMG (2005). The KPMG Guide: Improvements to Financial Reporting Standards incorporating FRSs 101, 108, 116, 117 and 124. Retrieved on February 1, 2013 from http://www.kpmg.com/my/en/topics/aci/pub-survey-resources/documents/2005/frs101,108,116,117,124-guide.pdf
Kvaal, E., & Nobes, C. (2010). International differences in IFRS policy choice: a research note. Accounting and Business Research, 40(2), 173-187.
La Porta, R., Lopez-de-Silanes, F., Shleifer, A., & Vishny, R. W. (1998). Law and finance. Journal of Political Economy, 106(6), 1113-1155.
Lapointe-Antunes, P., Cormier, D., & Magnan, M. (2008). Equity recognition of mandatory accounting changes: The case of transitional goodwill impairment losses. Canadian Journal of Administrative Sciences, 25(1), 37-54.
Leuz, C., Nanda, D., & Wysocki, P.D. (2003). Earnings management and investor protection: An international comparison. Journal of Financial Economics, 69, 505-527.
Lilien, S., & Pastena, V. (1982). Determinants of intramethod choice in the oil and gas industry. Journal of Accounting and Economics, 4, 145-170.
Long, S. J. (1997). Binary outcomes: The linear probability, probit, and logit models. In Regression models for categorical and limited dependent variables (pp.34-83). London: SAGE Publications.
Lys, T. (1984). Mandated accounting changes and debt covenants. The case of oil and gas accounting. Journal of Accounting and Economics, 6, 39-65.
Maddala, G. S. (1996). Introduction. In Limited-dependent and qualitative variables in econometrics (pp. 1-11). Cambridge: Cambridge University Press.
MASB (2000). Exposure draft to resolve contentious issue of goodwill. November 14, 2000. Retrieved September 3, 2008 from http://www.masb.org.my/index.php?option=com_content&view=article&id=657:contentious-issue-goodwill&catid=44:press-release-2000&Itemid=37
MASB (2001). MASB ED 28 Exposure Draft on Accounting for Goodwill. Reporting Foundation and Malaysian Accounting Standards Board (MASB) 2001. Kuala Lumpur.
MASB (2004a). MASB published Exposure Draft on Proposed Improvements to MASB standards. Retrieved on April 15, 2011 from http://www.masb.org.my/index.php?option=com_content&view=article&id=850:masb-published-exposure-draft-on-proposed-improvements-to-masb-standards&catid=50:world-news-2004&Itemid=39

335
MASB (2004b). FRS1082004 Net Profit or Loss for the Period, Fundamental Errors and Changes in Accounting Policies. Reporting Foundation and Malaysian Accounting Standards Board (MASB) 2006. Kuala Lumpur.
MASB (2005). Malaysia closer to world convergence as MASB finalises more financial reporting standards (FRSs). Retrieved February 15, 2008 from http://www.masb.org.my/masbmr_pr_detail.asp?prid=04052005-114835
MASB (2006a). FRS 3 Business Combinations. Reporting Foundation and Malaysian Accounting Standards Board (MASB) 2006. Kuala Lumpur.
MASB (2006b). MASB 21 Business Combinations. Malaysian Accounting Standards Board MASB 21: Business Combinations. Reporting Foundation and Malaysian Accounting Standards Board (MASB) 2001. Kuala Lumpur.
MASB (2006c). FRS 136 Impairment of Assets. Reporting Foundation and Malaysian Accounting Standards Board (MASB). Kuala Lumpur.
MASB (2006d). FRS 101 Presentation of Financial Statements. Reporting Foundation and Malaysian Accounting Standards Board (MASB). Kuala Lumpur.
MASB (Undated). Financial reporting Standards. Retrieved on April 19, 2011 from http://www.masb.org.my/index.php?option=com_content&view=article&id=1476
MASB (Undated). Foreword to Financial Reporting Standards. Retrieved on April 17, 2011 from http://www.masb.org.my/index.php?option=com_content&view=article&id=146%3Aforeword-full-pg2&catid=9%3Aforeword&Itemid=23
MASB (Undated). MASB profile. Retrieved on April 15, 2011 from http://www.masb.org.my/index.php?option=com_content&view=article&id=3&Itemid=7
MASB (Undated). What does convergence with IFRS mean? http://www.masb.org.my/index.php?option=com_content&view=article&id=1685&Itemid=57
Masters-Stout, B., Costigan, M.L., & Lovata, L.M. (2008). Goodwill impairments and chief executive tenure. Critical Perspectives on Accounting, 19, 1370-1383.
McConnell, J. J., & Servaes, H. (1995). Equity ownership and the two faces of debt. Journal of Financial Economics, 39, 131-157.
McNichols, M., & Wilson, P. G. (1988). Evidence of earnings management from the provision for bad debts. Journal of Accounting Research, 26, 1-31.
Menard, S. (1995). Applied logistic regression analysis. Thousand Oaks, CA: Sage Publications.

336
Menard, S. (2002). Summary statistics for evaluating the logistic regression model. In Applied logistic regression analysis (pp. 17-41). California: Sage Publications, Inc.
Menard, S. (2010). Quantitative approaches to model fit and explained variation. In Logistic regression. From introductory to advanced concepts and applications (pp. 42-63). Los Angeles: Sage Publications, Inc.
MICPA (Undated). The Malaysian Institute of Certified Public Accountant. Retrieved on April 5, 2011 from http://www.micpa.com.my/micpamember/public/links.asp.
Mohd Ghazali, N. A. (2004). Exploring theoretical explanations of voluntary disclosure by quantitative and qualitative investigation: Evidence from Malaysia. Unpublished PhD thesis. University of Strathclyde, Scotland, United Kingdom.
Mohd Ghazali, N.A., & Weetman, P. (2006). Perpetuating traditional influences: Voluntary disclosure in Malaysia following the economic crisis. Journal of International Accounting, Auditing and Taxation, 15, 226-248.
Moore, M. L. (1973). Management changes and discretionary accounting decisions. Journal of Accounting Research, 11(1), 100-107.
Morck, R., Shleifer, A. & Vishny, R. W. (1988). Management Ownership and Market Valuation: An Empirical Analysis. Journal of Financial Economics, 20(1), 293-315.
Murphy, K.J. & Zimmerman, J. L. (1993). Financial performance surrounding CEO turnover. Journal of Accounting and Economics, 16, 273-315.
Ngee, P. K. T. (2010). Corporate law reform: Too much too little too late?. Accountancy, 10-13.
Niehaus, G. R. (1989). Ownership structure and inventory method choice. The Accounting Review, 64(2), 269-284.
Nobes, C. (2006). The survival of international differences under IFRS: towards a research agenda. Accounting and Business Research, 36(3), 233-245.
Norusis, M. J. (2000). SPSS 10. Guide to data analysis. In Building multiple regression models (pp. 456-488). New Jersey: Prentice Hall, Inc.
Omar, N., & Mohd-Saleh, N. (2011). Family and government influence on goodwill impairment: Evidence from Malaysia. 2011 International Conference on Financial Management and Economics, IPCSIT, 11. Retrieved on April 14, 2012 from http://www.ipedr.com/vol11/77-W10014.pdf
Pallant, J. (2001). Descriptive statistics manual. In SPSS survival manual (pp. 49-62). Berkshire: Open University Press, Mc Graw-Hill Education.
Peers, I. (1996). Inferences involving binomial and nominal count data. In Statistical analysis for education & psychology researchers (pp. 161-205). London: The Falmer Press.

337
Pillai, T. S. (2006). Accounting standards for goodwill. Retrieved February 15, 2008 from http://www.pwc.com/en_MY/my/assets/.../pwc_frsgoodwill.pdf
Pourciau, S. (1993). Earnings management and nonroutine executive changes. Journal of Accounting and Economics, 16, 317-336.
Press, E. G., & Weintrop, J. B. (1990). Accounting-based constraints in public and private debt agreements. Their association with leverage and impact on accounting choice. Journal of Accounting and Economics, 12, 65-95.
PricewaterhouseCoopers (2008). Questions and answers on impairment of non-financial assets in the current crisis. Retrieved on October 15, 2009 from http://www.pwc.com/gx/en/ifrs-reporting/pdf/qa_impairment.pdf
PricewaterhouseCoopers (2009). TS insights. Market turmoil and goodwill implications - a study of the market response to goodwill impairment announcements. Retrieved on October 15, 2009 from http://www.pwc.com/en_US/us/transaction-services/assets/ts-insights-goodwil-impairments.pdf
Quarterly Malaysian Economy (2009). Quarterly update on the Malaysian economy – 3rd. Quarter 2009. Retrieved on April 21, 2011 from http://www.treasury.gov.my/pdf/ekonomi/sukutahun3_2009.pdf
Ramanna, K. (2008). The implications of unverifiable fair-value accounting: Evidence from the political economy of goodwill accounting. Journal of Accounting and Economics, 45, 2-3, 253-281.
Ramanna, K., & Watts, R. (2008). Evidence from goodwill non-impairments on the effects of unverifiable fair-value accounting. Working paper retrieved on March 14, 2009 at http://ssrn.com/
Ramanna, K., & Watts, R. L. (2012). Evidence on the use of unverifiable estimates in required goodwill impairment. Review of Accounting Studies, 17, 749-780. DOI 10.1007/S11142-012-91885.
Riedl, E.J. (2004). An examination of long-lived asset impairments. The Accounting Review, 79(3), 823-852.
Ronen, J., & Sadan, S. (1981). Smoothing income numbers: Objectives, means, and implications. Massachusetts: Addison-Wesley Publishing company.
Roychowdhury, S., & Watts, R. L. (2007). Asymmetric timeliness of earnings, market-to-book and conservatism in financial reporting. Journal of Accounting and Economics, 44, 2-31.
Securities Commission (Undated). Enforcement actions. Criminal prosecution initiated. Retrieved on April 5, 2011 from http://www.sc.com.my/main.asp?pageid=729&menuid=394&newsid=&linkid=2496&type=
Sengupta, P. (1998). Corporate disclosure quality and the cost of debt. The Accounting Review, 73(4), 459-474.

338
Shleifer, A., & Vishny, R. W. (1997). A survey of corporate governance. The Journal of Finance, LII (2), 737-783.
Skinner, D. J. (1993). The investment opportunity set and accounting procedure choice. Journal of Accounting and Economics, 16, 407-445.
Smith, A. (1993). Earnings and management incentives. Journal of Accounting and Economics, 16, 337-347.
Strong, J. S. & Meyer, J. R. (1987). Asset writedowns: Managerial incentives and security returns. The Journal of Finance, XLII (3), 643-661.
Suphakasem, J. (2008). An evaluation of corporate governance disclosure: Evidence from Malaysia, Singapore and Thailand. Unpublished PhD thesis. University of Strathclyde, Scotland, United Kingdom.
Susela, S.D. (1999). ―Interests‖ and accounting standard setting in Malaysia. Accounting, Auditing & Accountability Journal, 12(3), 358-389.
Tabachnick, B. G., & Fidell. L. S. (2007). Cleaning up your act: Screening data prior to analysis. In Using multivariate statistics (pp. 60-113). Fifth edition. Boston: Pearson International Edition.
Tan, L.T. (2000). Financial accounting and reporting in Malaysia. Second edition. Kuala Lumpur: Professional Advancement Achievement Centre publication.
Tarling, R. (2009). Logistic regression for binary response variables. In Statistical Modelling for Social Researchers: Principles and Practice (pp. 63-76). London : Routledge.
Teshima, N., & Shuto, A. (2008). Managerial ownership and earnings management: Theory and empirical evidence from Japan. Journal of International Financial Management and Accounting, 19(2), 107-132.
Tobin, J. (1958). Estimation of relationships for limited dependent variables. Econometrica, 26(1), 24-36.
Ward, M. M., & Leigh, P. J. (1993). Pooled time series regression analysis in longitudinal studies. J Clin Epidemiol, 46(7), 645-659.
Warfield, T. D., Wild, J. J., & Wild, K. L. (1995). Managerial ownership, accounting choices, and informativeness of earnings. Journal of Accounting and Economics, 20, 61-91.
Watts, R. L. (1977). Corporate financial statements, a product of the market and political process. Australian Journal of Management, 53-75.
Watts, R. L. (1992). Accounting choice theory and market-based research in accounting. British Accounting Review, 24, 235-267.
Watts, R. L., & Zimmerman, J. L. (1986). Positive accounting theory. New Jersey: Prentice-Hall, Inc.
Watts, R. L., & Zimmerman, J. L. (1990). Positive accounting theory: A ten year perspective. The Accounting Review, 65(1), 131-156.

339
Weisbach, M. S. (1988). Outside directors and CEO turnover. Journal of Financial Economics, 20, 431-460.
Wells, P. (2002). Earnings management surrounding CEO changes. Accounting and Finance, 42, 169-193.
Whittred, G. (1987). The derived demand for consolidated financial reporting. Journal of Accounting and Economics, 9, 259-285.
Wilson, P. G. (1996). Discussion: Write-Offs: Manipulation or Impairment? Journal of Accounting Research, Supplement, 34(3), 171-177.
Wooldridge, J. M. (2009). Advanced panel data methods. In Introductory econometrics. A modern approach (pp. 481-496). Fourth edition. Canada: South-Western Cengage learning.
Zang, Y. (2008). Discretionary behaviour with respect to the adoption of SFAS no. 142 and the behaviour of security prices. Review of Accounting and Finance, 7(1), 38-68.
Zucca, L. J., & Campbell, D. R. (1992). A closer look at discretionary writedowns of impaired assets. Accounting Horizons, September, 30-41.