abattoir—a techno-economic evaluation
TRANSCRIPT
energies
Article
Voltage Optimisation Technology for an AustralianAbattoir—A Techno-Economic Evaluation
GM Shafiullah 1,*, Bond Watson 2, Christopher Lund 1, Md Moktadir Rahman 1, Gloria Rupf 1
and Jonathan Whale 1
1 School of Engineering and IT, Murdoch University, Perth 6150, Australia;[email protected] (C.L.); [email protected] (M.M.R.);[email protected] (G.R.); [email protected] (J.W.)
2 Snowy Mountains Engineering Company (SMEC), Fortitude Valley, Brisbane 4006, Australia;[email protected]
* Correspondence: [email protected]; Tel.: +61-8-9360-6417
Received: 6 September 2017; Accepted: 17 October 2017; Published: 2 November 2017
Abstract: Optimising voltage levels to a controlled stable level at a facility can not only reduce the costof energy but also enhance equipment performance, prolong equipment life, reduce maintenancecosts and reduce greenhouse gas emissions. Voltage optimisation (VO) technology has been widelyused in a number of different industries locally and internationally, but not to a large extentwithin the red meat processing sector in Australia. To determine whether VO technology canbe implemented, and whether it is technically and economically viable for red meat processing sites,this study investigated, through case study analyses, the potential effectiveness of VO technology inAustralian abattoirs. Through an extensive literature survey, the study initially explored the need andconsiderations of deploying VO technologies at a typical red meat processing plant. To determinethe advantages of using VO technology the study then performed site analyses to investigatepower quality (PQ) issues, such as voltage regulation, harmonics and power factor, at two typicalmedium-sized abattoirs, one in Western Australia and another in Queensland. Finally, an economicassessment of the use of VO in the red meat processing industry was undertaken to identifythe potential electricity savings and payback periods. From the case study analyses, it is evident thatpower quality issues, such as under voltage, overvoltage, and harmonic distortion, can be reduced andsignificant energy savings can be achieved with the optimum selection of VO technology and voltagelevel. The outcomes of this study will enable engineering and operations staff to be better informedabout the economic and technical benefits of (and possible issues with) using VO technologies inan abattoir.
Keywords: voltage optimisation; abattoir; power quality; energy savings; payback period
1. Introduction
Energy costs are one of the major operating costs in the meat processing industry (AUD $1M toAUD $2M per year for each of the top 25 processing plants in Australia), with primary energy sourcesincluding electricity and natural gas [1]. Most meat processing facilities can be categorized according tothe activities performed at the facility and these can include: slaughter only or boning only; slaughterand boning; processing; and/or, rendering. The main energy consuming equipment found at abattoirsinclude a refrigeration plant, steam and hot water generating equipment, pumps, lighting loads andair compressors. Generally, the supply voltage maintained by the network operator is higher thanthe optimum operating voltage required for most of the electrical equipment in meat processingfacilities [2,3]. To ensure adequate power quality (PQ) and reduce energy costs, it is beneficial to
Energies 2017, 10, 1764; doi:10.3390/en10111764 www.mdpi.com/journal/energies
Energies 2017, 10, 1764 2 of 26
maintain a regulated electricity supply that is optimal, as overvoltage leads to inefficient use of energyin the device, and can causes overheating and shortening of equipment life [1–3].
According to the current Australian AS60038 Standard Voltages standard [4], single phase andthree phase supply voltages are 230 V and 400 V, respectively, with a tolerance between +10% and −6%and a utilization range of +10% and −11%. However, many local utilities still follow the old standard,for example Ergon Energy in Queensland uses 240 V ± 6% and 415 V ± 6% for single and three phasesystems, respectively [5]. There are a number of reasons that network operators maintain the voltageat the higher end of standard limits; some of these include to avoid voltage drop at the end node,accommodating loss in transmission and to avoid financial loss due to lower voltage at the customerend. Electrical equipment at the end of the network function optimally at 220 V to 230 V and sometimeseven as low as 200 V.
When incoming voltages exceed the required equipment voltages, energy is wasted in the formof heat. This results in unnecessary costs and potentially reduces the lifespan of electrical appliances.Generally, power demand will increase with an increase in supply voltage magnitude and vice versa.In effect, a 1% voltage increase leads to a 1% increase in energy consumption and a 1.7% or moreincrease in reactive power consumption (depending on load types and power factor). Energywise [6]performed data logging across Australia, and found that approximately 90% of sites are operating atan overvoltage level, with the average voltage being approximately 240 V. To ensure adequate powerquality and reduce energy costs, it is therefore beneficial to maintain a regulated electricity supply thatis stable at the equipment’s optimal operating voltage, whether using only the grid as an electricitysource, or combining the grid with on-site electricity generating sources.
Voltage optimisation (VO) technology aims to reduce electricity usage, power demand and overallcost by reducing supply voltage “downstream” of the meter. VO plays an important role by keepingthe voltage at an optimum level, improving the power factor and reducing harmonic losses andvoltage deviations and, most importantly reduces energy consumption and carbon emissions forthe red meat processing industry [7,8]. Recently Snowy Mountains Engineering Company (SMEC) [9]has developed a voltage optimisation guide that identifies the opportunity for the use of voltageoptimisation technology and issues for deployment in various industries.
Like other industries, the supply voltage maintained by the network operator for most meatprocessing facilities in Australia is usually higher than that required for their equipment to operateefficiently with minimal energy consumption [2]. Therefore, there is significant scope to reduce energyconsumption and carbon emissions for the meat processing industry by managing the voltage levelsat facilities using voltage optimization [7]. VO technologies are currently widely used in differentmeat industries around the world and evidence suggests that there is a significant opportunity inimplementing these technologies in the Australian meat processing industry [2,10].
To determine the suitability of adopting VO technology for the Australian meat processingindustry, a detailed investigation is required to understand the state of the power network andthe electrical equipment used in the industry as well as its corresponding operating conditions.This understanding is needed in order to correctly determine the potential technical, economic,environmental and social benefits to be gained in meat processing facilities after implementingVO technology. Therefore, this research has explored the current operating conditions in representativered meat processing facilities in Australia; specifically, PQ related issues such as voltage level,harmonics and power factor and, in light of this, investigated suitable voltage optimisers for thesefacilities, considering both technical and economic evaluation.
2. Methodology
Initially, an extensive literature review was conducted to investigate the voltage optimisationand stabilization technologies currently used in other related sectors and internationally in the meatprocessing industry with their technical and economic performance characteristics. Secondly, cataloguesof the equipment, measured load profiles, and grid PQ analyses for two abattoir case studies sites were
Energies 2017, 10, 1764 3 of 26
used to identify the extent of possible improvement to PQ and energy savings opportunities fromthe use of voltage optimisers. A techno-economic analysis was then undertaken to identify the suitableVO technology solution for the Australian meat processing industry. The methodology of the study isshown in Table 1.
Table 1. Methodological approach of the study.
Literature Survey Power Quality Analysis Techno-Economic Analysis
• Scientific, technical andengineering literature
• Case studies
• A plant inventory list of main electricalequipment on-site (e.g., type, make,age, model, ratings and use)
• Abattoirs’ typical hours of operation,site operating conditions and energyusage patterns
• Physical measurement of typical dailyand weekly voltage profiles andpower quality
• Investigate power quality issues
• Technical analysis of potential energy savings• Identify commercially available and
applicable voltage optimisation technologies• Document deployment costs• Economic analysis of VO technology
3. Literature Survey: Voltage Optimisation in Abattoirs
3.1. Electricity Consumption in Abattoirs
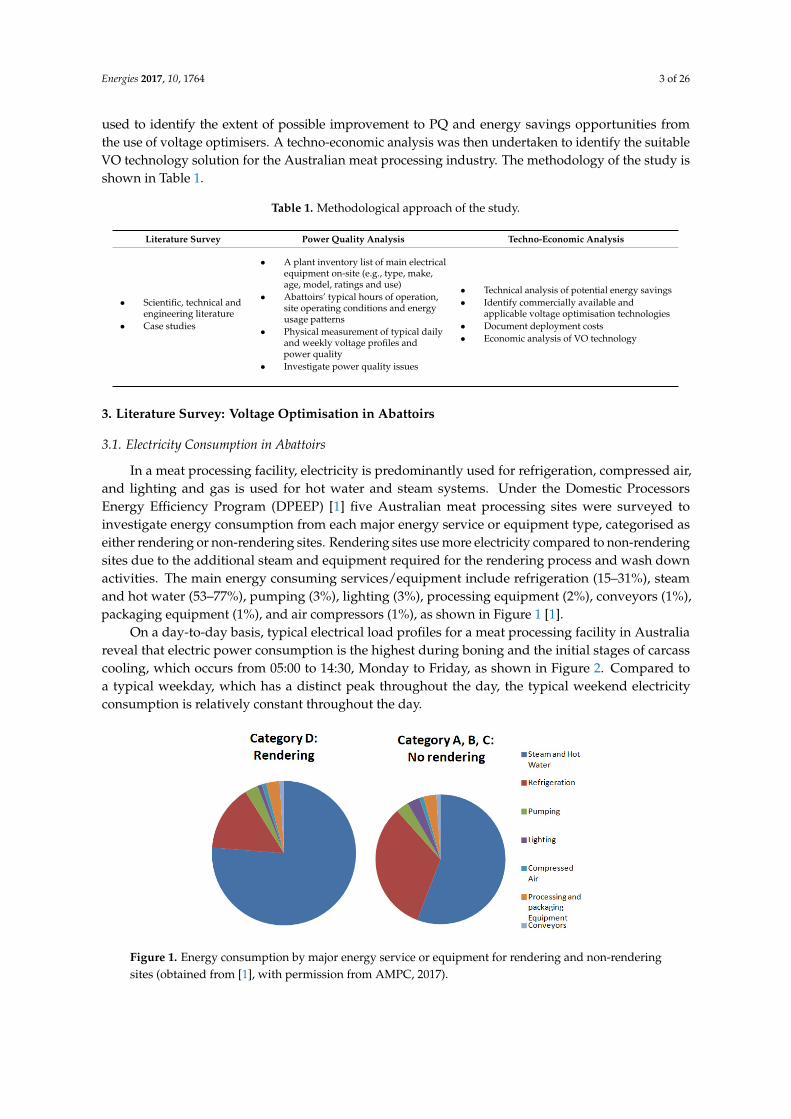
In a meat processing facility, electricity is predominantly used for refrigeration, compressed air,and lighting and gas is used for hot water and steam systems. Under the Domestic ProcessorsEnergy Efficiency Program (DPEEP) [1] five Australian meat processing sites were surveyed toinvestigate energy consumption from each major energy service or equipment type, categorised aseither rendering or non-rendering sites. Rendering sites use more electricity compared to non-renderingsites due to the additional steam and equipment required for the rendering process and wash downactivities. The main energy consuming services/equipment include refrigeration (15–31%), steamand hot water (53–77%), pumping (3%), lighting (3%), processing equipment (2%), conveyors (1%),packaging equipment (1%), and air compressors (1%), as shown in Figure 1 [1].
On a day-to-day basis, typical electrical load profiles for a meat processing facility in Australiareveal that electric power consumption is the highest during boning and the initial stages of carcasscooling, which occurs from 05:00 to 14:30, Monday to Friday, as shown in Figure 2. Compared toa typical weekday, which has a distinct peak throughout the day, the typical weekend electricityconsumption is relatively constant throughout the day.
Energies 2017, 10, 1764 3 of 26
to identify the suitable VO technology solution for the Australian meat processing industry. The methodology of the study is shown in Table 1.
Table 1. Methodological approach of the study.
Literature Survey Power Quality Analysis Techno-Economic Analysis
• Scientific, technical and engineering literature
• Case studies
• A plant inventory list of main electrical equipment on-site (e.g., type, make, age, model, ratings and use)
• Abattoirs’ typical hours of operation, site operating conditions and energy usage patterns
• Physical measurement of typical daily and weekly voltage profiles and power quality
• Investigate power quality issues
• Technical analysis of potential energy savings
• Identify commercially available and applicable voltage optimisation technologies
• Document deployment costs • Economic analysis of VO
technology
3. Literature Survey: Voltage Optimisation in Abattoirs
3.1. Electricity Consumption in Abattoirs
In a meat processing facility, electricity is predominantly used for refrigeration, compressed air, and lighting and gas is used for hot water and steam systems. Under the Domestic Processors Energy Efficiency Program (DPEEP) [1] five Australian meat processing sites were surveyed to investigate energy consumption from each major energy service or equipment type, categorised as either rendering or non-rendering sites. Rendering sites use more electricity compared to non-rendering sites due to the additional steam and equipment required for the rendering process and wash down activities. The main energy consuming services/equipment include refrigeration (15–31%), steam and hot water (53–77%), pumping (3%), lighting (3%), processing equipment (2%), conveyors (1%), packaging equipment (1%), and air compressors (1%), as shown in Figure 1 [1].
On a day-to-day basis, typical electrical load profiles for a meat processing facility in Australia reveal that electric power consumption is the highest during boning and the initial stages of carcass cooling, which occurs from 05:00 to 14:30, Monday to Friday, as shown in Figure 2. Compared to a typical weekday, which has a distinct peak throughout the day, the typical weekend electricity consumption is relatively constant throughout the day.
Figure 1. Energy consumption by major energy service or equipment for rendering and non-rendering sites (obtained from [1], with permission from AMPC, 2017).
Figure 1. Energy consumption by major energy service or equipment for rendering and non-renderingsites (obtained from [1], with permission from AMPC, 2017).

Energies 2017, 10, 1764 4 of 26Energies 2017, 10, 1764 4 of 26
Figure 2. Typical weekday electricity consumption profiles for an Australian meat processing facility (obtained from [1], with permission from AMPC, 2017).
From analyses undertaken in the Domestic Processors Energy Efficiency Program [1], electricity consumption increases during the summer months (November–March) due to additional cooling and refrigeration requirements, as shown in Figure 3.
What can be gleaned from typical energy consumption quantities, proportions, and usage patterns in Australian red meat processing facilities is that there is significant potential for reducing the electricity consumption by reducing the supply voltage to an optimum level, regardless of whether the site has rendering or non-rendering activities.
Figure 3. Typical weekend electricity consumption profile for an Australian meat processing facility (obtained from [1], with permission from AMPC, 2017).
3.2. Voltage Optimisation
Voltage optimisation can be beneficial for utilities through peak loading relief of distribution systems, reduction in fuel consumption (if, say, the utilities have local power generation plants), reduction in emissions (should energy regulations place a cost on emissions), and overall cost reductions [11,12]. The technology can also improve power quality by reducing harmonic and transient voltages, as well as balance phase voltages. A reduction and balancing in electricity supply voltage provides a saving in energy consumption (kWh) and a reduction in maximum demand (kW and kVA), which results in a reduction in electricity bills for the customer [13,14]. Other purported benefits include improved power quality, less equipment maintenance, improved equipment life, and reduced energy consumption, which all lead to significant cost savings [15].
Figure 2. Typical weekday electricity consumption profiles for an Australian meat processing facility(obtained from [1], with permission from AMPC, 2017).
From analyses undertaken in the Domestic Processors Energy Efficiency Program [1], electricityconsumption increases during the summer months (November–March) due to additional cooling andrefrigeration requirements, as shown in Figure 3.
What can be gleaned from typical energy consumption quantities, proportions, and usagepatterns in Australian red meat processing facilities is that there is significant potential for reducingthe electricity consumption by reducing the supply voltage to an optimum level, regardless of whetherthe site has rendering or non-rendering activities.
Energies 2017, 10, 1764 4 of 26
Figure 2. Typical weekday electricity consumption profiles for an Australian meat processing facility (obtained from [1], with permission from AMPC, 2017).
From analyses undertaken in the Domestic Processors Energy Efficiency Program [1], electricity consumption increases during the summer months (November–March) due to additional cooling and refrigeration requirements, as shown in Figure 3.
What can be gleaned from typical energy consumption quantities, proportions, and usage patterns in Australian red meat processing facilities is that there is significant potential for reducing the electricity consumption by reducing the supply voltage to an optimum level, regardless of whether the site has rendering or non-rendering activities.
Figure 3. Typical weekend electricity consumption profile for an Australian meat processing facility (obtained from [1], with permission from AMPC, 2017).
3.2. Voltage Optimisation
Voltage optimisation can be beneficial for utilities through peak loading relief of distribution systems, reduction in fuel consumption (if, say, the utilities have local power generation plants), reduction in emissions (should energy regulations place a cost on emissions), and overall cost reductions [11,12]. The technology can also improve power quality by reducing harmonic and transient voltages, as well as balance phase voltages. A reduction and balancing in electricity supply voltage provides a saving in energy consumption (kWh) and a reduction in maximum demand (kW and kVA), which results in a reduction in electricity bills for the customer [13,14]. Other purported benefits include improved power quality, less equipment maintenance, improved equipment life, and reduced energy consumption, which all lead to significant cost savings [15].
Figure 3. Typical weekend electricity consumption profile for an Australian meat processing facility(obtained from [1], with permission from AMPC, 2017).
3.2. Voltage Optimisation
Voltage optimisation can be beneficial for utilities through peak loading relief of distributionsystems, reduction in fuel consumption (if, say, the utilities have local power generation plants),reduction in emissions (should energy regulations place a cost on emissions), and overall costreductions [11,12]. The technology can also improve power quality by reducing harmonic and transientvoltages, as well as balance phase voltages. A reduction and balancing in electricity supply voltageprovides a saving in energy consumption (kWh) and a reduction in maximum demand (kW and kVA),which results in a reduction in electricity bills for the customer [13,14]. Other purported benefitsinclude improved power quality, less equipment maintenance, improved equipment life, and reducedenergy consumption, which all lead to significant cost savings [15].
Energies 2017, 10, 1764 5 of 26
Voltage optimisation is considered to be part of voltage management. Depending on how voltagemay impact an abattoir’s operations and productivity, and the performance of site equipment, voltagemanagement may include [16]:
• Voltage stabilization (e.g., manages electrical transients);• Voltage regulation (e.g., controls over- and under-voltage);• Voltage reduction (e.g., reduces voltage by a selectable percentage); and• Voltage optimisation (e.g., adjusts voltage within a certain range).
Voltage stabilization and voltage regulation are both ways of protecting equipment from variationsin voltage (either fast short period transients, or slower longer periods of over- or under-voltage). Both ofthese technologies do not change the underlying supply voltage but adjust the voltage around the suppliedgrid voltage and ensure this voltage is maintained. Voltage reduction and voltage optimisation are bothways of reducing the voltage to a set value in order to realise energy savings. Common types of voltageoptimisation units with their strength and shortcomings are presented in Table 2.
Table 2. Common types of voltage optimization units [16,17].
Type Description Benefits Issues
Fixed VoltageRegulators
Fixed voltage regulators arebasic voltage optimisation unitsthat step down the voltage bya fixed amount (e.g., 5%).The units deliver a varyingoutput (i.e., with the samevariations as the supply) ata lower voltage than the supply.These units use magneticcouplings that transmitan electric load and usea secondary winding thatapplies an induced opposingvoltage. They do not reactivelyadjust to voltage supply levels.
Generally cheaper thandynamic systems.Small sized units. Ideal fora site where the voltagesupply levels arerelatively stable.
Does not activelycompensate for voltagefluctuations in the supply.Risk associated with undervoltage (i.e., these units maysupply voltage that is lowerthan the rated voltage inthe event of a dip involtage supply).
DynamicSystem–Voltage
Optimisers
Voltage optimisers aim todynamically adjust voltagelevels within a specific range.This output is aimed to supplya specific voltage required bycertain electrical equipment.Most voltage optimisers useelectronic controls that canadjust voltage within a specifiedbandwidth. This is achieved bycontinually comparingthe incoming voltage tothe voltage needed to drivethe loads. Some voltageoptimisers may also containfeatures to address other powermanagement elements such asharmonics, transients andpower factor.
Voltage optimisers are usedto adjust supply voltage toa more precise and steadierlevel. This enables the userto supply voltage closer tothe equipment’s powerrating resulting in greaterenergy savings.
Voltage optimisers aretypically more expensivethan voltage regulators.Does not compensate forvoltage drops in the supply(some voltage optimisershave protection againstvoltage drop). Dependingon the unit, the voltageoptimisers are generallylarger thanvoltage regulators.
DynamicSystem-Boosted
Voltage Optimisers
Other electronically controlledvoltage optimisers are capableof boosting voltage to safeguardvoltage supply in the event ofvoltage drops.
Generally used whenthe voltage drops regularlybelow the desired level.May be suitable for endusers with variablevoltage supply.
Additional costs forthe voltage booster.Not widely used inAustralia as the voltagedoes not usually drop tolevels below the minimumallowable level (i.e., 216 V).
Figure 4 shows a typical voltage profile, measured from a representative survey site forsix weeks, pre- and post-VO installation. During the pre-installation process, the voltage range is
Energies 2017, 10, 1764 6 of 26
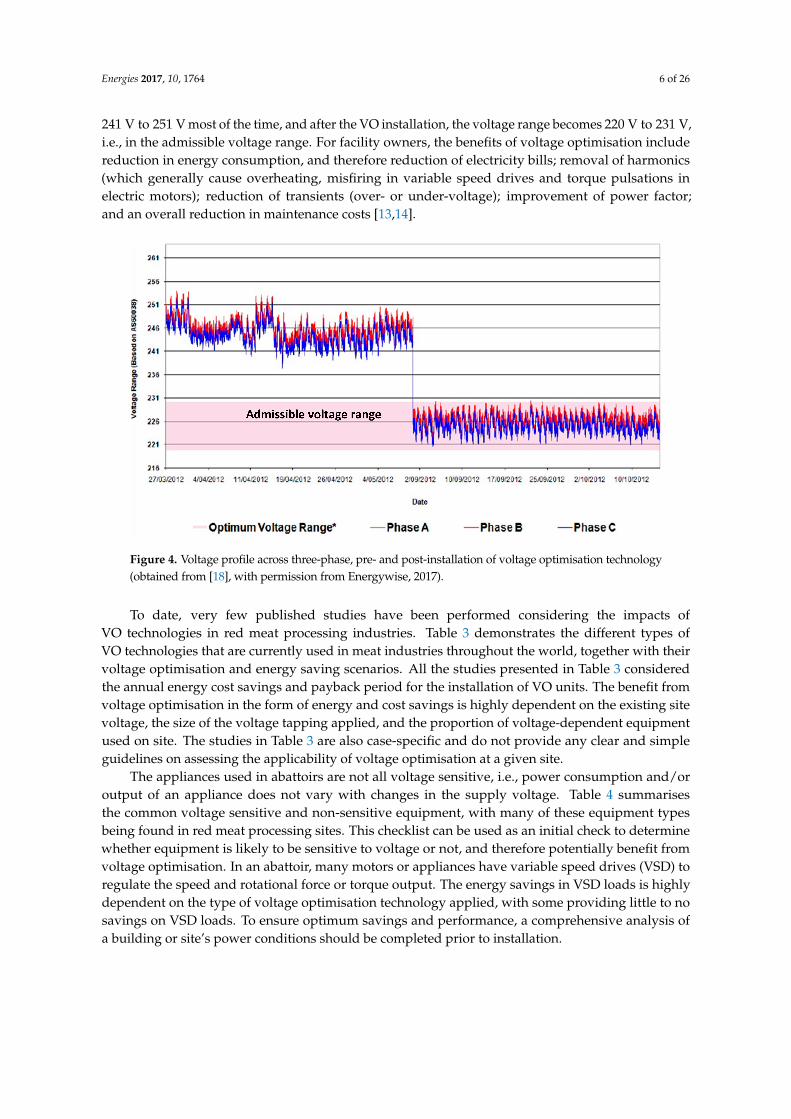
241 V to 251 V most of the time, and after the VO installation, the voltage range becomes 220 V to 231 V,i.e., in the admissible voltage range. For facility owners, the benefits of voltage optimisation includereduction in energy consumption, and therefore reduction of electricity bills; removal of harmonics(which generally cause overheating, misfiring in variable speed drives and torque pulsations inelectric motors); reduction of transients (over- or under-voltage); improvement of power factor;and an overall reduction in maintenance costs [13,14].
Energies 2017, 10, 1764 6 of 26
Figure 4 shows a typical voltage profile, measured from a representative survey site for six weeks, pre- and post-VO installation. During the pre-installation process, the voltage range is 241 V to 251 V most of the time, and after the VO installation, the voltage range becomes 220 V to 231 V, i.e., in the admissible voltage range. For facility owners, the benefits of voltage optimisation include reduction in energy consumption, and therefore reduction of electricity bills; removal of harmonics (which generally cause overheating, misfiring in variable speed drives and torque pulsations in electric motors); reduction of transients (over- or under-voltage); improvement of power factor; and an overall reduction in maintenance costs [13,14].
Figure 4. Voltage profile across three-phase, pre- and post-installation of voltage optimisation technology (obtained from [18], with permission from Energywise, 2017).
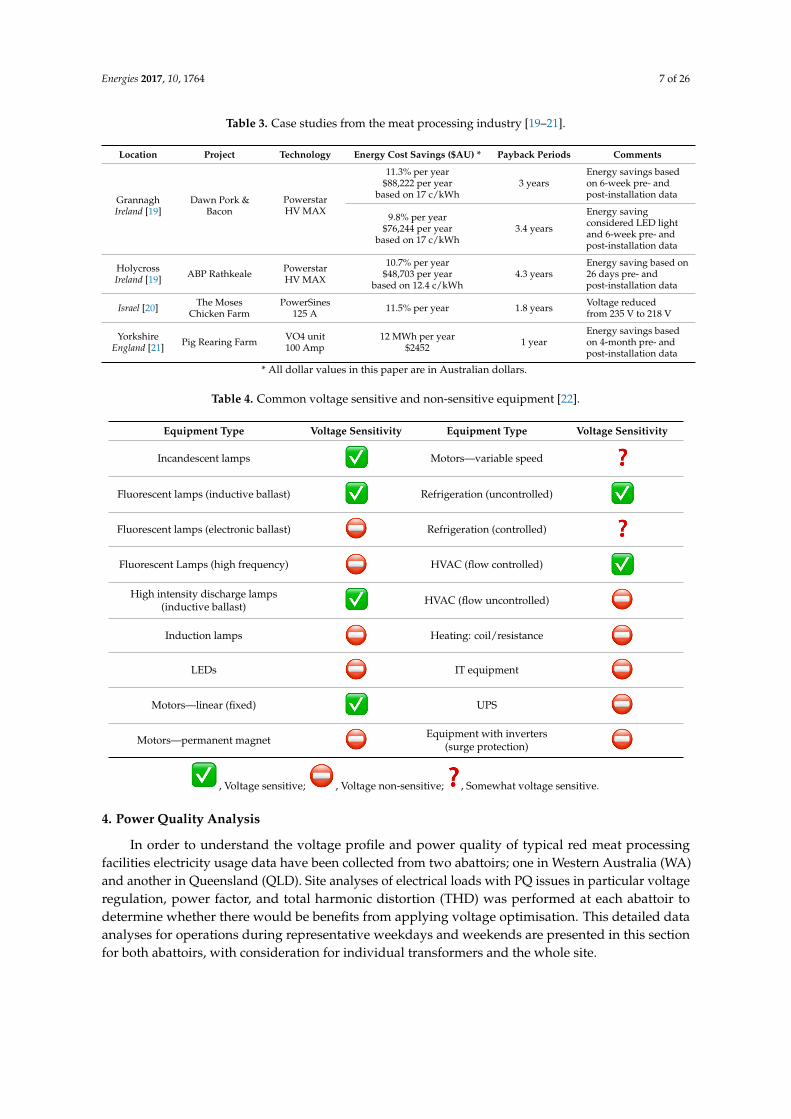
To date, very few published studies have been performed considering the impacts of VO technologies in red meat processing industries. Table 3 demonstrates the different types of VO technologies that are currently used in meat industries throughout the world, together with their voltage optimisation and energy saving scenarios. All the studies presented in Table 3 considered the annual energy cost savings and payback period for the installation of VO units. The benefit from voltage optimisation in the form of energy and cost savings is highly dependent on the existing site voltage, the size of the voltage tapping applied, and the proportion of voltage-dependent equipment used on site. The studies in Table 3 are also case-specific and do not provide any clear and simple guidelines on assessing the applicability of voltage optimisation at a given site.
The appliances used in abattoirs are not all voltage sensitive, i.e., power consumption and/or output of an appliance does not vary with changes in the supply voltage. Table 4 summarises the common voltage sensitive and non-sensitive equipment, with many of these equipment types being found in red meat processing sites. This checklist can be used as an initial check to determine whether equipment is likely to be sensitive to voltage or not, and therefore potentially benefit from voltage optimisation. In an abattoir, many motors or appliances have variable speed drives (VSD) to regulate the speed and rotational force or torque output. The energy savings in VSD loads is highly dependent on the type of voltage optimisation technology applied, with some providing little to no savings on VSD loads. To ensure optimum savings and performance, a comprehensive analysis of a building or site’s power conditions should be completed prior to installation.
Figure 4. Voltage profile across three-phase, pre- and post-installation of voltage optimisation technology(obtained from [18], with permission from Energywise, 2017).
To date, very few published studies have been performed considering the impacts ofVO technologies in red meat processing industries. Table 3 demonstrates the different types ofVO technologies that are currently used in meat industries throughout the world, together with theirvoltage optimisation and energy saving scenarios. All the studies presented in Table 3 consideredthe annual energy cost savings and payback period for the installation of VO units. The benefit fromvoltage optimisation in the form of energy and cost savings is highly dependent on the existing sitevoltage, the size of the voltage tapping applied, and the proportion of voltage-dependent equipmentused on site. The studies in Table 3 are also case-specific and do not provide any clear and simpleguidelines on assessing the applicability of voltage optimisation at a given site.
The appliances used in abattoirs are not all voltage sensitive, i.e., power consumption and/oroutput of an appliance does not vary with changes in the supply voltage. Table 4 summarisesthe common voltage sensitive and non-sensitive equipment, with many of these equipment typesbeing found in red meat processing sites. This checklist can be used as an initial check to determinewhether equipment is likely to be sensitive to voltage or not, and therefore potentially benefit fromvoltage optimisation. In an abattoir, many motors or appliances have variable speed drives (VSD) toregulate the speed and rotational force or torque output. The energy savings in VSD loads is highlydependent on the type of voltage optimisation technology applied, with some providing little to nosavings on VSD loads. To ensure optimum savings and performance, a comprehensive analysis ofa building or site’s power conditions should be completed prior to installation.
Energies 2017, 10, 1764 7 of 26
Table 3. Case studies from the meat processing industry [19–21].
Location Project Technology Energy Cost Savings ($AU) * Payback Periods Comments
GrannaghIreland [19]
Dawn Pork &Bacon
PowerstarHV MAX
11.3% per year$88,222 per year
based on 17 c/kWh3 years
Energy savings basedon 6-week pre- andpost-installation data
9.8% per year$76,244 per year
based on 17 c/kWh3.4 years
Energy savingconsidered LED lightand 6-week pre- andpost-installation data
HolycrossIreland [19] ABP Rathkeale Powerstar
HV MAX
10.7% per year$48,703 per year
based on 12.4 c/kWh4.3 years
Energy saving based on26 days pre- andpost-installation data
Israel [20] The MosesChicken Farm
PowerSines125 A 11.5% per year 1.8 years Voltage reduced
from 235 V to 218 V
YorkshireEngland [21] Pig Rearing Farm VO4 unit
100 Amp12 MWh per year
$2452 1 yearEnergy savings basedon 4-month pre- andpost-installation data
* All dollar values in this paper are in Australian dollars.
Table 4. Common voltage sensitive and non-sensitive equipment [22].
Equipment Type Voltage Sensitivity Equipment Type Voltage Sensitivity
Incandescent lamps
Energies 2017, 10, 1764 7 of 26
Table 3. Case studies from the meat processing industry [19–21].
Location Project Technology Energy Cost Savings($AU) *
PaybackPeriods Comments
Grannagh Ireland [19]
Dawn Pork & Bacon
Powerstar HV MAX
11.3% per year $88,222 per year
based on 17 c/kWh 3 years
Energy savings based on 6-week pre- and post-installation data
9.8% per year $76,244 per year
based on 17 c/kWh 3.4 years
Energy saving considered LED light and 6-week pre- and post-installation data
Holycross Ireland [19]
ABP Rathkeale Powerstar HV
MAX
10.7% per year $48,703 per year
based on 12.4 c/kWh 4.3 years
Energy saving based on 26 days pre- and post-installation data
Israel [20] The Moses
Chicken Farm PowerSines
125 A 11.5% per year 1.8 years
Voltage reduced from 235 V to 218 V
Yorkshire England [21]
Pig Rearing Farm
VO4 unit 100 Amp
12 MWh per year $2452
1 year Energy savings based on 4-month pre- and post-installation data
* All dollar values in this paper are in Australian dollars.
Table 4. Common voltage sensitive and non-sensitive equipment [22].
Equipment Type Voltage Sensitivity Equipment Type Voltage
Sensitivity
Incandescent lamps Motors—variable speed Fluorescent lamps (inductive
ballast) Refrigeration (uncontrolled) Fluorescent lamps (electronic
ballast) Refrigeration (controlled) Fluorescent Lamps (high
frequency) HVAC (flow controlled) High intensity discharge lamps (inductive ballast) HVAC (flow uncontrolled)
Induction lamps Heating: coil/resistance
LEDs IT equipment
Motors—linear (fixed) UPS
Motors—permanent magnet Equipment with inverters
(surge protection) , Voltage sensitive; , Voltage non-sensitive; , Somewhat voltage sensitive.
4. Power Quality Analysis
In order to understand the voltage profile and power quality of typical red meat processing facilities electricity usage data have been collected from two abattoirs; one in Western Australia (WA) and another in Queensland (QLD). Site analyses of electrical loads with PQ issues in particular voltage regulation, power factor, and total harmonic distortion (THD) was performed at each abattoir to determine whether there would be benefits from applying voltage optimisation. This detailed data analyses for operations during representative weekdays and weekends are presented in this section for both abattoirs, with consideration for individual transformers and the whole site.
Motors—variable speed
Energies 2017, 10, 1764 7 of 26
Table 3. Case studies from the meat processing industry [19–21].
Location Project Technology Energy Cost Savings($AU) *
PaybackPeriods Comments
Grannagh Ireland [19]
Dawn Pork & Bacon
Powerstar HV MAX
11.3% per year $88,222 per year
based on 17 c/kWh 3 years
Energy savings based on 6-week pre- and post-installation data
9.8% per year $76,244 per year
based on 17 c/kWh 3.4 years
Energy saving considered LED light and 6-week pre- and post-installation data
Holycross Ireland [19]
ABP Rathkeale Powerstar HV
MAX
10.7% per year $48,703 per year
based on 12.4 c/kWh 4.3 years
Energy saving based on 26 days pre- and post-installation data
Israel [20] The Moses
Chicken Farm PowerSines
125 A 11.5% per year 1.8 years
Voltage reduced from 235 V to 218 V
Yorkshire England [21]
Pig Rearing Farm
VO4 unit 100 Amp
12 MWh per year $2452
1 year Energy savings based on 4-month pre- and post-installation data
* All dollar values in this paper are in Australian dollars.
Table 4. Common voltage sensitive and non-sensitive equipment [22].
Equipment Type Voltage Sensitivity Equipment Type Voltage
Sensitivity
Incandescent lamps Motors—variable speed Fluorescent lamps (inductive
ballast) Refrigeration (uncontrolled) Fluorescent lamps (electronic
ballast) Refrigeration (controlled) Fluorescent Lamps (high
frequency) HVAC (flow controlled) High intensity discharge lamps (inductive ballast) HVAC (flow uncontrolled)
Induction lamps Heating: coil/resistance
LEDs IT equipment
Motors—linear (fixed) UPS
Motors—permanent magnet Equipment with inverters
(surge protection) , Voltage sensitive; , Voltage non-sensitive; , Somewhat voltage sensitive.
4. Power Quality Analysis
In order to understand the voltage profile and power quality of typical red meat processing facilities electricity usage data have been collected from two abattoirs; one in Western Australia (WA) and another in Queensland (QLD). Site analyses of electrical loads with PQ issues in particular voltage regulation, power factor, and total harmonic distortion (THD) was performed at each abattoir to determine whether there would be benefits from applying voltage optimisation. This detailed data analyses for operations during representative weekdays and weekends are presented in this section for both abattoirs, with consideration for individual transformers and the whole site.
Fluorescent lamps (inductive ballast)
Energies 2017, 10, 1764 7 of 26
Table 3. Case studies from the meat processing industry [19–21].
Location Project Technology Energy Cost Savings($AU) *
PaybackPeriods Comments
Grannagh Ireland [19]
Dawn Pork & Bacon
Powerstar HV MAX
11.3% per year $88,222 per year
based on 17 c/kWh 3 years
Energy savings based on 6-week pre- and post-installation data
9.8% per year $76,244 per year
based on 17 c/kWh 3.4 years
Energy saving considered LED light and 6-week pre- and post-installation data
Holycross Ireland [19]
ABP Rathkeale Powerstar HV
MAX
10.7% per year $48,703 per year
based on 12.4 c/kWh 4.3 years
Energy saving based on 26 days pre- and post-installation data
Israel [20] The Moses
Chicken Farm PowerSines
125 A 11.5% per year 1.8 years
Voltage reduced from 235 V to 218 V
Yorkshire England [21]
Pig Rearing Farm
VO4 unit 100 Amp
12 MWh per year $2452
1 year Energy savings based on 4-month pre- and post-installation data
* All dollar values in this paper are in Australian dollars.
Table 4. Common voltage sensitive and non-sensitive equipment [22].
Equipment Type Voltage Sensitivity Equipment Type Voltage
Sensitivity
Incandescent lamps Motors—variable speed Fluorescent lamps (inductive
ballast) Refrigeration (uncontrolled) Fluorescent lamps (electronic
ballast) Refrigeration (controlled) Fluorescent Lamps (high
frequency) HVAC (flow controlled) High intensity discharge lamps (inductive ballast) HVAC (flow uncontrolled)
Induction lamps Heating: coil/resistance
LEDs IT equipment
Motors—linear (fixed) UPS
Motors—permanent magnet Equipment with inverters
(surge protection) , Voltage sensitive; , Voltage non-sensitive; , Somewhat voltage sensitive.
4. Power Quality Analysis
In order to understand the voltage profile and power quality of typical red meat processing facilities electricity usage data have been collected from two abattoirs; one in Western Australia (WA) and another in Queensland (QLD). Site analyses of electrical loads with PQ issues in particular voltage regulation, power factor, and total harmonic distortion (THD) was performed at each abattoir to determine whether there would be benefits from applying voltage optimisation. This detailed data analyses for operations during representative weekdays and weekends are presented in this section for both abattoirs, with consideration for individual transformers and the whole site.
Refrigeration (uncontrolled)
Energies 2017, 10, 1764 7 of 26
Table 3. Case studies from the meat processing industry [19–21].
Location Project Technology Energy Cost Savings($AU) *
PaybackPeriods Comments
Grannagh Ireland [19]
Dawn Pork & Bacon
Powerstar HV MAX
11.3% per year $88,222 per year
based on 17 c/kWh 3 years
Energy savings based on 6-week pre- and post-installation data
9.8% per year $76,244 per year
based on 17 c/kWh 3.4 years
Energy saving considered LED light and 6-week pre- and post-installation data
Holycross Ireland [19]
ABP Rathkeale Powerstar HV
MAX
10.7% per year $48,703 per year
based on 12.4 c/kWh 4.3 years
Energy saving based on 26 days pre- and post-installation data
Israel [20] The Moses
Chicken Farm PowerSines
125 A 11.5% per year 1.8 years
Voltage reduced from 235 V to 218 V
Yorkshire England [21]
Pig Rearing Farm
VO4 unit 100 Amp
12 MWh per year $2452
1 year Energy savings based on 4-month pre- and post-installation data
* All dollar values in this paper are in Australian dollars.
Table 4. Common voltage sensitive and non-sensitive equipment [22].
Equipment Type Voltage Sensitivity Equipment Type Voltage
Sensitivity
Incandescent lamps Motors—variable speed Fluorescent lamps (inductive
ballast) Refrigeration (uncontrolled) Fluorescent lamps (electronic
ballast) Refrigeration (controlled) Fluorescent Lamps (high
frequency) HVAC (flow controlled) High intensity discharge lamps (inductive ballast) HVAC (flow uncontrolled)
Induction lamps Heating: coil/resistance
LEDs IT equipment
Motors—linear (fixed) UPS
Motors—permanent magnet Equipment with inverters
(surge protection) , Voltage sensitive; , Voltage non-sensitive; , Somewhat voltage sensitive.
4. Power Quality Analysis
In order to understand the voltage profile and power quality of typical red meat processing facilities electricity usage data have been collected from two abattoirs; one in Western Australia (WA) and another in Queensland (QLD). Site analyses of electrical loads with PQ issues in particular voltage regulation, power factor, and total harmonic distortion (THD) was performed at each abattoir to determine whether there would be benefits from applying voltage optimisation. This detailed data analyses for operations during representative weekdays and weekends are presented in this section for both abattoirs, with consideration for individual transformers and the whole site.
Fluorescent lamps (electronic ballast)
Energies 2017, 10, 1764 7 of 26
Table 3. Case studies from the meat processing industry [19–21].
Location Project Technology Energy Cost Savings($AU) *
PaybackPeriods Comments
Grannagh Ireland [19]
Dawn Pork & Bacon
Powerstar HV MAX
11.3% per year $88,222 per year
based on 17 c/kWh 3 years
Energy savings based on 6-week pre- and post-installation data
9.8% per year $76,244 per year
based on 17 c/kWh 3.4 years
Energy saving considered LED light and 6-week pre- and post-installation data
Holycross Ireland [19]
ABP Rathkeale Powerstar HV
MAX
10.7% per year $48,703 per year
based on 12.4 c/kWh 4.3 years
Energy saving based on 26 days pre- and post-installation data
Israel [20] The Moses
Chicken Farm PowerSines
125 A 11.5% per year 1.8 years
Voltage reduced from 235 V to 218 V
Yorkshire England [21]
Pig Rearing Farm
VO4 unit 100 Amp
12 MWh per year $2452
1 year Energy savings based on 4-month pre- and post-installation data
* All dollar values in this paper are in Australian dollars.
Table 4. Common voltage sensitive and non-sensitive equipment [22].
Equipment Type Voltage Sensitivity Equipment Type Voltage
Sensitivity
Incandescent lamps Motors—variable speed Fluorescent lamps (inductive
ballast) Refrigeration (uncontrolled) Fluorescent lamps (electronic
ballast) Refrigeration (controlled) Fluorescent Lamps (high
frequency) HVAC (flow controlled) High intensity discharge lamps (inductive ballast) HVAC (flow uncontrolled)
Induction lamps Heating: coil/resistance
LEDs IT equipment
Motors—linear (fixed) UPS
Motors—permanent magnet Equipment with inverters
(surge protection) , Voltage sensitive; , Voltage non-sensitive; , Somewhat voltage sensitive.
4. Power Quality Analysis
In order to understand the voltage profile and power quality of typical red meat processing facilities electricity usage data have been collected from two abattoirs; one in Western Australia (WA) and another in Queensland (QLD). Site analyses of electrical loads with PQ issues in particular voltage regulation, power factor, and total harmonic distortion (THD) was performed at each abattoir to determine whether there would be benefits from applying voltage optimisation. This detailed data analyses for operations during representative weekdays and weekends are presented in this section for both abattoirs, with consideration for individual transformers and the whole site.
Refrigeration (controlled)
Energies 2017, 10, 1764 7 of 26
Table 3. Case studies from the meat processing industry [19–21].
Location Project Technology Energy Cost Savings($AU) *
PaybackPeriods Comments
Grannagh Ireland [19]
Dawn Pork & Bacon
Powerstar HV MAX
11.3% per year $88,222 per year
based on 17 c/kWh 3 years
Energy savings based on 6-week pre- and post-installation data
9.8% per year $76,244 per year
based on 17 c/kWh 3.4 years
Energy saving considered LED light and 6-week pre- and post-installation data
Holycross Ireland [19]
ABP Rathkeale Powerstar HV
MAX
10.7% per year $48,703 per year
based on 12.4 c/kWh 4.3 years
Energy saving based on 26 days pre- and post-installation data
Israel [20] The Moses
Chicken Farm PowerSines
125 A 11.5% per year 1.8 years
Voltage reduced from 235 V to 218 V
Yorkshire England [21]
Pig Rearing Farm
VO4 unit 100 Amp
12 MWh per year $2452
1 year Energy savings based on 4-month pre- and post-installation data
* All dollar values in this paper are in Australian dollars.
Table 4. Common voltage sensitive and non-sensitive equipment [22].
Equipment Type Voltage Sensitivity Equipment Type Voltage
Sensitivity
Incandescent lamps Motors—variable speed Fluorescent lamps (inductive
ballast) Refrigeration (uncontrolled) Fluorescent lamps (electronic
ballast) Refrigeration (controlled) Fluorescent Lamps (high
frequency) HVAC (flow controlled) High intensity discharge lamps (inductive ballast) HVAC (flow uncontrolled)
Induction lamps Heating: coil/resistance
LEDs IT equipment
Motors—linear (fixed) UPS
Motors—permanent magnet Equipment with inverters
(surge protection) , Voltage sensitive; , Voltage non-sensitive; , Somewhat voltage sensitive.
4. Power Quality Analysis
In order to understand the voltage profile and power quality of typical red meat processing facilities electricity usage data have been collected from two abattoirs; one in Western Australia (WA) and another in Queensland (QLD). Site analyses of electrical loads with PQ issues in particular voltage regulation, power factor, and total harmonic distortion (THD) was performed at each abattoir to determine whether there would be benefits from applying voltage optimisation. This detailed data analyses for operations during representative weekdays and weekends are presented in this section for both abattoirs, with consideration for individual transformers and the whole site.
Fluorescent Lamps (high frequency)
Energies 2017, 10, 1764 7 of 26
Table 3. Case studies from the meat processing industry [19–21].
Location Project Technology Energy Cost Savings($AU) *
PaybackPeriods Comments
Grannagh Ireland [19]
Dawn Pork & Bacon
Powerstar HV MAX
11.3% per year $88,222 per year
based on 17 c/kWh 3 years
Energy savings based on 6-week pre- and post-installation data
9.8% per year $76,244 per year
based on 17 c/kWh 3.4 years
Energy saving considered LED light and 6-week pre- and post-installation data
Holycross Ireland [19]
ABP Rathkeale Powerstar HV
MAX
10.7% per year $48,703 per year
based on 12.4 c/kWh 4.3 years
Energy saving based on 26 days pre- and post-installation data
Israel [20] The Moses
Chicken Farm PowerSines
125 A 11.5% per year 1.8 years
Voltage reduced from 235 V to 218 V
Yorkshire England [21]
Pig Rearing Farm
VO4 unit 100 Amp
12 MWh per year $2452
1 year Energy savings based on 4-month pre- and post-installation data
* All dollar values in this paper are in Australian dollars.
Table 4. Common voltage sensitive and non-sensitive equipment [22].
Equipment Type Voltage Sensitivity Equipment Type Voltage
Sensitivity
Incandescent lamps Motors—variable speed Fluorescent lamps (inductive
ballast) Refrigeration (uncontrolled) Fluorescent lamps (electronic
ballast) Refrigeration (controlled) Fluorescent Lamps (high
frequency) HVAC (flow controlled) High intensity discharge lamps (inductive ballast) HVAC (flow uncontrolled)
Induction lamps Heating: coil/resistance
LEDs IT equipment
Motors—linear (fixed) UPS
Motors—permanent magnet Equipment with inverters
(surge protection) , Voltage sensitive; , Voltage non-sensitive; , Somewhat voltage sensitive.
4. Power Quality Analysis
In order to understand the voltage profile and power quality of typical red meat processing facilities electricity usage data have been collected from two abattoirs; one in Western Australia (WA) and another in Queensland (QLD). Site analyses of electrical loads with PQ issues in particular voltage regulation, power factor, and total harmonic distortion (THD) was performed at each abattoir to determine whether there would be benefits from applying voltage optimisation. This detailed data analyses for operations during representative weekdays and weekends are presented in this section for both abattoirs, with consideration for individual transformers and the whole site.
HVAC (flow controlled)
Energies 2017, 10, 1764 7 of 26
Table 3. Case studies from the meat processing industry [19–21].
Location Project Technology Energy Cost Savings($AU) *
PaybackPeriods Comments
Grannagh Ireland [19]
Dawn Pork & Bacon
Powerstar HV MAX
11.3% per year $88,222 per year
based on 17 c/kWh 3 years
Energy savings based on 6-week pre- and post-installation data
9.8% per year $76,244 per year
based on 17 c/kWh 3.4 years
Energy saving considered LED light and 6-week pre- and post-installation data
Holycross Ireland [19]
ABP Rathkeale Powerstar HV
MAX
10.7% per year $48,703 per year
based on 12.4 c/kWh 4.3 years
Energy saving based on 26 days pre- and post-installation data
Israel [20] The Moses
Chicken Farm PowerSines
125 A 11.5% per year 1.8 years
Voltage reduced from 235 V to 218 V
Yorkshire England [21]
Pig Rearing Farm
VO4 unit 100 Amp
12 MWh per year $2452
1 year Energy savings based on 4-month pre- and post-installation data
* All dollar values in this paper are in Australian dollars.
Table 4. Common voltage sensitive and non-sensitive equipment [22].
Equipment Type Voltage Sensitivity Equipment Type Voltage
Sensitivity
Incandescent lamps Motors—variable speed Fluorescent lamps (inductive
ballast) Refrigeration (uncontrolled) Fluorescent lamps (electronic
ballast) Refrigeration (controlled) Fluorescent Lamps (high
frequency) HVAC (flow controlled) High intensity discharge lamps (inductive ballast) HVAC (flow uncontrolled)
Induction lamps Heating: coil/resistance
LEDs IT equipment
Motors—linear (fixed) UPS
Motors—permanent magnet Equipment with inverters
(surge protection) , Voltage sensitive; , Voltage non-sensitive; , Somewhat voltage sensitive.
4. Power Quality Analysis
In order to understand the voltage profile and power quality of typical red meat processing facilities electricity usage data have been collected from two abattoirs; one in Western Australia (WA) and another in Queensland (QLD). Site analyses of electrical loads with PQ issues in particular voltage regulation, power factor, and total harmonic distortion (THD) was performed at each abattoir to determine whether there would be benefits from applying voltage optimisation. This detailed data analyses for operations during representative weekdays and weekends are presented in this section for both abattoirs, with consideration for individual transformers and the whole site.
High intensity discharge lamps(inductive ballast)
Energies 2017, 10, 1764 7 of 26
Table 3. Case studies from the meat processing industry [19–21].
Location Project Technology Energy Cost Savings($AU) *
PaybackPeriods Comments
Grannagh Ireland [19]
Dawn Pork & Bacon
Powerstar HV MAX
11.3% per year $88,222 per year
based on 17 c/kWh 3 years
Energy savings based on 6-week pre- and post-installation data
9.8% per year $76,244 per year
based on 17 c/kWh 3.4 years
Energy saving considered LED light and 6-week pre- and post-installation data
Holycross Ireland [19]
ABP Rathkeale Powerstar HV
MAX
10.7% per year $48,703 per year
based on 12.4 c/kWh 4.3 years
Energy saving based on 26 days pre- and post-installation data
Israel [20] The Moses
Chicken Farm PowerSines
125 A 11.5% per year 1.8 years
Voltage reduced from 235 V to 218 V
Yorkshire England [21]
Pig Rearing Farm
VO4 unit 100 Amp
12 MWh per year $2452
1 year Energy savings based on 4-month pre- and post-installation data
* All dollar values in this paper are in Australian dollars.
Table 4. Common voltage sensitive and non-sensitive equipment [22].
Equipment Type Voltage Sensitivity Equipment Type Voltage
Sensitivity
Incandescent lamps Motors—variable speed Fluorescent lamps (inductive
ballast) Refrigeration (uncontrolled) Fluorescent lamps (electronic
ballast) Refrigeration (controlled) Fluorescent Lamps (high
frequency) HVAC (flow controlled) High intensity discharge lamps (inductive ballast) HVAC (flow uncontrolled)
Induction lamps Heating: coil/resistance
LEDs IT equipment
Motors—linear (fixed) UPS
Motors—permanent magnet Equipment with inverters
(surge protection) , Voltage sensitive; , Voltage non-sensitive; , Somewhat voltage sensitive.
4. Power Quality Analysis
In order to understand the voltage profile and power quality of typical red meat processing facilities electricity usage data have been collected from two abattoirs; one in Western Australia (WA) and another in Queensland (QLD). Site analyses of electrical loads with PQ issues in particular voltage regulation, power factor, and total harmonic distortion (THD) was performed at each abattoir to determine whether there would be benefits from applying voltage optimisation. This detailed data analyses for operations during representative weekdays and weekends are presented in this section for both abattoirs, with consideration for individual transformers and the whole site.
HVAC (flow uncontrolled)
Energies 2017, 10, 1764 7 of 26
Table 3. Case studies from the meat processing industry [19–21].
Location Project Technology Energy Cost Savings($AU) *
PaybackPeriods Comments
Grannagh Ireland [19]
Dawn Pork & Bacon
Powerstar HV MAX
11.3% per year $88,222 per year
based on 17 c/kWh 3 years
Energy savings based on 6-week pre- and post-installation data
9.8% per year $76,244 per year
based on 17 c/kWh 3.4 years
Energy saving considered LED light and 6-week pre- and post-installation data
Holycross Ireland [19]
ABP Rathkeale Powerstar HV
MAX
10.7% per year $48,703 per year
based on 12.4 c/kWh 4.3 years
Energy saving based on 26 days pre- and post-installation data
Israel [20] The Moses
Chicken Farm PowerSines
125 A 11.5% per year 1.8 years
Voltage reduced from 235 V to 218 V
Yorkshire England [21]
Pig Rearing Farm
VO4 unit 100 Amp
12 MWh per year $2452
1 year Energy savings based on 4-month pre- and post-installation data
* All dollar values in this paper are in Australian dollars.
Table 4. Common voltage sensitive and non-sensitive equipment [22].
Equipment Type Voltage Sensitivity Equipment Type Voltage
Sensitivity
Incandescent lamps Motors—variable speed Fluorescent lamps (inductive
ballast) Refrigeration (uncontrolled) Fluorescent lamps (electronic
ballast) Refrigeration (controlled) Fluorescent Lamps (high
frequency) HVAC (flow controlled) High intensity discharge lamps (inductive ballast) HVAC (flow uncontrolled)
Induction lamps Heating: coil/resistance
LEDs IT equipment
Motors—linear (fixed) UPS
Motors—permanent magnet Equipment with inverters
(surge protection) , Voltage sensitive; , Voltage non-sensitive; , Somewhat voltage sensitive.
4. Power Quality Analysis
In order to understand the voltage profile and power quality of typical red meat processing facilities electricity usage data have been collected from two abattoirs; one in Western Australia (WA) and another in Queensland (QLD). Site analyses of electrical loads with PQ issues in particular voltage regulation, power factor, and total harmonic distortion (THD) was performed at each abattoir to determine whether there would be benefits from applying voltage optimisation. This detailed data analyses for operations during representative weekdays and weekends are presented in this section for both abattoirs, with consideration for individual transformers and the whole site.
Induction lamps
Energies 2017, 10, 1764 7 of 26
Table 3. Case studies from the meat processing industry [19–21].
Location Project Technology Energy Cost Savings($AU) *
PaybackPeriods Comments
Grannagh Ireland [19]
Dawn Pork & Bacon
Powerstar HV MAX
11.3% per year $88,222 per year
based on 17 c/kWh 3 years
Energy savings based on 6-week pre- and post-installation data
9.8% per year $76,244 per year
based on 17 c/kWh 3.4 years
Energy saving considered LED light and 6-week pre- and post-installation data
Holycross Ireland [19]
ABP Rathkeale Powerstar HV
MAX
10.7% per year $48,703 per year
based on 12.4 c/kWh 4.3 years
Energy saving based on 26 days pre- and post-installation data
Israel [20] The Moses
Chicken Farm PowerSines
125 A 11.5% per year 1.8 years
Voltage reduced from 235 V to 218 V
Yorkshire England [21]
Pig Rearing Farm
VO4 unit 100 Amp
12 MWh per year $2452
1 year Energy savings based on 4-month pre- and post-installation data
* All dollar values in this paper are in Australian dollars.
Table 4. Common voltage sensitive and non-sensitive equipment [22].
Equipment Type Voltage Sensitivity Equipment Type Voltage
Sensitivity
Incandescent lamps Motors—variable speed Fluorescent lamps (inductive
ballast) Refrigeration (uncontrolled) Fluorescent lamps (electronic
ballast) Refrigeration (controlled) Fluorescent Lamps (high
frequency) HVAC (flow controlled) High intensity discharge lamps (inductive ballast) HVAC (flow uncontrolled)
Induction lamps Heating: coil/resistance
LEDs IT equipment
Motors—linear (fixed) UPS
Motors—permanent magnet Equipment with inverters
(surge protection) , Voltage sensitive; , Voltage non-sensitive; , Somewhat voltage sensitive.
4. Power Quality Analysis
In order to understand the voltage profile and power quality of typical red meat processing facilities electricity usage data have been collected from two abattoirs; one in Western Australia (WA) and another in Queensland (QLD). Site analyses of electrical loads with PQ issues in particular voltage regulation, power factor, and total harmonic distortion (THD) was performed at each abattoir to determine whether there would be benefits from applying voltage optimisation. This detailed data analyses for operations during representative weekdays and weekends are presented in this section for both abattoirs, with consideration for individual transformers and the whole site.
Heating: coil/resistance
Energies 2017, 10, 1764 7 of 26
Table 3. Case studies from the meat processing industry [19–21].
Location Project Technology Energy Cost Savings($AU) *
PaybackPeriods Comments
Grannagh Ireland [19]
Dawn Pork & Bacon
Powerstar HV MAX
11.3% per year $88,222 per year
based on 17 c/kWh 3 years
Energy savings based on 6-week pre- and post-installation data
9.8% per year $76,244 per year
based on 17 c/kWh 3.4 years
Energy saving considered LED light and 6-week pre- and post-installation data
Holycross Ireland [19]
ABP Rathkeale Powerstar HV
MAX
10.7% per year $48,703 per year
based on 12.4 c/kWh 4.3 years
Energy saving based on 26 days pre- and post-installation data
Israel [20] The Moses
Chicken Farm PowerSines
125 A 11.5% per year 1.8 years
Voltage reduced from 235 V to 218 V
Yorkshire England [21]
Pig Rearing Farm
VO4 unit 100 Amp
12 MWh per year $2452
1 year Energy savings based on 4-month pre- and post-installation data
* All dollar values in this paper are in Australian dollars.
Table 4. Common voltage sensitive and non-sensitive equipment [22].
Equipment Type Voltage Sensitivity Equipment Type Voltage
Sensitivity
Incandescent lamps Motors—variable speed Fluorescent lamps (inductive
ballast) Refrigeration (uncontrolled) Fluorescent lamps (electronic
ballast) Refrigeration (controlled) Fluorescent Lamps (high
frequency) HVAC (flow controlled) High intensity discharge lamps (inductive ballast) HVAC (flow uncontrolled)
Induction lamps Heating: coil/resistance
LEDs IT equipment
Motors—linear (fixed) UPS
Motors—permanent magnet Equipment with inverters
(surge protection) , Voltage sensitive; , Voltage non-sensitive; , Somewhat voltage sensitive.
4. Power Quality Analysis
In order to understand the voltage profile and power quality of typical red meat processing facilities electricity usage data have been collected from two abattoirs; one in Western Australia (WA) and another in Queensland (QLD). Site analyses of electrical loads with PQ issues in particular voltage regulation, power factor, and total harmonic distortion (THD) was performed at each abattoir to determine whether there would be benefits from applying voltage optimisation. This detailed data analyses for operations during representative weekdays and weekends are presented in this section for both abattoirs, with consideration for individual transformers and the whole site.
LEDs
Energies 2017, 10, 1764 7 of 26
Table 3. Case studies from the meat processing industry [19–21].
Location Project Technology Energy Cost Savings($AU) *
PaybackPeriods Comments
Grannagh Ireland [19]
Dawn Pork & Bacon
Powerstar HV MAX
11.3% per year $88,222 per year
based on 17 c/kWh 3 years
Energy savings based on 6-week pre- and post-installation data
9.8% per year $76,244 per year
based on 17 c/kWh 3.4 years
Energy saving considered LED light and 6-week pre- and post-installation data
Holycross Ireland [19]
ABP Rathkeale Powerstar HV
MAX
10.7% per year $48,703 per year
based on 12.4 c/kWh 4.3 years
Energy saving based on 26 days pre- and post-installation data
Israel [20] The Moses
Chicken Farm PowerSines
125 A 11.5% per year 1.8 years
Voltage reduced from 235 V to 218 V
Yorkshire England [21]
Pig Rearing Farm
VO4 unit 100 Amp
12 MWh per year $2452
1 year Energy savings based on 4-month pre- and post-installation data
* All dollar values in this paper are in Australian dollars.
Table 4. Common voltage sensitive and non-sensitive equipment [22].
Equipment Type Voltage Sensitivity Equipment Type Voltage
Sensitivity
Incandescent lamps Motors—variable speed Fluorescent lamps (inductive
ballast) Refrigeration (uncontrolled) Fluorescent lamps (electronic
ballast) Refrigeration (controlled) Fluorescent Lamps (high
frequency) HVAC (flow controlled) High intensity discharge lamps (inductive ballast) HVAC (flow uncontrolled)
Induction lamps Heating: coil/resistance
LEDs IT equipment
Motors—linear (fixed) UPS
Motors—permanent magnet Equipment with inverters
(surge protection) , Voltage sensitive; , Voltage non-sensitive; , Somewhat voltage sensitive.
4. Power Quality Analysis
In order to understand the voltage profile and power quality of typical red meat processing facilities electricity usage data have been collected from two abattoirs; one in Western Australia (WA) and another in Queensland (QLD). Site analyses of electrical loads with PQ issues in particular voltage regulation, power factor, and total harmonic distortion (THD) was performed at each abattoir to determine whether there would be benefits from applying voltage optimisation. This detailed data analyses for operations during representative weekdays and weekends are presented in this section for both abattoirs, with consideration for individual transformers and the whole site.
IT equipment
Energies 2017, 10, 1764 7 of 26
Table 3. Case studies from the meat processing industry [19–21].
Location Project Technology Energy Cost Savings($AU) *
PaybackPeriods Comments
Grannagh Ireland [19]
Dawn Pork & Bacon
Powerstar HV MAX
11.3% per year $88,222 per year
based on 17 c/kWh 3 years
Energy savings based on 6-week pre- and post-installation data
9.8% per year $76,244 per year
based on 17 c/kWh 3.4 years
Energy saving considered LED light and 6-week pre- and post-installation data
Holycross Ireland [19]
ABP Rathkeale Powerstar HV
MAX
10.7% per year $48,703 per year
based on 12.4 c/kWh 4.3 years
Energy saving based on 26 days pre- and post-installation data
Israel [20] The Moses
Chicken Farm PowerSines
125 A 11.5% per year 1.8 years
Voltage reduced from 235 V to 218 V
Yorkshire England [21]
Pig Rearing Farm
VO4 unit 100 Amp
12 MWh per year $2452
1 year Energy savings based on 4-month pre- and post-installation data
* All dollar values in this paper are in Australian dollars.
Table 4. Common voltage sensitive and non-sensitive equipment [22].
Equipment Type Voltage Sensitivity Equipment Type Voltage
Sensitivity
Incandescent lamps Motors—variable speed Fluorescent lamps (inductive
ballast) Refrigeration (uncontrolled) Fluorescent lamps (electronic
ballast) Refrigeration (controlled) Fluorescent Lamps (high
frequency) HVAC (flow controlled) High intensity discharge lamps (inductive ballast) HVAC (flow uncontrolled)
Induction lamps Heating: coil/resistance
LEDs IT equipment
Motors—linear (fixed) UPS
Motors—permanent magnet Equipment with inverters
(surge protection) , Voltage sensitive; , Voltage non-sensitive; , Somewhat voltage sensitive.
4. Power Quality Analysis
In order to understand the voltage profile and power quality of typical red meat processing facilities electricity usage data have been collected from two abattoirs; one in Western Australia (WA) and another in Queensland (QLD). Site analyses of electrical loads with PQ issues in particular voltage regulation, power factor, and total harmonic distortion (THD) was performed at each abattoir to determine whether there would be benefits from applying voltage optimisation. This detailed data analyses for operations during representative weekdays and weekends are presented in this section for both abattoirs, with consideration for individual transformers and the whole site.
Motors—linear (fixed)
Energies 2017, 10, 1764 7 of 26
Table 3. Case studies from the meat processing industry [19–21].
Location Project Technology Energy Cost Savings($AU) *
PaybackPeriods Comments
Grannagh Ireland [19]
Dawn Pork & Bacon
Powerstar HV MAX
11.3% per year $88,222 per year
based on 17 c/kWh 3 years
Energy savings based on 6-week pre- and post-installation data
9.8% per year $76,244 per year
based on 17 c/kWh 3.4 years
Energy saving considered LED light and 6-week pre- and post-installation data
Holycross Ireland [19]
ABP Rathkeale Powerstar HV
MAX
10.7% per year $48,703 per year
based on 12.4 c/kWh 4.3 years
Energy saving based on 26 days pre- and post-installation data
Israel [20] The Moses
Chicken Farm PowerSines
125 A 11.5% per year 1.8 years
Voltage reduced from 235 V to 218 V
Yorkshire England [21]
Pig Rearing Farm
VO4 unit 100 Amp
12 MWh per year $2452
1 year Energy savings based on 4-month pre- and post-installation data
* All dollar values in this paper are in Australian dollars.
Table 4. Common voltage sensitive and non-sensitive equipment [22].
Equipment Type Voltage Sensitivity Equipment Type Voltage
Sensitivity
Incandescent lamps Motors—variable speed Fluorescent lamps (inductive
ballast) Refrigeration (uncontrolled) Fluorescent lamps (electronic
ballast) Refrigeration (controlled) Fluorescent Lamps (high
frequency) HVAC (flow controlled) High intensity discharge lamps (inductive ballast) HVAC (flow uncontrolled)
Induction lamps Heating: coil/resistance
LEDs IT equipment
Motors—linear (fixed) UPS
Motors—permanent magnet Equipment with inverters
(surge protection) , Voltage sensitive; , Voltage non-sensitive; , Somewhat voltage sensitive.
4. Power Quality Analysis
In order to understand the voltage profile and power quality of typical red meat processing facilities electricity usage data have been collected from two abattoirs; one in Western Australia (WA) and another in Queensland (QLD). Site analyses of electrical loads with PQ issues in particular voltage regulation, power factor, and total harmonic distortion (THD) was performed at each abattoir to determine whether there would be benefits from applying voltage optimisation. This detailed data analyses for operations during representative weekdays and weekends are presented in this section for both abattoirs, with consideration for individual transformers and the whole site.
UPS
Energies 2017, 10, 1764 7 of 26
Table 3. Case studies from the meat processing industry [19–21].
Location Project Technology Energy Cost Savings($AU) *
PaybackPeriods Comments
Grannagh Ireland [19]
Dawn Pork & Bacon
Powerstar HV MAX
11.3% per year $88,222 per year
based on 17 c/kWh 3 years
Energy savings based on 6-week pre- and post-installation data
9.8% per year $76,244 per year
based on 17 c/kWh 3.4 years
Energy saving considered LED light and 6-week pre- and post-installation data
Holycross Ireland [19]
ABP Rathkeale Powerstar HV
MAX
10.7% per year $48,703 per year
based on 12.4 c/kWh 4.3 years
Energy saving based on 26 days pre- and post-installation data
Israel [20] The Moses
Chicken Farm PowerSines
125 A 11.5% per year 1.8 years
Voltage reduced from 235 V to 218 V
Yorkshire England [21]
Pig Rearing Farm
VO4 unit 100 Amp
12 MWh per year $2452
1 year Energy savings based on 4-month pre- and post-installation data
* All dollar values in this paper are in Australian dollars.
Table 4. Common voltage sensitive and non-sensitive equipment [22].
Equipment Type Voltage Sensitivity Equipment Type Voltage
Sensitivity
Incandescent lamps Motors—variable speed Fluorescent lamps (inductive
ballast) Refrigeration (uncontrolled) Fluorescent lamps (electronic
ballast) Refrigeration (controlled) Fluorescent Lamps (high
frequency) HVAC (flow controlled) High intensity discharge lamps (inductive ballast) HVAC (flow uncontrolled)
Induction lamps Heating: coil/resistance
LEDs IT equipment
Motors—linear (fixed) UPS
Motors—permanent magnet Equipment with inverters
(surge protection) , Voltage sensitive; , Voltage non-sensitive; , Somewhat voltage sensitive.
4. Power Quality Analysis
In order to understand the voltage profile and power quality of typical red meat processing facilities electricity usage data have been collected from two abattoirs; one in Western Australia (WA) and another in Queensland (QLD). Site analyses of electrical loads with PQ issues in particular voltage regulation, power factor, and total harmonic distortion (THD) was performed at each abattoir to determine whether there would be benefits from applying voltage optimisation. This detailed data analyses for operations during representative weekdays and weekends are presented in this section for both abattoirs, with consideration for individual transformers and the whole site.
Motors—permanent magnet
Energies 2017, 10, 1764 7 of 26
Table 3. Case studies from the meat processing industry [19–21].
Location Project Technology Energy Cost Savings($AU) *
PaybackPeriods Comments
Grannagh Ireland [19]
Dawn Pork & Bacon
Powerstar HV MAX
11.3% per year $88,222 per year
based on 17 c/kWh 3 years
Energy savings based on 6-week pre- and post-installation data
9.8% per year $76,244 per year
based on 17 c/kWh 3.4 years
Energy saving considered LED light and 6-week pre- and post-installation data
Holycross Ireland [19]
ABP Rathkeale Powerstar HV
MAX
10.7% per year $48,703 per year
based on 12.4 c/kWh 4.3 years
Energy saving based on 26 days pre- and post-installation data
Israel [20] The Moses
Chicken Farm PowerSines
125 A 11.5% per year 1.8 years
Voltage reduced from 235 V to 218 V
Yorkshire England [21]
Pig Rearing Farm
VO4 unit 100 Amp
12 MWh per year $2452
1 year Energy savings based on 4-month pre- and post-installation data
* All dollar values in this paper are in Australian dollars.
Table 4. Common voltage sensitive and non-sensitive equipment [22].
Equipment Type Voltage Sensitivity Equipment Type Voltage
Sensitivity
Incandescent lamps Motors—variable speed Fluorescent lamps (inductive
ballast) Refrigeration (uncontrolled) Fluorescent lamps (electronic
ballast) Refrigeration (controlled) Fluorescent Lamps (high
frequency) HVAC (flow controlled) High intensity discharge lamps (inductive ballast) HVAC (flow uncontrolled)
Induction lamps Heating: coil/resistance
LEDs IT equipment
Motors—linear (fixed) UPS
Motors—permanent magnet Equipment with inverters
(surge protection) , Voltage sensitive; , Voltage non-sensitive; , Somewhat voltage sensitive.
4. Power Quality Analysis
In order to understand the voltage profile and power quality of typical red meat processing facilities electricity usage data have been collected from two abattoirs; one in Western Australia (WA) and another in Queensland (QLD). Site analyses of electrical loads with PQ issues in particular voltage regulation, power factor, and total harmonic distortion (THD) was performed at each abattoir to determine whether there would be benefits from applying voltage optimisation. This detailed data analyses for operations during representative weekdays and weekends are presented in this section for both abattoirs, with consideration for individual transformers and the whole site.
Equipment with inverters(surge protection)
Energies 2017, 10, 1764 7 of 26
Table 3. Case studies from the meat processing industry [19–21].
Location Project Technology Energy Cost Savings($AU) *
PaybackPeriods Comments
Grannagh Ireland [19]
Dawn Pork & Bacon
Powerstar HV MAX
11.3% per year $88,222 per year
based on 17 c/kWh 3 years
Energy savings based on 6-week pre- and post-installation data
9.8% per year $76,244 per year
based on 17 c/kWh 3.4 years
Energy saving considered LED light and 6-week pre- and post-installation data
Holycross Ireland [19]
ABP Rathkeale Powerstar HV
MAX
10.7% per year $48,703 per year
based on 12.4 c/kWh 4.3 years
Energy saving based on 26 days pre- and post-installation data
Israel [20] The Moses
Chicken Farm PowerSines
125 A 11.5% per year 1.8 years
Voltage reduced from 235 V to 218 V
Yorkshire England [21]
Pig Rearing Farm
VO4 unit 100 Amp
12 MWh per year $2452
1 year Energy savings based on 4-month pre- and post-installation data
* All dollar values in this paper are in Australian dollars.
Table 4. Common voltage sensitive and non-sensitive equipment [22].
Equipment Type Voltage Sensitivity Equipment Type Voltage
Sensitivity
Incandescent lamps Motors—variable speed Fluorescent lamps (inductive
ballast) Refrigeration (uncontrolled) Fluorescent lamps (electronic
ballast) Refrigeration (controlled) Fluorescent Lamps (high
frequency) HVAC (flow controlled) High intensity discharge lamps (inductive ballast) HVAC (flow uncontrolled)
Induction lamps Heating: coil/resistance
LEDs IT equipment
Motors—linear (fixed) UPS
Motors—permanent magnet Equipment with inverters
(surge protection) , Voltage sensitive; , Voltage non-sensitive; , Somewhat voltage sensitive.
4. Power Quality Analysis
In order to understand the voltage profile and power quality of typical red meat processing facilities electricity usage data have been collected from two abattoirs; one in Western Australia (WA) and another in Queensland (QLD). Site analyses of electrical loads with PQ issues in particular voltage regulation, power factor, and total harmonic distortion (THD) was performed at each abattoir to determine whether there would be benefits from applying voltage optimisation. This detailed data analyses for operations during representative weekdays and weekends are presented in this section for both abattoirs, with consideration for individual transformers and the whole site.
, Voltage sensitive;
Energies 2017, 10, 1764 7 of 26
Table 3. Case studies from the meat processing industry [19–21].
Location Project Technology Energy Cost Savings($AU) *
PaybackPeriods Comments
Grannagh Ireland [19]
Dawn Pork & Bacon
Powerstar HV MAX
11.3% per year $88,222 per year
based on 17 c/kWh 3 years
Energy savings based on 6-week pre- and post-installation data
9.8% per year $76,244 per year
based on 17 c/kWh 3.4 years
Energy saving considered LED light and 6-week pre- and post-installation data
Holycross Ireland [19]
ABP Rathkeale Powerstar HV
MAX
10.7% per year $48,703 per year
based on 12.4 c/kWh 4.3 years
Energy saving based on 26 days pre- and post-installation data
Israel [20] The Moses
Chicken Farm PowerSines
125 A 11.5% per year 1.8 years
Voltage reduced from 235 V to 218 V
Yorkshire England [21]
Pig Rearing Farm
VO4 unit 100 Amp
12 MWh per year $2452
1 year Energy savings based on 4-month pre- and post-installation data
* All dollar values in this paper are in Australian dollars.
Table 4. Common voltage sensitive and non-sensitive equipment [22].
Equipment Type Voltage Sensitivity Equipment Type Voltage
Sensitivity
Incandescent lamps Motors—variable speed Fluorescent lamps (inductive
ballast) Refrigeration (uncontrolled) Fluorescent lamps (electronic
ballast) Refrigeration (controlled) Fluorescent Lamps (high
frequency) HVAC (flow controlled) High intensity discharge lamps (inductive ballast) HVAC (flow uncontrolled)
Induction lamps Heating: coil/resistance
LEDs IT equipment
Motors—linear (fixed) UPS
Motors—permanent magnet Equipment with inverters
(surge protection) , Voltage sensitive; , Voltage non-sensitive; , Somewhat voltage sensitive.
4. Power Quality Analysis
In order to understand the voltage profile and power quality of typical red meat processing facilities electricity usage data have been collected from two abattoirs; one in Western Australia (WA) and another in Queensland (QLD). Site analyses of electrical loads with PQ issues in particular voltage regulation, power factor, and total harmonic distortion (THD) was performed at each abattoir to determine whether there would be benefits from applying voltage optimisation. This detailed data analyses for operations during representative weekdays and weekends are presented in this section for both abattoirs, with consideration for individual transformers and the whole site.
, Voltage non-sensitive;
Energies 2017, 10, 1764 7 of 26
Table 3. Case studies from the meat processing industry [19–21].
Location Project Technology Energy Cost Savings($AU) *
PaybackPeriods Comments
Grannagh Ireland [19]
Dawn Pork & Bacon
Powerstar HV MAX
11.3% per year $88,222 per year
based on 17 c/kWh 3 years
Energy savings based on 6-week pre- and post-installation data
9.8% per year $76,244 per year
based on 17 c/kWh 3.4 years
Energy saving considered LED light and 6-week pre- and post-installation data
Holycross Ireland [19]
ABP Rathkeale Powerstar HV
MAX
10.7% per year $48,703 per year
based on 12.4 c/kWh 4.3 years
Energy saving based on 26 days pre- and post-installation data
Israel [20] The Moses
Chicken Farm PowerSines
125 A 11.5% per year 1.8 years
Voltage reduced from 235 V to 218 V
Yorkshire England [21]
Pig Rearing Farm
VO4 unit 100 Amp
12 MWh per year $2452
1 year Energy savings based on 4-month pre- and post-installation data
* All dollar values in this paper are in Australian dollars.
Table 4. Common voltage sensitive and non-sensitive equipment [22].
Equipment Type Voltage Sensitivity Equipment Type Voltage
Sensitivity
Incandescent lamps Motors—variable speed Fluorescent lamps (inductive
ballast) Refrigeration (uncontrolled) Fluorescent lamps (electronic
ballast) Refrigeration (controlled) Fluorescent Lamps (high
frequency) HVAC (flow controlled) High intensity discharge lamps (inductive ballast) HVAC (flow uncontrolled)
Induction lamps Heating: coil/resistance
LEDs IT equipment
Motors—linear (fixed) UPS
Motors—permanent magnet Equipment with inverters
(surge protection) , Voltage sensitive; , Voltage non-sensitive; , Somewhat voltage sensitive.
4. Power Quality Analysis
In order to understand the voltage profile and power quality of typical red meat processing facilities electricity usage data have been collected from two abattoirs; one in Western Australia (WA) and another in Queensland (QLD). Site analyses of electrical loads with PQ issues in particular voltage regulation, power factor, and total harmonic distortion (THD) was performed at each abattoir to determine whether there would be benefits from applying voltage optimisation. This detailed data analyses for operations during representative weekdays and weekends are presented in this section for both abattoirs, with consideration for individual transformers and the whole site.
, Somewhat voltage sensitive.
4. Power Quality Analysis
In order to understand the voltage profile and power quality of typical red meat processingfacilities electricity usage data have been collected from two abattoirs; one in Western Australia (WA)and another in Queensland (QLD). Site analyses of electrical loads with PQ issues in particular voltageregulation, power factor, and total harmonic distortion (THD) was performed at each abattoir todetermine whether there would be benefits from applying voltage optimisation. This detailed dataanalyses for operations during representative weekdays and weekends are presented in this sectionfor both abattoirs, with consideration for individual transformers and the whole site.
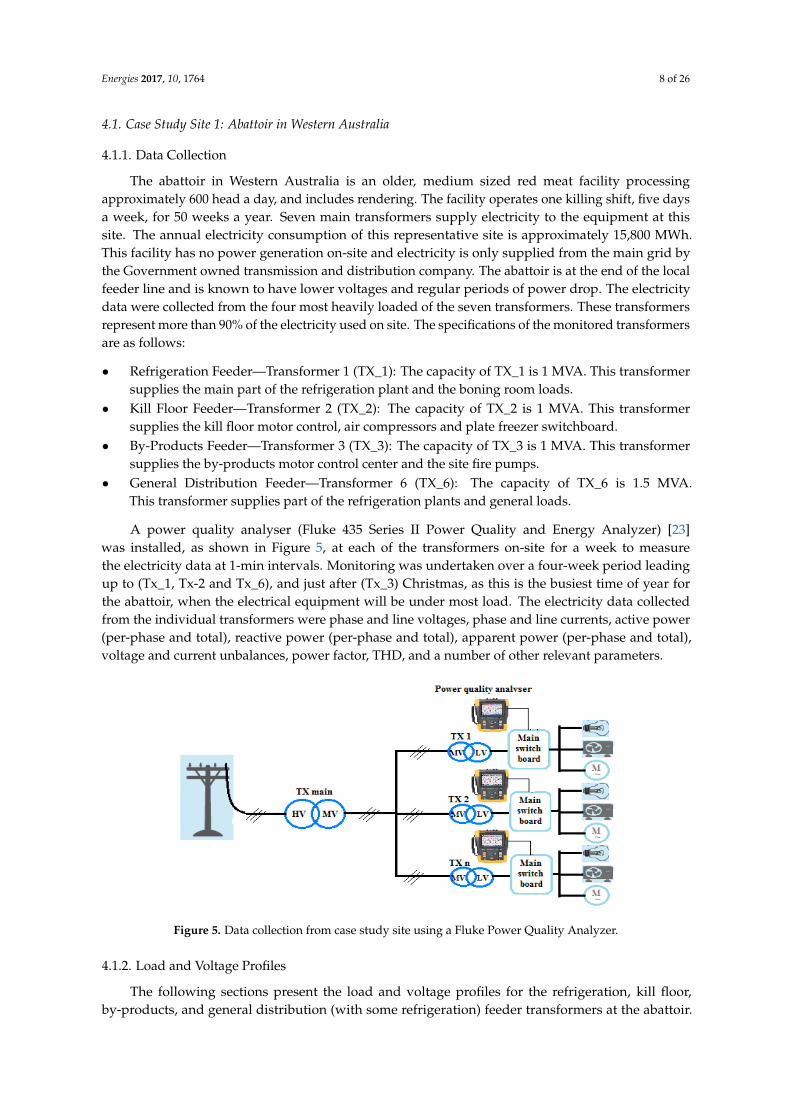
Energies 2017, 10, 1764 8 of 26
4.1. Case Study Site 1: Abattoir in Western Australia
4.1.1. Data Collection
The abattoir in Western Australia is an older, medium sized red meat facility processingapproximately 600 head a day, and includes rendering. The facility operates one killing shift, five daysa week, for 50 weeks a year. Seven main transformers supply electricity to the equipment at thissite. The annual electricity consumption of this representative site is approximately 15,800 MWh.This facility has no power generation on-site and electricity is only supplied from the main grid bythe Government owned transmission and distribution company. The abattoir is at the end of the localfeeder line and is known to have lower voltages and regular periods of power drop. The electricitydata were collected from the four most heavily loaded of the seven transformers. These transformersrepresent more than 90% of the electricity used on site. The specifications of the monitored transformersare as follows:
• Refrigeration Feeder—Transformer 1 (TX_1): The capacity of TX_1 is 1 MVA. This transformersupplies the main part of the refrigeration plant and the boning room loads.
• Kill Floor Feeder—Transformer 2 (TX_2): The capacity of TX_2 is 1 MVA. This transformersupplies the kill floor motor control, air compressors and plate freezer switchboard.
• By-Products Feeder—Transformer 3 (TX_3): The capacity of TX_3 is 1 MVA. This transformersupplies the by-products motor control center and the site fire pumps.
• General Distribution Feeder—Transformer 6 (TX_6): The capacity of TX_6 is 1.5 MVA.This transformer supplies part of the refrigeration plants and general loads.
A power quality analyser (Fluke 435 Series II Power Quality and Energy Analyzer) [23]was installed, as shown in Figure 5, at each of the transformers on-site for a week to measurethe electricity data at 1-min intervals. Monitoring was undertaken over a four-week period leadingup to (Tx_1, Tx-2 and Tx_6), and just after (Tx_3) Christmas, as this is the busiest time of year forthe abattoir, when the electrical equipment will be under most load. The electricity data collectedfrom the individual transformers were phase and line voltages, phase and line currents, active power(per-phase and total), reactive power (per-phase and total), apparent power (per-phase and total),voltage and current unbalances, power factor, THD, and a number of other relevant parameters.
Energies 2017, 10, 1764 8 of 26
4.1. Case Study Site 1: Abattoir in Western Australia
4.1.1. Data Collection
The abattoir in Western Australia is an older, medium sized red meat facility processing approximately 600 head a day, and includes rendering. The facility operates one killing shift, five days a week, for 50 weeks a year. Seven main transformers supply electricity to the equipment at this site. The annual electricity consumption of this representative site is approximately 15,800 MWh. This facility has no power generation on-site and electricity is only supplied from the main grid by the Government owned transmission and distribution company. The abattoir is at the end of the local feeder line and is known to have lower voltages and regular periods of power drop. The electricity data were collected from the four most heavily loaded of the seven transformers. These transformers represent more than 90% of the electricity used on site. The specifications of the monitored transformers are as follows:
• Refrigeration Feeder—Transformer 1 (TX_1): The capacity of TX_1 is 1 MVA. This transformer supplies the main part of the refrigeration plant and the boning room loads.
• Kill Floor Feeder—Transformer 2 (TX_2): The capacity of TX_2 is 1 MVA. This transformer supplies the kill floor motor control, air compressors and plate freezer switchboard.
• By-Products Feeder—Transformer 3 (TX_3): The capacity of TX_3 is 1 MVA. This transformer supplies the by-products motor control center and the site fire pumps.
• General Distribution Feeder—Transformer 6 (TX_6): The capacity of TX_6 is 1.5 MVA. This transformer supplies part of the refrigeration plants and general loads.
A power quality analyser (Fluke 435 Series II Power Quality and Energy Analyzer) [23] was installed, as shown in Figure 5, at each of the transformers on-site for a week to measure the electricity data at 1-min intervals. Monitoring was undertaken over a four-week period leading up to (Tx_1, Tx-2 and Tx_6), and just after (Tx_3) Christmas, as this is the busiest time of year for the abattoir, when the electrical equipment will be under most load. The electricity data collected from the individual transformers were phase and line voltages, phase and line currents, active power (per-phase and total), reactive power (per-phase and total), apparent power (per-phase and total), voltage and current unbalances, power factor, THD, and a number of other relevant parameters.
Figure 5. Data collection from case study site using a Fluke Power Quality Analyzer.
4.1.2. Load and Voltage Profiles
The following sections present the load and voltage profiles for the refrigeration, kill floor, by-products, and general distribution (with some refrigeration) feeder transformers at the abattoir. The
Figure 5. Data collection from case study site using a Fluke Power Quality Analyzer.
4.1.2. Load and Voltage Profiles
The following sections present the load and voltage profiles for the refrigeration, kill floor,by-products, and general distribution (with some refrigeration) feeder transformers at the abattoir.
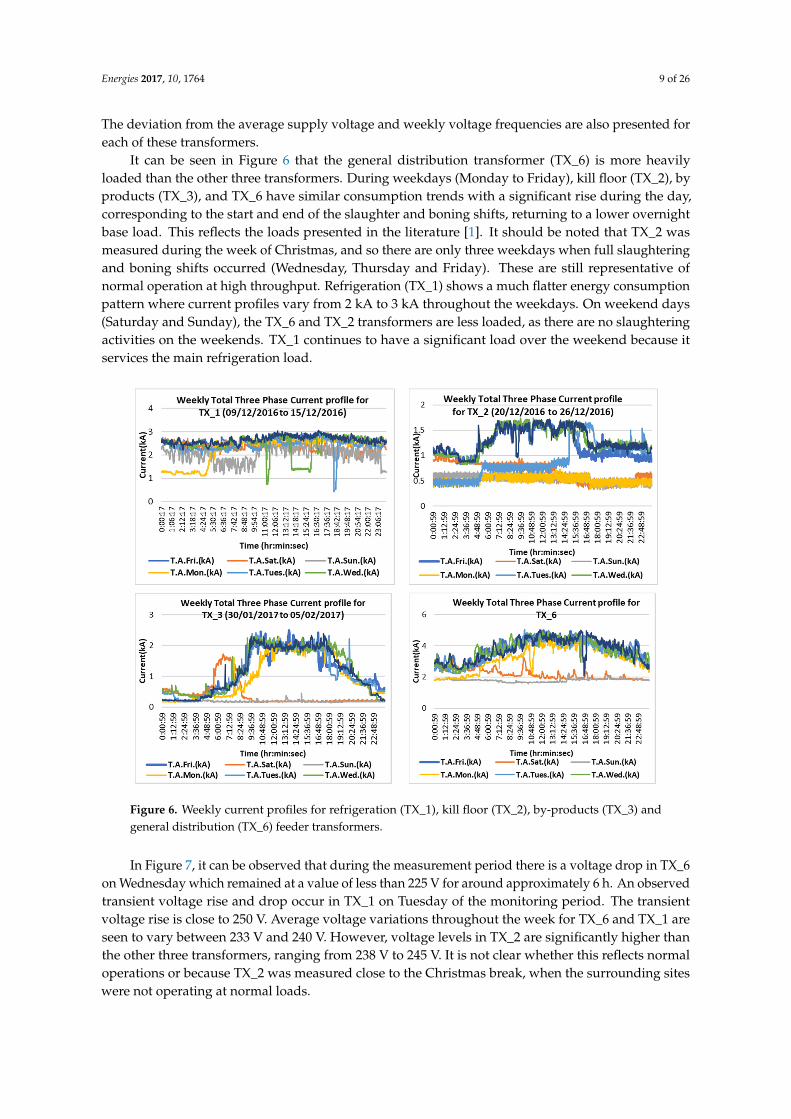
Energies 2017, 10, 1764 9 of 26
The deviation from the average supply voltage and weekly voltage frequencies are also presented foreach of these transformers.
It can be seen in Figure 6 that the general distribution transformer (TX_6) is more heavilyloaded than the other three transformers. During weekdays (Monday to Friday), kill floor (TX_2), byproducts (TX_3), and TX_6 have similar consumption trends with a significant rise during the day,corresponding to the start and end of the slaughter and boning shifts, returning to a lower overnightbase load. This reflects the loads presented in the literature [1]. It should be noted that TX_2 wasmeasured during the week of Christmas, and so there are only three weekdays when full slaughteringand boning shifts occurred (Wednesday, Thursday and Friday). These are still representative ofnormal operation at high throughput. Refrigeration (TX_1) shows a much flatter energy consumptionpattern where current profiles vary from 2 kA to 3 kA throughout the weekdays. On weekend days(Saturday and Sunday), the TX_6 and TX_2 transformers are less loaded, as there are no slaughteringactivities on the weekends. TX_1 continues to have a significant load over the weekend because itservices the main refrigeration load.
Energies 2017, 10, 1764 9 of 26
deviation from the average supply voltage and weekly voltage frequencies are also presented for each of these transformers.
It can be seen in Figure 6 that the general distribution transformer (TX_6) is more heavily loaded than the other three transformers. During weekdays (Monday to Friday), kill floor (TX_2), by products (TX_3), and TX_6 have similar consumption trends with a significant rise during the day, corresponding to the start and end of the slaughter and boning shifts, returning to a lower overnight base load. This reflects the loads presented in the literature [1]. It should be noted that TX_2 was measured during the week of Christmas, and so there are only three weekdays when full slaughtering and boning shifts occurred (Wednesday, Thursday and Friday). These are still representative of normal operation at high throughput. Refrigeration (TX_1) shows a much flatter energy consumption pattern where current profiles vary from 2 kA to 3 kA throughout the weekdays. On weekend days (Saturday and Sunday), the TX_6 and TX_2 transformers are less loaded, as there are no slaughtering activities on the weekends. TX_1 continues to have a significant load over the weekend because it services the main refrigeration load.
Figure 6. Weekly current profiles for refrigeration (TX_1), kill floor (TX_2), by-products (TX_3) and general distribution (TX_6) feeder transformers.
In Figure 7, it can be observed that during the measurement period there is a voltage drop in TX_6 on Wednesday which remained at a value of less than 225 V for around approximately 6 h. An observed transient voltage rise and drop occur in TX_1 on Tuesday of the monitoring period. The transient voltage rise is close to 250 V. Average voltage variations throughout the week for TX_6 and TX_1 are seen to vary between 233 V and 240 V. However, voltage levels in TX_2 are significantly higher than the other three transformers, ranging from 238 V to 245 V. It is not clear whether this reflects normal operations or because TX_2 was measured close to the Christmas break, when the surrounding sites were not operating at normal loads.
Figure 6. Weekly current profiles for refrigeration (TX_1), kill floor (TX_2), by-products (TX_3) andgeneral distribution (TX_6) feeder transformers.
In Figure 7, it can be observed that during the measurement period there is a voltage drop in TX_6on Wednesday which remained at a value of less than 225 V for around approximately 6 h. An observedtransient voltage rise and drop occur in TX_1 on Tuesday of the monitoring period. The transientvoltage rise is close to 250 V. Average voltage variations throughout the week for TX_6 and TX_1 areseen to vary between 233 V and 240 V. However, voltage levels in TX_2 are significantly higher thanthe other three transformers, ranging from 238 V to 245 V. It is not clear whether this reflects normaloperations or because TX_2 was measured close to the Christmas break, when the surrounding siteswere not operating at normal loads.
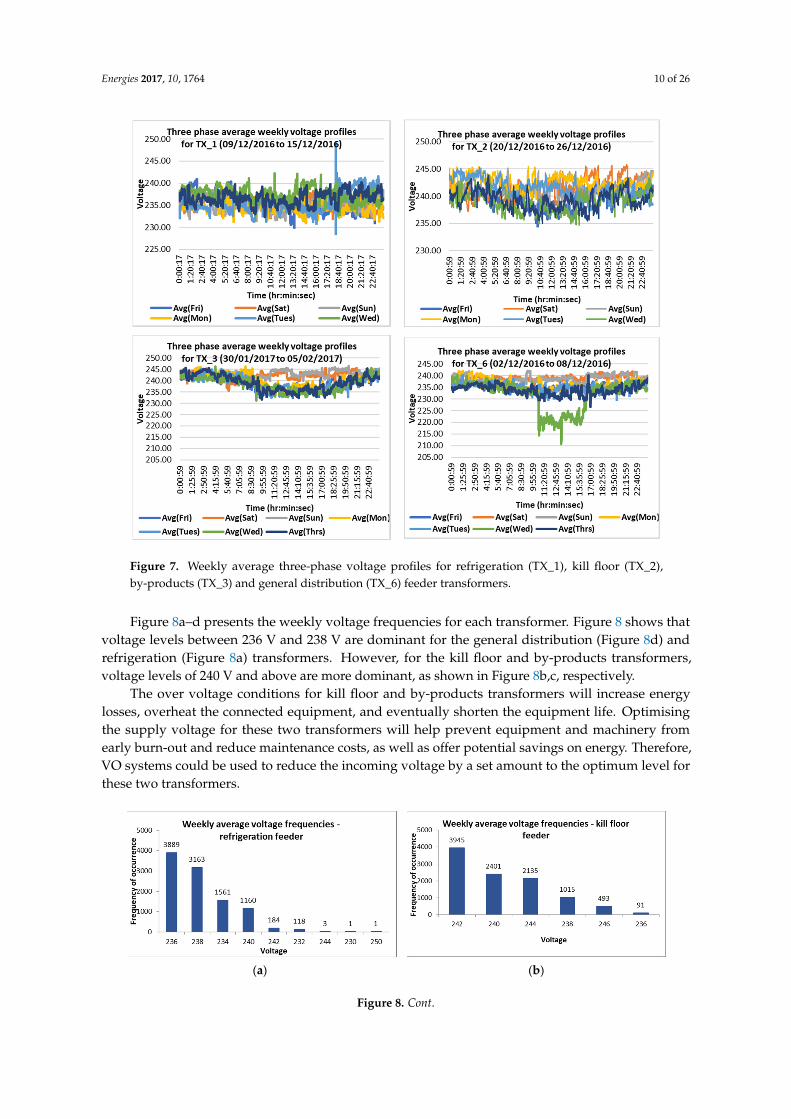
Energies 2017, 10, 1764 10 of 26Energies 2017, 10, 1764 10 of 26
Figure 7. Weekly average three-phase voltage profiles for refrigeration (TX_1), kill floor (TX_2), by-products (TX_3) and general distribution (TX_6) feeder transformers.
Figure 8a–d presents the weekly voltage frequencies for each transformer. Figure 8 shows that voltage levels between 236 V and 238 V are dominant for the general distribution (Figure 8d) and refrigeration (Figure 8a) transformers. However, for the kill floor and by-products transformers, voltage levels of 240 V and above are more dominant, as shown in Figure 8b,c, respectively.
The over voltage conditions for kill floor and by-products transformers will increase energy losses, overheat the connected equipment, and eventually shorten the equipment life. Optimising the supply voltage for these two transformers will help prevent equipment and machinery from early burn-out and reduce maintenance costs, as well as offer potential savings on energy. Therefore, VO systems could be used to reduce the incoming voltage by a set amount to the optimum level for these two transformers.
(a) (b)
Figure 7. Weekly average three-phase voltage profiles for refrigeration (TX_1), kill floor (TX_2),by-products (TX_3) and general distribution (TX_6) feeder transformers.
Figure 8a–d presents the weekly voltage frequencies for each transformer. Figure 8 shows thatvoltage levels between 236 V and 238 V are dominant for the general distribution (Figure 8d) andrefrigeration (Figure 8a) transformers. However, for the kill floor and by-products transformers,voltage levels of 240 V and above are more dominant, as shown in Figure 8b,c, respectively.
The over voltage conditions for kill floor and by-products transformers will increase energylosses, overheat the connected equipment, and eventually shorten the equipment life. Optimisingthe supply voltage for these two transformers will help prevent equipment and machinery fromearly burn-out and reduce maintenance costs, as well as offer potential savings on energy. Therefore,VO systems could be used to reduce the incoming voltage by a set amount to the optimum level forthese two transformers.
Energies 2017, 10, 1764 10 of 26
Figure 7. Weekly average three-phase voltage profiles for refrigeration (TX_1), kill floor (TX_2), by-products (TX_3) and general distribution (TX_6) feeder transformers.
Figure 8a–d presents the weekly voltage frequencies for each transformer. Figure 8 shows that voltage levels between 236 V and 238 V are dominant for the general distribution (Figure 8d) and refrigeration (Figure 8a) transformers. However, for the kill floor and by-products transformers, voltage levels of 240 V and above are more dominant, as shown in Figure 8b,c, respectively.
The over voltage conditions for kill floor and by-products transformers will increase energy losses, overheat the connected equipment, and eventually shorten the equipment life. Optimising the supply voltage for these two transformers will help prevent equipment and machinery from early burn-out and reduce maintenance costs, as well as offer potential savings on energy. Therefore, VO systems could be used to reduce the incoming voltage by a set amount to the optimum level for these two transformers.
(a) (b)
Figure 8. Cont.
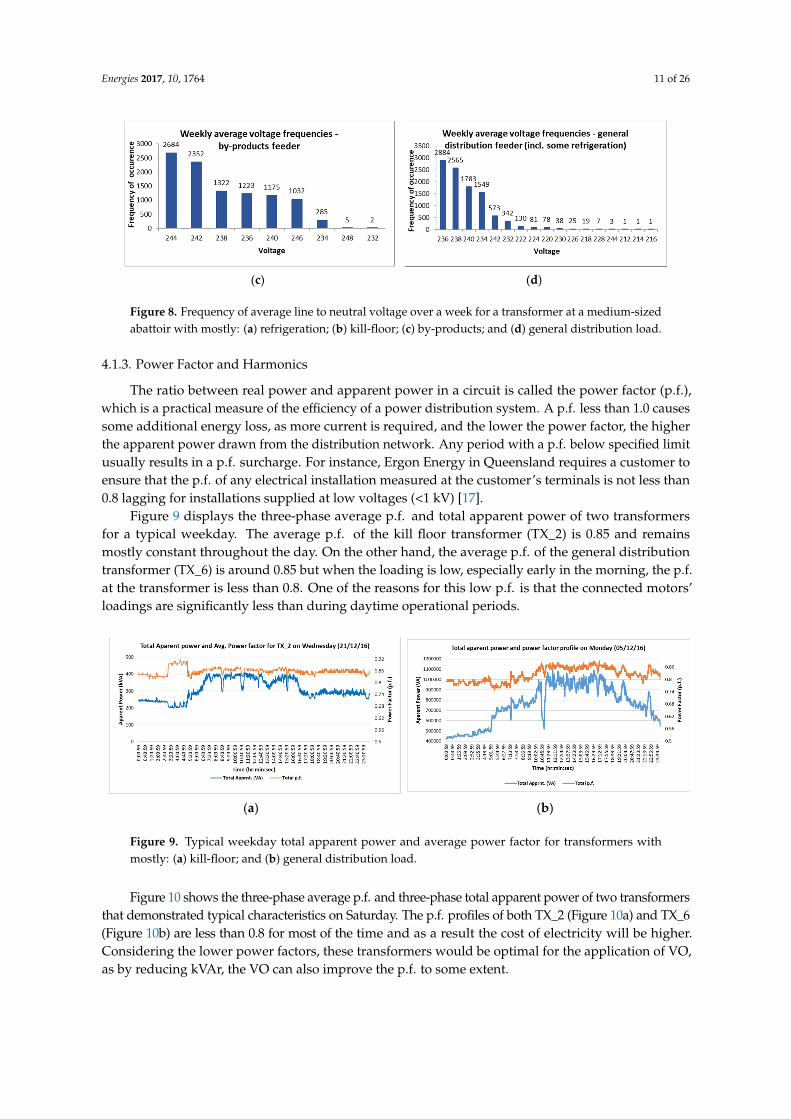
Energies 2017, 10, 1764 11 of 26
Energies 2017, 10, 1764 11 of 26
(c) (d)
Figure 8. Frequency of average line to neutral voltage over a week for a transformer at a medium-sized abattoir with mostly: (a) refrigeration; (b) kill-floor; (c) by-products; and (d) general distribution load.
4.1.3. Power Factor and Harmonics
The ratio between real power and apparent power in a circuit is called the power factor (p.f.), which is a practical measure of the efficiency of a power distribution system. A p.f. less than 1.0 causes some additional energy loss, as more current is required, and the lower the power factor, the higher the apparent power drawn from the distribution network. Any period with a p.f. below specified limit usually results in a p.f. surcharge. For instance, Ergon Energy in Queensland requires a customer to ensure that the p.f. of any electrical installation measured at the customer’s terminals is not less than 0.8 lagging for installations supplied at low voltages (<1 kV) [17].
Figure 9 displays the three-phase average p.f. and total apparent power of two transformers for a typical weekday. The average p.f. of the kill floor transformer (TX_2) is 0.85 and remains mostly constant throughout the day. On the other hand, the average p.f. of the general distribution transformer (TX_6) is around 0.85 but when the loading is low, especially early in the morning, the p.f. at the transformer is less than 0.8. One of the reasons for this low p.f. is that the connected motors’ loadings are significantly less than during daytime operational periods.
(a) (b)
Figure 9. Typical weekday total apparent power and average power factor for transformers with mostly: (a) kill-floor; and (b) general distribution load.
Figure 10 shows the three-phase average p.f. and three-phase total apparent power of two transformers that demonstrated typical characteristics on Saturday. The p.f. profiles of both TX_2 (Figure 10a) and TX_6 (Figure 10b) are less than 0.8 for most of the time and as a result the cost of electricity will be higher. Considering the lower power factors, these transformers would be optimal for the application of VO, as by reducing kVAr, the VO can also improve the p.f. to some extent.
Figure 8. Frequency of average line to neutral voltage over a week for a transformer at a medium-sizedabattoir with mostly: (a) refrigeration; (b) kill-floor; (c) by-products; and (d) general distribution load.
4.1.3. Power Factor and Harmonics
The ratio between real power and apparent power in a circuit is called the power factor (p.f.),which is a practical measure of the efficiency of a power distribution system. A p.f. less than 1.0 causessome additional energy loss, as more current is required, and the lower the power factor, the higherthe apparent power drawn from the distribution network. Any period with a p.f. below specified limitusually results in a p.f. surcharge. For instance, Ergon Energy in Queensland requires a customer toensure that the p.f. of any electrical installation measured at the customer’s terminals is not less than0.8 lagging for installations supplied at low voltages (<1 kV) [17].
Figure 9 displays the three-phase average p.f. and total apparent power of two transformersfor a typical weekday. The average p.f. of the kill floor transformer (TX_2) is 0.85 and remainsmostly constant throughout the day. On the other hand, the average p.f. of the general distributiontransformer (TX_6) is around 0.85 but when the loading is low, especially early in the morning, the p.f.at the transformer is less than 0.8. One of the reasons for this low p.f. is that the connected motors’loadings are significantly less than during daytime operational periods.
Energies 2017, 10, 1764 11 of 26
(c) (d)
Figure 8. Frequency of average line to neutral voltage over a week for a transformer at a medium-sized abattoir with mostly: (a) refrigeration; (b) kill-floor; (c) by-products; and (d) general distribution load.
4.1.3. Power Factor and Harmonics
The ratio between real power and apparent power in a circuit is called the power factor (p.f.), which is a practical measure of the efficiency of a power distribution system. A p.f. less than 1.0 causes some additional energy loss, as more current is required, and the lower the power factor, the higher the apparent power drawn from the distribution network. Any period with a p.f. below specified limit usually results in a p.f. surcharge. For instance, Ergon Energy in Queensland requires a customer to ensure that the p.f. of any electrical installation measured at the customer’s terminals is not less than 0.8 lagging for installations supplied at low voltages (<1 kV) [17].
Figure 9 displays the three-phase average p.f. and total apparent power of two transformers for a typical weekday. The average p.f. of the kill floor transformer (TX_2) is 0.85 and remains mostly constant throughout the day. On the other hand, the average p.f. of the general distribution transformer (TX_6) is around 0.85 but when the loading is low, especially early in the morning, the p.f. at the transformer is less than 0.8. One of the reasons for this low p.f. is that the connected motors’ loadings are significantly less than during daytime operational periods.
(a) (b)
Figure 9. Typical weekday total apparent power and average power factor for transformers with mostly: (a) kill-floor; and (b) general distribution load.
Figure 10 shows the three-phase average p.f. and three-phase total apparent power of two transformers that demonstrated typical characteristics on Saturday. The p.f. profiles of both TX_2 (Figure 10a) and TX_6 (Figure 10b) are less than 0.8 for most of the time and as a result the cost of electricity will be higher. Considering the lower power factors, these transformers would be optimal for the application of VO, as by reducing kVAr, the VO can also improve the p.f. to some extent.
Figure 9. Typical weekday total apparent power and average power factor for transformers withmostly: (a) kill-floor; and (b) general distribution load.
Figure 10 shows the three-phase average p.f. and three-phase total apparent power of two transformersthat demonstrated typical characteristics on Saturday. The p.f. profiles of both TX_2 (Figure 10a) and TX_6(Figure 10b) are less than 0.8 for most of the time and as a result the cost of electricity will be higher.Considering the lower power factors, these transformers would be optimal for the application of VO,as by reducing kVAr, the VO can also improve the p.f. to some extent.
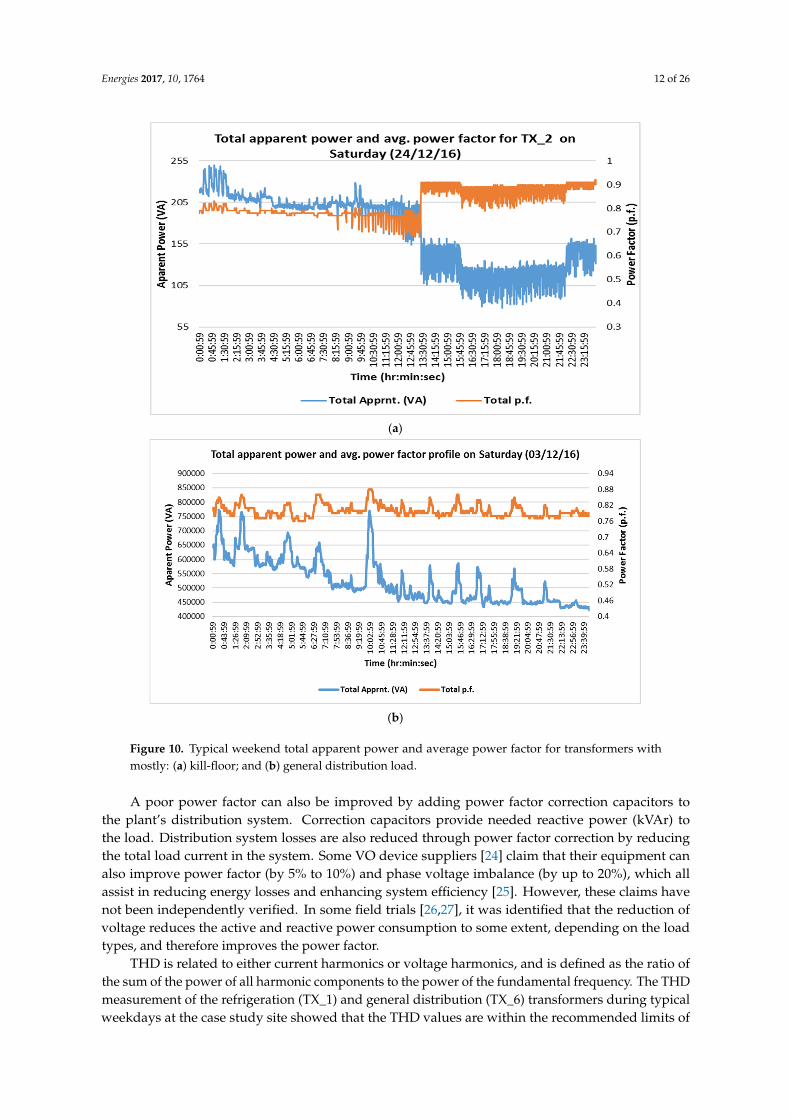
Energies 2017, 10, 1764 12 of 26
Energies 2017, 10, 1764 12 of 26
(a)
(b)
Figure 10. Typical weekend total apparent power and average power factor for transformers with mostly: (a) kill-floor; and (b) general distribution load.
A poor power factor can also be improved by adding power factor correction capacitors to the plant’s distribution system. Correction capacitors provide needed reactive power (kVAr) to the load. Distribution system losses are also reduced through power factor correction by reducing the total load current in the system. Some VO device suppliers [24] claim that their equipment can also improve power factor (by 5% to 10%) and phase voltage imbalance (by up to 20%), which all assist in reducing energy losses and enhancing system efficiency [25]. However, these claims have not been independently verified. In some field trials [26,27], it was identified that the reduction of voltage reduces the active and reactive power consumption to some extent, depending on the load types, and therefore improves the power factor.
THD is related to either current harmonics or voltage harmonics, and is defined as the ratio of the sum of the power of all harmonic components to the power of the fundamental frequency. The THD measurement of the refrigeration (TX_1) and general distribution (TX_6) transformers during typical weekdays at the case study site showed that the THD values are within the recommended
Figure 10. Typical weekend total apparent power and average power factor for transformers withmostly: (a) kill-floor; and (b) general distribution load.
A poor power factor can also be improved by adding power factor correction capacitors tothe plant’s distribution system. Correction capacitors provide needed reactive power (kVAr) tothe load. Distribution system losses are also reduced through power factor correction by reducingthe total load current in the system. Some VO device suppliers [24] claim that their equipment canalso improve power factor (by 5% to 10%) and phase voltage imbalance (by up to 20%), which allassist in reducing energy losses and enhancing system efficiency [25]. However, these claims havenot been independently verified. In some field trials [26,27], it was identified that the reduction ofvoltage reduces the active and reactive power consumption to some extent, depending on the loadtypes, and therefore improves the power factor.
THD is related to either current harmonics or voltage harmonics, and is defined as the ratio ofthe sum of the power of all harmonic components to the power of the fundamental frequency. The THDmeasurement of the refrigeration (TX_1) and general distribution (TX_6) transformers during typicalweekdays at the case study site showed that the THD values are within the recommended limits of

Energies 2017, 10, 1764 13 of 26
8% [28] on the low voltage side. TX_1 (Figure 11a) has higher THD than TX_6 (Figure 11b) due tothe refrigeration loads, as shown in Figure 11. The measurements also showed that the level of totalharmonic distortion is quite low on a typical weekend day relative to the weekdays, which is expectedas there are less loads on the weekend.
The presence of harmonics in the waveform of the network voltage can be attributed to variouscauses such as rectifiers, variable speed drives, thyristors, a saturated transformer, etc. If the harmonicpower is significant, i.e., total harmonic voltage distortion (THVD) is greater than 7% and totalharmonic current distortion (THID) is greater than 40%, this can result in overvoltage and overloads,which may lead to the failure of the capacitors, circuit breakers, contactors, etc. Harmonic powerlosses can be reduced using reactors or harmonic filters. In some voltage optimiser technologies [24],the harmonic filtration is integrated (e.g., in the Power Perfector VO), reducing overall THD.
Energies 2017, 10, 1764 13 of 26
limits of 8% [28] on the low voltage side. TX_1 (Figure 11a) has higher THD than TX_6 (Figure 11b) due to the refrigeration loads, as shown in Figure 11. The measurements also showed that the level of total harmonic distortion is quite low on a typical weekend day relative to the weekdays, which is expected as there are less loads on the weekend.
The presence of harmonics in the waveform of the network voltage can be attributed to various causes such as rectifiers, variable speed drives, thyristors, a saturated transformer, etc. If the harmonic power is significant, i.e., total harmonic voltage distortion (THVD) is greater than 7% and total harmonic current distortion (THID) is greater than 40%, this can result in overvoltage and overloads, which may lead to the failure of the capacitors, circuit breakers, contactors, etc. Harmonic power losses can be reduced using reactors or harmonic filters. In some voltage optimiser technologies [24], the harmonic filtration is integrated (e.g., in the Power Perfector VO), reducing overall THD.
(a)
(b)
Figure 11. Weekdays total voltage harmonic distortion for transformers in: (a) refrigeration; and (b) general distribution load.
4.2. Case Study Site 2: Abattoir in Queensland
4.2.1. Data Collection
The data was collected from the Case Study 2 site using a Powermonic PM45 [29] and included voltage and current across three phases from 12 December 2015 to 17 December 2015, again in the busiest period leading up to Christmas. The data were collected from the incoming on-site
Figure 11. Weekdays total voltage harmonic distortion for transformers in: (a) refrigeration; and(b) general distribution load.
4.2. Case Study Site 2: Abattoir in Queensland
4.2.1. Data Collection
The data was collected from the Case Study 2 site using a Powermonic PM45 [29] and includedvoltage and current across three phases from 12 December 2015 to 17 December 2015, again inthe busiest period leading up to Christmas. The data were collected from the incoming on-site
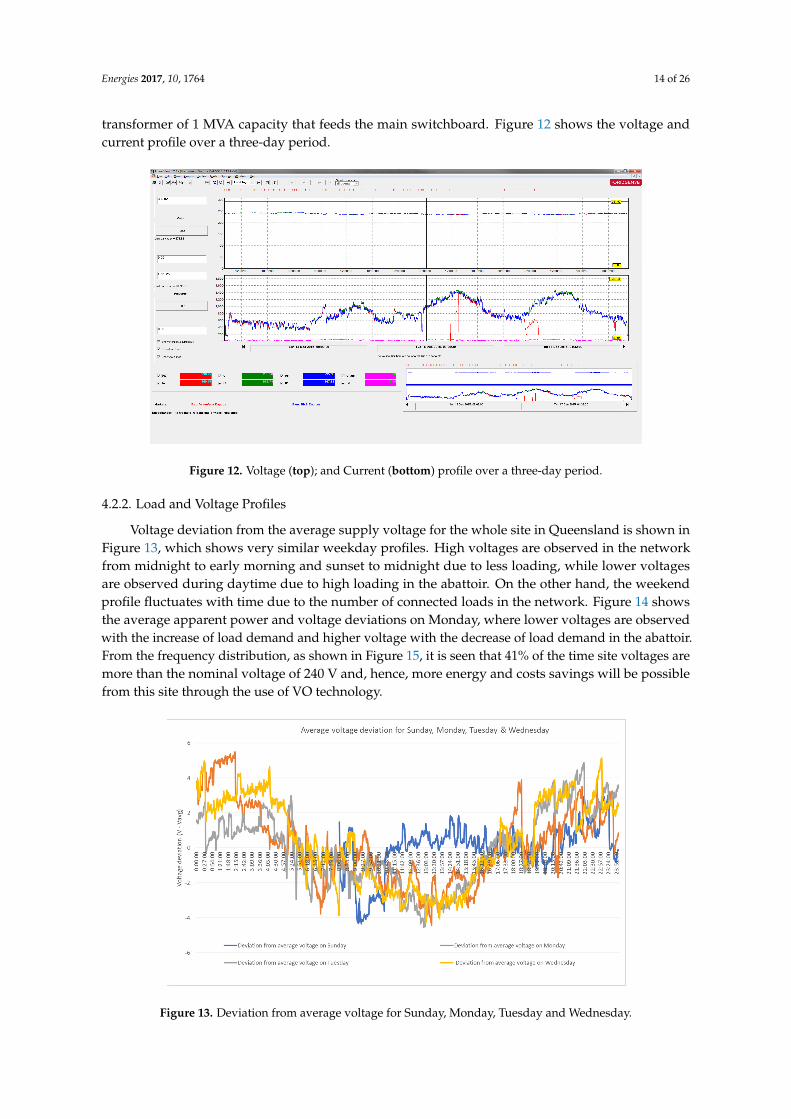
Energies 2017, 10, 1764 14 of 26
transformer of 1 MVA capacity that feeds the main switchboard. Figure 12 shows the voltage andcurrent profile over a three-day period.
Energies 2017, 10, 1764 14 of 26
transformer of 1 MVA capacity that feeds the main switchboard. Figure 12 shows the voltage and current profile over a three-day period.
Figure 12. Voltage (top); and Current (bottom) profile over a three-day period.
4.2.2. Load and Voltage Profiles
Voltage deviation from the average supply voltage for the whole site in Queensland is shown in Figure 13, which shows very similar weekday profiles. High voltages are observed in the network from midnight to early morning and sunset to midnight due to less loading, while lower voltages are observed during daytime due to high loading in the abattoir. On the other hand, the weekend profile fluctuates with time due to the number of connected loads in the network. Figure 14 shows the average apparent power and voltage deviations on Monday, where lower voltages are observed with the increase of load demand and higher voltage with the decrease of load demand in the abattoir. From the frequency distribution, as shown in Figure 15, it is seen that 41% of the time site voltages are more than the nominal voltage of 240 V and, hence, more energy and costs savings will be possible from this site through the use of VO technology.
Figure 13. Deviation from average voltage for Sunday, Monday, Tuesday and Wednesday.
Figure 12. Voltage (top); and Current (bottom) profile over a three-day period.
4.2.2. Load and Voltage Profiles
Voltage deviation from the average supply voltage for the whole site in Queensland is shown inFigure 13, which shows very similar weekday profiles. High voltages are observed in the networkfrom midnight to early morning and sunset to midnight due to less loading, while lower voltagesare observed during daytime due to high loading in the abattoir. On the other hand, the weekendprofile fluctuates with time due to the number of connected loads in the network. Figure 14 showsthe average apparent power and voltage deviations on Monday, where lower voltages are observedwith the increase of load demand and higher voltage with the decrease of load demand in the abattoir.From the frequency distribution, as shown in Figure 15, it is seen that 41% of the time site voltages aremore than the nominal voltage of 240 V and, hence, more energy and costs savings will be possiblefrom this site through the use of VO technology.
Energies 2017, 10, 1764 14 of 26
transformer of 1 MVA capacity that feeds the main switchboard. Figure 12 shows the voltage and current profile over a three-day period.
Figure 12. Voltage (top); and Current (bottom) profile over a three-day period.
4.2.2. Load and Voltage Profiles
Voltage deviation from the average supply voltage for the whole site in Queensland is shown in Figure 13, which shows very similar weekday profiles. High voltages are observed in the network from midnight to early morning and sunset to midnight due to less loading, while lower voltages are observed during daytime due to high loading in the abattoir. On the other hand, the weekend profile fluctuates with time due to the number of connected loads in the network. Figure 14 shows the average apparent power and voltage deviations on Monday, where lower voltages are observed with the increase of load demand and higher voltage with the decrease of load demand in the abattoir. From the frequency distribution, as shown in Figure 15, it is seen that 41% of the time site voltages are more than the nominal voltage of 240 V and, hence, more energy and costs savings will be possible from this site through the use of VO technology.
Figure 13. Deviation from average voltage for Sunday, Monday, Tuesday and Wednesday. Figure 13. Deviation from average voltage for Sunday, Monday, Tuesday and Wednesday.
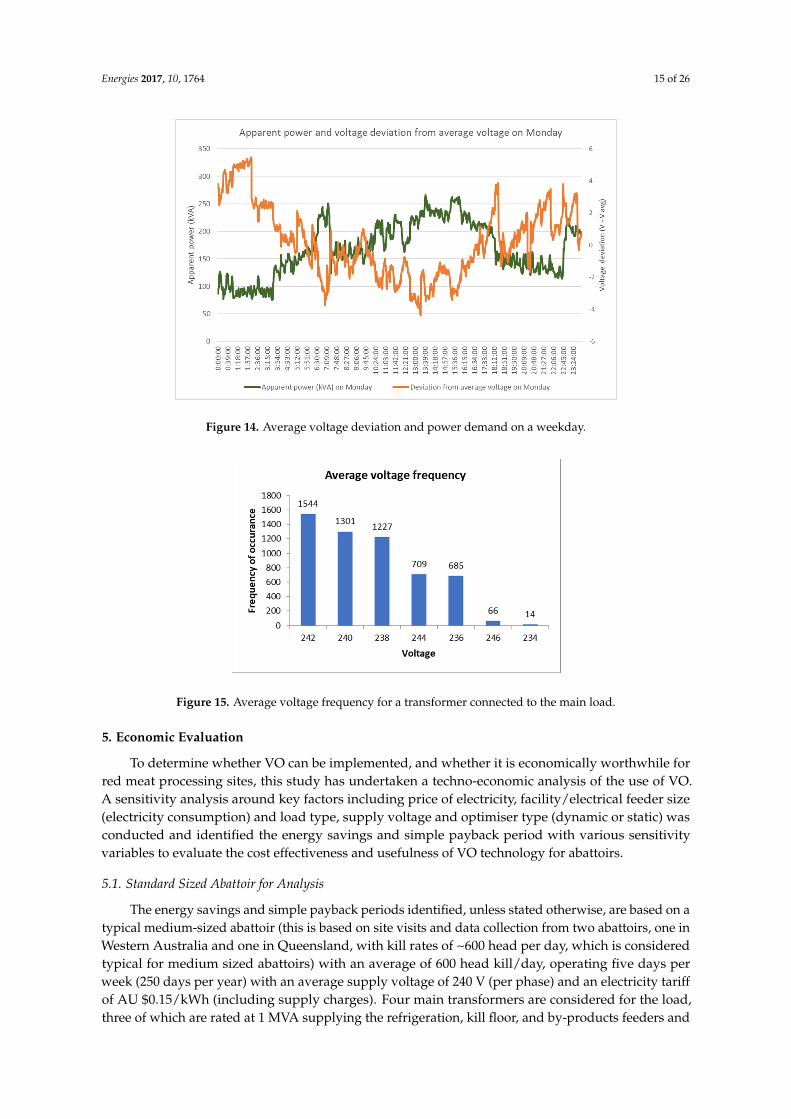
Energies 2017, 10, 1764 15 of 26Energies 2017, 10, 1764 15 of 26
Figure 14. Average voltage deviation and power demand on a weekday.
Figure 15. Average voltage frequency for a transformer connected to the main load.
5. Economic Evaluation
To determine whether VO can be implemented, and whether it is economically worthwhile for red meat processing sites, this study has undertaken a techno-economic analysis of the use of VO. A sensitivity analysis around key factors including price of electricity, facility/electrical feeder size (electricity consumption) and load type, supply voltage and optimiser type (dynamic or static) was conducted and identified the energy savings and simple payback period with various sensitivity variables to evaluate the cost effectiveness and usefulness of VO technology for abattoirs.
5.1. Standard Sized Abattoir for Analysis
The energy savings and simple payback periods identified, unless stated otherwise, are based on a typical medium-sized abattoir (this is based on site visits and data collection from two abattoirs, one in Western Australia and one in Queensland, with kill rates of ~600 head per day, which is considered typical for medium sized abattoirs) with an average of 600 head kill/day, operating five days per week (250 days per year) with an average supply voltage of 240 V (per phase) and an electricity tariff of AU $0.15/kWh (including supply charges). Four main transformers are considered for the load, three of which are rated at 1 MVA supplying the refrigeration, kill floor, and by-products feeders and a 1.5 MVA general distribution feeder (which also includes some refrigeration loads).
Figure 14. Average voltage deviation and power demand on a weekday.
Energies 2017, 10, 1764 15 of 26
Figure 14. Average voltage deviation and power demand on a weekday.
Figure 15. Average voltage frequency for a transformer connected to the main load.
5. Economic Evaluation
To determine whether VO can be implemented, and whether it is economically worthwhile for red meat processing sites, this study has undertaken a techno-economic analysis of the use of VO. A sensitivity analysis around key factors including price of electricity, facility/electrical feeder size (electricity consumption) and load type, supply voltage and optimiser type (dynamic or static) was conducted and identified the energy savings and simple payback period with various sensitivity variables to evaluate the cost effectiveness and usefulness of VO technology for abattoirs.
5.1. Standard Sized Abattoir for Analysis
The energy savings and simple payback periods identified, unless stated otherwise, are based on a typical medium-sized abattoir (this is based on site visits and data collection from two abattoirs, one in Western Australia and one in Queensland, with kill rates of ~600 head per day, which is considered typical for medium sized abattoirs) with an average of 600 head kill/day, operating five days per week (250 days per year) with an average supply voltage of 240 V (per phase) and an electricity tariff of AU $0.15/kWh (including supply charges). Four main transformers are considered for the load, three of which are rated at 1 MVA supplying the refrigeration, kill floor, and by-products feeders and a 1.5 MVA general distribution feeder (which also includes some refrigeration loads).
Figure 15. Average voltage frequency for a transformer connected to the main load.
5. Economic Evaluation
To determine whether VO can be implemented, and whether it is economically worthwhile forred meat processing sites, this study has undertaken a techno-economic analysis of the use of VO.A sensitivity analysis around key factors including price of electricity, facility/electrical feeder size(electricity consumption) and load type, supply voltage and optimiser type (dynamic or static) wasconducted and identified the energy savings and simple payback period with various sensitivityvariables to evaluate the cost effectiveness and usefulness of VO technology for abattoirs.
5.1. Standard Sized Abattoir for Analysis
The energy savings and simple payback periods identified, unless stated otherwise, are based on atypical medium-sized abattoir (this is based on site visits and data collection from two abattoirs, one inWestern Australia and one in Queensland, with kill rates of ~600 head per day, which is consideredtypical for medium sized abattoirs) with an average of 600 head kill/day, operating five days perweek (250 days per year) with an average supply voltage of 240 V (per phase) and an electricity tariffof AU $0.15/kWh (including supply charges). Four main transformers are considered for the load,three of which are rated at 1 MVA supplying the refrigeration, kill floor, and by-products feeders and
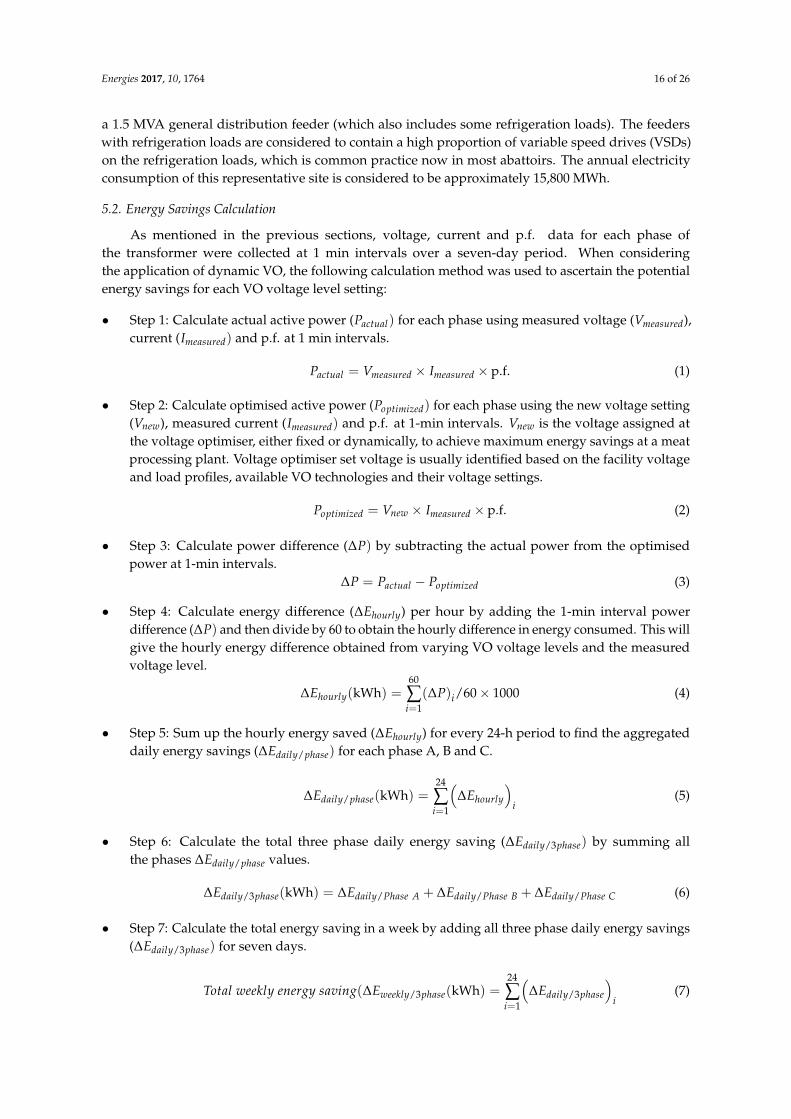
Energies 2017, 10, 1764 16 of 26
a 1.5 MVA general distribution feeder (which also includes some refrigeration loads). The feederswith refrigeration loads are considered to contain a high proportion of variable speed drives (VSDs)on the refrigeration loads, which is common practice now in most abattoirs. The annual electricityconsumption of this representative site is considered to be approximately 15,800 MWh.
5.2. Energy Savings Calculation
As mentioned in the previous sections, voltage, current and p.f. data for each phase ofthe transformer were collected at 1 min intervals over a seven-day period. When consideringthe application of dynamic VO, the following calculation method was used to ascertain the potentialenergy savings for each VO voltage level setting:
• Step 1: Calculate actual active power (Pactual) for each phase using measured voltage (Vmeasured),current (Imeasured) and p.f. at 1 min intervals.
Pactual = Vmeasured × Imeasured × p.f. (1)
• Step 2: Calculate optimised active power (Poptimized) for each phase using the new voltage setting(Vnew), measured current (Imeasured) and p.f. at 1-min intervals. Vnew is the voltage assigned atthe voltage optimiser, either fixed or dynamically, to achieve maximum energy savings at a meatprocessing plant. Voltage optimiser set voltage is usually identified based on the facility voltageand load profiles, available VO technologies and their voltage settings.
Poptimized = Vnew × Imeasured × p.f. (2)
• Step 3: Calculate power difference (∆P) by subtracting the actual power from the optimisedpower at 1-min intervals.
∆P = Pactual − Poptimized (3)
• Step 4: Calculate energy difference (∆Ehourly) per hour by adding the 1-min interval powerdifference (∆P) and then divide by 60 to obtain the hourly difference in energy consumed. This willgive the hourly energy difference obtained from varying VO voltage levels and the measuredvoltage level.
∆Ehourly(kWh) =60
∑i=1
(∆P)i/60 × 1000 (4)
• Step 5: Sum up the hourly energy saved (∆Ehourly) for every 24-h period to find the aggregateddaily energy savings (∆Edaily/phase) for each phase A, B and C.
∆Edaily/phase(kWh) =24
∑i=1
(∆Ehourly
)i
(5)
• Step 6: Calculate the total three phase daily energy saving (∆Edaily/3phase) by summing allthe phases ∆Edaily/phase values.
∆Edaily/3phase(kWh) = ∆Edaily/Phase A + ∆Edaily/Phase B + ∆Edaily/Phase C (6)
• Step 7: Calculate the total energy saving in a week by adding all three phase daily energy savings(∆Edaily/3phase) for seven days.
Total weekly energy saving(∆Eweekly/3phase(kWh) =24
∑i=1
(∆Edaily/3phase
)i
(7)
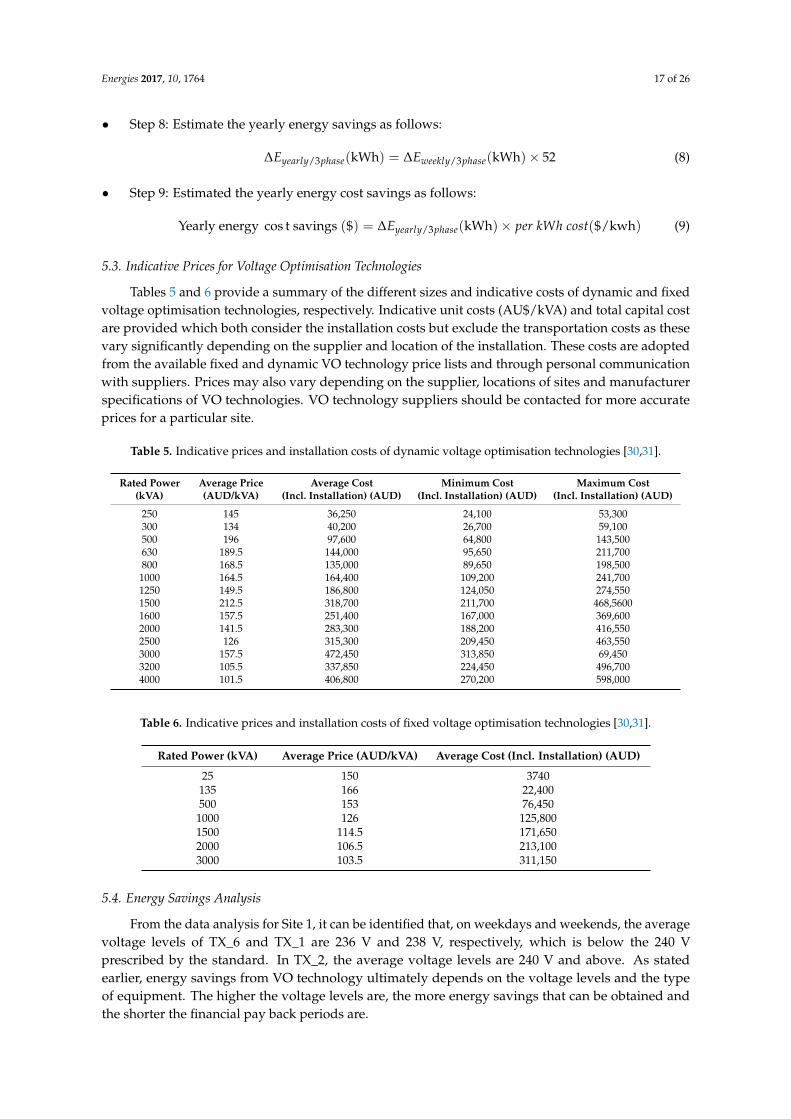
Energies 2017, 10, 1764 17 of 26
• Step 8: Estimate the yearly energy savings as follows:
∆Eyearly/3phase(kWh) = ∆Eweekly/3phase(kWh)× 52 (8)
• Step 9: Estimated the yearly energy cost savings as follows:
Yearly energy cos t savings ($) = ∆Eyearly/3phase(kWh)× per kWh cost($/kwh) (9)
5.3. Indicative Prices for Voltage Optimisation Technologies
Tables 5 and 6 provide a summary of the different sizes and indicative costs of dynamic and fixedvoltage optimisation technologies, respectively. Indicative unit costs (AU$/kVA) and total capital costare provided which both consider the installation costs but exclude the transportation costs as thesevary significantly depending on the supplier and location of the installation. These costs are adoptedfrom the available fixed and dynamic VO technology price lists and through personal communicationwith suppliers. Prices may also vary depending on the supplier, locations of sites and manufacturerspecifications of VO technologies. VO technology suppliers should be contacted for more accurateprices for a particular site.
Table 5. Indicative prices and installation costs of dynamic voltage optimisation technologies [30,31].
Rated Power(kVA)
Average Price(AUD/kVA)
Average Cost(Incl. Installation) (AUD)
Minimum Cost(Incl. Installation) (AUD)
Maximum Cost(Incl. Installation) (AUD)
250 145 36,250 24,100 53,300300 134 40,200 26,700 59,100500 196 97,600 64,800 143,500630 189.5 144,000 95,650 211,700800 168.5 135,000 89,650 198,500
1000 164.5 164,400 109,200 241,7001250 149.5 186,800 124,050 274,5501500 212.5 318,700 211,700 468,56001600 157.5 251,400 167,000 369,6002000 141.5 283,300 188,200 416,5502500 126 315,300 209,450 463,5503000 157.5 472,450 313,850 69,4503200 105.5 337,850 224,450 496,7004000 101.5 406,800 270,200 598,000
Table 6. Indicative prices and installation costs of fixed voltage optimisation technologies [30,31].
Rated Power (kVA) Average Price (AUD/kVA) Average Cost (Incl. Installation) (AUD)
25 150 3740135 166 22,400500 153 76,4501000 126 125,8001500 114.5 171,6502000 106.5 213,1003000 103.5 311,150
5.4. Energy Savings Analysis
From the data analysis for Site 1, it can be identified that, on weekdays and weekends, the averagevoltage levels of TX_6 and TX_1 are 236 V and 238 V, respectively, which is below the 240 Vprescribed by the standard. In TX_2, the average voltage levels are 240 V and above. As statedearlier, energy savings from VO technology ultimately depends on the voltage levels and the typeof equipment. The higher the voltage levels are, the more energy savings that can be obtained andthe shorter the financial pay back periods are.
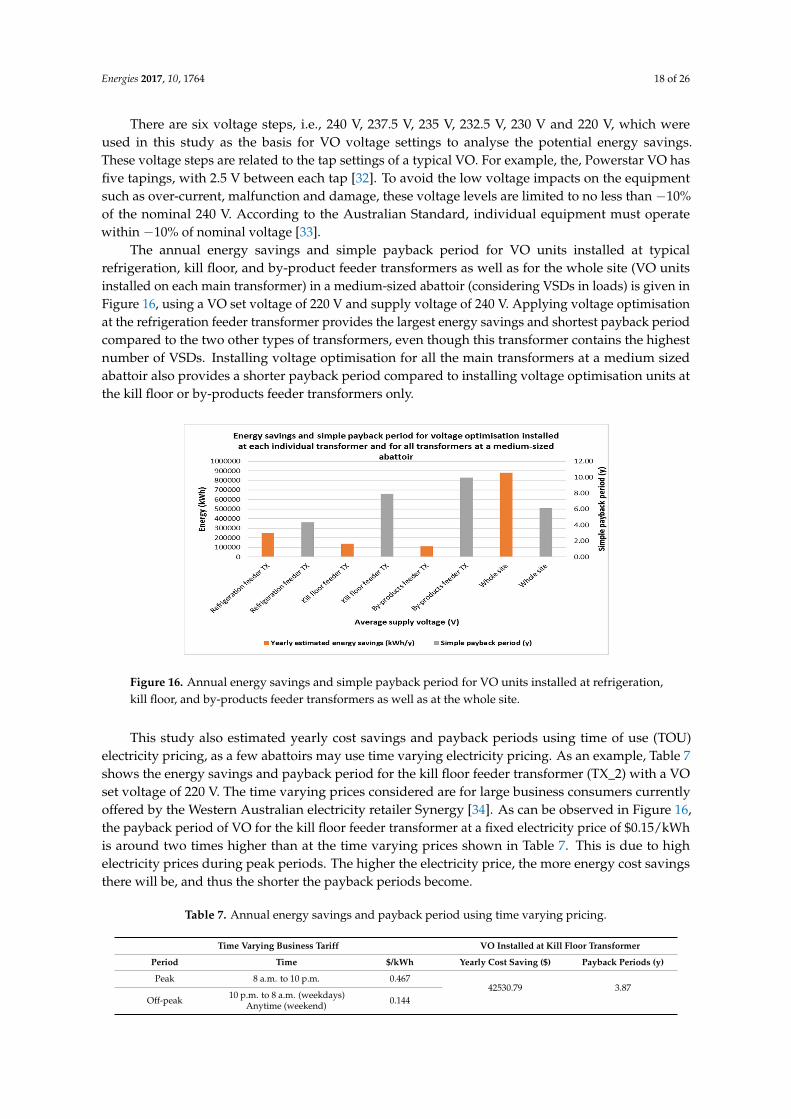
Energies 2017, 10, 1764 18 of 26
There are six voltage steps, i.e., 240 V, 237.5 V, 235 V, 232.5 V, 230 V and 220 V, which wereused in this study as the basis for VO voltage settings to analyse the potential energy savings.These voltage steps are related to the tap settings of a typical VO. For example, the, Powerstar VO hasfive tapings, with 2.5 V between each tap [32]. To avoid the low voltage impacts on the equipmentsuch as over-current, malfunction and damage, these voltage levels are limited to no less than −10%of the nominal 240 V. According to the Australian Standard, individual equipment must operatewithin −10% of nominal voltage [33].
The annual energy savings and simple payback period for VO units installed at typicalrefrigeration, kill floor, and by-product feeder transformers as well as for the whole site (VO unitsinstalled on each main transformer) in a medium-sized abattoir (considering VSDs in loads) is given inFigure 16, using a VO set voltage of 220 V and supply voltage of 240 V. Applying voltage optimisationat the refrigeration feeder transformer provides the largest energy savings and shortest payback periodcompared to the two other types of transformers, even though this transformer contains the highestnumber of VSDs. Installing voltage optimisation for all the main transformers at a medium sizedabattoir also provides a shorter payback period compared to installing voltage optimisation units atthe kill floor or by-products feeder transformers only.
Energies 2017, 10, 1764 18 of 26
equipment. The higher the voltage levels are, the more energy savings that can be obtained and the shorter the financial pay back periods are.
There are six voltage steps, i.e., 240 V, 237.5 V, 235 V, 232.5 V, 230 V and 220 V, which were used in this study as the basis for VO voltage settings to analyse the potential energy savings. These voltage steps are related to the tap settings of a typical VO. For example, the, Powerstar VO has five tapings, with 2.5 V between each tap [32]. To avoid the low voltage impacts on the equipment such as over-current, malfunction and damage, these voltage levels are limited to no less than −10% of the nominal 240 V. According to the Australian Standard, individual equipment must operate within −10% of nominal voltage [33].
The annual energy savings and simple payback period for VO units installed at typical refrigeration, kill floor, and by-product feeder transformers as well as for the whole site (VO units installed on each main transformer) in a medium-sized abattoir (considering VSDs in loads) is given in Figure 16, using a VO set voltage of 220 V and supply voltage of 240 V. Applying voltage optimisation at the refrigeration feeder transformer provides the largest energy savings and shortest payback period compared to the two other types of transformers, even though this transformer contains the highest number of VSDs. Installing voltage optimisation for all the main transformers at a medium sized abattoir also provides a shorter payback period compared to installing voltage optimisation units at the kill floor or by-products feeder transformers only.
Figure 16. Annual energy savings and simple payback period for VO units installed at refrigeration, kill floor, and by-products feeder transformers as well as at the whole site.
This study also estimated yearly cost savings and payback periods using time of use (TOU) electricity pricing, as a few abattoirs may use time varying electricity pricing. As an example, Table 7 shows the energy savings and payback period for the kill floor feeder transformer (TX_2) with a VO set voltage of 220 V. The time varying prices considered are for large business consumers currently offered by the Western Australian electricity retailer Synergy [34]. As can be observed in Figure 16, the payback period of VO for the kill floor feeder transformer at a fixed electricity price of $0.15/kWh is around two times higher than at the time varying prices shown in Table 7. This is due to high electricity prices during peak periods. The higher the electricity price, the more energy cost savings there will be, and thus the shorter the payback periods become.
Table 7. Annual energy savings and payback period using time varying pricing.
Time Varying Business Tariff VO Installed at Kill Floor Transformer Period Time $/kWh Yearly Cost Saving ($) Payback Periods (y)Peak 8 a.m. to 10 p.m. 0.467
42530.79 3.87 Off-peak
10 p.m. to 8 a.m. (weekdays) Anytime (weekend)
0.144
Figure 16. Annual energy savings and simple payback period for VO units installed at refrigeration,kill floor, and by-products feeder transformers as well as at the whole site.
This study also estimated yearly cost savings and payback periods using time of use (TOU)electricity pricing, as a few abattoirs may use time varying electricity pricing. As an example, Table 7shows the energy savings and payback period for the kill floor feeder transformer (TX_2) with a VOset voltage of 220 V. The time varying prices considered are for large business consumers currentlyoffered by the Western Australian electricity retailer Synergy [34]. As can be observed in Figure 16,the payback period of VO for the kill floor feeder transformer at a fixed electricity price of $0.15/kWhis around two times higher than at the time varying prices shown in Table 7. This is due to highelectricity prices during peak periods. The higher the electricity price, the more energy cost savingsthere will be, and thus the shorter the payback periods become.
Table 7. Annual energy savings and payback period using time varying pricing.
Time Varying Business Tariff VO Installed at Kill Floor Transformer
Period Time $/kWh Yearly Cost Saving ($) Payback Periods (y)
Peak 8 a.m. to 10 p.m. 0.46742530.79 3.87
Off-peak 10 p.m. to 8 a.m. (weekdays)Anytime (weekend) 0.144
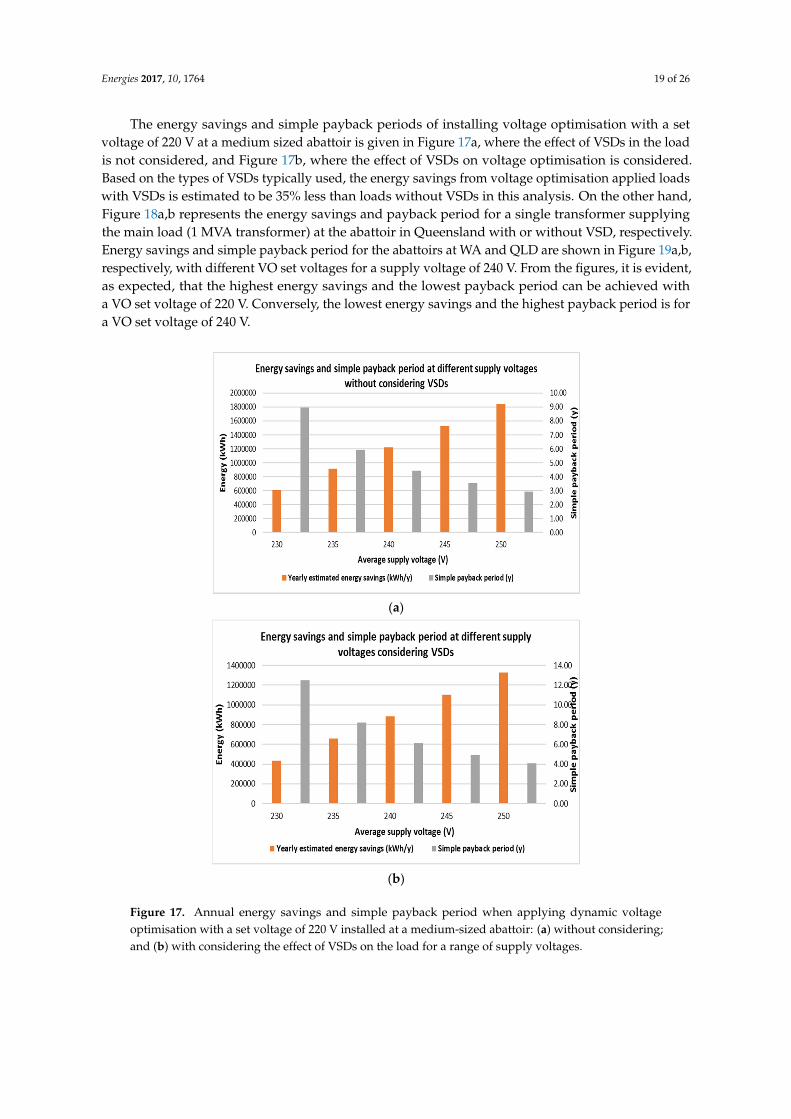
Energies 2017, 10, 1764 19 of 26
The energy savings and simple payback periods of installing voltage optimisation with a setvoltage of 220 V at a medium sized abattoir is given in Figure 17a, where the effect of VSDs in the loadis not considered, and Figure 17b, where the effect of VSDs on voltage optimisation is considered.Based on the types of VSDs typically used, the energy savings from voltage optimisation applied loadswith VSDs is estimated to be 35% less than loads without VSDs in this analysis. On the other hand,Figure 18a,b represents the energy savings and payback period for a single transformer supplyingthe main load (1 MVA transformer) at the abattoir in Queensland with or without VSD, respectively.Energy savings and simple payback period for the abattoirs at WA and QLD are shown in Figure 19a,b,respectively, with different VO set voltages for a supply voltage of 240 V. From the figures, it is evident,as expected, that the highest energy savings and the lowest payback period can be achieved witha VO set voltage of 220 V. Conversely, the lowest energy savings and the highest payback period is fora VO set voltage of 240 V.
Energies 2017, 10, 1764 19 of 26
The energy savings and simple payback periods of installing voltage optimisation with a set voltage of 220 V at a medium sized abattoir is given in Figure 17a, where the effect of VSDs in the load is not considered, and Figure 17b, where the effect of VSDs on voltage optimisation is considered. Based on the types of VSDs typically used, the energy savings from voltage optimisation applied loads with VSDs is estimated to be 35% less than loads without VSDs in this analysis. On the other hand, Figure 18a,b represents the energy savings and payback period for a single transformer supplying the main load (1 MVA transformer) at the abattoir in Queensland with or without VSD, respectively. Energy savings and simple payback period for the abattoirs at WA and QLD are shown in Figure 19a,b, respectively, with different VO set voltages for a supply voltage of 240 V. From the figures, it is evident, as expected, that the highest energy savings and the lowest payback period can be achieved with a VO set voltage of 220 V. Conversely, the lowest energy savings and the highest payback period is for a VO set voltage of 240 V.
(a)
(b)
Figure 17. Annual energy savings and simple payback period when applying dynamic voltage optimisation with a set voltage of 220 V installed at a medium-sized abattoir: (a) without considering; and (b) with considering the effect of VSDs on the load for a range of supply voltages.
Figure 17. Annual energy savings and simple payback period when applying dynamic voltageoptimisation with a set voltage of 220 V installed at a medium-sized abattoir: (a) without considering;and (b) with considering the effect of VSDs on the load for a range of supply voltages.
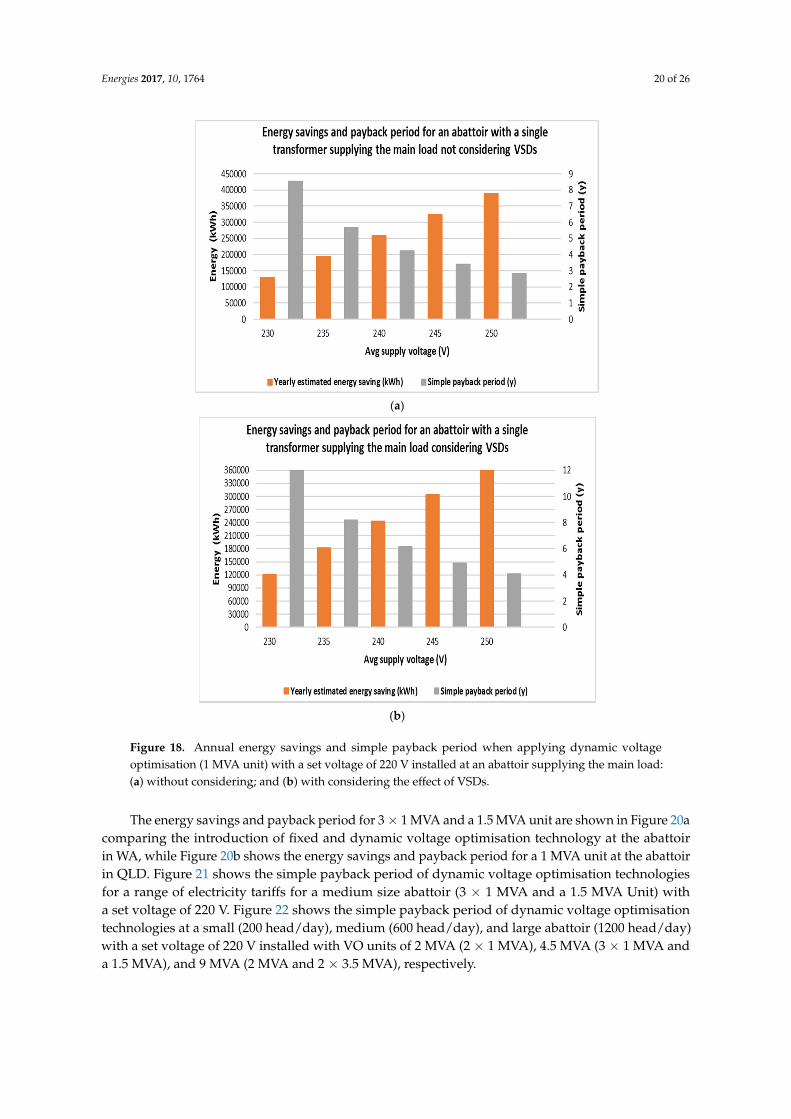
Energies 2017, 10, 1764 20 of 26
Energies 2017, 10, 1764 20 of 26
(a)
(b)
Figure 18. Annual energy savings and simple payback period when applying dynamic voltage optimisation (1 MVA unit) with a set voltage of 220 V installed at an abattoir supplying the main load: (a) without considering; and (b) with considering the effect of VSDs.
The energy savings and payback period for 3 × 1 MVA and a 1.5 MVA unit are shown in Figure 20a comparing the introduction of fixed and dynamic voltage optimisation technology at the abattoir in WA, while Figure 20b shows the energy savings and payback period for a 1 MVA unit at the abattoir in QLD. Figure 21 shows the simple payback period of dynamic voltage optimisation technologies for a range of electricity tariffs for a medium size abattoir (3 × 1 MVA and a 1.5 MVA Unit) with a set voltage of 220 V. Figure 22 shows the simple payback period of dynamic voltage optimisation technologies at a small (200 head/day), medium (600 head/day), and large abattoir (1200 head/day) with a set voltage of 220 V installed with VO units of 2 MVA (2 × 1 MVA), 4.5 MVA (3 × 1 MVA and a 1.5 MVA), and 9 MVA (2 MVA and 2 × 3.5 MVA), respectively.
Figure 18. Annual energy savings and simple payback period when applying dynamic voltageoptimisation (1 MVA unit) with a set voltage of 220 V installed at an abattoir supplying the main load:(a) without considering; and (b) with considering the effect of VSDs.
The energy savings and payback period for 3 × 1 MVA and a 1.5 MVA unit are shown in Figure 20acomparing the introduction of fixed and dynamic voltage optimisation technology at the abattoirin WA, while Figure 20b shows the energy savings and payback period for a 1 MVA unit at the abattoirin QLD. Figure 21 shows the simple payback period of dynamic voltage optimisation technologiesfor a range of electricity tariffs for a medium size abattoir (3 × 1 MVA and a 1.5 MVA Unit) witha set voltage of 220 V. Figure 22 shows the simple payback period of dynamic voltage optimisationtechnologies at a small (200 head/day), medium (600 head/day), and large abattoir (1200 head/day)with a set voltage of 220 V installed with VO units of 2 MVA (2 × 1 MVA), 4.5 MVA (3 × 1 MVA anda 1.5 MVA), and 9 MVA (2 MVA and 2 × 3.5 MVA), respectively.
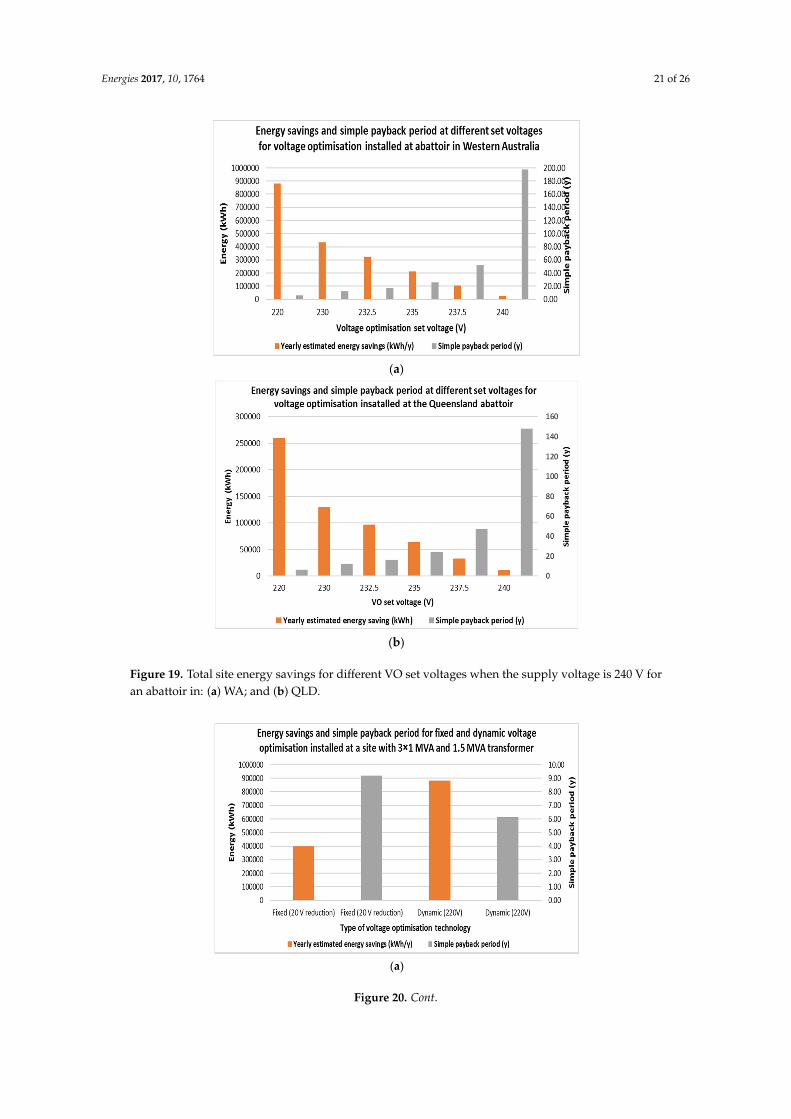
Energies 2017, 10, 1764 21 of 26Energies 2017, 10, 1764 21 of 26
(a)
(b)
Figure 19. Total site energy savings for different VO set voltages when the supply voltage is 240 V for an abattoir in: (a) WA; and (b) QLD.
(a)
Figure 19. Total site energy savings for different VO set voltages when the supply voltage is 240 V foran abattoir in: (a) WA; and (b) QLD.
Energies 2017, 10, 1764 21 of 26
(a)
(b)
Figure 19. Total site energy savings for different VO set voltages when the supply voltage is 240 V for an abattoir in: (a) WA; and (b) QLD.
(a)
Figure 20. Cont.
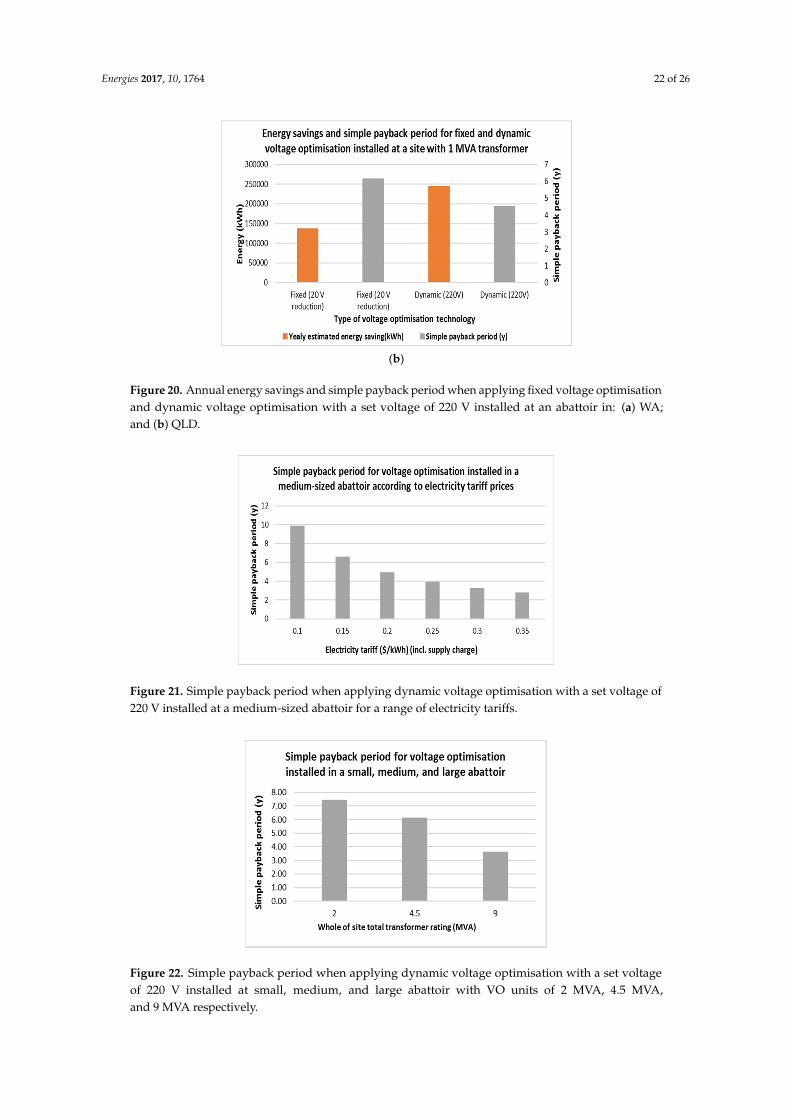
Energies 2017, 10, 1764 22 of 26
Energies 2017, 10, 1764 22 of 26
(b)
Figure 20. Annual energy savings and simple payback period when applying fixed voltage optimisation and dynamic voltage optimisation with a set voltage of 220 V installed at an abattoir in: (a) WA; and (b) QLD.
Figure 21. Simple payback period when applying dynamic voltage optimisation with a set voltage of 220 V installed at a medium-sized abattoir for a range of electricity tariffs.
Figure 22. Simple payback period when applying dynamic voltage optimisation with a set voltage of 220 V installed at small, medium, and large abattoir with VO units of 2 MVA, 4.5 MVA, and 9 MVA respectively.
Figure 20. Annual energy savings and simple payback period when applying fixed voltage optimisationand dynamic voltage optimisation with a set voltage of 220 V installed at an abattoir in: (a) WA;and (b) QLD.
Energies 2017, 10, 1764 22 of 26
(b)
Figure 20. Annual energy savings and simple payback period when applying fixed voltage optimisation and dynamic voltage optimisation with a set voltage of 220 V installed at an abattoir in: (a) WA; and (b) QLD.
Figure 21. Simple payback period when applying dynamic voltage optimisation with a set voltage of 220 V installed at a medium-sized abattoir for a range of electricity tariffs.
Figure 22. Simple payback period when applying dynamic voltage optimisation with a set voltage of 220 V installed at small, medium, and large abattoir with VO units of 2 MVA, 4.5 MVA, and 9 MVA respectively.
Figure 21. Simple payback period when applying dynamic voltage optimisation with a set voltage of220 V installed at a medium-sized abattoir for a range of electricity tariffs.
Energies 2017, 10, 1764 22 of 26
(b)
Figure 20. Annual energy savings and simple payback period when applying fixed voltage optimisation and dynamic voltage optimisation with a set voltage of 220 V installed at an abattoir in: (a) WA; and (b) QLD.
Figure 21. Simple payback period when applying dynamic voltage optimisation with a set voltage of 220 V installed at a medium-sized abattoir for a range of electricity tariffs.
Figure 22. Simple payback period when applying dynamic voltage optimisation with a set voltage of 220 V installed at small, medium, and large abattoir with VO units of 2 MVA, 4.5 MVA, and 9 MVA respectively.
Figure 22. Simple payback period when applying dynamic voltage optimisation with a set voltageof 220 V installed at small, medium, and large abattoir with VO units of 2 MVA, 4.5 MVA,and 9 MVA respectively.

Energies 2017, 10, 1764 23 of 26
6. Discussion
From the review of the literature, it is evident that there is a significant scope for the Australianred meat processing industry to reduce their energy consumption and improve power quality byoptimising voltage levels through the application of voltage optimisation technologies. The literaturereview has demonstrated that voltage optimisation technologies have been widely deployed indifferent types of industries including meat processing plants around the world and are still inuse, providing benefits to industrial-scale electricity consumers. However, up until now, no installationof VO technologies within the Australian red meat processing industry has been reported. It is clearlyevident from the literature that, by adopting VO technologies, it is possible to reduce energy costssignificantly in the industry and improve power quality.
The potential energy savings from VO are achieved by reducing the losses in the equipment beingsupplied, and vary according to the type of equipment. If the load is linear, a reduction in voltage from240 to 230 V will reduce the energy consumption by 8%, while a reduction to 220 V will yield a savingof 16% [35]. The equipment will still operate correctly at the reduced voltage, if it is still well withinthe statutory limits (i.e., 220 V), and there will usually also be benefits of increased life and reducedmaintenance of the equipment.
Voltage reduction does not work with all types of loads. Variable-speed inverter drives,high-frequency lighting ballasts, and switch-mode power supplies, for example, will generally not yieldsignificant savings at a reduced voltage because the voltage fed to the load is generated electronicallyand is not affected by the supply voltage. Temperature-controlled heating is another type of loadwhere no energy saving will be obtained, as the heater will still need to consume the same amount ofenergy to perform its required function [35].
The analysis for Case Study Site 1 showed that, if 230 V could be supplied and maintained forone main transformer alone, then annual energy and cost savings could potentially be 70,348 kWh.The analysis for Case Study Site 2 showed that maintaining the voltage level at 230 V for the site asa whole could potentially save 122,758 kWh annually. Apart from the savings in energy, other benefitsinclude less stress on electrical equipment and therefore improved lifetimes with less maintenance,as well as (depending on the technology used) improved power factors and less loss due to harmonics.The economic analysis has shown that, for a typical mid-sized (600 head a day) abattoir with a supplyvoltage of 240 volts and an electricity price of AU $0.15 a kWh, the installation of a voltage optimiserwill have a payback period of 3–6 years, depending on the supply voltage, type of feeder line,and number of VSDs installed. Due to their larger electricity consumption, larger abattoirs will havea lower payback period, as will the use of voltage optimisers on individual large electricity feederlines, such as refrigeration, compared to the whole site. The use of dynamic voltage optimisation ismore economically favourable than using voltage reduction.
The output of the project will also enable engineering and operations staff to be better informedabout the economic and technical benefits of using voltage stabilisation and optimisation technologiesfor abattoir. They can then use this to undertake a full feasibility and costing study for their site. It isanticipated that with the information provided in the project outcomes will:
• Save upfront time and costs;• Mitigate risk and enable a more targeted assessment by facilities;• Consider the total cost of ownership;• Expedite the implementation of the technology; and• Enable the performance of the procurement process to be carried out in an efficient manner.
This is the first study of its kind and therefore further research is required to developa comprehensive techno-economic evaluation that overcomes the limitations of the current studyin the following areas:
• Conduct the study with one-year load profiles: The current study has considered only one week ofcollected data, which cannot capture all of the voltage disturbances and variations in the demand
Energies 2017, 10, 1764 24 of 26
at the case study sites; therefore, the presented results, specifically the energy savings and paybackperiods, are intended to be more indicative rather than descriptive. To capture a more realisticactual scenario, it is necessary to run a similar analysis with one-years’ worth of data.
• Considering operational and maintenance costs: The operational costs of voltage optimisationtechnologies are not considered in the study in order for the results to remain indicative andapplicable to any Australian meat processing facility, since operation costs will vary significantlyaccording to the type of VO technology applied, where it is applied (location of the site), and howit is applied. However, a site-specific analysis will require details on the operational costs ofVO technologies specific to the site under consideration.
7. Conclusions
Voltage optimisation technologies have been widely deployed in different types of industriesaround the world to keep the site voltage within an optimum level that will reduce energy consumptionand greenhouse gas emissions, along with maintaining adequate power quality at the site. To determinethe suitability of voltage optimisation technology for the Australian red meat processing industry,this study has undertaken a techno-economic assessment. Through the analysis of collected electricitycharacteristics (e.g., voltage, current, active power, and power factor) and power quality (harmonicdistortion and under- and overvoltage events) data over time, it was found that most feeders ona typical red meat processing site would be able to save energy and ensure enhanced power qualitywith the targeted implementation of voltage optimisation equipment. The techno-economic analysishas shown that there are no technical reasons why voltage optimisers should not be installed inred meat abattoirs, and there are in fact many advantages in doing so. Apart from the savings inenergy, these include less stress on electrical equipment and therefore improved lifetimes with lessmaintenance, as well as (depending on the technology used) improved power factors and less lossesdue to harmonics. The uptake and implementation of voltage optimisation technology at one abattoircould serve as the catalyst for widespread installation at meat processing facilities throughout Australia.This study potentially serves as a catalyst for improved energy consumption, power quality and,therefore, potentially improved returns on equipment life right across the red meat processing industry.
Acknowledgments: The authors would like to thank AMPC (Australian Meat Processing Corporation) for theirfinancial support and guidance to undertake this research. The authors also express their gratitude to the casestudy abattoir in Western Australia and Queensland for their outstanding support in data collection and analysis.
Author Contributions: GM and C.L. developed the methodology; GM, B.W., C.L. and M.M.R. contributed indata collection and analysis. B.W., M.M.R. and G.R. analyzed the data; C.L., B.W., G.R. and J.W. contributed inliterature review, data interpretation and review; GM wrote the paper.
Conflicts of Interest: The authors declare no conflict of interest.
References
1. Tang, P.; Jones, M. Energy Consumption Guide for Small to Medium Red Meat Processing Facilities; Australian MeatProcessor Corporation: Sydney, Australia, 2013.
2. Brooks, R.; Visser, K. Saving Electrical Energy and Costs Phase Changing Materials; Meat & Livestock Australia Limited:Sydney, Australia, 2012.
3. Shafiullah, G.M.; Watson, B.; Lund, C.; Rahman, M. Voltage optimisation technology for an Australianabattoir to reduce power quality impacts and energy costs. In Proceedings of the Australian PowerEngineering Conference (AUPEC), Melbourne, Australia, 19–22 November 2017.
4. “AS60038–2000 Standard Voltages”, SAI Global. 2016. Available online: http://infostore.saiglobal.com/store/details.aspx?ProductID=3211556 (accessed on 15 May 2017).
5. Ergon Energy. Available online: https://www.ergon.com.au/ (accessed on 15 April 2017).6. Energywise. Solutions for Energy Cost Reduction. Available online: http://energywise.net.au/ (accessed on
5 March 2017).
Energies 2017, 10, 1764 25 of 26
7. Tang, P.; Horwood, R.; Johns, M. Literature Review Meat Technology Update; Australian Meat Processor Corporation:Sydney, Australia, 2013.
8. Voltage Optimisation: Beyond the Hype; Utility Systems Technologies, Inc.: Watervliet, NY, USA, 2016.Available online: http://www.ustpower.com/wp-content/uploads/2014/12/UST_White_Paper_Voltage_Optimization_v1dot1.pdf (accessed on 15 May 2017).
9. SMEC. Available online: http://www.smec.com/en_au/ (accessed on 5 May 2017).10. What Is Voltage Optimization, Captech. 2016. Available online: http://www.captech.com.au/wp-content/
uploads/2015/12/Captech-What-is-Voltage-Optimisation.pdf (accessed on 6 April 2017).11. Wilson, T. Measurement and verification of distribution voltage optimization results for the IEEE Power &
Energy Society. In Proceedings of the IEEE Power and Energy Society General Meeting, Providence, RL,USA, 25–29 July 2010.
12. Babu, P.; Divya, V. Application of ANN and DSM techniques for peak load management a case study.In Proceedings of the IEEE Region 8 International Conference on Computational Technologies in Electricaland Electronics Engineering, Novosibirsk, Russia, 21–25 July 2008.
13. Lawrence, R. Voltage optimization. IEEE Ind. Appl. Mag. 2006, 12, 28–33. [CrossRef]14. Leitermann, O.; Martinelli, V.; Simonelli, J. Estimation of customer voltages for planning of conservation
voltage reduction. In Proceedings of the IEEE Power & Energy Society General Meeting, Denver, CO, USA,26–30 July 2015.
15. Power Controllers—Energy and Earth Resources. 2016. Available online: http://www.energyandresources.vic.gov.au/energy/about/legislation-and-regulation/energy-saver-incentive/scheme-documents/review-of-activity-submissions-for-the-energy-saver-incentive-2012/power-controllers (accessed on 20 May 2017).
16. Sustain: Voltage Optimisation. Sustain: The Alliance for Better Food and Farming. 2016. Available online:http://www.sustainweb.org/resources/files/reports/Voltage_optimisation.pdf (accessed on 11 June 2017).
17. Voltage Control—Choosing the Best Energy Efficiency to Save. Hylec Energy Solutions. 2016. Available online:http://www.hylec.com.au (accessed on 12 June 2017).
18. Voltage Optimisation/Everybody Saving Energy. 2016. Available online: http://www.everybodysavingenergy.com.au/energy-saving-products/voltage-optimisation/ (accessed on 27 April 2017).
19. Case Studies—Powerstar, Powerstar. 2016. Available online: http://powerstar.com/au/case-studies/(accessed on 16 April 2017).
20. PowerSines. PowerSines Smart Energy Efficiency & Voltage Optimisation—Case Studies—ComEC CaseStudies—Smart Energy Savings at the Moses Chicken Farm. 2016. Available online: http://www.powersines.com/ComEC_CaseStudy_MosesChickenFarm (accessed on 25 May 2017).
21. Agriculture—Pig Farm—VO4, VO4 Voltage Optimisation System. 2016. Available online: https://vo4.co.uk/case-studies/agriculture-pig-farm/ (accessed on 5 January 2017).
22. NSW Office of Environment and Heritage, “I Am Your Guide to Voltage Optimisation: Is It Right for You?”.Available online: http://www.environment.nsw.gov.au/resources/business/160226-voltage-optimisation-guide.pdf (accessed on 15 June 2017).
23. Power Analyzer Fluke 435 Series II with Advanced Functions. 2017. Available online: http://en-us.fluke.com/products/power-quality-analyzers/fluke-435-ii-power-quality.html (accessed on 5 December 2016).
24. Voltage Power Optimisation—Forum Enviro, Forum Enviro. 2017. Available online: http://www.forumenviro.com.au/voltage-power-optimisation/ (accessed on 5 May 2017).
25. Hom, L. Justifying and Delivering Voltage Optimisation on the Mod Estate, 1st ed.; Defence Estates, Ministry ofDefence: Sutton Coldfield, UK, 2010. Available online: https://www.gov.uk/government/uploads/system/uploads/attachment_data/file/33611/pg01_10.pdf (accessed on 5 May 2017).
26. Nam, S.; Kang, S.; Lee, J.; Ahn, S.; Choi, J. Evaluation of the Effects of Nationwide Conservation VoltageReduction on Peak-Load Shaving Using SOMAS Data. Energies 2013, 6, 6322–6334. [CrossRef]
27. Vega-Fuentes, E.; Cerezo-Sánchez, J.; Rosario, S.; Vega-Martínez, A. Voltage Reduction Field Test ona Distribution Substation. Int. J. Electr. Energy 2015, 3, 1–5. [CrossRef]
28. Essential Energy. Supply Standards: Electricity Supply Standard, 1st ed.; Essential Energy: Sydney, Australia, 2011.Available online: http://www.essentialenergy.com.au/asset/cms/pdf/aasp/CEOP8026.pdf (accessed on 5 June 2017).
29. Power Monic. Available online: http://www.chkpowerquality.com.au/products/ (accessed on 15 January 2017).30. Personal Communication with Industry Suppliers. Available online: http://powerstar.com/au/what-is-
voltage-optimisation (accessed on 4 April 2017).
Energies 2017, 10, 1764 26 of 26
31. ORTEA. 2014/2015 Price List. Available online: http://vitasvet.ru/stabilizator_ORTEA/vitasvet.pdf(accessed on 30 May 2017).
32. Powerstar. Technical Overview, 1st ed.; Powerstar: Melbourne, Australia, 2017. Available online: http://www.emscap.com.au/resources/Powerstar%20Aus%20Technical%20Brochure.pdf (accessed on 2 March 2017).
33. Halliday, C.; Urquart, D. Voltage and Equipment Standards Misalignment; the Electric Energy Society ofAustralia: Canberra, Australia, 2011.
34. Synergy Business Saver. 2017. Available online: https://www.synergy.net.au/Large-business/Energy-products/Electricity-plans/Synergy-Business-Saver (accessed on 5 June 2017).
35. University of Nottingham. Voltage Optimisation Guide; University of Nottingham: Nottingham, UK, 2017;Available online: http://www.nottingham.ac.uk/etc/guide-voltageoptimisation.php (accessed on 15 June 2017).
© 2017 by the authors. Licensee MDPI, Basel, Switzerland. This article is an open accessarticle distributed under the terms and conditions of the Creative Commons Attribution(CC BY) license (http://creativecommons.org/licenses/by/4.0/).