abares national wood processing survey
TRANSCRIPT
ABARES National Wood Processing Survey
2010–11 Kevin Burns and Bethany Burke
Research by the Australian Bureau of Agricultural
and Resource Economics and Sciences
Research report 12.4 June 2012
© Commonwealth of Australia 2012
Ownership of intellectual property rights
Unless otherwise noted, copyright (and any other intellectual property rights, if any) in this publication is owned by the Commonwealth of Australia (referred to as the Commonwealth).
Creative Commons licence
All material in this publication is licensed under a Creative Commons Attribution 3.0 Australia Licence, save for content supplied by third parties, logos and the Commonwealth Coat of Arms.
Creative Commons Attribution 3.0 Australia Licence is a standard form licence agreement that allows you to copy, distribute, transmit and adapt this publication provided you attribute the work. A summary of the licence terms is available from creativecommons.org/licenses/by/3.0/au/deed.en. The full licence terms are available from creativecommons.org/licenses/by/3.0/au/legalcode.
This publication (and any material sourced from it) should be attributed as: Burns, K & Burke, B 2012, ABARES National Wood Processing Survey: 2010–11, ABARES research report 12.4, Canberra, June. CC BY 3.0.
Cataloguing data
Burns, K & Burke, B 2012, ABARES National Wood Processing Survey: 2010–11, ABARES research report 12.4, Canberra, June.
ISSN 1447-8358 ISBN 978-1-74 323-030-5 ABARES project 43214 Internet
ABARES National Wood Processing Survey: 2010–11 is available at daff.gov.au/abares/publications.
Australian Bureau of Agricultural and Resource Economics and Sciences (ABARES) Postal address GPO Box 1563 Canberra ACT 2601 Switchboard +61 2 6272 2010| Facsimile +61 2 6272 2001 Email [email protected] Web daff.gov.au/abares
Inquiries regarding the licence and any use of this document should be sent to [email protected].
The Australian Government acting through the Department of Agriculture, Fisheries and Forestry represented by the Australian Bureau of Agricultural and Resource Economics and Sciences, has exercised due care and skill in the preparation and compilation of the information and data in this publication. Notwithstanding, the Department of Agriculture, Fisheries and Forestry, ABARES, its employees and advisers disclaim all liability, including liability for negligence, for any loss, damage, injury, expense or cost incurred by any person as a result of accessing, using or relying upon any of the information or data in this publication to the maximum extent permitted by law.
Acknowledgements
ABARES and Forest and Wood Products Australia (FWPA) jointly funded the survey. It was developed with advice and
assistance from the Forestry Branch of the Australian Government Department of Agriculture, Fisheries and Forestry
(DAFF), FWPA, and the members of the ABARES–FWPA project steering committee: the Australian Forest Products
Association (AFPA), the Australian Timber Importers Federation (ATIF) and the Engineered Wood Products Association of
Australasia (EWPAA). Assistance was also provided by DAFF’s Levies Revenue Service (LRS) and several state forest agencies
and state-based industry associations. Ongoing surveys will depend on the future support of these organisations. The
authors thank Rohan Best, Ian Frakes, Mihir Gupta and Ziaul Hoque of ABARES for assistance in undertaking surveys of the
sawmills, and Walter Shafron and Dale Ashton for advice with the statistical analysis.

ii
Contents Summary ............................................................................................................................................................ 1
1 Introduction .......................................................................................................................................... 2
2 Methodology ......................................................................................................................................... 3
Validating the number of wood processors in Australia ..................................................... 3
Developing the survey questionnaire ......................................................................................... 6
Selecting a representative sample and undertaking the survey ....................................... 7
Aggregating and weighting the results ....................................................................................... 8
3 Survey results .................................................................................................................................... 10
Estimated log input ......................................................................................................................... 10
Comparison of log input volumes with estimates of logs harvested............................ 11
State sawmill characteristics ....................................................................................................... 13
Structure of Australia’s wood processing industry ............................................................ 14
Final production of sawnwood ................................................................................................... 15
Employment ....................................................................................................................................... 16
Other survey information ............................................................................................................. 17
4 Conclusion ........................................................................................................................................... 19
Appendix A ABARES Mill Survey 2010–11 questionnaire .......................................................... 20
References ...................................................................................................................................................... 22
Tables
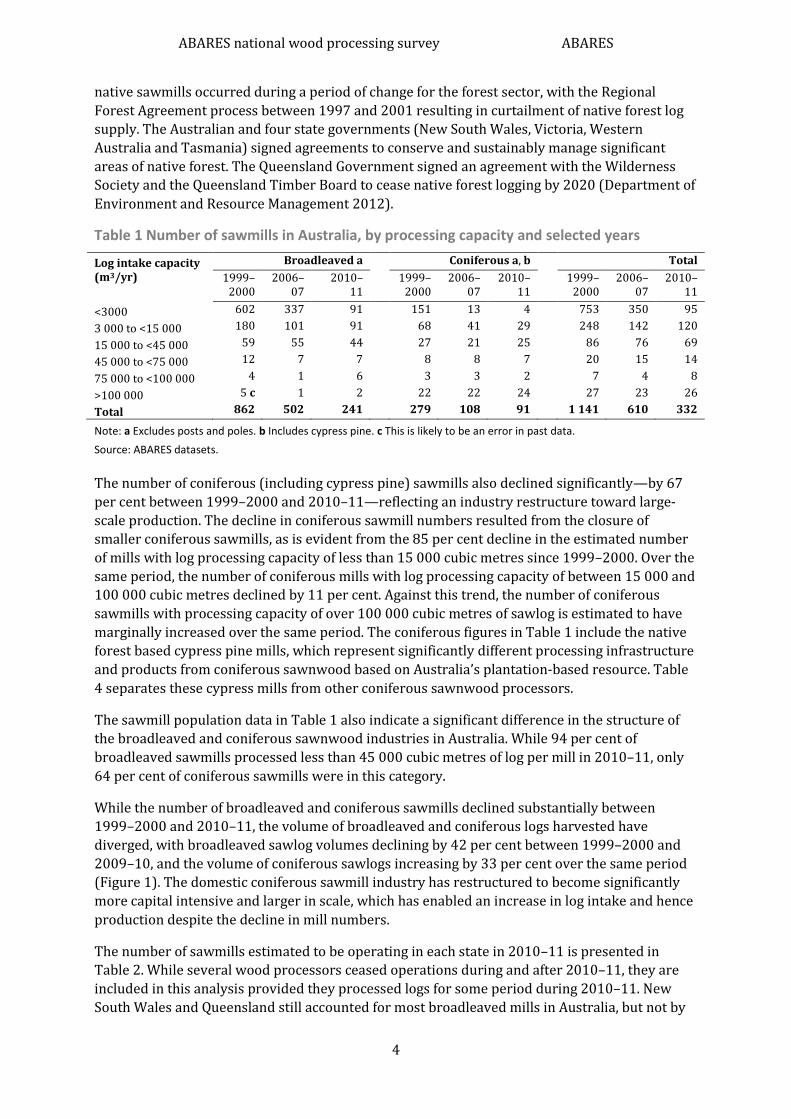
Table 1 Number of sawmills in Australia, by processing capacity and selected years ....... 4
Table 2 Number of mills in Australia, by processing capacity and state, 2010–11 .............. 5
Table 3 Sawmill population, sample and proportion surveyed (excl. Tasmania) ................. 8
Table 4 Survey results—sawmill log input, by source and state, 2010–11 .......................... 10
Table 5 Comparison of survey results with ABARES estimates of logs harvested, 2010–11 (excl. Tasmania) ......................................................................................................................... 13
Table 6 Sawmill and post & pole mill characteristics, by state, 2010–11 ............................. 14
Table 7 Broadleaved and coniferous sawmill characteristics, by size, 2010–11 ............... 15
Table 8 Final sawnwood production, 2010–11 ............................................................................... 16
Table 9 Direct employment in the wood processing industry, 2010–11 .............................. 17

iii
Figures
Figure 1 Number of sawmills and volume of sawlogs harvested in Australia, 1999–2000 to 2010–11 ............................................................................................................................................. 5
Figure 2 National broadleaved sawlog input, by sawmill size and forest tenure, 2010–11 ................................................................................................................................................................. 12
Figure 3 Product shares for final sawnwood production in 2010–11, by species ............. 16
Figure 4 Outlook for demand of sawmill products, by industry, 2010–11 ........................... 17
Figure 5 Use of residue material, 2010–11 ....................................................................................... 18

ABARES national wood processing survey ABARES
1
Summary Between November 2011 and March 2012, ABARES undertook a survey of Australian wood
processors to obtain up-to-date mill-specific data, including mill inputs, production and
employment. This survey updates the Australian Bureau of Agricultural and Resource
Economics 2007 national sawmill survey.
The results from this survey provide consistent and reliable estimates of the production of
broadleaved and coniferous wood products, using a standardised approach and definitions
across each state of mainland Australia. Mill survey results for Tasmania have been adopted
from a survey undertaken by Schirmer and colleagues (2011). Excluding sawmills in Tasmania,
ABARES received a survey response from around 36 per cent of broadleaved sawmills, 57 per
cent of coniferous sawmills and 52 per cent of cypress pine sawmills. While the survey results
are broadly consistent with comparable datasets, such as the estimated volumes of logs
harvested in Australia in 2010–11, some discrepancies remain, and future surveys will work
toward resolving these.
Because of regular changes that occur in Australia’s forest sector, the ABARES database of wood
processors was validated before undertaking the survey. This involved consulting industry
associations and directly contacting many mills. The validated database includes 332 sawmills,
more than half of which are small processors of broadleaved sawlogs, each with an annual
processing capacity of less than 15 000 cubic metres of sawlog. It is estimated there were 241
broadleaved and 91 coniferous sawmills (comprising 68 sawmills based on the coniferous
plantation resource, and 23 cypress pine sawmills) in Australia in 2010–11. The number of
sawmills in Australia has fallen significantly, with broadleaved sawmills falling by 72 per cent
and coniferous (including cypress pine) sawmills by 67 per cent since 1999–2000.
The results of the survey, combined with data for Tasmania (Schirmer et al. 2011), show that
around two million cubic metres of broadleaved sawlogs, over eight million cubic metres of
coniferous sawlogs, and 186 000 cubic metres of cypress pine sawlogs were processed in
Australian sawmills during 2010–11. Broadleaved sawnwood production in 2010–11 was
estimated at around 730 000 cubic metres, coniferous sawnwood production at around 3.7
million cubic metres, and cypress sawnwood production at around 81 000 cubic metres (final
sawnwood production). It is estimated that 28 per cent of broadleaved sawnwood output from
Australian sawmills was produced as dry appearance grade sawnwood, while green structural,
green other and dry structural grade sawnwood also accounted for significant shares of final
broadleaved sawnwood production. In contrast, it is estimated that more than half of all final
coniferous sawnwood output was produced as dry structural timber.
According to the ABARES wood processing database, the broadleaved sawmilling industry is
characterised by a large number of relatively small mills in New South Wales and Queensland.
Compared with other states, both average mill size and sawnwood recovery rates were
estimated to be relatively low in Tasmania. The coniferous industry, excluding cypress pine
mills, is more uniform, with mill size averaging above 100 000 cubic metres across Australia.
The cypress sawnwood industry consists of relatively small mills in New South Wales and
Queensland only. The post and pole industry is more evenly distributed across Australia, with
average mill size similar to that of the cypress industry. The wood-based panel industry is also
distributed fairly evenly across the states, with more than half having a processing capacity of
100 000 cubic metres or greater.

ABARES national wood processing survey ABARES
2
1 Introduction The availability of up-to-date reliable information about production in Australia’s forest sector is
critical for timely and targeted government policies and for private business investment
decisions.
However, in recent years some information has not been available for some parts of the forest
sector. While production estimates for Australia’s pulp and paper and wood-based panels
industries are available, through collection and public disclosure of data by industry associations
and ABARES, over the past decade several national and state-based surveys of sawmilling have
ceased. This has meant many of the changes to sawnwood processing over the past decade have
not been recorded. Such changes have resulted from shifts in native forest management,
privatisation of many plantation estates and increased competition from overseas.
In 2007 ABARE undertook a sawmill survey to examine some of these changes, and estimated
the extent of production in Australia’s broadleaved and coniferous sawmill industries (Burns et
al. 2009). The 2007 survey highlighted the restructuring that had occurred in these industries
since 1999–2000. Over this period the number of broadleaved mills declined by 52 per cent, and
coniferous mill numbers (including cypress pine) fell by 37 per cent. Most of these closures
occurred among the smaller mills, those that processed logs more intensively, but generally with
higher production costs. A consequence of the Regional Forest Agreements of the late 1990s and
the early 2000s was consolidation of the sawmilling industry and a structural shift toward larger
mills capable of processing logs more efficiently and maintaining competitiveness in both import
and export markets.
Structural adjustments have continued since the 2007 survey. They reflect continued changes to
Australia’s forest management practices, with further restrictions or reductions in availability of
logs from public native forests in some states, tighter regulation of private native forests and
ongoing privatisation of public plantations. The survey results presented in this report
document many of the changes that occurred between 2006–07 and 2010–11.
For this survey, ABARES undertook a comprehensive assessment of the current wood
processing industry in Australia, to estimate the number and size of mills in operation. This
survey of 138 wood processors provided a valuable snapshot of the wood processing industry’s
current structure, the amount and source of logs for processing and changes to the efficiency of
log processing. It also provided processors with the opportunity to answer questions about the
number of people employed in these activities and the outlook for their products.

ABARES national wood processing survey ABARES
3
2 Methodology This chapter discusses the approach adopted for the ABARES 2010–11 wood processing survey,
and the process involved in estimating population data based on the survey sample for the wood
processing industry. Tasks consisted of:
validating the number of wood processors in Australia
developing the survey questionnaire
selecting a representative sample and undertaking the survey
aggregating and weighting the results.
Validating the number of wood processors in Australia
ABARES maintains a comprehensive database of wood processing facilities in Australia.
However, each year Australia’s forest sector undergoes some degree of restructuring, including
mill openings and closures, investments to change capacity or products, and changes in
ownership. To maintain an up-to-date database of wood processing mills in Australia, ABARES
regularly consults a variety of sources, including state forest agencies, industry associations and
internet and telephone listings.
For this survey, ABARES devoted significant effort to compiling and cross-checking its mill
population database. ABARES attempted telephone contact for all mills to ensure mill-specific
data, such as mill type, log species and input capacity, were correct. Where no operational
telephone number could be ascertained, mills were assumed closed and were removed from the
mill population list. Although an effort was made to include all mill sizes in the survey,
estimating the number of small mills is difficult as many mobile mills may not belong to existing
mill registers or are difficult to contact. In addition, some definitional issues persist about the
difference between small sawmills and other manufacturers that produce craft products.
ABARES received help from several state-based industry associations to identify mills to survey.
Validating the number of mills currently processing logs is an important first step in this survey.
While this was also undertaken in the 2007 study, the mill population estimates presented in the
current report were more comprehensively validated than in previous years. Hence, some of the
differences in mill numbers estimated between surveys may be due to greater reliability of
estimates in the present survey.
Table 1 presents the sawmill population estimates ABARES compiled for 2010–11, along with
previous estimates of mill numbers in Australia. Historical data relating to other wood
processors, such as posts and poles and wood-based panels, are not available. Data for 1999–
2000 were published in Australian forest and wood products statistics (ABARES 2011) and are
based on state government records, which in some cases were not regularly maintained. As a
result, historical estimates of mill numbers may contain errors. Nevertheless, the data indicate a
significant decline in the estimated number of sawmills between 1999–2000 and 2010–11.
The total number of sawmills in Australia in 2010–11 is estimated to be only 29 per cent of the
1999–2000 population. Over this period the number of broadleaved sawmills, which continue to
be dependent on the native forest resource, is estimated to have fallen by 72 per cent. This
reduction occurred principally among smaller mills (with annual processing capacity of less than
3000 cubic metres), the number of which declined by 85 per cent. Consolidation of broadleaved
ABARES national wood processing survey ABARES
4
native sawmills occurred during a period of change for the forest sector, with the Regional
Forest Agreement process between 1997 and 2001 resulting in curtailment of native forest log
supply. The Australian and four state governments (New South Wales, Victoria, Western
Australia and Tasmania) signed agreements to conserve and sustainably manage significant
areas of native forest. The Queensland Government signed an agreement with the Wilderness
Society and the Queensland Timber Board to cease native forest logging by 2020 (Department of
Environment and Resource Management 2012).
Table 1 Number of sawmills in Australia, by processing capacity and selected years
Log intake capacity (m3/yr)
Broadleaved a Coniferous a, b Total
1999–2000
2006–07
2010–11
1999–2000
2006–07
2010–11
1999–2000
2006–07
2010–11
<3000 602 337 91 151 13 4 753 350 95
3 000 to <15 000 180 101 91 68 41 29 248 142 120
15 000 to <45 000 59 55 44 27 21 25 86 76 69
45 000 to <75 000 12 7 7 8 8 7 20 15 14
75 000 to <100 000 4 1 6 3 3 2 7 4 8
>100 000 5 c 1 2 22 22 24 27 23 26
Total 862 502 241 279 108 91 1 141 610 332
Note: a Excludes posts and poles. b Includes cypress pine. c This is likely to be an error in past data.
Source: ABARES datasets.
The number of coniferous (including cypress pine) sawmills also declined significantly—by 67
per cent between 1999–2000 and 2010–11—reflecting an industry restructure toward large-
scale production. The decline in coniferous sawmill numbers resulted from the closure of
smaller coniferous sawmills, as is evident from the 85 per cent decline in the estimated number
of mills with log processing capacity of less than 15 000 cubic metres since 1999–2000. Over the
same period, the number of coniferous mills with log processing capacity of between 15 000 and
100 000 cubic metres declined by 11 per cent. Against this trend, the number of coniferous
sawmills with processing capacity of over 100 000 cubic metres of sawlog is estimated to have
marginally increased over the same period. The coniferous figures in Table 1 include the native
forest based cypress pine mills, which represent significantly different processing infrastructure
and products from coniferous sawnwood based on Australia’s plantation-based resource. Table
4 separates these cypress mills from other coniferous sawnwood processors.
The sawmill population data in Table 1 also indicate a significant difference in the structure of
the broadleaved and coniferous sawnwood industries in Australia. While 94 per cent of
broadleaved sawmills processed less than 45 000 cubic metres of log per mill in 2010–11, only
64 per cent of coniferous sawmills were in this category.
While the number of broadleaved and coniferous sawmills declined substantially between
1999–2000 and 2010–11, the volume of broadleaved and coniferous logs harvested have
diverged, with broadleaved sawlog volumes declining by 42 per cent between 1999–2000 and
2009–10, and the volume of coniferous sawlogs increasing by 33 per cent over the same period
(Figure 1). The domestic coniferous sawmill industry has restructured to become significantly
more capital intensive and larger in scale, which has enabled an increase in log intake and hence
production despite the decline in mill numbers.
The number of sawmills estimated to be operating in each state in 2010–11 is presented in
Table 2. While several wood processors ceased operations during and after 2010–11, they are
included in this analysis provided they processed logs for some period during 2010–11. New
South Wales and Queensland still accounted for most broadleaved mills in Australia, but not by

ABARES national wood processing survey ABARES
5
as significant a margin as in 2006–07. In 2006–07, the proportion of broadleaved sawmills in the
smallest size category (less than 3000 cubic metres) in these states was estimated to be 67 per
cent in New South Wales and 78 per cent in Queensland; this is estimated to have declined to 41
per cent and 35 per cent respectively in 2010–11. This reflects the large number of small
broadleaved sawmill closures that occurred in Australia since 2006–07, although some of this
decline may be due to the comprehensive mill population validation undertaken for this study.
Figure 1 Number of sawmills and volume of sawlogs harvested in Australia, 1999–2000 to 2010–11
Note: Sawmill numbers include cypress sawmills and exclude post and pole mills; sawlog harvest excludes estimates of
sawlog exports; coniferous sawlog harvest includes cypress pine. Finalised harvest volumes not available for 2010–11.
Data source: ABARES
Table 2 Number of mills in Australia, by processing capacity and state, 2010–11
Log intake capacity (m3/yr)
NSW a Vic. Qld SA WA Tas. Aust.
Broadleaved
<3000 36 11 19 0 8 17 91
3 000 to <15 000 27 15 27 0 4 18 91
15 000 to <45 000 19 8 8 0 4 5 44
45 000 to <75 000 4 0 0 0 1 2 7
75 000 to <100 000 0 0 0 0 2 4 6
>100 000 1 1 0 0 0 0 2
Total 87 35 54 0 19 46 241
Coniferous b
<3 000 1 0 0 0 0 0 1
3 000 to <15 000 2 2 5 5 2 0 16
15 000 to <45 000 4 2 6 6 0 0 18
45 000 to <75 000 3 0 2 1 0 1 7
75 000 to <100 000 0 0 0 2 0 0 2
>100 000 7 7 3 4 1 2 24
Total 17 11 16 18 3 3 68
Post & pole total 3 7 3 2 4 3 22
Cypress pine total 5 0 18 0 0 0 23
Wood based panels total 7 3 7 2 2 4 25
Note: a Includes ACT. b Excludes cypress pine.
Source: ABARE datasets
0
1000
2000
3000
4000
5000
6000
7000
8000
9000
10000
0
100
200
300
400
500
600
700
800
900
1000
volu
me
of
logs
har
vest
ed
('0
00
m3)
no
. mill
s
Broadleaved mills (LHS)
Coniferous mills (LHS)
Broadleaved sawlog harvest (RHS)
Coniferous sawlog harvest (RHS)
ABARES national wood processing survey ABARES
6
Twenty-six sawmills are estimated to be in the ‘over 100 000’ cubic metres of input size
category; only two are broadleaved sawmills. While this category represents a small proportion
of the sawmill population, it accounts for a significant proportion of total sawnwood production
(Table 7). In addition, the category represents a variety of mill sizes and six sawmills (all
coniferous) are estimated to have an annual log input capacity of greater than 500 000 cubic
metres. The scale and significance of these mills imply it is critical to comprehensively sample
them in order to derive meaningful survey results.
The data also illustrate that New South Wales, Queensland and South Australia have the largest
number of coniferous sawmills in Australia. The cypress pine sawmills are concentrated around
Australia’s native cypress pine resource, in New South Wales and Queensland.
Australia has 25 wood-based panel mills comprising six particleboard mills, 13 plywood/veneer
mills, four medium density fibreboard mills, one laminated veneer lumber mill and one
hardboard mill.
Developing the survey questionnaire
ABARES developed the survey questionnaire in consultation with key forest sector
representatives, with input from some state forest agencies and other forest sector stakeholders.
It is more comprehensive than the 2007 sawmill survey and includes questions on production
values, use of residues, costs of production, employment and investment, log input and
production volumes. These questions were considered important for gathering valuable
information for policymakers and forest sector stakeholders. A copy of the questionnaire is
provided in Appendix A. Some questions were considered obligatory for inclusion of the
respondent in the survey: these consisted of the questions relating to log input, volume of
production and mill employment estimates. Mills that could not answer one or more of these
questions were not included in the survey. Additional questions (such as product prices, input
costs and capital values) were considered optional without affecting respondents’ inclusion in
the survey results.
The log input question included respondents’ estimates of the tenure of the logs they processed.
ABARES provided a definition of tenure to survey respondents to aid allocation of log inputs. For
this survey, public logs were those derived from forests managed by government agencies or
public corporations on either public or private land. Thus, for the purpose of this survey logs
derived from a private forest on farmland managed by a state forest agency were public logs.
Private logs were those sourced from forests managed by private companies, on both public and
private land. For example, coniferous plantations in Victoria planted by government agencies
and remaining on public land, but which are now managed by HVP Plantations, were regarded
as private logs.
The figures presented in this report represent survey respondents’ estimates of the provenance
of the logs, and have not been otherwise verified. Nevertheless, by estimating the volume of logs
used from public and private native forests, the survey results can be compared with other
ABARES data, both to validate the quality of the mill survey results (for example, public native
broadleaved sawlog input should approximately equal ABARES estimates of logs harvested from
these forests) and to improve ABARES other datasets, such as private native forest harvesting
estimates.
This survey also presents an opportunity to estimate the type of sawnwood produced in
Australian sawmills, such as the share of broadleaved and coniferous sawnwood going to
structural or appearance grade timbers. This information will be useful to forest sector analysts

ABARES national wood processing survey ABARES
7
estimating the end use of sawnwood (for example, between construction and furniture) and
examining trends between these uses.
There are a number of ways to define the volume of sawnwood production, reflecting changes in
product dimensions through the different stages of processing and drying. Sawnwood may be
defined as green-off-sawn (GOS or target yield), the nominal yield (which may be around 10 per
cent smaller than the GOS and is the intended dimension of the dry roughsawn board), or as the
actual yield (which may be around 30 per cent smaller than the GOS and represents the dry
dressed dimension of the sawnwood). These percentage losses in product will depend on a
number of factors, including scale and efficiency of the mill, tree species and quality of the
sawlog. This survey collected consistent estimates of the GOS and actual recovery rates for
sawnwood production.
This survey also collected direct employment estimates from mills. These estimates include all
people employed in operating and administering the mill. Contractors for log harvest and
haulage are not included, although other studies suggest this is also an important area of
regional employment (Schirmer et al. 2011). Where businesses operated across several forest
sector classifications, such as mills that also wholesale sawnwood, the researchers attempted to
identify only employees involved in sawmill processing and administration.
The survey collected the number of employees classified as owners/managers (this includes
owners who had a management role (as opposed to shareholders) and other managers, full-time
and part-time/casual employees. Employment by gender was also collected, although some mills
provided only total employment numbers. Additionally, an estimate of the average hours
worked per week for each employee category was collected. This data was used to estimate the
full-time equivalent employment, based on a 38-hour week.
Selecting a representative sample and undertaking the survey
The survey required the cooperation of both large and small processors across Australia. To this
end, ABARES sought cooperation from a number of industry associations, including the
Australian Forest Products Association, the Australian Timber Importers Federation and the
Engineered Wood Products Association of Australasia. ABARES contacted mills by telephone;
those interested in participating were emailed or faxed a copy of the questionnaire and an
Australian Government Solicitor approved Data Supply Agreement detailing the use, storage and
confidentiality guidelines for collected survey data. Telephone interviews were undertaken
between November 2011 and March 2012. In some instances wood processors preferred to
complete the survey in their own time and emailed their response to ABARES.
Excluding Tasmania, around 36 per cent of broadleaved sawmills, comprising 56 per cent of
estimated industry capacity, and 57 per cent of coniferous sawmills (73 per cent of industry
capacity), participated in the survey (Table 3). In addition, ABARES surveyed post and pole mills
separately, and received responses from 53 per cent of mainland mills, accounting for 41 per
cent of industry capacity. A further 52 per cent of cypress pine sawmills, by both mill numbers
and industry capacity, were surveyed.
For this survey, ABARES did not interview any wood processors in Tasmania. Instead, results
from another survey (Schirmer et al. 2011) are presented in this report, where they were
consistent with the ABARES survey. The Tasmanian survey data that ABARES used to produce
the results presented in this report were updated after release of the Schirmer et al. (2011)
interim report. Consequently, some differences may be evident between the results in these
reports.
ABARES national wood processing survey ABARES
8
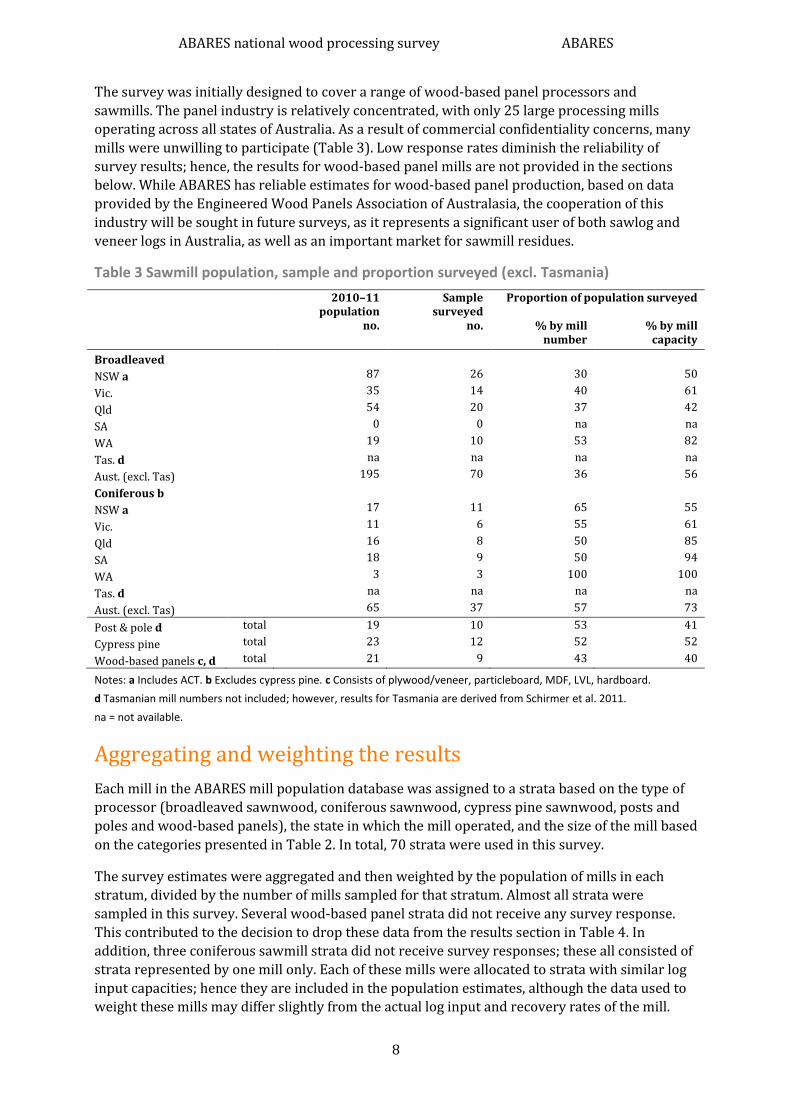
The survey was initially designed to cover a range of wood-based panel processors and
sawmills. The panel industry is relatively concentrated, with only 25 large processing mills
operating across all states of Australia. As a result of commercial confidentiality concerns, many
mills were unwilling to participate (Table 3). Low response rates diminish the reliability of
survey results; hence, the results for wood-based panel mills are not provided in the sections
below. While ABARES has reliable estimates for wood-based panel production, based on data
provided by the Engineered Wood Panels Association of Australasia, the cooperation of this
industry will be sought in future surveys, as it represents a significant user of both sawlog and
veneer logs in Australia, as well as an important market for sawmill residues.
Table 3 Sawmill population, sample and proportion surveyed (excl. Tasmania)
2010–11 population
Sample surveyed
Proportion of population surveyed
no. no. % by mill number
% by mill capacity
Broadleaved
NSW a 87 26 30 50
Vic. 35 14 40 61
Qld 54 20 37 42
SA 0 0 na na
WA 19 10 53 82
Tas. d na na na na
Aust. (excl. Tas) 195 70 36 56
Coniferous b
NSW a 17 11 65 55
Vic. 11 6 55 61
Qld 16 8 50 85
SA 18 9 50 94
WA 3 3 100 100
Tas. d na na na na
Aust. (excl. Tas) 65 37 57 73
Post & pole d total 19 10 53 41
Cypress pine total 23 12 52 52
Wood-based panels c, d total 21 9 43 40
Notes: a Includes ACT. b Excludes cypress pine. c Consists of plywood/veneer, particleboard, MDF, LVL, hardboard.
d Tasmanian mill numbers not included; however, results for Tasmania are derived from Schirmer et al. 2011.
na = not available.
Aggregating and weighting the results
Each mill in the ABARES mill population database was assigned to a strata based on the type of
processor (broadleaved sawnwood, coniferous sawnwood, cypress pine sawnwood, posts and
poles and wood-based panels), the state in which the mill operated, and the size of the mill based
on the categories presented in Table 2. In total, 70 strata were used in this survey.
The survey estimates were aggregated and then weighted by the population of mills in each
stratum, divided by the number of mills sampled for that stratum. Almost all strata were
sampled in this survey. Several wood-based panel strata did not receive any survey response.
This contributed to the decision to drop these data from the results section in Table 4. In
addition, three coniferous sawmill strata did not receive survey responses; these all consisted of
strata represented by one mill only. Each of these mills were allocated to strata with similar log
input capacities; hence they are included in the population estimates, although the data used to
weight these mills may differ slightly from the actual log input and recovery rates of the mill.

ABARES national wood processing survey ABARES
9
There were also two small post and pole mills that represented individual strata that were not
sampled; these were left out of the analysis as their contribution to the national totals was
considered negligible.
ABARES collected data on the production of sawnwood from log processing by the mill,
including the volume of GOS sawnwood and dry sawnwood produced for sale. For GOS sales,
ABARES did not collect data on the destination of products; in some cases this GOS is delivered
to a final product market, while some may be sold to other mills for further processing or drying.
However, the survey did collect the volume of GOS purchased from other mills, as well as the
GOS-to-dry recovery rate for these products. When these survey data were aggregated, the
estimated volume of GOS purchased by mills was subtracted from the volume sold in order to
estimate the volume of GOS sold as final product to market.

ABARES national wood processing survey ABARES
10
3 Survey results This chapter presents results of ABARES 2010–11 wood processing survey. Some survey results
were aggregated to maintain individual mill confidentiality, and to ensure reported results were
statistically robust. Specifically, because of the small number of mills in some categories,
production data for broadleaved sawmills were aggregated for mills with an annual log intake
capacity of greater than 45 000 cubic metres and coniferous sawmills were aggregated for
Victoria–South Australia and New South Wales–Queensland. Results for coniferous sawmills
with less than 15 000 cubic metres of log intake capacity have also been aggregated to maintain
confidentiality. Additionally, survey results for wood-based panel mills are not presented in the
results tables because the sample was considered insufficient to derive statistically robust
results.
All survey estimates of forest tenure (public and private) and forest type (native and plantation)
from which logs were sourced are based on survey respondents’ estimates. ABARES did not
undertake any validation of these estimates, or alter survey responses.
Estimated log input
Survey results show that around 2 million cubic metres of broadleaved sawlogs and more than
8 million cubic metres of coniferous sawlogs were processed in Australian sawmills in 2010–11
(Table 4). Additionally, around 186 000 cubic metres of cypress pine sawlogs were processed in
the same period.
New South Wales is estimated to have accounted for 32 per cent of the total volume of
broadleaved sawlogs processed and 28 per cent of coniferous sawlogs processed in Australia in
2010–11. After New South Wales, Victoria and Tasmania were the largest processors of
broadleaved sawlogs, while South Australia and Victoria were the largest coniferous sawlog
processors. The native cypress pine resource is located in New South Wales and Queensland;
hence, the cypress pine sawmill industry is located only in these states.
Table 4 Survey results—sawmill log input, by source and state, 2010–11
Broadleaved Coniferous b Cypress pine
Private Public Total Private Public Total Private Public Total
’000m3 ’000m3 ’000m3 ’000m3 ’000m3 ’000m3 ’000m3 ’000m3 ’000m3
NSW a 84 582 666 208 2 071 2 279 0 54 54
Vic. 19 506 525 1 585 73 1 657 0 0 0
Qld 181 145 326 183 1 173 1 356 0 133 133
SA 0 0 0 731 1 088 1 819 0 0 0
WA 5 188 193 106 395 501 0 0 0
Tas. 46 302 347 505 0 505 0 0 0
Aust. 334 1 724 2 058 3 317 4 800 8 117 0 186 186
Note: Private and public split based on respondents’ estimates; includes post and pole mills. a Includes ACT. b Excludes
cypress pine.
The survey also provides respondents’ estimates of the forest tenure from which their processed
logs were harvested. The figures are survey respondents’ estimates of the provenance of these
logs, and results have not been cross-checked. Hence, the sale of Queensland’s public softwood
plantations (Forestry Plantations Queensland Pty Ltd) to Hancock Queensland Plantations Pty
Ltd in June 2010 is not reflected in the data in Table 4, because many mills had not recognised
the change in ownership when recording the source of their softwood sawlogs.
ABARES national wood processing survey ABARES
11
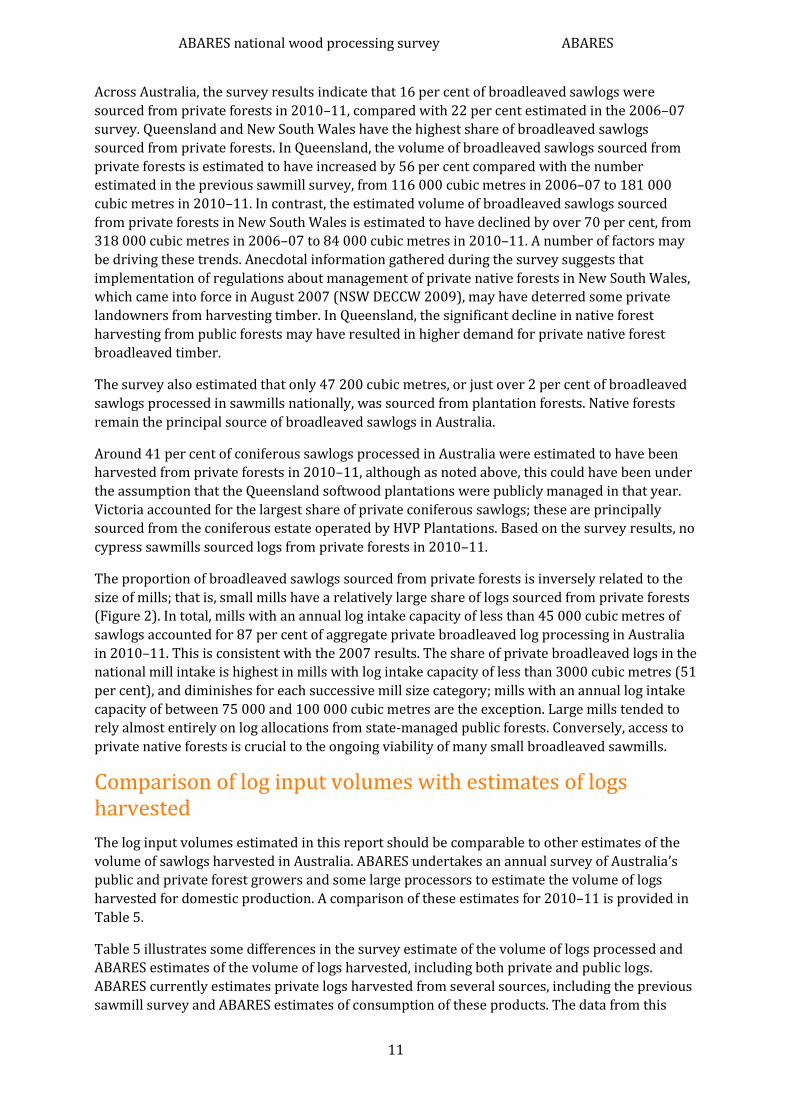
Across Australia, the survey results indicate that 16 per cent of broadleaved sawlogs were
sourced from private forests in 2010–11, compared with 22 per cent estimated in the 2006–07
survey. Queensland and New South Wales have the highest share of broadleaved sawlogs
sourced from private forests. In Queensland, the volume of broadleaved sawlogs sourced from
private forests is estimated to have increased by 56 per cent compared with the number
estimated in the previous sawmill survey, from 116 000 cubic metres in 2006–07 to 181 000
cubic metres in 2010–11. In contrast, the estimated volume of broadleaved sawlogs sourced
from private forests in New South Wales is estimated to have declined by over 70 per cent, from
318 000 cubic metres in 2006–07 to 84 000 cubic metres in 2010–11. A number of factors may
be driving these trends. Anecdotal information gathered during the survey suggests that
implementation of regulations about management of private native forests in New South Wales,
which came into force in August 2007 (NSW DECCW 2009), may have deterred some private
landowners from harvesting timber. In Queensland, the significant decline in native forest
harvesting from public forests may have resulted in higher demand for private native forest
broadleaved timber.
The survey also estimated that only 47 200 cubic metres, or just over 2 per cent of broadleaved
sawlogs processed in sawmills nationally, was sourced from plantation forests. Native forests
remain the principal source of broadleaved sawlogs in Australia.
Around 41 per cent of coniferous sawlogs processed in Australia were estimated to have been
harvested from private forests in 2010–11, although as noted above, this could have been under
the assumption that the Queensland softwood plantations were publicly managed in that year.
Victoria accounted for the largest share of private coniferous sawlogs; these are principally
sourced from the coniferous estate operated by HVP Plantations. Based on the survey results, no
cypress sawmills sourced logs from private forests in 2010–11.
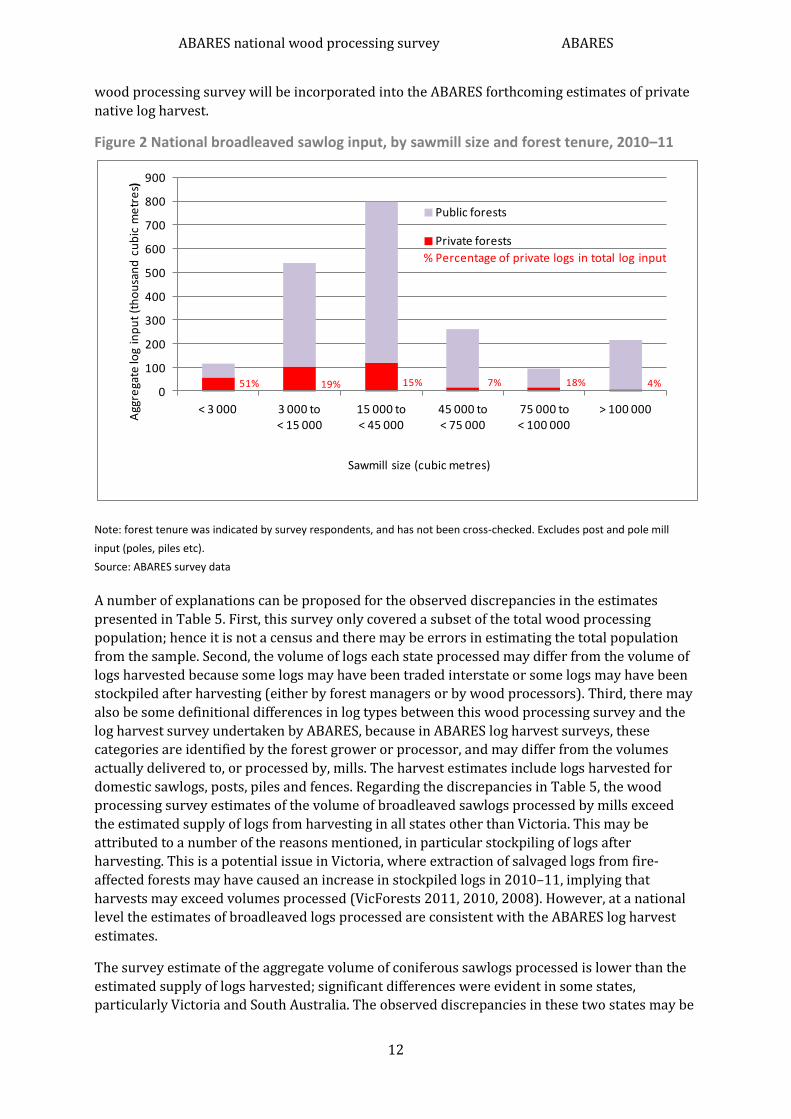
The proportion of broadleaved sawlogs sourced from private forests is inversely related to the
size of mills; that is, small mills have a relatively large share of logs sourced from private forests
(Figure 2). In total, mills with an annual log intake capacity of less than 45 000 cubic metres of
sawlogs accounted for 87 per cent of aggregate private broadleaved log processing in Australia
in 2010–11. This is consistent with the 2007 results. The share of private broadleaved logs in the
national mill intake is highest in mills with log intake capacity of less than 3000 cubic metres (51
per cent), and diminishes for each successive mill size category; mills with an annual log intake
capacity of between 75 000 and 100 000 cubic metres are the exception. Large mills tended to
rely almost entirely on log allocations from state-managed public forests. Conversely, access to
private native forests is crucial to the ongoing viability of many small broadleaved sawmills.
Comparison of log input volumes with estimates of logs harvested
The log input volumes estimated in this report should be comparable to other estimates of the
volume of sawlogs harvested in Australia. ABARES undertakes an annual survey of Australia’s
public and private forest growers and some large processors to estimate the volume of logs
harvested for domestic production. A comparison of these estimates for 2010–11 is provided in
Table 5.
Table 5 illustrates some differences in the survey estimate of the volume of logs processed and
ABARES estimates of the volume of logs harvested, including both private and public logs.
ABARES currently estimates private logs harvested from several sources, including the previous
sawmill survey and ABARES estimates of consumption of these products. The data from this
ABARES national wood processing survey ABARES
12
wood processing survey will be incorporated into the ABARES forthcoming estimates of private
native log harvest.
Figure 2 National broadleaved sawlog input, by sawmill size and forest tenure, 2010–11
Note: forest tenure was indicated by survey respondents, and has not been cross-checked. Excludes post and pole mill
input (poles, piles etc).
Source: ABARES survey data
A number of explanations can be proposed for the observed discrepancies in the estimates
presented in Table 5. First, this survey only covered a subset of the total wood processing
population; hence it is not a census and there may be errors in estimating the total population
from the sample. Second, the volume of logs each state processed may differ from the volume of
logs harvested because some logs may have been traded interstate or some logs may have been
stockpiled after harvesting (either by forest managers or by wood processors). Third, there may
also be some definitional differences in log types between this wood processing survey and the
log harvest survey undertaken by ABARES, because in ABARES log harvest surveys, these
categories are identified by the forest grower or processor, and may differ from the volumes
actually delivered to, or processed by, mills. The harvest estimates include logs harvested for
domestic sawlogs, posts, piles and fences. Regarding the discrepancies in Table 5, the wood
processing survey estimates of the volume of broadleaved sawlogs processed by mills exceed
the estimated supply of logs from harvesting in all states other than Victoria. This may be
attributed to a number of the reasons mentioned, in particular stockpiling of logs after
harvesting. This is a potential issue in Victoria, where extraction of salvaged logs from fire-
affected forests may have caused an increase in stockpiled logs in 2010–11, implying that
harvests may exceed volumes processed (VicForests 2011, 2010, 2008). However, at a national
level the estimates of broadleaved logs processed are consistent with the ABARES log harvest
estimates.
The survey estimate of the aggregate volume of coniferous sawlogs processed is lower than the
estimated supply of logs harvested; significant differences were evident in some states,
particularly Victoria and South Australia. The observed discrepancies in these two states may be
0
100
200
300
400
500
600
700
800
900
< 3 000 3 000 to < 15 000
15 000 to < 45 000
45 000 to < 75 000
75 000 to < 100 000
> 100 000
Agg
rega
te lo
g in
pu
t (t
ho
usa
nd
cu
bic
me
tre
s)
Sawmill size (cubic metres)
Public forests
Private forests
51% 19% 15% 7% 18% 4%
% Percentage of private logs in total log input

ABARES national wood processing survey ABARES
13
explained as an interstate transfer of logs from Victoria to mills in South Australia. Some
transfers may also occur between Victoria and New South Wales, and between New South Wales
and Queensland. These discrepancies are significantly less than estimated in the 2007 survey,
suggesting either that interstate trade has diminished or that the survey results are more
consistent with log harvest estimates. However, the discrepancy in the coniferous sawlog
estimates in Western Australia is likely to arise from sampling error. The cypress pine estimates
are consistent between the two surveys.
Table 5 Comparison of survey results with ABARES estimates of logs harvested, 2010–11 (excl. Tasmania)
Broadleaved Coniferous Cypress pine
Survey log
input
Logs harvested
b
Difference Survey log
input
Logs harvested
b
Difference Survey log
input
Logs harvested
Difference
’000m3
’000m3 % ’000m3
’000m3 % ’000m3 ’000m3 %
NSW a 666 652 2.1 2 279 2 374 –4.0 54 54 0
Vic. 525 566 –7.2 1 657 1 945 –14.8 0 0 0
Qld 326 268 21.6 1 356 1 325 2.3 133 127 4.7
SA 0 0 0 1 819 1 529 19.0 0 0 0
WA 193 165 17.0 501 578 –13.3 0 0 0
Tas. c na na na na na na na na na
Aust. 1 711 1 652 3.6 7 613 7 750 –1.8 186 182 2.2
Note: Volumes include posts and poles and exclude wood-based panels. a Includes ACT. b Preliminary data; includes logs
harvested for domestic sawlogs to sawmills, poles, piles and fences, and excludes cypress pine and sawlogs exported or sold
to other forest industries; includes ABARES estimates of private logs harvested. c Estimates for Tasmania excluded from this
table; however, results for Tasmania included in results section below. Errors in totals may exist due to rounding. na = not
available.
State sawmill characteristics
Significant differences are evident in the structure of Australia’s sawnwood industry in each
state. The broadleaved sawmilling industry is characterised by a large number of relatively small
mills in New South Wales and Queensland. New South Wales contains 36 per cent of Australia’s
broadleaved sawmills and 25 per cent of coniferous sawmills. Around one-third of national
broadleaved GOS sawnwood production was produced in New South Wales in 2010–11. New
South Wales’ coniferous GOS sawnwood production has been combined with Queensland in the
results presented in Table 6. Recovery rates are generally higher among coniferous sawmills,
and there are some distinct differences between states. The recovery rates reported in Table 6
are the result of a number of factors, including the species and size of sawlogs in each state as
well as the sawing technology each mill uses.
This survey estimated broadleaved sawnwood production (measured in GOS volumes) in 2010–
11 at 784 000 cubic metres, and coniferous sawnwood production at over 4.2 million cubic
metres (Table 6). These output estimates differ from final production because a significant
proportion of the GOS sawnwood produced by sawmills in Australia is dried and dressed before
sale in the market. This process results in volume loss, both from shrinkage and offcuts. Final
sawnwood production is presented in Table 8.
ABARES national wood processing survey ABARES
14
Table 6 Sawmill and post & pole mill characteristics, by state, 2010–11
No. mills
Average log intake
Recovery rate c
Average output c
Total output c
Share of national
output
m3/mill % m3/mill ’000 m3 %
Broadleaved a
NSW 87 7 534 40.6 3 056 265.8 33.9
Vic. 35 15 012 39.5 5 928 20.5 26.5
Qld 54 5 798 36.5 2 119 114.4 14.6
SA 0 0 na na 0.0 0.0
WA 19 10 177 41.0 4 175 79.3 10.1
Tas. e 46 7 490 33.9 2 536 116.7 14.9
Aust. 241 8 431 38.6 3 252 783.7 100.0
Coniferous a, b
NSW & Qld d 33 108 328 53.1 57 498 1 897.4 45.0
Vic. & SA d 29 117 690 52.0 61 202 1 774.8 42.1
WA 3 156 315 55.5 86 781 260.3 6.2
Tas. e 3 170 000 55.9 94 992 285.0 6.8
Aust. 68 117 158 52.9 62 024 4 217.6 100.0
Other products
Post & pole f 22 8 959 64.0 5 736 126.2 100.0
Cypress pine 23 8 107 45.1 3 655 84.1 100.0
Note: a Log intake numbers for broadleaved and coniferous sawnwood exclude posts and poles. b Excludes cypress pine.
c Based on the green-off-sawn (GOS) volume of sawnwood output. d State results combined to protect individual mill
confidentiality. e Tasmanian results from Schirmer et al. (2011). f Includes broadleaved and coniferous species. na = not
available.
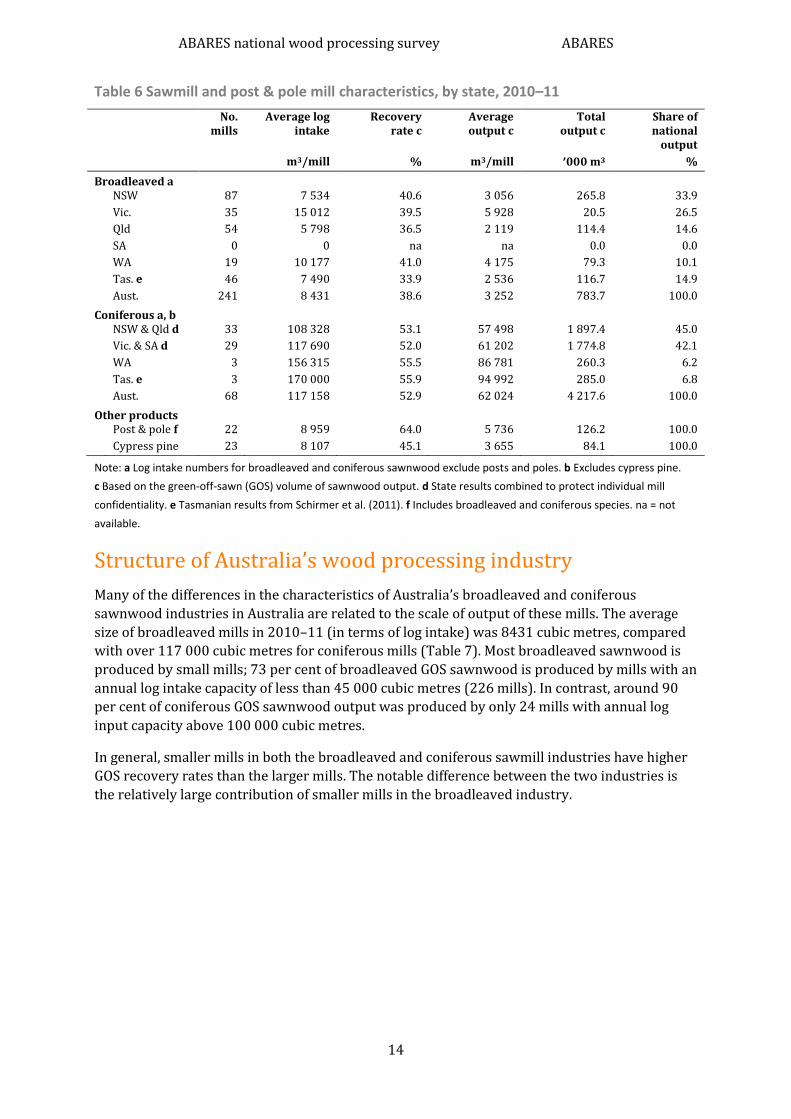
Structure of Australia’s wood processing industry
Many of the differences in the characteristics of Australia’s broadleaved and coniferous
sawnwood industries in Australia are related to the scale of output of these mills. The average
size of broadleaved mills in 2010–11 (in terms of log intake) was 8431 cubic metres, compared
with over 117 000 cubic metres for coniferous mills (Table 7). Most broadleaved sawnwood is
produced by small mills; 73 per cent of broadleaved GOS sawnwood is produced by mills with an
annual log intake capacity of less than 45 000 cubic metres (226 mills). In contrast, around 90
per cent of coniferous GOS sawnwood output was produced by only 24 mills with annual log
input capacity above 100 000 cubic metres.
In general, smaller mills in both the broadleaved and coniferous sawmill industries have higher
GOS recovery rates than the larger mills. The notable difference between the two industries is
the relatively large contribution of smaller mills in the broadleaved industry.

ABARES national wood processing survey ABARES
15
Table 7 Broadleaved and coniferous sawmill characteristics, by size, 2010–11
Log intake capacity(m3/yr)
No. mills
Average log intake
Recovery rate b
Average output b
Total output b
Share of national
output
m3/mill % m3/mill ’000 m3 %
Broadleaved
<3000 91 1 287 42.3 544 49.5 6.3
3000 to <15 000 91 5 994 39.0 2 338 212.7 27.1
15 000 to <45 000 44 18 197 38.6 7 028 309.2 39.5
>45 000 c 15 37 912 37.3 14 149 212.2 27.1
Total 241 8 431 38.6 3 252 783.7 100.0
Coniferous a
<15 000 c 17 8 630 60.9 5 253 89.3 2.1
15 000 to <45 000 18 10 933 47.7 5 213 93.8 2.2
45 000 to <75 000 7 51 571 43.0 22 174 155.2 3.7
75 000 to <100 000 2 79 903 46.2 36 931 73.9 1.8
>100 000 24 295 936 53.6 158 558 3 805.4 90.2
Total 68 117 158 52.9 62 024 4 217.6 100.0
Notes: Excludes post and pole mills; average log intake may be less than log intake capacity for some mill groups. a Excludes
cypress pine. b Reflects the green-off-sawn (GOS) volume of sawnwood output. c Mill size categories aggregated to protect
individual mill confidentiality.
Final production of sawnwood
The estimates of sawnwood production for the different states and mill-size categories
described above were provided in terms of GOS produced from logs. Hence the estimates
excluded other factors that reduce the volume of the final sawnwood product, such as shrinkage
through drying and offcuts and defects arising from finishing sawnwood for market. Estimates of
final sawnwood production for 2010–11 are presented in Table 8. The final GOS sawnwood
production estimate represents sawnwood sold to market and hence excludes green sawnwood
sold to other mills. The dry final sawnwood output estimate represents the sawnwood mills sold
to the market, including sawnwood produced by processing logs onsite, as well as through
purchasing and drying GOS from other mills.
Overall, around 730 000 cubic metres of broadleaved sawnwood was produced for sale to
market in 2010–11, 52 per cent of which was dried. New South Wales accounted for more than
one-third of total final broadleaved sawnwood production. More than 3.7 million cubic metres of
coniferous sawnwood was produced for sale to market in 2010–11, with more than three-
quarters of this sold as dried product. The combined states of New South Wales–Queensland and
Victoria–South Australia each accounted for over 40 per cent of national production. In contrast
to the other industries, most cypress pine sawnwood (83 per cent) was estimated to be sold
green to the market.
The types of sawnwood Australian sawmills produced in 2010–11 is illustrated in Figure 3. The
‘Dry other’ and ‘Green other’ sawnwood categories include products such as pallets, fencing and
wooden stakes. Figure 3 shows that, for broadleaved sawnwood production, the shares of green
structural, green other and dry structural output were relatively similar, with dry appearance
constituting the largest individual share of broadleaved sawnwood production. In contrast, more
than half of all coniferous sawnwood output was produced as dry structural timber. For cypress
pine, green structural sawnwood accounted for almost two-thirds of total final production.

ABARES national wood processing survey ABARES
16
Table 8 Final sawnwood production, 2010–11
Broadleaved
Green Dry Total
’000m3 ’000m3 ’000m3
NSW 140 108 248
Vic. 67 120 186
Qld 85 26 111
SA 0 0 0
WA 35 37 72
Tas. 27 86 113
Aust. 353 377 730
Coniferous Cypress pine
Green Dry Total Green Dry Total
’000m3 ’000m3 ’000m3 ’000m3 ’000m3 ’000m3
NSW & Qld a 403 1 288 1 691 67 14 81
Vic. & SA a 329 1 264 1 594 – – –
WA 30 178 208 – – –
Tas. 98 155 253 – – –
Aust. 860 2 885 3 745 67 14 81
Note: Excludes post and pole production. a Data combined due to commercial confidentiality.
Figure 3 Product shares for final sawnwood production in 2010–11, by species
Data source: ABARES
Employment
An estimate of the number of people employed by sawmills and post and pole mills in Australia
in 2010–11 is provided in Table 9. As stated in the methodology section, these are estimates of
the number of people directly employed in mill operation and administration, and exclude
contractors involved with the harvesting and delivery of log inputs, as well as those employed in
downstream activities such as wood product wholesaling.
The data suggest that Australia’s sawmills and post and pole mills employed about 8 795 people;
around 90 per cent were full-time workers and males accounting for more than 90 per cent of
the workforce. These proportions are consistent across the different types of mills, except the
cypress pine sawmills where part-time workers constitute 28 per cent of employees. The
22%
5%
20%
21%
28%
1%
3%
Broadleaved
Green structural
Green appearance
Green other
Dry structural
Dry appearance
Dry other
Posts & poles
5%
0%
16%
51%
8%
16%
3%
Coniferous
Green structural
Green appearance
Green other
Dry structural
Dry appearance
Dry other
Posts & poles
63%
12%
8%
12%
6%
0%
0%
Cypress pine
Green structural
Green appearance
Green other
Dry structural
Dry appearance
Dry other
Posts & poles

ABARES national wood processing survey ABARES
17
number of full-time equivalent employees is measured as the number of 38-hour weeks worked
at mills.
The survey’s total employment number is lower than data provided in the Australian Bureau of
Statistics (ABS) labour force survey (ABARES 2011). In the ABS data, around 12 500 people
were estimated to be employed in log sawmilling and timber dressing in 2010–11. The ABS
number is likely to be higher than this survey because it also includes employment in
woodchipping. The broadleaved and cypress pine sawmills employed more workers per cubic
metre of logs processed relative to the coniferous mills in particular. This reflects the smaller
scale of these mills in general, and the large-scale, capital-intensive nature of coniferous sawlog
processing.
Table 9 Direct employment in the wood processing industry, 2010–11
Sawmill type
Owners a
Full-time a
Part-time a
Tas. Total Male Female FTE FTE/ ’000 m3 logs
processed
no. no. no. no. no. % % no.
Broadleaved 188 2 705 198 843 3 934 90.8 9.2 3 357 1.65
Coniferous 62 3 593 286 229 4 170 92.6 7.4 3 925 0.49
Post & pole 14 232 24 47 317 89.4 10.6 267 1.35
Cypress pine 20 248 105 0 373 92.5 7.5 366 1.96
Total 284 6 779 613 1 119 8 795 91.7 8.3 7 915 0.76
Note: a Total employment data for Tasmania is not included in the individual categories, but is included separately. It is
included in male/female percentages, FTEs and FTE/’000m3 logs processed. FTE = full-time equivalents (calculated as
number of employee hours worked divided by 38 hour working week).
Data source: ABARES datasets, Schirmer et al. 2011.
Other survey information
ABARES also included a number of optional survey questions, including one on the respondent’s
opinion of the industry outlook. In total, 73 mills responded; the least optimistic were
broadleaved sawmills—only 12 per cent expected an increase in demand for their product in
2011–12 (Figure 4). Cypress pine and coniferous mills had a similar outlook, with around one-
fifth of respondents expecting an increase in demand. More than one-third of broadleaved and
coniferous sawmills indicated they expected demand for their products to decrease.
Figure 4 Outlook for demand of sawmill products, by industry, 2010–11
Data source: ABARES
12%
52%
36%
Broadleaved
Grow
Remain Constant
Shrink
19%
43%
38%
Coniferous
Grow
Remain Constant
Shrink
20%
50%
30%
Cypress pine
Grow
Remain Constant
Shrink

ABARES national wood processing survey ABARES
18
Respondents were also asked about how production by-product was used. Fifty-two mills
responded to the question (Figure 5). The most common uses of production residues reported
were sale as woodchips (33 per cent), comprising woodchips for export (25 per cent) or
domestic panel and paper production (8 per cent). The next most common use of residues was
for fuel (31 per cent); most was used internally to fuel the mill’s boiler (25 per cent) and the
remainder (6 per cent) was sold for use in electricity generation elsewhere. Almost one-quarter
of respondents (23 per cent) reported selling residues (mostly sawdust and bark) for landscape
and gardening uses. Finally, the ‘other’ category includes residue material sold for use on farms
for animal bedding, burnt or sold as firewood.
Figure 5 Use of residue material, 2010–11
Data source: ABARES
33%
31%
23%
14%
sold as woodchips
fuel
landscape
other
ABARES national wood processing survey ABARES
19
4 Conclusion This report highlights many changes that have occurred in Australia’s wood processing industry
over the past 12 years, and particularly in the years since the previous ABARES survey was
completed. The coniferous wood industry continues to adapt to change, moving progressively to
large-scale processing technologies capable of competing in world markets. Significant change
has occurred in the broadleaved sawmill industry, although small mills continue to contribute a
significant share of aggregate production and employment for the industry.
These changes reflect responses to competitive pressures and investors’ expectations about
future trends in forest product demand and log supply. The relative security of coniferous
sawlog supply may encourage ongoing investment in Australia’s coniferous sawmill industry. In
contrast, uncertainty about future supply of broadleaved sawlogs may continue to constrain
future investment in the broadleaved sawmill industry.
This report illustrates the diversity of Australia’s sawmill industry, with a range of mills
operating at various capacities, sourcing logs from private and public native and plantation
forests, and manufacturing a variety of products for alternative markets using a range of
processing technologies. While broadleaved sawmills are relatively small, produce both green
and dry structural and appearance grade timber and rely on public and private native forests,
most output from the coniferous sawmill industry is produced by a small number of large-scale
mills, using plantation timber to manufacture mainly dried structural sawnwood.
Effective government policy and efficient business decisions require the availability of timely
and reliable information. These survey results go some way to providing this information for the
sawmilling industry in Australia. However, further research is needed to ensure the government
and forest sector are provided with up-to-date information to prepare Australia’s forest sector
for continuing challenges. For example, discrepancies in employment estimates between this
survey and the ABS employment estimates merit further examination as do the differences in
ABARES estimates of logs harvested compared with this survey’s log input volumes.

ABARES National Wood Processing Survey ABARES
20
Appendix A ABARES Mill Survey 2010–11 questionnaire
ABARES mill survey 2010-11 Sawmill
Contact Name and position: Phone: Mill Name (legal and trading): Mill No.: Location (street address): Start time: Finish time:
Input capacity (m3):
5 Main log species:
5 Main log types: (e.g. sawlog,
pulplog, piles, girders, etc)
volume
Total log input (2010-11) m3
Public native %
Private native %
Public plantation %
Private plantation %
Average small end diameter OR cm
Centre diameter under bark cm
Green off saw (GOS) purchased m3
Green, dry or green/dry mill: green
GOS recovery: %
volume value Automatic checks:
Total green sawnwood
produced onsite (2010-11) m3 average selling price (ASP)
Total GOS produced (m3),
given GOS rec: 0
Green Structural % or m3 ASP
Green Appearance % or m3 ASP
Green other (specify) % or m3 ASP
Total dried sawnwood
produced onsite (2010-11) m3 ASP
Dry Structural % or m3 ASP
Dry Appearance % or m3 ASP
Dry other (specify) % or m3 ASP
Dried recovery given total
dried production:
% lost between GOS and
dried:
GOS recovery given total
GOS production:
Logs processed onsite
Sawnwood output
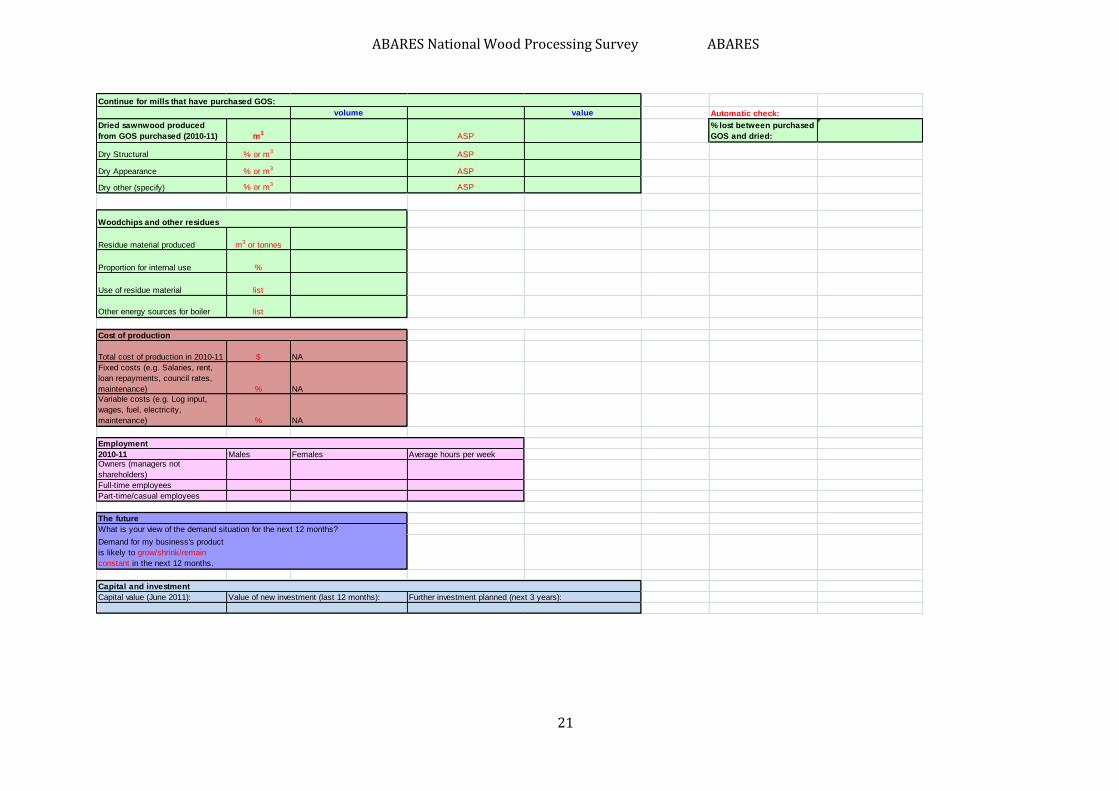
ABARES National Wood Processing Survey ABARES
21
volume value Automatic check:
Dried sawnwood produced
from GOS purchased (2010-11) m3 ASP
% lost between purchased
GOS and dried:
Dry Structural % or m3 ASP
Dry Appearance % or m3 ASP
Dry other (specify) % or m3 ASP
Residue material produced m3 or tonnes
Proportion for internal use %
Use of residue material list
Other energy sources for boiler list
Total cost of production in 2010-11 $ NA
Fixed costs (e.g. Salaries, rent,
loan repayments, council rates,
maintenance) % NA
Variable costs (e.g. Log input,
wages, fuel, electricity,
maintenance) % NA
2010-11 Males Females Average hours per weekOwners (managers not
shareholders)
Full-time employees
Part-time/casual employees
What is your view of the demand situation for the next 12 months?
Demand for my business's product
is likely to grow/shrink/remain
constant in the next 12 months.
Capital value (June 2011):
The future
Capital and investment
Value of new investment (last 12 months): Further investment planned (next 3 years):
Continue for mills that have purchased GOS:
Woodchips and other residues
Cost of production
Employment

ABARES National Wood Processing Survey ABARES
22
References ABARES 2011, Australian forest and wood products statistics, March and June quarters 2011,
Australian Bureau of Agricultural and Resource Economics and Sciences, Canberra, November.
Burns, K, Sledge, P & Wicks, S 2009, ABARE 2007 sawmill survey report, ABARE report to the
Australian Government Department of Agriculture, Fisheries and Forestry and Forest and Wood
Products Australia, Canberra, April.
Department of Environment and Resource Management 2012, About the South east Queensland
Forests Agreement, Queensland Government, available at
epa.qld.gov.au/parks_and_forests/managing_parks_and_forests/forest_transfer_processes_in_qu
eensland/south_east_queensland_forests_agreement_seqfa/about_seqfa accessed 3 May 2012.
NSW DECCW 2009, Private Native Forestry Code of Practice Fact Sheet No. 1, NSW Department of
Environment, Climate Change and Water, available at
environment.nsw.gov.au/resources/pnf/09706pnfoverview.pdf accessed 3 May 2012.
Schirmer, J, Dunn, C, Loxton, E & Dare, M 2011, Socioeconomic impacts of forest industry change:
a baseline study of the Tasmanian forest industry, Technical Report 214 Interim, Cooperative
Research Centre for Forestry, July.
VicForests 2011, Annual Report 2010–11.
VicForests 2010, Annual Report 2009–10.
VicForests 2008, Annual Report 2007–08.