aalborg universitet glucagon fibrillation - kinetics and...
TRANSCRIPT

Aalborg Universitet
Glucagon fibrillation - kinetics and structural polymorphism
Andersen, Christian Beyschau
Publication date:2009
Document VersionPublisher's PDF, also known as Version of record
Link to publication from Aalborg University
Citation for published version (APA):Andersen, C. B. (2009). Glucagon fibrillation - kinetics and structural polymorphism. Aalborg Universitet: Institutfor Kemi, Miljø og Bioteknologi, Aalborg Universitet.
General rightsCopyright and moral rights for the publications made accessible in the public portal are retained by the authors and/or other copyright ownersand it is a condition of accessing publications that users recognise and abide by the legal requirements associated with these rights.
? Users may download and print one copy of any publication from the public portal for the purpose of private study or research. ? You may not further distribute the material or use it for any profit-making activity or commercial gain ? You may freely distribute the URL identifying the publication in the public portal ?
Take down policyIf you believe that this document breaches copyright please contact us at [email protected] providing details, and we will remove access tothe work immediately and investigate your claim.
Downloaded from vbn.aau.dk on: juli 11, 2018

ii
Glucagon fibrillation — kinetics and structural polymorphism
Christian Beyschau Andersen
Ph.D. Thesis
Protein Structure and Biophysics, Novo Nordisk A/S
&
Department of Life Sciences, Aalborg University

iii

iv
Ph.D. thesis
Ph.D. thesis by Christian Beyschau Andersen under the Industrial PhD pro‐
gramme. Supervised by Christian Rischel (Novo Nordisk) and Daniel Erik Otzen
(now Aarhus University). Thesis work initiated December 1st, 2004.
Contacts:
C.B.A.1,2 +45 44 42 62 66, [email protected]
D.E.O.3 +45 20 72 52 38, [email protected]
C.R.1 +45 44 42 05 13, [email protected]
1 Novo Nordisk A/S, Protein Structure and Biophysics, Novo Nordisk Park, DK‐2760 Måløv. 2 Aalborg University, Department of Life Sciences, Sohngaardsholmsvej 49, DK‐9000 Aalborg. 3 Aarhus University, Interdisciplinary Nanoscience Centre, Gustav Wieds Vej 10 C, DK‐8000 Århus C.
© Christian Beyschau Andersen, 2008
Ph.D. thesis
1st Ed., 10 copies.
Novo Nordisk A/S
Novo Nordisk Park
DK‐2760 Måløv
Denmark

v
Table of contents
Glucagon fibrillation — kinetics and structural polymorphism..................................... ii Ph.D. thesis...........................................................................................................................................iv Table of contents ................................................................................................................................ v Preface and acknowledgments.................................................................................................. vii Resumé (Danish summary)........................................................................................................... ix Summary...............................................................................................................................................xi Abbreviations................................................................................................................................... xiii Papers ................................................................................................................................................. xiv Papers included in the thesis ................................................................................................ xiv Papers not included in the thesis ........................................................................................ xiv
1. Introduction................................................................................................................................2 1.1 Historical preamble.......................................................................................................2 1.2 Amyloid diseases............................................................................................................2 1.3 Glucagon ............................................................................................................................3 1.4 Subject of the thesis ......................................................................................................5 1.4.1 The molecular basis for glucagon's structural polymorphism ..............5 1.4.2 Morphology selection via morphology‐dependent growth inhibition5 1.4.3 Glucagon fibrils multiply by branching ...........................................................6
2. Fibril structure and polymorphism ..................................................................................8 2.1 Folding and misfolding of proteins.........................................................................8 2.2 Amino acid properties affect fibrillation........................................................... 10 2.3 Prediction of fibril propensity ............................................................................... 11 2.4 Fibrils are built from protofilaments.................................................................. 15 2.5 Fibril structure at atomic resolution................................................................... 17 2.6 Fibril criteria................................................................................................................. 19 2.6.1 Transmission electron microscopy................................................................ 20 2.6.2 Fiber diffraction ..................................................................................................... 21 2.6.3 Fibril‐specific fluorescent dyes........................................................................ 22
2.7 Intrinsic Trp fluorescence ....................................................................................... 23 2.8 Linear dichroism ......................................................................................................... 25 2.9 Proteolysis of fibrils ................................................................................................... 26
3. Selection of morphologies ................................................................................................. 30 3.1 Templated fibril growth........................................................................................... 30
vi
3.2 Morphology‐dependent growth inhibition ...................................................... 33 4. Fibrillation kinetics............................................................................................................... 38 4.1 Nucleation‐dependent aggregation..................................................................... 38 4.2 Oligomeric species and protofibrils .................................................................... 39 4.3 Secondary nucleation mechanisms ..................................................................... 41 4.4 Glucagon fibril branching in surface layers ..................................................... 43 4.5 TEM pictures of branching glucagon fibrils ..................................................... 47 4.6 Kinetics in bulk solution........................................................................................... 48 4.7 Criteria for the existence of secondary nucleation mechnisms............... 50
5. Prion diseases ......................................................................................................................... 54 5.1 Strain encoding ............................................................................................................ 55 5.2 Transmissibility........................................................................................................... 55 5.3 Strain stability .............................................................................................................. 57
6. Specialized techniques ........................................................................................................ 60 6.1 Total internal reflection fluorescence microscopy ....................................... 60 6.2 Fiber diffraction........................................................................................................... 62 6.3 Small‐angle light scattering .................................................................................... 64
7. Conclusion ................................................................................................................................ 66 8. Papers......................................................................................................................................... 68 8.1 Glucagon amyloid‐like fibril morphology is selected via morphology‐
dependent growth inhibition....................................................................................................... 68 8.2 Branching in amyloid fibril growth ..................................................................... 68
9. References ................................................................................................................................ 70
vii
Preface and acknowledgments
This thesis highlights the work done from December 1st, 2004 to Januar 31st,
2008 by undersigned in order to obtain the Ph.D. degree. The work was done under
the Industrial PhD programme financed by Ministry of Science, Technology and In‐
novation and Novo Nordisk A/S and to that end an Industrial PhD report has been
submitted and approved separately.
I am very grateful to my supervisors Christian Rischel and Daniel Otzen for the
dedicated supervision and commitment, I have received for the past three years.
The main part of the work was carried out at Department of Protein Structure and
Biophysics, Novo Nordisk, and I greatly appreciate the many friendly colleagues
found in this and neighbouring departments. You are all acknowledged for gener‐
ously taking your time to patiently teach me new techniques and discuss data.
Mathias Norrman, Anders Svensson, Gerd Schluckebier have collected X‐ray data in‐
house as well as at Maxlab, Sweden. Simon Bjerregaard and Henning Thøgersen
contributed with insights into the fibrillation propensity of glucagon and related
peptides. Brian Vandahl and Henrik Rahbek‐Nielsen introduced me to MS and pa‐
tiently helped me identify the digest fragments. Finally, Novo Nordisk and Ministry
of Science, Technology and Innovation have co‐financed the project and Christian
Rischel and Head of Department, Hanne B. Rasmussen, are gratefully acknowledged
for help finding founding for the Ph.D. project as well as founding for the postdoc at
CNR in Palermo, which I will start February 1st 2008. Thank you!
Parts of the project took place at Department of Life Sciences, Aalborg University,
and each time I have been warmly welcomed by the group of Daniel Otzen. The Ph.D.
project is based on the tremendous amount of work performed by Ph.D. Jesper
Søndergaard Pedersen, with whom I truly appreciate the friendship as well as hours
of scientific discussions. Professor Gunna Christiansen has several times assisted
with electron microscopy images and always with great enthusiasm.
My supervisors missed no chance to send me abroad to visit colleagues in exotic
parts of the world. The opportunities seized during these visits have multiplied
throughout my Ph.D. Dr. Goto warmly welcomed me to his lab in fall 2006. The three
months I spent there were culturally and scientifically among the greatest experi‐
ences of my life. The Osakan generosity and curiosity—especially that of Dr. Hisashi
Yagi, Dr. Masanori Yagi, Dr. Tadato Ban, and Dr. Yuji Goto—will not be forgotten.
The visit in Osaka will stay with me for the rest of my life thanks to you. Louise Ser‐
pell at University of Sussex introduced me to the art of fiber diffraction in what must

viii
have been the hottest summer in Brighton ever. I sincerely appreciate the substan‐
tial amount of help I received during and after the visit. Enzo, Mauro and Rita twice
welcomed me to CNR, Palermo, apparently a place I cannot seem to let go off. Thank
you for introducing me to light scattering as well as Sicilian hospitality. I am truly
looking forward to continuing working with you for the next two years.
Last but not least, family and friends are acknowledged for most appreciated
non‐scientific discussions. Thanks!
Måløv, January 31st, 2008
Christian Beyschau Andersen

ix
Resumé (Danish summary)
Emnet for denne ph.d. afhandling er fibrillering af glucagon. Glucagon er et natur‐
ligt forekommende hormon bestående af 29 aminosyrer, som sammen med insulin
kontrollerer blodsukkeret i mennesker. Ved frigivelse fra pancreas øger glucagon
blodsukkeret, mens insulin har den stik modsatte effekt. Glucagon sælges af Novo
Nordisk til behandling af akut hypoglukæmi. Som en lang række andre peptider og
proteiner har glucagon en naturlig tendens til at danne lange uopløselige protein‐
strukturer kaldet fibriller. Fibrillering kan bl.a. være et problem under produktion
af biofarmaceutika (proteinbaserede lægemidler) og ved henstand i flydende formu‐
lering. En anden interesse i fibrillering stammer fra en lang række uhelbredelige og
fatale sygdomme, som alle tilskrives fibrillering af et specifikt protein i en specifik
vævstype. Som eksempel, menes Alzheimers at skyldes dannelsen af fibriller eller
fibrilrelaterede strukturer af amyloidt β‐peptid i hjernen.
Et interessant kendetegn ved fibrilstrukturer observeret med elektronmikrosko‐
pi er deres polymorfi. Glucagonfibriller er ingen undtagelse, idet de ved lav peptid‐
koncentration (0.25 mg/mL) består af to eller flere protofilamenter, der snor sig
repetitivt om hinanden, mens de ved høj koncentration (8 mg/mL) består af et en‐
kelt usnoet protofilament. Det er i det store hele uvist, hvorfra fibrillers polymorfi
stammer: Skyldes det polymorfi af protofilamenterne, der danner de modne fibriller,
eller repræsenterer polymorfi forskellige måder at kombinere identiske protofila‐
menter lateralt? Det er bemærkelsesværdigt, at glucagon fibrillers morfologi kan
udvælges ved at ændre blot én parameter, peptidkoncentrationen. Denne egenskab
gør det nemlig muligt at undersøge mekanismen bag udvælgelsen af fibrilmorfolo‐
gier. Samtidig er det muligt at karakterisere den snoede og den lige morfologis
strukturelle egenskaber. Polymorfi er gennem de senere år blevet vist at være vigtig
i forståelsen af visse prionsygdommes evne til at transmittere fra individ til individ,
sommetider på tværs af artsbarrierer.
Selve dannelsen af fibriller fra en proteinopløsning udviser ofte et sigmoidt for‐
løb, karakteriseret ved en lang lagfase, hvor der ikke sker betydelig tilvækst af fi‐
brilmasse, efterfulgt af en fase hvor fibrilmassen stiger drastisk. Denne reaktions‐
profil kan ikke alene forklares ved en simpel nukleeringsproces efterfulgt af vækst
fra fibrilenderne. En mulig forklaring er, at der findes en sekundær nukleringsme‐
kanisme, som kontinuerligt danner nye fibrilender proportionalt med den allerede
dannede fibrilmasse. Denne forklaring lider dog under en udtalt mangel på ekspe‐

x
rimentelle beviser for, at en sådan nukleeringsmekanisme overhovedet eksisterer.
Glucagon har også en sigmoid reaktionsprofil og vba. specialiserede biofysiske tek‐
nikker blev baggrunden for dette fibrilleringsforløb studeret. Sekundære nukle‐
ringsmekanismers vigtighed understreges af deres indflydelse på prionstammers
fænotype og stabilitet.
I dette ph.d. arbejde er benyttet en række biofysiske teknikker, både traditionelle
teknikker så som cirkulær dikroisme, dynamisk lysspredning, fluorescens‐
spektroskopi og elektronmikroskopi, men også en række mere specialiserede tek‐
nikker: Småvinkellysspredning, total intern refleksionsfluorescensmikroskopi
(TIRFM) samt fiberdiffraktion. Disse er tilegnet ved ophold hos forskningsgrupper i
Palermo, Osaka og Brighton.
Ph.d. arbejdets tre hovedresulter er:
1. Glucagon fibriller dannet ved 0.25 mg/mL glucagon er snoede, mens de
ved 8 mg/mL er lige. Der er en strukturel forskel på de to morfologier be‐
stemt ved forskelle i bl.a. fiberdiffraktionsmønstre, lineær
dikroismespektre samt proteolytisk fordøjelse. Dette antyder, at de to
morfologier er dannet af strukturelt forskellige protofilamenter.
2. Skiftet i morfologi fra snoet til lige sker gradvist og korrelerer med dan‐
nelsen af reversible trimerer. Krydsseedingsforsøg afslører, at seeds af li‐
ge morfologi har en udtalt virkning på fibrilleringskinetikken ved 0.25
mg/mL, hvorimod seeds af snoet morfologi ingen effekt har på fibrille‐
ringskinetikken ved 8 mg/mL glucagon. Vi konkluderer, at reversibel
hæmning af snoede fibriller med glucagon trimerer er årsagen til udvæl‐
gelsen af den lige fibrilmorfologi ved høj koncentration.
3. Glucagons fibrilleringskinetik har et sigmoidt forløb, som antyder at fi‐
brilmassen vokser proportionalt med den på et givent tidspunkt dannede
fibrilmasse. Med TIRFM og småvinkellysspredning på seedede opløsnin‐
ger af glucagon blev det vist, at glucagonfibriller er i stand til at forgrene
sig kontinuerligt både på quartz overflader og i opløsning. Baseret på
seedet fibrilleringskinetik blev et kriterium for eksistensen af sekundære
processer opstillet: I deres fravær påvirkes udelukkende fibrilmassens
vækstrate, mens deres tilstedeværelse udelukkende påvirker lagfasen.
Ved sammenligning med Aβ(1‐40), et peptid som tidligere er vist at dan‐
ne uforgrenede fibriller, blev kriteriet valideret.

xi
Summary
The subject of this Ph.D. thesis is fibrillation of glucagon. Glucagon is a naturally
occurring hormone consisting of 29 amino acids, which together with insulin regu‐
late the blood sugar in humans. When released from the pancreas, glucagon in‐
creases the blood sugar, while insulin has the exact opposite effect. Glucagon is
marketed by Novo Nordisk as a drug to treat severe hypoglycaemia. As most pep‐
tides and proteins, glucagon has an inherent propensity to form long insoluble pro‐
tein structures, fibrils. Fibrillation is often a problem during the production of bio‐
pharmaceuticals (drugs based on proteins) and when formulating proteins. Another
interest in fibrillation is due to a large number of incurable and fatale diseases as‐
sumed to be caused by fibrillation of a specific protein in a specific location. As an
example, Alzheimer’s disease seems to evolve from the formation of fibrils or fibril‐
related structures of amyloid β‐peptide in the human brain.
An interesting feature of fibril structures observed by electron microscopy is
their polymorphism. Glucagon fibrils are no exception as they at low peptide con‐
centration (0.25 mg/mL) consist of two or several repetitively twisting protofila‐
ments, while they at high concentration (8 mg/mL) consist of a single nontwisting
protofilament. The origin of fibril polymorphism is largely unknown: is it caused by
polymorphism of the protofilaments forming the mature fibrils, or do polymor‐
phism represent different ways to organize otherwise identical protofilaments?
Surprisingly, by changing just one parameter, the glucagon concentration, it is pos‐
sible to select a specific morphology. This property enables studying the mechanism
behind the selection of morphologies, and at the same time, it enables characteriz‐
ing the structural properties of the twisted and straight morphology. Recently, poly‐
morphism has been shown to be important for the understanding of the ability of
prion diseases to transmit between individuals, sometimes crossing the species‐
barrier.
The formation of fibrils in a protein solution often exhibit a sigmoid reaction pro‐
file, characterized by a long lag phase, in which minute amounts of fibril mass are
formed, followed by a phase of rapid fibril growth. This reaction profile cannot be
explained by a simple nucleation process followed by growth from the fibril ends. A
possible explanation suggests the existence of a secondary nucleation mechanism,
which continuously generate new fibril ends in proportion to the already formed
fibril mass. This explanation does, however, suffer from a pronounced lack of ex‐

xii
perimental evidence that such a mechanism should even exist. Glucagon has also a
sigmoid reaction profile, and using specialized biophysical techniques the origin of
the kinetics was studied. The importance of secondary nucleation mechanisms is
stressed by their influence on the phenotype and stability of prion strains.
In this Ph.D. work a number of biophysical techniques have been applied, includ‐
ing traditional techniques such as circular dichroism, dynamic light scattering, fluo‐
rescence spectroscopy, and electron microscopy; but also a number of specialized
techniques: small‐angle light scattering, total internal reflection fluorescence mi‐
croscopy (TIRFM), and fiber diffraction. These techniques have been obtained
through visits at research groups in Palermo, Osaka, and Brighton.
The three main results of the Ph.D. work are:
1. Glucagon fibrils formed at 0.25 mg/mL are twisted, while at 8 mg/mL
they are straight. Structural differences between the two morphologies
manifest themselves in, e.g., fiber diffraction patterns, linear dichroism
spectra, and proteolytic digest. The results suggest that the two mor‐
phologies are formed from structurally different protofilaments.
2. The change in morphology from twisted to straight occurs gradually
when the peptide concentration is increased and correlates with the for‐
mation of reversible trimers. Cross‐seeding experiments reveal that
seeds of straight morphology have a pronounced effect on the fibrillation
kinetics at 0.25 mg/mL, while seeds of twisted morphology no effect have
on the fibrillation kinetics at 8 mg/mL glucagon. We conclude that re‐
versible inhibition of twisted fibrils by glucagon trimers is the reason for
the selection of the straight morphology at high concentration.
3. Glucagon’s fibrillation kinetics have a sigmoid profile, which indicates
that the fibril mass grows in proportion to the fibril mass present at any
given time. Using TIRFM and small‐angle light scattering on seeded solu‐
tions of glucagon, it was shown that glucagon fibrils continuously create
new fibril ends by branching. Based on seeded fibrillation kinetics, a cri‐
terion for the existence of secondary processes was proposed: in their
absence, only the fibril mass growth rate is affected, while their presence
only affects the lag phase. By comparison with Aβ(1‐40), a peptide previ‐
ously shown to form unbranched fibrils under physiological conditions,
the validity of the criterion was confirmed.

xiii
Abbreviations
AFM Atomic force microscopy
Aβ(1‐40) Amyloid β‐peptide residue 1‐40
BSE Bovine spongiform encephalopathy
CD Circular dichroism
CJD Creutzfeldt‐Jakob's disease
EM Electron microscopy
GLP‐1 Glucagon‐like peptide 1
GLP‐2 Glucagon‐like peptide 2
LALS Large‐angle light scattering
LD Linear dichroism
PrP Prion protein
SALS Small‐angle light scattering
ssNMR Solid state nuclear magnetic resonance
TEM Transmission electron microscopy
ThT Thioflavin T
TIRFM Total internal reflection fluorescence microscopy
vCJD Variant Creutzfeldt‐Jakob's disease
β2M β2‐microglobulin
Amino acids are abbreviated using the one‐ and three letter symbols suggested
by IUPAC.

xiv
Papers
Papers included in the thesis
Andersen, C. B., Otzen, D., Christiansen, G., and Rischel, C. Glucagon Amyloidlike
Fibril Morphology Is Selected via MorphologyDependent Growth Inhibition Biochem‐
istry (2007) 46, 7314‐7324.
Andersen C. B., Yagi H., Manno M., Martorana V., Christiansen G., Otzen D. E., Goto
Y., Rischel C. Branching in amyloid fibril growth submitted.
Papers not included in the thesis
Andersen C. B., Serpell L. C., Hicks M., Svensson M., Norrman M., Rahbek‐Nielsen
H., Vandahl B., Christiansen G., Rischel C., Otzen D. E. The molecular basis for gluca
gon’s structural polymorphism manuscript in preparation.
Nesgaard, L. W., Hoffmann, S. V., Andersen, C. B., Malmendal, A., Otzen, D. E. Char‐
acterization of Dry Globular Proteins and Proteins Fibrils by Synchrotron Radiation
Circular Dichroism submitted.
Holm N. K., Jespersen S. K, Thomassen L. V., Wolff T. Y., Sehgal P., Thomsen L. A.,
Christiansen G., Andersen C. B., Knudsen A.D., Otzen, D. E. Aggregation and fibrilla
tion of bovine serum albumin Biochimica et Biophysica Acta (2007) 1774, 1128–
1138.

1
2
1. Introduction In this chapter, an introduction to the field of fibrillation is presented from the
first accounts of fibrils in human tissue to the challenges faced today when formu‐
lating future protein‐based pharmaceuticals. The short historical introduction is
followed by an introduction to the model peptide, glucagon, studied during this Ph.D.
project. Toward the end of the chapter, the subject of the thesis is detailed.
1.1 Historical preamble
In 1639, Nicolaus Fontanus reported what is believed to be the first account of
amylodosis. In an autopsy of a young man, he discovered that the deceased had a
large spleen filled with white stones. Later medical accounts found similar deposits
of what appeared to be fat or starch in various organs including liver, kidneys, and
brain. In 1854, Rudolph Virchow used the term amyloid (from Latin, amylum,
starch) to describe the deposits, as he had noticed, they stained blue with iodine. In
some cases, as for example systemic amylodosis, several kilograms of proteins could
be deposited (1). Five years later, in 1859, Carl Friedreich and August Kekulé re‐
ported that the spleen deposits were chemically identical to albumin, and hence of
proteinaceous nature (2). It was not until 1959, Cohen and Calkins recognized that
when examined by electron microscopy (EM), all types of amyloid deposits—
whether formed in vivo or in vitro—consisted of non‐branching fibril structures (3).
Even today, the term amyloid is used in connection with fibrils as a reminder of the
highly ordered structure fibrils share with starch. Amyloid fibrils have since their
discovery been considered misfolded structures serving no functional purposes to
the organism. This understanding has been challenged in recent years with the dis‐
covery of certain functional amyloids as reviewed by Otzen and Nielsen (2007) (4).
Functional amyloids include components in spider’s web (spidroins) and adhesion
fibrils on the surface of bacteria (CsgA).
1.2 Amyloid diseases
The human body contains an estimated 25 000 genes each encoding up to several
different proteins and peptides (5). Each protein is formed from a string of amino
acids, which fold into a specific three‐dimensional structure from which the protein
exerts its function. Failure to attain the structure can potentially harm the human
organism, and to that end a number of cellular security measures have evolved that
detect and degrade misfolded proteins. In a number of cases, these quality control

3
systems fail, and as a result misfolded proteins accumulate (6). Often these plaques
of aggregated proteins manifest themselves as severe diseases. A special class of
highly ordered aggregates, fibrils, have gained special interest due to their severity.
In humans, more than 40 diseases related to fibrils are known (7, 8). Each disease is
linked to the fibrillation of a specific protein in a specific location (Section 4.2). As
an example, fibrillation of amyloid β‐peptide (Aβ) in the brain is closely linked to
Alzheimer's disease. Amyloid diseases such as Parkinson's disease and Alzheimer's
disease rank among the most enervating, socially disruptive not to mention costly
diseases of the modern world (9). As of today, no treatment exists for amyloid dis‐
eases, but the first Alzheimer’s disease drug candidates, which all aim at reducing
the amount of protofibrillar Aβ aggregates, are now being tested in the clinic (10). A
disease caused by fibrillation of a given protein often show variations in terms of
phenotypes and incubation periods. This phenomenon is referred to as strains and
is thought to be connected to the fact that fibrils can have various structural iso‐
forms known as morphologies (11).
1.3 Glucagon
Glucagon is a peptide hormone derived from the proglucagon precursor, which in
the α‐cells of the pancreatic islets of Langerhals is processed to glucagon and a lar‐
ger fragment, designated ‘major proglucagon fragment’ (12). In the gut endocrine
cells, proglucagon is processed to the glucagon‐like peptides GLP‐1 and GLP‐2,
which are involved in the intake, absorption, retention and disposal of energy. More
specifically, GLP‐1 stimulates insulin and inhibits glucagon secretion from the islet β
and α cells, respectively, in a glucose‐dependent manner. Hence, once plasma glu‐
cose returns to normal, GLP‐1 no longer stimulates insulin or inhibits glucagon se‐
cretion. Proglucagon contains three other peptides, shown schematically in Figure 1,
which also share sequence‐similarity with glucagon.

4
1 30 64 69 78 107/8 126 158
33 61 72 111 123 158
MPGF
Proglucagon
Glicentin
GFPP Glucagon IP1 GLP-1 IP2 GLP-2
Figure 1. Proglucagon contains a number of peptides with similar
primary structures. Glucagon and GLP‐1 are involved in the regula‐
tion of blood sugar levels and the function of GRPP, IP1, IP2, and
GLP‐2—although not understood in detail—is related to the devel‐
opment and regulation of the gastric organs. Adapted from reference
(12).
Glucagon itself generally functions as a counter‐regulatory hormone, opposing
the actions of insulin, and maintaining the levels of blood glucose. The hormone has
29 residues and a molecular weight of 3 843 Da. In peripheral tissue and especially
the liver, the insulin‐to‐glucagon ratio controls the release and uptake of plasma
glucose, which in the human body is kept between 4–8 mmol under normal condi‐
tions. Failure to keep this level leads to either hypoglycaemia (low blood sugar) or
hyperglycaemia (high blood sugar). In severe cases, hypoglycaemia can lead to coma
and—if untreated—even brain damage or death. In diabetics, the counter‐
regulatory responses to hypoglycaemia are frequently impaired, a defect most often
associated with reduced or absent glucagon responses. This is a critical issue, as
current diabetes treatment with intensive insulin administration usually increases
the risk and frequency of hypoglycaemic events. Although the mechanisms regulat‐
ing the sensing and response to hypoglycaemia are not fully understood, glucose
sensors in the brain (hypothalamus and brainstem) and portal system play impor‐
tant roles in this counter‐regulatory system (13).
Glucagon is manufactured by Novo Nordisk as a drug against severe hypogly‐
caemia. Formulated at pH 2.5, glucagon readily forms fibrils, and this property ren‐
ders manufacturing of glucagon difficult. At the same time, fibrillation is a key rea‐
son why a liquid formulation has not been achieved. Knowledge of the glucagon
fibrillation process could very well facilitate production and possibly render a liquid
formulation possible. Another interest in the fibrillation properties of glucagon
comes from the sequence similarity to GLP‐1 (14). GLP‐1 analogues are currently in
5
development as new drugs against diabetes (12, 15). The high sequence similarity
between glucagon and GLP‐1 makes it likely that new knowledge about glucagon
fibrillation can be applied to future liquid formulations of GLP‐1. So far, possibly due
to the competitive situation surrounding GLP‐1 analogues, only few GLP‐1 fibrilla‐
tion studies have been published (16). Last but not least, independently of their
proteinaceous origin, all fibrils share a common fibril forming mechanism and struc‐
ture, and glucagon can thus be used as a model system to elucidate general proper‐
ties of fibrils.
1.4 Subject of the thesis
The subject of this thesis work is related to the structural polymorphism of glu‐
cagon fibrils and the kinetics of glucagon fibrillation and falls in three parts. Com‐
mon to each of the three sub‐projects is that they involved collaboration with exter‐
nal partners in Denmark and abroad.
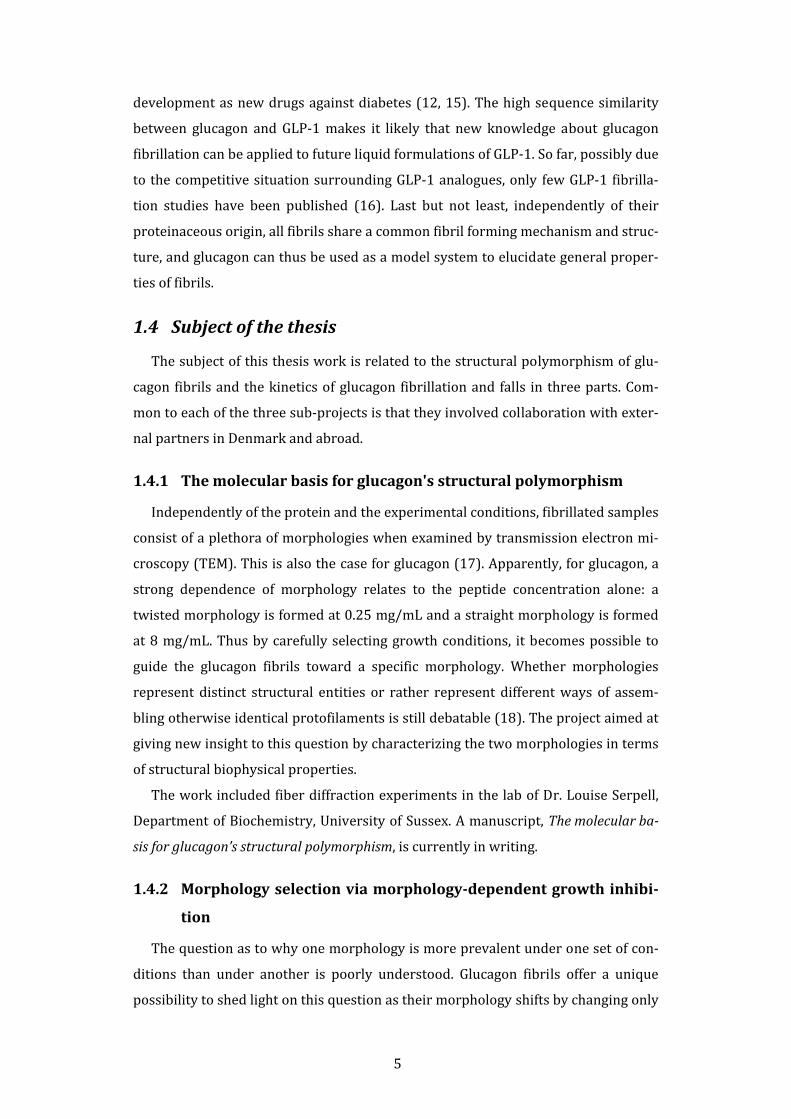
1.4.1 The molecular basis for glucagon's structural polymorphism
Independently of the protein and the experimental conditions, fibrillated samples
consist of a plethora of morphologies when examined by transmission electron mi‐
croscopy (TEM). This is also the case for glucagon (17). Apparently, for glucagon, a
strong dependence of morphology relates to the peptide concentration alone: a
twisted morphology is formed at 0.25 mg/mL and a straight morphology is formed
at 8 mg/mL. Thus by carefully selecting growth conditions, it becomes possible to
guide the glucagon fibrils toward a specific morphology. Whether morphologies
represent distinct structural entities or rather represent different ways of assem‐
bling otherwise identical protofilaments is still debatable (18). The project aimed at
giving new insight to this question by characterizing the two morphologies in terms
of structural biophysical properties.
The work included fiber diffraction experiments in the lab of Dr. Louise Serpell,
Department of Biochemistry, University of Sussex. A manuscript, The molecular ba
sis for glucagon’s structural polymorphism, is currently in writing.
1.4.2 Morphology selection via morphologydependent growth inhibi
tion
The question as to why one morphology is more prevalent under one set of con‐
ditions than under another is poorly understood. Glucagon fibrils offer a unique
possibility to shed light on this question as their morphology shifts by changing only

6
one parameter: the peptide concentration. As mentioned above, at 0.25 mg/mL the
fibril morphology is twisted, and at 8 mg/mL it is straight. In an interval between
these two concentrations, a mixture of both morphologies is present. By combining
cross‐seeding experiments with insight into glucagon's ability to self‐associate, a
new understanding of fibril morphology selection emerged.
The work included TEM experiments in collaboration with Dr. Gunna
Christiansen, Institute of Medical Microbiology and Immunology, University of Aar‐
hus, and an article, Glucagon amyloidlike fibril morphology is selected via morphol
ogydependent growth inhibition, was published in Biochemistry (19).
1.4.3 Glucagon fibrils multiply by branching
Glucagon fibrillation kinetics are characterized by a sigmoid reaction profile with
a growth phase significantly shorter than the preceding lag phase (20‐23). The
abruptness of the transition cannot be explained by spontaneous (fiber‐
independent) nucleation alone; instead the exponential nature of the reaction pro‐
file suggests that a secondary (fibril‐dependent) nucleation pathway is involved.
Real‐time total internal reflection fluorescence microscopy (TIRFM) observations of
seeded glucagon solutions showed single‐fibrils growing along the quartz surface by
addition of monomers to seed ends and continuous branching from fibrils already
formed. Light scattering experiments performed under similar conditions demon‐
strated an abrupt increase in fibril mass suggesting that branching is not restricted
to the surface‐layer, but also plays an important role in bulk solution kinetics. Based
on seeded solutions, a new method to distinguish processes with a secondary nu‐
cleation mechanism from processes without such a mechanism was introduced: in
the absence of a secondary nucleation mechanism, the effect of increasing the seed
concentration is to increase the mass growth rate, while in its presence increasing
the seed concentration decreases the lag phase but conserves the exponential na‐
ture of the growth.
TIRFM experiments were performed in collaboration with the group of Dr. Yuji
Goto, Institute for Protein Research, Osaka University. In addition, light scattering
experiments were done in collaboration with Dr. Vincenzo Martorana and Dr.
Mauro Manno, Institute of Biophysics, Consiglio Nazionale delle Ricerche, Palermo.
A manuscript, Branching in amyloid fibril growth, has been submitted for publication.

7
8
2. Fibril structure and polymorphism In this chapter, the structural properties of fibrils are detailed along with some of
the basic biophysical techniques used in the characterization of fibrils exemplified
by work done on glucagon fibrils during the Ph.D. project. An interesting aspect of
glucagon fibrils is their inherent polymorphic properties. Not only does glucagon
form a variety of morphologies easily distinguishable by TEM, but by changing the
peptide concentration alone, it is possible to select a specific morphology. This pro‐
vides an excellent platform for studying the structural differences and the mecha‐
nism behind the selection of morphologies.
2.1 Folding and misfolding of proteins
The central dogma of molecular biology is that the genetic code stored in DNA is
transcribed to RNA, and RNA is translated into a string of amino acids (24). The
amino acid chain spontaneously folds into a specific three‐dimensional structure,
the protein. At least for smaller proteins, the folding process is governed exclusively
by the properties of the amino acid residues as demonstrated by Anfinsen’s work on
ribonuclease in the late 1950's to early 60’s (25). Considering the number of amino
acids in a typical globular protein and the high degree of conformational freedom in
the polypeptide chain, the Anfinsen hypothesis apparently leads to a paradox as
originally stated by Levinthal (26). Levinthal concluded that in order to reach the
most stable configuration, the protein cannot simple do a random conformational
search. In fact, the new view that emerged in the following years involved the con‐
cept of an energy landscape for each protein describing the free energy of the poly‐
peptide chain as a function of its conformation (27). As the native state is ap‐
proached, the conformational degrees of freedom is reduced and the energy land‐
scape is hence likened to a funnel (28). Experiments suggest that the underlying
mechanism can be described as nucleation‐condensation, in which a small number
of key residues form a folding nucleus to which the remainder of the structure con‐
denses (29). For larger proteins, several folding nuclei domains may exist, and these
proteins generally fold independently in different domains, which then in a final
step are locked into the final structure.
Misfolding, with fibrillation representing a prominent example, is due to expo‐
sure of regions of the protein that are normally buried. The cell has many mecha‐
nisms, including chaperones, to avoid this, but in some cases, misfolded proteins
escape the protective mechanisms of the cell and accumulate within cells or in the

9
extracellular space. In contrast to protein folding, the formation of fibril structures
is mostly a property of the protein backbone, and in general, there is no overlap
between the folding nucleus regions and the amino acids prone to fibrillation (30).
As the protein backbone is common to all proteins, independently of the amino acid
residues, the fibril structure is now considered a general feature of all proteins, in‐
cluding proteins not associated with any disease (27, 31).
Figure 2. Folding pathways highlighting the faith of a newly synthe‐
sized polypeptide chain. Reprinted from reference (30).
Figure 2 recapitulates the possible structural faiths of a newly synthesized poly‐
peptide chain. Initially a folding nucleus is formed, which guides the rest of the
chain into the state of lowest energy, the native state. The native state may form
reversible oligomers (dimers and hexamers in the case of insulin) or fibers (e.g.,
actin and myosin). The unfolded and partly unfolded state may end up in stable mis‐
folded states and form disordered aggregates. This process is often reversible
through the action of chaperones. Fragments of the original polypeptide may be
formed by the cellular quality control system, and these fragments may be con‐
verted to fibrils as is the case of Aβ (32). As is shown in the figure, fibrils represent
highly stable and insoluble aggregates from which the monomeric polypeptide is
not easily recovered.

10
2.2 Amino acid properties affect fibrillation
Although the fibril backbone structure is basically connected through hydrogen
bonding of the protein backbones, there is an effect of the individual residues on the
fibril stability and fibrillation propensity. Hydrophobic and aromatic residues, such
as Trp, Phe, Tyr, Ile, and Val, are highly prone to fibrillate and long consecutive
stretches of such amino acids are selected against in nature (33). In contrast,
charged residues, like Lys, Glu, and Arg, help keeping proteins in solution and hence
decrease the propensity to fibrillate. In fact, to avoid fibrillation these charged resi‐
dues are often found on either side of segments containing residues prone to aggre‐
gation (33). Pro and Gly are of special interest. The Pro residue has special struc‐
tural constraints that make it difficult for it to form a β‐sheet structure. For this rea‐
son, Pro has been termed 'β‐breaker' or 'gatekeeper residue' (34, 35). Gly is the
smallest amino acid with a single hydrogen atom as its residue. Owing to this, Gly is
highly flexible, and incorporation of Gly in a secondary structure element comes at a
high entropic cost (8, 36). In the light of these amino acid properties, the strategy
for a peptide—such as glucagon—that wishes to remain intrinsically disordered
should be clear: avoid the hydrophobic residues, strive for a high net charge, and
add a few Pro residues. Curiously, referring to the amino acid sequence of glucagon
in Figure 3, glucagon does not seem to follow this strategy.
HSQGTFTSDY SKYLDSRRAQ DFVQWLMNT
Figure 3. The amino acid sequence of glucagon, containing 29 resi‐
dues. Glucagon has five aromatic residues (blue), five hydrophobic
residues (pink), and six charged residues (green). Amino acid prop‐
erties were assigned using GPMAW (37).
The peptide has five aromatic residues (blue) and additionally five hydrophobic
residues (pink). It has six charged residues (green), three positively charged and
three negatively charged, and an isoelectric point at pI = 7.7. This implies that the
peptide solubility at physiological pH is very low. Reasons why glucagon still avoids
aggregation in vivo include the fact that the glucagon plasma concentration is in the
nanomolar range and that the plasma half life is in the order of a few minutes (38‐
40).

11
2.3 Prediction of fibril propensity
A number of algorithms have been developed in order to predict the regions
prone to fibrillation (33, 41, 42). One such algorithm is TANGO developed by the
group of Luis Serrano (2004) (41). TANGO incorporates five different conforma‐
tional states of the protein—β‐turn, α‐helix, β‐sheet, the folded state, and β‐
aggregates—and different energy terms, taking into account hydrophobicity and
solvation energies, electrostatic interactions and hydrogen bonding. For each resi‐
due in a peptide, TANGO computes the percent occupancy of the β‐aggregation con‐
formation. Five consecutive residues with a score higher than 5 % pr. residue were
classified as having some aggregation tendency. TANGO was previously applied to
glucagon by Pedersen et al. in a study, which predicted residues 22‐27 (FVQWLM)
to have a score higher than 5 % (43). This stretch contains two aromatic residues (F
and W) and three hydrophobic residues (V, L, and M). The remainder of the gluca‐
gon structure was assigned scores equal to or close to zero. The TANGO plot is
shown in Figure 4.
Glucagon residue
0 5 10 15 20 25 30
TAN
GO
-agg
rega
tion
scor
e(%
)�
0
5
10
15HSQGTFTSDYSKYLDSRRAQDFVQWLMNT
Figure 4. TANGO algorithm applied to glucagon under the conditions
used in this thesis. Glucagon, with six consecutive residues with a β‐
aggregation score higher than 5 %, has some aggregation tendency
according to TANGO. The calculation was performed using the web‐
based TANGO‐interface (44).
In a comparison with aggregation studies of 179 peptide sequences found in the
literature, TANGO was found to be highly accurate as only 9 out of 62 predictions

12
were false positives. In general, a guideline of 5 consecutive residues having a β‐
aggregation score higher than 5 % turned out to be a good predictor of aggregation
propensity independently of the size of the peptide or protein. Furthermore, the
group measured a set of 71 peptides to test if the false predictions are due to ex‐
perimental error in the dataset or due to inaccuracies in the algorithm, and found a
slightly lower correlation compared to the literature‐derived set (41).
We have applied a more recent algorithm, PASTA, to the glucagon sequence (42).
PASTA is a computational approach based on the propensities of two residues to be
facing each other on neighbouring strands in a β‐sheet. Hence, the basic assumption
is that the same interactions found in structures of known globular proteins are also
found in the fibril backbone. The method assigns energy scores to fragments of the
same length from the peptide in both parallel and antiparallel orientations. Com‐
pared to other algorithms, PASTA is able to predict the registry of the intermolecu‐
lar hydrogen bonds between fibril‐prone sequences, and PASTA is able to discrimi‐
nate between parallel and antiparallel β‐strand configurations. The ability of the
algorithm to correctly predict aggregation prone regions was tested on three de‐
signed polypeptides, whose structure is known from X‐ray diffraction and ssNMR,
and on five well‐characterized, natively unfolded proteins, including Aβ(1‐40) (42).
For the natively unfolded proteins, PASTA generally correctly predicted the ob‐
served tendency of specific amino acid stretches to assemble into parallel β‐sheets.
The algorithm was also able to correctly determine the parallel or antiparallel orien‐
tation of β‐strands as confirmed by applying PASTA to short designed polypeptides,
whose structure had been determined experimentally. Later, the algorithm was
tested on a set of natively folded proteins and once again the ability of the algorithm
to predict regions prone to aggregation was very high (45).
13
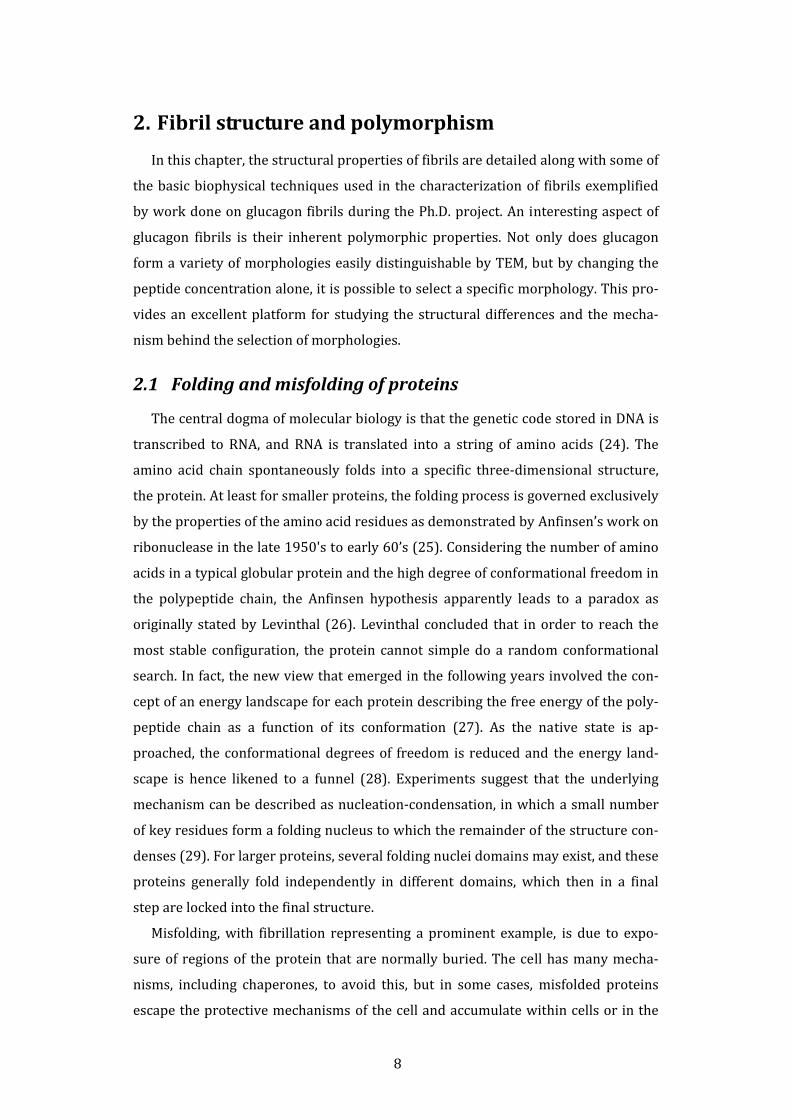
H S Q G T F T S D Y S K Y L D S R R A Q D F VQWLMN TPASTAscore
Number ofresidues
ParallelAnti-parallel
-3.81-3.66-3.58-3.02-2.41-1.95-1.19-0.33
76565464
F VQWLMF VQWLMG T F T
T F TS
Examples
Figure 5. Fibrillation‐prone regions of glucagon as predicted by
PASTA. Blue lines indicate parallel configuration and red lines indi‐
cate antiparallel configurations as exemplified in the bottom part of
the figure. A single line indicates in‐register configurations. PASTA
calculation by Henning Thøgersen, Novo Nordisk.
In Figure 5, the fibril‐prone areas of glucagon as predicted by PASTA are shown
and the parallel/antiparallel configurations exemplified. In comparison with the
TANGO algorithm, which only predicts the region containing residues 22–27 to be
fibril‐prone (43), PASTA indicates that also regions involving residues 2–10 are
prone to aggregation. The many molecular configurations shown on Figure 5, could
very well be the basis for the many morphologies observed for glucagon. It is, how‐
ever, also possible that the packing of the residues outside the backbone region of
protofilaments contribute to the general polymorphism of glucagon fibrils (18).
The fibril backbone residues can be probed by biophysical methods, including
point mutations (43), hydrogen exchange (46), and enzymatic digest (47, 48).
Pedersen et al. (2006) made an extensive work to find the fibrillogenic residues of
glucagon (43). Fifteen carefully chosen residues were substituted for Ala and the
affect on fibrillation kinetics examined by thioflavin T (ThT) fluorescence in a fluo‐
rescence plate reader. The main observation was that both N‐ and C‐terminal
patches are important for fibrillation. More specifically, they observed that residues
Phe‐6, Tyr‐10, Val‐23, and Met‐27, when point mutated to an Ala, decrease fibrilla‐
tion rates drastically. Other point mutations affected the fluorescence spectrum of

14
the fibrils without having a strong effect on fibrillation kinetics, a behaviour attrib‐
uted to the general polymorphism of glucagon. Based on their observations, the
authors proposed a loop model for glucagon, in which residues 6‐12 form an anti‐
parallel β‐sheet with residues 21‐27 (or residues 6‐10 and 23‐27 if we include only
the highly fibrillogenic residues found in the study). PASTA does allow for the pep‐
tide to form a β‐sheet with itself in a loop structure, but the proposed loops have
unfavourable energies compared to the energies of the arrangements shown in
Figure 5, and in fact does not include the two regions proposed by Pedersen et al.
(2006).
It is likely that the experimental conditions (salts and agitation) used in the ex‐
periments by Pedersen et al. (2006) favour a variety of morphologies with some
morphologies having a backbone composed of N‐terminal residues and some of C‐
terminal residues. In this way, N‐terminal Ala substitutions only decrease the
growth of a set of the morphologies present, and C‐terminal Ala substitutions affect
another set of morphologies.

15
2.4 Fibrils are built from protofilaments
In this and the following section, the structure of fibrils is outlined from the
structure observed by TEM to the atomic‐resolution structure.
~10 Å
Protofilament
Protofilaments
Fibril
Parallel -sheet�
Anti-parallel -sheet�
4.7 Å
~3 nm~6 15 nm–
Figure 6. Schematic presentation of structure and nomenclature of a
mature fibril. A typical fibril has a width of 6–15 nm, and is essen‐
tially an assembly of protofilaments each with a width of approxi‐
mately 3 nm. A protofilament is a double‐pleated β‐sheet, which can
be either parallel of antiparallel. The inter‐strand distance is 4.7 Å
and the inter‐sheet distance is around 10 Å. Adapted from reference
(49).
Figure 6 shows the overall structure of a fibril. The backbone of the fibril is de‐
fined as the amino acids forming a double‐pleated β‐sheet (indicated by arrows in
the figure). The β‐sheets can be either parallel or antiparallel to each other as indi‐
cated by the direction of the arrows in the figure. The distance between the individ‐
ual β‐strands is 4.7 Å and the inter‐sheet distance is typically in the order of 10 Å.
The inter‐sheet distance correlates with the size of the amino acid residues and can
hence vary significantly (50). The double‐pleated β‐sheet structure is referred to as
a protofilament and often has a width around 30 Å (49). Protofilaments can assem‐
16
ble in various ways and hence form a mature fibril. It is the exact arrangement of
protofilaments that determine the morphological phenotype observable by TEM.
It is still controversial whether fibril polymorphism reflects the various ways
identical protofilaments can assemble laterally, or whether it reflects polymorphism
at a protofilament level. In fact, it seems likely that both views are represented in
nature (18). Krishnan and Lindquist (2005) recently observed structural differences
in the amyloid core of the yeast prion Sup35 (51). Two fibril strains formed at 4 °C
and 25 °C, respectively, differed in terms of stability and length of the amyloid core.
This experiment demonstrates that Sup35 fibril morphologies reflect protofilament
polymorphism. In other studies, e.g., a high resolution AFM study by Anderson et al.
(2006), it has been observed that a fibril can change morphology during growth
(52). This indicates that these fibrils are essentially an arbitrary assembly of identi‐
cal protofilaments or rather that structural differences between protofilaments can
be very subtle and allow for assembly into various fibril morphologies. Finally, in
other cases, dichotomous branching, a process where a fibril splits into a number of
sub‐fibrils during growth without increasing the net number of protofilaments, has
been observed (52‐57). Hence, protofilaments may be only weakly bound together
and can give rise to a number of morphologies. In summary, we have two (not mu‐
tually exclusive) views on the nature of fibril polymorphism: (a) differences in pro‐
tofilament structure give rise to different morphologies, or (b) fibril morphologies
result from the self‐association of identical protofilaments. These views are summa‐
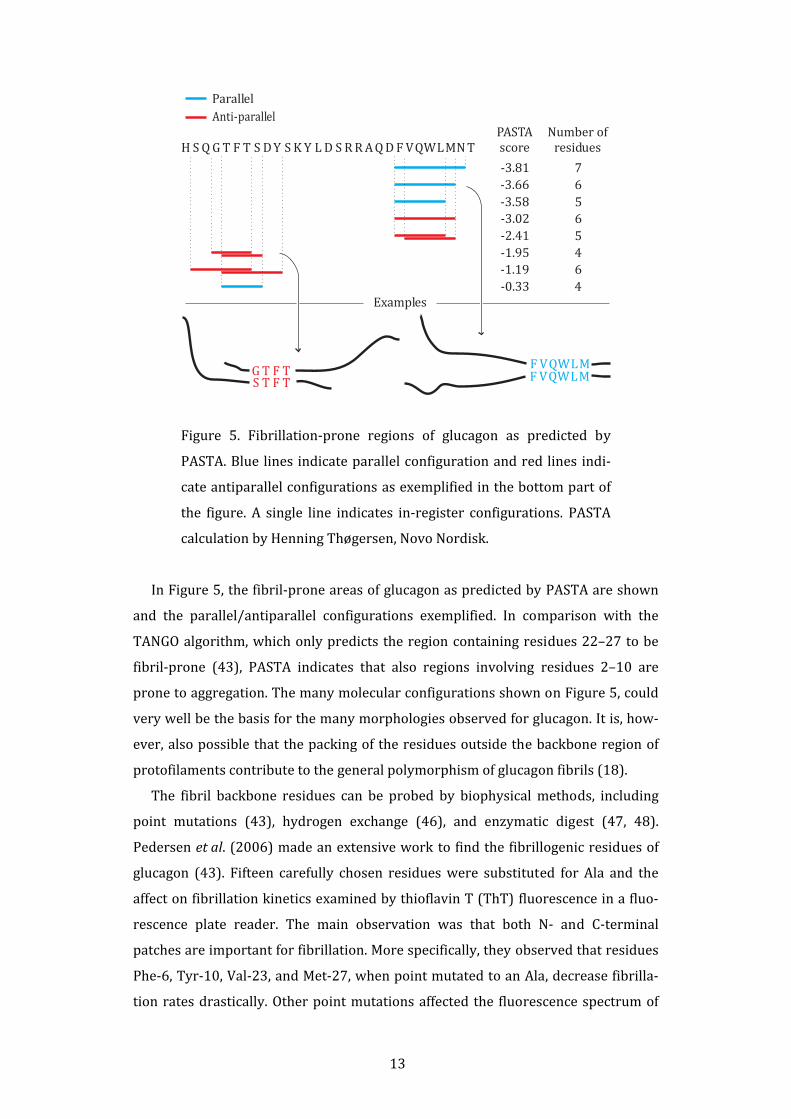
rized in Figure 7.
proto-filaments
a b
+
proto-filaments
fibrilsfibrils fibrils
Figure 7. Assembly of fibrils from protofilaments. (a) Fibril poly‐
morphism is the result of polymorphism of the protofilaments. The
black and blue lines represent structurally distinct protofilaments,
which form straight and twisted morphologies, respectively. (b) A
population of identical protofilaments gives rise polymorphic fibrils.
For glucagon, a great number of morphologies have been identified and classified
by both TEM and AFM (17, 54, 57). As is often the case with fibril morphologies, the

17
growth conditions have a great impact on the distribution of morphologies present
(17). Pedersen et al. (2006) identified four structurally distinct morphologies,
whose population were apparently determined by the experimental conditions in‐
cluding salts, agitation, pH, and peptide concentration (17). As was observed during
the Ph.D. study at hand, changing the peptide concentration in small steps from 0.25
to 8 mg/mL gradually changes the fibrils from having a predominantly twisted mor‐
phology to an almost completely homogeneous, straight morphology (19). In an
interval, both morphologies are present. The ability to select morphologies was ex‐
ploited to obtain an understanding of which scenario in Figure 7 best describes glu‐
cagon’s polymorphism. In all experiments described in this thesis, glucagon powder
was dissolved in 50 mM glycine/HCl pH 2.5 at 21 °C and agitation was kept to a
minimum.
2.5 Fibril structure at atomic resolution
In recent years, significant advances have been made in understanding the struc‐
tural organization within amyloid fibrils. The goal is to be able to determine the
structure at atomic resolution, and to that end a number of different biophysical
techniques have been applied. Insight into the structural basis for amyloid fibrils
could lead to an understanding of the basis of structural polymorphism, and possi‐
bly devise new ways to control fibril growth.
Some of the first insights came from three‐dimensional image reconstruction of a
large number of cryo‐EM pictures of mature fibrils as demonstrated by Saibil's
group in 2002 (58). By reconstructing the three‐dimensional structure of insulin
fibrils of 2, 4 or 6 protofilaments, they proposed that insulin fibrils are built from
arrangements of identical protofilaments and proposed a model of the protofibril
based on a flat β‐sheet structure between individual insulin molecules. The proto‐
filament model is visualized docked inside the electron density reconstruction of a
mature fibril in Figure 8a.
Additional insight came from solid state nuclear magnetic resonance (ssNMR).
Measurements of dipole‐dipole couplings between pairs of nuclear spins serve as
molecular rulers indicating which 13C and 15N are close in space. Through intermo‐
lecular couplings, it is possible to obtain information about which part of the mole‐
cule has a cross‐β structure, while intramolecular couplings put constraints on the
secondary motifs at specific sites. In this way, ssNMR was the basis for creating a
detailed model of Aβ(1‐40) fibrils by Tycko et al. (2003) as demonstrated in Figure
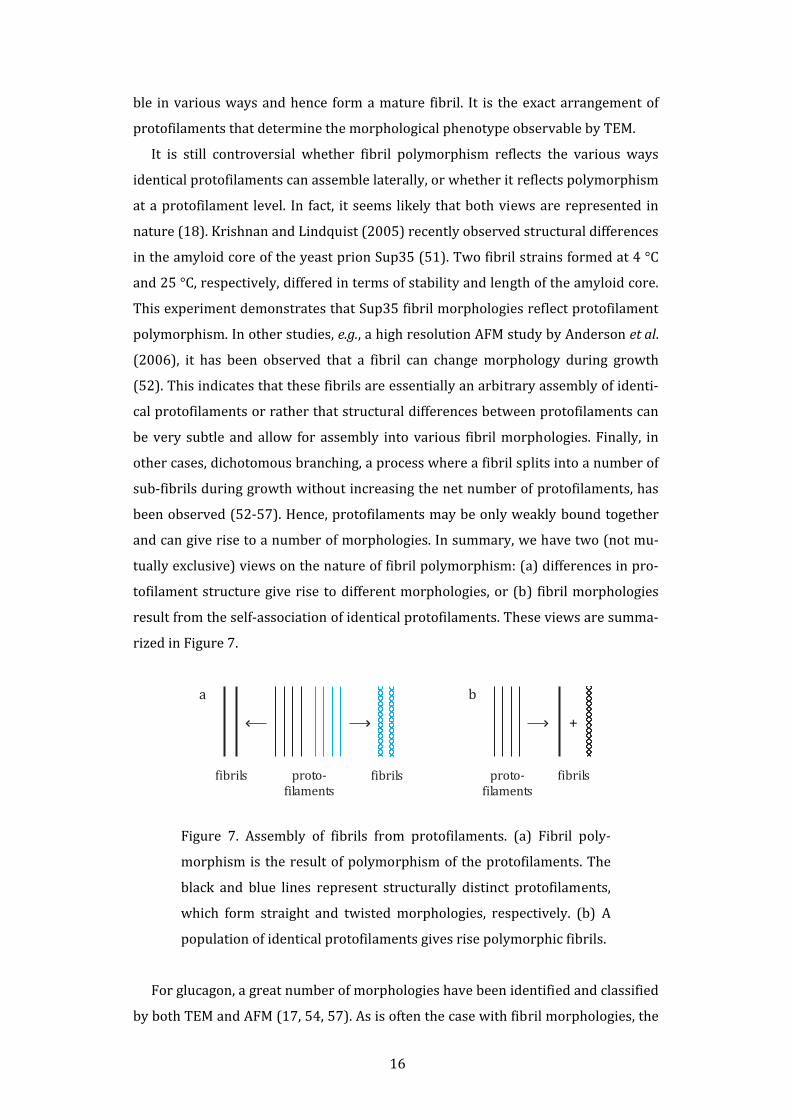
8b (59). Approximately the first ten residues are structurally disordered in accor‐
18
dance with observations showing these residues to be susceptible to proteolysis (32,
60). Residues 12‐24 and 30‐40 form two separate β‐strand segments connected by
a loop region. A single protofilament with a width of approximately 6 nm is made
from two cross‐β units in a parallel configuration as shown in Figure 8b. The core is
mainly stabilized by hydrophobic interactions and more importantly by the fact that
charged side chains are exposed to the solvent.
The most detailed understanding of the fibril backbone structure has been ob‐
tained by designing short fibrillogenic peptides known to be involved in the back‐
bone region of various proteins. The short peptides are fully incorporated into the
β‐sheet backbone structure, and produces very well‐ordered monomorphic fibrils,
which readily form small crystals. Makin et al. (2005) used a small 12‐mer polypep‐
tide to study the basis of amyloid fibril structure (61). The peptide formed well‐
ordered fibrils, which readily formed nanocrystals. Using electron diffraction in
combination with fiber diffraction, space group and unit cell dimensions were as‐
signed to the crystal structure. Using these constraints, the peptide was modelled in
a β‐sheet conformation inside the unit cell, and it was shown that simulated diffrac‐
tion patterns of the theoretical structure were similar to the experimental diffrac‐
tion patterns. The structure revealed an antiparallel β‐sheet zipped together by π‐π‐
bonding of the Phe rings on opposite strands and by salt‐bridges between charge
pairs of Glu and Lys.
In recent years, a large number of fibrillated polypeptides have been shown to
form microcrystals. The group of David Eisenberg solved the structure of such mi‐
crocrystals by X‐ray diffraction at the microfocus beamline at ESRF, Grenoble (62,
63). Based on 13 such structures, they proposed a general scheme of backbone or‐
ganization. The backbone consists of a pair of identical β‐sheets formed by extended
strands of the polypeptide, all perpendicular to the fibril axis. The two sheets meet
at a dry interfaced, i.e., an interface depleted from water and solvent molecules. The
interface is essentially a tight intermesh of residues forming a steric zipper. The
steric zippers formed eight groups depending on, e.g., parallel/antiparallel configu‐
ration and the orientation of the surface of the sheets (face‐to‐face vs. face‐to‐back).

19
Figure 8. Fibril models obtained by different biophysical techniques.
(a) Insulin fibril model based on cryo‐EM and three‐dimensional im‐
age reconstruction. Each protofilament has been assigned a color.
(b) Aβ(1‐40) fibril model viewed down the fibril axis based on
ssNMR. (c) Fibril model of GNNQQNY based on X‐ray diffraction on
microcrystals. The picture shows nine β‐sheets down the fibril axis.
Reprinted from reference (58), (59), and (62), respectively.
Considering the recent significant advances in determining fibril structure at a
molecular level, the first full‐length structures solved at atomic resolution are
within reach.
2.6 Fibril criteria
The highly ordered repetitive structure of the fibril backbone can be probed by a
number of biophysical techniques. Traditionally, for fibrils stained with the sul‐
fonated azo dye Congo red, the appearance of an apple green birefringence when
observed under crossed polarizers was considered fingerprints of amyloid fibrils.
Today, three biophysical criteria are considered essential for the classification of in
vitro aggregates as fibrils: (i) the observation of fibril‐like structures by TEM, (ii) X‐
ray fiber diffraction, and (iii) the binding of fibril‐specific dyes, primarily ThT. In the
following three sections, the basic principles of these criteria are explored using
examples from the present work on glucagon fibrils. As will become clear, not only
do these techniques help determine if a fibrous material is indeed amyloid fibrils,
they also give insight into the structure of the fibrils and help elucidate even slight
differences between morphologies.

20
2.6.1 Transmission electron microscopy
When viewed by TEM, fibrils often appear as micrometer long nonbranched
structures built from subunits arranged as twisted ropes, ribbons, or bundles (3).
The structures are typically highly organized with persistence lengths in the mi‐
crometer regime (64).
Figure 9. TEM pictures of glucagon fibrils formed at two different
peptide concentrations: (a) 0.25 mg/mL and (b) 8 mg/mL. At 0.25
mg/mL, the fibrils share a morphology characterized by two or more
protofilaments twisting around each other. At 8 mg/mL, the fibrils
are predominantly straight and made up of two protofilaments. Bars
represent 100 nm.
Figure 9 shows examples of TEM pictures obtained from fibrillated samples of
0.25 and 8 mg/mL glucagon (19). The fibils are micrometers long and appear non‐
branched. The two TEM pictures also demonstrate fibril polymorphism, a phe‐
nomenon first reported for glucagon by Glenner et al. (1974) (65). The fibrils
formed from 0.25 mg/mL of glucagon all share a twisted morphology with two or
several protofilaments twisting around each other (Figure 9a). Put in more strin‐
gent terms, at 0.25 mg/mL of glucagon, the fibrillated sample is composed of a
number of different morphologies, which all feature protofilaments with a repetitive
twist. At 8 mg/mL, glucagon forms fibrils composed of a single protofilament, and
the population of fibrils is very homogeneous (Figure 9b) (19).
Phenotypes observed by TEM are one way to identify differences in morpholo‐
gies. It should be noted, however, that subtle structural differences between mor‐
phologies do not necessarily manifest themselves in TEM pictures, in which case
other biophysical techniques should be applied (17).
21
2.6.2 Fiber diffraction
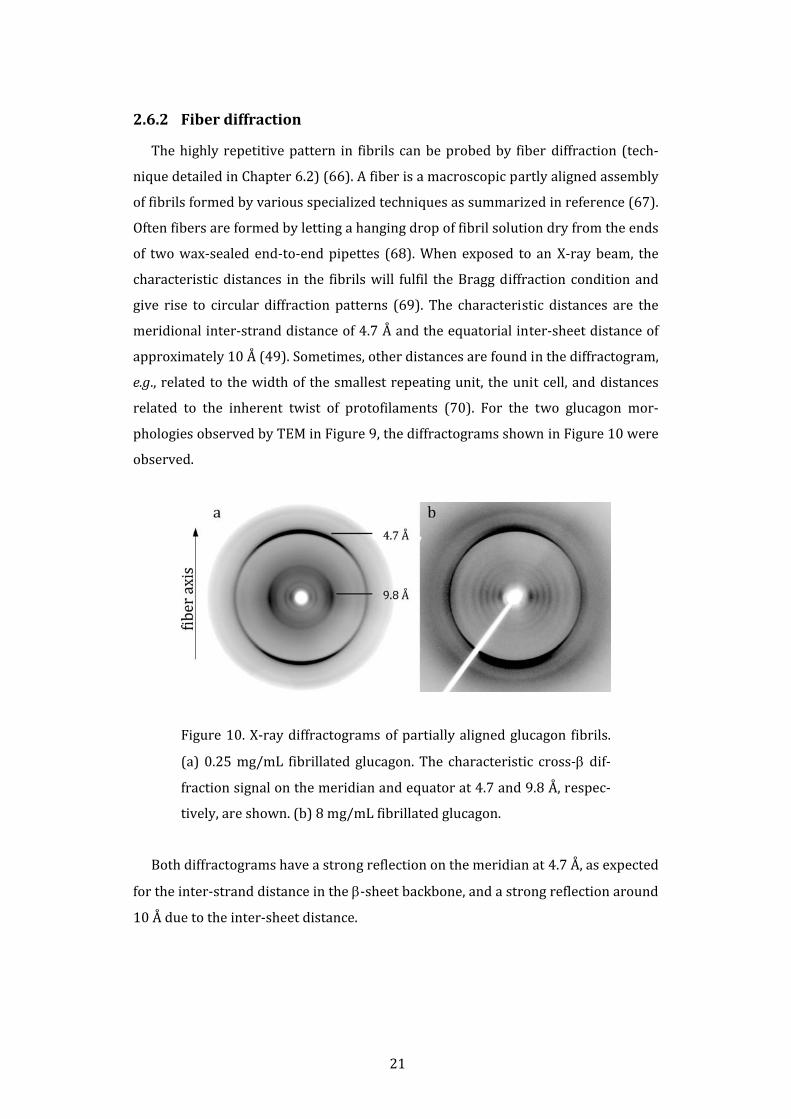
The highly repetitive pattern in fibrils can be probed by fiber diffraction (tech‐
nique detailed in Chapter 6.2) (66). A fiber is a macroscopic partly aligned assembly
of fibrils formed by various specialized techniques as summarized in reference (67).
Often fibers are formed by letting a hanging drop of fibril solution dry from the ends
of two wax‐sealed end‐to‐end pipettes (68). When exposed to an X‐ray beam, the
characteristic distances in the fibrils will fulfil the Bragg diffraction condition and
give rise to circular diffraction patterns (69). The characteristic distances are the
meridional inter‐strand distance of 4.7 Å and the equatorial inter‐sheet distance of
approximately 10 Å (49). Sometimes, other distances are found in the diffractogram,
e.g., related to the width of the smallest repeating unit, the unit cell, and distances
related to the inherent twist of protofilaments (70). For the two glucagon mor‐
phologies observed by TEM in Figure 9, the diffractograms shown in Figure 10 were
observed.
Figure 10. X‐ray diffractograms of partially aligned glucagon fibrils.
(a) 0.25 mg/mL fibrillated glucagon. The characteristic cross‐β dif‐
fraction signal on the meridian and equator at 4.7 and 9.8 Å, respec‐
tively, are shown. (b) 8 mg/mL fibrillated glucagon.
Both diffractograms have a strong reflection on the meridian at 4.7 Å, as expected
for the inter‐strand distance in the β‐sheet backbone, and a strong reflection around
10 Å due to the inter‐sheet distance.

22
Radius (pixels)
0 20 40 60 80 100 120 140
Inte
nsi
ty(a
.u.)
50
100
150
200
250
0.25 mg/mL, equatorial0.25 mg/mL, meridional8 mg/mL, equatorial8 mg/mL, meridional
30Å
19.5
Å
13.3
Å
10.6
Å9.
8Å
8.7
Å 4.7 Å
Figure 11. Intensity profiles of the glucagon fiber diffractograms in
Figure 10. Intensity profiles were calculated by integration over a 60
deg angle along the equator and meridian, respectively. Approximate
distances are shown in the plot.
A number of other reflections are also seen, although their physical origin is not
easily interpreted. In Figure 11, the intensities along the radius of the detector, as
obtained by integrating a 60 degree angle along the meridian and the equator, re‐
spectively, are plotted. The diffractogram from the twisted fibrils (Figure 10a) has a
reflection around 30 Å, and this reflection could be related to the width of a single
protofilament (cf. Figure 6). The diffractogram from the straight morphology fibrils
(Figure 10b) has three peaks around 10 Å on the equator (8.7, 10.6, and 13.3 Å). The
two diffractograms in Figure 10 are currently being analyzed by the use of the pro‐
gram CLEARER developed by the group of Dr. Louise Serpell (71).
2.6.3 Fibrilspecific fluorescent dyes
A number of fluorescent dyes including ThT and Congo red have been shown to
preferentially bind to the mature fibril structure (72, 73). The exact binding mecha‐
nism is not known, but due to its specificity toward fibrillar structures, it is expected
that binding occurs in the regularly spaced grooves of the backbone (74).
23
Time (hours)
0 20 40 60 80
Fluo
resc
ence
inte
nsi
ty(a
.u.)
0
200
400
600
800
1000
1200
0
20
40
60
80
100
120
8 mg/mL0.25 mg/mL
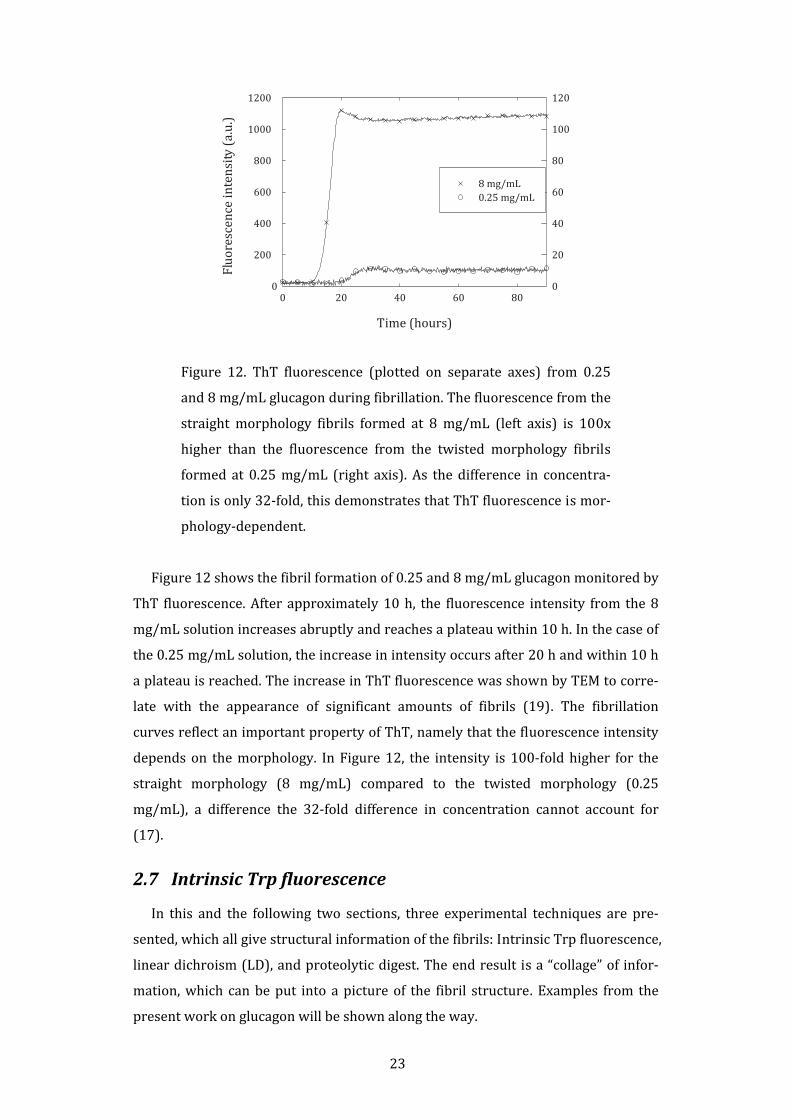
Figure 12. ThT fluorescence (plotted on separate axes) from 0.25
and 8 mg/mL glucagon during fibrillation. The fluorescence from the
straight morphology fibrils formed at 8 mg/mL (left axis) is 100x
higher than the fluorescence from the twisted morphology fibrils
formed at 0.25 mg/mL (right axis). As the difference in concentra‐
tion is only 32‐fold, this demonstrates that ThT fluorescence is mor‐
phology‐dependent.
Figure 12 shows the fibril formation of 0.25 and 8 mg/mL glucagon monitored by
ThT fluorescence. After approximately 10 h, the fluorescence intensity from the 8
mg/mL solution increases abruptly and reaches a plateau within 10 h. In the case of
the 0.25 mg/mL solution, the increase in intensity occurs after 20 h and within 10 h
a plateau is reached. The increase in ThT fluorescence was shown by TEM to corre‐
late with the appearance of significant amounts of fibrils (19). The fibrillation
curves reflect an important property of ThT, namely that the fluorescence intensity
depends on the morphology. In Figure 12, the intensity is 100‐fold higher for the
straight morphology (8 mg/mL) compared to the twisted morphology (0.25
mg/mL), a difference the 32‐fold difference in concentration cannot account for
(17).
2.7 Intrinsic Trp fluorescence
In this and the following two sections, three experimental techniques are pre‐
sented, which all give structural information of the fibrils: Intrinsic Trp fluorescence,
linear dichroism (LD), and proteolytic digest. The end result is a “collage” of infor‐
mation, which can be put into a picture of the fibril structure. Examples from the
present work on glucagon will be shown along the way.

24
As the inherent fluorescent signal of aromatic residues Trp, Tyr, and Phe de‐
pends strongly on the environment, these residues can be used as intrinsic fluores‐
cent probes of protein conformation, dynamics, and intermolecular interactions
(75). Of the three, Trp is most frequently used, and this residue is often used to
probe the conversion of proteins into fibril structures. When incorporated into the
fibril structure, the fluorescence spectrum of the Trp residue is typically blue‐
shifted from a maximum around 350 nm to approximately 320 nm. The ratio be‐
tween the peak maxima is therefore often used to probe fibrillation kinetics (76).
Wavelength (nm)
300 330 360 390 420 450
Fluo
resc
ence
inte
nsi
ty(a
.u.)
0
0.2
0.4
0.6
0.8
1.0
8 mg/mL, nonfib.0.25 mg/mL, nonfib.0.25 mg/mL, fib.8 mg/mL, fib.
Figure 13. Fluorescence spectra of freshly prepared 0.25 and 8
mg/mL glucagon samples (open symbols) compared with fibrillated
samples formed at identical peptide concentrations (solid symbols).
The nonfibrillated 0.25 and 8 mg/mL samples have maxima at 348
and 346 nm, respectively. The fibrillated 0.25 and 8 mg/mL samples
have a maxima at 314 and 319 nm, respectively, and the Trp resi‐
dues are thus significantly blue‐shifted when incorporated into the
fibril structure. The fibrillated 8 mg/mL sample was diluted 32 times
to take the difference in concentration into account and data has
been normalized. Excitation wavelength λex = 290 nm.
Glucagon contains a single Trp residue, Trp‐25, and using this residue it is possi‐
ble to study glucagon fibrillation kinetics without adding fluorescent dyes (17, 19).
Figure 13 shows fluorescence spectra of fibrillated samples of 0.25 and 8 mg/mL
glucagon from 300–450 nm when excited at 280 nm. The spectra are compared with
spectra of freshly prepared, nonfibrillated samples of 0.25 and 8 mg/mL glucagon,

25
which have maxima at 348 and 346 nm, respectively. The spectrum of fibrils formed
at 0.25 mg/mL is significantly blue‐shifted with a maximum at 314 nm, and simi‐
larly, the spectrum of the fibrils formed at 8 mg/mL has a maximum at 319 nm. This
demonstrates the sensitivity of the Trp residue to the surroundings.
2.8 Linear dichroism
The polarization of light is often applied to probe molecular structure. Left and
right circularly polarized light, for example, interacts differently with chiral mole‐
cules and secondary structure elements giving rise to small differences in the frac‐
tion of absorbed light (77). This effect is explored in circular dichroism (CD) and can
give information about the structural content of proteins (19). Linear dichroism
(LD) is a technically related method relying on differences in absorption of linearly
polarized light in horizontal and vertical direction, respectively (78). Only samples
oriented in a specific direction will display linear dichroism. For fibrils and DNA,
this is possible after alignment in a flow cell. LD can provide information about the
presence of secondary structure elements, α‐helices and β‐sheets, and the relative
position of the aromatic residues including Tyr and Trp (78). The LD technique has
in recent years been applied to amyloid fibrils by Dafforn et al. (2004) and Adachi et
al. (2007) (79, 80). Dafforn et al. (2004) compared CD and LD spectra of various
fibrous materials and found that Aβ(1‐42) fibrils have strong positive peak around
200‐205 nm characteristic of fibers with a β‐sheet structure more perpendicular
than parallel to the fiber axis (79). No signal was observed in the aromatic region
(250‐300 nm) despite a high content of Tyr and Phe. Adachi et al. (2007) flow‐
aligned fibrils of a fragment of β2M, which forms two different morphologies. The
spectra showed strong absorbance differences in the aromatic region. The aromatic
signal was assigned to a Tyr residue in the peptide, which was shown to have its
transition moment oriented in parallel to the fibril axis.

26
Wavelength (nm)
200 220 240 260 280 300 3200,000
0,002
0,004
0,006
0,008
0,010
0,012
0,014
LD(
Abs
)�
0,00
0,02
0,04
0,06
0,08
0,10
220 240 260 280 3000,0000
0,0002
0,0004
0,00060,0008
0,0010
0,00120,0014
0,000
0,002
0,004
0,006
0,008
0,010
Figure 14. LD spectra from 190–320 nm of flow‐aligned straight ( )
and twisted (×) fibrils (plotted on left and right axis, respectively).
The inset shows the aromatic region in detail. The fibrils formed at 8
mg/mL were diluted 32x to take the difference in concentration into
account.
LD spectra of flow‐aligned glucagon fibrils formed under the two conditions cen‐
tral to this Ph.D. project have been measured by Dr. Matthew Hicks, University of
Warwick, and they are shown in Figure 14. The figure shows the LD spectra from
190–320 nm of flow‐aligned twisted and straight fibrils. A shoulder around 230 nm
for the straight morphology and a large spectral difference in the aromatic region
(inset) stands out. The twisted morphology fibrils have a pronounced shoulder at
287 nm, which is absent in the straight morphology. This could suggest more con‐
formational freedom of the Trp‐25 residue in the straight morphology. The shoulder
at 295 nm is also likely to be due to the orientation of the Trp‐25 residue and may
be related to the shoulder at 230 nm. The fibrillated 8 mg/mL sample was diluted
32x to take the difference in concentration of the two samples into account, but still
the LD signal is 7–10x higher for the straight morphology sample. Although data
analysis is currently in progress, it is clear that the structural differences of the
twisted and straight morphologies also manifest themselves by LD.
2.9 Proteolysis of fibrils
The fibril core is often very stable and resistant to proteases. This property has
been exploited to determine the regions forming the β‐strands perpendicular to the
fibril axis (47, 48). Typically, the mature fibrils are digested by adding pepsin. The
enzyme chews off all residues not protected in the fibril core, and leaves the fibril

27
backbone intact. The fragments released by the enzyme are removed by repeatedly
isolating the fibrils by centrifugation, removing the supernatant and rediluting in
buffer. The fibrils are dissolved and separated by size or hydrophobicity. In one par‐
ticular study, two different fibril morphologies of β2M were found to have different
digest patterns when digested by pepsin (48).
Time (h)
0 20 40 60 80 100 120
Nor
mal
ized
inte
nsi
ty
0,0
0,2
0,4
0,6
0,8
1,0
TrpThT
Pepsin
Figure 15. Fibrillation of glucagon and subsequent pepsin digest of
the fibrils formed followed by ThT and Trp fluorescence. After 60 h,
the ThT signal is essentially unchanged, but the Trp signal has de‐
creased to approximately 15 % suggesting that the fibrils are intact
but the Trp‐25 has been cleaved off.
Glucagon fibrils of straight and twisted morphology were digested in order to de‐
termine it the morphologies are due to differences in the amino acid stretches form‐
ing the amyloid core. The PASTA algorithm described in Section 2.3 predicts that
this could indeed be the case. Unfortunately, only the straight morphology fibrils are
protease resistant. Figure 15 shows the fibrillation of 8 mg/mL of glucagon followed
by ThT and Trp fluorescence. After approximately 50 h, pepsin is added to the fibril‐
lated sample solution. The ThT fluorescence is essentially unchanged even after 60
h, clearly demonstrating that fibril structures are still present. The Trp fluorescence,
on the other hand, is simultaneously decreased to approximately 15 % of the initial
level hereby showing that pepsin has had an effect on the peptide, and that probably
the C‐terminal has been affected.
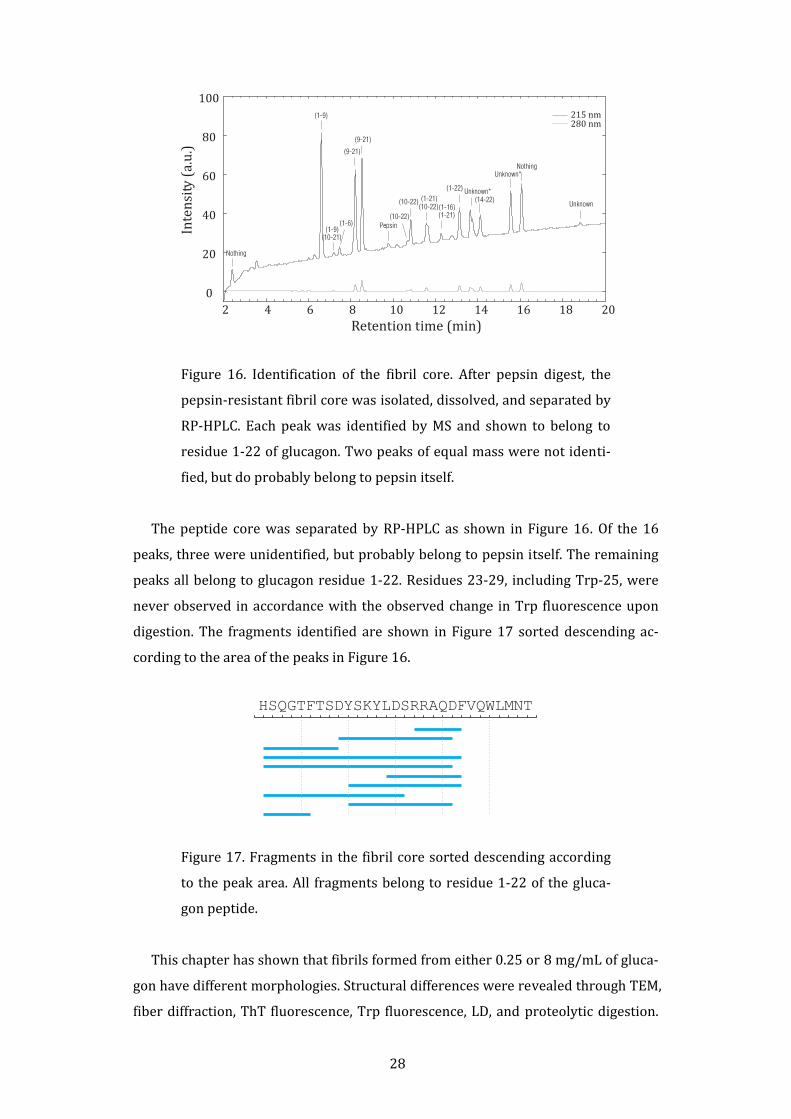
28
Retention time (min)2 4 6 8 10 12 14 16 18 20
Inte
nsi
ty(a
.u.)
0
20
40
60
80
100215 nm280 nm
Nothing
(1-9)
(1-9)(10-21)
(9-21)
(9-21)
Pepsin
(10-22)
(10-22)
(1-6)
(1-21)(10-22)(1-16)
(1-21)
(1-22) Unknown*(14-22)
Unknown*Nothing
Unknown
Figure 16. Identification of the fibril core. After pepsin digest, the
pepsin‐resistant fibril core was isolated, dissolved, and separated by
RP‐HPLC. Each peak was identified by MS and shown to belong to
residue 1‐22 of glucagon. Two peaks of equal mass were not identi‐
fied, but do probably belong to pepsin itself.
The peptide core was separated by RP‐HPLC as shown in Figure 16. Of the 16
peaks, three were unidentified, but probably belong to pepsin itself. The remaining
peaks all belong to glucagon residue 1‐22. Residues 23‐29, including Trp‐25, were
never observed in accordance with the observed change in Trp fluorescence upon
digestion. The fragments identified are shown in Figure 17 sorted descending ac‐
cording to the area of the peaks in Figure 16.
HSQGTFTSDYSKYLDSRRAQDFVQWLMNT
Figure 17. Fragments in the fibril core sorted descending according
to the peak area. All fragments belong to residue 1‐22 of the gluca‐
gon peptide.
This chapter has shown that fibrils formed from either 0.25 or 8 mg/mL of gluca‐
gon have different morphologies. Structural differences were revealed through TEM,
fiber diffraction, ThT fluorescence, Trp fluorescence, LD, and proteolytic digestion.

29
More work is necessary to conclude that hydrogen‐bonding in two different parts of
the glucagon peptide gives rise to the two morphologies described above. However,
based on the biophysical data at hand, it is clear that significant structural differ‐
ences characterize the two morphologies studied, and these differences are likely to
result from polymorphism in the protofilaments involved. The work on glucagon
presented in this chapter is currently being prepared for publication. It is surprising
that changing the concentration of glucagon molecules in the test tube has such a
profound impact on the fibril structure. In the next chapter, the mechanism behind
this selection of morphologies is explored.
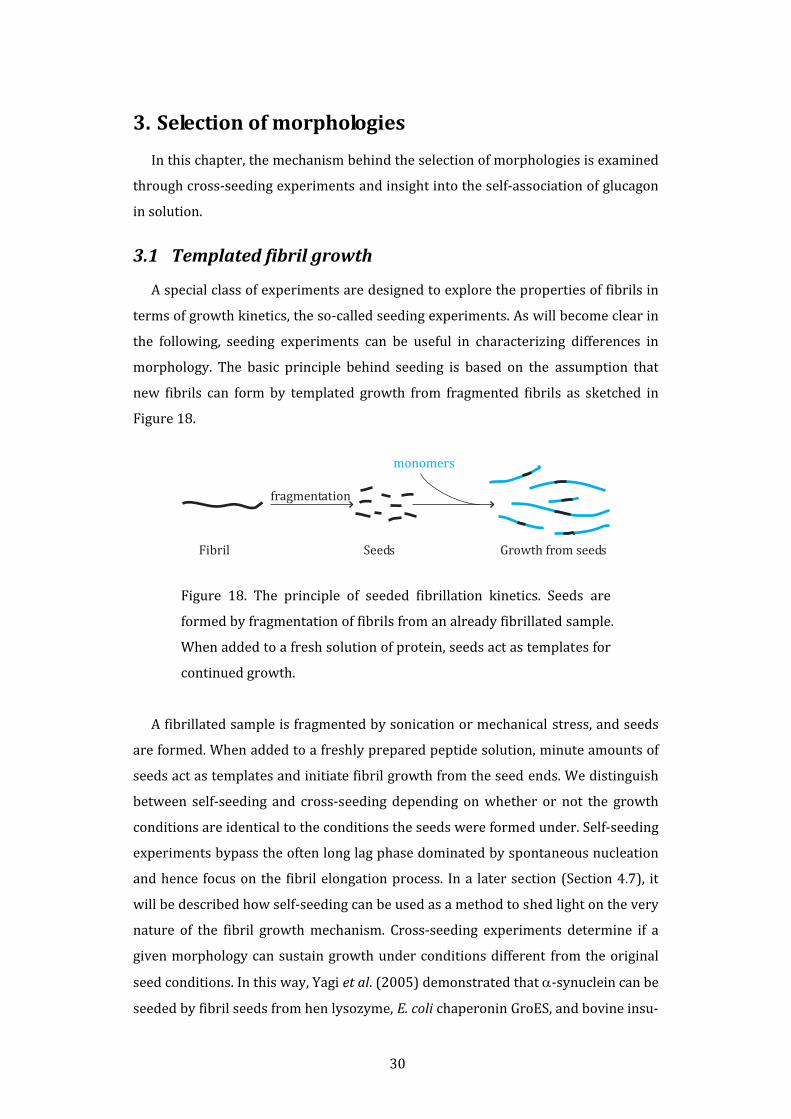
30
3. Selection of morphologies In this chapter, the mechanism behind the selection of morphologies is examined
through cross‐seeding experiments and insight into the self‐association of glucagon
in solution.
3.1 Templated fibril growth
A special class of experiments are designed to explore the properties of fibrils in
terms of growth kinetics, the so‐called seeding experiments. As will become clear in
the following, seeding experiments can be useful in characterizing differences in
morphology. The basic principle behind seeding is based on the assumption that
new fibrils can form by templated growth from fragmented fibrils as sketched in
Figure 18.
fragmentation
monomers
Fibril Seeds Growth from seeds
Figure 18. The principle of seeded fibrillation kinetics. Seeds are
formed by fragmentation of fibrils from an already fibrillated sample.
When added to a fresh solution of protein, seeds act as templates for
continued growth.
A fibrillated sample is fragmented by sonication or mechanical stress, and seeds
are formed. When added to a freshly prepared peptide solution, minute amounts of
seeds act as templates and initiate fibril growth from the seed ends. We distinguish
between self‐seeding and cross‐seeding depending on whether or not the growth
conditions are identical to the conditions the seeds were formed under. Self‐seeding
experiments bypass the often long lag phase dominated by spontaneous nucleation
and hence focus on the fibril elongation process. In a later section (Section 4.7), it
will be described how self‐seeding can be used as a method to shed light on the very
nature of the fibril growth mechanism. Cross‐seeding experiments determine if a
given morphology can sustain growth under conditions different from the original
seed conditions. In this way, Yagi et al. (2005) demonstrated that α‐synuclein can be
seeded by fibril seeds from hen lysozyme, E. coli chaperonin GroES, and bovine insu‐

31
lin (81). In each case, it was demonstrated that the seeds were incorporated into the
mature fibrils. This rather extreme example of cross‐seeding demonstrates the ver‐
satility of the fibril backbone to template fibril growth, even when the incoming
monomer is completely different from the protein at the seed end. This property
arises from the fact that fibrils predominantly assemble through amino acid back‐
bone interactions rather than side chain interactions (82). If the seed ends are not
receptive to monomers, seeding has no effect on the lag phase.
Time (h)
0 5 10 15 20 25 30
Fluo
resc
ence
inte
nsi
ty(a
.u.)
0,0
0,2
0,4
0,6
0,8
1,0
Figure 19. Seeded fibrillation kinetics. An 8 mg/mL glucagon solu‐
tion is seeded with seed concentrations ranging from 10‐3 to 400
µg/mL with intermediate concentrations separated by a factor of 5.
The rightmost curve is the nonseeded kinetics. As the seed concen‐
tration is increased, the lag phase is decreased. The intensity was
normalized with respect to the maximum fluorescence intensity.
Self‐seeding and cross‐seeding experiments were performed by adding minute
amounts of twisted and straight seeds to freshly prepared 0.25 and 8 mg/mL gluca‐
gon solutions. An example of seeded fibrillation of an 8 mg/mL glucagon solution is
shown in Figure 19. The resulting kinetics profiles were characterized by the dura‐
tion of the lag phase as detailed in reference (19). Considering the experiments by
Yagi et al. (2005), it is expected that both fibril morphologies would sustain growth
when cross‐seeded. After all, the change in glucagon concentration should only im‐
pact the fibril growth rate.

32
Glucagon concentration (mg/mL)
0.25 8
Lag
pha
se(h
)
0
5
10
15
20
25
30
No seedsTwisted seedsStraight seed
Figure 20. Seeding 0.25 and 8 mg/mL glucagon solutions with pre‐
formed seeds formed at either 0.25 mg/mL (twisted seeds) or 8
mg/mL (straight seeds). Seeds of either morphology have a pro‐
found effect on the lag phase when added to a 0.25 mg/mL sample
solution, and so do straight seeds when added to an 8 mg/mL sam‐
ple solution. Puzzling, twisted seeds have no effect when added to an
8 mg/mL glucagon solution. The seed concentration was approxi‐
mately 3 µg/mL.
The lag phases of the seeding experiments are shown in Figure 20. At a seed con‐
centration of approximately 3 µg/mL, the lag phase of the 0.25 mg/mL solution is
reduced from 24 h to 1.2 and 1.9 h when self‐seeded and cross‐seeded, respectively.
The 14 h lag phase of the 8 mg/mL solution is reduced to 2.3 h upon self‐seeding,
but when cross‐seeded, the reduction in the lag phase is negligible and within the
error margin. An effect, if any, could be caused by the small fraction of straight fi‐
brils present in fibrillated 0.25 mg/mL samples. The morphology of the seed‐
induced fibrils were subsequently determined by TEM as shown in Figure 21.

33
Figure 21. Morphologies of fibrils after the seeding experiment
shown in Figure 20. (a) 0.25 mg/mL self‐seeded. (8) 8 mg/mL self‐
seeded. (c) 0.25 mg/mL cross‐seeded. (d) 8 mg/mL cross‐seeded. In
accordance with Figure 20, the twisted seeds added at 8 mg/mL
sample solution has no effect on the resulting morphology. Bar
represents 100 nm. From reference (19).
Figure 21a and b show that self‐seeding conserves the morphology imprinted by
the seed. Figure 21c shows that straight seeds when added to a 0.25 mg/mL gluca‐
gon solution conserves the morphology of the seeds. Intriguingly, the twisted seeds
do not imprint their morphology when added to a fresh solution of 8 mg/mL gluca‐
gon. In conclusion, cross‐seeding twisted seeds to an 8 mg/mL sample solution,
where straight fibrils dominate under non‐seeded conditions, has no effect on nei‐
ther lag phase nor morphology. The origin of this peculiar behaviour is detailed in
the next section.
3.2 Morphologydependent growth inhibition
In a series of fibrillation experiments, freshly prepared solutions of 0.25–8
mg/mL glucagon were fibrillated at 21 °C in a fluorescence plate reader. Intuitively,
increasing the peptide concentration should increase the fibril growth rate as the
monomers are not as easily locally depleted at the growing fibril ends. Fibrillation
kinetics were characterized by an hour long lag phase followed by a rapid increase
in fibril mass (19). The lag phase was calculated for each sample and is plotted as a
function of the peptide concentration in Figure 22.

34
Glucagon concentration (mg/mL)
0 1 2 3 4 5 6 7 8
Lag
tim
e(h
)
0
10
20
30
40
Figure 22. Lag phase duration as a function of the peptide concentra‐
tion. The maximum at 1 mg/mL stands out. From reference (19).
The lag phase plot in Figure 22 shows that as the peptide concentration is in‐
creased from 0.25 mg/mL to 1 mg/mL, the lag phase increases from approximately
22 to 34 h. Above 1 mg/mL, a further increase in peptide concentration decreases
the lag phase until it reaches a plateau around 12 h at high concentrations. The be‐
haviour when gradually increasing the concentration from 0.25 mg/mL to 1 mg/mL
stands out. In a separate experiment, the experiment above was repeated and sam‐
ples examined by TEM as soon as the maximum fluorescence level had been reached
(19). Interestingly, as the peptide concentration is increased from 0.25 mg/mL, the
fraction of straight fibrils increase at the expense of twisted fibrils. Above 2.5
mg/mL the straight fibril morphology is by far the most numerous with only minute
amounts of nonstraight fibrils.
In search for an explanation for the peculiar lag phase behaviour, the self‐
association of glucagon molecules in freshly prepared solutions was examined by a
light scattering method devised by Glatter (83, 84). The glucagon oligomer size as a
function of the peptide concentration is plotted in Figure 23.

35
Glucagon concentration (mg/mL)
0 1 2 3 4 5 6 7 8
Olig
omer
size
0
1
2
3
Figure 23. Concentration‐dependent self‐association of glucagon. At
low concentration, glucagon is predominantly monomeric, and at
high concentration, glucagon forms trimers. From reference (19).
The figure demonstrates that glucagon is monomeric at low concentration and
has an oligomer size of 2.6 at high concentrations. This suggests a monomer–trimer
equilibrium under the solvent conditions used throughout this study. The trimer
conformation has been confirmed in previous studies under different solvent condi‐
tions (85, 86), and also by the fact that the crystal structures of glucagon are
trimeric (85, 87). By singular value decomposition of CD spectra, it was established
that the monomer–trimer equilibrium does not involve a significantly populated
dimer state (19).
Based on the correlation between the increase in the lag phase and the formation
of glucagon trimers, we hypothesise that the trimer is able to specifically inhibit the
twisted morphology fibrils. So in summary, at low concentrations of glucagon, the
twisted morphology dominates. As the peptide concentration increases, so does the
fraction of reversible trimers, and these trimers have the ability to specifically block
twisted fibrils from growing. With the twisted fibrils struggling to grow, another
morphology, the straight morphology, becomes the most numerous. As straight fi‐
brils are not blocked by trimers, a further increase in peptide concentration de‐
creases the lag phase (Figure 22). Turning to the seeding experiments shown in
Figure 20, we propose that the surprising behaviour observed when cross‐seeding
twisted fibrils to an 8 mg/mL glucagon solution is due to the inhibition of twisted
fibrils by reversible trimers as summarized in Figure 24.

36
monomers
monomers
0.25 mg/mL 8 mg/mLSeed stocks
monomers+ trimers
monomers+ trimers
Twistedseeds
Straightseeds
Inhibition of fibrilgrowth from seed ends
due to trimers !
Figure 24. Inhibition of twisted fibrils by reversible trimers. Seeds
formed by fragmentation of straight fibrils decrease the lag phase
when added to fresh solutions of glucagon at either 0.25 or 8 mg/mL.
At the same time, the seeds determine the morphology at either glu‐
cagon concentration. In contrast, seeds from twisted fibrils readily
self‐seed, but fail to increase the fibrillation rate at 8 mg/mL gluca‐
gon. Instead, the fibrils formed have the straight morphology ex‐
pected for non‐seeded solutions of 8 mg/mL glucagon. We conclude
that growth of twisted fibrils is inhibited by reversible trimers, and
hypothesise that reversible trimers are able to bind to the ends of
twisted fibrils.
The exact molecular mechanism behind the inhibition of fibril growth by reversi‐
ble trimers remains unanswered. Recent experiments by Hong et al. (2006) demon‐
strate that the inhibition of fibril growth due to oligomers may be a general phe‐
nomenon (88). In their study, they observed slowing of fibrillation of the insulin B‐
chain when increasing the concentration from 0.2 to 0.5 µM. At higher concentra‐
tions, no fibrillation was detected, and this anomalous behaviour was attributed to
the formation of oligomers with increasing concentration. In the case of the insulin
B‐chain, the oligomers preferentially form protofilaments instead of mature fibrils.
Devlin et al. (2006) studied insulin fibril growth and found that adding preformed
seeds of either insulin A‐chain or B‐chain both resulted in a reduced lag phase, but
also that the fibrils formed were morphologically different from the seeds (89). In a
separate experiment, self‐seeded insulin fibril growth was shown to be inhibited by
the soluble form of insulin A‐chain and B‐chain peptides, respectively. They were,
however, able to show that the inhibition was due to interaction between the A‐

37
chain and the B‐chain, respectively, with the soluble form of insulin, rather than
through interactions with the seed ends.

38
4. Fibrillation kinetics Fibrillation kinetics describes the rate of change of fibrillar species. Fibrillation
experiments performed in vitro are often characterized by a long lag phase, in which
apparently only minute amounts of fibrils are formed, followed by a sudden in‐
crease in fibril mass. Curiously, amyloid diseases are also characterized by a very
long incubation period—sometimes decades long—followed by a rapid develop‐
ment of disease phenotype (11). The disease phenotype is believed to be connected
to the accumulation of fibrils or fibril‐related species (10, 11, 90, 91). In this chapter,
the current understanding of this kind of kinetics is detailed with emphasis on re‐
cent experiments obtained during this Ph.D. work, which elucidates the kinetics
mechanism responsible for glucagon’s sigmoid reaction profile.
4.1 Nucleationdependent aggregation
In solution, a fibril can form by spontaneous nucleation from monomers. Once
formed, the nucleus elongates into a fibril by continuous addition of monomers.
Spontaneous fibril formation is sketched in Figure 25.
Monomers Nucleus Fibril
Figure 25. Spontaneous formation of fibrils. A fibril nucleus is in
equilibrium with monomers. Once formed, the nucleus gives rise to
the formation of a fibril.
Fibrillation kinetics are often characterized by a sigmoid reaction profile, in
which a long lag phase is followed by a phase of fast fibril mass accumulation. Dur‐
ing the lag phase, only minute amounts of fibrils are formed, hence the lag phase is
often used as a qualitative measure of the fibrillation propensity of a protein. The
physical interpretation of the lag phase is complex. In one view, a number of differ‐
ent oligomeric species are formed during the lag phase until finally a sufficient
number of nuclei have formed to initiate rapid fibril growth (92). In an opposite
view, the lag phase is due to the inherent ability of fibrils to produce new fibrils with

39
a rate proportional to the already formed fibril mass giving rise to exponential mass
growth (93, 94). These two views are summarized in Figure 26.
Time (h)
0 10 20 30 40
Inte
nsi
ty(a
.u.)
0
2000
4000
6000
8000a
Time (h)
0 10 20 30 40 50
Fibril growthfrom seeds
b
Exponential growthdue to a secondary
nucleationmechanism
Figure 26. Two opposing views on the typical fibrillation profile. (a)
The lag phase represents the nucleation phase and when a number
of nuclei have accumulated, a phase of rapid fibril elongation follows.
(b) The sigmoid reaction profile is due to a secondary nucleation
mechanism forming new fibril ends in proportion to the fibril mass
already present thus increasing fibril mass exponentially (93, 94).
Both figures show fibrillation of an 8 mg/mL solution of glucagon,
and in (b) an exponential of the form cbtatI += )exp()( was fitted to
the initial part of the curve, where the intensity was less than 35 per‐
cent of the maximum intensity.
4.2 Oligomeric species and protofibrils
During fibril formation, metastable intermediates are commonly observed. These
intermediates may be in the form of small oligomers or protofibrils (18, 90, 91, 95).
Generally, oligomers are considered small ensembles of monomers, which may or
may not be in equilibrium with monomers or other oligomeric species (18). When
examined by TEM, AFM, or light scattering, oligomers often appear small and
spherical when compared to protofibrils and fibrils. Protofibrils are defined from
their appearance when examined by TEM or AFM, where they often appear non‐
spherical elongated structures without a periodic substructure. Structural order
seems to increase from oligomers to protofibrils to fibrils (18). Protofibrils may
resemble rod‐like or worm‐like fibrils, and in this case a lower ThT fluorescence
signal or fiber diffraction is used to distinguish the two different structures (68).

40
Gosal et al. (2005) monitored the aggregation of β2‐microglobulin (β2M) by AFM
under different experimental conditions (ionic strength, pH, and protein concentra‐
tion), and found data suggesting the existence of two competing pathways (96). One
pathway is non‐nucleated and gives rise to oligomers and kinetically trapped proto‐
fibrils, while the other is nucleation‐dependent and leads to mature fibrils. In other
words, the β2M‐protofibrils do not mature into fibrils and neither are they on the
reaction pathway to fibrils. Instead, the aggregates and protofibrils are formed
through a mechanism very different from that of fibrils, namely downhill polymeri‐
zation, which does not require a nucleation step (93, 94, 97). In downhill polymeri‐
zation, the polymer is formed by addition of monomers through a series of succes‐
sive steps. Using electrospray ionization mass spectrometry, Smith et al. (2006)
showed that under conditions favouring β2M protofibril‐formation, oligomers of
sizes up to 11‐mers were found, while under conditions favouring mature fibrils,
only dimers to tetramers were detected (98). In general, oligomers and protofibrils
are most often considered to be off‐pathway, owing perhaps to experimental diffi‐
culty in obtaining quantitative data to make tight kinetic arguments, and most data
are inconsistent with the hypothesis that such species are on‐pathway (18). Two
recent studies using small‐angle X‐ray scattering (SAXS) and small‐angle neutron
scattering (SANS) have studied the size and shape of oligomeric species present at
early time‐points in protein solutions (99, 100). In the SAXS study by Vestergaard et
al. (2007), the early elongation events of insulin fibrils formed above the critical
concentration was studied in vitro. Three major components were identified:
monomers, mature fibrils, and a homogeneous population of oligomers composed of
five to six monomers. As the elongation rate was found to be proportional to the
concentration of oligomers, the authors proposed a dual role of the oligomers: as a
structural nucleus—the starting point of new fibrils—and as the smallest unit in
fibril elongation (99). Although the notion that mature fibrils elongate by addition of
oligomeric species is conceptually new and would need confirmation by different
methods, the experiments show the power of SAXS to detect and model oligomeric
species involved in fibrillation.
A special interest in prefibrillar or side‐product structures formed during the fib‐
rillation process is due to their possible connection to the onset of clinical symp‐
toms in amyloid and prion diseases (10, 11, 101). As several subtypes of neurode‐
genrative diseases have been identified, it has become apparent that the severity of
symptoms of the respective diseases is not linked quantitatively to the amount of
fibrillar deposits accumulated in neural tissue. Perhaps even more intriguing, some
41
amyloid and prion diseases do not show fibrillar aggregation, while at the other
extreme, amyloid plaques are found throughout the cortex of many cognitively
normal 70‐year‐olds (10). These findings suggest that the oligomers or protofibrils
observed in vitro are correlated to the disease progression rather than the mature
fibrils.
Two AFM studies of fibrillating glucagon solutions have been carried out by sepa‐
rate groups and both reported oligomeric species in samples at early time‐points
(54, 57). As time progresses, structural order increases as protofilaments and later
mature fibrils are formed, leading the authors of both studies to suggest a mecha‐
nism, in which protofilaments are formed from oligomers, and the mature fibrils are
subsequently formed by lateral assembly of protofilaments.
4.3 Secondary nucleation mechanisms
Spontaneous fibril growth is very often characterized by a long lag phase fol‐
lowed by fast formation of fibril mass. As explained in a detailed review by Ferrone
(1999), this behaviour cannot simply be explained by a nucleated growth mecha‐
nism, where the lag phase is ascribed the slow formation of a rare nuclei species,
from which the mature fibrils are subsequently formed by fast monomer addition to
the ends (94). Instead, two other reaction schemes within nucleation‐dependent
aggregation have been proposed to describe the origin of the lag phase (93). In the
first scheme, the nucleus is formed through a number of successive steps, and once
formed, the nucleus gives rise to mature fibrils through addition of monomers to the
seed ends. If the number of steps is sufficiently large, a prolonged lag phase is pre‐
dicted. Flyvbjerg et al. (1996) successfully modelled the assembly of microtubulin—
a process which involves a pronounced lag phase—by proposing a model involving
a nucleus of 15 heterodimers (102). A second scheme relies on fibril‐dependent
nucleation, in which the presence of fibrils increase the chance that new fibril ends
are formed in a manner proportional to the fibril mass present. This creates an ex‐
ponential growth in fibril mass (93, 94, 103). Fibril‐dependent fibril formation is
believed to occur through one of the following three mechanisms: surface‐
dependent fibril formation, fragmentation, and branching (94). These fibril‐
dependent nucleation mechanisms—usually referred to as secondary nucleation
mechanisms—are illustrated in Figure 27.

42
Surface-dependentnucleation
Fibril breakage Fibril branching
� � �
a b c
Figure 27. Three different secondary mechanisms are shown. (a)
Surface‐dependent nucleation denotes a process, in which nuclea‐
tion is enhanced at the surface of a fibril. After a while, the nucleus
dissociates and gives rise to a new fibril. (b) In fibril breakage, a fi‐
bril breaks due to stress or thermal fluctuations hereby exposing
two new fibril ends. (c) Fibril branching denotes a process, where a
new fibril protrudes from the side of an existing fibril. In all three
cases, the result is the formation of new fibril ends from existing fi‐
brils.
Common to secondary mechanisms is the generation of new fibril ends from ex‐
isting fibrils. In this way, the increase in fibril mass is proportional to the fibril mass
already formed and hence the kinetics become exponential (93, 94). So far, experi‐
mental evidence for these mechanisms has been scarce. Ruschak and Miranker
(2007) studied fibril‐dependent nucleation of residue 20 to 29 of IAPP in the pres‐
ence and absence of a CH2Cl2:aquous interface where primary and secondary nu‐
cleation, respectively, are the dominating nucleation processes (104). They found
that primary and secondary nucleation could be modeled by the same mechanism
and concluded that the secondary nucleation process need not be different from
spontaneous nucleation. Hence, the secondary nucleation involved in IAPP fibrilla‐
tion could be surface‐dependent nucleation (Figure 27a). In another experimental
work on insulin, Smith et al. (2006) determined the nanoscale properties of single
fibrils (105). They determined the breakage rate due to thermal fluctuations, and
found that fibril breakage (Figure 27b) could be the secondary mechanism account‐
ing for the sigmoid reaction profile found during insulin fibrillation (92). In the fol‐
lowing section, it is demonstrated that fibril branching (Figure 27c) accounts for the
sigmoid reaction profile of glucagon.

43
4.4 Glucagon fibril branching in surface layers
In the light of the overall picture just described, the remainder of this chapter
will discuss the implications of my own results own results on glucagon. TIRFM is a
specialized fluorescence microscopy technique that enables real‐time observations
of fibril growth in an approximately 150 nm thin layer close to the quartz surface
(106). The technique is detailed in Section 6.1. The TIRFM technique has been opti‐
mized for the study of amyloid fibril growth in the lab of Dr. Yuji Goto, which also
applied the technique to seeded reactions of Aβ(1‐40) and β2M (107‐109). The pri‐
mary observation in these experiments is that the amyloid fibrils grow exclusively
by addition of monomers to fibril ends. In a series of experiments, fibril growth of
seeded solutions of 0.25 mg/mL glucagon was monitored by collecting images of the
surface layer at fixed intervals. An example of such a real‐time movie is attached on
a cd‐rom (Supplementary Movie). Three close‐ups from the movie are shown in
Figure 28.
Figure 28. Three pictures showing glucagon fibril growth at times
specified on the figure. After 5 h, fibrils have grown up to 25 µm in
length, and new fibrils have formed by branching. After 17 h, a rela‐
tively dense spherulitic structure has formed. The bar represents 10
µm.
During the experiment, fibril grows radially from clusters of seeds, and most no‐
tably, new fibril ends are formed continuously by branching until and a large spher‐
ulitic structure with a diameter of 40–50 µm has formed. Rogers et al. (2006) stud‐
ied insulin spherulite formation by optical microscopy and found that over time the
density of the spherulites grew linearly or faster, indicating that the space fills as the
spherulites grow (110). This observation, they proposed, could be due to extensive
branching of insulin fibrils during growth. Our TIRFM observations of glucagon fi‐
brils forming dense spherulites support this proposal.

44
Figure 29. Branching detail from two separate experiments. (a) Two
fibrils grow from seeds in the center of the picture. At t = 3.3 h, a
branching event along the fibril is observed and in the following
hours, several such events are observed. (b) A fibril grows from a
seed in the left hand side of the picture. After 1 h, the fibril forms a
kink and in the following hours a fibril is formed close to the kink (t
= 2.5 h). Finally, a cascade of new fibrils is formed, and at t = 7.3 h,
fibrils branching off from fibrils formed by branching themselves are
observed. The bar represents 10 µm.
Figure 29 shows two examples of branching events from separate experiments.
In Figure 29a, two fibrils grow in opposite directions from a small cluster of seeds.
While this could be interpreted as bidirectional growth, it should be noted that the
optical resolution does not allow for a distinction between single seeds and clusters
of seeds. In fact, most often single fibril growth in only one direction was observed.
(data not shown). After 3.5 h, a new fibril is formed by branching and this process
repeats itself in the following hours resulting in several new fibrils. In one case, a
fibril grows along the parent fibril for a few micrometers before leaving at an angle.
In Figure 29b, a fibril is seen growing along the surface. At one point it forms a kink,
and in the following measurements several fibrils protrude close to the kink.
Branching did not occur close to growing fibril ends, and a single fibril were often
observed to branch into several new fibrils, showing that the observed phenomenon
is not untwisting of intertwined protofilaments.

45
Branching angle (deg)
0 10 20 30 40 50 60 70 80 90
Bra
nch
ing
even
ts
0
2
4
6
8
10
Figure 30. Distribution of branching angles measured with respect to
the direction of growth of the parent fibril. 65 branching events on a
single slide glass were measured. Branches most frequently form an
angle of 35–40 deg and branching opposite the direction of growth is
never observed.
In Figure 30, branching angles from a single experiment have been binned and
plotted in a histogram. Branching angles fall between 15–65 deg, and the distribu‐
tion is approximately symmetric with a maximum at 35–40 deg. Even more signifi‐
cantly, branching events were exclusively in the direction of growth. However, in a
number of cases, the newly formed fibril grew along the parent fibril for several
micrometers before leaving at an angle. These zero‐angle events have not been in‐
cluded in the branching angle histogram.
One interpretation is that glucagon fibrils are polar structures with growth in
only one direction. If branches develop from surface‐dependent nucleation on a
polar surface, a particular direction of branching could be preferred. Goldsbury et al.
(1999) and Blackley et al. (2000) have reported bidirectional fibril growth using
time‐lapse Atomic Force Microscopy (AFM) studies (55, 111). However, Goldsbury
et al. (1999) reported that higher‐order Islet Amyloid Polypeptide (IAPP) fibrils
often appeared blocked at one end (55). Glucagon fibrils formed under the condi‐
tions used in this study are also higher‐order, composed of two or several proto‐
filaments with a repetitive twist (19). Another possibility is that branches grow
from defects that are created during the growth process, and therefore have a pref‐
erential angle relative to the direction of growth. The observation that branches

46
often protrude close to kinks (Figure 29) seems to support this possibility, although
surface‐dependent nucleation on a polar fibril might also be enhanced at kinks. De‐
fects might form during growth by untwining of single protofilaments from the main
bundle, which then continues to grow. Later, the dangling protofilaments matures to
a growing fibril. A number of groups have reported fibrils splitting into protofila‐
ments during growth without increasing the net number of protofilaments (52‐55,
57). Most studies are static measurements on fibrillated samples, but Goldsbury et
al. (1999) described the same phenomenon using time‐lapse AFM (55). Their data
show an example of a protofilament growing out of a thicker fibril, which then con‐
tinues growth in a different direction (Figure 3b of reference (55)). In order for an
untwining mechanism to support continuous branching as shown in Figure 28 and
Figure 29, the untwined protofilament must be replaced in the growing bundle, or
the fibril would run out of protofilaments to untwine. A similar mechanism should
exist to inflate the dangling protofilament to a full‐size fibril, capable of forming new
branches itself.
Time (h)
0 2 4 6 8 10 12 14 16
Fibr
ille
ngt
h(
m)
�
0
5
10
15
20
25
30
Fibril 1Fibril 2Fibril 3Fibril 4Fibril 5Fibril 6
Figure 31. Length in µm of six individual fibrils from a single real‐
time measurement. Fibrils exhibited stop‐and‐run behaviour charac‐
terized by intervals where no growth occur followed by continued
growth.
Six individual fibrils, which grew from the seeds added initially, were identified
and their length measured. In Figure 31, the length of each fibril is plotted as a func‐
tion of time. The final length of the fibrils ranged from 10 to 28 µm. Occasionally, the
fibrils showed stop‐and‐run behavior, where a fibril after hours of continuous

47
growth stops growing for a while and then resumes growth. Also, two of the six fi‐
brils stopped growing after less than four hours although fibrils in their vicinity
kept growing for several hours (fibril 1 and 6 in Figure 31). While this could be due
to a local depletion of monomers, the stop‐and‐run behavior could also be due to
monomers misaligned at the fibril end. If this is the case, fibril growth would resume
after the monomer had either aligned properly to the fibril backbone or dissociated
from the fibril end. We also note that of the six fibrils, whose lengths were plotted in
Figure 31, only two continue growth throughout the experiment (fibril 2 and 4). The
others stop growing after 3.7–9.7 h. This could indicate that the fibril end of these
fibrils have been terminated due to a misaligned monomer or perhaps due to mor‐
phology‐dependent binding of a reversible glucagon trimer as proposed in Section
3.2.
4.5 TEM pictures of branching glucagon fibrils
Examination of fibrillated samples by TEM showed several examples of branched
fibrils. As TEM sample preparation involves pipetting to a carbon‐coated grid, stain‐
ing, and drying of the sample, care should be taken when interpreting the results.
Despite these reservations, we were able to identify a number of cases, where a sin‐
gle fibril branched into two or several fibrils. Four examples are shown in Figure 32.
The fact that a single fibril was observed to branch into several fibrils, makes it less
likely to be an artefact from sample preparation (Figure 32a). In some cases, the
fibril split into two separate fibrils, which continued growth side by side (Figure
32d). While this could be due to the sample preparation, it could also be examples of
the events observed by TIRFM, where newly formed fibrils grow along the parent
fibril for several micrometers.

48
Figure 32. TEM pictures of branching fibrils. Most often, the fibril
split into two fibrils (b‐d), but in a some cases several fibrils
branched off from the parent fibril (a). In (d), the fibril branches
splits into two fibrils with a branching angle close to zero degrees.
Scale bar represents 100 nm.
4.6 Kinetics in bulk solution
Light scattering measures fibrillation kinetics in solution and offers an opportu‐
nity to test if the branching observed by TIRFM on quartz surfaces also occurs in
bulk solution. A small‐angle light scattering (SALS) setup was designed specifically
for studying the growth of large micrometer structures, in this case fibrils. The
large‐angle light scattering (LALS) setup measures the scattered intensity at q = 23
µm‐1 and is hence more sensitive to the growth of fibrillar species of smaller size.
Experiments were performed on both light scattering setups simultaneously with
aliquots from the same sample preparation. Generally, the light scattering signal
from a solution increases, when the components aggregate to form larger structures
such as fibrils. The light scattered at small angles from a solution containing various
fibrillar species mainly comes from large structures, while smaller fibrillar species
contribute relatively more at large angles. The scattered intensity is used as a quali‐
tative measure for the growth in fibril mass, although it should be noted that the
two are not directly proportional. For example, fibrils bundling together forming
large structures can give rise to an increase in the scattered intensity, in particular
at small angles, without an increase in fibril mass.

49
Time (h)
0 5 10 15 20
Inte
nsi
ty(a
.u.)
0
0.4
0.6
0.8
1
Time (h)
0 2 4 6 8 10
0.1 mg/mL1 mg/mL
a b
Figure 33. (a) Seeded glucagon kinetics monitored by SALS at q =
0.84 µm‐1 (1.8 deg). The reaction profiles are characterized by a long
lag phase. Increasing the seed concentration ten‐fold decreases the
lag time from approximately 10 to 5 h. (b) Seeded glucagon kinetics
monitored by LALS at q = 23 µm‐1 (90 deg). After a long lag phase,
the intensity increases irregularly as large particles diffuse through
the small scattering volume.
Figure 33a shows the scattered intensity at q = 0.84 µm‐1 (1.8 deg) from 0.25
mg/mL glucagon solutions seeded with 0.1 and 1 µg/mL seeds as a function of time.
At a seed concentration of 0.1 µg/mL, the beginning of the reaction profile is domi‐
nated by a long lag phase. After approximately 10 h, the scattered intensity in‐
creases abruptly and reaches a plateau at the end of the experiment. Increasing the
seed concentration to 1 µg/mL conserves the general reaction profile. The initial
scattered intensity is higher suggesting that the signal at early times is mainly due
to the seeds. The lag phase is reduced to approximately 5 h.
The scattered intensity at q = 23 µm‐1 from seeded solutions of glucagon is plot‐
ted in Figure 33b. After some hours with a relatively moderate increase in scattered
intensity, the scattered intensity increases abruptly and fluctuates as large particles
diffuse through the small scattering volume. This occurs after approximately 9 and 5
hours for seed concentrations of 0.1 and 1 µg/mL, respectively.
The prolonged lag phase followed by an explosive increase in fibril mass, as de‐
tected by SALS and LALS in Figure 33, is the hallmark of a secondary process. The
light scattering data hence suggests that the secondary process observed at the
quartz surface layer also takes place in solution.
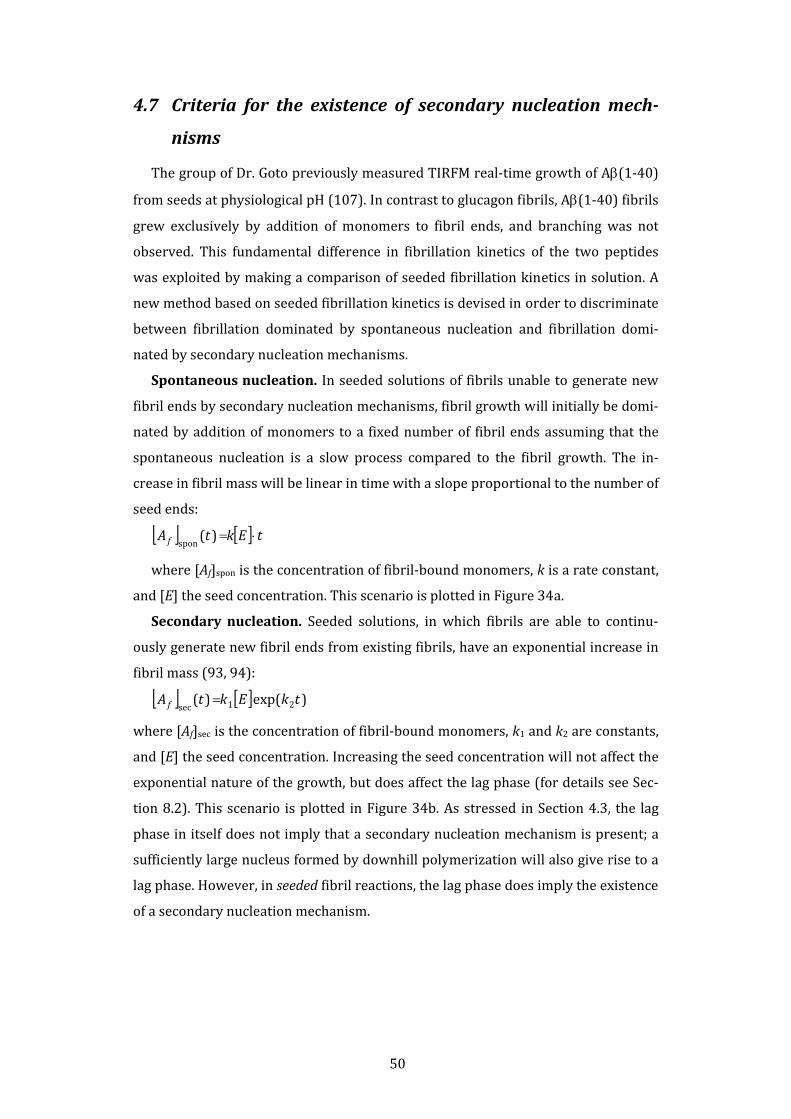
50
4.7 Criteria for the existence of secondary nucleation mech
nisms
The group of Dr. Goto previously measured TIRFM real‐time growth of Aβ(1‐40)
from seeds at physiological pH (107). In contrast to glucagon fibrils, Aβ(1‐40) fibrils
grew exclusively by addition of monomers to fibril ends, and branching was not
observed. This fundamental difference in fibrillation kinetics of the two peptides
was exploited by making a comparison of seeded fibrillation kinetics in solution. A
new method based on seeded fibrillation kinetics is devised in order to discriminate
between fibrillation dominated by spontaneous nucleation and fibrillation domi‐
nated by secondary nucleation mechanisms.
Spontaneous nucleation. In seeded solutions of fibrils unable to generate new
fibril ends by secondary nucleation mechanisms, fibril growth will initially be domi‐
nated by addition of monomers to a fixed number of fibril ends assuming that the
spontaneous nucleation is a slow process compared to the fibril growth. The in‐
crease in fibril mass will be linear in time with a slope proportional to the number of
seed ends:
[ ] [ ] tEktAf ⋅=)(spon
where [Af]spon is the concentration of fibril‐bound monomers, k is a rate constant,
and [E] the seed concentration. This scenario is plotted in Figure 34a.
Secondary nucleation. Seeded solutions, in which fibrils are able to continu‐
ously generate new fibril ends from existing fibrils, have an exponential increase in
fibril mass (93, 94):
[ ] [ ] )exp()( 21sectkEktAf =
where [Af]sec is the concentration of fibril‐bound monomers, k1 and k2 are constants,
and [E] the seed concentration. Increasing the seed concentration will not affect the
exponential nature of the growth, but does affect the lag phase (for details see Sec‐
tion 8.2). This scenario is plotted in Figure 34b. As stressed in Section 4.3, the lag
phase in itself does not imply that a secondary nucleation mechanism is present; a
sufficiently large nucleus formed by downhill polymerization will also give rise to a
lag phase. However, in seeded fibril reactions, the lag phase does imply the existence
of a secondary nucleation mechanism.

51
Time (a.u.)
Fibr
ilm
ass
(a.u
.)
Secondary nucleationabsent
Secondary nucleationpresent
High seed Low seed
a b
High seed
Low seed
000
Time (a.u.)
Figure 34. The effect of seeding fibril processes on the initial part of
the fibrillation curve. (a) Seeding a kinetic process, which forms new
fibril ends by spontaneous nucleation only, changes the growth rate.
Increasing the seed concentration, increases the growth rate. (b)
Seeding a kinetic process dominated by a secondary nucleation
mechanism shortens the lag phase, but does not change the expo‐
nential nature of the growth (right panel).
The kinetics of seeded glucagon solutions were shown for two different seed con‐
centrations in Figure 33a. In both cases, the kinetics were dominated by a long lag
phase characteristic of exponential reactions followed by a rapid increase in fibril
mass. We performed the same light scattering experiments on seeded solutions of
Aβ(1‐40) reproducing the experimental conditions from the original TIRFM ex‐
periments (107). The data are shown in Figure 35. The 0.5 µg/mL seed concentra‐
tion corresponds to the original seed concentration, and once again we compare
against a ten times higher seed concentration to examine the effect of changing the
seed concentration. The growth as measured by SALS and LALS was linear, and in‐
creasing the seed concentration increased the slope.
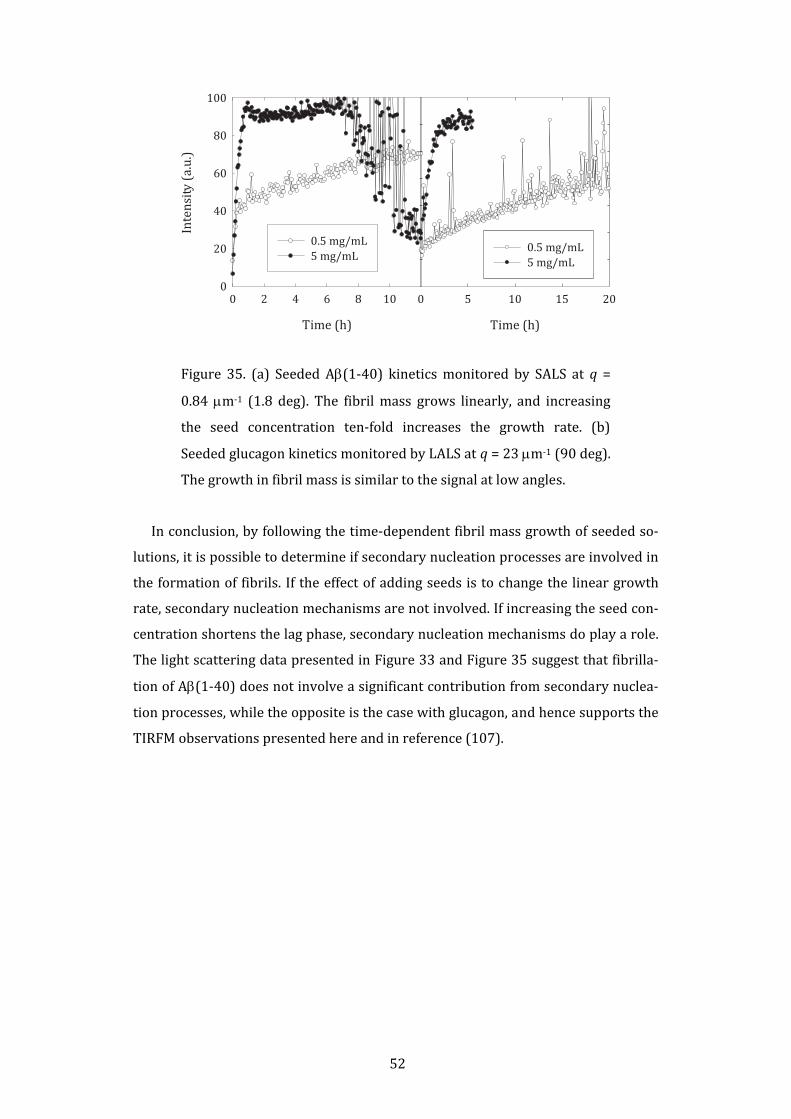
52
Time (h)
0 2 4 6 8 10
Inte
nsi
ty(a
.u.)
0
20
40
60
80
100
0.5 mg/mL5 mg/mL
Time (h)
0 5 10 15 20
0.5 mg/mL5 mg/mL
Figure 35. (a) Seeded Aβ(1‐40) kinetics monitored by SALS at q =
0.84 µm‐1 (1.8 deg). The fibril mass grows linearly, and increasing
the seed concentration ten‐fold increases the growth rate. (b)
Seeded glucagon kinetics monitored by LALS at q = 23 µm‐1 (90 deg).
The growth in fibril mass is similar to the signal at low angles.
In conclusion, by following the time‐dependent fibril mass growth of seeded so‐
lutions, it is possible to determine if secondary nucleation processes are involved in
the formation of fibrils. If the effect of adding seeds is to change the linear growth
rate, secondary nucleation mechanisms are not involved. If increasing the seed con‐
centration shortens the lag phase, secondary nucleation mechanisms do play a role.
The light scattering data presented in Figure 33 and Figure 35 suggest that fibrilla‐
tion of Aβ(1‐40) does not involve a significant contribution from secondary nuclea‐
tion processes, while the opposite is the case with glucagon, and hence supports the
TIRFM observations presented here and in reference (107).

53

54
5. Prion diseases A group of lethal amyloid diseases are characterized by their ability to transmit
between individuals. These are the so‐called prion diseases. Prion diseases include
bovine spongiform encephalopathy (BSE) in cattle, scrapie in sheep, and
Creutzfeldt‐Jakob’s disease (CJD) in humans. In the mid‐80's, certain European
countries approved a new procedure to process carcasses for feed and as a conse‐
quence, a new strain of the hitherto rare prion disease BSE spread through cattle.
Most notably in the UK where two million cattle became infected with the disease.
Later it became clear that CJD—the human analogue of BSE—could be induced in
humans, who had consumed prion‐infected meat. So far, around 200 people have
been diagnosed with this new variant CJD (vCJD) (11). Like other amyloid diseases,
prion diseases have very long incubation periods followed by rapid progression of
the disease phenotype. The BSE example illustrates two important properties of
prions: they transmit within a species with relative ease, and sometimes they even
cross the barrier between species.
Prion diseases are all related to a prion protein (PrP), a naturally occurring
highly conserved glycoprotein, which in its soluble cellular form, PrPc, is completely
harmless to the cell. For long, it was widely accepted that PrPc can be converted into
a fibrillar form mediated by a PrPc isoform denoted PrPSc, and it was hypothesised
that the PrPc and PrPSc isoforms differ only in the monomer conformation and ag‐
gregation state (112). However, recently, this hypothesis has been challenged, and it
is now believed that the infectious entity is the ends of a small fibrillar form of PrPc
(11). However, very little is known about the structure of the infectious particle
(101).
Probably the most interesting aspects of prion diseases are how a proteinaceous
infectious entity encodes a strain with a specific disease phenotype, while it at the
same time remains adequately unspecific in order for it to cross the species barrier
by accepting foreign prion primary sequences. As it turns out, the encoding of strain
properties is closely related to the structural properties of the fibrils, and the ability
to cross between species is related to templated fibril growth detailed in Section 3.1.
These properties are further detailed in Section 5.1 and 5.2 with emphasis on the
analogy to the glucagon results presented in this thesis. Furthermore, the impor‐
tance of secondary nucleation mechanisms on the strain phenotype and stability is
detailed in Section 5.3.

55
5.1 Strain encoding
Fraser et al. (1973) isolated multiple strains of scrapie and propagated the
strains in lines of inbred mice with identical PrP gene (113). The strains differed in
terms of incubation period and neuropathology and remained stable when propa‐
gated. As the prion proteins in the experiment were identical, the strain properties
must be encoded in the structure of the pathogenic fibrils rather than the primary
structure. The fact that biologically different strains do indeed have different bio‐
physical properties have since been shown for various prion proteins including hu‐
man PrPsc (114) and the yeast prion protein Sup35 (51). In both these studies, it
was shown that the backbone region was structurally different for each strain, thus
the connection between strain and fibril morphology was established. The fact that
a proteinaceous entity is responsible for a variety of strains—and hence morpholo‐
gies—makes it less likely that a single misfolded protein encodes such diverse in‐
formation. Instead, it seems more likely that a small seed‐like particle encodes the
hydrogen bond pattern necessary for accepting prion monomers. This was demon‐
strated in a study by Silveira et al. (2005), in which the infectivity was examined on
partly disaggregated PrP fibril samples fractionated by size and characterized by
light scattering (101). Oligomers of less than six PrP peptides were substantially
inactive, and instead non‐fibrillar particles equivalent to 14‐28 PrP molecules were
the most efficient pathogenic species.
The glucagon seeding experiment detailed in Section 3.1 demonstrates that a
straight morphology seed is able to imprint its own morphology under conditions
which normally favours a different morphology. This is analogous to the concept of
strains. In accordance with the results by Fraser et al. (1973), the two glucagon
"strains" differed in terms of structure as well as kinetics.
5.2 Transmissibility
Another question that has been puzzling scientists for many years is the question
as to how a prion disease crosses the species barrier. Essentially, crossing the spe‐
cies barrier refers to the ability of a prion strain to accept PrP with a different pri‐
mary structure. For example, in experimental settings, the new strain responsible
for the cattle BSE epidemic readily transmits to a range of species with different PrP
primary structure. Remarkably, when transmitted back into cattle, the biological
characteristics of the strain have been conserved (11). The situation is sketched in
Figure 36.

56
PrPBo
PrPmu
PrPBo
Figure 36. The BSE strain responsible for the new variant CJD in hu‐
mans, vCJD, readily crosses species barriers, but maintains its bio‐
logical characteristics upon passage through an intermediate species
with a different PrP primary structure (here murine PrP). Adapted
from reference (11).
A striking example of strain transmission came from studies of transmission of
human prion diseases (115). The study focused on transmission of the classical CJD
prion strain and the new vCJD prion strain. The two strains, which have identical
primary structure, were propagated in wild type mice expressing murine PrP and
transgenic mice expressing human PrP only. The classical CJD failed to transmit to
wild type mice, but readily transmitted to humanized mice expressing human PrP.
In contrast, vCJD, despite having a PrP primary structure identical to the PrP ex‐
pressed in humanized mice, only transmitted efficiently to wild type mice. The study
concluded that the prion strain type—not the primary structure—has the greatest
impact on the transmission efficiency. The experiment, which suggests that the spe‐
cies barrier is actually better described as a transmission barrier, is summarized in
Figure 37.
CJD
CJD
vCJD
vCJD
PrPmu PrPmu
PrPhuPrPhu
Figure 37. Species barrier vs. transmission barrier. Classical CJD
strains do not transmit to wild type mice (black), but easily transmit
to humanized mice expressing human PrP (blue). BSE‐derived vCJD
prions, despite having a primary sequence identical to the classical
CJD, easily transmit to mice expressing murine PrP, but inefficiently
transmit to humanized mice.
Two possible explanations to the observations in Figure 36 and Figure 37 have
been proposed: (i) under certain conditions, a strain is composed of an ensemble of
structurally distinct morphologies each with its own infectious entity PrPSc, or (ii)

57
the infectious entity of a certain strain is able to adopt a plethora of PrP primary
sequences. The first explanation is analogues to the perhaps most striking observa‐
tion of in vitro experiments; the observation that fibrils are composed of a large
number of different morphologies some more predominant than others. If this sce‐
nario is also occurring in vivo, a strain should perhaps be visualized as a population
of morphologies with the most frequent occurring being responsible for the biologi‐
cal phenotype. The role of the other morphologies could be manifested when the
strain is introduced into a new host, in which case the morphology able to propa‐
gate in the new host will become the most dominant. The second explanation as‐
sumes that the infectious entity of certain strains is able to accept a wide diversity of
monomer configurations, while other strains are more specific toward the mono‐
mer configuration. The strains capable of crossing species barriers may hence have
an infectious unit with a hydrogen pattern capable of accepting protein backbones
without being too restrictive with respect to the primary sequence. This situation is
analogous to the cross‐seeding experiments performed by Yagi et al. (2005), in
which seeds of α‐synuclein were capable of accepting a variety of proteins (see Sec‐
tion 3.1 for details) (81).
5.3 Strain stability
Amyloid diseases including prion diseases are characterized by a very long and
precisely reproducible incubation period often extending several years without
clinical symptoms (10). Once the first clinical symptoms arise, the disease pheno‐
type progresses rapidly (11). The in vivo behaviour thus resembles the in vitro ob‐
servations of amyloid fibril growth, with one important distinction: in vivo, the fibril
mass is continuously diluted as cells divide and degrade misfolded proteins. This
behaviour is most pronounced in yeast prions, which divide rapidly. Two yeast
prion proteins, Ure2p and Sup35, have been identified, and they share no sequence
similarity to PrP. The use of these proteins as model systems for PrP has led to rapid
advances in the field of prion diseases.
Exponential growth has been proposed to play an important role in prion dis‐
eases (116). If cells divide exponentially, as is certainly the case of yeast prions, the
fibril mass has to grow exponentially as well in order keep up with the dilution ef‐
fect. A strain failing to do so will inevitably be terminated (11, 23, 116). Tanaka et al.
(2006) studied physical properties of three different Sup35 prion strains and were
able to show that the strain with the strongest phenotype and highest stability, i.e.,
highest numbers of fibers per cell, surprisingly had the slowest growth rate of the

58
three. However, this was amply compensated for by a marked increase in fragmen‐
tation rate (117). We suggest that some strains may also take advantage of branch‐
ing as a mechanism to rapidly generate new fibril ends and note that branched fi‐
brils are probably more likely to undergo breakage due to stress than nonbranching
fibrils.

59

60
6. Specialized techniques Glucagon fibrillation was studied by a number of biophysical techniques. These
include standard techniques (CD, fluorescence spectroscopy, TEM, etc.) as well as
more specialized techniques. In this chapter, the specialized techniques are de‐
scribed in more detail in terms of the general layout of the setup as well as the ap‐
plicability to fibril samples.
6.1 Total internal reflection fluorescence microscopy
TIRFM is based on standard fluorescence microscopy, the main difference being
the penetration depth of the excitation light. In TIRFM, only a very thin surface layer
is excited by the laser. The setup is sketched in Figure 38.
Figure 38. TIRFM setup. A drop of sample solution (S) is placed be‐
tween a slide glass (GS) and a cover glass (C). A prism (P) lies on top
of the glass slide with a thin layer of glycerol (GL) between the two.
The laser beam passes through a focusing lens (L) and is incident on
the surface of the slide glass at an angle close to the critical angle. In
this way, a thin layer of the sample solution is illuminated. The light
emitted by fluorescence is collected by the microscope objective
(MO). A drop of oil is placed between the cover glass and the objec‐
tive in order to match the index of refraction. Reprinted from refer‐
ence (118).
Excitation of a very thin layer close to the surface of the slide glass is achieved
through total internal reflection. The principle behind this physical phenomenon is
described in the following. A laser beam perpendicular to a glass surface will be
almost completely transmitted through the glass. As the angle, θ, between the laser

61
beam and the glass surface is decreased toward zero degrees, a fraction of the inci‐
dent light will be reflected. This fraction is in general low compared to the fraction
of light transmitted. However, at the critical angle θc, a large fraction of the incident
light is reflected on behalf of the fraction transmitted. This phenomenon is known as
total internal reflection. The exact position of the critical angle depends on the
wavelength of the incident light, λ, and the refractive index of the two media, n1 and
n2 (118).
Figure 39. The relative intensity of the evanescent wave as a function
of the incident angle, θ. At the critical angle, θc, the intensity is sev‐
eral times higher than the intensity of the incoming laser field. In this
plot the refractive indices of fused silica (n1 = 1.46) and water (n2 =
1.33) were used together with an Argon wavelength of 532 nm. Re‐
printed from reference (118)
As it turns out, at the critical angle an evanescent electromagnetic field with the
same wavelength as the incident light is generated close to the surface as shown in
Figure 39. The intensity of this field is several times higher than the intensity of the
incoming laser field and decays exponentially with a penetration depth d = 1/e
given by the expression
22
221 sin4 nn
d−
=θπ
λ
where λ is the wavelength of the incident light in vacuum, and n1 and n2 are the
refractive indices of the media. In the case where medium 1 is fused silica (n1 =
1.46), medium 2 is water (n2 = 1.33), and the Ar laser has a wavelength of

62
nm 455Ar =λ , a penetration depth of 150 nm is obtained (106). Molecules outside
this thin volume will not be excited and for this reason the TIRFM technique can be
used to study the growth of individual fibrils. The TIRFM technique was first applied
to fibril samples by the group of Dr. Goto in 2004 (107).
As fibrillation kinetics very often involve a long lag phase, where only small
amounts of fibril mass is formed, preformed seeds are added to the sample solution.
The seeds typically bundle together in clusters (107, 108). Radial fibril growth is
observed from these clusters by collecting data at fixed time intervals. The tech‐
nique relies on the fluorescence from a fibril specific dye, in this case ThT. The laser
wavelength is chosen so as to match the excitation wavelength of the fluorescent
dye.
TIRFM is currently one of just two techniques able to monitor growth of single‐
fibrils in real‐time. The other technique is time‐lapse AFM (55). In theory, both tech‐
niques are able to visualize secondary nucleation mechanisms (fibril breakage,
branching and surface‐dependent nucleation). Time‐lapse AFM has the great advan‐
tage of directly visualizing the organization of the individual protofilaments, allow‐
ing for a classification of the individual morphologies and their respective growth
rates. However, the interaction with the mica could influence the growth signifi‐
cantly. Goldsbury et al. (1999) studied IAPP with time‐lapse AFM and were able to
show dichotomous branching and measure growth rates (55). They reported, how‐
ever, that fibrils on the mica consisted of just one protofilament whereas the fibrils
from the bulk solution consisted predominantly of higher‐order fibrils. The growth
rates they reported (approximately 1 nm/min), are very low compared to the grow‐
th rates of Aβ(1‐40) (approximately 300 nm/min) and glucagon (approximately 140
nm/min), indicating that mica not only favours simple morphologies but also re‐
duces fibril growth in general. TIRFM, on the other hand, does not give any detailed
structural information, but the quartz surface apparently does not affect fibril grow‐
th, and is very versatile allowing for a number of different coatings, which enables
studying the impact of surfaces on fibril growth (108).
6.2 Fiber diffraction
Fibrils can be aligned along the fibril axis to form fibers. A fiber is hence a mac‐
roscopic assembly of fibrils, essentially a one‐dimensional crystal, which when ex‐
posed to X‐rays gives structural information about the molecular organization
within the fibril (67). Fibers are often formed by letting a drop of fibrillated sample
solution dry between the wax‐sealed ends of two end‐to‐end capillaries (68, 119). If
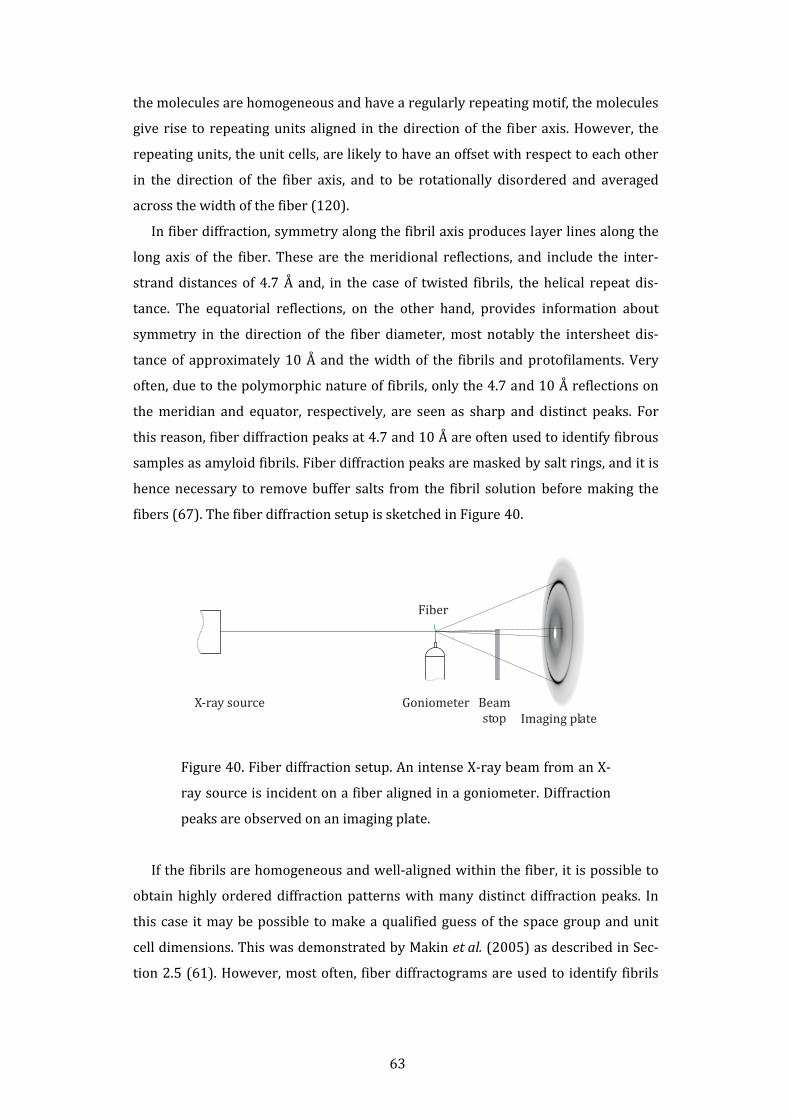
63
the molecules are homogeneous and have a regularly repeating motif, the molecules
give rise to repeating units aligned in the direction of the fiber axis. However, the
repeating units, the unit cells, are likely to have an offset with respect to each other
in the direction of the fiber axis, and to be rotationally disordered and averaged
across the width of the fiber (120).
In fiber diffraction, symmetry along the fibril axis produces layer lines along the
long axis of the fiber. These are the meridional reflections, and include the inter‐
strand distances of 4.7 Å and, in the case of twisted fibrils, the helical repeat dis‐
tance. The equatorial reflections, on the other hand, provides information about
symmetry in the direction of the fiber diameter, most notably the intersheet dis‐
tance of approximately 10 Å and the width of the fibrils and protofilaments. Very
often, due to the polymorphic nature of fibrils, only the 4.7 and 10 Å reflections on
the meridian and equator, respectively, are seen as sharp and distinct peaks. For
this reason, fiber diffraction peaks at 4.7 and 10 Å are often used to identify fibrous
samples as amyloid fibrils. Fiber diffraction peaks are masked by salt rings, and it is
hence necessary to remove buffer salts from the fibril solution before making the
fibers (67). The fiber diffraction setup is sketched in Figure 40.
Goniometer Beamstop
Fiber
X-ray sourceImaging plate
Figure 40. Fiber diffraction setup. An intense X‐ray beam from an X‐
ray source is incident on a fiber aligned in a goniometer. Diffraction
peaks are observed on an imaging plate.
If the fibrils are homogeneous and well‐aligned within the fiber, it is possible to
obtain highly ordered diffraction patterns with many distinct diffraction peaks. In
this case it may be possible to make a qualified guess of the space group and unit
cell dimensions. This was demonstrated by Makin et al. (2005) as described in Sec‐
tion 2.5 (61). However, most often, fiber diffractograms are used to identify fibrils

64
and to examine if samples formed under different conditions give rise to different
morphologies.
6.3 Smallangle light scattering
SALS is a useful technique for studying physical and chemical systems, which are
inhomogeneous on length scales of the order of the wavelength of light or larger.
Examples of its application include gel formation (121), polymerization processes,
and fibrillation (22, 97, 122). In this Ph.D. project, SALS has been applied to study
the formation of glucagon and Aβ(1‐40) spherulites. Interestingly, SALS data sug‐
gest that glucagon also forms physical gels after the initial spherulite formation
through cross‐linking of fibrils from neighbouring spherulites (unpublished results).
The SALS setup is sketched below.
HeNe
Filter Samplecell
Mirror
Photo diode Photo diode
Beamstop
CCDLensLens
Figure 41. SALS setup. The 632.8 nm HeNe beam passes through an
adjustable filter, the sample cell, and a lens before being stopped by
the beam stop. Photo diodes before and after the sample cell are
used for normalizing the intensity. The first lens on the light path
images the scattered light from the sample cell onto the CCD, while
the second lens images the beam stop onto the CCD.
The light scattered out of an incoming laser beam is due to the presence of local
fluctuations in the dielectric constant of the medium. Letting ),0(),( tt δεδε r denote
the spatial correlation function of the fluctuations in the dielectric constant at time t
and position r, the intensity distribution of the scattered light is given by (123):
( ) ( )∫ ⋅∝ rrqrq dexp),0(),( ittI δεδε
where q is the scattering vector given by the difference between the scattered
wave‐vector k and the incident wave‐vector k0, q = k – k0. The magnitude of q is
given by:

65
⎟⎠
⎞⎜⎝
⎛=2
sin4 θλπn
q
where λ is the laser wavelength, n is the index of refraction, and θ is the scatter‐
ing angle (the angle between k and k0). It can be shown that for small angles, where
θθ ≈)sin( , the length scale Λ of the system is given by θλ /≈Λ (123). The angular
ranges accessible on a typical SALS are typically 0.1–10 deg, thus length scales from
a few µm up to hundreds of µm can be probed. In contrast to scattering at large an‐
gles, the scattering signal at small angles is not directly proportional to the particle
mass, as the particle shape is reflected in the form factors at small angles. It is, how‐
ever, possible to use it as a qualitative measure of particle mass.

66
7. Conclusion This thesis has focused on the experimental results elucidating glucagon fibril
polymorphism and glucagon fibrillation kinetics. When dissolved in glycine/HCl pH
2.5 buffer, glucagon forms polymorphic fibrils and two of these morphologies—
denoted twisted and straight due to their appearance when viewed under an elec‐
tron microscope—depend strongly on the peptide concentration with twisted fibrils
formed at 0.25 mg/mL and straight fibrils formed at 8 mg/mL. The work presented
in this thesis show that these two morphologies are most likely due to structural
differences at the protofilament level, a phenomenon confirmed in recent years to
be a characteristic of prion strains as well.
Intriguingly, the twisted morphology fibrils are unable to sustain growth when
cross‐seeded at 8 mg/mL glucagon, which normally favors the straight morphology.
By studying the self‐association of glucagon, it was shown that the inhibition of
twisted fibrils—as manifested through a peculiar maximum at 1 mg/mL in the con‐
centration‐lag phase plot—correlates with the formation of reversible glucagon
trimers. Hence, we conclude that the selection of morphologies arises from the abil‐
ity of glucagon trimers to specifically inhibit the straight morphology fibrils.
In a set of real‐time observations of single‐fibril growth on quartz surface layers,
glucagon fibrils were monitored for up to 20 hours. The main observation is that
glucagon fibrils grow from clusters of seeds into dense spherulitic structures by
continuously forming new fibrils by branching. This fibril‐dependent formation of
new fibril ends is the structural basis for the sigmoid reaction profile first reported
for glucagon nearly 40 years ago (124). In TEM of fibrillated samples, we were able
to retrieve examples of branching fibrils. Under physiological conditions, seeded
solutions of Aβ(1‐40) have been shown to grow solely by addition of monomers
(107). We exploited this basic difference in growth mechanisms between Aβ(1‐40)
and glucagon to devise a new light scattering method to separate spontaneous nu‐
cleation from secondary nucleation. The method is based on seeded reactions: if
fibrils grow by addition of monomers to the seed ends alone, fibril mass increases
linearly, and increasing the seed concentration increases the slope of fibril mass
formation. If, on the other hand, fibrils formed from seeds are also capable of form‐
ing new fibrils by a secondary mechanism, increasing the seed concentration will
decrease the lag phase.
Consensus in the field for the past 50 years has established that fibrils are non‐
branched structures (3), and most structural studies have since then confirmed this

67
view. As the sigmoid reaction profile—a hallmark of secondary processes—is com‐
mon to studies of fibril kinetics, we would not be surprised if branching turns out to
be a widespread feature of amyloid fibril formation.
The thesis also highlights the parallelism of glucagon fibrillation with findings in
prion diseases, and hence demonstrates the reason why peptides not directly re‐
lated to amyloid diseases are conveniently used as model systems of fibrillation.

68
8. Papers
8.1 Glucagon amyloidlike fibril morphology is selected via
morphologydependent growth inhibition
8.2 Branching in amyloid fibril growth

69
70
9. References 1. Dobson, C. M. (1999) Protein misfolding, evolution and disease Trends in Biochemi
cal Sciences 24, 329‐332.
2. Kyle, R. A. (2001) Amyloidosis: A convoluted story British Journal of Haematology 114, 529‐538.
3. Cohen, A. S. & Calkins, E. (1959) Electron Microscopic Observations on A Fibrous Component in Amyloid of Diverse Origins Nature 183, 1202‐1203.
4. Otzen, D. & Nielsen, P. (2008) We find them here, we find them there: Functional bacterial amyloid Cellular and Molecular Life Sciences (CMLS) (Published online ahead of print).
5. Claverie, J. M. (2005) Fewer Genes, More Noncoding RNA Science 309, 1529‐1530.
6. Thomas, P. J., Qu, B. H., & Pedersen, P. L. (1995) Defective Protein‐Folding As A Basis of Human‐Disease Trends in Biochemical Sciences 20, 456‐459.
7. Uversky, V. N. & Fink, A. L. (2004) Conformational constraints for amyloid fibrilla‐tion: the importance of being unfolded Biochimica et Biophysica ActaProteins and Proteomics 1698, 131‐153.
8. Monsellier, E. & Chiti, F. (2007) Prevention of amyloid‐like aggregation as a driving force of protein evolution Embo Reports 8, 737‐742.
9. Dobson, C. M. (2002) Protein‐misfolding diseases: Getting out of shape Nature 418, 729‐730.
10. Lansbury, P. T. & Lashuel, H. A. (2006) A century‐old debate on protein aggregation and neurodegeneration enters the clinic Nature 443, 774‐779.
11. Collinge, J. & Clarke, A. R. (2007) A general model of prion strains and their patho‐genicity Science 318, 930‐936.
12. Drucker, D. J. (2005) Biologic actions and therapeutic potential of the proglucagon‐derived peptides Nature Clinical Practice Endocrinology & Metabolism 1, 22‐31.
13. Miki, T., Liss, B., Minami, K., Shiuchi, T., Saraya, A., Kashima, Y., Horiuchi, M., Ashcroft, F., Minokoshi, Y., Roeper, J. et al. (2001) ATP‐sensitive K+ channels in the hypo‐thalamus are essential for the maintenance of glucose homeostasis Nat Neurosci 4, 507‐512.
14. Drucker, D. J. (1998) Glucagon‐like peptides Diabetes 47, 159‐169.
15. Jang, H. J., Kokrashvili, Z., Theodorakis, M. J., Carlson, O. D., Kim, B. J., Zhou, J., Kim, H. H., Xu, X., Chan, S. L., Juhaszova, M. et al. (2007) Gut‐expressed gustducin and taste receptors regulate secretion of glucagon‐like peptide‐1 Proceedings of the National Academy of Sciences of the United States of America 104, 15069‐15074.

71
16. Christensen, S., Moeller, E. H., Bonde, C., & Lilleoere, A. M. (2007) Preliminary stud‐ies of the physical stability of a glucagon‐like peptide‐1 derivate in the presence of metal ions European Journal of Pharmaceutics and Biopharmaceutics 66, 366‐371.
17. Pedersen, J. S., Dikov, D., Flink, J. L., Hjuler, H. A., Christiansen, G., & Otzen, D. E. (2006) The changing face of glucagon fibrillation: Structural polymorphism and conformational imprinting J. Mol. Biol. 355, 501‐523.
18. Kodali, R. & Wetzel, R. (2007) Polymorphism in the intermediates and products of amyloid assembly Current Opinion in Structural Biology 17, 48‐57.
19. Andersen, C. B., Otzen, D., Christiansen, G., & Rischel, C. (2007) Glucagon Amyloid‐like Fibril Morphology Is Selected via Morphology‐Dependent Growth Inhibition Biochemistry 46, 7314‐7324.
20. Padrick, S. B. & Miranker, A. D. (2002) Islet amyloid: Phase partitioning and secon‐dary nucleation are central to the mechanism of fibrillogenesis Biochemistry 41, 4694‐4703.
21. Pedersen, J. S., Flink, J. M., Dikov, D., & Otzen, D. E. (2006) Sulfates dramatically sta‐bilize a salt‐dependent type of glucagon fibrils Biophys. J. 90, 4181‐4194.
22. Manno, M., Craparo, E. F., Martorana, V., Bulone, D., & San Biagio, P. L. (2006) Kinet‐ics of insulin aggregation: Disentanglement of amyloid fibrillation from large‐size cluster formation Biophys. J. 90, 4585‐4591.
23. Collins, S. R., Douglass, A., Vale, R. D., & Weissman, J. S. (2004) Mechanism of prion propagation: Amyloid growth occurs by monomer addition Plos Biology 2, 1582‐1590.
24. Crick, F. (1970) Central Dogma of Molecular Biology Nature 227, 561‐563.
25. Anfinsen, C. B., Haber, E., Sela, M., & White, F. H. (1961) Kinetics of Formation of Native Ribonuclease During Oxidation of Reduced Polypeptide Chain Proceedings of the National Academy of Sciences of the United States of America 47, 1309‐1314.
26. Levinthal, C. (1968) Are There Pathways for Protein Folding Journal de Chimie Physique et de PhysicoChimie Biologique 65, 44‐45.
27. Dobson, C. M. (2003) Protein folding and misfolding Nature 426, 884‐890.
28. Dill, K. A. & Chan, H. S. (1997) From Levinthal to pathways to funnels Nature Structural Biology 4, 10‐19.
29. Fersht A. (1999) Structure and mechanism in protein science (Freeman, New York).
30. Dobson, C. M. (2004) Principles of protein folding, misfolding and aggregation Seminars in Cell & Developmental Biology 15, 3‐16.
31. Chiti, F., Webster, P., Taddei, N., Clark, A., Stefani, M., Ramponi, G., & Dobson, C. M. (1999) Designing conditions for in vitro formation of amyloid protofilaments and

72
fibrils Proceedings of the National Academy of Sciences of the United States of America 96, 3590‐3594.
32. Roher, A. E., Lowenson, J. D., Clarke, S., Wolkow, C., Wang, R., Cotter, R. J., Reardon, I. M., Zurcherneely, H. A., Heinrikson, R. L., Ball, M. J. et al. (1993) Structural Altera‐tions in the Peptide Backbone of Beta‐Amyloid Core Protein May Account for Its Deposition and Stability in Alzheimers‐Disease Journal of Biological Chemistry 268, 3072‐3083.
33. Pawar, A. P., Dubay, K. F., Zurdo, J., Chiti, F., Vendruscolo, M., & Dobson, C. M. (2005) Prediction of "aggregation‐prone" and "aggregation‐susceptible" regions in proteins associated with neurodegenerative diseases Journal of Molecular Biology 350, 379‐392.
34. Steward, A., Adhya, S., & Clarke, J. (2002) Sequence conservation in lg‐like domains: The role of highly conserved proline residues in the fibronectin type III superfamily Journal of Molecular Biology 318, 935‐940.
35. Pedersen, J. S., Christensen, G., & Otzen, D. E. (2004) Modulation of S6 fibrillation by unfolding rates and gatekeeper residues Journal of Molecular Biology 341, 575‐588.
36. Parrini, C., Taddei, N., Ramazzotti, M., Degl'lnnocenti, D., Ramponi, G., Dobson, C. M., & Chiti, F. (2005) Glycine residues appear to be evolutionarily conserved for their ability to inhibit aggregation Structure 13, 1143‐1151.
37. Lighthouse Data (2006).
38. Schade, D. S. & Eaton, R. P. (1975) Glucagon Regulation of Plasma Ketone‐Body Con‐centration in Human Diabetes Journal of Clinical Investigation 56, 1340‐1344.
39. Drucker, D. J. (1998) Glucagon‐like peptides Diabetes 47, 159‐169.
40. Drucker, D. J. (2005) Biologic actions and therapeutic potential of the proglucagon‐derived peptides Nature Clinical Practice Endocrinology & Metabolism 1, 22‐31.
41. Fernandez‐Escamilla, A. M., Rousseau, F., Schymkowitz, J., & Serrano, L. (2004) Pre‐diction of sequence‐dependent and mutational effects on the aggregation of pep‐tides and proteins Nature Biotechnology 22, 1302‐1306.
42. Trovato, A., Chiti, F., Maritan, A., & Seno, F. (2006) Insight into the structure of amy‐loid fibrils from the analysis of globular proteins Plos Computational Biology 2, 1608‐1618.
43. Pedersen, J. S., Dikov, D., & Otzen, D. E. (2006) N‐ and C‐terminal hydrophobic patches are involved in fibrillation of glucagon Biochemistry 45, 14503‐14512.
44. Serrano, L., Schymkowitz, J., and Rousseau, F. (5‐11‐2007) Tango ‐ A computer algo‐rithm for prediction of aggregating regions in unfolded polypeptide chains http://tango.crg.es/.
45. Trovato, A., Maritan, A., & Seno, F. (2007) Aggregation of natively folded proteins: a theoretical approach Journal of PhysicsCondensed Matter 19.
73
46. Kheterpal, I., Chen, M., Cook, K. D., & Wetzel, R. (2006) Structural differences in A beta amyloid protofibrils and fibrils mapped by hydrogen exchange ‐ Mass spec‐trometry with on‐line proteolytic fragmentation Journal of Molecular Biology 361, 785‐795.
47. Frare, E., Mossuto, M. F., de Laureto, P. P., Dumoulin, M., Dobson, C. M., & Fontana, A. (2006) Identification of the core structure of lysozyme amyloid fibrils by proteolysis Journal of Molecular Biology 361, 551‐561.
48. Myers, S. L., Thomson, N. H., Radford, S. E., & Ashcroft, A. E. (2006) Investigating the structural properties of amyloid‐like fibrils formed in vitro from beta 2‐microglobulin using limited proteolysis and electrospray ionisation mass spec‐trometry Rapid Communications in Mass Spectrometry 20, 1628‐1636.
49. Stromer, T. & Serpell, L. C. (2005) Structure and morphology of the Alzheimer's amyloid fibril Microscopy Research and Technique 67, 210‐217.
50. Fandrich, M. & Dobson, C. M. (2002) The behaviour of polyamino acids reveals an inverse side chain effect in amyloid structure formation Embo Journal 21, 5682‐5690.
51. Krishnan, R. & Lindquist, S. L. (2005) Structural insights into a yeast prion illumi‐nate nucleation and strain diversity Nature 435, 765‐772.
52. Anderson, M., Bocharova, O. V., Makarava, N., Breydo, L., Salnikov, V. V., & Baskakov, I. V. (2006) Polymorphism and ultrastructural organization of prion protein amyloid fibrils: An insight from high resolution atomic force microscopy J. Mol. Biol. 358, 580‐596.
53. Kad, N. M., Myers, S. L., Smith, D. P., Smith, D. A., Radford, S. E., & Thomson, N. H. (2003) Hierarchical assembly of beta(2)‐microglobulin amyloid in vitro revealed by atomic force microscopy J. Mol. Biol. 330, 785‐797.
54. Dong, M., Hovgaard, M. B., Xu, S., Otzen, D., & Besenbacher, F. (2006) AFM Study of glucagon fibrillation via oligomeric structures resulting in interwoven fibrils Nanotech. 17, 4003‐4009.
55. Goldsbury, C., Kistler, J., Aebi, U., Arvinte, T., & Cooper, G. J. S. (1999) Watching amy‐loid fibrils grow by time‐lapse atomic force microscopy J. Mol. Biol. 285, 33‐39.
56. Goldsbury, C. S., Wirtz, S., Muller, S. A., Sunderji, S., Wicki, P., Aebi, U., & Frey, P. (2000) Studies on the in vitro assembly of A beta 1‐40: Implications for the search for A beta fibril formation inhibitors J. Struct. Biol. 130, 217‐231.
57. De Jong, K. L., Incledon, B., Yip, C. M., & DeFelippis, M. R. (2006) Amyloid fibrils of glucagon characterized by high‐resolution atomic force microscopy Biophys. J. 91, 1905‐1914.
58. Jimenez, J. L., Nettleton, E. J., Bouchard, M., Robinson, C. V., Dobson, C. M., & Saibil, H. R. (2002) The protofilament structure of insulin amyloid fibrils Proceedings of the National Academy of Sciences of the United States of America 99, 9196‐9201.

74
59. Tycko, R. (2003) Insights into the amyloid folding problem from solid‐state NMR Biochemistry 42, 3151‐3159.
60. Kheterpal, I., Williams, A., Murphy, C., Bledsoe, B., & Wetzel, R. (2001) Structural features of the A beta amyloid fibril elucidated by limited proteolysis Biochemistry 40, 11757‐11767.
61. Makin, O. S., Atkins, E., Sikorski, P., Johansson, J., & Serpell, L. C. (2005) Molecular basis for amyloid fibril formation and stability Proceedings of the National Academy of Sciences of the United States of America 102, 315‐320.
62. Nelson, R., Sawaya, M. R., Balbirnie, M., Madsen, A. O., Riekel, C., Grothe, R., & Eisenberg, D. (2005) Structure of the cross‐beta spine of amyloid‐like fibrils Nature 435, 773‐778.
63. Sawaya, M. R., Sambashivan, S., Nelson, R., Ivanova, M. I., Sievers, S. A., Apostol, M. I., Thompson, M. J., Balbirnie, M., Wiltzius, J. J. W., McFarlane, H. T. et al. (2007) Atomic structures of amyloid cross‐beta spines reveal varied steric zippers Nature 447, 453‐457.
64. Knowles, T. P. J., Smith, J. F., Craig, A., Dobson, C. M., & Welland, M. E. (2006) Spatial persistence of angular correlations in amyloid fibrils Phys. Rev. Let. 96, 238301.
65. Glenner, G. G., Eanes, E. D., Bladen, H. A., Linke, R. P., & Termine, J. D. (1974) Beta‐Pleated Sheet Fibrils ‐ Comparison of Native Amyloid with Synthetic Protein Fibrils J. Histochem. & Cytochem. 22, 1141‐1158.
66. Sunde, M. & Blake, C. (1997) The structure of amyloid fibrils by electron microscopy and X‐ray diffraction in Advances in protein chemistry pp. 123‐159.
67. Serpell, L. C., Fraser, P. E., & Sunde, M. (1999) X‐Ray fiber diffraction of amyloid fi‐brils in Methods in Enzymology, ed. Ronald, W. (Academic Press, New York), pp. 526‐536.
68. Holm, N. K., Jespersen, S. K., Thomassen, L. V., Wolff, T. Y., Sehgal, P., Thomsen, L. A., Christiansen, G., Andersen, C. B., Knudsen, A. D., & Otzen, D. E. (2007) Aggregation and fibrillation of bovine serum albumin Biochimica et Biophysica ActaProteins and Proteomics 1774, 1128‐1138.
69. Makin, O. S. & Serpell, L. C. (2005) Structures for amyloid fibrils Febs Journal 272, 5950‐5961.
70. Sumner Makin, O. & Serpell, L. C. (2004) Structural Characterisation of Islet Amyloid Polypeptide Fibrils Journal of Molecular Biology 335, 1279‐1288.
71. Makin, O. S., Sikorski, P., & Serpell, L. C. (2007) CLEARER: a new tool for the analysis of X‐ray fibre diffraction patterns and diffraction simulation from atomic structural models Journal of Applied Crystallography 40, 966‐972.
72. Khurana, R., Coleman, C., Ionescu‐Zanetti, C., Carter, S. A., Krishna, V., Grover, R. K., Roy, R., & Singh, S. (2005) Mechanism of thioflavin T binding to amyloid fibrils Journal of Structural Biology 151, 229‐238.

75
73. Khurana, R., Uversky, V. N., Nielsen, L., & Fink, A. L. (2001) Is Congo red an amyloid‐specific dye? Journal of Biological Chemistry 276, 22715‐22721.
74. Groenning, M., Norrman, M., Flink, J. M., van de Weert, M., Bukrinsky, J. T., Schlucke‐bier, G., & Frokjaer, S. (2007) Binding mode of Thioflavin T in insulin amyloid fibrils Journal of Structural Biology 159, 483‐497.
75. Chen, Y. & Barkley, M. D. (1998) Toward Understanding Tryptophan Fluorescence in Proteins Biochemistry 37, 9976‐9982.
76. Kihara, M., Chatani, E., Iwata, K., Yamamoto, K., Matsuura, T., Nakagawa, A., Naiki, H., & Goto, Y. (2006) Conformation of Amyloid Fibrils of beta2‐Microglobulin Probed by Tryptophan Mutagenesis Journal of Biological Chemistry 281, 31061‐31069.
77. Yang, J. T., Wu, C. S., & Martinez, H. M. (1986) [11] Calculation of protein conforma‐tion from circular dichroism in Methods in Enzymology Enzyme Structure Part K, ed. Hirs and Serge, H. W. (Academic Press, pp. 208‐269.
78. Dafforn, T. R. & Rodger, A. (2004) Linear dichroism of biomolecules: which way is up? Current Opinion in Structural Biology 14, 541‐546.
79. Dafforn, T. R., Rajendra, J., Halsall, D. J., Serpell, L. C., & Rodger, A. (2004) Protein fiber linear dichroism for structure determination and kinetics in a low‐volume, low‐wavelength couette flow cell Biophys. J. 86, 404‐410.
80. Adachi, R., Yamaguchi, K., Yagi, H., Sakurai, K., Naiki, H., & Goto, Y. (2007) Flow‐induced alignment of amyloid protofilaments revealed by linear dichroism Journal of Biological Chemistry 282, 8978‐8983.
81. Yagi, H., Kusaka, E., Hongo, K., Mizobata, T., & Kawata, Y. (2005) Amyloid fibril for‐mation of alpha‐synuclein is accelerated by preformed amyloid seeds of other pro‐teins: implications for the mechanism of transmissible conformational diseases J. Biol. Chem. 280, 38609‐38616.
82. O'Nuallain, B., Williams, A. D., Westermark, P., & Wetzel, R. (2004) Seeding specific‐ity in amyloid growth induced by heterologous fibrils J. Biol. Chem. 279, 17490‐17499.
83. Lindner, H. & Glatter, O. (2000) Determination of absolute intensity and molecular weight of small colloidal particles in the presence of some large aggregates. A com‐bined study using static and dynamic light scattering Particle & Particle Systems Characterization 17, 89‐95.
84. Oberer, M., Lindner, H., Glatter, O., Kratky, C., & Keller, W. (1999) Thermodynamic properties and DNA binding of the ParD protein from the broad host‐range plasmid RK2/RP4 killing system Biological Chemistry 380, 1413‐1420.
85. Blundell, T. L. (1983) The Conformation of Glucagon in Handbook of Experimental Pharmacology, ed. Lefebvre, P. (Springer‐Verlag, Berlin), pp. 37‐56.
86. Wagman, M. E., Dobson, C. M., & Karplus, M. (1980) Proton Nmr‐Studies of the Asso‐ciation and Folding of Glucagon in Solution Febs Letters 119, 265‐270.

76
87. Sasaki, K., Dockerill, S., Adamiak, D. A., Tickle, I. J., & Blundell, T. (1975) X‐Ray Analy‐sis of Glucagon and Its Relationship to Receptor‐Binding Nature 257, 751‐757.
88. Hong, D. P. & Fink, A. L. (2005) Independent heterologous fibrillation of insulin and its B‐chain peptide Biochemistry 44, 16701‐16709.
89. Devlin, G. L., Knowles, T. P. J., Squires, A., McCammon, M. G., Gras, S. L., Nilsson, M. R., Robinson, C. V., Dobson, C. M., & MacPhee, C. E. (2006) The component polypeptide chains of bovine insulin nucleate or inhibit aggregation of the parent protein in a conformation‐dependent manner Journal of Molecular Biology 360, 497‐509.
90. Conway, K. A., Lee, S. J., Rochet, J. C., Ding, T. T., Williamson, R. E., & Lansbury, P. T. (2000) Acceleration of oligomerization, not fibrillization, is a shared property of both alpha‐synuclein mutations linked to early‐onset Parkinson's disease: Implica‐tions for pathogenesis and therapy Proceedings of the National Academy of Sciences of the United States of America 97, 571‐576.
91. Harper, J. D., Wong, S. S., Lieber, C. M., & Lansbury, P. T. (1999) Assembly of A beta amyloid protofibrils: An in vitro model for a possible early event in Alzheimer's dis‐ease Biochemistry 38, 8972‐8980.
92. Nielsen, L., Khurana, R., Coats, A., Frokjaer, S., Brange, J., Vyas, S., Uversky, V. N., & Fink, A. L. (2001) Effect of environmental factors on the kinetics of insulin fibril formation: Elucidation of the molecular mechanism Biochem. 40, 6036‐6046.
93. Librizzi, F. & Rischel, C. (2005) The kinetic behavior of insulin fibrillation is deter‐mined by heterogeneous nucleation pathways Protein Sci 14, 3129‐3134.
94. Ferrone, F. (1999) Analysis of protein aggregation kinetics in Meth. Enzym. pp. 256‐274.
95. Kumar, S., Mohanty, S. K., & Udgaonkar, J. B. (2007) Mechanism of formation of amy‐loid protofibrils of barstar from soluble oligomers: Evidence for multiple steps and lateral association coupled to conformational conversion Journal of Molecular Biology 367, 1186‐1204.
96. Gosal, W. S., Morten, I. J., Hewitt, E. W., Smith, D. A., Thomson, N. H., & Radford, S. E. (2005) Competing pathways determine fibril morphology in the self‐assembly of beta(2)‐microglobulin into amyloid Journal of Molecular Biology 351, 850‐864.
97. Carrotta, R., Manno, M., Bulone, D., Martorana, V., & San Biagio, P. L. (2005) Protofi‐bril formation of amyloid beta‐protein at low pH via a non‐cooperative elongation mechanism J. Biol. Chem. 280, 30001‐30008.
98. Smith, A. M., Jahn, T. R., Ashcroft, A. E., & Radford, S. E. (2006) Direct observation of oligomeric species formed in the early stages of amyloid fibril formation using elec‐trospray ionisation mass spectrometry J. Mol. Biol. 364, 9‐19.
99. Vestergaard, B., Groenning, M., Roessle, M., Kastrup, J. S., van de Weert, M., Flink, J. M., Frokjaer, S., Gajhede, M., & Svergun, D. I. (2007) A helical structural nucleus is the primary elongating unit of insulin amyloid fibrils Plos Biology 5, 1089‐1097.

77
100. Hamill, A. C., Wang, S. C., & Lee, C. T. (2007) Solution Structure of an Amyloid‐Forming Protein During Photoinitiated Hexamer‐Dodecamer Transitions Revealed through Small‐Angle Neutron Scattering Biochemistry 46, 7694‐7705.
101. Silveira, J. R., Raymond, G. J., Hughson, A. G., Race, R. E., Sim, V. L., Hayes, S. F., & Caughey, B. (2005) The most infectious prion protein particles Nature 437, 257‐261.
102. Flyvbjerg, H., Jobs, E., & Leibler, S. (1996) Kinetics of self‐assembling microtubules: An ''inverse problem'' in biochemistry Proc. Natl. Acad. Sci. 93, 5975‐5979.
103. Librizzi, F. & Rischel, C. (2005) The kinetic behavior of insulin fibrillation is deter‐mined by heterogeneous nucleation pathways Protein Sci 14, 3129‐3134.
104. Ruschak, A. M. & Miranker, A. D. (2007) Fiber‐dependent amyloid formation as ca‐talysis of an existing reaction pathway Proc. Natl. Acad. Sci. 104, 12341‐12346.
105. Smith, J. F., Knowles, T. P. J., Dobson, C. M., MacPhee, C. E., & Welland, M. E. (2006) Characterization of the nanoscale properties of individual amyloid fibrils Proc. Natl. Acad. Sci. 103, 15806‐15811.
106. Ban, T. & Goto, Y. (2006) Direct observation of amyloid growth monitored by total internal reflection fluorescence microscopy in Meth. Enzym. pp. 91‐102.
107. Ban, T., Hoshino, M., Takahashi, S., Hamada, D., Hasegawa, K., Naiki, H., & Goto, Y. (2004) Direct observation of Abeta amyloid fibril growth and inhibition J. Mol. Biol. 344, 757‐767.
108. Ban, T., Morigaki, K., Yagi, H., Kawasaki, T., Kobayashi, A., Yuba, S., Naiki, H., & Goto, Y. (2006) Real‐time and single fibril observation of the formation of amyloid beta spherulitic structures J. Biol. Chem. 281, 33677‐33683.
109. Ban, T., Hamada, D., Hasegawa, K., Naiki, H., & Goto, Y. (2003) Direct observation of amyloid fibril growth monitored by thioflavin T fluorescence Journal of Biological Chemistry 278, 16462‐16465.
110. Rogers, S. S., Krebs, M. R. H., Bromley, E. H. C., van der Linden, E., & Donald, A. M. (2006) Optical microscopy of growing insulin amyloid spherulites on surfaces in vi‐tro Biophys. J. 90, 1043‐1054.
111. Blackley, H. K. L., Sanders, G. H. W., Davies, M. C., Roberts, C. J., Tendler, S. J. B., & Wilkinson, M. J. (2000) In‐situ atomic force microscopy study of beta‐amyloid fibril‐lization Journal of Molecular Biology 298, 833‐840.
112. Jackson, G. S. & Collinge, J. (2001) The molecular pathology of CJD: old and new vari‐ants Journal of Clinical PathologyMolecular Pathology 54, 393‐399.
113. Fraser, H. & Dickinso, A. G. (1973) Scrapie in Mice ‐ Agent‐Strain Differences in Dis‐tribution and Intensity of Grey Matter Vacuolation Journal of Comparative Pathology 83, 29‐40.
114. Collinge, J., Sidle, K. C. L., Meads, J., Ironside, J., & Hill, A. F. (1996) Molecular analysis of prion strain variation and the aetiology of 'new variant' CJD Nature 383, 685‐690.

78
115. Hill, A. F., Desbruslais, M., Joiner, S., Sidle, K. C. L., Gowland, I., Collinge, J., Doey, L. J., & Lantos, P. (1997) The same prion strain causes vCJD and BSE Nature 389, 448‐450.
116. Masel, J., Jansen, V. A. A., & Nowak, M. A. (1999) Quantifying the kinetic parameters of prion replication Biophys. Chem. 77, 139‐152.
117. Tanaka, M., Collins, S. R., Toyama, B. H., & Weissman, J. S. (2006) The physical basis of how prion conformations determine strain phenotypes Nature 442, 585‐589.
118. Wazawa, T. & Ueda, M. (2005) Total internal reflection fluorescence microscopy in single molecule nanobioscience (Springer‐Verlag, Berlin Heidelberg).
119. Makin, O. S., Sikorski, P., & Serpell, L. C. (2006) Diffraction to study protein and pep‐tide assemblies Current Opinion in Chemical Biology 10, 417‐422.
120. Kensal E.van Holde, W.Curtis Johnson, & P.Shing Ho (1998) Principles of Physical Biochemistry (Prentice‐Hall, Inc., Upper Saddle River, New Jersey 07458).
121. Bulone, D., Giacomazza, D., Martorana, V., Newman, J., & San Biagio, P. L. (2004) Ordering of agarose near the macroscopic gelation point Phys. Rev. E 69, 041401.
122. Carrotta, R., Barthes, J., Longo, A., Martorana, V., Manno, M., Portale, G., & Biagio, P. L. S. (2007) Large size fibrillar bundles of the Alzheimer amyloid beta‐protein Euro. Biophys. J. with Biophys. Let. 36, 701‐709.
123. Ferri, F. (1997) Use of a charge coupled device camera for low‐angle elastic light scattering Review of Scientific Instruments 68, 2265‐2274.
124. Beaven, G. H., Gratzer, W. B., & Davies, H. G. (1969) Formation and Structure of Gels and Fibrils from Glucagon Euro. Jour. Biochem. 11, 37‐42.