aaib bulletin g-bxfi ec20150804
TRANSCRIPT
1© Crown copyright 2019 All times are UTC
AAIB Bulletin G-BXFI EW/C2015/08/04
SUPPLEMENT
Registered Owner and Operator Canfield Hunter Ltd
Aircraft Type Hawker Hunter T7
Nationality British
Registration G-BXFI
Place of accident A27, Shoreham Bypass, at the junction with Old Shoreham Road, North of Shoreham Airport
Date and Time: 22 August 2015 at 1222 hrs (Times in this report are UTC1 unless stated otherwise)
Summary
In June 2019 the AAIB was asked to consider additional information related to the accident involving Hawker Hunter G-BXFI at Shoreham in 2015. As part of its review of this material the AAIB considered further aeromedical opinion and produced more detailed estimates of acceleration experienced by the pilot in the manoeuvres preceding the accident. The review concluded that the findings of the AAIB investigation published in Aircraft Accident Report 1/2017 remain valid.
Introduction
On 3 March 2017 the AAIB published the final report2 of its investigation of the accident involving Hawker Hunter G-BXFI near Shoreham Airport on 22 August 2015 (the AAIB investigation). In the period between June and October 2019 the AAIB was asked to consider additional information. This included witness statements, several analyses3 of the pilot’s actions and a video of a practice display at Duxford. The purpose of this review was to determine if these documents contained new and significant evidence of cognitive impairment.
For the purpose of this review, the AAIB defined cognitive impairment as a physiological state in which an individual cannot think as well as usual, so is less able to do a task reliably and the probability of error is increased.
The review considered whether the material was:
● evidence – containing facts relevant to the accident, distinct from analysis of those facts,
Footnote1 Co-ordinated Universal Time.2 Aircraft Accident Report 1/2017: report on the accident to Hawker Hunter T7, G-BXFI near Shoreham Airport
on 22 August 2015 available at https://www.gov.uk/aaib-reports/aircraft-accident-report-aar-1-2017-g-bxfi-22-august-2015 [accessed December 2019]
3 These analyses were prepared for a purpose other than safety investigation and do not necessarily represent the complete opinion of their authors.

2© Crown copyright 2019 All times are UTC
AAIB Bulletin G-BXFI EW/C2015/08/04
● new – not previously considered by the AAIB, and
● significant – having a different effect from evidence that the AAIB had already considered.
If all three criteria were met, the AAIB was required to reopen its investigation.4
The review involved Inspectors who were not part of the AAIB investigation described in Aircraft Accident Report 1/2017. The review team included an Inspector (Human Factors), an Inspector (Recorded Data) with expertise in aircraft performance, and two Inspectors (Operations) who were formerly fast jet pilots with experience in instruction and display flying.
As part of the process of considering the significance of the material presented, the review applied additional modelling techniques to determine the aircraft’s flight path, and to provide more detailed estimates of +Gz (the “head to foot” acceleration experienced by the pilot, normal to the flightpath), in the manoeuvres preceding the accident. These are described in Appendix 1. It also considered additional aeromedical opinion.
Summary of Gz analysis
The additional modelling indicated that +Gz during the positioning turn was briefly about 3.8 g, four seconds after the start of the positioning turn, falling within three seconds to approximately 2.2 g, then rising slightly to a level predominantly around 3 g before falling again to around 1 g over the final six seconds of the turn.
The review also estimated +Gz exposure in the first part of the loop. This indicated that a maximum +Gz of 4 g occurred about five seconds after the start of the manoeuvre and remained above 3 g for about four seconds. The +Gz load then reduced in a linear manner to a value of approximately 1.6 g some four seconds later.
Conclusions of the AAIB investigation regarding pilot impairment
The issue of possible cognitive impairment due to +Gz exposure was considered in the AAIB investigation and was discussed in the AAIB final report5. The pilot’s behaviour as captured by a cockpit action camera6 was assessed by pilot expert advisors to the investigation, human factors experts and an aeromedical expert. The AAIB report stated:
‘As far as could be determined from cockpit image recordings the pilot appeared alert and active throughout the flight.’
Footnote
⁴ Regulation 18(1) of the Civil Aviation (Investigation of Air Accidents and Incidents) Regulations 2018.⁵ See sections 1.18.10.1 page 124 and 2.2.3 page 166 of AAIB Aircraft Accident Report 1/2017.⁶ This camera captured a partial view of the pilot from behind, a portion of the instrument panel and a portion
of the view through the canopy and windscreen. See section 1.11.3 page 40 of AAIB Aircraft Accident Report 1/2017.
3© Crown copyright 2019 All times are UTC
AAIB Bulletin G-BXFI EW/C2015/08/04
The aeromedical expert who advised the AAIB investigation stated:
‘Although some day to day variation in G tolerance occurs in every individual, it would be very unusual for an individual to suffer G related impairment at less than +3Gz while wearing a G suit. The video evidence reviewed herein shows no evidence of the classically described G-LOC or A-LOC syndromes, and the G levels in the accident video are similar to previously experienced levels flown without incident (eg in the Duxford video). 7 Therefore, I can find no evidence of G related impairment in the material available for review.’
The pilot had G currency8 having flown nine displays in the two weeks prior to the accident. Although not documented in detail in the AAIB final report, other factors that can affect G tolerance9 were considered to the extent possible using information from the accident flight and previous flights conducted by this pilot, medical information and pilot interviews. There was no evidence that these factors differed significantly from previous occasions.
The AAIB report provided the following analysis of the factual information it presented:
‘There was no evidence of any g-related impairment of the pilot during the aerobatic sequence flown. If the pilot was unwell before the accident, it was not established in what way he was unwell or when the onset of any condition was first experienced.’
On this topic, the report concluded that:
‘The g experienced by the pilot during the manoeuvre was probably not a factor in the accident.’
Analysis of pilot actions - AAIB investigation
The pilot’s actions were considered during the AAIB investigation. Evidence was limited because the pilot did not recall the accident and his plan for the display was not documented in detail. It was not possible to draw firm conclusions about what influenced the pilot’s performance on the day.
The AAIB’s analysis focused on two decision points where the pilot may have been able to recover from any deviations in the planned manoeuvres that had occurred and prevent the situation from progressing into an accident:
1. The entry to the accident manoeuvre
2. The apex of the accident manoeuvre
Footnote
⁷ Cockpit image recording of a display at Duxford.⁸ Recent experience of flying with +Gz exposure. G currency increases G tolerance.⁹ Factors reducing G tolerance include hypoxia, hyperventilation, infection, drugs, alcohol, heat stress,
dehydration, fatigue, hunger and poor physical fitness among others. Factors increasing G tolerance include G currency, use of anti-G clothing and anti-G straining manoeuvre among others.

4© Crown copyright 2019 All times are UTC
AAIB Bulletin G-BXFI EW/C2015/08/04
The AAIB determined that these were the areas where the greatest safety learning could be obtained to improve display pilots’ ability to recover when manoeuvres do not progress as planned.
The Royal Air Force Centre for Aviation Medicine (RAFCAM) conducted a human factors analysis10 of these decision points. It used a range of evidence sources such as the cockpit action camera footage, results from flight trials and notes from interviews with the pilot. The RAFCAM applied recognised systematic human factors analysis techniques.11 The RAFCAM analysis identified the credible errors and performance shaping factors12 that could have been present at the entry to the loop manoeuvre, during the climb and at the apex of the manoeuvre.
Additional analyses of the pilot’s actions
The material presented to the AAIB in 2019 included analyses by six different authors of the pilot’s actions preceding the accident. Among them the authors had experience and qualifications in display flying, aviation medicine and human factors. None of these documents were ‘evidence’. They were all opinions regarding the pilot’s actions based on the authors’ interpretations of facts that were already known to the AAIB. These analyses of the pilot’s actions were reviewed to determine if they contained or referenced new and significant evidence, or if they offered new insights.
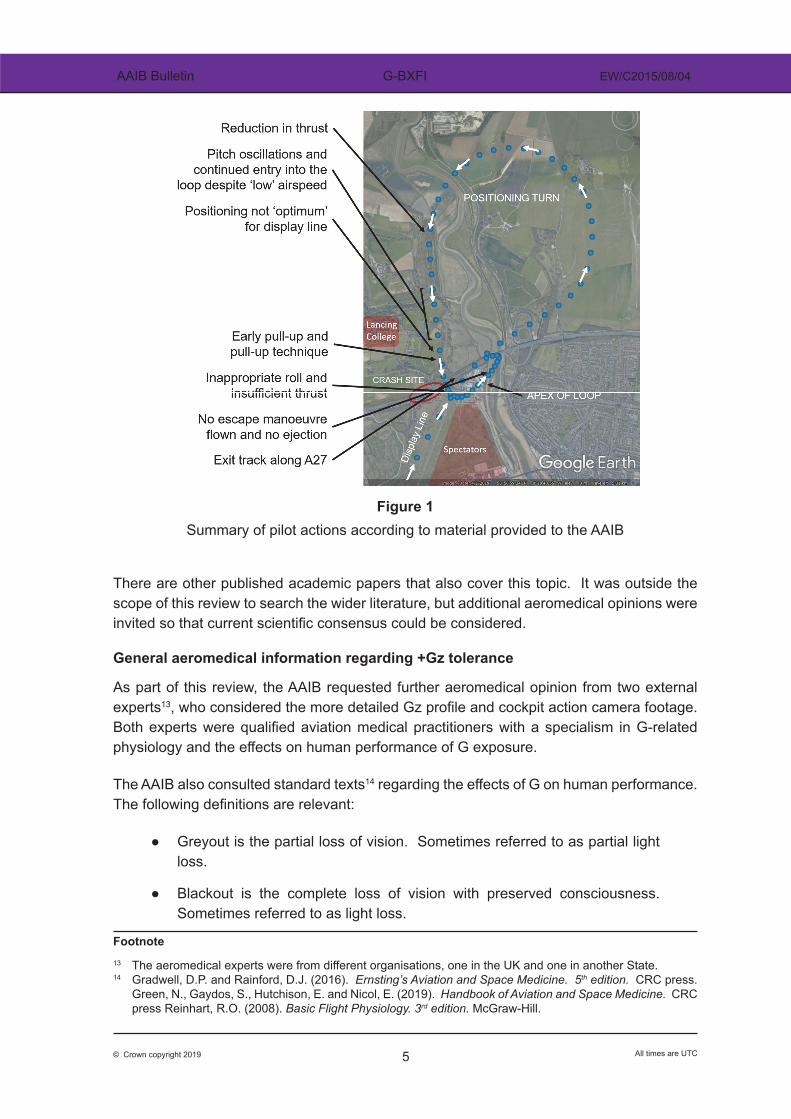
Figure 1 summarises how the analyses considered that the pilot’s performance diverged from what was required.
Several of the authors asserted that such a pattern of behaviour by this pilot could only be explained by some form of cognitive impairment. One of the authors argued that the only source of such impairment possible in this accident was +Gz.
Referenced research papers
One of the documents referred to several published papers on the topic of human response to +Gz. These papers were evidence that was potentially relevant and had not been considered previously by the AAIB (Appendix 2 provides summaries). Therefore, they were considered as part of this review to assess whether they were significant. Only those papers referenced within the documents presented to the AAIB have been considered specifically.
Footnote10 Royal Airforce Centre for Aviation Medicine. Aircraft Accident Human Factors Report. Hawker Hunter
G-BXFI. Shoreham Airshow, 22 August 2014. Referred to in Appendix M, pages 404 – 420 of the AAIB Aircraft Accident Report 1/2017.
11 Task analysis and two methods of human error analysis, Systematic Human Error Reduction and Prediction Approach (SHERPA) and an adapted version of the Australian Transportation Safety Board Human Factors analysis of see and avoid.
12 Performance shaping factors are characteristics of an individual, group, task, environment or organisation that influence human performance. Some performance shaping factors enhance performance, such as motivation, training or practice and some reduce human performance such as high workload, unclear procedures or badly designed equipment.
5© Crown copyright 2019 All times are UTC
AAIB Bulletin G-BXFI EW/C2015/08/04
Figure 1Summary of pilot actions according to material provided to the AAIB
There are other published academic papers that also cover this topic. It was outside the scope of this review to search the wider literature, but additional aeromedical opinions were invited so that current scientific consensus could be considered.
General aeromedical information regarding +Gz tolerance
As part of this review, the AAIB requested further aeromedical opinion from two external experts13, who considered the more detailed Gz profile and cockpit action camera footage. Both experts were qualified aviation medical practitioners with a specialism in G-related physiology and the effects on human performance of G exposure.
The AAIB also consulted standard texts14 regarding the effects of G on human performance. The following definitions are relevant:
● Greyout is the partial loss of vision. Sometimes referred to as partial light loss.
● Blackout is the complete loss of vision with preserved consciousness. Sometimes referred to as light loss.
Footnote13 The aeromedical experts were from different organisations, one in the UK and one in another State. 14 Gradwell, D.P. and Rainford, D.J. (2016). Ernsting’s Aviation and Space Medicine. 5th edition. CRC press. Green, N., Gaydos, S., Hutchison, E. and Nicol, E. (2019). Handbook of Aviation and Space Medicine. CRC
press Reinhart, R.O. (2008). Basic Flight Physiology. 3rd edition. McGraw-Hill.
6© Crown copyright 2019 All times are UTC
AAIB Bulletin G-BXFI EW/C2015/08/04
● A-LOC is ‘almost loss of consciousness’. It is G-related incapacitation without overt loss of consciousness. There is inconsistency in the literature about the performance effects, but symptoms reported following A-LOC include sensory abnormalities, amnesia, confusion and a disconnection between cognition and the ability to act.
● G-LOC is ‘G induced loss of consciousness’. It features a period of absolute incapacitation followed by a period of impaired consciousness while the crew member is recovering.
● G tolerance is the level at which individuals experience greyout or G-LOC. It varies between individuals and there is variation within individuals on different days.
The figures stated for average levels of Gz tolerance varied slightly in the literature depending on what research source was used. Figure 2 summarises results from a compilation of Gz tolerance studies involving participants who were not wearing any anti-G clothing or performing any techniques to increase their G tolerance. Each point on the graph shows the result of a research study in terms of when the end point of greyout, blackout or unconsciousness was experienced under different levels of Gz and different durations of exposure. The line on the graph summarises the general finding seen across studies that high levels of Gz of short duration may not result in symptoms, but symptoms progress quickly if the onset of Gz is rapid. Lower levels can be tolerated for longer, especially if the onset is slow. It shows that it is rare to find effects within four seconds of exposure or below +3 g.
A typical G-suit could provide up to 1.5 g additional tolerance if working correctly. Wearing anti-G clothing even if not functional is said to add approximately 0.4 g additional tolerance.15
Greyout, blackout, A-LOC and G-LOC are the only performance effects of +Gz that are widely acknowledged by the aeromedical community. None of the standard texts mentioned a possibility of cognitive impairment at low levels of +Gz exposure insufficient to induce A-LOC or G-LOC.
The two aeromedical experts were specifically asked about performance effects of low +Gz exposure. They provided opinion supported by published literature, a bibliography of which is included at the end of this supplement.
One expert stated:
‘Some limited research has been conducted looking at cognitive impairment under +Gz loads that do not result in A-LOC or G-LOC. The findings of these studies are somewhat inconsistent, and in many cases contradictory. As such, it is not possible to make definitive conclusions from these limited experimental studies, which by and large have no practical implications for the flying task under +Gz.’
Footnote15 Parkhurst, MJ, Leverett SD Jr, Shubrooks JR. Human Tolerance to High, Sustained +Gz Acceleration.
Aerospace Med. 1972; 43(7):708712.

7© Crown copyright 2019 All times are UTC
AAIB Bulletin G-BXFI EW/C2015/08/04
The other expert cited three studies that found no change in performance under low levels of +Gz and two studies that found some minor changes in performance during or after +Gz exposure. In conclusion this expert stated:
‘Based on the limited evidence that does exist, and international medical and flying experience, the probability that pilots can become cognitively impaired during exposure to low levels of +Gz acceleration is extremely low.’
Figure 2Relaxed participants’ tolerance to +Gz acceleration based on a compilation of research studies (reproduced from Gradwell, D.P. and Rainford, D.J., 2016)
The AAIB reviewed the full original text of all the publications cited by the aeromedical experts.
It also asked the opinion of the RAFCAM, which advised the AAIB that:
‘the existence of low Gz induced cognitive impairment is not supported by decades of flight experience or flying training under high G loads requiring completion of complex cognitive tasks.’
The RAFCAM consulted the relevant NATO panel, air forces in the European Air Group, the Five Eyes Air Force Interoperability Council, and the United States Air Force. None of these authorities recognised the existence of low Gz-induced cognitive impairment, nor do they train their respective military pilots to avoid this condition.

8© Crown copyright 2019 All times are UTC
AAIB Bulletin G-BXFI EW/C2015/08/04
Re-assessment of video footage
During this review, videos of the accident flight and previous displays and practises by the pilot at Shoreham in 2014, Duxford 2014, Bray 2015, Shuttleworth 2015 and Eastbourne in 2014 and 2015 were re-examined by two AAIB Inspectors of Air Accidents (Operations). Their experience included flying, displaying and instructing in various aircraft types including the Jet Provost, Hawk, Buccaneer, Hunter, Jaguar and T33 Shooting Star. They were not part of the AAIB investigation team.
These Inspectors, familiar with observing students while sat behind them in tandem cockpits, concluded that the pilot’s head and body movements were consistent with what they would expect from someone flying a loop manoeuvre. They did not observe any significant differences in behaviour between the accident flight and previous displays. They could not identify a point at which the pilot’s behaviour changed in an observable way that would indicate impairment.
One of the aeromedical experts reviewed the cockpit action camera footage of the accident flight and the Shoreham display in 2014 for evidence of +Gz induced impairment. He stated:
‘the accident clip does not demonstrate any of the typical head movements associated with impairment due to high +Gz.’
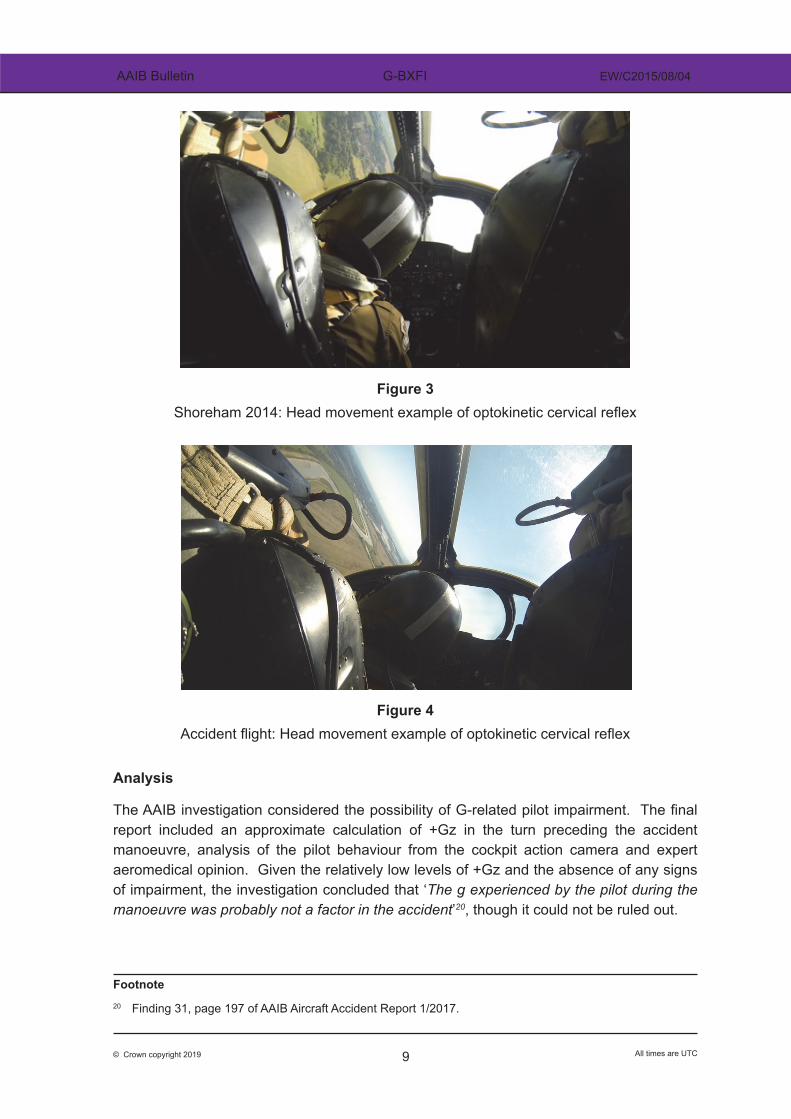
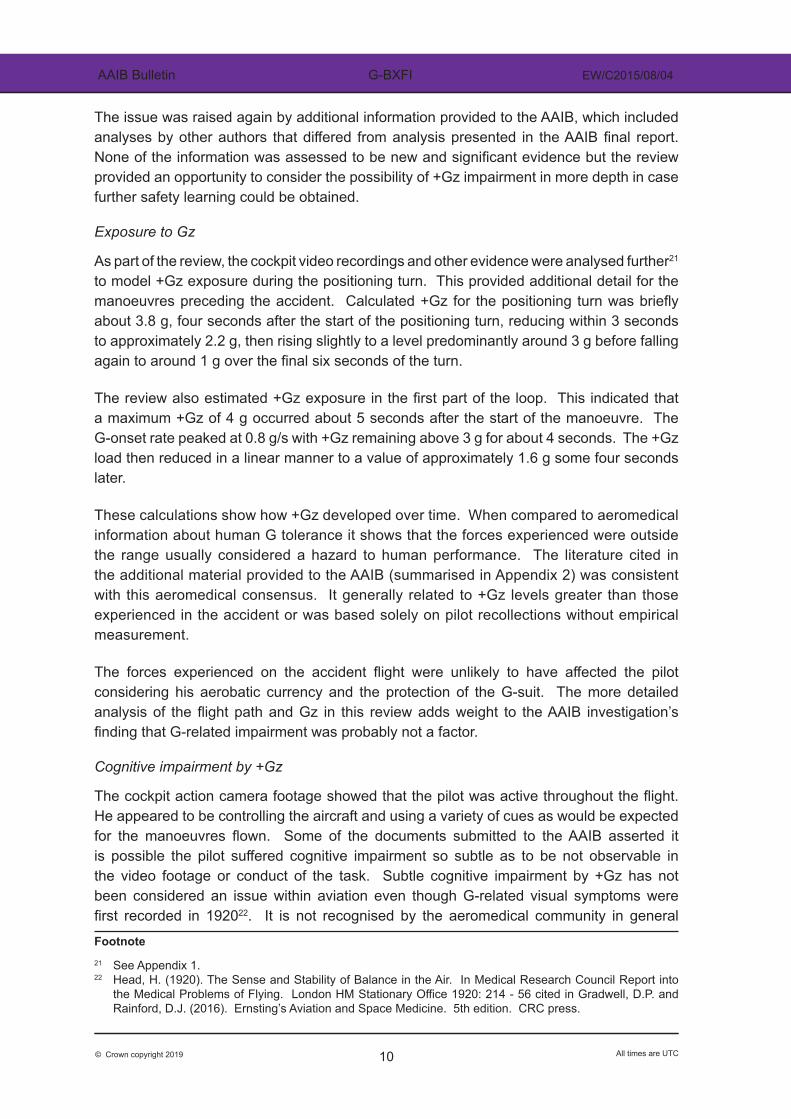
Figure 3 and Figure 4 illustrate one of the behaviours he described as an example of optokinetic cervical reflex.16,17,18,19 This is a well-documented phenomenon in low-level flight in visual meteorological conditions, in which a pilot orients their head with respect to the visible horizon rather than the aircraft’s attitude. This aeromedical expert noted that:
‘the presence of these typical flight-related head movements is entirely consistent with normal, routine flight operations.’
He concluded that:
‘there was no discernible significant difference between the head movements of the pilot in either of the two flights. What movements were seen were entirely consistent with a pilot attempting to maintain an adequate lookout during low-level aerobatic manoeuvring.’
Footnote16 Beer J, Freeman, D. Flight display dynamics and compensatory head movements in pilots. Aviat Space
Environ Med 2007; 78(6):579-87. 17 Gallimore J BN. Effects of FOV and Aircraft Bank on Pilot Head Movement and Reversal Errors During
Simulated Flight. Aviat Space Environ Med 1999; 70:1152-60. 18 Gallimore J P, F, Brannon, N, Nalepka, J. The Opto-Kinetic Cervical Reflex During Formation Flight. Aviat
Space Environ Med 2000; 71(8):812-21. 19 Merryman R, Cacioppo, A. The Optokinetic Cervical Reflex in Pilots of High-Performance Aircraft. Aviat
Space Environ Med 1997; 68(6):479-87.
9© Crown copyright 2019 All times are UTC
AAIB Bulletin G-BXFI EW/C2015/08/04
Figure 3Shoreham 2014: Head movement example of optokinetic cervical reflex
Figure 4Accident flight: Head movement example of optokinetic cervical reflex
Analysis
The AAIB investigation considered the possibility of G-related pilot impairment. The final report included an approximate calculation of +Gz in the turn preceding the accident manoeuvre, analysis of the pilot behaviour from the cockpit action camera and expert aeromedical opinion. Given the relatively low levels of +Gz and the absence of any signs of impairment, the investigation concluded that ‘The g experienced by the pilot during the manoeuvre was probably not a factor in the accident’20, though it could not be ruled out.
Footnote20 Finding 31, page 197 of AAIB Aircraft Accident Report 1/2017.
10© Crown copyright 2019 All times are UTC
AAIB Bulletin G-BXFI EW/C2015/08/04
The issue was raised again by additional information provided to the AAIB, which included analyses by other authors that differed from analysis presented in the AAIB final report. None of the information was assessed to be new and significant evidence but the review provided an opportunity to consider the possibility of +Gz impairment in more depth in case further safety learning could be obtained.
Exposure to Gz
As part of the review, the cockpit video recordings and other evidence were analysed further21 to model +Gz exposure during the positioning turn. This provided additional detail for the manoeuvres preceding the accident. Calculated +Gz for the positioning turn was briefly about 3.8 g, four seconds after the start of the positioning turn, reducing within 3 seconds to approximately 2.2 g, then rising slightly to a level predominantly around 3 g before falling again to around 1 g over the final six seconds of the turn.
The review also estimated +Gz exposure in the first part of the loop. This indicated that a maximum +Gz of 4 g occurred about 5 seconds after the start of the manoeuvre. The G-onset rate peaked at 0.8 g/s with +Gz remaining above 3 g for about 4 seconds. The +Gz load then reduced in a linear manner to a value of approximately 1.6 g some four seconds later.
These calculations show how +Gz developed over time. When compared to aeromedical information about human G tolerance it shows that the forces experienced were outside the range usually considered a hazard to human performance. The literature cited in the additional material provided to the AAIB (summarised in Appendix 2) was consistent with this aeromedical consensus. It generally related to +Gz levels greater than those experienced in the accident or was based solely on pilot recollections without empirical measurement.
The forces experienced on the accident flight were unlikely to have affected the pilot considering his aerobatic currency and the protection of the G-suit. The more detailed analysis of the flight path and Gz in this review adds weight to the AAIB investigation’s finding that G-related impairment was probably not a factor.
Cognitive impairment by +Gz
The cockpit action camera footage showed that the pilot was active throughout the flight. He appeared to be controlling the aircraft and using a variety of cues as would be expected for the manoeuvres flown. Some of the documents submitted to the AAIB asserted it is possible the pilot suffered cognitive impairment so subtle as to be not observable in the video footage or conduct of the task. Subtle cognitive impairment by +Gz has not been considered an issue within aviation even though G-related visual symptoms were first recorded in 192022. It is not recognised by the aeromedical community in general Footnote21 See Appendix 1.22 Head, H. (1920). The Sense and Stability of Balance in the Air. In Medical Research Council Report into
the Medical Problems of Flying. London HM Stationary Office 1920: 214 - 56 cited in Gradwell, D.P. and Rainford, D.J. (2016). Ernsting’s Aviation and Space Medicine. 5th edition. CRC press.

11© Crown copyright 2019 All times are UTC
AAIB Bulletin G-BXFI EW/C2015/08/04
and major military authorities around the world do not consider it to be an issue. Both aeromedical experts consulted during this review considered it unlikely, basing their view on the balance of published evidence of which they were aware. Where performance effects were documented in these published studies, their direction, nature and magnitude were variable, and some studies found no change in the performance variables they measured. There were not enough studies of low +Gz exposure overall to draw conclusions about any particular performance effect.
It was outside the scope of this review to perform a comprehensive search of the literature and there may be additional relevant material that has not been considered. The UK Civil Aviation Authority (CAA) stated that it is conducting a medical review of the potential risk of cognitive impairment in civilian pilots due to G forces. It will not re-examine the specific circumstances of the 2015 Shoreham accident. Following this review and if appropriate, the CAA will consider taking regulatory action to improve flight safety.
Performance shaping factors
Some of the analyses provided to the AAIB offered an account of where in the accident flight the authors felt the pilot’s actions differed from what was intended or appropriate. Not all these actions were discussed in the AAIB final report due to limited evidence about the pilot’s intentions and a focus on areas where safety could be improved. Some of the authors of the additional material considered in this review asserted that, looking at the pilot’s overall pattern of behaviour, impairment was the only explanation. However, there are alternative explanations that do not involve cognitive impairment.
It is possible that an individual doing any task will do it incorrectly. For an easy task or a highly trained person doing a task they are very familiar with, the likelihood of this is low. For a difficult task, or a task performed by someone not sufficiently familiar with it, the likelihood is high. The probability that someone will do a task incorrectly is influenced by performance shaping factors. Impairment was one possible performance shaping factor in the G-BXFI accident. The AAIB investigation found no evidence of impairment but, if present, it did not affect the pilot’s observable behaviour and the source of any impairment was unknown.
Other performance shaping factors were more likely than impairment to have contributed to this accident. During the AAIB investigation, the RAFCAM conducted a human factors analysis.23 It identified credible performance shaping factors, including the possibility of glare affecting the pilot’s ability to read critical information from the instruments, and the possibility that the pilot did not correctly recall the required speeds and heights due to the differences between the various aircraft he regularly flew.
Footnote23 Royal Airforce Centre for Aviation Medicine. Aircraft Accident Human Factors Report. Hawker Hunter
G-BXFI. Shoreham Airshow, 22 August 2014. Referred to in Appendix M, pages 404 – 420 of the AAIB Aircraft Accident Report 1/2017.
12© Crown copyright 2019 All times are UTC
AAIB Bulletin G-BXFI EW/C2015/08/04
Pilot’s overall pattern of behaviour
The overall pattern of behaviour described by the analyses provided to the AAIB can be explained in other ways that do not require impairment as a common factor. The pitch oscillations, the pull-up technique and the decision not to eject were proposed as significant in some of the analyses but the AAIB did not consider them to be significant actions in the sequence. The pitch oscillations were assessed to be minor deviations probably due to the aircraft being slightly out of trim in pitch. The pull-up technique was consistent with the pilot’s technique seen in other display videos. A decision to eject would not be taken in preference to flying an escape manoeuvre if the pilot realised this was required. By the time the situation was unrecoverable, the aircraft was outside the limits from which an ejection would be likely to be survivable.
The reduction in thrust24 prior to the start of the loop, if commanded by the pilot25, may have been an appropriate action if he intended to commence the loop at less than 350 kt, or if he mis-recalled the target speed. He may have considered the speed to be correct.
Any analysis of the pilot’s position and pull-up point relies on assumptions about his plan. There was no evidence documenting the exact track he planned to fly and therefore none with which to compare the actual flight path. The track at the end of the positioning turn was only marginally different to what the pilot described when interviewed. Had he rolled out of the positioning turn earlier he would have flown over Lancing College; which was prohibited. On the actual final heading achieved, a later pull-up would have risked infringing the display line.
If the pilot had deviated from his planned positioning, he may have become preoccupied with this, causing him to pay less attention to flying the manoeuvre accurately. This could account for the early roll and perhaps the insufficient thrust.
For the pilot to decide to fly an escape manoeuvre he would need to: realise he was too low, believe that the escape manoeuvre was likely to be successful, and be capable of flying it. The RAFCAM human factors analysis considered the apex of the loop in depth.26 It described several credible mechanisms by which the pilot could be unaware he was too low. For example, the AAIB investigation highlighted a design issue that would have increased the likelihood of misreading the altimeter due to the obscuration of the digit showing thousands of feet.27 The investigation found that the pilot may not have known an escape manoeuvre could be successful from the height and speed achieved at the apex of the final manoeuvre. If the pilot realised he was too low, the time available may
Footnote24 Analysis of cockpit audio recordings from the accident flight enabled thrust levels to be assessed, but throttle
movements were not visible in the cockpit image recordings. Section 1.11.3 on page 41 of Aircraft Accident Report 1/2017.
25 An uncommanded reduction in thrust during the accident manoeuvre could not be ruled out. Finding 13 on page 196 of Aircraft Accident Report 1/2017
26 See paragraphs 19 – 21, pages 415 - 418 of AAIB Aircraft Accident Report 1/2017.27 See Figure 28, page 129 of AAIB Aircraft Accident Report 1/2017.
13© Crown copyright 2019 All times are UTC
AAIB Bulletin G-BXFI EW/C2015/08/04
only have been sufficient to execute a rule-based decision28 of a practiced action. By the time it would have been obvious to the pilot he could not complete the loop safely it is unlikely it would have been possible to avoid the road.
Hence, the actions may have been linked together and do not require cognitive impairment as an explanation.
Whatever the explanations for the pilot’s actions, air display flying is challenging. It is foreseeable that manoeuvres will sometimes differ from what was intended even with the most expert pilots and the best possible preparation. The AAIB investigation found that the severity of the outcome at Shoreham was due to the absence of provisions to mitigate the effects of an aircraft crashing in an area outside the control of the organisers of the flying display. Accordingly, the AAIB final report also explored the effectiveness of measures to protect the public from the hazards of displaying aircraft and made Safety Recommendations for improvement in this area.
Conclusion
The AAIB has reviewed the information provided and concluded that it does not constitute new and significant evidence.
This review has provided a more detailed understanding of the +Gz profile experienced by the pilot during the manoeuvres preceding the accident. It has also examined alternative analyses of the pilot’s actions during the accident flight. The cockpit action camera footage from the accident flight and other displays by the pilot were reviewed again in light of the additional material provided. The AAIB found no new and significant evidence of cognitive impairment. There are credible alternative explanations for the pilot’s actions which are supported by evidence presented in the AAIB final report and are considered more likely.
The findings of the AAIB investigation remain valid.
Footnote
28 Rule based decision making can occur when there is a specific pre-determined action to take in response to a specific criterion or criteria. For example, IF the height at the apex of the loop is less than the minimum gate height THEN execute the escape manoeuvre. It requires the action and criteria to be known prior to having to make the decision.

14© Crown copyright 2019 All times are UTC
AAIB Bulletin G-BXFI EW/C2015/08/04
APPENDIX 1 – Detailed estimates of Gz
The AAIB investigation found that the accident aircraft did not have a serviceable g-meter. Consequently, no direct indications of Gz were available. However, a study of the available data by the RAFCAM indicated the pilot would have experienced +Gz of 2.7 g in the positioning turn.
In this review the AAIB applied additional modelling techniques to provide more detailed estimates of Gz in the positioning turn and loop manoeuvre.
The AAIB final report provided speed29 at the pull-up into the loop manoeuvre in terms of airspeed read from the right ASI and groundspeed from photogrammetry. It indicated these had the same values despite the presence of wind but did not explain why these were consistent. Given the relationship between airspeed and Gz, this appendix provides an explanation for the relationship between airspeed and groundspeed.
Gz during the positioning turn
The vertical (head to foot) force on a pilot normal to the flightpath is known as Gz. Gz generated during any turn, regardless of the aircraft type, is a factor of the shape of the three-dimensional (3-D) flightpath and the speed at which it is flown. The tighter the turn at a given speed the higher the Gz. Equally, for a given radius of turn, the faster it is flown the higher the Gz. Small flightpath changes also affect Gz by an amount proportional to the rate of these changes. Small changes in pitch, for example, generate momentary changes in Gz which either add to (when pitching up) or reduce (when pitching down) the Gz produced when flying the turn without these changes.
The 3-D flightpath and timing of the positioning turn can be used to calculate the Gz generated during the turn. Therefore, the accuracy of the calculated Gz depends on how well the flightpath of the aircraft can be determined.
Radar positions
The only direct location information available for the positioning turn are the radar returns from Pease Pottage and Gatwick radar30 which have a degree of uncertainty. Horizontally this uncertainty is bounded by allowable system and random errors.31
The system errors for all radar heads in the UK are measured daily and so can be accounted for; however, the random errors will be different for every radar return and can only be taken into account by considering the allowable extent of these errors. The random errors for distance and bearing from the radar head are different, but for each radar return, a box can be drawn to represent with 95% confidence the range of possible positions of the target aircraft. Near to Shoreham the box would be 140 m long in the direction of the radar head, Footnote29 See page 44 of AAIB Aircraft Accident Report 1/2017 which states that the pull-up at the start of this
manoeuvre commenced at an indicated airspeed of 310 ±15 KIAS and groundspeed as 310 ±15 kt.30 See section 1.11.2 of AAIB Aircraft Accident Report 1/2017.31 EUROCONTROL Standard Document for Radar Surveillance in En-Route Airspace and Major Terminals
SUR.ET1.ST01.1000-STD-01-01 March 1997.

15© Crown copyright 2019 All times are UTC
AAIB Bulletin G-BXFI EW/C2015/08/04
and 75 m wide for Pease Pottage and 95 m wide for Gatwick (note that Gatwick is further away so the bearing swathe is slightly wider). The Mode C altitude data received by the radar stations32 is in 100 ft increments and required to be within 125 ft (with 95% confidence) of the altimeter used on board the aircraft. Figure A-1 shows the radar returns of the aircraft for the flypast, positioning turn and loop, with the known system errors removed.
Position derived from photogrammetry
The radar data on its own does not define the flightpath sufficiently to rule out a wide variety of flightpaths transitioning through the radar boxes. However, the on-board imagery taken by the two action cameras mounted within the cockpit33 showed a smooth path which provided assurance that any short-term variations in Gz were not large. This was also evident in the imagery of the aircraft taken from the ground. The same imagery can be further processed to more tightly define the flightpath. The action cameras show, for example, whether the flightpath was smooth or involved the aircraft pitching up and down, and which ground features the aircraft flew over.
When external references that support photogrammetry are present in the image, the position of the action cameras, and hence the aircraft, can be calculated along a 3-D flightpath. Both action cameras recorded at a rate of 25 frames per second, enabling the flightpath to be determined in more detail than using radar returns, which are spaced up to 6 seconds apart. Images from videos of the aircraft taken from the ground were also used to triangulate parts of the flightpath.
Figure A-1Boxes showing with 95% confidence the position of the aircraft indicated by Pease
Pottage (red) and Gatwick (blue) radar heads (note that the corners of the boxes have been extended down to show their position over the ground)
Footnote32 Mode C is a type of secondary surveillance radar (SSR) system that requests identity and altitude information
from the aircraft itself in additional to the measured position of the aircraft from detections.33 See section 1.11.3 of AAIB Aircraft Accident Report 1/2017.
16© Crown copyright 2019 All times are UTC
AAIB Bulletin G-BXFI EW/C2015/08/04
Assessment of how the positioning turn was flown
Extracts from both action cameras were analysed, starting just after the 270° roll of the Derry turn when the aircraft was just over 90° left-wing-down and climbing, ending 27 seconds later with the wings level just prior to pulling up for the loop. The turn was flown with only small perturbations in pitch and roll, consistent with the GoPro imagery of the right control column (which is connected directly to, and so, mirrors the pilot’s control column) that shows no large amplitude movements of the control column.
Flightpath from photogrammetry
Photogrammetry, in which positional information is derived from photographs and videos, is well understood and used in an increasing number of software tools. It can be used, for example, to place a virtual object in a video sequence in which the camera position and perspective is constantly changing, or to generate models of urban environments from drone footage.
When necessary, the AAIB uses photogrammetry to generate 3D models of accident sites. By providing markers in the scene at known locations, the 3-D model can be scaled and positioned to allow measurements to be made as in the real world.
In video applications, photogrammetry software can analyse footage from a moving camera to create a 3-D model of what was filmed and can determine the position of the camera in the model for every video frame. The software can use actual locations of features appearing in the footage to reference these positions to the real world. With sufficient tracked features in the video, the software can model and compensate for camera lens distortions as part of the iterative process of refining the 3-D model of the surroundings and camera path.
It is possible to derive the position of an aircraft in a series of frames by applying this type of analysis to videos taken from within the aircraft and providing the geographical location of features in the video.
The use of the action camera videos to derive the location of the aircraft is only possible when known or derivable external references are in view. The GoPro video contained sufficient ground features to calculate the location of the camera from the end of the 270° roll of the Derry turn to when the aircraft rolled wings level for the start of the loop manoeuvre.
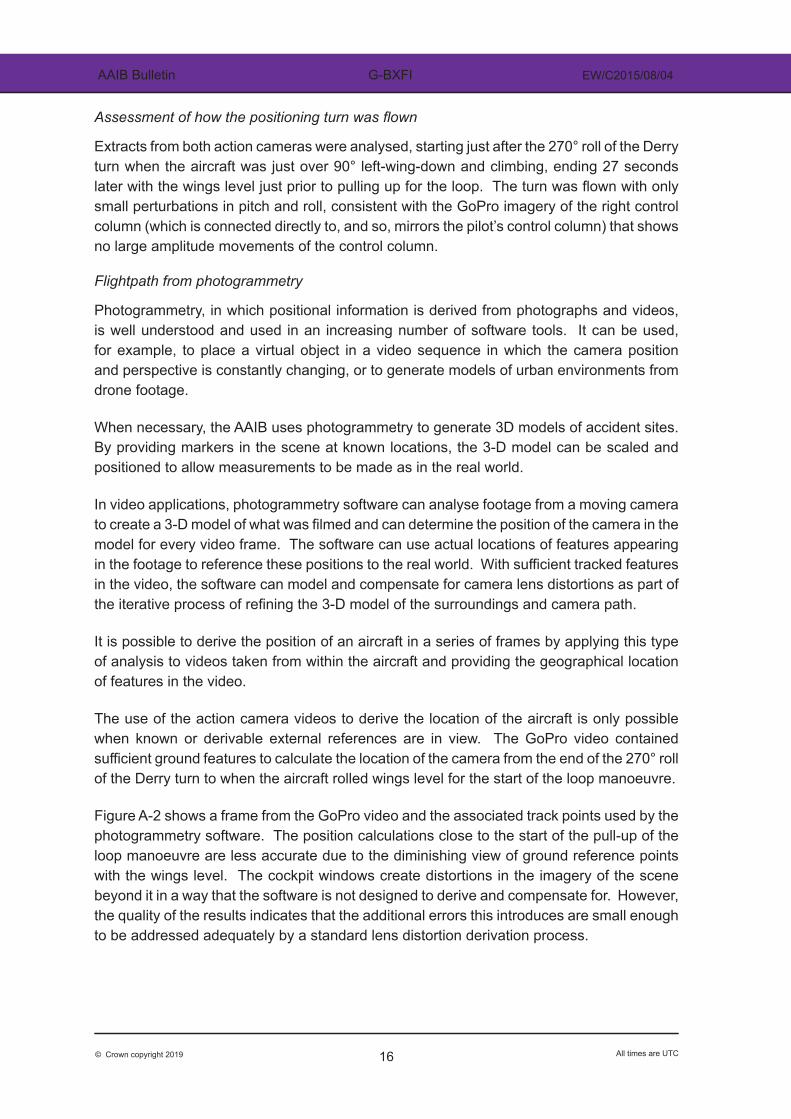
Figure A-2 shows a frame from the GoPro video and the associated track points used by the photogrammetry software. The position calculations close to the start of the pull-up of the loop manoeuvre are less accurate due to the diminishing view of ground reference points with the wings level. The cockpit windows create distortions in the imagery of the scene beyond it in a way that the software is not designed to derive and compensate for. However, the quality of the results indicates that the additional errors this introduces are small enough to be addressed adequately by a standard lens distortion derivation process.
17© Crown copyright 2019 All times are UTC
AAIB Bulletin G-BXFI EW/C2015/08/04
Figure A-2
Snapshot from the GoPro action camera with markers for track points and the locations of ground features including those not in frame or obscured in the frame
The DogCam video was roughly processed using fewer reference points to provide a reasonableness check of the GoPro results. This was done for a similar period to that of the GoPro analysis work to ensure the process was consistent using a different camera in the cockpit with a different view of the ground. The photogrammetry software declared more positional errors for the DogCam results, and these errors were apparent in the results. However, in general the calculated 3-D positions were consistent with the GoPro results (Figure A-3).
The GoPro video of the aircraft in the loop manoeuvre was also processed in order to compare the altitude this would generate with the other evidence associated with the loop apex altitude. This indicated an apex altitude within the band given in the AAIB final report, providing further evidence of the robustness of the process.
Some of the videos taken by the public from different locations captured both the aircraft and terrain in the background and so were suitable for photogrammetry. On their own they were used to generate the direction of the aircraft relative to the camera location. Used in pairs, they generated a triangulated flightpath. These were consistent with, and provided some additional flightpath information at the start of the loop, and correlated well with the paths derived from the on-board cameras.

18© Crown copyright 2019 All times are UTC
AAIB Bulletin G-BXFI EW/C2015/08/04
Figure A-3
Overview and comparison of derived tracks from DogCam (dark pink dots) and GoPro (dark blue dots) cockpit action cameras with Pease Pottage (red)
and Gatwick (blue) radar boxes
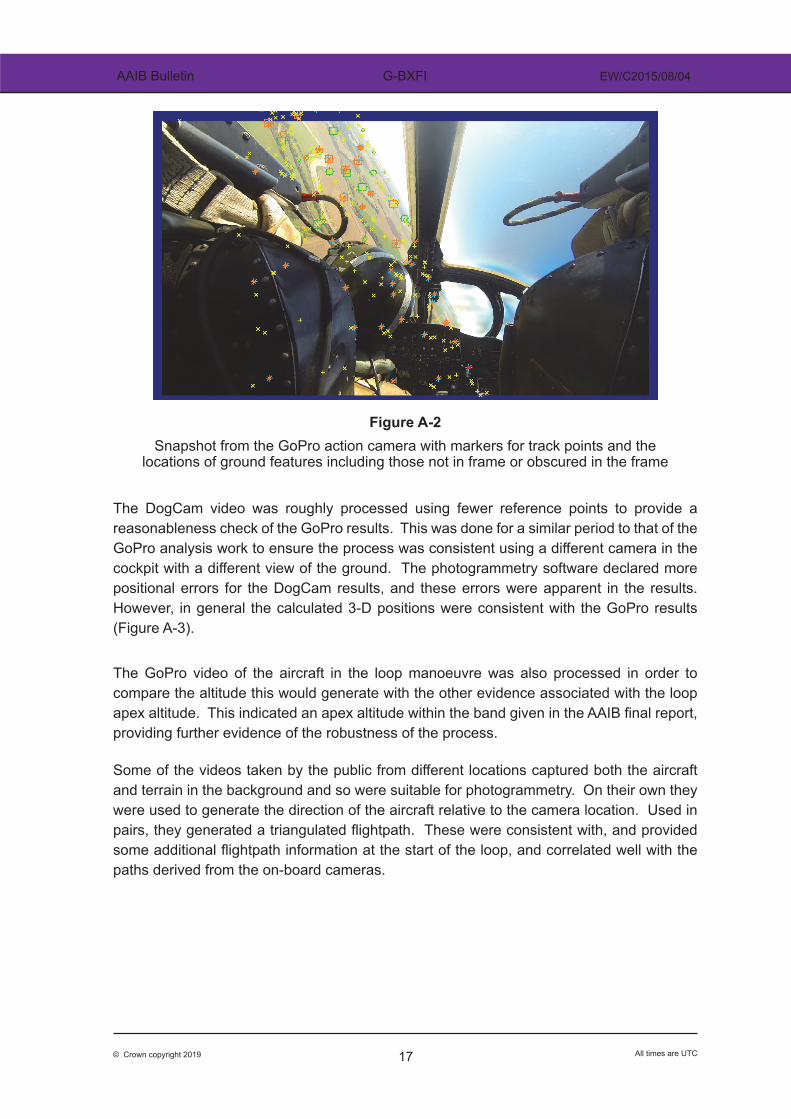
Figure A-4 compares the derived altitudes of the GoPro, DogCam and ground videos with each other and with the Mode C radar altitudes. They are consistent with each other and with the radar altitudes. Note that the along-track length of the radar boxes equates to a flight time of up to 2 seconds at a groundspeed of 300 kt. This is shown in Figure A-4 by the length of the horizontal lines through each of the points; the vertical lines represent the ±125 ft Mode C accuracy requirement. Note also that the radar altitudes were consistently between 50 and 200 ft less than the GNSS34 recorded altitudes when the aircraft flew along the coast toward Shoreham.35
Footnote34 Global Navigation Satellite System. 35 See section 1.11.6 of AAIB Aircraft Accident Report 1/2017.
19© Crown copyright 2019 All times are UTC
AAIB Bulletin G-BXFI EW/C2015/08/04
Figure A-4
Comparison of altitude derived from DogCam (dark pink), GoPro (dark blue) cockpit action cameras and ground video (black) with Pease Pottage (red square)
and Gatwick (purple circle) Mode C altitudes
Gz calculations
Gz was calculated using a proprietary flight mechanics software tool. Assuming that the sideslip angle is small and the aircraft is not stalled, the equations of motion along a flightpath can be simplified such that the aircraft’s orientation (heading, pitch and roll angles), velocities, Gz and other performance parameters can be determined as a function of time. The wind and atmospheric conditions must also be known36 (because the wind affects the ground track), as well as the lift and drag characteristics of the aircraft37 (to model angle of attack and thrust).
The flightpath analysis used two radar points (both from Pease Pottage) prior to the positioning turn, the first point being at the end of the flypast. This was to ensure that any errors at the start of the modelling, introduced by having to constrain the start point of the flightpath, were not part of the positioning turn. An interpolation routine was used to generate a continuous flightpath through these radar points and the set of video-derived positions during the turn and pull-up, interpolated at intervals of one second (a frequency of 1 Hz) for use in the flightpath analysis (Figures A-5 & A-6).
Footnote36 At 1220 hrs on the day of the accident, the Shoreham airport reported wind was 120° at 12 kt and the
temperature was 24°C with a QNH of 1013 hPa (ie ISA+9).37 Ministry of Aviation Aeronautical Research Council R&M No. 3420 – Flight Measurements of the Drag of
a Swept-Wing Aircraft (Hunter Mk.1) at Mach Numbers up to 1.2, together with some Measurements of Lift-Curve Slope – 1966. Note that the aerodynamic differences between the Hunter Mk.1 and Mk.7 are insignificant for the purposes of the flightpath analysis.

20© Crown copyright 2019 All times are UTC
AAIB Bulletin G-BXFI EW/C2015/08/04
Figure A-5 Figure A-5
1Hz interpolated flightpath ground track (light blue dots) through the radar boxes and the derived GoPro (dark blue dots) and ground video (black) positions
Figure A-61Hz interpolated altitude profile (light blue) through the radar boxes and the
derivedGoPro (dark blue) and ground video (black) positions
21© Crown copyright 2019 All times are UTC
AAIB Bulletin G-BXFI EW/C2015/08/04
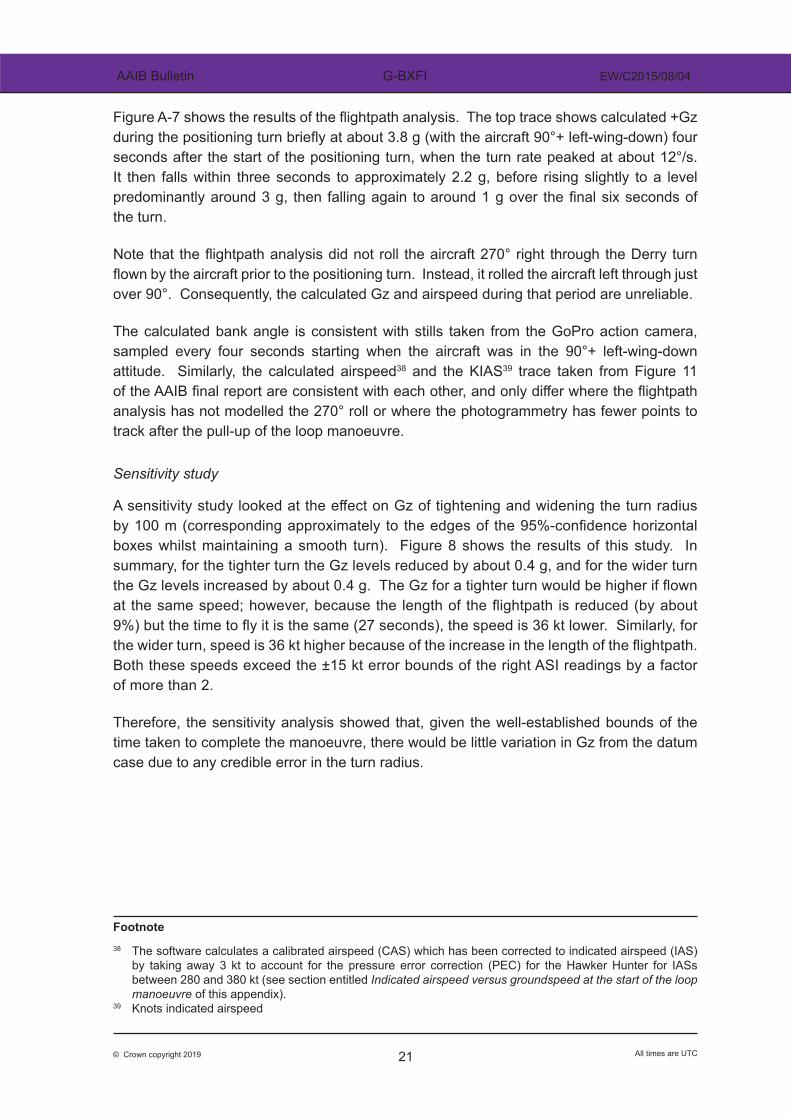
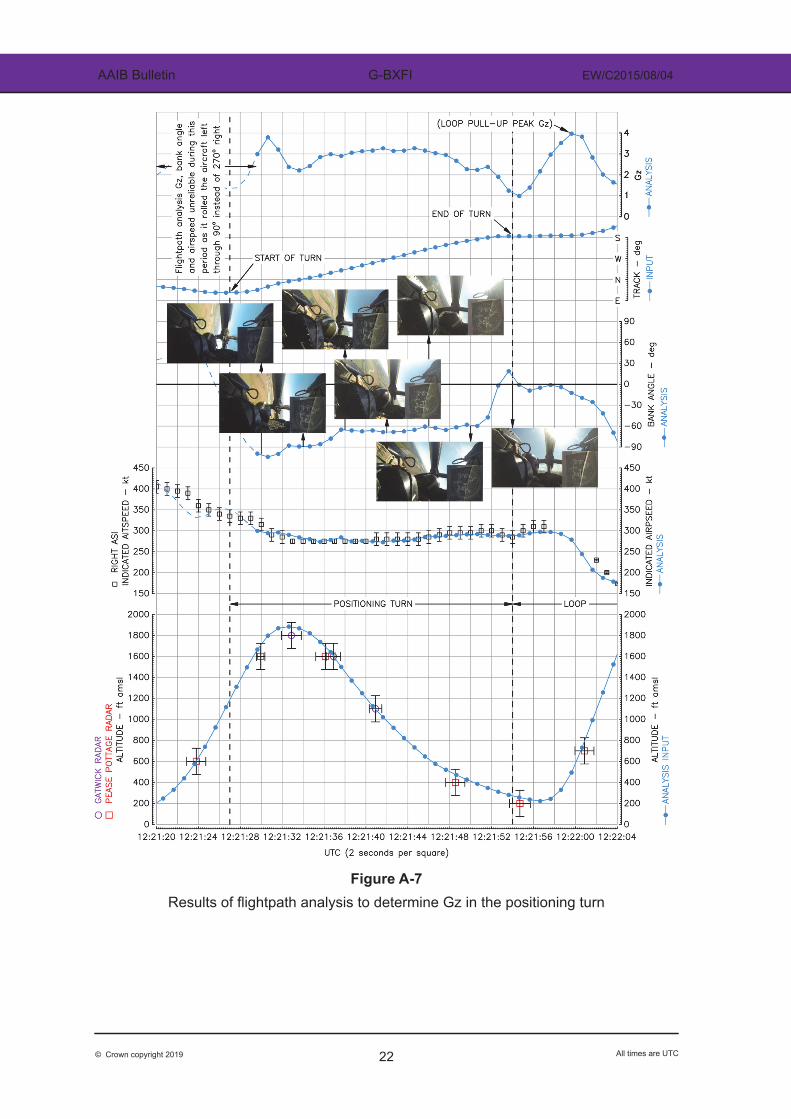
Figure A-7 shows the results of the flightpath analysis. The top trace shows calculated +Gz during the positioning turn briefly at about 3.8 g (with the aircraft 90°+ left-wing-down) four seconds after the start of the positioning turn, when the turn rate peaked at about 12°/s. It then falls within three seconds to approximately 2.2 g, before rising slightly to a level predominantly around 3 g, then falling again to around 1 g over the final six seconds of the turn.
Note that the flightpath analysis did not roll the aircraft 270° right through the Derry turn flown by the aircraft prior to the positioning turn. Instead, it rolled the aircraft left through just over 90°. Consequently, the calculated Gz and airspeed during that period are unreliable. The calculated bank angle is consistent with stills taken from the GoPro action camera, sampled every four seconds starting when the aircraft was in the 90°+ left-wing-down attitude. Similarly, the calculated airspeed38 and the KIAS39 trace taken from Figure 11 of the AAIB final report are consistent with each other, and only differ where the flightpath analysis has not modelled the 270° roll or where the photogrammetry has fewer points to track after the pull-up of the loop manoeuvre.
Sensitivity study
A sensitivity study looked at the effect on Gz of tightening and widening the turn radius by 100 m (corresponding approximately to the edges of the 95%-confidence horizontal boxes whilst maintaining a smooth turn). Figure 8 shows the results of this study. In summary, for the tighter turn the Gz levels reduced by about 0.4 g, and for the wider turn the Gz levels increased by about 0.4 g. The Gz for a tighter turn would be higher if flown at the same speed; however, because the length of the flightpath is reduced (by about 9%) but the time to fly it is the same (27 seconds), the speed is 36 kt lower. Similarly, for the wider turn, speed is 36 kt higher because of the increase in the length of the flightpath. Both these speeds exceed the ±15 kt error bounds of the right ASI readings by a factor of more than 2.
Therefore, the sensitivity analysis showed that, given the well-established bounds of the time taken to complete the manoeuvre, there would be little variation in Gz from the datum case due to any credible error in the turn radius.
Footnote38 The software calculates a calibrated airspeed (CAS) which has been corrected to indicated airspeed (IAS)
by taking away 3 kt to account for the pressure error correction (PEC) for the Hawker Hunter for IASs between 280 and 380 kt (see section entitled Indicated airspeed versus groundspeed at the start of the loop manoeuvre of this appendix).
39 Knots indicated airspeed
22© Crown copyright 2019 All times are UTC
AAIB Bulletin G-BXFI EW/C2015/08/04
Figure A-7
Results of flightpath analysis to determine Gz in the positioning turn

23© Crown copyright 2019 All times are UTC
AAIB Bulletin G-BXFI EW/C2015/08/04
Figure A-8Results of sensitivity study comparing datum flightpath analysis (light blue dots)
with a turn which is tighter (orange dots) or wider (grey dots) by 100 m (the overlay shows a plan view of these tracks relative to the radar boxes)
Peak Gz during the loop manoeuvre
Maximum performance loops
During the data gathering flights described in Appendix H of the AAIB final report, 24 loops were flown at various speeds, thrusts and configurations: some straight, some bent. The minimum entry-to-apex height achieved was never less than 2,700 ft. Each of these loops were flown using the maximum performance of the aircraft40 to minimise the radius of the loop and hence the height of the apex.
Footnote40 A maximum performance loop is defined as using the maximum available lift which is generated from flying
with the maximum available angle of attack (α). Note that for a swept-wing aircraft, the CL-α curve, which shows the relationship between lift (CL) and α, flattens off at CLmax during which the buffet progressively grows from light to heavy as α is increased, before the wing stalls. Maximum α, therefore, can be achieved when the aircraft is in light buffet, with no gains in performance if buffet levels increase as the stick is pulled back further.
24© Crown copyright 2019 All times are UTC
AAIB Bulletin G-BXFI EW/C2015/08/04
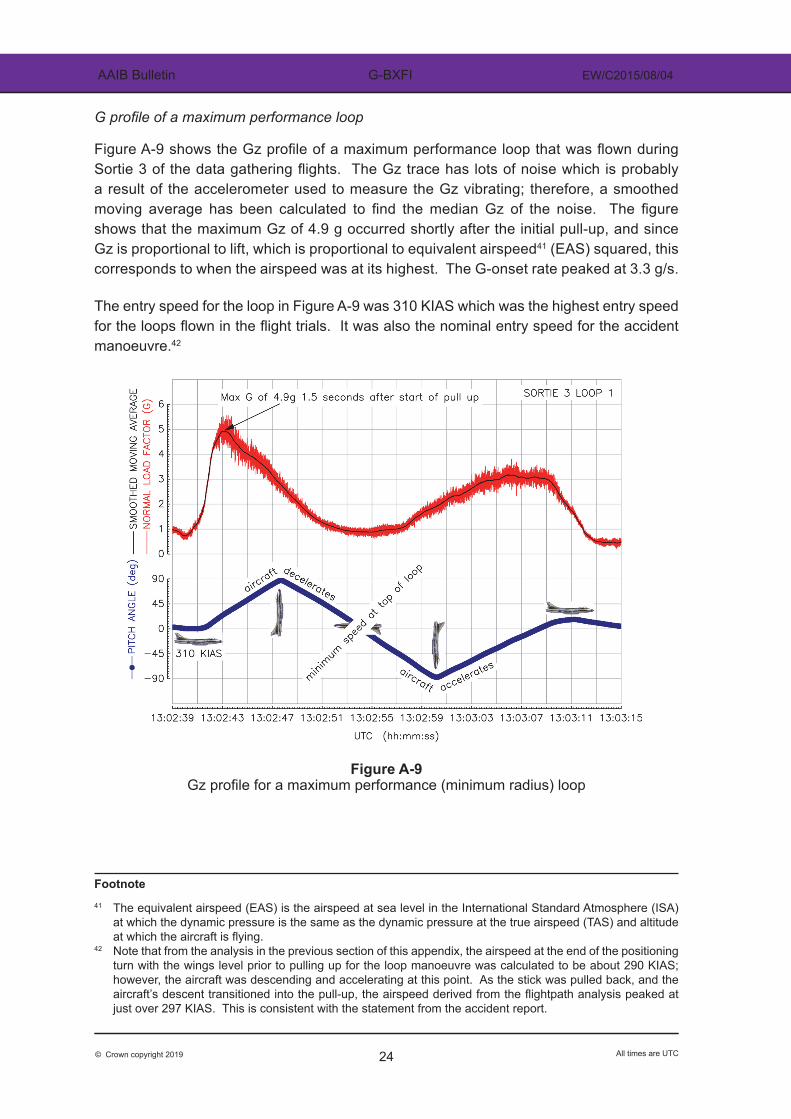
G profile of a maximum performance loop
Figure A-9 shows the Gz profile of a maximum performance loop that was flown during Sortie 3 of the data gathering flights. The Gz trace has lots of noise which is probably a result of the accelerometer used to measure the Gz vibrating; therefore, a smoothed moving average has been calculated to find the median Gz of the noise. The figure shows that the maximum Gz of 4.9 g occurred shortly after the initial pull-up, and since Gz is proportional to lift, which is proportional to equivalent airspeed41 (EAS) squared, this corresponds to when the airspeed was at its highest. The G-onset rate peaked at 3.3 g/s.
The entry speed for the loop in Figure A-9 was 310 KIAS which was the highest entry speed for the loops flown in the flight trials. It was also the nominal entry speed for the accident manoeuvre.42
Figure A-9 Gz profile for a maximum performance (minimum radius) loop
Footnote41 The equivalent airspeed (EAS) is the airspeed at sea level in the International Standard Atmosphere (ISA)
at which the dynamic pressure is the same as the dynamic pressure at the true airspeed (TAS) and altitude at which the aircraft is flying.
42 Note that from the analysis in the previous section of this appendix, the airspeed at the end of the positioning turn with the wings level prior to pulling up for the loop manoeuvre was calculated to be about 290 KIAS; however, the aircraft was descending and accelerating at this point. As the stick was pulled back, and the aircraft’s descent transitioned into the pull-up, the airspeed derived from the flightpath analysis peaked at just over 297 KIAS. This is consistent with the statement from the accident report.
25© Crown copyright 2019 All times are UTC
AAIB Bulletin G-BXFI EW/C2015/08/04
Given that EAS = CAS = IAS + 3.5 kt,43 the nominal 4.9 g corresponding to an entry speed of 310 KIAS can be factored to calculate the peak Gz had the entry speed been 310 - 15 = 295 KIAS or 310 + 15 = 325 KIAS. Therefore, for an entry speed of 295 KIAS, the peak Gz would have been:
+4.9 x (295 + 3.5)2 / (310 + 3.5)2 = 4.4 g
and for an entry speed of 325 KIAS, the peak Gz would have been:
+4.9 x (325 + 3.5)2 / (310 + 3.5)2 = 5.4 g
for a maximum performance loop.
Accident loop manoeuvre
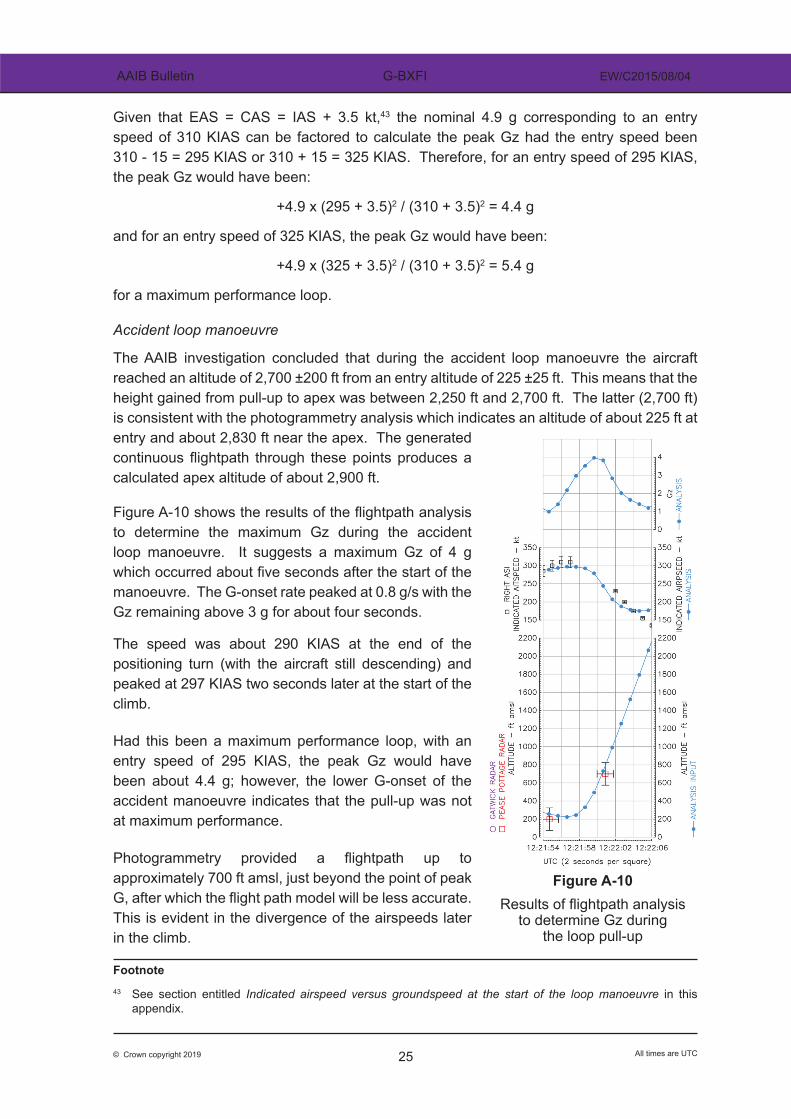
The AAIB investigation concluded that during the accident loop manoeuvre the aircraft reached an altitude of 2,700 ±200 ft from an entry altitude of 225 ±25 ft. This means that the height gained from pull-up to apex was between 2,250 ft and 2,700 ft. The latter (2,700 ft) is consistent with the photogrammetry analysis which indicates an altitude of about 225 ft at entry and about 2,830 ft near the apex. The generated continuous flightpath through these points produces a calculated apex altitude of about 2,900 ft.
Figure A-10 shows the results of the flightpath analysis to determine the maximum Gz during the accident loop manoeuvre. It suggests a maximum Gz of 4 g which occurred about five seconds after the start of the manoeuvre. The G-onset rate peaked at 0.8 g/s with the Gz remaining above 3 g for about four seconds.
The speed was about 290 KIAS at the end of the positioning turn (with the aircraft still descending) and peaked at 297 KIAS two seconds later at the start of the climb.
Had this been a maximum performance loop, with an entry speed of 295 KIAS, the peak Gz would have been about 4.4 g; however, the lower G-onset of the accident manoeuvre indicates that the pull-up was not at maximum performance.
Photogrammetry provided a flightpath up to approximately 700 ft amsl, just beyond the point of peak G, after which the flight path model will be less accurate. This is evident in the divergence of the airspeeds later in the climb.
Footnote43 See section entitled Indicated airspeed versus groundspeed at the start of the loop manoeuvre in this
appendix.
Figure A-10 shows the results of the flightpath analysis to determine the maximum Gz during the accident loop manoeuvre. It suggests a maximum Gz of 4 g which occurred about five seconds after the start of the manoeuvre. The G-onset rate peaked at 0.8 g/s with the Gz remaining above 3 g for about four seconds.
The speed was about 290 KIAS at the end of the positioning turn (with the aircraft still descending) and peaked at 297 KIAS two seconds later at the start of the climb.
Had this been a maximum performance loop, with an entry speed of 295 KIAS, the peak Gz would have been about 4.4 g; however, the lower G-onset of the accident manoeuvre indicates that the pull-up was not at maximum performance.
Photogrammetry provided a flightpath up to approximately 700 ft amsl, just beyond the point of peak G, after which the flight path model will be less accurate. This is evident in the divergence of the airspeeds later in the climb.
Figure A-10
Results of flightpath analysis to determine Gz during the loop pull-up
Figure A-10Results of flightpath analysis
to determine Gz duringthe loop pull-up
26© Crown copyright 2019 All times are UTC
AAIB Bulletin G-BXFI EW/C2015/08/04
Indicated airspeed versus groundspeed at the start of the loop manoeuvre
The following shows the relationship between indicated airspeed and groundspeed at the point of pull-up for the accident manoeuvre.
Relationship of true airspeed (TAS) with groundspeed (GS)
True airspeed is the speed of the aircraft relative to the airmass in which it is flying. If the airmass is moving over the ground at a certain speed (ie the wind speed), the relationship between true airspeed (TAS) and groundspeed (GS) is:
TAS = GS + headwind component of the wind speed
Given that the wind reported at Shoreham Airport at the time of the accident was 120° at 12 kt, and the heading of the aircraft was about 170°, the headwind component at the surface would have been 7.7 kt. However, because the manoeuvre started at about 225 ft, the headwind component would have been nearer 9 to 10 kt due to the wind gradient and veering of the wind with increasing altitude.44 Therefore, at the start of the loop manoeuvre:
TAS = GS + 9.5 kt (1)
Relationship between calibrated airspeed (CAS) and indicated airspeed (IAS)
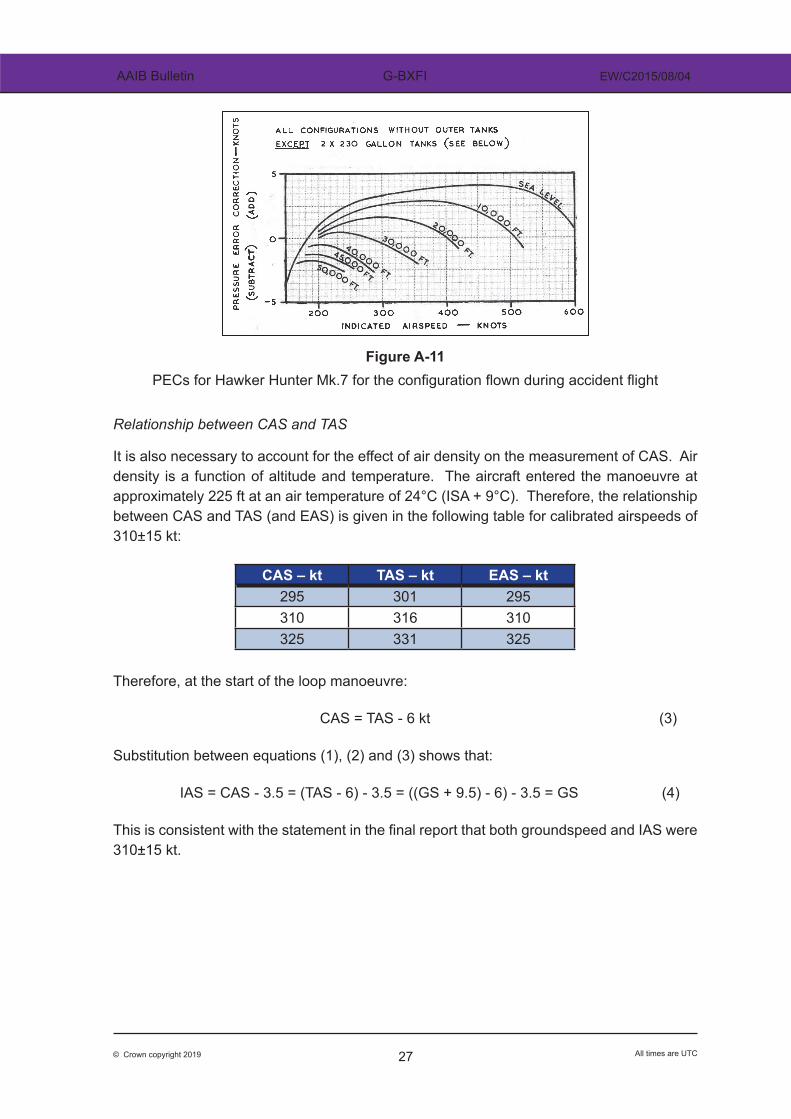
Calibrated airspeed (CAS) is the indicated airspeed (IAS) corrected for instrument errors (which are not known for the aircraft) and position errors (in which the pressures sensed by the pitot-static system are not the actual free stream values). To correct for position errors, a position (or pressure) error correction (PEC) must be applied to the IAS to get CAS. Figure A11 shows the PECs for the Hawker Hunter Mk.7 in the configuration flown during the accident flight, indicating a PEC of +3.5 kt at about 300 KIAS.
Therefore, at the start of the loop manoeuvre:
IAS = CAS - 3.5 kt (2)
Footnote44 Surface friction forces the surface wind to slow and change direction near the surface of the Earth when
compared to the winds above the Earth’s surface. The Met Office aftercast surface wind was approximately 10 kt increasing steadily with height to approximately 16 kt at 5,000 ft; therefore, at 225 ft the wind speed would have been no more than 1-2 kt more than the reported speed. In the northern hemisphere the wind direction veers (ie turns clockwise) with increasing altitude. A general rule of thumb is for the wind to veer by about 30° at 2,000 ft; therefore, a wind veer of 2-3° at 225 ft is not unreasonable.
27© Crown copyright 2019 All times are UTC
AAIB Bulletin G-BXFI EW/C2015/08/04
Figure A-11
PECs for Hawker Hunter Mk.7 for the configuration flown during accident flight
Relationship between CAS and TAS
It is also necessary to account for the effect of air density on the measurement of CAS. Air density is a function of altitude and temperature. The aircraft entered the manoeuvre at approximately 225 ft at an air temperature of 24°C (ISA + 9°C). Therefore, the relationship between CAS and TAS (and EAS) is given in the following table for calibrated airspeeds of 310±15 kt:
CAS – kt TAS – kt EAS – kt295 301 295310 316 310325 331 325
Therefore, at the start of the loop manoeuvre:
CAS = TAS - 6 kt (3)
Substitution between equations (1), (2) and (3) shows that:
IAS = CAS - 3.5 = (TAS - 6) - 3.5 = ((GS + 9.5) - 6) - 3.5 = GS (4)
This is consistent with the statement in the final report that both groundspeed and IAS were 310±15 kt.
28© Crown copyright 2019 All times are UTC
AAIB Bulletin G-BXFI EW/C2015/08/04
Appendix 2 – Summaries of relevant literature referred to in submissions to the AAIB
Morrissette KL and McGowan DG (2000) Further Support for the Concept of a G-LOC Syndrome: A Survey of Military High-Performance Aviators. Aviation Space and Environmental Medicine, Vol 71, No 5, May 2000
The title of this paper refers to G-LOC but it is mostly concerned with A-LOC. It reports on the incidence of A-LOC episodes in military aviators and their memories of the symptoms they experienced.
The study used an anonymous survey of 329 military pilots and ‘back seaters’.45 The survey was preceded by a verbal and video brief describing the mechanisms and symptoms of ALOC. The full questionnaire was not provided in the paper but appeared to include a pre-populated list of possible symptoms which participants could indicate if they had experienced. Of the 280 respondents 40 (14%) reported 1 or 2 episodes in which they had experienced various symptoms. The symptoms reported included sensory abnormality, motor abnormality, lack of recall and confusion. Of these, 58% were associated with loss of vision.
The paper was not considered significant evidence in relation to the G-BXFI accident for several reasons. The level of +Gz associated with symptoms was not captured or reported so it was not possible to assess if any of the episodes were at comparable exposure levels. It relied on flight crew memory of symptoms rather than any empirical measurement of the performance effects of these symptoms. The briefing prior to the questionnaire may have encouraged participants to report symptoms that they would not otherwise have mentioned. In general, it is difficult to draw conclusions from self-report studies of the prevalence and symptoms of A-LOC because the symptoms described as A-LOC can also occur on recovery from G-LOC. G-LOC is associated with amnesia and a proportion of G-LOC events are not recalled. Therefore, it is not possible to determine if the respondents are accurately recalling A-LOC episodes. This applies equally to the following two studies by Rickards and Newman (2005) and Slungaard, McLeod, Green, Kiran, Newham and Harridge (2017).
Rickards CA; Newman DG (2005). G-Induced Visual and Cognitive Disturbances in a Survey of 65 Operational Fighter Pilots. Aviation Space and Environmental Medicine, Vol 76, No 5, May 2005
This study was another example of a pilot survey that collected self-reports of A-LOC events. The participants were fighter pilots then currently serving in the Royal Australian Air Force. The full survey was not available in the paper. It appeared to include a list of potential symptoms for the pilots to choose from. Of the 65 pilots who responded, 64 reported at least one episode of A-LOC symptoms or G-LOC and 34 pilots reported experiencing some
Footnote45 Occupants who were not in control of the aircraft.
29© Crown copyright 2019 All times are UTC
AAIB Bulletin G-BXFI EW/C2015/08/04
of the following: abnormal sensation in limbs; disorientation; poor response to auditory stimuli; confusion and apathy.
The paper was not considered significant evidence in relation to the G-BXFI accident because it did not discuss the G exposure when the reported events occurred. Again, it relied on memory of symptoms rather than any empirical measurement of performance.
Slungaard E, McLeod J, Green NDC, Kiran A, Newham DJ, Harridge SDR (2017). Incidence of G Induced Loss of Consciousness and Almost Loss of Consciousness in the Royal Air Force. Aerospace Medicine and Human Performance, Vol 88, No 6, June 2017.
The aim of this survey was to measure the incidence of A-LOC and G-LOC episodes in pilots and weapons operators in the Royal Air Force. Of 809 aircrew who returned a survey, 120 (14.8%) reported one or more episodes of G-LOC and 260 (32.2%) reported one or more episodes of A-LOC. The participants were not asked about the specific symptoms they experienced. All the incidences of G-LOC or A-LOC were reported to have occurred when exposed to between +4 and +9 g. The majority occurred when exposed to between +5 and +5.9 g.
The study did not provide significant evidence in relation to the G-BXFI accident because it only covers incidence of A-LOC and G-LOC and not the effects of +Gz on pilot cognitive performance. It provided evidence that symptoms may be experienced at levels as low as +4 g. The paper did not state whether or not the pilots in these instances were wearing anti-g trousers. The finding of some symptoms at +4 g was consistent with the aeromedical information already available to the AAIB investigation so was not considered new and significant.
Shender BS, Forster EM, Hrebien L, Ryoo HC, Cammarota JP Jr (2003), Acceleration-induced near loss of consciousness: The “A-LOC” syndrome. Aviation Space and Environmental Medicine, Vol 74, No 10, October 2003.
This study was conducted in a human centrifuge. It included nine participants who were exposed to rapid onset pulses of +6, +8 and +10 g. The initial pulse in each set lasted 0.25 seconds and the duration of each subsequent pulse was increased in 1, 0.5 or 0.25 second increments, depending on participant response, until they lost consciousness. The participants were not protected with any anti-G clothing. The study collected a variety of data including: observation of the participants’ physical symptoms; participants’ experience of loss of vision; performance on a simple mathematical task; reported emotional state and the change in cerebral tissue oxygenation.
In total the study included 161 positive G pulses. A-LOC symptoms were observed or reported in 66 of these. The observable and reported effects of A-LOC included a variety of physical, cognitive, emotional and ‘altered states of awareness’ symptoms. All participants who experienced A-LOC lost all vision (blackout) prior to the A-LOC episode. The cognitive symptoms documented were: confusion, amnesia, delayed recovery, difficulty forming words and disorientation. Participants gave an incorrect answer to the mathematical task
30© Crown copyright 2019 All times are UTC
AAIB Bulletin G-BXFI EW/C2015/08/04
31 out of 66 times during the A-LOC episodes. There was a difference in cerebral tissue oxygenation in the 66 A-LOC events compared to the asymptomatic G pulses.
The results of this study were not considered relevant to the G-BXFI accident because the levels of +Gz exposure were much higher than those experienced by the accident pilot.
Bibliography – Papers referenced by aeromedical experts regarding performance effects of low levels of +Gz exposure
Biernacki M.P., Tarnowski A., Lengsfeld K., Lewkowicz R., Kowalczuk K., Dereń M. (2013). +Gz load and executive functions. Aviation, Space and Environmental Medicine, 84(5): 511 – 515.
Biernacki M.P., Jankowski K.S., Kowalczuk K., Lewkowicz R., Dereń M. (2012). +Gz Centrifugation and Mood. Aviation, Space and Environmental Medicine, 83(2): 136–139.
Comrey A.L., Canfield A.A., Wilson R.C., Zimmerman W.S. (1951). The effect of increased positive radial acceleration upon perceptual speed ability. Journal of Aviation Medicine, 22(1): 60-64.
Dalecki M., Bock O., Guardiera S. (2010). Simulated flight path control of fighter pilots and novice subjects at +3 Gz in a human centrifuge. Aviation, Space and Environmental Medicine, 81(5): 484-488.
Dern S., Vogt T., Abeln V., Strüder H.K., Schneider S. (2014). Psychophysiological responses of artificial gravity exposure to humans. European Journal of Applied Physiology, 114(10): 2061-2071.
Levin B., Andersson J., Karlsson T. (2007). Memory performance during G exposure as assessed by a word recognition task. Aviation, Space and Environmental Medicine, 78(6):587–592.
McKinley R.A., Fullerton K.L., Tripp L.D. Jr, Goodyear C., Esken R.L. (2004). A Model of the Effects of Acceleration on a Pursuit Tracking Task. AFRL-HE-WP-TR-2005-0008; Air Force Research Laboratory, Wright-Patterson AFB.
Truszczynski O., Lewkowicz R., Wojtkowiak M., Biernacki M.P. (2014) Reaction time in pilots during intervals of high sustained G. Aviation, Space and Environmental Medicine, 85(11): 1114 – 11.

31© Crown copyright 2019 All times are UTC
AAIB Bulletin G-BXFI EW/C2015/08/04
GLOSSARY OF ABBREVIATIONS USED IN THIS SUPPLEMENT
3-D three-dimensionalα angle of attackAAIB Air Accidents Investigation BranchA-LOC almost loss of consciousnessamsl above mean sea levelASI air speed indicatorCAS calibrated airspeedCL coefficient of lift°C Celsiusdeg degrees (angle)EAS equivalent airspeedft feetg acceleration due to Earth gravityG acceleration due to aircraft manoeuvringGNSS Global Navigation Satellite SystemGS groundspeedGz acceleration normal to the flight path (“head to foot”)G-LOC G induced loss of consciousnesshh hours (in clock time, hh:mm:ss)hPa hectopascal (equivalent unit to millibar)Hz hertzIAS indicated airspeedISA International Standard AtmosphereKIAS knots indicated airspeedkt knot(s)m metre(s)mm minutes (clock time)PEC pressure error correctionQNH altimeter pressure setting to indicate elevation amsls second(s)ss seconds (clock time)TAS true airspeed
Published: 19 December 2019.