aade-03-ntce-57 a comparison of sag measurement … · equipment, and it is important to have an...
TRANSCRIPT

Copyright 2003 AADE Technical Conference This paper was prepared for presentation at the AADE 2003 National Technology Conference “Practical Solutions for Drilling Challenges”, held at the Radisson Astrodome Houston, Texas, April 1 - 3, 2003 in Houston, Texas. This conference was hosted by the Houston Chapter of the American Association of Drilling Engineers. The information presented in this paper does not reflect any position, claim or endorsement made or implied by the American Association of Drilling Engineers, their officers or members. Questions concerning the content of this paper should be directed to the individuals listed as author/s of this work.
Abstract Barite sag usually becomes an issue when drilling a high-angle hole, especially in deep water or through de-pleted reservoirs. With increasing frequency both condi-tions are encountered and anti-sag treatments can lead to elevated equivalent circulating density (ECD) and cir-culating losses. Narrow pressure windows demand pre-cision rheological control. Unfortunately, the tendency for anti-sag treatments to increase rheological properties and ECD defeats the intended positive effect on wellbore stability. Thus, understanding the relationship between sag and rheological properties is critical.
A number of tests were conducted with a well-characterized sag-prone field mud selected as a stan-dard for a comprehensive study. To control sag the field mud was treated with a variety of anti-sag additives and subjected to several types of sag tests using an array of semi-standard and non-standard benchtop devices. Cor-relations of barite sag among these test methods, as well as with various rheological parameters, were at-tempted to improve our ability to predict sag potential and aid design of fluids to reduce the settlement and sag problem. Introduction Barite sag is a potential problem associated only with weighted drilling fluids. It may cause well-control and lost-circulation problems in deviated and extended-reach drilling operations. Barite sag is related to and begins with barite settling, which may result in the formation of a barite bed in an inclined wellbore. Barite settling can occur under static or circulating conditions, or both, and is affected by mud density, rheological properties, tem-perature, hole angle, particle size of suspended solids, and other factors.
Sag in a high-angle wellbore can be effectively re-solved using fine-ground or soluble weight materials. Weight materials ground to a d50 below 2 microns have been evaluated. Very finely ground barite or hematite are essentially sag free and provide improved rheologi-cal properties. Grinding energy, time, and dusting prob-lems have blocked introduction of sub-API grind materi-als except in very special circumstances. Anti-sag addi-tives or drilling fluids which aid suspension of API barite or assist bed pickup continue to be a focus of work to resolve the settlement and sag problem.
Barite settlement and sag occurs to some degree at all mud densities but can be particularly intractable in relatively low-solids and low-density drilling fluids. Barite and cuttings settling and sag from fluids of 10 to 13 lb/gal are traditionally regarded as the most difficult to resolve. Many of the most commonly used additives available to the industry are least effective in this density range.
This paper will deal specifically with barite settling and sag but associated problems can occur even in un-weighted drilling fluids. Cuttings settling, deposition, and sag also respond to changes in drilling fluid characteris-tics. Y. Luo and P. Bern proposed a sag model1 which considers:
• Fluid viscosity (apparent viscosity on low side of hole)
• Particle size, shape, and density • Fluid density and buoyancy effects • Annular size and eccentricity • Gravitational force and hole angle • Annular flow and drag force • Pipe rotational effects • Friction force at wall
With all these components of complex settling and a sag model at work, a simple rheologically based correc-tion cannot be expected to be completely satisfactory. As described above fluid viscosity is only one of at least eight complex components which govern sag.
Barite sag is typically recognized in the field by lower-than-normal densities followed by higher-than-normal densities when circulating bottoms up after extended trip time, and/or by density variations on PWD (pressure-while-drilling) logs. However, it is desirable to quantify barite sag potential at the wellsite so that causes of sag can be corrected before it interferes with the drilling op-eration occurs.
Various methods have been devised to evaluate sag potential of a drilling fluid. Commonly used methods include but are not limited to: Sag Flow Loop Test (SFL),2 Viscometer Sag Test (VST),3 various rheological parameters,4 and centrifuged settling test.4
The Viscometer Sag Test and Rheological Measure-ments are convenient and most often used for field monitoring of barite sag. Rheological parameters, which
AADE-03-NTCE-57
A Comparison of Sag Measurement Methods and Implications for Additive Performance and Selection R.P. Schlemmer, J.L. Lee, J.E. Friedheim, and F.B. Growcock, M-I L.L.C.

2 R. Schlemmer, J. L. Lee, J.E. Friedheim and F. B. Growcock AADE-03-NTCE-57
include Low-Shear Rate Viscosity (LSRV)5 and visco-elasticity, are indirect measurements and do not reflect actual sedimentation or settling of barite. The most complex and arguably the most instructive test device, the Sag Flow Loop is confined to the laboratory due to size and complexity of equipment.
Mid-2002 while drilling an extended-reach well using a Non-Aqueous Fluid, or NAF, in deepwater Gulf of Mex-ico, troublesome mud density changes were measured. The density swings were observed in direct measure-ments of mud density before, during, and after “bottoms up” and also in PWD data collected while drilling imme-diately after trips. The cause of the density changes was attributed to the introduction of large amounts of freshly prepared mud and frequent mud density changes due to pre-trip additions of NAF base and API barite.
The field observations were seen to correlate closely with a Sag Flow Loop Test data performed on collected samples of the field drilling fluid. Transportation of mud to the lab and collection of data with the Sag Flow Loop required about 2 days per sample. The Sag Flow Loop Test requires a large amount of sample, time, and equipment, and it is important to have an alternative method for prediction of sag potential that may be ap-plied at wellsite.
A systematic study using several protocols was con-ducted on the as-received NAF. Tests in addition to Sag Flow Loop testing included:
• API rheological measurements • VST - viscometer sag testing • Low shear rheological measurement • Fluid shear stress relaxation analysis • Centrifugal sag acceleration test • RBC barite concentration using a proprietary
device.
The ultimate goal of the study was the selection or design of a test device and investigation of novel materi-als to reduce settlement and sag. Correlation of settling and sag measurements by each of the test devices or protocols with the Sag Flow Loop measurement was calculated in an attempt to select an optimum test method that may be easily and dependably applied in the field.
To evaluate the effects of various clays and chemi-cals on barite settling and sag, 55 gallons of the sag prone non-aqueous fluid were collected and transported to the laboratory for detailed testing. The ongoing study included evaluation of a variety of currently applied and potential settling/sag control materials. New test and chemical remedies were sought that could be applied with some immediacy for the resolution of what could develop into a technical service problem. Evaluation Fluid The field drilling fluid made available for this equipment
and additive evaluation was a used 13.0 lb/gal NAF re-covered from an 8500-ft TVD well. ECD concerns lim-ited Yield Point to 18 – 22 lb/100 ft2. Sag was evident in the initial laboratory evaluation. A drilling fluid properties summary report is included in Table 1. Test Methods The primary device used to measure barite sag potential of the field-conditioned synthetic mud was the Sag Flow Loop Tester, which has been described by Peter Bern, et al. in IADC/SPE 23884.2 Performance of the Sag Flow Loop has been well documented and similar equipment is now in use in other laboratories. The Sag Flow Loop tester allows the drilling fluid of interest to be circulated at flow rates varying from 0 to 26 gal/min (0 – 98.4 L/min) with pipe rotation varying from 0 to 210 rpm. The deposition and viewing segment of the flow loop tester can be adjusted to an angle between 0 and 90 degrees to simulate well angle. For this study, the angle was set at 60 degrees.
At the beginning of the Sag Flow Loop test, the fluid was first circulated at maximum flow rate with maximum pipe rotation for 10 min to ensure a thorough mixing of the fluid inside the flow loop. The fluid was then circu-lated at reduced flow rates (7.0 and 3.5 gal/min) for 10 and 100 min, respectively, with no pipe rotation to allow solids, primarily barite, to settle and sag. The long circu-lating period of 100 min at 3.5 gal/min provides sufficient time for any performance differences to be observed in each of the fluid additives tested.
Pipe rotation was initiated after 110 min to observe bed (primarily barite) “pick-up” over a range of rotation speeds and flow rates. At the completion of the test pro-tocol, the fluid was circulated for an additional 10 min at maximum pipe rotation and flow rate before shutting down the test.
At completion of the Sag Flow Loop test, a mud sam-ple was collected and tested using a variety of other pro-cedures. The sample material was retested using 6 ad-ditional distinctly different tests to develop a data set for comparison and correlation with the baseline Sag Flow Loop dataset.
The additional tests and measurements included the following:
• Fann 35 Viscometer rheometer measured all API rheological properties.
• The "VST", essentially a Fann 35 Viscometer with proprietary collection cup, was applied to model settling tendency by measurement of density gradient in the collection container.3
• Grace M3500 viscometer was evaluated for measurement of fluid properties at 0.1 rpm (0.17 sec-1).
• The “fluid relaxation time” feature of the Grace M3500 viscometer was evaluated for repeat-ability and applicability to settling and/or sag

AADE-03-NTCE-57 A Comparison of Sag Measurement Methods and Implications for Additive Performance and Selection 3
modeling. • A proprietary centrifuge (hand-crank) method
was evaluated to determine applicability for field testing of barite settling rate.
• An RBC, “rapid barite concentrator”7 is a pro-prietary conical bob and cup device. The RBC was evaluated to determine applicability for field testing of barite settling rate.
Summary procedures for the VST, relaxation time measurement, and the RBC test are provided in the Re-sults and Discussion section.
Results and Discussion Sag Flow Loop Tests - Of all the tests applied in this study only the Sag Flow Loop can visit each of the three previously described settlement and sag regimes with precise control of pipe positioning and rotation and coun-tercurrent mud flow. The loop contains a quantity of mud which can remain static or circulated through a cir-cuit which includes a circulating pump, flowmeter and densitometer, and a wellbore test-section containing a rotatable, eccentrically oriented drillpipe. A barite bed can be deposited on the lower side of the wellbore test section at any applicable selected angle of wellbore. Circulation and pipe rotation can be started or stopped as desired to observe effects on circulating mud density, mud mixing, or deposited bed pickup. The Sag Flow Loop Test is generally accepted as a device that can be configured to reasonably model the fluid flow of an ac-tual wellbore.
The Sag Flow Loop Test provides baseline data by which the quality of settling and/or sag evaluation by other devices and techniques is judged. Fig. 1 and Fig. 2 present typical barite settlement and sag curves before and after the NAF was treated with clay-based and polymeric additives to reduce barite settlement and sag. For this study, more than 50 Sag Flow Loop tests were run; a portion of the complete data set has been made available for this paper.
The slope of the settlement/sag curve and the actual change in density should be considered when judging the performance of the additives. For example, a steep slope with a profound change in density indicates rapid and severe barite settling; on the other hand, a flattened curve with a reduced density change indicates minimal barite settling.
The base mud without treatment produced a steep settlement/sag curve with a density reduction of 0.32 lb/gal after 100 min circulating at a flow-rate of 3.5 gal/min without pipe movement. A barite bed was formed under these conditions. Addition of clay-based or polymer-based additives can cause significant changes in the slope of the curve and magnitude of the mud-weight drop. The type and quantity of additives usually accompanied by intrinsic rheological change can
affect the barite settlement and sag. The ability to circulate mud and rotate a pipe over the
bed allows barite bed characteristics and mud-bed inter-actions to be investigated. In the base mud test the bar-ite bed was re-suspended rapidly upon rotation of the pipe, as indicated by the rapid increase in density 130 min and 150 min into the test.
Of the clay-based additives tested, the most effective treatment was Clay-A1. Experience has shown that or-ganophyllic clays similar to Clay-A1 require higher solids concentration than was available in the 13.0 lb/gal tested NAF to achieve optimum suspension of solids and facili-tate bed pickup.
Of the polymers tested, Polymer-A is the most effec-tive for reducing barite sag, followed by Polymer-VE, Polymer-T and Polymer-D.
However, under the solids content, density, tempera-ture, oil-water ratio, base fluid conditions, and other spe-cific characteristics of this particular NAF, the clay-based additives were generally less efficient than polymer-based additives. This is related to less-than-well under-stood polymer-solids interactions, such as adsorption onto solids, an ability to flocculate, or to in some other way bind solids. Apparently, certain species of polymer-based additives affect low-end rheological properties of a fluid through interactions with fine solids.
A graphical comparison of the performance of the clay-based and polymer-based additives is shown in Fig. 3 and Fig. 4. API Rheological Properties and VST - Rheological measurements demonstrated varying degrees of in-crease in "lower-end" (Fann 35 Viscometer 6-rpm and 3-rpm values) rheological properties and gel strength with addition of the candidate additives. Two novel materials, Polymer-T and Clay-A1, were judged as most effective.
Low-end rheological properties are traditionally held to have significant impact on barite sag control. How-ever, this study indicates that this widely held assump-tion may not be a universal truth. For example, Polymer-T at 2.0 lb/bbl provided the most significant increase in Fann 35 Viscometer 6-rpm and 3-rpm readings. Despite elevated 6 and 3-rpm measurements, addition of Poly-mer-T did not result in the lowest settlement and sag as measured by the Sag Flow Loop. This counter-intuitive response suggests that low-end rheological property enhancement cannot be, in and of itself, regarded as an effective correction for barite settlement and sag in every circumstance.
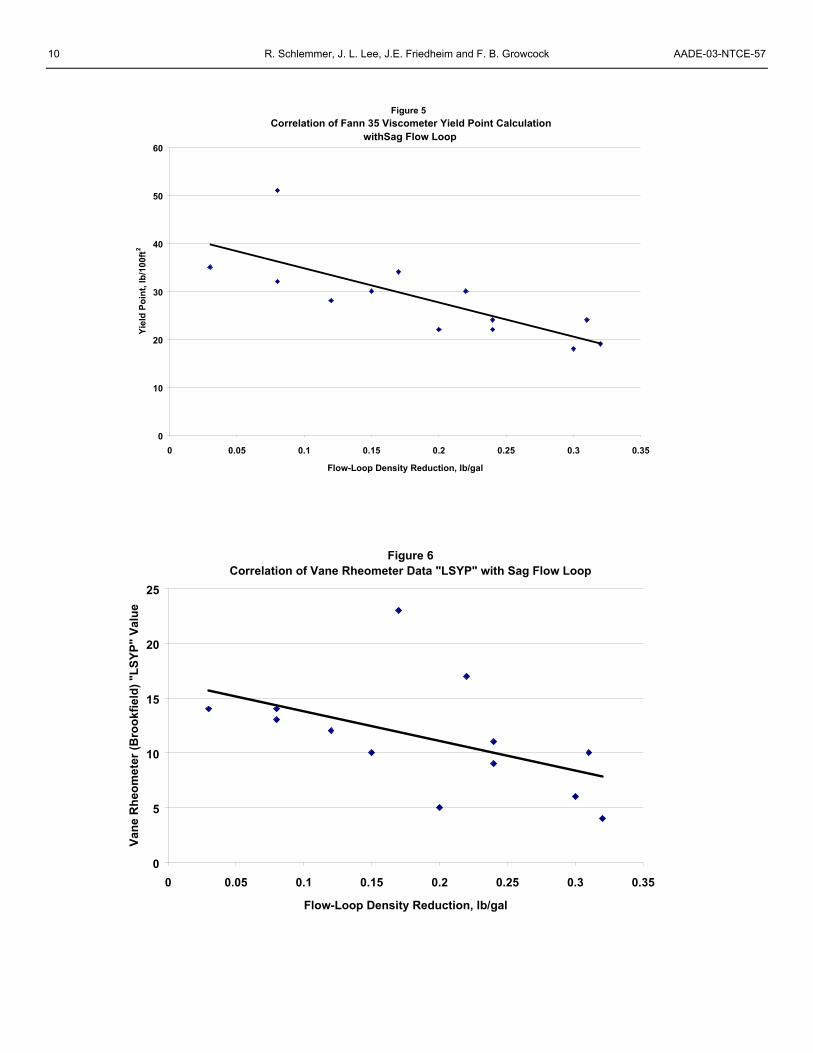
Correlation of the rheological properties and VST re-sults with Sag Flow Loop maximum mud density drop (or barite settlement/sag potential) are presented in Figs. 5 through 9.
A clear correlation was observed between the Sag Flow Loop test results and the Yield Point (YP) of the fluid. A similar correlation was observed with Plastic Viscosity (PV) which was not plotted. This correlation is not surprising; settling rate is a function of fluid viscosity.

4 R. Schlemmer, J. L. Lee, J.E. Friedheim and F. B. Growcock AADE-03-NTCE-57
These results are in general agreement with a recent laboratory study of dynamic sag in a deviated flow-tube,6 where it was shown that, under laminar conditions, barite sag in a deviated pipe correlates best with moderate- to high-shear rheology.
The correlation between Sag Flow Loop and VST data is only fair. The VST data exhibited considerable scatter, which was attributable to operator variation in measurement technique. This influenced correlation with the Sag Flow Loop data. Low Shear Rate (0.1-rpm) Viscosity - Since barite sag is a dynamic phenomenon occurring primarily under moderate-shear-rate conditions, raising the low-shear-rate viscosity and extending fluid relaxation time of a drilling fluid have been suggested as possible solutions to improve barite suspension, hence minimizing barite sag.
The 0.1-rpm (0.17-sec-1) viscosity and relaxation property of each test fluid was measured using a Grace M3500 viscometer. The fluid was first stirred at high shear rate for a few minutes at desired temperature; the shear rate was then reduced stepwise from 600 to 0.1 rpm. The 0.1-rpm viscosity was measured at this time before reducing rotation to 0 rpm.
Immediately upon full stop at 0 rpm, the change of shear stress (dial reading) with time in a 10-min period was recorded automatically at 1-sec intervals.
The results of 0.1-rpm viscosity measurement at 150°F using Grace M3500 viscometer are presented in Table 2. In general, the 0.1-rpm viscosity increased with the addition of treatment additives and the increase was proportional to the overall rheological increase observed at higher shear rates using Fann 35A viscometer at 150°F.
Limited correlation exists between the 0.1-rpm vis-cosity and sag test results as well as the 3-rpm readings of the fluids. In general, for a given additive, the sag reduction improves as the 0.1-rpm viscosity and low-end rheological property increases.
The correlation between 0.1-rpm viscosity and barite sag of all the test fluids is shown in Fig. 10. However, when comparing different additives, the absolute values of these properties do not correlate well with each other. The most significant increase in 0.1-rpm viscosity was observed with Polymer-T, while the most effective sag control additive Polymer-A demonstrated a moderate increase in 0.1-rpm reading. Zero rpm – Shear Stress Relaxation - Measurements of the fluid’s relaxation property were also carried out using Grace M3500 Viscometer at 150°F. As examples, the plots of dial readings as a function of elapsed time (10-min relaxation time at 0 shear rate) for the base fluid without any treatment and with treatment of Clay-A and Polymer-A are presented in Figs. 11 through 13.
For each relaxation curve, a power law equation can be generated for calculation of the half time of the total relaxation. Relaxation time was defined as the time re-
quired for the initial dial reading at 0 shear rate to de-crease to 50% of its initial value. The initial dial reading of each fluid at 0 shear rate and its calculated half time are given in Table 4.
In general, the relaxation time increased with increas-ing treatment level for each additive, indicating a possi-ble correlation between barite sag reduction and relaxa-tion property for a given additive. However, when all the test results were plotted against barite sag potential, the correlation was rather poor, suggesting that different additives have different mechanisms and effects on rheological properties and should be evaluated individu-ally as shown in Fig. 14. Centrifuge Settling Test - The Centrifuge Settling/Sag Test method increases barite settling by applying cen-tripetal acceleration to a mud sample in the centrifuge tube. The density profile in the centrifuge tube after cen-trifugation can be theoretically related to barite suspen-sion quality and used to estimate barite settling or sag tendency depending upon tube angle. Fig. 15 shows the density distribution of fluid inside centrifuge tube af-ter the fluid sample was rotated 5 revolutions in 5 sec-onds using a hand-cranked centrifuge.
The amount of the barite settled to the bottom of the centrifuge tube is a function of the viscosity of the fluid sample and the rotation applied for centrifugation. More barite would settle out if the viscosity of the fluid is low and/or if centripetal acceleration is high for a longer pe-riod.
Because the test was conducted manually, a precise control of the rotational speed was rather difficult, which could vary significantly from one operator to another. As a result, the centrifuge data showed more scattering in one series than the other. The correlation of barite sag potential with barite settling from the centrifuge test is shown in Fig. 16. Due to scattering of data, the correla-tion was not as good as expected.. Rapid Barite Concentrator - The Rapid Barite Concen-trator (RBC) sag tester consists of a specially designed aluminum conical bob and a matching cup, Fig. 17, i.e., rather than the concentric cylinder (couette) geometry that is typically used for standard mud property meas-urements. This new device uses concentric cone ge-ometry.3,7
The original version was fabricated as an attachment device for a Fann 35 Viscometer. The prototype and predecessor of the Barite Concentrator was specifically designed to measure dynamic sag at defined shear rates. A luer fill-valve was added to reduce air entrain-ment during the initial filling of the apparatus with fluid. Further refinements provide for a fixed cup-bob gap width and fixed axial alignment for significantly more ac-curate quantitative measurements.
During original 30-min evaluation tests, the bob was rotated at consistent 5 rpm by a gear-motor to induce

AADE-03-NTCE-57 A Comparison of Sag Measurement Methods and Implications for Additive Performance and Selection 5
barite settlement and sag into and through the conical section. Equipment design provides for a shear rate which ranges from 12 sec-1 to a mechanical ideal of 0 sec-1 at the apex as presented in Fig. 18. Sagged barite concentrates at the apex of the conical receiver and is sampled one or more times during the course of the test. The change in fluid density between the initial and final measurements of mud weight is used to grade the sag tendency of the test mud. Results of the RBC sag tests are shown in Table 5.
Barite settled in the upper conical regime will be ex-posed to shear which will also influence barite bed pickup. As the equilibrium shifts between barite deposi-tion and pickup on the 45° surface the density of dis-charged sample will be affected.
Correlation of the Sag Flow Loop and the Barite Con-centrator test is higher than correlations calculated for other techniques or devices presented in this paper. A 30-min collection time provided the highest calculated correlation as presented in Fig. 19.
The modified Barite Concentrator sag tester can be used as a screening tool to evaluate barite-sag tendency of drilling fluid at the wellsite and before running on the sag flow-loop tester. The device is currently being used in the field.
Summary and Conclusions
• The RBC sag test provides both an extended
flow regime and the ability to measure settle-ment and limited sag directly. It can be argued that the flow model is representative of the shear history experienced by settled and sagged barite.
• Maximum data correlation of any of the evalu-ated techniques to the Sag Flow Loop data was 0.80. Correlation was limited by the multiple flow regimes intrinsic to the Sag Flow Loop de-sign. Only the Sag Flow Loop provides an en-vironment for barite bed formation and slippage plus a variable countercurrent mud flow and pipe rotation to effect barite and solids bed pickup and re-suspension.
• Rheological properties recorded using the con-centric viscometer correlated surprisingly well with the barite sag measured using Sag Flow Loop tester. Yield point calculated from meas-urements taken at shear rates of 1022 sec-1 and 511 sec-1 provided highest correlation of all rheological measurements recorded. Low-end rheological property enhancement cannot be, in and of itself, regarded as an effective correc-tion for barite settlement and sag in every cir-cumstance.
• VST measurements collected using a viscome-ter and proprietary cup were inconsistent and
data scatter resulted in reduced correlation. This may represent poorly applied collection technique or fluid channeling into the sagged barite stratum.
• Unexpected but consistent variation of data ob-served in related categories of polymeric sag-control additives indicate that the qualities or characteristics of particular additives may pro-vide similar rheological properties by different mechanisms. For example, two related materi-als, as measured by the RBC, yield increasing sag with increase in concentration despite an increase in rheological properties. This sug-gests that rheological properties and sag can change due to increased solids interactions.
• Of tests available at the wellsite, rheological measurements may provide clues to barite set-tling potential. Only the RBC and to a lesser extent, the centrifuge and VST test, provide an actual measurement related to settled or sagged barite.
Acknowledgements
The authors wish to thank M-I L.L.C. for permission to publish this paper and Bob O’Connor and Burhan Hoxha for their patience and care in testing. A special thank you is extended to Gerry Meeten whose brilliantly simple design is fundamental to the RBC. Dr. Meeten is a Prin-cipal Scientist at Schlumberger Cambridge Research. It is recognised that the RBC is an evolutionary device which follows the "Jefferson VST". References 1. Luo, Y., Bern, P.A.. and Chambers, B.D.: "Flow-Rate
Predictions for Cleaning Deviated Wells," SPE 23884, IADC/SPE Drillling Conference, New Or-leans, Feb 18-21, 1992.
2. Bern, P.A., van Oort, E., Neussatadt, B., Ebeltoft, H., Zurdo, E. Zamora, M., and Slater, K.: “Barite Sag: Measurement, Modelling and Management,” SPE 47787, SPE/IADC Asia Pacific Drilling Conference, Jakarta, Indonesia, Sept. 7-9, 1998.
3. Jefferson, D.T.: “New Procedure Helps Monitor Sag in the Field,” ASME 91-PET-3, American Society of Mechanical Engineers Energy Sources Technical Conference, Houston, Jan 20-24, 1991.
4. Gao, E., Booth, M. and MacBeath, N.: “Continued Improvements on High-Pressure/High-Temperature Drilling Performance on Wells With Extremely Nar-row Drilling Windows - Experiences From Mud For-mulation to Operational Practices, Shearwater Pro-ject,” SPE 59175, SPE/IADC Drilling Conference, New Orleans, Feb. 23–25, 2000.
5. Aldea, C., Growcock, F.B., Lee, L.J., Friedheim, J.E., and van Oort, E.: "Prevention of Dynamic Sag in Deepwater Invert Emulsion Fluids," AADE 01-NC-

6 R. Schlemmer, J. L. Lee, J.E. Friedheim and F. B. Growcock AADE-03-NTCE-57
HO-51, AADE National Drilling Conference on ‘Drill-ing Technology – The Next 100 Years, Houston, Texas, March 27-29, 2001.
6. Skalle, P., Backe, K. R., Lyomov, S. K. and Sveen, J.: “Barite Segregation in Inclined Boreholes,” Paper
97-76, Journal of Canadian Petroleum Technology (1997).
7. Meeten, G.H.: “Dynamic Sag Monitor for Drilling Flu-ids,” US patent 6,330,826 (Dec. 18, 2001).
Table 1 - Maximum mud weight drop observed with each test fluid during Sag Flow Loop Test, along with rheology measurements and viscometer sag test (VST) results at 150F with Fann 35 viscometer
Base Mud
2.5 lb/bbl Clay-A1
5 lb/bbl Clay-A1
1 lb/bbl Clay-B
3 lb/bbl Clay-B
1 lb/bbl Poly-D
2 lb/bbl Poly-D
1 lb/bbl Poly-T
2 lb/bbl Poly-T
1 lb/bbl Poly-VE
3 lb/bbl Poly-VE
0.5 lb/bbl Poly-A
1 lb/bbl Poly-A
MW Drop (lb/gal) 0.32 0.20 0.08 0.31 0.15 0.31 0.22 0.24 0.17 0.24 0.08 0.12 0.03
6-rpm 8 11 15 8 14 12 19 13 25 11 18 14 18
3-rpm 7 8 14 6 12 11 18 12 24 10 16 13 16
PV (cP) 25 30 24 25 36 28 32 28 29 26 34 30 31 YP
(lb/100 ft2) 18 22 51 19 30 24 30 22 34 24 32 28 35
10-sec Gel (lb/100 ft2) 11 14 20 12 20 23 39 19 39 18 32 19 23
10-min Gel (lb/100 ft2) 19 22 30 18 28 32 48 24 43 30 44 26 32
VST (lb/gal) 1.22 1.31 1.39 0.97 0.78 0.97 0.94 0.85 0.62 1.15 0.9 1.17 0.63
Table 2 - 0.1-rpm viscosity measured with Grace M3500 Viscometer at 150°F.
Base Mud
2.5 lb/bbl Clay-A1
5 lb/bbl Clay-A1
1 lb/bbl Clay-B
3 lb/bbl Clay-B
1 lb/bbl Poly-D
2 lb/bbl Poly-D
1 lb/bbl Poly-T
2 lb/bbl Poly-T
1 lb/bbl Poly-VE
3 lb/bbl Poly-VE
0.5 lb/bbl Poly-A
1 lb/bbl Poly-A
0.1-rpm Vis (cP) 15258 22887 31396 17035 28490 24966 34072 35833 40826 27316 34368 31721 30252
Table 3 - Relaxation half-time, calculated as the time required to reach ½ To Grace 3500M Viscometer at 0 sec-1
Base Mud
2.5 lb/bbl Clay-A1
5 lb/bbl Clay-A1
1 lb/bbl Clay-B
3 lb/bbl Clay-B
1 lb/bbl Poly-D
2 lb/bbl Poly-D
1 lb/bbl Poly-T
2 lb/bbl Poly-T
1 lb/bbl Poly-VE
3 lb/bbl Poly-VE
0.5 lb/bbl Poly-A
1 lb/bbl Poly-A
Init. Dial Reading,
at To 3.78 4.47 5.67 3.23 4.51 4.21 6.51 5.41 8.47 5.08 4.31 3.49 6.01
Half Time (sec) 4.44 31.1 810 14.3 252 654 3250 7310 14570 39.5 187000 30 43

AADE-03-NTCE-57 A Comparison of Sag Measurement Methods and Implications for Additive Performance and Selection 7
Table 4 - Barite sag tendency as measured by using the Cone Viscometer Sag Tester. The amount of barite settled to the bottom of the cup is measured at 10-min intervals during the 30-min test. The sag
tendency is determined by using the mud weight difference between the initial and 30-min test results.
lb/gal Base Mud
2.5 lb/bbl Clay-A1
5 lb/bbl Clay-A1
1 lb/bbl Clay-B
3 lb/bbl Clay-B
1 lb/bbl Poly-D
2 lb/bbl Poly-D
1 lb/bbl Poly-T
2 lb/bbl Poly-T
1 lb/bbl Poly-VE
3 lb/bbl Poly-VE
0.5 lb/bbl Poly-A
1 lb/bbl Poly-A
Initial density 13.0 13.1 13.1 13.1 13.1 13.1 13.0 13.0 13.0 13.0 13.1 13.1 13.0
10-min density 13.4 13.7 13.3 13.9 13.6 13.5 13.7 13.4 13.5 13.5 13.4 13.2 13.5
20-min density 14.5 14 14.4 15.1 14.3 15.3 14.9 14.6 14.8 15 15 13.9 13.6
30-min density 15.2 14.5 14.4 15.9 15.4 16.0 15.2 15.3 15.3 15.9 15.4 14.8 14.1
barite sag 2.2 1.4 1.3 2.8 2.3 2.9 2.2 2.3 2.3 2.9 2.3 1.7 1.1
Table 5. Correlation of Various
Rheological and Sag Measurements with Sag Flow Loop Test Results
(Correlation Coefficient calculated using Microsoft Excel Trend Analysis Tool)
Correlation Comparison Flow Loop 1.00 RBC100°F 0.80 RBCRT 0.68 YP 0.58 VST 0.51 Centrifuge 0.40 PV 0.21 Gel 10-sec 0.15 Gel 10-min 0.11 T-1/2 0.06

8 R. Schlemmer, J. L. Lee, J.E. Friedheim and F. B. Growcock AADE-03-NTCE-57
Figure 2
Change of Barite Sag Tendencyafter Treatment with Polymer-Based Additives
12.55
12.60
12.65
12.70
12.75
12.80
12.85
12.90
12.95
13.00
0 30 60 90 120 150 180Time, minutes
Dril
ling
Flui
d D
ensi
ty, l
b/ga
l
Field Mud
Field Mud + 2 lb/bbl Poly T
Field Mud + 2 lb/bbl Poly D
Field Mud + 1 lb/bbl Poly A
Field Mud + 3 lb/bbl Poly VE
Figure 1Barite Sag Tendency
C lay-Based Additives
12.55
12.60
12.65
12.70
12.75
12.80
12.85
12.90
12.95
13.00
0 30 60 90 120 150 180 210Tim e, m in
Mud
Den
sity
, lb/
gal
F ie ld M udField M ud + C lay A1Field M ud + C lay B

AADE-03-NTCE-57 A Comparison of Sag Measurement Methods and Implications for Additive Performance and Selection 9
Figure 3 Reduction of Barite Sag by Clay Based Additives
Measured Using Flow Loop
0%
10%
20%
30%
40%
50%
60%
70%
80%
90%
100%
Base - 0 Clay B - 1.0 Clay A1 - 2.5 Clay B - 3.0 Clay A1 - 5.0
Red
uctio
n in
Sag
- Fl
ow L
oop
Clay Type and Addition, lb/bbl
Figure 4 Reduction is Barite Sag by Polymer Additives
Measured Using Flow Loop
0%
10%
20%
30%
40%
50%
60%
70%
80%
90%
100%
Base - 0 D - 1.0 VE - 1.0 T - 1.0 D - 2.0 T - 2.0 A - 0.5 VE - 3.0 A - 1.0
Polymer Type and Addition, lb/bbl
Red
uctio
n in
Sag
- Fl
ow L
oop
10 R. Schlemmer, J. L. Lee, J.E. Friedheim and F. B. Growcock AADE-03-NTCE-57
Figure 5 Correlation of Fann 35 Viscometer Yield Point Calculation
withSag Flow Loop
0
10
20
30
40
50
60
0 0.05 0.1 0.15 0.2 0.25 0.3 0.35
Flow-Loop Density Reduction, lb/gal
Yiel
d Po
int,
lb/1
00ft
2
Figure 6Correlation of Vane Rheometer Data "LSYP" with Sag Flow Loop
0
5
10
15
20
25
0 0.05 0.1 0.15 0.2 0.25 0.3 0.35
Flow-Loop Density Reduction, lb/gal
Vane
Rhe
omet
er (B
rook
field
) "LS
YP"
Valu
e

AADE-03-NTCE-57 A Comparison of Sag Measurement Methods and Implications for Additive Performance and Selection 11
Figure 7 Correlation of Fann 35 Viscometer 3-rpm Measurement
with Sag Flow Loop
0
5
10
15
20
25
30
0 0.05 0.1 0.15 0.2 0.25 0.3 0.35Flow-Loop Density Reduction, lb/gal
Fann
35
3-rp
m re
adin
g, °
defle
ctio
n
Figure 8Correlation of Fann 35
10 Second Gel Measurement with Sag Flow Loop
0
10
20
30
40
50
60
0.00 0.05 0.10 0.15 0.20 0.25 0.30 0.35
Flow-Loop Density Reduction, lb/gal
10 s
econ
d ge
l (3
rpm
), lb
/100
ft2

12 R. Schlemmer, J. L. Lee, J.E. Friedheim and F. B. Growcock AADE-03-NTCE-57
Figure 9 Correlation of VST Data with Sag Flow Loop
0.40
0.60
0.80
1.00
1.20
1.40
1.60
0 0.05 0.1 0.15 0.2 0.25 0.3 0.35Flow-Loop Density Reduction, lb/gal
VST
Mea
sure
men
t, lb
/gal
Figure 10Correlation of Grace Viscometer 0.1 rpm Indication
with Sag Flow Loop
0
5000
10000
15000
20000
25000
30000
35000
40000
45000
0.00 0.05 0.10 0.15 0.20 0.25 0.30 0.35
Flow-Loop Density Reduction, lb/gal
Visc
osity
, cP

AADE-03-NTCE-57 A Comparison of Sag Measurement Methods and Implications for Additive Performance and Selection 13
Figure 11 Fluid Relaxation Curve at 0-rpm, 150°F
Base Mud
0
1
2
3
4
5
6
7
8
9
10
0 100 200 300 400 500 600 700
Time, seconds
Dia
l Rea
ding
, ° d
efle
ctio
n
Figure 12Fluid Relaxation Curve at 0-rpm, 150°F
with 5 ppb Clay-A
0
1
2
3
4
5
6
7
8
9
10
0 100 200 300 400 500 600 700Time, seconds
Dia
l Rea
ding
, ° d
efle
ctio
n
Figure 13 Fluid Relaxation Curve at 0-rpm, 150°F
With 1 ppb Polymer-A
0
1
2
3
4
5
6
7
8
9
10
0 100 200 300 400 500 600 700Time, seconds
Dia
l Rea
ding
, ° d
efle
ctio
n

14 R. Schlemmer, J. L. Lee, J.E. Friedheim and F. B. Growcock AADE-03-NTCE-57
Figure 15 Fluid Density inside Centrifuge Tube after Centrifugation
9.0
11.0
13.0
15.0
17.0
19.0
21.0
23.0
2ml (top) 4ml 6ml 8ml 10ml (bottom)Fluid inside centrifuge tube (from top to bottom)
Flui
d D
ensi
ty, l
b/bb
l
Figure 14 Correlation of Relaxation Half Time with Sag Flow Loop
1.0E+00
1.0E+01
1.0E+02
1.0E+03
1.0E+04
1.0E+05
1.0E+06
0 0.05 0.1 0.15 0.2 0.25 0.3 0.35
Flow-Loop Density Reduction, lb/gal
Rel
axat
ion
Hal
f Tim
e, s
econ
ds

AADE-03-NTCE-57 A Comparison of Sag Measurement Methods and Implications for Additive Performance and Selection 15
Figure 17. Image of the Cone Viscometer Sag Tester consisting of a motor-driven solid aluminum bob with a conical bot-tom and a matching aluminum cup (right picture). Approximately 45-mL mud is injected from the bottom of the cup using a 60-mL syringe, and the bob is rotated at 5 rpm during the Sag Test. Fluid samples of 2 mL are taken out from the bot-tom to measure barite sag at 10-min intervals for a total test time of 30 min (left picture).
Figure16 Correlation of Centrifuge Test Results with Sag Flow Loop
4.0
5.0
6.0
7.0
8.0
9.0
10.0
0 0.05 0.1 0.15 0.2 0.25 0.3 0.35
Flow-Loop Density Reduction, lb/gal
Cen
trifu
ge F
luid
Den
sity
, lb/
gal

16 R. Schlemmer, J. L. Lee, J.E. Friedheim and F. B. Growcock AADE-03-NTCE-57
Figure 18 Shear Rate vs Bob Position
RBC Sag Test Device
0.0
2.0
4.0
6.0
8.0
10.0
12.0
14.0
Begin Angle -Mud Inlet
13.4 mm 26.9 mm 40.3 mm Sag Apex -Discharge Port
Postion on Conical Bob
Shea
r Rat
e, s
ec-1
Figure 19 Correlation of RBC Device with Sag Flow Loop
12
12.5
13
13.5
14
14.5
15
15.5
16
16.5
0.00 0.05 0.10 0.15 0.20 0.25 0.30 0.35
Flow-Loop Density Reduction, lb/gal
RB
C D
isch
arge
Den
sity
, lb/
gal
10-minute data 20-minute data 30-minute data