aac accepts, published online ahead of print on 24...
TRANSCRIPT

Page 1 of 36
The Effect of Half-Life on the Pharmacodynamic Index of Zanamivir Against Influenza Virus as 1
Delineated by a Mathematical Model 2
3
Ashley N. Brown, Jürgen B. Bulitta, James J. McSharry, Qingmei Weng, Jonathan R. Adams, 4
Robert Kulawy and George L. Drusano*. 5
6
7
Virology Therapeutics and Pharmacodynamics Laboratory 8
Center for Biodefense and Emerging Infections 9
Ordway Research Institute 10
Center for Medical Sciences 11
150 New Scotland Avenue 12
Albany, New York 12208 13
14
*Corresponding Author: George L. Drusano, M.D. 15
Phone #: 518-641-6410 16
FAX #: 518-641-6304 17
18
e-mail: [email protected] 19
Copyright © 2011, American Society for Microbiology and/or the Listed Authors/Institutions. All Rights Reserved.Antimicrob. Agents Chemother. doi:10.1128/AAC.01629-10 AAC Accepts, published online ahead of print on 24 January 2011
on May 21, 2018 by guest
http://aac.asm.org/
Dow
nloaded from

Page 2 of 36
Abstract 20
Intravenous zanamivir is recommended to treat hospitalized patients with oseltamivir-21
resistant complicated influenza virus infections. In a companion paper, we showed that 22
Time>EC50 is the pharmacodyanmic index predicting inhibition of viral replication by 23
intravenous zanamivir. However, for other neuraminidase inhibitors AUC/EC50 is the most 24
predictive index. Our objectives are to 1) explain the dynamically linked variable of intravenous 25
zanamivir by using different half-lives and 2) develop a new, mechanism-based population 26
pharmacokinetic/pharmacodynamic model for the time course of viral load. We conducted dose 27
fractionation studies in the HFIM system with zanamivir against an oseltamivir-resistant 28
influenza virus. A clinical 2.5h and an artificially prolonged 8h half-life were simulated for 29
zanamivir. Both had equivalent AUC0-24h of zanamivir. Viral loads and zanamivir 30
pharmacokinetics were co-modeled using data from the present study and a previous dose range 31
experiment via population PK/PD modeling in S-ADAPT. Dosing Q8h suppressed viral load 32
better than dosing Q12h and Q24h at the 2.5h half-life, whereas all regimens suppressed viral 33
growth similarly at the 8h half-life. The model provided unbiased and precise individual 34
(Bayesian) (r2>0.96) and population fits (Pre-Bayesian) (r
2>0.87) for log10 viral load. Zanamivir 35
inhibited viral release (IC50: 0.0168 mg/L, maximum extent of inhibition: 0.990). We identified 36
AUC/EC50 as the pharmacodynamic index for zanamivir at the 8h half-life, whereas T>EC50 best 37
predicted viral suppression at the 2.5h half-life, since the trough concentrations approached the 38
IC50 for the 2.5h but not for the 8h half-life. The model explained data at both half-lives and 39
holds promise for optimizing clinical zanamivir dosage regimens. 40
on May 21, 2018 by guest
http://aac.asm.org/
Dow
nloaded from

Page 3 of 36
Introduction 41
In April 2009, a novel swine origin influenza A (H1N1) virus was identified in California 42
(14, 17, 20, 21, 23). This virus spread rapidly throughout the population causing the World 43
Health Organization to declare a pandemic in July 2009. Initial drug susceptibility assays 44
indicated that clinical isolates of pandemic H1N1 (pH1N1) influenza virus were completely 45
resistant to amantadine and rimantadine, but remained generally susceptible to the neuraminidase 46
inhibitors, oseltamivir and zanamivir (12). However, as the pandemic progressed, the detection 47
of oseltamivir-resistant pH1N1 viruses became more frequent (9-13). The spread of dually-48
resistant pH1N1 viruses would likely jeopardize successful therapy and spur a public health 49
crisis. Thus, there is an urgent need to design innovative dosing strategies with alternative 50
antiviral compounds that will be effective against influenza viruses that are resistant to 51
oseltamivir. 52
Although zanamivir and oseltamivir belong to the same drug class, zanamivir interacts 53
with the neuraminidase active site in a very different manner than oseltamivir (24). As a result, 54
mutations in the neuraminidase gene that cause resistance to oseltamivir do not affect viral 55
susceptibility to zanamivir. Therefore, zanamivir is a viable therapeutic option for the treatment 56
of oseltamivir-resistant influenza. In order to use zanamivir effectively, the pharmacodynamics 57
of the compound must be understood. In a companion paper, we have shown that for i.v. 58
zanamivir the pharmacodynamic index linked with suppression of viral replication is Time>EC50 59
(5). This parameter is different from that of other neuraminidase inhibitors, as illustrated by our 60
previous findings showing that the area under the concentration time curve (AUC) to EC50 ratio 61
(AUC/EC50) is the pharmacodynamic index for oseltamivir and peramivir (16, 22). Our first 62
objective was to assess whether the dynamically-linked index for zanamivir changes from 63
on May 21, 2018 by guest
http://aac.asm.org/
Dow
nloaded from

Page 4 of 36
Time>EC50 to AUC/EC50 in the hollow fiber infection model, if zanamivir is eliminated with an 64
oseltamivir-like half-life of 8 h instead of the 2.5h half-life for zanamivir. As our second 65
objective, we sought to develop a new, mechanism-based population 66
pharmacokinetic/pharmacodynamic (PK/PD) model that describes the time course of viral load. 67
(This work was presented in part at the 2010 Annual Meeting of the Interscience Conference on 68
Antimicrobial Agents and Chemotherapy in Boston, MA.) 69
70
on May 21, 2018 by guest
http://aac.asm.org/
Dow
nloaded from

Page 5 of 36
Materials and Methods 71
Viruses and Cells: The oseltamivir-resistant pandemic 2009 H1N1 Influenza A/Hong 72
Kong/2369/2009 (A/Hong Kong [H275Y]) was provided by U.S. Centers for Disease Control 73
and Prevention (Atlanta, GA). Viral stocks were propagated in Madin-Darby canine kidney 74
(MDCK) cells, as previously described (6), aliquoted, and stored at -80°C. MDCK cells (ATCC 75
#CCL-34) were obtained from the American Type Culture Collection (Manassas, VA) and 76
grown in minimal essential medium (MEM) [supplemented with 10% fetal bovine serum (FBS), 77
non-essential amino acids, 2 mM L-glutamine, 1 mM sodium pyruvate, 100 U/ml of penicillin, 78
100µg/ml of streptomycin, and 1.5 g/L sodium bicarbonate] at 37°C and 5% CO2. 79
Compound: Zanamivir was provided by GlaxoSmithKline (Philadelphia, PA). Drug was 80
reconstituted in sterile distilled water to a final concentration of 10 mg/ml, filter-sterilized 81
through a 0.2 micron filter, and aliquots were stored at -80°C. 82
Plaque Assay: Plaque assays were performed as previously described (19) and used to titrate 83
viral stocks and assess viral burden in experimental samples. Briefly, serial 10-fold dilutions 84
were performed on viral samples in virus growth medium (VGM) [MEM, 0.2% final 85
concentration of bovine serum albumin (BSA) (Sigma-Aldrich, Inc), 2 ug/ml of L-1-(tosyl-86
amido-2-phenyl)ethyl chloromethyl ketone (TPCK)-treated trypsin (Sigma-Aldrich, Inc), 100 87
U/ml of penicillin, and 100µg/ml of streptomycin]. Confluent MDCK cell monolayers in 6-well 88
culture plates were washed twice with VGM and inoculated with 100 µl of diluted virus. Each 89
dilution was tested in duplicate. Plates were incubated for two hours at 36°C, 5% CO2 and 90
rocked every 15 minutes. The inoculum was removed and a primary overlay (MEM, 0.5% agar, 91
1% DEAE-dextran, 0.2% BSA, 2 µg/ml TPCK-treated trypsin, 100 U/ml of penicillin, and 92
on May 21, 2018 by guest
http://aac.asm.org/
Dow
nloaded from

Page 6 of 36
100µg/ml of streptomycin) was added to each well (4 mls/well) and incubated for two to three 93
days at 36°C, 5% CO2. Following the incubation period, virus was inactivated by fixing each 94
well with 10% formaldehyde for at least 2 hrs at room temperature. The agar overlay was 95
removed from all wells and cell monolayers were stained with a crystal violet solution (70% 96
ethanol and 0.8% crystal violet). Visible plaques were counted with the naked eye. 97
Drug Susceptibility Assays: Two different methods were used to determine the susceptibility 98
of A/Hong Kong to zanamivir: the plaque inhibition assay and the neuraminidase (NA) 99
inhibition assay. The plaque inhibition assay was performed as previously described (19, 22). In 100
brief, confluent MDCK cell monolayers were washed twice with VGM and virus was inoculated 101
onto cell monolayers at an MOI of 0.0001. Following a 2 hour absorption period at 36°C, 5% 102
CO2, the viral inoculum was removed and cells were overlayed with VGM containing various 103
concentrations of zanamivir. Cells were observed daily for cytopathic effect (CPE). Cell 104
supernatants were harvested at 24 hrs post-inoculation, clarified by high-speed centrifugation 105
(21,130 x g for 5 mins), and frozen at -80°C until further use. The effective zanamivir 106
concentration required to reduce the number of plaques by 50% (EC50), relative to untreated 107
controls, was determined by plaque assay of harvested supernatants. The EC50 values were 108
calculated using GraphPad Prism software (GraphPad, LaJolla, CA). 109
NA inhibition assays were performed as described by Gubareva et al. (18). Briefly, the 110
NA activity of the virus was determined prior to NA inhibition assays. Two-fold dilutions of 111
virus were placed in a black opaque 96-well plate and incubated with the fluorigenic substrate 112
2’-(4-Methylumbelliferyl)-a-D-N-acetylneruaminic acid, sodium salt (MUNANA; Sigma, St. 113
Louis,MO) for 30 mins on an orbital shaker (75-100 RPM) at 37°C in the dark. After 30 mins, 114
the reaction was stopped by adding stop solution (80% ethanol and 20% NaOH) to all wells. NA 115
on May 21, 2018 by guest
http://aac.asm.org/
Dow
nloaded from

Page 7 of 36
activity was evaluated using a Synergy HT multi-detection microplate reader (BioTek, 116
Winooski, VT) at an excitation wavelength of 365 nm and an emission wavelength of 460 nm. 117
For NA inhibition assays, various concentrations of zanamivir were incubated with the 118
appropriate concentration of virus, as determined from the NA activity assay, in a black opaque 119
96-well plate on an orbital shaker for 30 mins at 37°C in the dark. The MUNANA substrate was 120
then added to the plates and incubated for an additional hour under the same conditions. NA 121
activity of the virus in the presence of zanamivir was evaluated following the addition of stop 122
solution. The EC50 value, or concentration of zanamivir that reduced NA activity of A/Hong 123
Kong to that of 50% of untreated controls, was calculated using GraphPad Prism software. 124
Hollow Fiber Infection Model (HFIM) System: We used the HIFM system to study the 125
response of the oseltamivir-resistant pandemic H1N1 Influenza A virus, A/Hong Kong [275Y], 126
to zanamivir exposures. The use of the HFIM system for Influenza A viruses has been 127
previously described (6, 22). Briefly, 102 MDCK cells infected with H1N1 A/Hong Kong 128
Influenza virus were mixed with 108 uninfected MDCK cells in 25 ml of VGM and inoculated 129
into the extra capillary space (ECS) of several hollow fiber (HF) cartridges (FiberCell Systems, 130
Frederick, MD). The 24 hr area under the concentration time curve (AUC) for a 1200 mg per 131
day exposure of zanamivir were delivered into HF units as either the total 24 hr AUC exposure 132
once a day (Q24), one-half the 24 hr AUC exposure twice a day (Q12), or one-third the 24 hr 133
AUC exposure three times a day (Q8h). One cartridge did not receive zanamivir and served as a 134
no-treatment control. Each dose was infused into the system over one hour via programmable 135
syringe pumps. In this study, two different half-lives of 2.5 hr and 8 hr were simulated for 136
zanamivir to determine if the PK/PD index varied with the duration of half-life. The 2.5 hr half-137
life was chosen based on human PK data reported for i.v. zanamivir in healthy human volunteers 138
on May 21, 2018 by guest
http://aac.asm.org/
Dow
nloaded from

Page 8 of 36
(7). A half-life of approximately 8 hr has been described for oseltamivir (15), thus, we selected 139
this value to represent the artificially prolonged half-life of zanamivir. PK samples were 140
harvested from the central reservoir at various times points during the first 48 hr and quantified 141
by LC-MS/MS to ensure that the desired concentration-time profiles for zanamivir were 142
achieved. During the 5 day study, the ECS from each HF unit was sampled daily from the left 143
and right sampling ports to elucidate the effect of zanamivir on viral burden over time. All ECS 144
samples were harvested, centrifuged for 5 minutes at 10,000 x g to remove any cellular debris, 145
and frozen at -80°C until the end of the study. The amount of virus in each sample was 146
determined by plaque assay on MDCK cells. 147
Zanamivir concentration determination. Media samples were diluted with HPLC water 148
(0.050mL sample into 1.0mL water), and were analyzed by high pressure liquid chromatography 149
tandem mass spectrometry (LC/MS/MS) for Zanamivir concentrations. The LC/MS/MS system 150
was comprised of a Shimadzu Prominence HPLC system and an Applied Biosystems/MDS Sciex 151
API5000 LC/MS/MS. 152
Chromatographic separation was performed using a Thermo Scientific Hypersil Gold 153
C-18 column, 150 x 4.6 mm, 5µm column and a mobile phase consisting of 90% 10mM 154
ammonium acetate and 10% acetonitrile, at a flow rate of 0.75 mL/min. 155
Zanamivir concentrations were obtained using LC/MS/MS monitoring the MS/MS 156
transition m/z 333 → m/z 60. Analysis run time was 3.5 minutes. The assay was linear over a 157
range of 0.05 – 20.0 µg/ml (r2 > 0.997). The inter-day CVs for the quality control samples 158
analyzed in replicates of three at three concentrations on each analysis day (0.100, 1.00, and 10.0 159
µg/mL) were 7.12% or less with accuracies (%REC) ranging between 95.2% to 107% . 160
161
on May 21, 2018 by guest
http://aac.asm.org/
Dow
nloaded from

Page 9 of 36
Mathematical modeling. We developed a new mechanism-based population PK/PD model to 162
simultaneously describe host cell dynamics, viral replication, and PK of zanamivir (Fig. 1). The 163
model contained compartments for uninfected host cells, infected host cells, intracellular virus, 164
extracellular virus, and the amount of zanamivir. 165
Host cell dynamics: Uninfected host cells (U) were assumed to be infected by extracellular virus 166
(Vextra) via a second order process with an infection rate constant kinfect. Models with a saturable 167
rate of infection described by a Michaelis-Menten function were considered. Both uninfected and 168
infected (I) host cells were assumed to not replicate under the chosen experimental conditions. 169
Infected host cells were assumed to die with a first order death-rate constant (kdeath). Initial 170
conditions (IC) were fixed to the targeted initial inoculum of 108 for the total hollow fiber 171
cartridge for uninfected host cells and of 102 for infected host cells. Differential equations were: 172
UVkdt
Udextrainfect ⋅⋅−= IC: 108 cells (1) 173
Ik-UVkdt
Iddeathextrainfect ⋅⋅⋅= IC: 102 cells (2) 174
Viral replication: New intracellular virus (Vi) was generated by infected host cells with a first-175
order synthesis rate constant (ksyn). Viral replication involves multiple steps including uncoating 176
of RNA, translocation into the nucleus, RNA replication, transcription of RNA to mRNA, 177
translocation of mRNA into cytoplasm, translation of mRNA into proteins, virion synthesis, and 178
egress of synthesized virus from the cell. We did not measure intermediates involved in these 179
intracellular processes. To empirically describe the time delay between infection of host cells and 180
release of virus due to the various stages of intracellular replication, we included a series of 181
on May 21, 2018 by guest
http://aac.asm.org/
Dow
nloaded from

Page 10 of 36
transit compartments linked by a transit rate constant ktr. Models with zero to 15 transit 182
compartments were explored. Depending on the number of transit compartments, the time 183
‘delay’ between entry of virus into a host cell and egress of virus takes different shapes. 184
In the final model, the five stages are called intracellular virus 1 to 5 (Vi1, Vi2, Vi3, Vi4, and 185
Vi5). As the number of infected host cells were negligible compared to uninfected cells (102 vs. 186
108 cells) and as extracellular virus and infected host cells were undetectable at 0 h, initial 187
conditions of Vi1 to Vi5 were set to 0. Differential equations for intracellular virus are: 188
i1deathi1trsyni1 VkVkIk
dt
Vd⋅−⋅−⋅= IC: 0 PFU/mL (3) 189
( ) i2deathi2i1tri2 VkVVk
dt
Vd⋅−−⋅= IC: 0 PFU/mL (4) 190
( ) i3deathi3i2tri3 VkVVk
dt
Vd⋅−−⋅= IC: 0 PFU/mL (5) 191
( ) i4deathi4i3tri4 VkVVk
dt
Vd⋅−−⋅= IC: 0 PFU/mL (6) 192
( ) i5deathi5i4tri5 VkVINHVk
dt
Vd⋅−⋅−⋅= IC: 0 PFU/mL (7) 193
We assumed that death of an infected host cell also causes loss of the respective intracellular 194
virus components, since the intracellular viral components were assumed to be incomplete. A 195
first-order death rate constant kdeath was included for intracellular virus for Vi1 to Vi5. The 196
inhibition (INH) term in the equation for Vi5 represents the effect of zanamivir. We considered 197
alternative models lacking death of intracellular virus. 198
on May 21, 2018 by guest
http://aac.asm.org/
Dow
nloaded from

Page 11 of 36
Extracellular virus (Vextra) is the result of the egress of intracellular virus from the last 199
intracellular virus compartment (Vi5) and was assumed to be subject to a first-order loss rate 200
constant (kloss,Vextra). The latter represents degradation of virus in medium due to temperature 201
sensitivity (10). Initial condition for extracellular virus was set to zero, because the inoculum 202
was free of intracellular virus. The initial condition for extracellular virus was estimated for 203
alternative models. 204
extraVextraloss,i5trextra VkVINHk
dt
Vd⋅−⋅⋅= IC: 0 PFU/mL (8) 205
Drug effect: Zanamivir inhibits release of virions from infected host cells. Drug effect was 206
modeled as inhibition of release of mature virions from compartment Vi5 by an inhibitory Hill-207
equation with maximum extent of inhibition (Imax) and the zanamivir concentration causing 208
50% of Imax (IC50): 209
Hill50
HillZanamivir
HillZanamivir
ICC
CImax1INH
+⋅−= (9) 210
The differential equation for the amount of zanamivir (AZanamivir) was: 211
ZanamivirZanamivir A
V
CLateInfusion_r
dt
Ad⋅−= IC: 0 mg/L (10) 212
The zanamivir concentration is AZanamivir / V with V representing the volume of medium in the 213
central reservoir. As the hollow fiber system has a rapid inter-compartmental clearance between 214
the central reservoir and the hollow fiber cartridge and as the surface area (approximately 0.3 m2) 215
available for equilibration between both compartments is large, we used a simplified one-216
on May 21, 2018 by guest
http://aac.asm.org/
Dow
nloaded from

Page 12 of 36
compartment instead of a two-compartment model to describe the PK of zanamivir. Figure 1 217
summarizes the structure of the full model. 218
System outputs and residual error model: The model contained the logarithm of plaque forming 219
units per mL (log10 [PFU/mL]) and the zanamivir concentration as dependent variables. In the 220
plaque assay, each extracellular virus forms one plaque that is counted as described above. To 221
account for samples below the quantification limit for the plaque assay at time zero, we 222
employed the Beal M3 method (2) in the population PK/PD modeling. We used an additive 223
residual error on log10 scale for the PFU/mL data and an additive plus proportional residual error 224
for zanamivir concentrations. 225
Parameter variability model: An exponential parameter variability model was employed. A 226
logistic transformation was employed to constrain the individual Imax estimates between 0 and 1 227
and Imax was assumed to be normally distributed on transformed scale. Parameters estimated on 228
log10 scale were assumed to be normally distributed. 229
Model qualification: Individual curve fits, individual and population fitted versus observed 230
plots, and normalized prediction distribution error (NPDE) plots (4) were used to assess the 231
goodness of curve fits and predictive performance. Models were compared based on these 232
diagnostic plots, the objective function (-2 • log-likelihood), and the plausibility of parameter 233
estimates. 234
Software and algorithm: For nonlinear mixed-effects modeling, we employed the Monte-Carlo 235
Parametric Expectation Maximization method (MC-PEM) with the pmethod=4 option for 236
importance sampling in S-ADAPT (version 1.56). Normalized prediction distribution errors were 237
on May 21, 2018 by guest
http://aac.asm.org/
Dow
nloaded from

Page 13 of 36
computed in S-ADAPT (version 1.57 beta). An automated translator, debugging, and plotting 238
tool (SADAPT-TRAN) was utilized for efficient model coding and development. 239
on May 21, 2018 by guest
http://aac.asm.org/
Dow
nloaded from

Page 14 of 36
Results 240
Susceptibility to zanamivir. We evaluated the antiviral activity of zanamivir against A/Hong 241
Kong (H275Y), an oseltamivir-resistant 2009 pandemic H1N1 influenza virus strain, by 242
measuring the inhibitory effect of the compound on the 1) yield of infectious virus in MDCK cell 243
culture and 2) neuraminidase activity of the virus. The EC50 value for zanamivir was 0.418 ± 244
0.065 ng/ml (1.254 ± 0.196 nM) by the plaque inhibition assay and 0.1 ± 0.03 ng/ml (0.3 ± 0.09 245
nM) by the NA inhibition assay. These results were similar to those reported for other 246
susceptible viruses, indicating that A/Hong Kong [H275Y] is susceptible to zanamivir, despite its 247
resistance to oseltamivir. 248
HFIM studies with A/Hong Kong [H275Y] and zanamivir. In a companion paper, we showed 249
that zanamivir is an effective treatment for oseltamivir-resistant influenza virus and that the 250
pharmacodynamic index for this compound is Time>EC50 (5). Since the pharmacodynamically-251
linked index previously described for the neuraminidase inhibitors oseltamivir and peramivir is 252
AUC/EC50 (16, 22), we determined if AUC/EC50 is the most predictive PK/PD index for 253
zanamivir at a longer half-life (8 h) that is similar to the half-lives of other neuraminidase 254
inhibitors such as oseltamivir. 255
A/Hong Kong [H275Y] replicated well in the system in the absence of drug. All dosage 256
regimens suppressed viral replication relative to the no-treatment control (Fig. 2). For the 2.5 hr 257
half-life, the Q8h administration yielded the greatest inhibition of viral burden throughout the 258
course of the study followed by the Q12h regimen. The Q24h regimen suppressed the least (Fig. 259
2). In contrast, all dosage regimens with an 8 hr simulated half-life achieved a similar extent of 260
on May 21, 2018 by guest
http://aac.asm.org/
Dow
nloaded from

Page 15 of 36
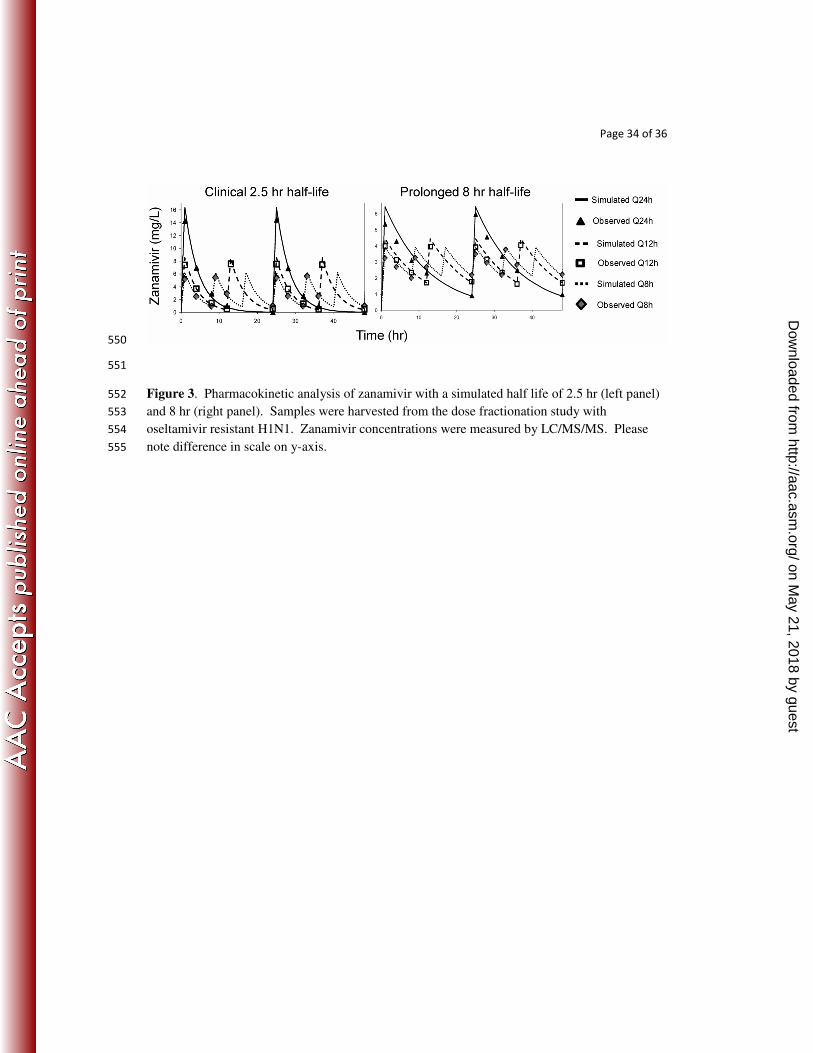
viral inhibition (Fig. 2). Simulated and observed zanamivir concentrations for both half-lives are 261
depicted in Figure 3 and show that the target 24 hr AUCs were attained for all dosage regimens. 262
Mechanism-based population PK/PD model. We developed a novel mechanism-based 263
population PK/PD model to describe the relationship between zanamivir concentrations and 264
extracellular viral concentration over time. The mathematical model (Figure 1) was 265
simultaneously fit to all viral burden and pharmacokinetic (PK) data generated in the HFIM 266
system from the present study and from a dose fractionation study of companion paper (5). We 267
co-modeled both studies to obtain more robust estimates. Viral load and PK data from the 268
present study are depicted in Figure 2 (top panels) and Figure 3, respectively, and are described 269
above. Figure 2 (bottom panels) shows the viral burden data described in a companion paper. 270
Briefly, these results illustrate that the Q12h regimens inhibited viral replication better than the 271
corresponding Q24h regimens at all doses of zanamivir, indicating that Time>EC50 is the 272
pharmacodynamic parameter predictive of viral suppression. Measured zanamivir 273
concentrations from this study were within 10% of the targeted values (data not shown; see 274
companion paper). 275
The proposed model showed precise and unbiased curve fits, as shown by the predicted-276
versus-observed plots for viral load and zanamivir concentration (Fig. 4). Linear regression of 277
observed vs. fitted log10 (PFU/mL) yielded a slope of 1.014, intercept of -0.074, and r2 of 0.96 278
for individual fits (Bayesian) and slope of 0.972, intercept of 0.163, and r2 of 0.87 for population 279
fits (Pre-Bayesian) (Fig. 3). For zanamivir concentrations, both the individual and population fits 280
had a slope of 1.0 (r2=0.99). 281
Parameter estimates (Table 1) were precise with coefficients of variation for uncertainty 282
below 20% for all parameters except IC50 which had a CV of 26.1%. Between curve variability 283
on May 21, 2018 by guest
http://aac.asm.org/
Dow
nloaded from

Page 16 of 36
of PK and PD parameters was small with apparent coefficients of variation (calculated as the 284
square root of the variances shown in Table 1) below 20% for most parameters. 285
The maximum extent of inhibition of viral release was 0.990 (Imax on normal scale) and 286
IC50 was 0.0168 mg/L. This modeled IC50 estimate is part of the model component describing 287
the inhibition of viral release from the last intracellular virus compartment. The IC50 parameter 288
needs to be distinguished from the EC50 estimate that relates the drug concentration to the overall 289
measured effect in the plaque or NA inhibition assay. Extent of inhibition at the end of the 290
dosing interval (i.e. caused by the trough concentration) was 0.962 for Q24h, 0.974 for Q12h, 291
and 0.977 for Q8h at the 8 hr half-life. These high extents of inhibition indicate near-maximal 292
inhibition of viral release during the entire dosing interval. This was achieved at the 8 h but not 293
at the 2.5 h half-life, since the extents of inhibition at the 2.5 hr half-life were 0.718 for Q24h, 294
0.940 for Q12h, and 0.963 for Q8h. 295
Alternative models: A model with no compartments for intracellular virus yielded an objective 296
function (-2•log-likelihood) worse by 34.4 compared to the final model and had notably less 297
precise population fits. Compared to the final model with 5 transit compartments, the objective 298
function was worse by 15.7 for a model with one, worse by 9.6 for a model with two, worse by 299
5.3 for a model with three, worse by 2.1 for a model with four, and worse by 6.3 for a model 300
with 15 transit compartments representing stages of intracellular virus. Models with 5 to 10 301
transit compartment yielded objective functions within 1.9 points. As the performance of these 302
non-nested models was indistinguishable, we chose the model with five transit compartments as 303
final model following the rule of parsimony, since it is simplest of these models. Interested 304
readers may contact the authors for details on the alternative models explored. 305
on May 21, 2018 by guest
http://aac.asm.org/
Dow
nloaded from

Page 17 of 36
Exclusion of the first-order death process of intracellular virus for all or only for the last 306
transit compartment caused an objective function worse by 20 (p<0.001, likelihood ratio test) 307
and yielded notably less precise population fits. Therefore, death of intracellular virus due to 308
death of infected host cells was included as a significant and useful model feature. Inclusion of a 309
saturable infection rate instead of the 2nd
order infection process yielded a high Michaelis-310
Menten constant and had no effect on the objective function. Estimating the initial condition of 311
extracellular virus improved the objective function insignificantly by 1.6 and yielded a very 312
small initial condition of 10-0.13
PFU/mL. Therefore, these two features were not included in the 313
final model. 314
Predictive performance: Due to the large number of different dosage regimens, the present 315
dataset is not amenable to a visual predictive check. Instead, we employed a state-of-the-art and 316
statistically rigorous method for assessing predictive performance. The NPDE spanned the ideal 317
range from approximately -2 to +2 for a standard normally distributed variable at essentially 318
every observation time (Fig. 5). A Shapiro-Wilk-test did not reject the null hypothesis (p=0.40) 319
that all samples originate from the same distribution as the predictions by the final model. As this 320
test is known to be very difficult to achieve, the NPDE statistic supports the excellent predictive 321
performance of the final model. 322
on May 21, 2018 by guest
http://aac.asm.org/
Dow
nloaded from

Page 18 of 36
Discussion 323
Antiviral agents are paramount for the control of infections caused by influenza. 324
Unfortunately, the emergence of influenza A viruses resistant to most commercially available 325
antiviral compounds is becoming more prevalent, posing a significant threat to public health. 326
This threat was recently observed during the 2009 Influenza A (H1N1) pandemic, in which 327
several pH1N1 viral isolates were determined to be resistant to amantadine, rimantadine, and 328
oseltamivir (9-12). The potential for spread of these dual resistant viruses causes great concern 329
that our current anti-influenza drugs will be rendered ineffective. Thus, there is an urgent need 330
to design innovative dosing strategies with alternative antivirals. In this study we focused on the 331
neuraminidase inhibitor zanamivir. 332
Previously, we have demonstrated that Time>EC50 is the predictive PK/PD index for the 333
intravenous administration of zanamivir (5). This is different from other neuraminidase 334
inhibitors (oseltamivir and peramivir) for which AUC/EC50 is the PK/PD index predictive of 335
viral suppression (16, 22). For the present study, we hypothesized the pharmacodynamically-336
linked parameter for zanamivir is different from the other neuraminidase inhibitors due to its 337
short clinical half-life (2.5 hr) in humans, as the half-lives for oseltamivir and peramivir are 8 hr 338
and 21 hr (15, 27). To test this hypothesis, a dose fractionation study was performed with a 2.5 339
hr half-life or an 8 hr half-life at a zanamivir dose of 1200 mg/day with all regimens generating 340
the same AUC0-24h. The results demonstrated that for the 2.5 hr half-life, more frequent dosing 341
intervals provided greater inhibition of viral replication. In contrast, the extent of viral inhibition 342
was similar for all dosage regimens with a simulated 8 hr half-life. This suggests that 343
Time>EC50 best predicted suppression of viral burden for the 2.5 h half-life, whereas AUC/EC50 344
on May 21, 2018 by guest
http://aac.asm.org/
Dow
nloaded from

Page 19 of 36
best predicted suppression of viral burden for the 8 h half-life. These data confirmed the 345
hypothesis. 346
These findings have important implications for the clinical use of intravenous zanamivir 347
in patients, as a single PK/PD index may not be sufficient to describe optimal therapeutic 348
regimens for all patients groups. Cass et al. (8) showed that individuals with renal impairment 349
have significantly altered PK following an intravenous zanamivir dose when compared to 350
healthy volunteers. Because elimination of zanamivir occurs almost exclusively via renal 351
excretion (7), zanamivir clearance was markedly decreased in individuals with renal impairment, 352
resulting in higher serum AUC values and longer zanamivir half-lives. Therefore, it is likely that 353
patients with renal disease would have a PK/PD index of AUC/EC50 and healthy individuals 354
would have a PK/PD index of Time>EC50. 355
The different most predictive PK/PD indices for zanamivir at the 2.5 hr half-life and the 8 356
hr half-life were explained by our mechanism-based mathematical model. This model is capable 357
of describing viral burden for any half-life that may be relevant for patients with different 358
degrees of renal impairment. The model showed a mean IC50 value of 0.0168 mg/L and a mean 359
Imax of 0.990 (Table 1). Identification of an Imax of 0.990 indicates that it is possible to shut 360
down virtually all rounds (99%) of viral replication, if enough zanamivir makes it to the infection 361
site. The Q24h dosing with the 2.5 hr half-life had a trough concentration of 0.05 mg/L, which 362
resulted in a suboptimal extent of inhibition of 72%. In contrast, the trough concentrations at the 363
Q12h and Q8h dosing had extents of inhibition of 93% and 96%. These most estimates explain 364
why the low trough concentrations for the longer dosing intervals (Q24h) with the 2.5 hr half-life 365
provided sub-optimal viral suppression and why shorter dosing intervals are necessary for 366
successful therapy at the 2.5 hr half-life. Thus, Time>EC50 is the PK/PD index best predicting 367
on May 21, 2018 by guest
http://aac.asm.org/
Dow
nloaded from

Page 20 of 36
inhibition of viral replication for the 2.5 hr half life. On the other hand, all dosage regimens with 368
the 8 hr half-life had trough concentrations at or above 0.9 mg/L, resulting in extents of 369
inhibition of viral release in excess of at least 96% for the entire dosing interval. This is how the 370
model explained AUC/EC50 to be the most predictive PK/PD index for the 8 h half-life. 371
Our newly developed mechanism-based model is a powerful tool for predicting viral load 372
over time for any zanamivir dosage regimen. Such predictions cannot be achieved using 373
traditional PK/PD experimental approaches, because these methods do not account for the entire 374
time course of infection. This mathematical model can also be used to predict therapeutic success 375
in special population groups. For example, patients with medical impairments, such as renal 376
dysfunction, often exhibit PK profiles that are markedly different from profiles in healthy 377
volunteers. Our model can predict optimal zanamivir dosage regimens that maximize viral 378
inhibition throughout the course of infection for that patient. 379
Others have instituted mathematical models to describe the growth kinetics of Influenza 380
A virus and the effect of amantadine on viral growth kinetics (1, 3). The models described in 381
these reports are different from our mechanism-based model. Baccam et al. and Beaucheam et 382
al. (1, 3) modeled the infection state of target cells using a single delay compartment for infected 383
cells. In contrast, we modeled the intracellular stages of the virus replication cycle employing a 384
transition compartment model and optimized the number of transit compartments. Both 385
approaches can describe the delay between infection of a host cell and egress of infectious virus. 386
We included compartments for different stages of intracellular virus to specify the mechanism of 387
action for zanamivir that inhibits egress of infectious virus. Importantly, inclusion of the first 388
order death process for intracellular virus improved the predictive performance of the model. 389
Therefore, inhibition of viral egress also reduces the total number of infectious virus released in 390
on May 21, 2018 by guest
http://aac.asm.org/
Dow
nloaded from

Page 21 of 36
our model, since zanamivir therapy reduces the fraction of intracellular virus that is released as 391
infectious virus. 392
The emergence and spread of influenza viruses that are resistant to the available 393
treatments has pushed combination chemotherapy to the forefront of antiviral research. 394
Currently, there are several studies investigating the efficacy of antiviral agents when used in 395
combination against influenza viruses (25, 26, 28). To use combination chemotherapy 396
efficaciously, dosage regimens for antiviral combinations must be optimized. Our new 397
mechanism-based mathematical model offers the advantage over traditional PK/PD index 398
approaches in that the model is well amenable to describe the effects of combination 399
chemotherapy with two agents. Such combination regimens may be most efficacious, if two 400
antivirals, such as zanamivir and amantadine, affect different stages of the viral life-cycle (Figure 401
1). Therefore, our model could be a very useful tool for optimizing dosage regimens with 402
multiple antiviral compounds. 403
This study showed that the dynamically-linked PK/PD index for suppression of A/Hong 404
Kong [H275Y], an oseltamivir-resistant pH1N1 influenza virus, for zanamivir was Time>EC50 405
for the clinical 2.5 hr half life, whereas AUC/EC50 was most predictive for the artificial 8 hr half-406
life. This change in the most predictive PK/PD index was explained by a new mechanism-based 407
mathematical model that described all viral load profiles well and had excellent predictive 408
performance. The model showed that the trough concentrations for the Q24h (and Q12 h) dosing 409
provided worse viral suppression compared to the Q8h dosing for the 2.5 hr half-life. In 410
contrast, all dosage regimens yielded similar extents of inhibition of viral release for the 8 hr 411
half-life. This proposed model may be used as a predictive tool to determine viral load over time 412
for any dosage regimen of zanamivir and can be adapted to estimate viral load for combination 413
on May 21, 2018 by guest
http://aac.asm.org/
Dow
nloaded from

Page 22 of 36
chemotherapy. Overall, these studies offer a better understanding of the time-course of the 414
pharmacodynamics of i.v. zanamivir and hold great promise for optimizing dosage regimens for 415
patients. 416
on May 21, 2018 by guest
http://aac.asm.org/
Dow
nloaded from

Page 23 of 36
Acknowledgements: 417
This work was supported by grant RO1-AI079729-02 from NIAID to the Virology Therapeutics 418
and Pharmacodynamics laboratory. We thank Diane Singer for providing tissue culture cells for 419
these experiments. 420
The content is solely the responsibility of the authors and does not necessarily represent 421
the official views of the National Institute of Health. 422
The authors have no conflicts. 423
424
on May 21, 2018 by guest
http://aac.asm.org/
Dow
nloaded from

Page 24 of 36
Reference List 425
426
1. Baccam, P., C. Beauchemin, C. A. Macken, F. G. Hayden, and A. S. Perelson. 2006. 427
Kinetics of influenza A virus infection in humans. J. Virol. 80: 7590-7599. 428
2. Beal, S. L. 2001. Ways to fit a PK model with some data below the quantification limit. J. 429
Pharmacokinet. Pharmacodyn. 28: 481-504. 430
3. Beauchemin, C. A., J. J. McSharry, G. L. Drusano, J. T. Nguyen, G. T. Went, R. M. 431
Ribeiro, and A. S. Perelson. 2008. Modeling amantadine treatment of influenza A virus in 432
vitro. J. Theor. Biol. 254: 439-451. 433
4. Brendel, K., E. Comets, C. Laffont, C. Laveille, and F. Mentre. 2006. Metrics for 434
external model evaluation with an application to the population pharmacokinetics of 435
gliclazide. Pharm. Res. 23: 2036-2049. 436
5. Brown A.N., J. J. McSharry, Q. Weng, J. R. Adams, R. Kulawy, and G. L. Drusano. 437
2011. Zanamivir, at 600 mg Twice Daily, Inhibits Oseltamivir–Resistant 2009 pandemic 438
H1N1 Influenza Virus in an in vitro Hollow Fiber Infection Model System. Antimicrob. 439
Agents Chemother. AAC01628-10: 440
6. Brown, A. N., J. J. McSharry, Q. Weng, E. M. Driebe, D. M. Engelthaler, K. Sheff, P. 441
S. Keim, J. Nguyen, and G. L. Drusano. 2010. In vitro system for modeling influenza A 442
virus resistance under drug pressure. Antimicrob. Agents Chemother. 54: 3442-3450. 443
on May 21, 2018 by guest
http://aac.asm.org/
Dow
nloaded from

Page 25 of 36
7. Cass, L. M., C. Efthymiopoulos, and A. Bye. 1999. Pharmacokinetics of zanamivir after 444
intravenous, oral, inhaled or intranasal administration to healthy volunteers. Clin. 445
Pharmacokinet. 36 (Suppl 1): 1-11. 446
8. Cass, L. M., C. Efthymiopoulos, J. Marsh, and A. Bye. 1999. Effect of renal impairment 447
on the pharmacokinetics of intravenous zanamivir. Clin. Pharmacokinet. 36 (Suppl 1): 13-448
19. 449
9. CDC. 2009. 2008-2009 Influenza Season Week 38 ending September 26, 2009. Centers for 450
Disease Control and Prevention. http://www.cdc.gov/flu/weekly/. 451
10. CDC. 2009. Oseltamivir-resistant 2009 pandemic influenza A (H1N1) virus infection in 452
two summer campers receiving prophylaxis--North Carolina, 2009. MMWR Morb. Mortal. 453
Wkly. Rep. 58: 969-972. 454
11. CDC. 2009. Oseltamivir-resistant novel influenza A (H1N1) virus infection in two 455
immunosuppressed patients - Seattle, Washington, 2009. MMWR Morb. Mortal. Wkly. 456
Rep. 58: 893-896. 457
12. CDC. 2009. Update: drug susceptibility of swine-origin influenza A (H1N1) viruses, April 458
2009. MMWR Morb. Mortal. Wkly. Rep. 58: 433-435. 459
13. CDC. 2010. Patients hospitalized with 2009 pandemic influenza A (H1N1) - New York 460
City, May 2009. MMWR Morb. Mortal. Wkly. Rep. 58: 1436-1440. 461
on May 21, 2018 by guest
http://aac.asm.org/
Dow
nloaded from

Page 26 of 36
14. Dawood, F. S., S. Jain, L. Finelli, M. W. Shaw, S. Lindstrom, R. J. Garten, L. V. 462
Gubareva, X. Xu, C. B. Bridges, and T. M. Uyeki. 2009. Emergence of a novel swine-463
origin influenza A (H1N1) virus in humans. N. Engl. J. Med. 360: 2605-2615. 464
15. Doucette, K. E. and F. Y. Aoki. 2001. Oseltamivir: a clinical and pharmacological 465
perspective. Expert. Opin. Pharmacother. 2: 1671-1683. 466
16. Drusano, G. L., S. L. Preston, D. Smee, K. Bush, K. Bailey, and R. W. Sidwell. 2001. 467
Pharmacodynamic evaluation of RWJ-270201, a novel neuraminidase inhibitor, in a lethal 468
murine model of influenza predicts efficacy for once-daily dosing. Antimicrob. Agents 469
Chemother. 45: 2115-2118. 470
17. Garten, R. J., C. T. Davis, C. A. Russell, B. Shu, S. Lindstrom, A. Balish, W. M. 471
Sessions, X. Xu, E. Skepner, V. Deyde, M. Okomo-Adhiambo, L. Gubareva, J. 472
Barnes, C. B. Smith, S. L. Emery, M. J. Hillman, P. Rivailler, J. Smagala, M. de 473
Graaf, D. F. Burke, R. A. Fouchier, C. Pappas, C. M. Alpuche-Aranda, H. Lopez-474
Gatell, H. Olivera, I. Lopez, C. A. Myers, D. Faix, P. J. Blair, C. Yu, K. M. Keene, P. 475
D. Dotson, Jr., D. Boxrud, A. R. Sambol, S. H. Abid, K. St George, T. Bannerman, A. 476
L. Moore, D. J. Stringer, P. Blevins, G. J. Demmler-Harrison, M. Ginsberg, P. Kriner, 477
S. Waterman, S. Smole, H. F. Guevara, E. A. Belongia, P. A. Clark, S. T. Beatrice, R. 478
Donis, J. Katz, L. Finelli, C. B. Bridges, M. Shaw, D. B. Jernigan, T. M. Uyeki, D. J. 479
Smith, A. I. Klimov, and N. J. Cox. 2009. Antigenic and genetic characteristics of swine-480
origin 2009 A(H1N1) influenza viruses circulating in humans. Science 325: 197-201. 481
on May 21, 2018 by guest
http://aac.asm.org/
Dow
nloaded from

Page 27 of 36
18. Gubareva, L. V., R. G. Webster, and F. G. Hayden. 2002. Detection of influenza virus 482
resistance to neuraminidase inhibitors by an enzyme inhibition assay. Antiviral Res. 53: 47-483
61. 484
19. Hayden, F. G., K. M. Cote, and R. G. Douglas, Jr. 1980. Plaque inhibition assay for drug 485
susceptibility testing of influenza viruses. Antimicrob. Agents Chemother. 17: 865-870. 486
20. Itoh, Y., K. Shinya, M. Kiso, T. Watanabe, Y. Sakoda, M. Hatta, Y. Muramoto, D. 487
Tamura, Y. Sakai-Tagawa, T. Noda, S. Sakabe, M. Imai, Y. Hatta, S. Watanabe, C. 488
Li, S. Yamada, K. Fujii, S. Murakami, H. Imai, S. Kakugawa, M. Ito, R. Takano, K. 489
Iwatsuki-Horimoto, M. Shimojima, T. Horimoto, H. Goto, K. Takahashi, A. Makino, 490
H. Ishigaki, M. Nakayama, M. Okamatsu, K. Takahashi, D. Warshauer, P. A. Shult, 491
R. Saito, H. Suzuki, Y. Furuta, M. Yamashita, K. Mitamura, K. Nakano, M. 492
Nakamura, R. Brockman-Schneider, H. Mitamura, M. Yamazaki, N. Sugaya, M. 493
Suresh, M. Ozawa, G. Neumann, J. Gern, H. Kida, K. Ogasawara, and Y. Kawaoka. 494
2009. In vitro and in vivo characterization of new swine-origin H1N1 influenza viruses. 495
Nature 460: 1021-1025. 496
21. Jain, S., L. Kamimoto, A. M. Bramley, A. M. Schmitz, S. R. Benoit, J. Louie, D. E. 497
Sugerman, J. K. Druckenmiller, K. A. Ritger, R. Chugh, S. Jasuja, M. Deutscher, S. 498
Chen, J. D. Walker, J. S. Duchin, S. Lett, S. Soliva, E. V. Wells, D. Swerdlow, T. M. 499
Uyeki, A. E. Fiore, S. J. Olsen, A. M. Fry, C. B. Bridges, and L. Finelli. 2009. 500
Hospitalized patients with 2009 H1N1 influenza in the United States, April-June 2009. N. 501
Engl. J. Med. 361: 1935-1944. 502
on May 21, 2018 by guest
http://aac.asm.org/
Dow
nloaded from

Page 28 of 36
22. McSharry, J. J., Q. Weng, A. Brown, R. Kulawy, and G. L. Drusano. 2009. Prediction 503
of the pharmacodynamically linked variable of oseltamivir carboxylate for influenza A 504
virus using an in vitro hollow-fiber infection model system. Antimicrob. Agents 505
Chemother. 53: 2375-2381. 506
23. Metzgar, D., D. Baynes, C. A. Myers, P. Kammerer, M. Unabia, D. J. Faix, and P. J. 507
Blair. 2010. Initial identification and characterization of an emerging zoonotic influenza 508
virus prior to pandemic spread. J. Clin. Microbiol. 48: 4228-4234. 509
24. Moscona, A. 2005. Oseltamivir resistance--disabling our influenza defenses. N. Engl. J. 510
Med. 353: 2633-2636. 511
25. Nguyen, J. T., J. D. Hoopes, M. H. Le, D. F. Smee, A. K. Patick, D. J. Faix, P. J. Blair, 512
M. D. de Jong, M. N. Prichard, and G. T. Went. 2010. Triple combination of 513
amantadine, ribavirin, and oseltamivir is highly active and synergistic against drug resistant 514
influenza virus strains in vitro. PLoS. One. 5: e9332- 515
26. Nguyen, J. T., J. D. Hoopes, D. F. Smee, M. N. Prichard, E. M. Driebe, D. M. 516
Engelthaler, M. H. Le, P. S. Keim, R. P. Spence, and G. T. Went. 2009. Triple 517
combination of oseltamivir, amantadine, and ribavirin displays synergistic activity against 518
multiple influenza virus strains in vitro. Antimicrob. Agents Chemother. 53: 4115-4126. 519
27. Sidwell, R. W. and D. F. Smee. 2002. Peramivir (BCX-1812, RWJ-270201): potential 520
new therapy for influenza. Expert. Opin. Investig. Drugs 11: 859-869. 521
on May 21, 2018 by guest
http://aac.asm.org/
Dow
nloaded from

Page 29 of 36
28. Smee, D. F., B. L. Hurst, M. H. Wong, K. W. Bailey, and J. D. Morrey. 2009. Effects of 522
double combinations of amantadine, oseltamivir, and ribavirin on influenza A (H5N1) virus 523
infections in cell culture and in mice. Antimicrob. Agents Chemother. 53: 2120-2128. 524
525
526
527
528
529
on May 21, 2018 by guest
http://aac.asm.org/
Dow
nloaded from

Page 30 of 36
Table: Parameter estimates for the population PK/PD model of zanamivir against oseltamivir 530
resistant H1N1 influenza virus in the hollow fiber infection model 531
Parameter Symbol Unit Mean %CV (uncertainty)
Log10 of 2nd
order infection rate constant Log10 kinfect - -2.49 6.1
Synthesis rate constant of virus ksyn 1/h 3.49 19.8
Mean delay time until release of virus in absence of drug
TDelay = 5 / ktr h 37.6 2.6
Mean survival time of infected cells MSTInfected = 1 / kdeath h 7.4 5.3
Mean survival time for extracellular virus MSTVirus = 1 / kloss,virus h 12.4 6.9
Maximum extent of inhibition Imax (normal scale) - 0.990
Maximum extent of inhibition (on transformed scale)
Imax (transformed scale) - 4.62 a,b
9.6
Zanamivir conc. causing 50% of Imax IC50 mg/L 0.0168 26.1
Hill coefficient Hill - 0.885 9.7
Clearance CL L/h 16.0 2.1
Volume of distribution for 8.0 h half-life V18h half-life L 170 15.0
Volume of distribution for 2.5 h half-life V12.5h half-life L 69.8 0.4
Log10 of initial number of uninfected cells LogU - 8 0 (fixed)
Log10 of initial number of infected cells LogI - 2 0 (fixed)
Residual error parameters Symbol
Additive error for viral load on log10 scale
SDin - 0.224 6.9
Additive error for zanamivir conc. PKin mg/L 0.092 20.6
Proportional error for zanamivir conc. PKsl - 0.071 14.8
Estimates for between curve variability
Parameter Variance %CV
(uncertainty)
please see explanations above Log10 kinfect 0.0834 90
ksyn 0.0045 145
TDelay = 5 / ktr 0.0067 82
MSTInfected = 1 / kdeath 0.0054 74
MSTVirus = 1 / kloss,virus 0.0183 87
Imax (transformed scale) 0.133 a,b
140
IC50 0.0114 285
Hill 0.0017 136
CL 0.0041 51
V12.5h half-life 0.0399 282
V18h half-life <0.0001 872
532
on May 21, 2018 by guest
http://aac.asm.org/
Dow
nloaded from
Page 31 of 36
a: Imax was assumed to be normally distributed on transformed scale (ImaxTransformed). 533
The following logistic transformation was used to constrain Imax between 0 and 1: 534
Imax = 1 / [ 1 + exp(-ImaxTransformed) ] 535
b: Individual Imax estimates (on normal scale) ranged from 0.988 to 0.991 for all curves. 536
on May 21, 2018 by guest
http://aac.asm.org/
Dow
nloaded from

Page 32 of 36
537
Figure 1. Mechanism-based model for zanamivir against oseltamivir-resistant pH1N1 influenza 538
virus, A/Hong Kong [H275Y]. The model describes the inhibitory effect of zanamivir on the 539
release of extracellular influenza virus over time.540
on May 21, 2018 by guest
http://aac.asm.org/
Dow
nloaded from

Page 33 of 36
541
542
Figure 2. Individual fitted viral load for zanamivir against oseltamivir resistant H1N1 influenza 543
virus in the hollow fiber infection model. Panels A and B refer to the dose fractionation study 544
described in the methods section. A 1200 mg/day dose of zanamivir was fractionated at Q24h, 545
Q12h, and Q8h dosing intervals with a simulated 2.5 hr half-life (A) or 8 hr half-life (B) for 546
zanamivir. Panels C and D refer to the dose range study described in a companion paper (5). In 547
this study, a total daily dose of 300 mg, 600 mg, or 1200 mg of zanamivir was administered 548
every Q24h (C) or Q12h (D). A half-life of 2.5 hr was simulated for zanamivir in this study. 549
on May 21, 2018 by guest
http://aac.asm.org/
Dow
nloaded from
Page 34 of 36
550
551
Figure 3. Pharmacokinetic analysis of zanamivir with a simulated half life of 2.5 hr (left panel) 552
and 8 hr (right panel). Samples were harvested from the dose fractionation study with 553
oseltamivir resistant H1N1. Zanamivir concentrations were measured by LC/MS/MS. Please 554
note difference in scale on y-axis. 555
on May 21, 2018 by guest
http://aac.asm.org/
Dow
nloaded from

Page 35 of 36
556
557
558
Figure 4. Individual (Bayesian) and population (Pre-Bayesian) fitted viral load and 559
pharmacokinetics for zanamivir against oseltamivir resistant H1N1 influenza virus in the hollow 560
fiber infection model system. 561
562
on May 21, 2018 by guest
http://aac.asm.org/
Dow
nloaded from

Page 36 of 36
563
564
565 566
567
568
Figure 5. Normalized prediction distribution error (NPDE) for viral load. Ideally, the NPDE 569
should be standard normally distributed with approximately 95% of the points falling between -2 570
and +2 at each observation time. 571
572
573
574
575
576
577
578
579
580
581
582
583
584
on May 21, 2018 by guest
http://aac.asm.org/
Dow
nloaded from