a19 dishforth to tyne tunnel dbfo billingham …a19nag.com/a19 billingham noise report - 27 august...
TRANSCRIPT

www.scottwilson.com
Autolink – A19 Dishforth to Tyne Tunnel
A19 DISHFORTH TO TYNE TUNNEL DBFO BILLINGHAM BY - PASS
NOISE ASSESSMENT
Final Report August 2010

A19 Dishforth to Tyne Tunnel DBFO Billingham By-Pass Noise Assessment
Scott Wilson Ltd www.scottwilson.com
Revision Schedule A19 DBFO Billingham By-Pass Noise Assessment – Draft Report April 2010
Rev Date Details Prepared by Reviewed by Approved by
0 6th May 2010 Draft Maggi Fuller Principal Engineer
Teri Ford Transport Planner Bob Richards Technical Director
Bob Richards Technical Director
A 27th Aug 2010 Final Maggi Fuller Principal Engineer
Teri Ford Transport Planner Bob Richards Technical Director
Bob Richards Technical Director

A19 Dishforth to Tyne Tunnel DBFO Billingham By-Pass Noise Assessment
CONTENTS
No. Chapter Page No.
1.0 Introduction 1
2.0 Current Legislation 1
3.0 Methodology 4
4.0 Noise Measurement Survey 6
5.0 Analysis of Results 10
6.0 Comparison of Noise Results Measured by Scott Wilson and Stockton Borough Council at 6 Kielder Close 14
7.0 Comparison of Results to CRTN Prediction Method Calculations 15
8.0 Summary 16
FIGURES
No. Title Page No.
3.1 Location of A19(T) Billingham Bypass Noise Assessments 5
4.1 Location of properties on the Wolviston Court Estate where noise measurements were undertaken 7
4.2 Noise measurement equipment set up at 7 Glenfall Close 8
4.3 Noise measurement equipment set up alongside the HRA carriageway on the A19(T) Billingham Bypass 8
4.6 Noise measurement equipment set up alongside the concrete carriageway on the A19(T) Billingham Bypass 9
4.3 Noise measurement equipment set up at 6 Kielder Close 9
4.4 Noise measurement equipment set up at 20 Calder Close 10
5.1 View towards the A19(T) from 6 Kielder Close 11
5.2 View towards 6 Kielder Close from the A19(T) verge 11
5.3 View towards the A19(T) from 20 Calder Close 12
5.4 Ridged pattern in concrete slabs on A19(T) Billingham Bypass 14
APPENDICES
Appendix Title
A Noise Terminology and Perception
B Annual Average Weekday (AWT) 18-hour Traffic Flows for 2009/10 (Originating from the Highways Agency’s TRADS on-line Database)
C Average Daily Weather Data during Survey Periods
D Measurement Results from Scott Wilson Surveys
E CRTN Predicted Calculations at 10 Lowther Close and 6 Kielder Close

A19 Dishforth to Tyne Tunnel DBFO Billingham By-Pass Noise Assessment
1
1.0 Introduction
1.1 The A19/A168 Dishforth to Tyne Tunnel trunk road is a vital route linking Tyneside, Wearside and Teesside to the A1(M). The route between the A1 at Dishforth in the south, and the Tyne Tunnel in the north, provides an important link into the industrial areas of the north east of England. The route is of major importance in satisfying the traffic demand of the Teesside conurbation, the centres of population near which it passes, industry located down the eastern fringe of County Durham and the rural communities of North Yorkshire.
1.2 The present A19(T) Billingham Bypass to the north-west of Middlesbrough, was opened in 1982 and carries over 23 million vehicles a year over its 7.3km (4.5 miles) length. The A19(T) in this location still has the original 4.2km (2.6 mile) section of dual, 2-lane concrete carriageway and is in an approximate 6m deep cutting. The annual 18 hour average weekday traffic flow for 2009 was in the region of 70,000 vehicles, with 16.35% HGV.
Approximately 400 residential properties are located on the Wolviston Court Estate on the eastern side of the A19 Billingham Bypass. The estate was constructed and extended in 1985; after the bypass had opened. There is an existing 3m high timber noise fence at the edge of the highway boundary adjacent to the fronting residential properties, which was erected in 2002. However, despite the presence of the noise fence, the Highways Agency continues to receive numerous complaints from residents regarding perceived traffic noise associated with the concrete carriageway.
1.3 To better understand the scale of the problems residents of the Wolviston Court Estate are experiencing, and to provide data to support any case for noise mitigation measures, the Highways Agency briefed AutoLink, the DBFO (Design, Build, Finance & Operate) Co., to undertake noise measurements associated with the concrete carriageway at properties on this estate and to provide a brief, factual Noise Assessment Study Report, which would discuss appropriate guidance; describe the measurement methodology; and outline the findings and results of the baseline noise survey, compared to the calculations using the Prediction Method, which is the HA’s preferred method of assessment, as described in CRTN (the Calculation of Road Traffic Noise). Autolink requested that Scott Wilson undertake this task on their behalf.
2.0 Current Legislation
2.1 There is no current UK legislation specifically relating to acceptable noise levels from existing roads. The Noise Insulation Regulations (as amended in 1988), make provision for mitigation measures to be carried out for residential properties affected by new or altered roads only. The Regulations use the dB(A)(L10(18-hour)) parameter to define road traffic noise levels. Noise from road traffic however, does not fall under the Statutory Nuisance provisions of the Environmental Protection Act 1990. A summary of noise terminology and perception is included in Appendix A.
Predicted increases in traffic volume do not necessarily directly correlate to an increase in noise. In a typical day, a busy road will be at its quietest during the middle of the day and noise will increase as the rush hour approaches. A point will come, however, when the road is so busy that traffic begins to slow-down or even stop – consequently noise levels will typically go down and vary less.
2.2 The Highway Authority has a duty to carry out insulation work or to make grants for the work if the criteria are met due to a new highway or a highway for which an additional carriageway is to be constructed. In addition, the Highway Authority has the power to carry out insulation works or to make grants for the work if the criteria are met due to an

A19 Dishforth to Tyne Tunnel DBFO Billingham By-Pass Noise Assessment
2
altered highway, defined as ‘a highway of which the location, width or level of the carriageway is to be altered’.
2.4 The Word Health Organisation (WHO) provides guidelines for total ambient noise levels, not specifically road traffic noise, to prevent annoyance. The WHO guidelines are expressed in terms of daytime (16 hour) and night time (8 hour) LAeq noise levels.
The WHO criteria are guidelines that would be desirable to achieve at new residential developments, or at existing properties affected by a new development. They are not noise limits to be strictly applied.
The above documents are referenced to assist in putting the monitoring results in context.
2.5 Current Highways Agency Policy
In July 2000, the DETR publication "Transport 2010 - The 10 Year Plan”, announced that to deal with noise problems on existing roads, a ‘ring-fenced’ budget would be provided to treat serious and pressing cases where there was no immediate prospect of relief under maintenance or improvement schemes. A methodology was introduced to assess whether locations already identified as giving rise to significant concern re noise levels, met the requirements of the ‘sift’ criteria announced by the Minister in the CHE Memorandum 72/99. The criteria were:
The road had to have been opened or altered before JUNE 1988.
The noise level immediately adjacent to the road and calculated from current traffic data had to be at least 80dB(A).
If the road had been opened or altered after October 1969, the calculated roadside noise level had to be at least 3dB(A) greater than was predicted for the design year (15 years from the opening/alteration).
Only properties exposed to noise levels in excess of 68dB(A)(L10(18-hour)) were considered. Under this methodology, the Wolviston Court Estate at Billingham should have qualified under the ‘sift’ criteria and should have been assessed. A copy of the associated study has not been made available for this report. However, it is assumed that the new reflective noise barrier erected in 2002 alongside the boundary to this estate, was as a result of this policy to provide an effective noise mitigation measure for properties that fronted the concrete carriageway of the A19(T).
2.6 In addition, under The 10 Year Plan, the Highways Agency would have (by 31 March 2011):
installed quieter surfaces on over 60% (2500 miles) of the strategic network, including all concrete stretches; thus,
reducing the noise from traffic, benefiting an estimated 3 million people living around 1/3 mile from trunk roads that met the following criteria:
In October 2001, having consulted with English local highway authorities and other interested bodies, the Government announced four criteria for prioritising the surfacing of concrete trunk roads with quieter materials. The criteria were:
That wherever possible the application of quieter surfaces will fit in with normal maintenance needs;
that priority will be given to those sites where treatment would benefit the greatest number of people;
A19 Dishforth to Tyne Tunnel DBFO Billingham By-Pass Noise Assessment
3
that the works will be carried out in such a way as to minimise disruption to general public and users of network;
that priority will be given to roads, opened since June 1988, where actual noise levels have turned out to be significantly higher than predicted at the time of the Public Inquiry.
In 2003, the Minister for Transport announced the timetable for the resurfacing of all stretches of concrete roads and that within the following four years, 26 stretches of road affecting the largest number of people, would be resurfaced. The remaining stretches would be resurfaced between 2007 and 2011 (Ref. AMM No 43, December 2003).
2.7 The original ‘Ten Year Plan’ target was to include the resurfacing of any remaining concrete trunk road carriageways with quieter materials irrespective of the need for maintenance by the end of March 2011. However, following spending reviews in 2004 and 2007, the resurfacing of concrete roads ahead of maintenance need for noise reasons was no longer allocated funding.
The A19(T) Billingham Bypass, whilst having been identified as a site for further study in the AMM No. 43 in 2003, includes the only remaining stretch of concrete running surface on the A19(T) DBFO. However, the carriageway is in good condition and there have never been any plans to surface the carriageway during the DBFO contract, which ends in 2026. Therefore, there are no plans to replace the carriageway surface for the next 17 years (the time remaining for the DBFO contract).
2.8 Defra
EU Directive 2002/49/EC on the management of environmental noise required Member States to produce noise maps and action plans for urban areas and major transport infrastructures, including roads, railways and airports.
The maps would highlight the extent of the noise problem and identify hotspots throughout Europe. Noise Action Plans were then to be drawn up on the basis of the maps. The maps illustrate noise levels in urban areas and near major transport infrastructures. These results will be combined with the latest research on the impacts of noise on health and wellbeing, to identify areas for priority action and remediation measures. The data will also permit a precise calculation of the number of citizens exposed to dangerous noise levels, and the associated costs to society. These criteria should replace those prescribed in the DETR "Transport 2010 - The 10 Year Plan” and the then agreed ‘sift’ criteria, which was broadly based upon the CRTN methodology.
Defra has recently completed consultation on the Draft Noise Action Plans, which were developed under the terms of the Environmental Noise (England) Regulations 2006 for major roads and railways. Whilst these Plans have not yet been formally adopted, it is expected that Defra will adopt all the Noise Action Plans during 2010, following which, the Agency will consider whether action can be taken to manage noise levels at the First Priority Locations identified on strategic roads.
The important areas are those where the top 1% of the population are affected by the highest level of noise, but as a priority, attention being focussed on those locations with a noise exposure of 76dB(A) or more (L10, 18h for road traffic), according to the noise maps, which were submitted to the Commission at the end of 2007. (www.defra.gov.uk/noise mapping)
Local Highway Authorities in the Teesside area were sent an information pack by Defra in July 2009 and given the opportunity to comment on the proposals by November 2009.
2.9 The A19 at Billingham has not been identified as a First Priority Location under the Defra Noise Action Plan process, it is therefore assumed that none of the properties on the

A19 Dishforth to Tyne Tunnel DBFO Billingham By-Pass Noise Assessment
4
Wolviston Court Estate met the above criteria. As a result, the estate is unlikely to be considered for any further noise mitigation measures in the foreseeable future.
3.0 Methodology
To determine the level of traffic noise by measurement at the facades of properties closest to the edge of carriageway:
3.1 Based on the understanding of Client requirement, the chosen methodology Scott Wilson Ltd used for the measured baseline noise survey, was the shortened (3-hour) measurement method as prescribed in CTRN and described below, in order to provide a means of validating noise level calculations undertaken using the standard UK methodology set out in 'Calculation of Road Traffic Noise (1988 version).
3.2 The approximate length of the residential property frontage is in the region of 160 metres; therefore, the equipment was installed at three locations. Contact was made with the residents to identify householders who would be willing to have the manned noise monitoring equipment installed at their property before work on site began.
3.3 In addition, short term manned measurements were taken at two locations in laybys adjacent to the A19(T) carriageway in the near vicinity, in order to compare noise levels from the two types of road surfaces; concrete and HRA wearing course. The HRA surfacing is situated on the same link of the A19(T) Billingham Bypass, but to the south of the Wolviston Court Estate.
3.4 Calibrated, noise monitoring equipment with suitable all weather protection was used. The noise meter was connected to a microphone and mounted on a camera style tripod. For outdoor measurements, the preferred measurement height is 1.2m – 1.5m above the ground. These procedures conform to BS7445: 1991 ‘Description and Measurement of Environmental Noise’.
3.5 The noise measurement equipment used is the property of Scott Wilson and comprised a Casella, CEL 268 sound level meter, CEL-284/2 microphone and CEL-225/3 preamp, which were calibrated to the UKAS Accredited Calibration standard in January 2010. For the Audio Attenuator LAT-45, the accuracy of the 0.1dB, 1dB and 10 dB steps were checked and the 10 dB steps up to the 60 dB setting. These calibrations were undertaken at 1kHz and 8kHz.
3.6 The noise meter was set to log various parameters including LAmax, LAeq, LA10, LA50, LA90
and LA95, averaged over five minute intervals for each of the 3-hour periods and was closely monitored throughout the recording process to identify and note any abnormal noise activity. The microphone was calibrated prior to each measurement monitoring period at each location and checked afterwards. No significant changes (+/- 1dB), were noted. The calibration certificate for the noise instrumentation is available upon request.
3.7 To aid in the understanding of the monitored noise levels and to undertake calculations using the Prediction Methodology as prescribed in CRTN; the HA’s preferred method for the calculation of road traffic noise, details of the most recent traffic flow information for the A19(T) in this location were taken from the HA’s database (www.trads2.co.uk). (Counter sites in Area 26, Nos: 4858 N/B and 4861 S/B). The annual average two-way 18-hour AWT flow for 2009 was 69,850 vehicles. Flows for 2010 were available for the months of January, February and March. The February and March flows were higher than the corresponding months in 2009; thereby increasing the AAWT flow to 71,640. The data is included in Appendix B.
A19 Dishforth to Tyne Tunnel DBFO Billingham By-Pass Noise Assessment
5
3.8 It should be noted that dry and relatively still conditions are required to undertake noise monitoring. In addition, for a survey of this type, any periods of unusual traffic conditions e.g. during school holidays or local events, should be avoided.
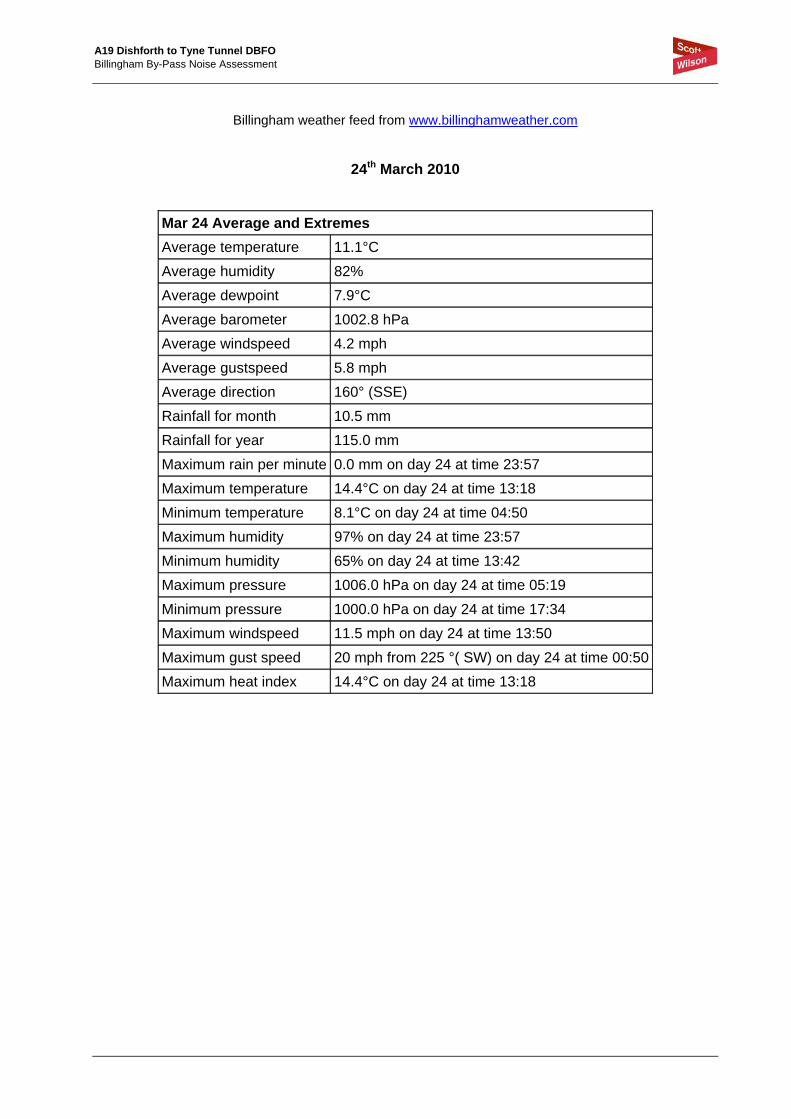
3.9 A summary of weather conditions during the noise monitoring period is included in Appendix C. The Source of data was the Government’s Met Office, Weather Underground for Teesside; http://www.wunderground.com/global/stations/03263.html, and from a local weather station; the Billingham Weather Station feed from www.billinghamweather.com.
3.10 The Highways Agency advised that AutoLink/Scott Wilson should liaise with Stockton Borough Council, who had been independently requested by a resident of the estate, to undertake noise measurements for them. Scott Wilson contacted Mr Steve Smith of Stockton BC prior to the first measurement survey, to confirm and agree methodology.
Following the first surveys, Scott Wilson was contacted by Mr Cirous Asadi of Stockton BC to discuss their findings at 6 Kielder Close, prior to a meeting they were to have with the property owner. Scott Wilson was also to take noise measurements at this same property after the Easter holidays.
Mr Asadi briefly joined the SW measurement team on site while they were undertaking the survey.
Mr Asadi made the results of their 7-day, 24-hour noise measurement survey at 6 Kielder Close available to Scott Wilson for comparison purposes.
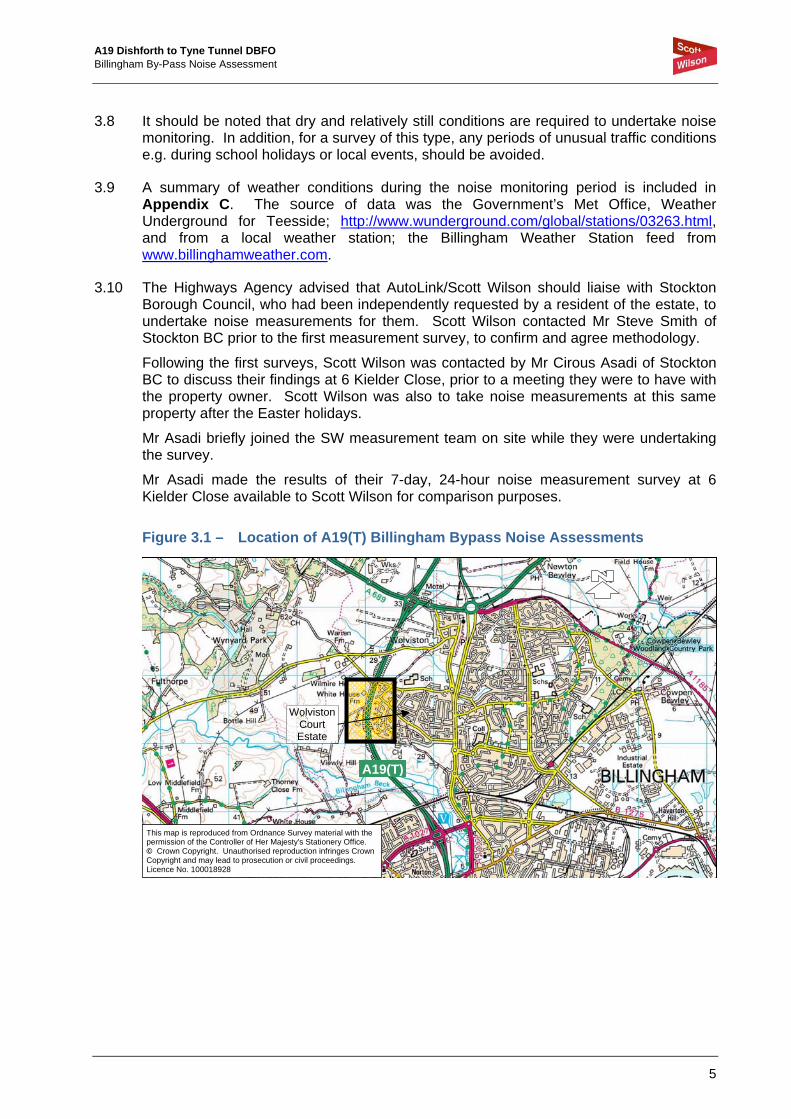
Figure 3.1 – Location of A19(T) Billingham Bypass Noise Assessments
WolvistonCourt Estate
A19(T)
This map is reproduced from Ordnance Survey material with the permission of the Controller of Her Majesty's Stationery Office. © Crown Copyright. Unauthorised reproduction infringes Crown Copyright and may lead to prosecution or civil proceedings. Licence No. 100018928

A19 Dishforth to Tyne Tunnel DBFO Billingham By-Pass Noise Assessment
6
4.0 Noise Measurement Survey 4.1 Noise measurements were undertaken at three properties on the Wolviston Court
Estate, together with two roadside measurements at two laybys; one adjacent to the Hot Rolled Asphalt (HRA) carriageway surface, and the other next to the concrete surfacing. The chosen laybys are both located on the southbound carriageway, to ensure consistent wind conditions on the survey day.
4.2 Intervening ground cover between the Wolviston Court Estate and the A19(T) Billingham Bypass, is predominately acoustically soft, with a golf course and areas of wooded side slopes and grass verges.
4.3 3-hour noise measurements were taken at one property; No. 7, Glenfall Close, on Wednesday 24th March 2010, between 14:00 and 17:00. The weather was cloudy and calm. The average wind speed did not exceed the prescribed limit of 11mph (5 m/s).
4.4 On Thursday 25th March 2010, 3-hour noise measurements were undertaken at the two laybys adjacent to the southbound carriageway. The first readings were taken between 10:00 and 13:00; 4m away from the edge of the HRA surfaced carriageway, and the second readings taken between 14:00 and 17:00, 4m away from the edge of the concrete carriageway. Once again, the weather was cloudy and calm and the average wind speed did not exceed the prescribed limit of 11mph (5 m/s).
4.5 Measurements at the remaining two properties planned for Friday 26th March, had to be abandoned because of adverse weather conditions. The measurements were therefore postponed until the schools reopened after the Easter holidays, and took place on Thursday 22nd April 2010 at No.6 Kielder Close, between 13:00 and 16:00, and on Friday 23rd April at No. 20 Calder Close, between 11:00 and 14:00. The weather was dry with a slight breeze and the average wind speed did not exceed the prescribed limit of 11mph (5 m/s).
The property locations are indicated in Figure 4.1 overleaf.

A19 Dishforth to Tyne Tunnel DBFO Billingham By-Pass Noise Assessment
7
Figure 4.1 – Location of properties on the Wolviston Court Estate where noise measurements were undertaken
This map is reproduced from Ordnance Survey material with the permission of the Controller of Her Majesty's Stationery Office. © Crown Copyright. Unauthorised reproduction infringes Crown Copyright and may lead to prosecution or civil proceedings. Licence No. 100018928

A19 Dishforth to Tyne Tunnel DBFO Billingham By-Pass Noise Assessment
8
4.6 The Figures below show the noise measurement equipment set up and recording at all the chosen locations. At each property, the noise meter microphone was located according to the guidelines given in CRTN; 1m away from the property façade and at a height of 1.5m.
Figure 4.2 Noise measurement equipment set up at
7 Glenfall Close on Wednesday 24th March 2010
Figure 4.3 Noise measurement equipment set up alongside the HRA carriageway
on the A19(T) Billingham Bypass on Thursday 25th March 2010

A19 Dishforth to Tyne Tunnel DBFO Billingham By-Pass Noise Assessment
9
Figure 4.4 Noise measurement equipment set up alongside the concrete
carriageway on the A19(T) Billingham Bypass on Thursday 25th March 2010 4.7 At the layby locations off the A19(T) southbound carriageway, the microphone of the
noise meter was located 4.0m away from the carriageway edge, at a height of 1.2m.
Figure 4.5 Noise measurement equipment set up at
6 Kielder Close on Thursday 22nd April 2010

A19 Dishforth to Tyne Tunnel DBFO Billingham By-Pass Noise Assessment
10
Figure 4.6 Noise measurement equipment set up at 20 Calder Close on Friday 23rd April 2010
4.8 The tabulated results of all the noise measurements are included in Appendix D.
5.0 Analysis of Results
5.1 The condition of the concrete carriageway of the A19(T) in this location is good, and noise levels at frontage properties calculated using both the ‘Sift’ Criteria, based on the CRTN Prediction methodology, and the new Defra guidelines, are below the specified minimum levels for priority treatment to reduce noise.
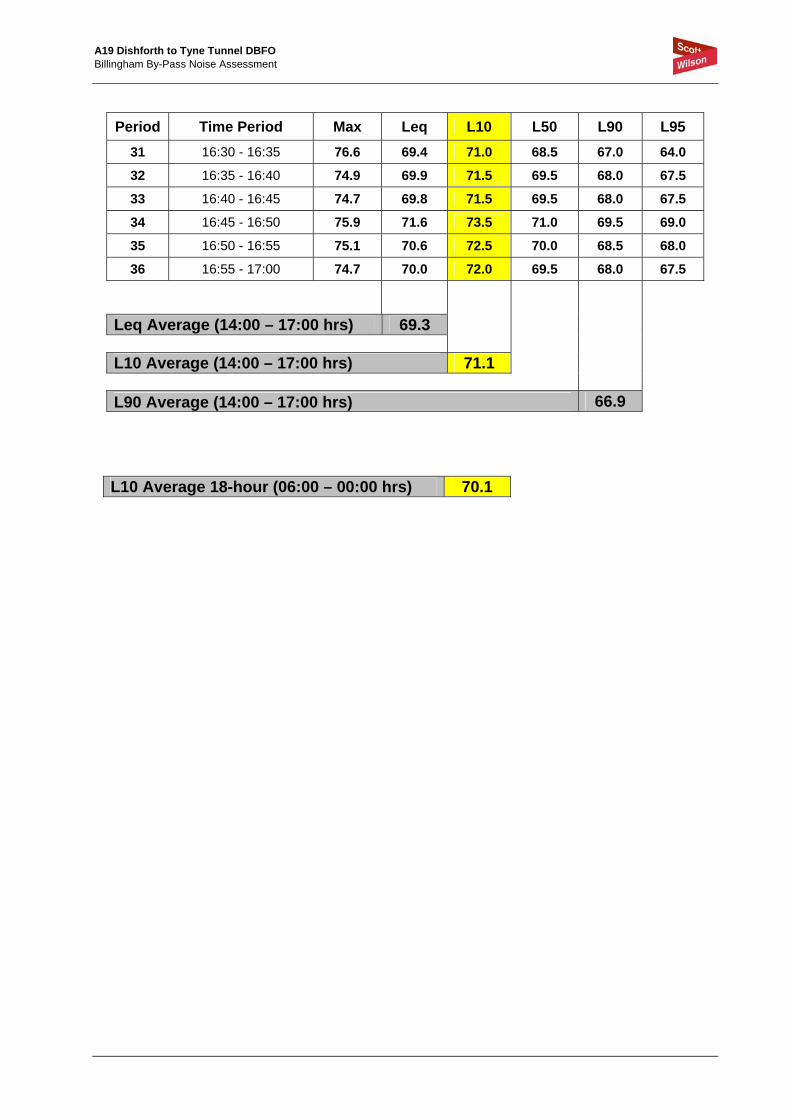
5.2 7 Glenfall Close on Wednesday 24th March 2010 Noise levels at this property were measured at 5-minute intervals for a 3 hour period between 14:00 and 17:00. The average L10(3-hour)dB(A) measurement required by the CRTN guidelines was 71 and the average Leq over the 3-hour period was 69. The A19(T) at this point is in an approximate 6m high, 1 in 3 cutting, and the property façade is located at a distance of 49m away from the edge of the southbound concrete carriageway of the A19(T). Properties in this area are protected by a 3m high, reflective timber noise barrier, which is positioned on the highway boundary at the top of the cutting.
To factor the 3-hour measurement to the 18-hour measurement period as advised in CRTN, 1 dB(A) should be deducted. This gives an L10(18-hour)dB(A) measurement of 70.
5.3 6 Kielder Close on Thursday 22nd April 2010
Noise levels at this property were measured at 5-minute intervals for a 3 hour period between 13:00 and 16:00. The weather was sunny and dry with a slight, predominately north-westerly breeze. The average L10(3-hour)dB(A) measurement was 61 and the average Leq over the 3-hour period was 59. The A19(T) at this point is on a slight embankment, but beyond the highway boundary, the intervening ground rises to these

A19 Dishforth to Tyne Tunnel DBFO Billingham By-Pass Noise Assessment
11
properties on the southern perimeter of the estate to approximately 10m above the level of the A19(T) carriageway. The property façade is located at a distance of 180m away from the edge of the southbound carriageway of the A19(T). The angle of view to the road from this property is segmented between the concrete carriageway section and the HRA section.
The equivalent L10(18-hour)dB(A) measurement as required by the CRTN guidelines is 60.
Figure 5.1 View towards the A19(T) from 6 Kielder Close
Figure 5.2 View towards 6 Kielder Close from the A19(T) verge
5.4 20 Calder Close on Friday 23rd April 2010
Noise levels at this property were measured at 5-minute intervals for a 3 hour period between 11:00 and 14:00. The weather was cloudy and dry with a slight, predominately south-westerly breeze. This property is a bungalow and the property façade is located at a distance of 53m away from the edge of the southbound concrete carriageway of the A19(T). The A19(T) at this point is in an approximate 6m high, 1 in 3 cutting and properties in this area are protected by a 3m high, reflective timber noise barrier, which is positioned on the highway boundary at the top of the cutting. To the boundary of the property, there is a tall and very dense, established Leylandii hedge, adjacent to and higher than the noise barrier and which extends to the south-west boundary of the property. Whilst no allowance for a hedge of this type can be made in noise prediction calculations, a dense, evergreen conifer hedge is nevertheless proven to have a
6 Kielder Close
A19(T) Carriageway
A19 Dishforth to Tyne Tunnel DBFO Billingham By-Pass Noise Assessment
12
beneficial mitigation effect against a troublesome noise source. However, in this instance, the section of hedge located adjacent to the noise fence; would be of little benefit, other than visually, but the hedge to the southern side of the property would give some additional protection against the traffic noise carried from the A19(T) by the prevailing wind.
An incident on the A19(T) between the junctions of the A174(T) and the A172, closed the southbound carriageway on the 23rd April, between 05:00 and 13:30. Traffic reports announced on both local and national radio and information provided on the Highways Agency website, stated that the A19(T) was closed and a lengthy diversion was in place. This incident was removed and the traffic was flowing freely by 13:30 hours. This incident would have affected the traffic flows on the A19(T) at the survey location, however a decision was made in agreement with the resident that the noise survey should proceed, although at the resident’s request, it was delayed until 11:00.
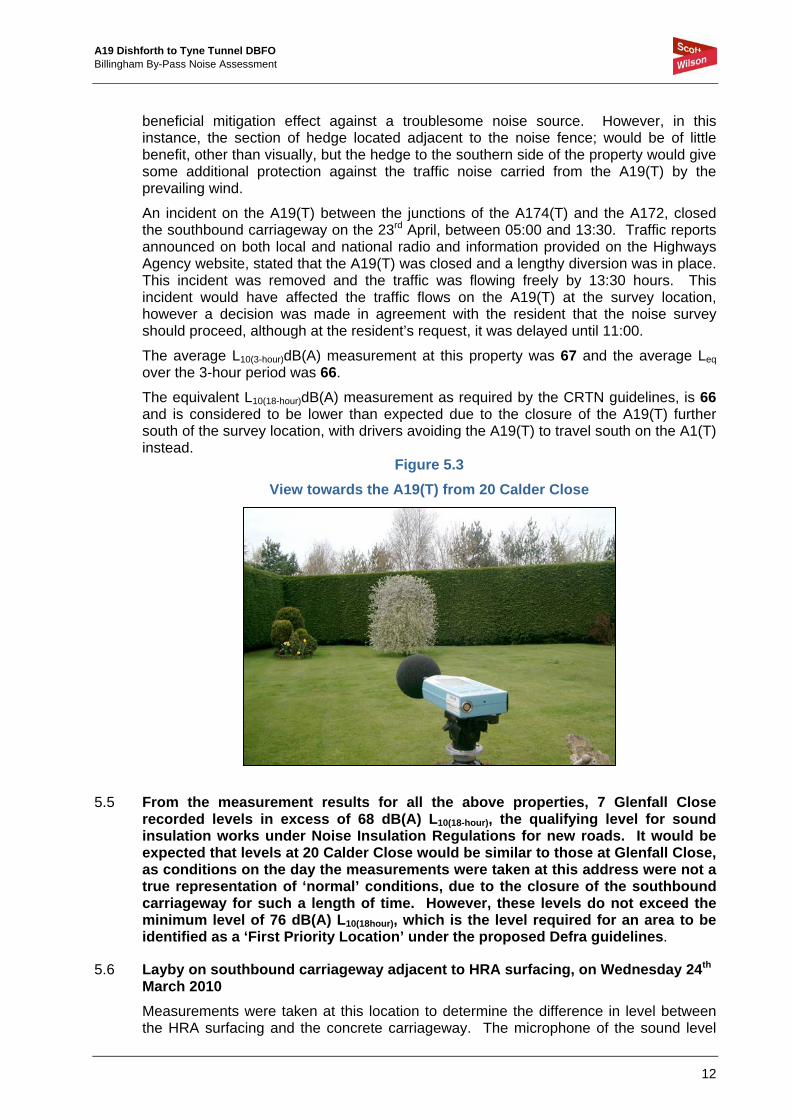
The average L10(3-hour)dB(A) measurement at this property was 67 and the average Leq over the 3-hour period was 66.
The equivalent L10(18-hour)dB(A) measurement as required by the CRTN guidelines, is 66 and is considered to be lower than expected due to the closure of the A19(T) further south of the survey location, with drivers avoiding the A19(T) to travel south on the A1(T) instead.
Figure 5.3 View towards the A19(T) from 20 Calder Close
5.5 From the measurement results for all the above properties, 7 Glenfall Close recorded levels in excess of 68 dB(A) L10(18-hour), the qualifying level for sound insulation works under Noise Insulation Regulations for new roads. It would be expected that levels at 20 Calder Close would be similar to those at Glenfall Close, as conditions on the day the measurements were taken at this address were not a true representation of ‘normal’ conditions, due to the closure of the southbound carriageway for such a length of time. However, these levels do not exceed the minimum level of 76 dB(A) L10(18hour), which is the level required for an area to be identified as a ‘First Priority Location’ under the proposed Defra guidelines.
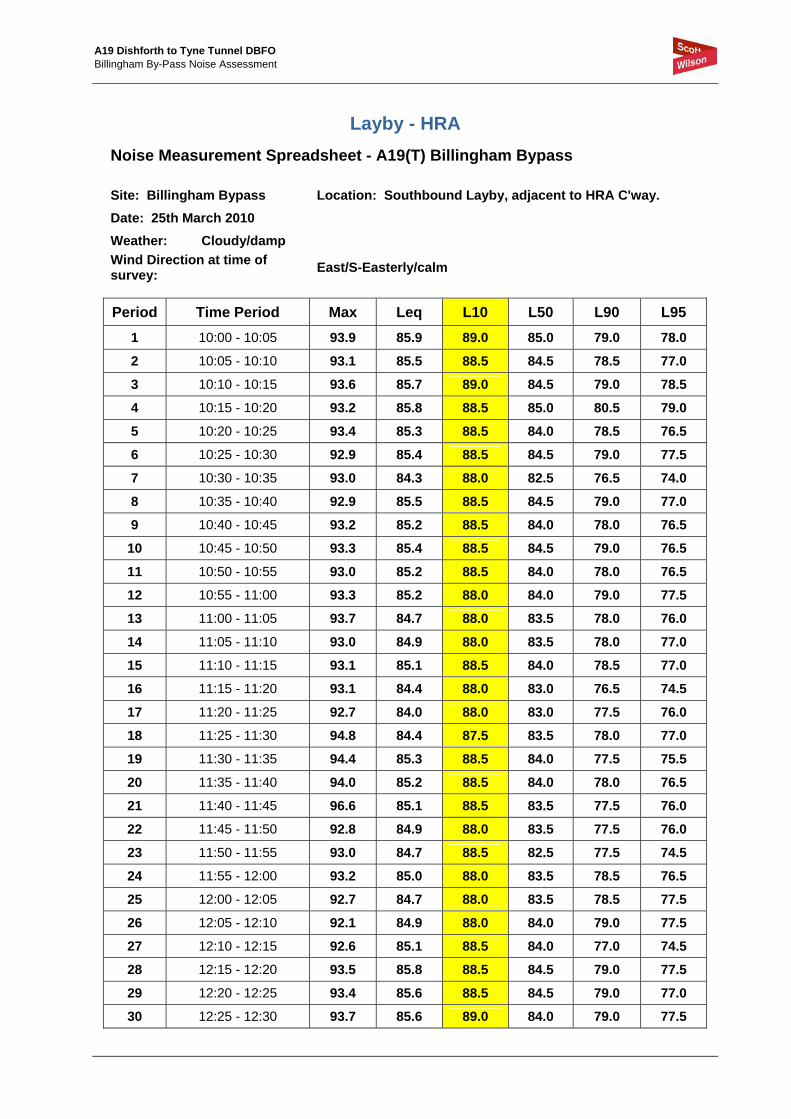
5.6 Layby on southbound carriageway adjacent to HRA surfacing, on Wednesday 24th March 2010
Measurements were taken at this location to determine the difference in level between the HRA surfacing and the concrete carriageway. The microphone of the sound level

A19 Dishforth to Tyne Tunnel DBFO Billingham By-Pass Noise Assessment
13
meter was located at the edge of the verge to the layby, 4m away from the edge of the nearside southbound carriageway, at a height of 1.2m. Wind speeds were light and variable over the 3-hour measurement period between 10:00 and 13:00.
The average L10(3-hour)dB(A) measurement was 88.47 and the average Leq over the 3-hour period was 85.3.
The equivalent L10(18-hour)dB(A) measurement as required for the CRTN ‘Shortened Measurement Method’ guidelines is 87.
5.7 Layby on southbound carriageway adjacent to concrete surfacing, on Wednesday 24th March 2010
Measurements were taken at this location to determine the difference in level between the concrete carriageway and the HRA surfacing. The microphone of the sound level meter was located at the edge of the verge to the layby, 4m away from the edge of the nearside southbound carriageway, at a height of 1.2m. Wind speeds were light and variable over the 3-hour measurement period between 14:00 and 17:00.
The average L10(3-hour)dB(A) measurement was 93.4 and the average Leq over the 3-hour period was 90.5.
The equivalent L10(18-hour)dB(A) measurement as required by the CRTN guidelines is 92.
5.8 The measured difference of 5 dB(A) between the two types of surfacing was higher than anticipated, given the good condition of the two carriageways and that the allowance for impervious concrete carriageways in the CRTN Prediction Method calculations is only 2 dB(A). The concrete surface on the Billingham Bypass therefore generates two and a half times the expected decibel increase over and above hot rolled asphalt. This was therefore queried with Autolink and the Highways Agency.
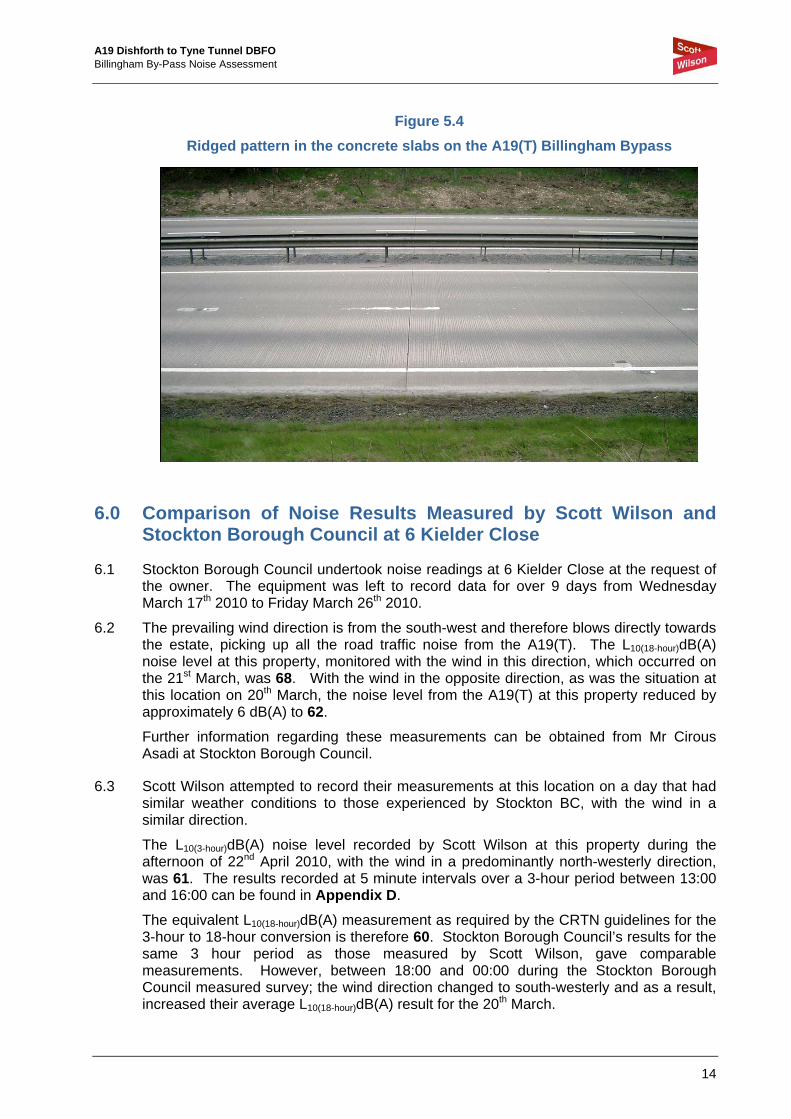
Following discussion, it is understood that in an attempt to reduce the noise from concrete carriageways, two lengths of road on the HA network of which the A19(T) Billingham Bypass was one, were trialled using specified grooves in the concrete slabs that were scientifically designed to reduce the noise. However, this did not have the beneficial effect it was designed to have, and in fact had the opposite effect by increasing the decibel level, resulting in a running surface that generates 2.5 times the expected increase in decibels over and above that generated by hot rolled asphalt. See Figure 5.4 overleaf.
This would therefore explain the higher than expected difference between the measurements at these two roadside locations.
A19 Dishforth to Tyne Tunnel DBFO Billingham By-Pass Noise Assessment
14
Figure 5.4 Ridged pattern in the concrete slabs on the A19(T) Billingham Bypass
6.0 Comparison of Noise Results Measured by Scott Wilson and Stockton Borough Council at 6 Kielder Close
6.1 Stockton Borough Council undertook noise readings at 6 Kielder Close at the request of the owner. The equipment was left to record data for over 9 days from Wednesday March 17th 2010 to Friday March 26th 2010.
6.2 The prevailing wind direction is from the south-west and therefore blows directly towards the estate, picking up all the road traffic noise from the A19(T). The L10(18-hour)dB(A) noise level at this property, monitored with the wind in this direction, which occurred on the 21st March, was 68. With the wind in the opposite direction, as was the situation at this location on 20th March, the noise level from the A19(T) at this property reduced by approximately 6 dB(A) to 62.
Further information regarding these measurements can be obtained from Mr Cirous Asadi at Stockton Borough Council.
6.3 Scott Wilson attempted to record their measurements at this location on a day that had similar weather conditions to those experienced by Stockton BC, with the wind in a similar direction.
The L10(3-hour)dB(A) noise level recorded by Scott Wilson at this property during the afternoon of 22nd April 2010, with the wind in a predominantly north-westerly direction, was 61. The results recorded at 5 minute intervals over a 3-hour period between 13:00 and 16:00 can be found in Appendix D.
The equivalent L10(18-hour)dB(A) measurement as required by the CRTN guidelines for the 3-hour to 18-hour conversion is therefore 60. Stockton Borough Council’s results for the same 3 hour period as those measured by Scott Wilson, gave comparable measurements. However, between 18:00 and 00:00 during the Stockton Borough Council measured survey; the wind direction changed to south-westerly and as a result, increased their average L10(18-hour)dB(A) result for the 20th March.
A19 Dishforth to Tyne Tunnel DBFO Billingham By-Pass Noise Assessment
15
7.0 Comparison of Results to CRTN Prediction Method Calculations
7.1 The CRTN Prediction Method standard has been used to predict traffic noise levels on new and altered highways for many decades and is still the methodology preferred by the DfT/Highways Agency, rather than by measurement alone.
For comparison purposes, Scott Wilson calculated noise levels using the Prediction Method, at two properties on the estate that directly fronted the A19(T). The first, a sample property from those with façades nearest the trunk road; No. 10 Lowther Close, located at a similar distance from the concrete carriageway and behind the existing noise fence to the two properties on Glenfall Close and Calder Close, where measurements were taken in March and April, therefore, a comparable location. The second property was No. 6 Kielder Close, where measurements had been taken by Scott Wilson on 22nd April 2010, and also by Stockton Borough Council at the end of March 2010. Whilst this property is further away from the A19(T), it is located on the southernmost boundary of the estate and has unobstructed views towards the trunk road over the adjacent golf course and does not have the benefit of a noise barrier.
7.2 The HA’s TRADS2 database was checked to establish whether traffic flows for the 3-months (January, February & March) data that was available for 2010, had risen in comparison to the corresponding months in 2009. In January 2010, the flows were not representative as the poor weather conditions throughout the month significantly reduced the average weekday traffic flow. However, in February and March, the 18-hour AAWT, 2-way flow was found to have increased by approximately 1,800 vehicles. The percentage of HGVs over the two months had also increased to 16.9%. As a result, it was decided to augment the AAWT data for 2009 to reflect these increases, to ensure a worst case scenario for the predicted calculation process. See Appendix B for the downloaded TRADS2 traffic flow data.
7.3 10, Lowther Close The calculated noise level at this property using the CRTN Prediction Method is
69dB(A).
7.4 6, Kielder Close The calculated noise level at this property using the CRTN Prediction Method is
69dB(A).
7.5 The predicted noise levels are approximately 2dB(A) lower than the levels measured on site for the properties fronting the A19(T) adjacent to the noise barrier; i.e. 10 Lowther Close, 7 Glenfall Close and 20 Calder Close, although measurements at the latter property were abnormally low due to the reduced traffic flow as a result of the incident further south. In normal circumstances, predicted levels would be expected to be higher, as the CRTN methodology usually gives conservative results. It can only be assumed therefore, that traffic speeds along this section of the A19(T) Billingham Bypass, are significantly higher than the prescribed mean speed for the type of road, as advised by the table included under Paragraph 14 of ‘The prediction method (general procedures)’ in Section 1 of CRTN. In addition, as mentioned previously, the difference in the measured levels between the concrete carriageway and the HRA, was 5 dB(A), 3 dB(A) (or 2.5 times the expected decibel increase), higher than the road surface correction for concrete surfaces, as advised in Paragraph 16 in Section 1 of CRTN, which was used for the prediction measurement. (See paragraph 5.8).
A19 Dishforth to Tyne Tunnel DBFO Billingham By-Pass Noise Assessment
16
7.6 However, for the property 6 Kielder Close, the results calculated using the prediction method are similar to those measured on site (although dependant on wind direction). This is due to the angle of view to the A19(T), which is divided between the concrete carriageway and the HRA surfacing.
7.7 Details of the CRTN calculations are included in Appendix E.
8.0 Summary
8.1 It is understood that the main concern for the residents of the Wolviston Court Estate is that the Government’s 10-year Plan at the turn of the century stated that by 2011, all concrete carriageways on the motorway and trunk road network would be replaced. This was later revised so that only those concrete carriageways requiring major maintenance were being replaced.
The condition of the concrete carriageway of the A19(T) in this location is good, and noise levels at frontage properties calculated using the ‘Sift’ criteria, based on the CRTN Prediction methodology, do not wholly support an HA intervention. In addition, the proposed Defra guidelines set the specified minimum levels for intervention by a different method to those specified by the HA’s 1999/2000 ‘sift’ criteria; therefore, it is unlikely that the carriageway will be replaced in the foreseeable future.
8.2 It is apparent by the results from both the predicted and measured levels at these properties, that the existing 3m high timber noise barrier is effectively reflecting traffic noise away from the closest properties to the concrete carriageway of the A19(T) Billingham Bypass, where roadside noise levels are well in excess of the 80dB(A) as specified in the ‘sift’ criteria. However, with façade readings at 69dB(A) and above, particularly with a prevailing south-westerly wind direction, these levels are higher than the acceptable minimum required by the Noise Insulation Regulations (1988), for new or altered roads.
8.3 The existing noise barrier only extends to the southern perimeter boundary hedge/fence of the Wolviston Court Estate. Therefore, the properties located along this southern perimeter of the estate that front onto the golf course, have uninterrupted views across to the A19(T) and the southernmost extent of the concrete carriageway, without the benefit of the noise fence that protects the closer, frontage properties further north.
8.4 The higher than anticipated noise levels measured both at the properties close to and fronting the A19(T) and the levels measured at the carriageway edge, in comparison to those calculated using the CRTN Prediction Method, are therefore assumed to be attributable to three main contributory factors:
1. Higher than average speeds for this type of road, in comparison to the prescribed mean speed of 97km/h suggested in CRTN.
2. In an attempt to reduce excessive traffic noise from concrete carriageways, it is understood that this section of the A19(T) Billingham Bypass carriageway was ribbed as a trial, which instead of having the desired effect of reducing traffic noise, had the opposite detrimental effect, with the measured levels from the concrete carriageway being 5dB(A) higher than those from the adjacent HRA carriageway (3dB(A) or 2.5 times the expected decibel increase over and above hot rolled asphalt).
3. It is apparent from both the Stockton BC and Scott Wilson noise measurements that when the wind is in the prevailing south-westerly direction, traffic noise levels from the A19(T) at each receptor, rose by up to 6dB(A).

A19 Dishforth to Tyne Tunnel DBFO Billingham By-Pass Noise Assessment
17
8.5 Given the above factors, it can therefore be concluded that for a large percentage of the year, most of the A19(T) frontage properties on the Wolviston Court Estate, do indeed experience noise levels that are in excess of 68dB(A), despite the provision of the reflective noise barrier in 2002. This figure is estimated to be 72dB(A) for most frontage properties when the full effect [5dB(A)] of the concrete carriageway is considered. However, the levels do not exceed the minimum level of 76 dB(A) L10(18hour), which is the level required for an area to be identified as a ‘First Priority Location’ under the proposed Defra guidelines, which set the specified minimum levels for intervention by a different method to those given in the HA’s 1999/2000 ‘sift’ criteria.

A19 Dishforth to Tyne Tunnel DBFO Billingham By-Pass Noise Assessment
Appendices

A19 Dishforth to Tyne Tunnel DBFO Billingham By-Pass Noise Assessment
Appendix A Noise Terminology and Perception
A19 Dishforth to Tyne Tunnel DBFO Billingham By-Pass Noise Assessment
Noise Terminology and Perception
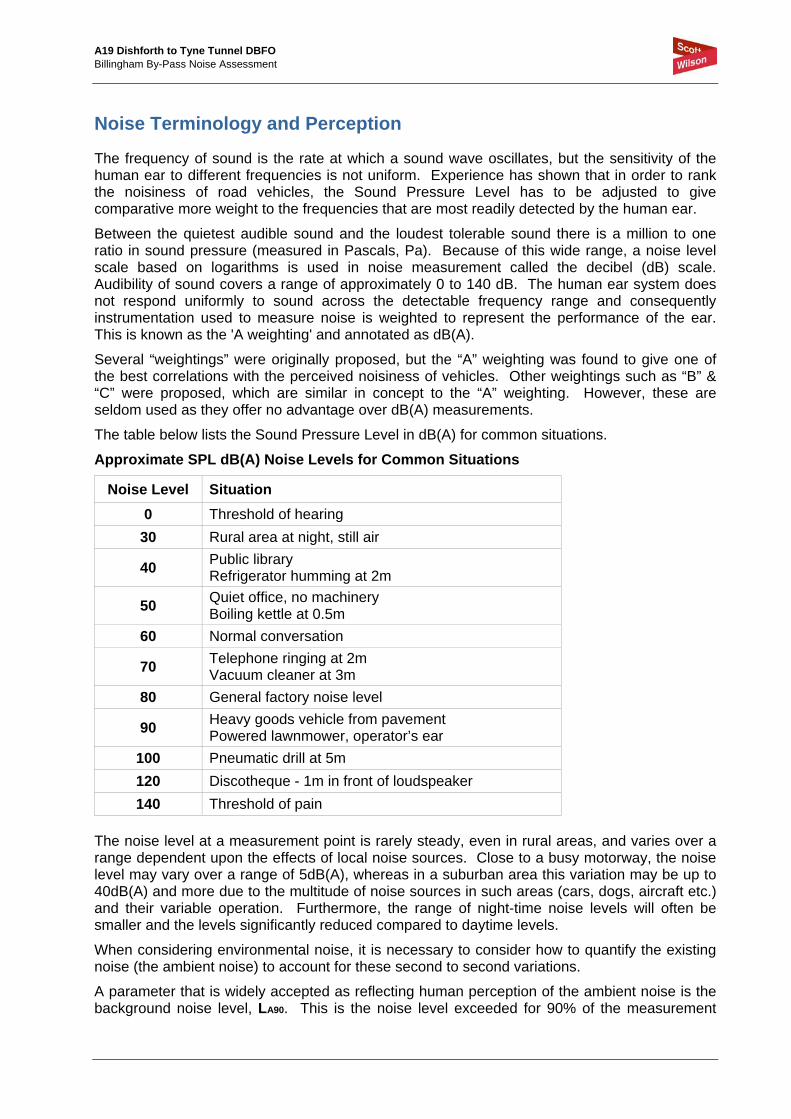
The frequency of sound is the rate at which a sound wave oscillates, but the sensitivity of the human ear to different frequencies is not uniform. Experience has shown that in order to rank the noisiness of road vehicles, the Sound Pressure Level has to be adjusted to give comparative more weight to the frequencies that are most readily detected by the human ear.
Between the quietest audible sound and the loudest tolerable sound there is a million to one ratio in sound pressure (measured in Pascals, Pa). Because of this wide range, a noise level scale based on logarithms is used in noise measurement called the decibel (dB) scale. Audibility of sound covers a range of approximately 0 to 140 dB. The human ear system does not respond uniformly to sound across the detectable frequency range and consequently instrumentation used to measure noise is weighted to represent the performance of the ear. This is known as the 'A weighting' and annotated as dB(A).
Several “weightings” were originally proposed, but the “A” weighting was found to give one of the best correlations with the perceived noisiness of vehicles. Other weightings such as “B” & “C” were proposed, which are similar in concept to the “A” weighting. However, these are seldom used as they offer no advantage over dB(A) measurements.
The table below lists the Sound Pressure Level in dB(A) for common situations.
Approximate SPL dB(A) Noise Levels for Common Situations
Noise Level Situation 0 Threshold of hearing
30 Rural area at night, still air
40 Public library Refrigerator humming at 2m
50 Quiet office, no machinery Boiling kettle at 0.5m
60 Normal conversation
70 Telephone ringing at 2m Vacuum cleaner at 3m
80 General factory noise level
90 Heavy goods vehicle from pavement Powered lawnmower, operator’s ear
100 Pneumatic drill at 5m 120 Discotheque - 1m in front of loudspeaker 140 Threshold of pain
The noise level at a measurement point is rarely steady, even in rural areas, and varies over a range dependent upon the effects of local noise sources. Close to a busy motorway, the noise level may vary over a range of 5dB(A), whereas in a suburban area this variation may be up to 40dB(A) and more due to the multitude of noise sources in such areas (cars, dogs, aircraft etc.) and their variable operation. Furthermore, the range of night-time noise levels will often be smaller and the levels significantly reduced compared to daytime levels.
When considering environmental noise, it is necessary to consider how to quantify the existing noise (the ambient noise) to account for these second to second variations.
A parameter that is widely accepted as reflecting human perception of the ambient noise is the background noise level, LA90. This is the noise level exceeded for 90% of the measurement

A19 Dishforth to Tyne Tunnel DBFO Billingham By-Pass Noise Assessment
period and generally reflects the noise level in the lulls between individual noise events. Over a one hour period, the LA90 will be the noise level exceeded for 54 minutes.
The LA10 is the noise level exceeded for 10% of the time and is the parameter widely used in the assessment of road traffic noise. Over a one hour period, the LA10 will be the noise level exceeded for 6 minutes.
The equivalent continuous A-weighted sound pressure level, LAeq is the single number that represents the total sound energy measured over that period. LAeq is the sound level of a notionally steady sound having the same energy as a fluctuating sound over a specified measurement period. It is commonly used to express the energy level from individual sources that vary in level over their operational cycle.
Human subjects are generally only capable of noticing changes in steady levels of no less than 3dB(A). It is generally accepted that a change of 10dB(A) in an overall, steady noise level is perceived to the human ear as a doubling (or halving) of the noise level. (These findings do not necessarily apply to transient or non-steady noise sources such as changes in noise due to changes in road traffic flow, or intermittent noise sources).

A19 Dishforth to Tyne Tunnel DBFO Billingham By-Pass Noise Assessment
Appendix B Annual Average Weekday (AWT) 18-hour Traffic Flows for 2009/10
(Originating from the Highways Agency’s TRADS On-line Database)

A19 Dishforth to Tyne Tunnel DBFO Billingham By-Pass Noise Assessment
Yearly classified during 2009 for Site 26/4858 NB, A19, A1185-A689, NORTH OF A1027 NORTHBOUND(E444114, N523842)
24hr 18hr 16hr 12hr ATC Month
ADT %>6.6m AWT %>6.6m ADT %>6.6m AWT %6.6m ADT %>6.6m AWT %>6.6m ADT %>6.6m AWT %>6.6m DAY b Jan 29986 14.9 33963 16.5 29139 14.2 33123 15.9 28473 14.2 32436 15.9 25226 14.5 28761 16.2 31 w Feb 31536 15.3 35736 17.1 30650 14.7 34861 16.5 29930 14.7 34109 16.5 26517 14.9 30235 16.8 28 t Mar 33289 14.9 37306 16.8 32379 14.3 36426 16.2 31643 14.4 35670 16.2 27987 14.6 31570 16.5 30 b Apr 32612 14.5 36379 16.3 31720 13.9 35488 15.7 30982 14 34736 15.8 27250 14.2 30622 16.1 29
b May 32717 14.8 36474 16.5 31777 14.2 35544 15.9 31015 14.2 34759 15.9 27211 14.5 30565 16.2 31 s Jun 33605 15.3 37437 17 32545 14.7 36411 16.4 31672 14.7 35566 16.5 27697 15 31233 16.8 30 a Jul 33359 15.6 37044 17.4 32379 15 36066 16.8 31598 15.1 35275 16.9 27583 15.4 30856 17.4 31
bas Aug 33465 15 37053 16.7 32470 14.4 36046 16.1 31668 14.4 35218 16.1 27565 14.8 30733 16.6 31 o Sep 33929 15.4 37369 17.3 32945 14.8 36386 16.7 32200 14.8 35614 16.7 28245 15.1 31288 17.1 30 t Oct 34118 15.3 38059 17.1 33133 14.7 37073 16.5 32370 14.7 36274 16.5 28562 14.9 32002 16.8 29
a Nov 33464 15.6 37576 17.3 32443 14.9 36557 16.6 31694 14.8 35776 16.6 27868 15 31386 16.9 30 bw Dec 28511 14.8 31743 16.4 27584 14.1 30813 15.7 26879 14 30062 15.7 23687 14.2 26433 15.9 31
Avg 32549 15.1 36345 16.9 31597 14.5 35400 16.2 30844 14.5 34625 16.3 27117 14.8 30474 16.6 361
Yearly classified during 2010 for Site 26/4858 NB, A19, A1185-A689, NORTH OF A1027 NORTHBOUND(E444114, N523842)
24hr 18hr 16hr 12hr ATC Month
ADT %>6.6m AWT %>6.6m ADT %>6.6m AWT %6.6m ADT %>6.6m AWT %>6.6m ADT %>6.6m AWT %>6.6m DAY bwr Jan 28093 16.4 32457 17.9 27250 15.6 31594 17.1 26689 15.6 31007 17.1 23647 15.7 27513 17.3 31
r Feb 32536 15.9 36918 17.6 31564 15.1 35927 16.8 30811 15.1 35121 16.8 27186 15.2 30980 17 28 t Mar 33976 15.7 37918 17.5 33008 15 36942 16.8 32263 15 36171 16.8 28428 15.2 31843 17.1 31
Avg 31535 16 35764 17.7 30607 15.3 34821 16.9 29921 15.2 34100 16.9 26420 15.4 30112 17.1 90
b Bank Holiday w Weather a Accident t Time change r Road Works s Sporting Event o Other
Showing only complete days. No estimated data. Not including hidden data.
A19 Dishforth to Tyne Tunnel DBFO Billingham By-Pass Noise Assessment
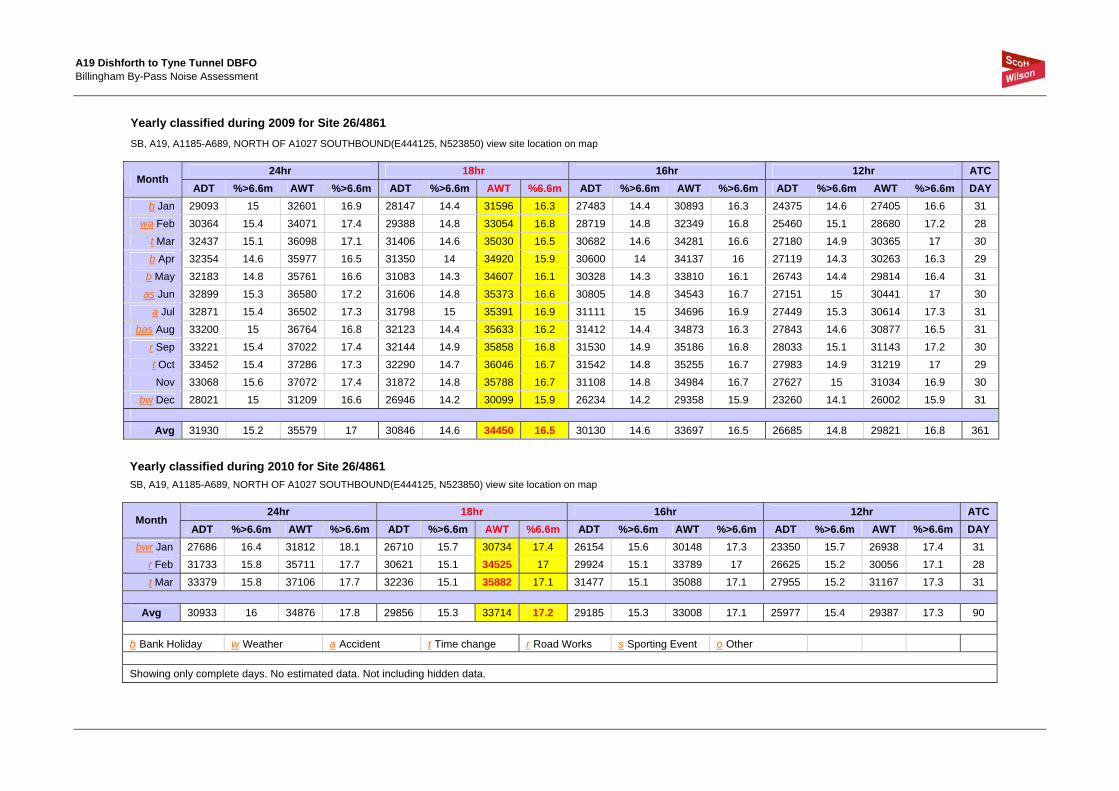
Yearly classified during 2009 for Site 26/4861 SB, A19, A1185-A689, NORTH OF A1027 SOUTHBOUND(E444125, N523850) view site location on map
24hr 18hr 16hr 12hr ATC Month
ADT %>6.6m AWT %>6.6m ADT %>6.6m AWT %6.6m ADT %>6.6m AWT %>6.6m ADT %>6.6m AWT %>6.6m DAY b Jan 29093 15 32601 16.9 28147 14.4 31596 16.3 27483 14.4 30893 16.3 24375 14.6 27405 16.6 31
wa Feb 30364 15.4 34071 17.4 29388 14.8 33054 16.8 28719 14.8 32349 16.8 25460 15.1 28680 17.2 28 t Mar 32437 15.1 36098 17.1 31406 14.6 35030 16.5 30682 14.6 34281 16.6 27180 14.9 30365 17 30 b Apr 32354 14.6 35977 16.5 31350 14 34920 15.9 30600 14 34137 16 27119 14.3 30263 16.3 29
b May 32183 14.8 35761 16.6 31083 14.3 34607 16.1 30328 14.3 33810 16.1 26743 14.4 29814 16.4 31 as Jun 32899 15.3 36580 17.2 31606 14.8 35373 16.6 30805 14.8 34543 16.7 27151 15 30441 17 30
a Jul 32871 15.4 36502 17.3 31798 15 35391 16.9 31111 15 34696 16.9 27449 15.3 30614 17.3 31 bas Aug 33200 15 36764 16.8 32123 14.4 35633 16.2 31412 14.4 34873 16.3 27843 14.6 30877 16.5 31
r Sep 33221 15.4 37022 17.4 32144 14.9 35858 16.8 31530 14.9 35186 16.8 28033 15.1 31143 17.2 30 t Oct 33452 15.4 37286 17.3 32290 14.7 36046 16.7 31542 14.8 35255 16.7 27983 14.9 31219 17 29 Nov 33068 15.6 37072 17.4 31872 14.8 35788 16.7 31108 14.8 34984 16.7 27627 15 31034 16.9 30
bw Dec 28021 15 31209 16.6 26946 14.2 30099 15.9 26234 14.2 29358 15.9 23260 14.1 26002 15.9 31
Avg 31930 15.2 35579 17 30846 14.6 34450 16.5 30130 14.6 33697 16.5 26685 14.8 29821 16.8 361
Yearly classified during 2010 for Site 26/4861 SB, A19, A1185-A689, NORTH OF A1027 SOUTHBOUND(E444125, N523850) view site location on map
24hr 18hr 16hr 12hr ATC Month
ADT %>6.6m AWT %>6.6m ADT %>6.6m AWT %6.6m ADT %>6.6m AWT %>6.6m ADT %>6.6m AWT %>6.6m DAY bwr Jan 27686 16.4 31812 18.1 26710 15.7 30734 17.4 26154 15.6 30148 17.3 23350 15.7 26938 17.4 31
r Feb 31733 15.8 35711 17.7 30621 15.1 34525 17 29924 15.1 33789 17 26625 15.2 30056 17.1 28 t Mar 33379 15.8 37106 17.7 32236 15.1 35882 17.1 31477 15.1 35088 17.1 27955 15.2 31167 17.3 31
Avg 30933 16 34876 17.8 29856 15.3 33714 17.2 29185 15.3 33008 17.1 25977 15.4 29387 17.3 90
b Bank Holiday w Weather a Accident t Time change r Road Works s Sporting Event o Other
Showing only complete days. No estimated data. Not including hidden data.

A19 Dishforth to Tyne Tunnel DBFO Billingham By-Pass Noise Assessment
Appendix C Average Daily Weather Data during Survey Periods

A19 Dishforth to Tyne Tunnel DBFO Billingham By-Pass Noise Assessment
Billingham weather feed from www.billinghamweather.com
20th March 2010 (Stockton BC Survey)
Mar 20 Average and Extremes Average temperature 5.8°C Average humidity 90% Average dewpoint 4.2°C Average barometer 1002.5 hPa Average windspeed 2.5 mph Average gustspeed 3.7 mph Average direction 18° (NNE) Rainfall for month 8.4 mm Rainfall for year 112.9 mm Maximum rain per minute 1.3 mm on day 20 at time 11:54 Maximum temperature 7.4°C on day 20 at time 01:06 Minimum temperature 1.7°C on day 20 at time 23:57 Maximum humidity 98% on day 20 at time 13:17 Minimum humidity 71% on day 20 at time 01:14 Maximum pressure 1007.0 hPa on day 20 at time 23:57 Minimum pressure 1000.0 hPa on day 20 at time 12:35 Maximum windspeed 9.2 mph on day 20 at time 13:38 Maximum gust speed 13 mph from 00 °( N ) on day 20 at time 16:24 Maximum heat index 7.4°C on day 20 at time 01:06

A19 Dishforth to Tyne Tunnel DBFO Billingham By-Pass Noise Assessment
Billingham weather feed from www.billinghamweather.com
21st March 2010 (Stockton BC Survey)
Mar 21 Average and Extremes Average temperature 7.0°C Average humidity 77% Average dewpoint 2.8°C Average barometer 1012.6 hPa Average windspeed 2.9 mph Average gustspeed 4.0 mph Average direction 221° ( SW) Rainfall for month 8.4 mm Rainfall for year 112.9 mm Maximum rain per minute 0.0 mm on day 21 at time 23:57 Maximum temperature 14.0°C on day 21 at time 14:28 Minimum temperature 0.2°C on day 21 at time 06:06 Maximum humidity 98% on day 21 at time 08:27 Minimum humidity 45% on day 21 at time 14:32 Maximum pressure 1015.0 hPa on day 21 at time 23:50 Minimum pressure 1007.0 hPa on day 21 at time 00:35 Maximum windspeed 10.4 mph on day 21 at time 15:35 Maximum gust speed 15 mph from 315 °( NW) on day 21 at time 16:07 Maximum heat index 14.0°C on day 21 at time 14:28
A19 Dishforth to Tyne Tunnel DBFO Billingham By-Pass Noise Assessment
Billingham weather feed from www.billinghamweather.com
24th March 2010
Mar 24 Average and Extremes Average temperature 11.1°C Average humidity 82% Average dewpoint 7.9°C Average barometer 1002.8 hPa Average windspeed 4.2 mph Average gustspeed 5.8 mph Average direction 160° (SSE) Rainfall for month 10.5 mm Rainfall for year 115.0 mm Maximum rain per minute 0.0 mm on day 24 at time 23:57 Maximum temperature 14.4°C on day 24 at time 13:18 Minimum temperature 8.1°C on day 24 at time 04:50 Maximum humidity 97% on day 24 at time 23:57 Minimum humidity 65% on day 24 at time 13:42 Maximum pressure 1006.0 hPa on day 24 at time 05:19 Minimum pressure 1000.0 hPa on day 24 at time 17:34 Maximum windspeed 11.5 mph on day 24 at time 13:50 Maximum gust speed 20 mph from 225 °( SW) on day 24 at time 00:50 Maximum heat index 14.4°C on day 24 at time 13:18

A19 Dishforth to Tyne Tunnel DBFO Billingham By-Pass Noise Assessment
Billingham weather feed from www.billinghamweather.com
25th March 2010
Mar 25 Average and Extremes Average temperature 10.9°C Average humidity 84% Average dewpoint 7.9°C Average barometer 997.4 hPa Average windspeed 2.9 mph Average gustspeed 4.2 mph Average direction 103° (ESE) Rainfall for month 26.3 mm Rainfall for year 130.8 mm Maximum rain per minute 1.3 mm on day 25 at time 04:54 Maximum temperature 16.6°C on day 25 at time 14:58 Minimum temperature 7.3°C on day 25 at time 08:05 Maximum humidity 98% on day 25 at time 12:25 Minimum humidity 45% on day 25 at time 15:38 Maximum pressure 1003.0 hPa on day 25 at time 01:34 Minimum pressure 991.0 hPa on day 25 at time 23:57 Maximum windspeed 12.7 mph on day 25 at time 23:31 Maximum gust speed 18 mph from 180 °( S ) on day 25 at time 23:30 Maximum heat index 16.6°C on day 25 at time 14:58

A19 Dishforth to Tyne Tunnel DBFO Billingham By-Pass Noise Assessment
Billingham weather feed from www.billinghamweather.com
22nd April 2010
Apr 22 Average and Extremes Average temperature 8.1°C Average humidity 50% Average dewpoint -2.9°C Average barometer 1016.8 hPa Average windspeed 2.7 mph Average gustspeed 3.9 mph Average direction 283° (WNW) Rainfall for month 19.5 mm Rainfall for year 168.5 mm Maximum rain per minute 0.0 mm on day 22 at time 23:57 Maximum temperature 16.7°C on day 22 at time 14:08 Minimum temperature -1.0°C on day 22 at time 04:19 Maximum humidity 87% on day 22 at time 04:52 Minimum humidity 26% on day 22 at time 12:24 Maximum pressure 1021.0 hPa on day 22 at time 01:15 Minimum pressure 1014.0 hPa on day 22 at time 22:29 Maximum windspeed 9.2 mph on day 22 at time 15:55 Maximum gust speed 14 mph from 315 °( NW) on day 22 at time 11:57 Maximum heat index 16.7°C on day 22 at time 14:08

A19 Dishforth to Tyne Tunnel DBFO Billingham By-Pass Noise Assessment
Billingham weather feed from www.billinghamweather.com
23rd April 2010
Apr 23 Average and Extremes Average temperature 10.1°C Average humidity 49% Average dewpoint -0.7°C Average barometer 1014.5 hPa Average windspeed 2.4 mph Average gustspeed 3.5 mph Average direction 231° ( SW) Rainfall for month 19.5 mm Rainfall for year 168.5 mm Maximum rain per minute 0.0 mm on day 23 at time 23:57 Maximum temperature 17.2°C on day 23 at time 15:36 Minimum temperature 3.3°C on day 23 at time 05:15 Maximum humidity 74% on day 23 at time 06:57 Minimum humidity 31% on day 23 at time 18:14 Maximum pressure 1015.0 hPa on day 23 at time 23:57 Minimum pressure 1013.0 hPa on day 23 at time 17:59 Maximum windspeed 9.2 mph on day 23 at time 16:55 Maximum gust speed 14 mph from 225 °( SW) on day 23 at time 16:42 Maximum heat index 17.2°C on day 23 at time 15:36
A19 Dishforth to Tyne Tunnel DBFO Billingham By-Pass Noise Assessment
Appendix D Measurement Results from Scott Wilson Surveys

A19 Dishforth to Tyne Tunnel DBFO Billingham By-Pass Noise Assessment
7 Glenfall Close Noise Measurements - A19(T) Billingham Bypass Site: Billingham Bypass Property No. 7 Glenfall Close Date: 24th March 2010
Weather: Cloudy/dry Wind Direction at time of survey: South/S-Westerly/Calm
Period Time Period Max Leq L10 L50 L90 L95 1 14:00 - 14:05 74.5 69.5 71.5 69.0 66.5 66.0
2 14:05 - 14:10 72.5 68.7 70.5 68.5 66.5 66.0
3 14:10 - 14:15 75.3 68.7 70.5 68.5 66.0 65.0
4 14:15 - 14:20 74.5 69.6 71.0 69.5 67.5 67.0
5 14:20 - 14:25 74.3 68.7 70.5 68.5 66.0 65.5
6 14:25 - 14:30 74.1 69.3 71.0 69.0 67.0 66.0
7 14:30 - 14:35 74.8 69.5 71.0 69.5 67.0 66.5
8 14:35 - 14:40 73.6 68.9 70.5 68.5 67.0 66.5
9 14:40 - 14:45 73.9 68.6 70.5 68.5 66.0 65.0
10 14:45 - 14:50 74.9 70.0 72.0 69.5 67.0 66.5
11 14:50 - 14:55 73.3 69.0 70.5 69.0 67.0 66.5
12 14:55 - 15:00 73.3 69.6 71.0 69.5 67.0 66.0
13 15:00 - 15:05 76.2 70.3 72.5 69.5 67.0 66.0
14 15:05 - 15:10 75.2 70.7 72.5 70.5 68.0 67.0
15 15:10 - 15:15 76.1 70.0 72.0 69.5 68.0 67.0
16 15:15 - 15:20 73.1 68.6 70.0 68.5 67.0 67.0
17 15:20 - 15:25 73.9 70.2 72.0 70.0 67.5 67.0
18 15:25 - 15:30 82.9 70.3 72.0 70.0 68.0 67.5
19 15:30 - 15:35 73.7 70.0 71.5 70.0 68.0 67.0
20 15:35 - 15:40 75.6 71.3 73.0 71.0 68.5 68.0
21 15:40 - 15:45 74.5 69.5 71.5 69.0 67.0 66.5
22 15:45 - 15:50 75.3 69.6 71.5 69.5 67.5 67.0
23 15:50 - 15:55 81.7 68.0 70.0 67.5 64.0 63.5
24 15:55 - 16:00 73.1 67.1 69.5 66.5 64.0 63.5
25 16:00 - 16:05 71.4 66.6 68.5 66.5 64.0 63.5
26 16:05 - 16:10 72.0 67.3 69.5 67.0 64.5 64.0
27 16:10 - 16:15 74.3 69.5 71.0 69.5 67.0 66.5
28 16:15 - 16:20 73.0 69.6 71.0 69.5 68.0 67.5
29 16:20 - 16:25 70.8 66.5 68.0 66.5 64.5 64.0
30 16:25 - 16:30 72.4 69.0 70.0 69.0 68.0 67.5
A19 Dishforth to Tyne Tunnel DBFO Billingham By-Pass Noise Assessment
Period Time Period Max Leq L10 L50 L90 L95 31 16:30 - 16:35 76.6 69.4 71.0 68.5 67.0 64.0
32 16:35 - 16:40 74.9 69.9 71.5 69.5 68.0 67.5
33 16:40 - 16:45 74.7 69.8 71.5 69.5 68.0 67.5
34 16:45 - 16:50 75.9 71.6 73.5 71.0 69.5 69.0
35 16:50 - 16:55 75.1 70.6 72.5 70.0 68.5 68.0
36 16:55 - 17:00 74.7 70.0 72.0 69.5 68.0 67.5
Leq Average (14:00 – 17:00 hrs) 69.3
L10 Average (14:00 – 17:00 hrs) 71.1
L90 Average (14:00 – 17:00 hrs) 66.9
L10 Average 18-hour (06:00 – 00:00 hrs) 70.1
A19 Dishforth to Tyne Tunnel DBFO Billingham By-Pass Noise Assessment
Layby - HRA
Noise Measurement Spreadsheet - A19(T) Billingham Bypass Site: Billingham Bypass Location: Southbound Layby, adjacent to HRA C'way. Date: 25th March 2010
Weather: Cloudy/damp Wind Direction at time of survey: East/S-Easterly/calm
Period Time Period Max Leq L10 L50 L90 L95 1 10:00 - 10:05 93.9 85.9 89.0 85.0 79.0 78.0
2 10:05 - 10:10 93.1 85.5 88.5 84.5 78.5 77.0
3 10:10 - 10:15 93.6 85.7 89.0 84.5 79.0 78.5
4 10:15 - 10:20 93.2 85.8 88.5 85.0 80.5 79.0
5 10:20 - 10:25 93.4 85.3 88.5 84.0 78.5 76.5
6 10:25 - 10:30 92.9 85.4 88.5 84.5 79.0 77.5
7 10:30 - 10:35 93.0 84.3 88.0 82.5 76.5 74.0
8 10:35 - 10:40 92.9 85.5 88.5 84.5 79.0 77.0
9 10:40 - 10:45 93.2 85.2 88.5 84.0 78.0 76.5
10 10:45 - 10:50 93.3 85.4 88.5 84.5 79.0 76.5
11 10:50 - 10:55 93.0 85.2 88.5 84.0 78.0 76.5
12 10:55 - 11:00 93.3 85.2 88.0 84.0 79.0 77.5
13 11:00 - 11:05 93.7 84.7 88.0 83.5 78.0 76.0
14 11:05 - 11:10 93.0 84.9 88.0 83.5 78.0 77.0
15 11:10 - 11:15 93.1 85.1 88.5 84.0 78.5 77.0
16 11:15 - 11:20 93.1 84.4 88.0 83.0 76.5 74.5
17 11:20 - 11:25 92.7 84.0 88.0 83.0 77.5 76.0
18 11:25 - 11:30 94.8 84.4 87.5 83.5 78.0 77.0
19 11:30 - 11:35 94.4 85.3 88.5 84.0 77.5 75.5
20 11:35 - 11:40 94.0 85.2 88.5 84.0 78.0 76.5
21 11:40 - 11:45 96.6 85.1 88.5 83.5 77.5 76.0
22 11:45 - 11:50 92.8 84.9 88.0 83.5 77.5 76.0
23 11:50 - 11:55 93.0 84.7 88.5 82.5 77.5 74.5
24 11:55 - 12:00 93.2 85.0 88.0 83.5 78.5 76.5
25 12:00 - 12:05 92.7 84.7 88.0 83.5 78.5 77.5
26 12:05 - 12:10 92.1 84.9 88.0 84.0 79.0 77.5
27 12:10 - 12:15 92.6 85.1 88.5 84.0 77.0 74.5
28 12:15 - 12:20 93.5 85.8 88.5 84.5 79.0 77.5
29 12:20 - 12:25 93.4 85.6 88.5 84.5 79.0 77.0
30 12:25 - 12:30 93.7 85.6 89.0 84.0 79.0 77.5

A19 Dishforth to Tyne Tunnel DBFO Billingham By-Pass Noise Assessment
Period Time Period Max Leq L10 L50 L90 L95 31 12:30 - 12:35 94.5 86.2 89.5 85.5 79.5 78.0
32 12:35 - 12:40 93.4 85.6 89.0 84.5 79.5 78.5
33 12:40 - 12:45 95.2 86.1 89.5 84.5 79.0 77.5
34 12:45 - 12:50 97.5 86.1 89.0 85.5 79.5 78.0
35 12:50 - 12:55 93.8 85.5 88.5 84.5 78.0 76.5
36 12:55 - 13:00 93.6 86.0 89.0 85.0 79.5 77.5
Leq Average (10:00 – 13:00 hrs) 85.3
L10 Average (10:00 – 13:00 hrs) 88.5
L90 Average (10:00 – 13:00 hrs) 78.4
L10 Average 18-hour (06:00 – 00:00 hrs) 87.5

A19 Dishforth to Tyne Tunnel DBFO Billingham By-Pass Noise Assessment
Layby – Concrete Noise Measurement Spreadsheet - A19(T) Billingham Bypass Site: Billingham Bypass Location: Southbound Layby, adjacent to Concrete C'way. Date: 24th March 2010
Weather: Cloudy/dry Wind Direction at time of survey: East/S-Easterly/Calm
Period Time Period Max Leq L10 L50 L90 L95 1 14:00 - 14:05 98.8 90.8 93.5 90.0 83.5 82.0
2 14:05 - 14:10 100.3 90.8 94.0 89.0 82.0 81.0
3 14:10 - 14:15 99.1 90.9 94.0 90.0 83.5 82.5
4 14:15 - 14:20 99.8 90.2 93.5 89.0 83.0 81.5
5 14:20 - 14:25 100.2 90.8 94.0 89.5 83.5 82.5
6 14:25 - 14:30 99.5 90.9 94.0 89.5 84.5 83.5
7 14:30 - 14:35 99.0 89.9 93.0 88.0 82.5 81.5
8 14:35 - 14:40 99.1 90.3 93.5 89.0 83.0 82.0
9 14:40 - 14:45 99.7 89.7 93.5 87.0 81.5 80.5
10 14:45 - 14:50 98.9 89.9 93.5 88.0 82.5 81.5
11 14:50 - 14:55 98.8 90.4 93.5 89.0 83.5 82.5
12 14:55 - 15:00 101.7 90.7 93.5 89.5 83.0 82.0
13 15:00 - 15:05 100.4 90.1 93.0 88.5 84.5 83.5
14 15:05 - 15:10 100.6 90.8 93.5 89.5 84.5 83.5
15 15:10 - 15:15 98.3 90.9 93.5 90.0 84.0 82.0
16 15:15 - 15:20 98.5 90.6 93.5 90.0 84.5 83.5
17 15:20 - 15:25 99.1 91.3 94.0 90.5 86.0 84.0
18 15:25 - 15:30 99.8 90.6 93.5 89.5 83.5 82.5
19 15:30 - 15:35 98.9 90.5 93.0 89.5 83.5 82.5
20 15:35 - 15:40 98.9 90.4 93.5 89.5 83.0 82.0
21 15:40 - 15:45 99.5 91.1 94.0 90.0 85.0 83.5
22 15:45 - 15:50 99.7 91.5 94.0 91.0 85.5 84.5
23 15:50 - 15:55 99.0 90.9 93.5 90.0 83.5 81.5
24 15:55 - 16:00 98.2 90.7 93.5 90.0 84.5 83.0
25 16:00 - 16:05 99.4 91.1 94.0 90.5 85.5 84.0
26 16:05 - 16:10 99.7 90.9 93.5 90.0 86.0 85.0
27 16:10 - 16:15 100.1 91.1 94.0 90.0 85.5 84.5
28 16:15 - 16:20 98.8 91.5 94.0 91.0 87.0 85.5
29 16:20 - 16:25 99.7 91.5 94.0 91.0 86.0 85.0
30 16:25 - 16:30 99.4 90.8 93.5 90.0 86.0 85.5

A19 Dishforth to Tyne Tunnel DBFO Billingham By-Pass Noise Assessment
Period Time Period Max Leq L10 L50 L90 L95 31 16:30 - 16:35 98.1 90.1 93.0 89.5 84.0 82.5
32 16:35 - 16:40 98.7 90.9 93.5 90.0 85.5 84.0
33 16:40 - 16:45 99.6 90.8 93.5 90.0 85.5 84.5
34 16:45 - 16:50 98.8 90.8 93.5 90.0 86.0 84.5
35 16:50 - 16:55 99.1 90.6 93.0 90.0 84.5 83.0
36 16:55 - 17:00 92.6 83.7 86.5 82.5 79.0 78.5
Leq Average (14:00 – 17:00 hrs) 90.5
L10 Average (14:00 – 17:00 hrs) 93.4
L90 Average (14:00 – 17:00 hrs) 84.1
L10 Average 18-hour (06:00 – 00:00 hrs) 92.4

A19 Dishforth to Tyne Tunnel DBFO Billingham By-Pass Noise Assessment
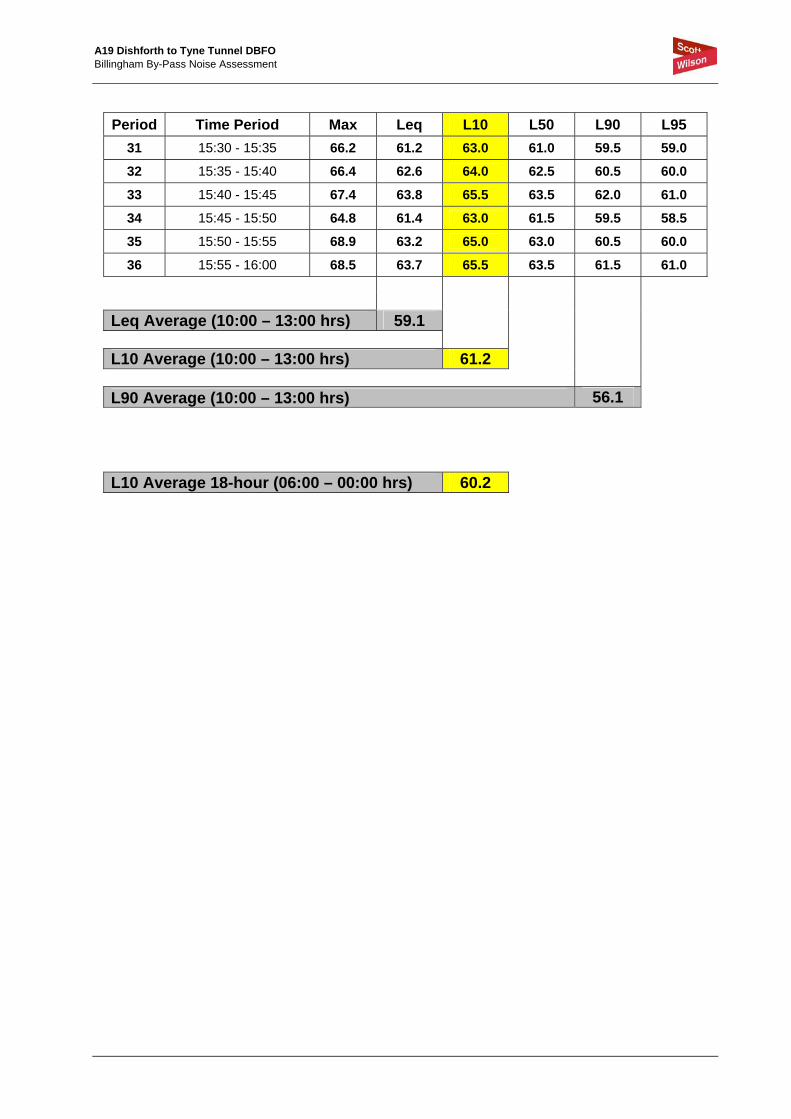
6 Kielder Close Noise Measurement Spreadsheet - A19(T) Billingham Bypass Site: Billingham Bypass Location: Date: 22nd April 2010
Weather: Sunny/dry Wind Direction at time of survey: West/N-Westerly/Calm
Period Time Period Max Leq L10 L50 L90 L95 1 13:00 - 13:05 69.3 54.2 56.5 53.0 50.5 50.0
2 13:05 - 13:10 73.8 57.3 59.0 56.5 54.5 54.0
3 13:10 - 13:15 64.7 57.8 59.8 57.5 55.0 54.5
4 13:15 - 13:20 62.1 57.0 59.5 56.5 53.5 52.5
5 13:20 - 13:25 63.1 56.2 60.0 55.0 52.0 51.5
6 13:25 - 13:30 59.9 55.6 57.5 55.0 53.0 52.5
7 13:30 - 13:35 61.3 54.4 56.0 54.0 52.5 52.0
8 13:35 - 13:40 60.9 55.2 57.5 54.5 53.0 52.5
9 13:40 - 13:45 59.6 54.5 56.5 54.5 51.5 51.0
10 13:45 - 13:50 58.9 55.0 56.5 55.0 53.0 52.5
11 13:50 - 13:55 60.0 56.0 57.5 56.0 53.0 52.5
12 13:55 - 14:00 63.4 57.4 59.5 57.0 54.0 53.5
13 14:00 - 14:05 59.6 54.9 56.5 54.5 52.5 52.0
14 14:05 - 14:10 64.9 56.3 58.5 55.5 53.0 53.0
15 14:10 - 14:15 64.8 60.1 62.0 59.5 58.0 57.5
16 14:15 - 14:20 68.9 63.1 65.5 62.5 60.0 59.0
17 14:20 - 14:25 68.0 62.0 64.5 61.0 58.5 57.5
18 14:25 - 14:30 65.7 59.5 62.0 58.5 55.5 54.0
19 14:30 - 14:35 61.6 57.7 59.5 57.5 55.0 54.5
20 14:35 - 14:40 65.7 58.3 60.0 58.0 55.5 55.0
21 14:40 - 14:45 66.7 60.8 63.5 60.0 57.0 56.0
22 14:45 - 14:50 69.1 61.8 64.5 61.0 58.0 57.5
23 14:50 - 14:55 67.2 61.3 63.5 61.0 58.5 58.0
24 14:55 - 15:00 67.9 60.9 63.0 60.5 58.0 57.5
25 15:00 - 15:05 68.5 61.2 63.5 60.5 57.5 57.0
26 15:05 - 15:10 66.8 58.8 62.0 57.0 54.0 52.5
27 15:10 - 15:15 65.3 60.0 62.5 59.5 55.5 55.0
28 15:15 - 15:20 65.6 60.8 63.5 60.0 56.5 55.5
29 15:20 - 15:25 69.3 63.8 66.0 63.0 61.5 61.0
30 15:25 - 15:30 66.4 60.3 62.5 59.5 57.5 57.0
A19 Dishforth to Tyne Tunnel DBFO Billingham By-Pass Noise Assessment
Period Time Period Max Leq L10 L50 L90 L95 31 15:30 - 15:35 66.2 61.2 63.0 61.0 59.5 59.0
32 15:35 - 15:40 66.4 62.6 64.0 62.5 60.5 60.0
33 15:40 - 15:45 67.4 63.8 65.5 63.5 62.0 61.0
34 15:45 - 15:50 64.8 61.4 63.0 61.5 59.5 58.5
35 15:50 - 15:55 68.9 63.2 65.0 63.0 60.5 60.0
36 15:55 - 16:00 68.5 63.7 65.5 63.5 61.5 61.0
Leq Average (10:00 – 13:00 hrs) 59.1
L10 Average (10:00 – 13:00 hrs) 61.2
L90 Average (10:00 – 13:00 hrs) 56.1
L10 Average 18-hour (06:00 – 00:00 hrs) 60.2

A19 Dishforth to Tyne Tunnel DBFO Billingham By-Pass Noise Assessment
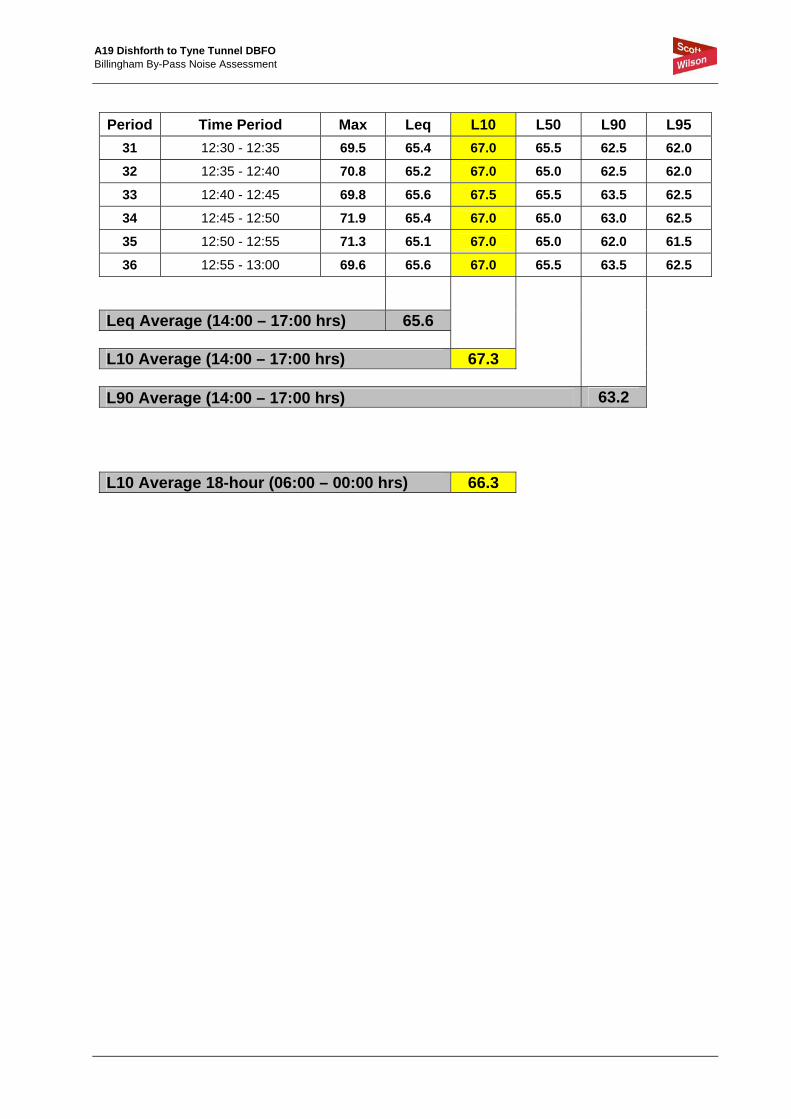
20 Calder Close Noise Measurement Spreadsheet - A19(T) Billingham Bypass Site: Billingham Bypass Location: Date: 22nd April 2010
Weather: Cloudy/dry Wind Direction at time of survey: South-westerly/Calm
Period Time Period Max Leq L10 L50 L90 L95 1 10:00 - 10:05 70.6 66.3 68.0 66.0 63.5 62.0
2 10:05 - 10:10 69.7 65.4 67.0 65.5 63.0 62.5
3 10:10 - 10:15 69.0 64.6 66.5 64.5 62.0 61.0
4 10:15 - 10:20 69.4 65.2 67.0 65.0 62.5 62.0
5 10:20 - 10:25 70.3 64.4 66.0 64.0 61.5 61.0
6 10:25 - 10:30 69.8 65.5 67.0 65.5 63.0 62.0
7 10:30 - 10:35 71.3 66.0 67.5 66.0 63.5 62.0
8 10:35 - 10:40 71.7 66.4 68.0 66.5 64.0 63.0
9 10:40 - 10:45 71.3 66.0 67.5 66.0 63.5 63.0
10 10:45 - 10:50 70.7 66.1 67.5 66.0 64.0 63.5
11 10:50 - 10:55 71.2 66.6 68.0 66.5 64.5 64.0
12 10:55 - 11:00 70.8 65.4 67.5 65.0 62.5 62.0
13 11:00 - 11:05 69.6 65.3 67.0 65.0 62.0 61.5
14 11:05 - 11:10 69.9 66.0 67.5 66.0 63.5 63.0
15 11:10 - 11:15 70.4 65.8 67.5 65.5 64.0 63.0
16 11:15 - 11:20 68.6 65.4 67.0 65.5 63.5 63.0
17 11:20 - 11:25 69.5 65.8 67.5 65.5 63.5 63.0
18 11:25 - 11:30 71.9 66.2 68.0 66.0 63.5 63.0
19 11:30 - 11:35 70.8 66.0 68.0 66.0 63.0 62.0
20 11:35 - 11:40 70.7 66.1 67.5 66.0 64.0 63.5
21 11:40 - 11:45 70.1 65.6 67.0 65.5 63.0 62.0
22 11:45 - 11:50 70.1 66.0 67.5 66.0 64.0 63.5
23 11:50 - 11:55 70.9 65.8 67.0 65.5 64.0 63.5
24 11:55 - 12:00 69.1 65.6 67.0 65.5 64.0 63.0
25 12:00 - 12:05 69.1 65.1 66.5 65.0 63.0 61.5
26 12:05 - 12:10 70.4 65.3 67.0 65.0 62.5 61.5
27 12:10 - 12:15 72.4 65.6 67.5 65.5 63.5 62.5
28 12:15 - 12:20 69.2 65.3 67.0 65.0 63.0 62.0
29 12:20 - 12:25 70.7 65.7 67.5 65.5 63.0 62.5
30 12:25 - 12:30 69.4 65.9 67.5 66.0 63.5 62.5
A19 Dishforth to Tyne Tunnel DBFO Billingham By-Pass Noise Assessment
Period Time Period Max Leq L10 L50 L90 L95 31 12:30 - 12:35 69.5 65.4 67.0 65.5 62.5 62.0
32 12:35 - 12:40 70.8 65.2 67.0 65.0 62.5 62.0
33 12:40 - 12:45 69.8 65.6 67.5 65.5 63.5 62.5
34 12:45 - 12:50 71.9 65.4 67.0 65.0 63.0 62.5
35 12:50 - 12:55 71.3 65.1 67.0 65.0 62.0 61.5
36 12:55 - 13:00 69.6 65.6 67.0 65.5 63.5 62.5
Leq Average (14:00 – 17:00 hrs) 65.6
L10 Average (14:00 – 17:00 hrs) 67.3
L90 Average (14:00 – 17:00 hrs) 63.2
L10 Average 18-hour (06:00 – 00:00 hrs) 66.3
A19 Dishforth to Tyne Tunnel DBFO Billingham By-Pass Noise Assessment
Appendix E CRTN Predicted Calculations at 10 Lowther Close and 6 Kielder Close

A19 Dishforth to Tyne Tunnel DBFO Billingham By-Pass Noise Assessment
OBJECT: To predict the value of L10 (18 hour) at a reception point 1m from the property façade and at first floor level, 4m above the ground in the vicinity of the A19(T) near Billingham
STAGE 1. SEGMENT ROAD SCHEME: The A19 is on embankment with grass banks. The site is open with no changes in traffic variables and the separation between the two carriageways is 2.5m. However, as there is a change to the road surface with both HRA and concrete and a variation in the propagation conditions, the road is treated as two segments
STAGE 2. BASIC NOISE LEVEL: The A19 is dual 2-lane carriageway and has a 120kph speed limit. The road surface for Segment 1 is concrete and a surface correction is required
A19 Billingham – 6 Kielder Close A19 Billingham – 6 Kielder Close Segment 1 Segment 2
Segment 1 Segment 2
Traffic flow Q CHART 3 veh/18-hour day 71,638 71,638 L10 (18-hour) dB(A) 77.7 77.7 Traffic speed V km/h 117 117 CHART 4 Heavy vehicles p % 16.9% 16.9% correction dB(A) + 6.4 + 6.4 Gradient G % 2.4% 2.4% CHART 6 correction dB(A) + 0.7 + 0.7 Road surface Concrete HRA correction dB(A) + 2.0 -
Basic Noise Level dB(A) 86.8 84.8 STAGE 3. PROPAGATION : For Segment 1 the road is predominately within a cutting, and therefore, the view of the source line is obstructed, for Segment 2 the road is predominately on an embankment and the view is not obstructed
A19 Billingham – 6 Kielder Close A19 Billingham – 6 Kielder Close Segment 1 Segment 2
Segment 1 Segment 2
Shortest horiz. distance d m 179.2m 137.31m CHART 7 Height relative to source h m +12.5m 13.26m correction dB(A) - 11.3 - 12.5 Average ht. of propagation H m - 3.8m CHART 8 Absorbent ground cover I - 1.0 correction dB(A) - - 5.5 CHART 9 Barrier path difference δ m 0.03 (Shad) - correction dB(A) - 7.6 -
Propagation Correction dB(A) - 18.9 - 18.0
STAGE 4. SITE LAYOUT : A façade correction is required (para 26.1, CRTN 1988). There is no reflection.
A19 Billingham – 6 Kielder Close A19 Billingham – 6 Kielder Close Segment 1 Segment 2
Segment 1 Segment 2
Façade correction dB(A) + 2.5 + 2.5 Opposite façade angle θ’ deg. - reflection correction dB(A) - - Angle of view segment θ deg. 93o 31o CHART 10 correction dB(A) - 2.9 -7 .6
Site Layout Correction dB(A) - 0.4 - 5.1 STAGE 5. OVERALL NOISE LEVELS :
A19 Billingham – 6 Kielder Close Segment 1 Segment 2
Basic Noise Level dB(A) 86.8 84.8 Propagation Correction dB(A) - 18.9 - 18.0 Site Layout Correction dB(A) - 0.4 - 5.1
A19(T) BILLINGHAM BYPASS 6 Kielder Close – Existing Predicted Traffic Noise Level = 69 dB(A) Noise Contributions dB(A) 67.5 61.7
CHART 11 (if required) Combined Noise Level dB(A) 68.5
Rounding to the nearest whole number, the predicted value of L10 (18 hour) 69 dB(A)

A19 Dishforth to Tyne Tunnel DBFO Billingham By-Pass Noise Assessment
OBJECT: To predict the value of L10 (18 hour) at a reception point 1m from the property façade and at first floor level, 4m above the ground in the vicinity of the A19(T) near Billingham
STAGE 1. SEGMENT ROAD SCHEME: The A19 is in cutting with wooded banks. The site is open with no changes in traffic variables, propagation conditions and the separation between the two carriageways is 2.5m. The road can therefore be treated as a single segment
STAGE 2. BASIC NOISE LEVEL: The A19 is dual 2-lane carriageway and has a 120kph speed limit. The road surface is concrete and a surface correction is required
A19 Billingham – 10 Lowther Close A19 Billingham – 10 Lowther Close Segment 1 Segment 2
Segment 1 Segment 2
Traffic flow Q CHART 3 veh/18-hour day 71,638 L10 (18-hour) dB(A) 77.7 Traffic speed V km/h 120 (-0.0) CHART 4 Heavy vehicles p % 16.9% correction dB(A) + 6.6 (+ 0.0) Gradient G % 0% CHART 6 correction dB(A) + 0.0 Road surface Concrete correction dB(A) + 2.0
Basic Noise Level dB(A) 86.3 STAGE 3. PROPAGATION : The road is within a cutting, with a barrier situated at the top, therefore, the view of the source line is obstructed
A19 Billingham – 10 Lowther Close A19 Billingham – 10 Lowther Close Segment 1 Segment 2
Segment 1 Segment 2
Shortest horiz. distance d m 43.2m CHART 7 Height relative to source h m +9.58m correction dB(A) - 5.5 Average ht. of propagation H m - CHART 8 Absorbent ground cover I - correction dB(A) - CHART 9 Barrier path difference δ m 0.67 (Shad) correction dB(A) - 14.0
Propagation Correction dB(A) - 19.5
STAGE 4. SITE LAYOUT : A façade correction is required (para 26.1, CRTN 1988). There are large farm buildings opposite which provide some reflection
A19 Billingham – 10 Lowther Close A19 Billingham – 10 Lowther Close Segment 1 Segment 2 Segment 1 Segment 2
Façade correction dB(A) + 2.5 Opposite façade angle θ’ deg. 23o reflection correction dB(A) + 0.2 Angle of view segment θ deg. 169o CHART 10 correction dB(A) - 0.3
Site Layout Correction dB(A) + 2.4 STAGE 5. OVERALL NOISE LEVELS :
A19 Billingham – 10 Lowther Close Segment 1 Segment 2
Basic Noise Level dB(A) 86.3 Propagation Correction dB(A) - 19.5
Site Layout Correction dB(A) + 2.4
A19(T) BILLINGHAM BYPASS 10 Lowther Close – Existing Predicted Traffic Noise Level = 69 dB(A) Noise Contributions dB(A) 69.2
CHART 11 (if required) Combined Noise Level dB(A) -
Rounding to the nearest whole number, the predicted value of L10 (18 hour) 69 dB(A)