a viscosity-dependent affinity sensor for continous - infoscience
TRANSCRIPT

POUR L'OBTENTION DU GRADE DE DOCTEUR ÈS SCIENCES
acceptée sur proposition du jury:
Prof. H. Bleuler, président du juryProf. P. Ryser, directeur de thèse
Dr H. Knapp, rapporteur Prof. S. Mougiakakou, rapporteur
Prof. Ph. Renaud, rapporteur
A Viscosity-Dependent Affinity Sensor for Continous Monitoring of Glucose in Biological Fluids
THÈSE NO 5324 (2012)
ÉCOLE POLYTECHNIQUE FÉDÉRALE DE LAUSANNE
PRÉSENTÉE LE 5 AvRIL 2012
À LA FACULTÉ DES SCIENCES ET TECHNIQUES DE L'INGÉNIEURLABORATOIRE DE PRODUCTION MICROTECHNIQUE 2
PROGRAMME DOCTORAL EN SYSTÈMES DE PRODUCTION ET ROBOTIQUE
Suisse2012
PAR
Christophe BOSS


Abstract
For fifty years, tremendous efforts have been directed towards the devel-opment of glucose sensors for tight glycemic control of diabetic patients.Today, millions of diabetics test their blood glucose level daily, makingglucose the most commonly tested analyte. Recently, subcutaneous im-plantable needle-type sensors became commercially available for continu-ous glucose monitoring. However, these devices require frequent calibra-tions and are lacking accuracy and reliability. They are based on electro-chemical detection, which is strongly affected by the biological environ-ment in which the sensor is placed. In addition, an accurate and reliablecontinuous glucose sensor would also be of great interest for tight glycemiccontrol in intensive care units of hospitals. However, despite the many im-pressive breakthroughs, the development of clinically accurate continuousglucose sensors remains a challenge.
In this context, alternative approaches to overcome the limitation ofelectrochemical methods have been actively investigated. Among these,affinity sensing should offer several intrinsic advantages for in vivo mon-itoring. In this thesis, we investigate a novel viscosity-dependent affinitysensor for continuous monitoring of glucose in biological fluids such asblood and plasma. The sensing principle relies upon the viscosity varia-tion of a sensitive fluid with glucose concentration. The sensitive fluid isbased on the competitive binding of glucose and dextran with a glucose-specific binding protein, Concanavalin A. Basically, the sensor is filled withthe sensitive fluid, and includes both an actuating and a sensing piezo-electric diaphragm as well as a flow-resistive microchannel. In addition,a nanoporous alumina membrane completely retains the sensitive fluidwithin the sensor whilst allowing glucose permeation through the mem-brane.
The sensor was extensively tested in isotonic saline solution for physio-logical blood glucose concentrations between 2 and 20 mM, demonstrating
i
Abstract
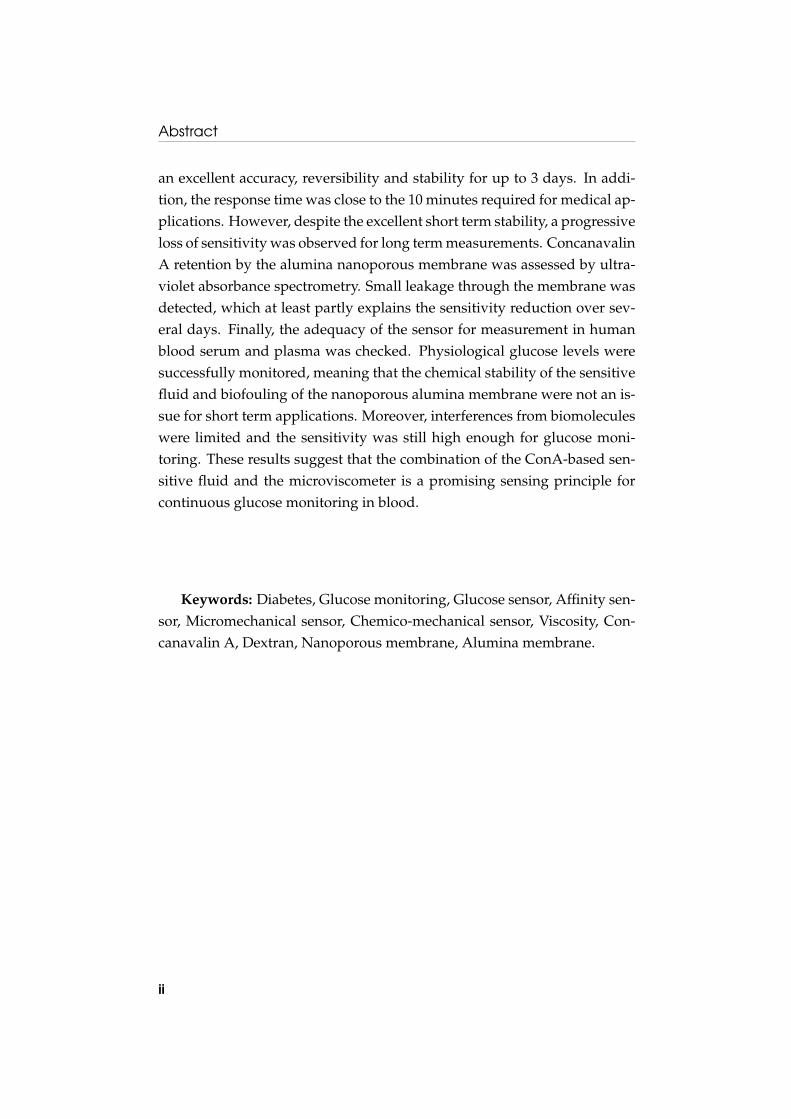
an excellent accuracy, reversibility and stability for up to 3 days. In addi-tion, the response time was close to the 10 minutes required for medical ap-plications. However, despite the excellent short term stability, a progressiveloss of sensitivity was observed for long term measurements. ConcanavalinA retention by the alumina nanoporous membrane was assessed by ultra-violet absorbance spectrometry. Small leakage through the membrane wasdetected, which at least partly explains the sensitivity reduction over sev-eral days. Finally, the adequacy of the sensor for measurement in humanblood serum and plasma was checked. Physiological glucose levels weresuccessfully monitored, meaning that the chemical stability of the sensitivefluid and biofouling of the nanoporous alumina membrane were not an is-sue for short term applications. Moreover, interferences from biomoleculeswere limited and the sensitivity was still high enough for glucose moni-toring. These results suggest that the combination of the ConA-based sen-sitive fluid and the microviscometer is a promising sensing principle forcontinuous glucose monitoring in blood.
Keywords: Diabetes, Glucose monitoring, Glucose sensor, Affinity sen-sor, Micromechanical sensor, Chemico-mechanical sensor, Viscosity, Con-canavalin A, Dextran, Nanoporous membrane, Alumina membrane.
ii

Résumé
Depuis cinquante ans, d’importants efforts ont été consentis pour déve-lopper des capteurs de glucose permettant un contrôle optimal de la gly-cémie des patients diabétiques. Actuellement, des millions de diabétiquesmesurent quotidiennement leur glycémie, ce qui fait du glucose la sub-stance la plus fréquemment testée. Récemment, des systèmes de mesuredu glucose en continu utilisant l’insertion d’une aiguille sous-cutanée ontété commercialisés. Cependant, ces dispositifs nécessitent une calibrationfréquente et manquent de précision et de fiabilité. Ils sont basés sur unedétection électrochimique qui est fortement affectée par l’environnementbiologique dans lequel le capteur est placé. En outre, un capteur de glucosepermettant une mesure continue qui soit précise et fiable aurait aussi ungrand intérêt pour le contrôle de la glycémie dans les unités de soins in-tensifs. Cependant, malgré les avances technologiques importantes, le dé-veloppement d’un système permettant une mesure continue du glucosesuffisamment précise reste un défi majeur.
Dans ce contexte, des approches alternatives qui permettraient de sur-monter les limitations des méthodes électrochimiques ont été investiguées.Parmi ces dernières, les méthodes utilisant l’affinité spécifique de certainscomposés pour le glucose devraient offrir certains avantages pour les me-sures in vivo. Dans cette thèse, nous investiguons un nouveau principe dedétection pour la mesure continue du glucose dans les liquides biologiquestels que le sang et le plasma. Le principe de mesure repose sur la variationde la viscosité d’une solution sensible avec la concentration de glucose. Lasolution sensible est basée sur la compétition entre le glucose et le dextranpour lier la Concanavalin A, une protéine ayant une affinité spécifique pourle glucose. Plus précisément, le capteur est rempli avec la solution sensible,et comprend deux diaphragmes piézoélectriques ainsi qu’un micro-canalpermettant de mesurer la viscosité. De plus, une membrane d’alumine na-noporeuse confine la solution sensible dans le capteur tout en permettant
iii

Résumé
la perméation du glucose à travers la membrane.Le capteur a été testé dans une solution saline isotonique pour des
concentrations physiologiques de glucose entre 2 et 20 mM, démontrantune excellente précision, réversibilité et stabilité jusqu’à 3 jours. De plus, letemps de réponse est proche des 10 minutes requises pour des applicationsmédicales. Cependant, malgré l’excellente stabilité à court terme, une perteprogressive de sensibilité a été observée pour des mesures à long terme.La rétention de la Concanavalin A par la membrane d’alumine nanopo-reuse a été évaluée par spectrométrie d’absorption ultraviolette. De petitesfuites ont été détectées, expliquant au moins partiellement la réduction desensibilité observée sur plusieurs jours. Enfin, la capacité du capteur à fonc-tionner dans le sang et le plasma humain a été vérifiée. Différentes concen-trations physiologiques de glucose ont été mesurées avec succès dans leplasma humain, ce qui signifie que la stabilité chimique de la solution sen-sible et l’encrassement biologique de la membrane d’alumine nanoporeusen’est pas un problème pour les mesures à court terme. Par ailleurs, les inter-férences dues aux biomolécules du plasma étaient limitées et la sensibilitéétait encore suffisamment élevée pour permettre une mesure précise. Cesrésultats suggèrent que la combinaison de la solution sensible basée sur laConcanavalin A et du micro-viscosimètre est un principe prometteur pourla mesure continue du glucose dans le sang.
Mots clé : Diabète, Mesure du glucose, Capteur de glucose, Capteurd’affinité, Capteur micromécanique, Capteur chimico-mécanique, Viscosité,Concanavalin A, Dextran, Membrane nanoporeuse, Membrane d’alumine.
iv

Acknowledgments
This PhD thesis represents a significant work that would not have beenpossible without the constant support, encouragement, help and motiva-tion from my colleagues, friends, and family.
Foremost, I express my gratitude to Professor Peter Ryser who offeredme the opportunity to work at the Laboratory of Microengineering forManufacturing.
I deeply thank Eric Meurville for the supervision of this research work.He continuously provided extremely valuable support, enthusiasm, ideas,and motivation to guide me throughout my thesis.
I owe special thanks to Dr Nao Takano, Dr Simon Kuenzi and Dr An-toine Barraud for their help in starting my thesis. Their expertise in glucosesensing, their laboratory experience, and their own research work were ex-tremely valuable.
Many thanks to the team involved in the multi-analyte detection projectfunded by the Swiss Innovation Promotion Agency (CTI). I especially thankDr Frédéric Schmitt for the fruitful collaboration.
I thank Dr Jean-Michel Sallèse for his valuable advices and his help forthe publication of the two journal articles related to this thesis.
I also thank Dr Léandre Bolomey and Giancarlo Corradini for their helpin electronics and precision assembly.
Finally, I wish to thank all my friends and family for their supportand the good times during these years at EPFL. I especially thank my par-ents for their constant support and encouragement, and my siblings David,Aline et Antoine for the great moments together.
v

Acknowledgment
vi

Contents
1 Introduction 1
1.1 Glucose-sensing function of pancreas . . . . . . . . . . . . . 11.2 Glucose monitoring for diabetes mellitus . . . . . . . . . . . 21.3 In vivo continuous glucose monitoring . . . . . . . . . . . . . 4
1.3.1 Subcutaneous needle-type glucose sensor . . . . . . . 41.3.2 Limitations of electrochemical devices . . . . . . . . . 61.3.3 Long term implantable glucose sensor . . . . . . . . . 7
1.4 Critically ill patients monitoring . . . . . . . . . . . . . . . . 81.5 Affinity sensing as an alternative method . . . . . . . . . . . 9
1.5.1 Advantages of affinity sensing . . . . . . . . . . . . . 91.5.2 A novel viscometric affinity biosensor . . . . . . . . . 10
2 Glucose measuring technologies 13
2.1 First glucose sensors . . . . . . . . . . . . . . . . . . . . . . . 132.2 Electrochemical test strips . . . . . . . . . . . . . . . . . . . . 142.3 Continuous glucose monitoring . . . . . . . . . . . . . . . . . 16
2.3.1 Major commercial developments . . . . . . . . . . . . 162.3.2 Subcutaneous amperometric technology . . . . . . . 182.3.3 Performance of commercial devices . . . . . . . . . . 20
2.4 Affinity sensing technology . . . . . . . . . . . . . . . . . . . 212.4.1 Fluorescence affinity sensors . . . . . . . . . . . . . . 212.4.2 Viscosity-dependent affinity sensors . . . . . . . . . . 23
3 Sensor principle and modeling 29
3.1 Introduction . . . . . . . . . . . . . . . . . . . . . . . . . . . . 293.2 Sensitive fluid . . . . . . . . . . . . . . . . . . . . . . . . . . . 30
3.2.1 Sensing principle . . . . . . . . . . . . . . . . . . . . . 303.2.2 Rheological properties . . . . . . . . . . . . . . . . . . 31
vii

Contents
3.2.3 Concanavalin A properties . . . . . . . . . . . . . . . 323.3 Viscosity sensing principle . . . . . . . . . . . . . . . . . . . . 333.4 Semi-permeable membrane . . . . . . . . . . . . . . . . . . . 35
3.4.1 Function and requirements . . . . . . . . . . . . . . . 353.4.2 Nanoporous alumina membrane . . . . . . . . . . . . 37
3.5 Sensor modeling . . . . . . . . . . . . . . . . . . . . . . . . . . 383.5.1 Viscosity sensing principle . . . . . . . . . . . . . . . 383.5.2 Piezoelectric diaphragm deflection . . . . . . . . . . . 413.5.3 Fundamentals of diffusion . . . . . . . . . . . . . . . . 443.5.4 Diffusion in membranes . . . . . . . . . . . . . . . . . 463.5.5 Free diffusion . . . . . . . . . . . . . . . . . . . . . . . 49
3.6 Conclusion . . . . . . . . . . . . . . . . . . . . . . . . . . . . . 51
4 Sensor development and assessment 53
4.1 Introduction . . . . . . . . . . . . . . . . . . . . . . . . . . . . 534.2 Sensor design . . . . . . . . . . . . . . . . . . . . . . . . . . . 54
4.2.1 Sensor structure . . . . . . . . . . . . . . . . . . . . . . 544.2.2 Actuating piezoelectric diaphragm . . . . . . . . . . . 544.2.3 Sensing piezoelectric diaphragm . . . . . . . . . . . . 574.2.4 Measurement process . . . . . . . . . . . . . . . . . . 58
4.3 Experimental section . . . . . . . . . . . . . . . . . . . . . . . 594.3.1 Sensor fabrication . . . . . . . . . . . . . . . . . . . . . 594.3.2 Sensitive fluid characteristics . . . . . . . . . . . . . . 614.3.3 Sensitive fluid preparation . . . . . . . . . . . . . . . 614.3.4 Experimental setup . . . . . . . . . . . . . . . . . . . . 62
4.4 Results and discussion . . . . . . . . . . . . . . . . . . . . . . 634.4.1 Demonstrating the viscosity sensing principle . . . . 634.4.2 Sensor characterization at various temperatures . . . 644.4.3 Sensor response dynamics . . . . . . . . . . . . . . . . 664.4.4 Sensor accuracy and stability . . . . . . . . . . . . . . 68
4.5 Conclusion . . . . . . . . . . . . . . . . . . . . . . . . . . . . . 69
5 Long term performance study of the sensor 71
5.1 Introduction . . . . . . . . . . . . . . . . . . . . . . . . . . . . 715.2 Experimental description . . . . . . . . . . . . . . . . . . . . . 72
5.2.1 Diffusion cells . . . . . . . . . . . . . . . . . . . . . . . 72
viii

Contents
5.2.2 Refractometry . . . . . . . . . . . . . . . . . . . . . . . 725.2.3 UV absorbance spectrometry . . . . . . . . . . . . . . 73
5.3 Results and discussion . . . . . . . . . . . . . . . . . . . . . . 755.3.1 Long term stability of the sensor . . . . . . . . . . . . 755.3.2 Glucose diffusion in the nanoporous membrane . . . 765.3.3 ConA retention by the nanoporous membrane . . . . 785.3.4 Pores size distribution . . . . . . . . . . . . . . . . . . 815.3.5 Pores narrowing by atomic layer deposition . . . . . 83
5.4 Conclusion . . . . . . . . . . . . . . . . . . . . . . . . . . . . . 85
6 Determination of glucose in biological fluids 87
6.1 Introduction . . . . . . . . . . . . . . . . . . . . . . . . . . . . 876.2 Experimental description . . . . . . . . . . . . . . . . . . . . . 886.3 Results and discussion . . . . . . . . . . . . . . . . . . . . . . 88
6.3.1 Measurements in human serum and plasma . . . . . 886.3.2 Molecular interference with sensitivity to glucose . . 916.3.3 Sensitive fluid stability in serum and plasma . . . . . 91
6.4 Conclusion . . . . . . . . . . . . . . . . . . . . . . . . . . . . . 93
7 Conclusion 95
Bibliography 97
Curriculum Vitae 107
ix

Contents
x

Chapter 1
Introduction
1.1 Glucose-sensing function of pancreas
Glucose concentration in blood is mainly regulated by insulin, which is avital hormone secreted by the beta cells of the pancreas (Fig. 1.1). Insulinmakes possible to assimilate nutrients, by triggering the glucose storageas glycogen in cells of the liver, muscles and fat tissues. The peak secre-tion of insulin coincides therefore with meals, when a high amount of glu-cose is absorbed by the body. By allowing the passage of glucose into thecells, insulin allows energy storage while preventing hyperglycemia aftera meal. Insulin secretion in response to glucose is extremely rapid, occur-ring within one minute after the glucose concentration increase. When theglucose concentration is back to a normal level, the insulin secretion stops,thus avoiding a swing in the opposite direction that would lead to hypo-glycemia. This mechanism, known as glucose-controlled insulin secretion,is normally regulating the glycemia. However, if the glucose concentrationdrops to dangerous levels, e.g. after an extended period without eating, thealpha cells of the pancreas release glucagon, an other hormone. Its effect isopposite that of insulin. This is a safety mechanism which acts to restorethe glucose concentration in the physiological range. The glucagon trig-gers the conversion of the glycogen of the liver cells into glucose, which issubsequently released into the blood. The antagonist effects of insulin andglucagon keep the blood glucose concentration within very narrow limits(80–120 mg/dl or 4.4–6.6 mM)1 in healthy persons in spite of the fact that
1Both units are commonly used for the glucose concentration (1 mM = 18 mg/dl).
1

Chapter 1. Introduction
Figure 1.1: Regulation of the body glycemia: insulin and glucagon haveopposite effects on liver and other tissues for controlling the blood glucoseconcentration. (Reprinted from http://health.howstuffworks.com.)
various amounts of carbohydrates are consumed both during and betweenmeals.
1.2 Glucose monitoring for diabetes mellitus
In diabetes mellitus, this feedback homeostasis of blood glucose concen-tration is lost. This results in hyperglycemia and glucose intolerance dueto insulin deficiency, impaired effectiveness of insulin action, or both. Intype 1 diabetes, the autoimmune destruction of the pancreatic beta cellsleads to severe insulin deficiency, which in the absence of insulin replace-ment, would lead to death because of the inability to assimilate nutrients.Fortunately, since the discovery of insulin in the early 1920s, patients wereable to survive by injecting insulin themselves two to four times a day. InType 2 diabetes, the glycemia regulation is impaired due to a combinationof defective insulin secretion and a reduced insulin sensitivity. It is often
2

1.2. Glucose monitoring for diabetes mellitus
Figure 1.2: Procedure for self-monitoring of blood glucose: a drop of bloodis applied on a test strip inserted on a handheld glucose meter.
associated with obesity, which itself can cause insulin resistance and leadto chronic high blood glucose levels. Type 2 diabetes is often managed byincreasing exercise, dietary modification and routinely monitoring glucoselevels. However, it may require insulin in case of persistent hyperglycemia.
Diabetes is one of the leading cause of death and disability in the world.Serious long term complications are related to chronic hyperglycemia, in-cluding higher risks of heart disease, kidney failure, or blindness [1]. Suchcomplications were thought to be greatly reduced through stringent per-sonal control of blood glucose, and since the early 1980s, blood glucoselevels have been self-monitored. The test involves pricking a finger with alancet device to obtain a small blood sample, and applying a drop of bloodonto a dry chemical test strip inserted in a handheld meter for determin-ing the glucose concentration (Fig. 1.2). Self-monitoring of blood glucoseallows the improvement of glycemic control by collecting detailed infor-mation about blood glucose levels throughout the day. It helps diabetic pa-tients to adjust their dietary intake, physical activity, and insulin doses inresponse to blood glucose values. The effectiveness of self-monitoring wasconfirmed by measuring the glycosylated hemoglobin, which is a markerof metabolic control over the previous 3–4 months. In general, studies sup-port the evidence that self-monitoring of blood glucose is effective in im-proving glycemia [2]. The advent of self-monitoring is therefore consideredas a major advance in diabetes management.
Today, millions of diabetics test their blood glucose levels daily, making
3

Chapter 1. Introduction
0 0 : 0 0 0 6 : 0 0 1 2 : 0 0 1 8 : 0 0 2 4 : 0 002468
1 01 21 41 61 8
0
5 0
1 0 0
1 5 0
2 0 0
2 5 0
Glyc
emia
[mg/d
L]
Glyc
emia
[mmo
l/L]
T i m e
H y p e r g l y c e m i a
H y p o g l y c e m i a
Figure 1.3: Glycemia evolution of a diabetic over one day. The greenpoints represent the points-in-time monitoring obtained with finger-stickmeasurements, and the blue curve the real glycemia. (Reprinted from [3].)
glucose the most commonly tested analyte. However, conventional glucosemonitoring is a discontinuous process that tells the patient about blood glu-cose concentration only at the moment it is performed. The fluctuationsoccurring between two measurements are not recorded. As the feedbackhomeostasis is lost, rapid fluctuations can occur, particularly after a mealor after insulin injection (Fig. 1.3). Hypo- and hyperglycemic episodes aretherefore commonly happening in spite of frequent monitoring. Moreover,to avoid hypoglycemic episodes which could lead to unconsciousness, pa-tients often regulate their blood glucose above the normal range. As aconsequence, despite intensive insulin therapy, diabetic patients generallyhave their level of glycosylated hemoglobin over the normal range. Thisis a great concern regarding the long term complications associated withelevated blood glucose.
1.3 In vivo continuous glucose monitoring
1.3.1 Subcutaneous needle-type glucose sensor
The limitations of intermittent glucose monitoring were early recognizedand a lot of effort was put towards the development of continuous glucose
4

1.3. In vivo continuous glucose monitoring
Figure 1.4: Example of commercially available subcutaneous im-plantable needle-type glucose sensor (Guardian REAL-Time System fromMedtronic).
meters [4]. In fact, continuous glucose monitoring (CGM) would providemaximal information about shifting blood glucose levels throughout theday and would therefore facilitate the making of optimal treatment deci-sions for the diabetic patient. Moreover, the sensor could be part of analarm system to inform the patient about glucose concentrations outsidethe normal range, especially in the direction of hypoglycemia. The ultimategoal would of course be an artificial pancreas, consisting of a closed-loopinsulin delivery system.
In the early 2000s, subcutaneous implantable needle-type glucose sen-sors became commercially available (Fig. 1.4). Such devices track glucoselevels by measuring the glucose concentration in the interstitial fluid of thesubcutaneous tissue. They are commonly inserted into the subcutaneoustissue in the abdomen or upper arm. Today, CGM devices are used to bet-ter understand the glycemia pattern of difficult-to-control diabetes and tofacilitate adjustments in therapy. For instance, the impact of lifestyle mod-ifications or mealtime insulin bolus changes can be assessed using a CGMdevice. This is therefore a very efficient tool for patient education. How-ever, the limited accuracy is hindering a more routine use of these devices[5]. In fact, currently available CGM devices require up to four finger-stickblood glucose measurements per day for calibration. Moreover, they are
5

Chapter 1. Introduction
not sufficiently accurate to make therapeutic decisions and a finger-stickblood glucose measurement has always to confirm the CGM value. Finally,they do not measure the glucose concentration in the whole blood, but in-stead in the interstitial fluid, which introduces a lag time [5].
As methods for minimally invasive continuous monitoring advance, itappears likely that CGM devices will eventually become a routine part ofdiabetes management. However, in spite of the many impressive break-throughs in the design and use of glucose biosensors, the promise of tightdiabetes management has not been fulfilled. There are still major chal-lenges in achieving clinically accurate continuous glycemic monitoring sys-tems. Undesirable interactions between the surface of the implanted deviceand biological medium cause deterioration of the sensor performance uponimplantation and proved to be the major barrier to the development of re-liable in vivo glucose probes [6].
1.3.2 Limitations of electrochemical devices
The vast majority of glucose sensors used for in vivo applications are basedon electrochemical detection. Basically, the measurement relies on a glu-cose oxidase (GOx) coated electrode. This enzyme catalyzes a chemicalreaction between glucose and oxygen, which generates an electroactiveproduct measured by common working electrodes. With such a detec-tion method, other oxidizable constituents of biological fluids can compro-mise the selectivity and hence the overall accuracy of measurement [6, 7].Considerable effort was devoted to minimizing the interference of coex-isting electroactive compounds. Major improvements were realized bycoating the electrode for minimizing the access of these constituents anddecreasing the operating potential. Oxygen consumption by the oxidase-based reaction was an other major limitation for in vivo measurements. Infact, physiological oxygen concentrations are about one order of magnitudelower than the glucose level. This limitation, known as oxygen deficit, wasaddressed by using mass-transport-limiting films for increasing the oxy-gen/glucose permeability ratio. However, despite these technological im-provements, challenges for achieving a reliable and accurate in vivo elec-trochemical sensor remain. In particular, these include long term stabilityof the enzyme and transducer, oxygen deficit and surface biofouling (theadhesion of biomolecules to surfaces) of the electrode.
6

1.3. In vivo continuous glucose monitoring
Sensing part
Electronics
Energy storage
Antenna
Figure 1.5: Concept of long term implantable autonomous glucose sensor.
1.3.3 Long term implantable glucose sensor
A minimally invasive, long term implantable glucose sensor would be aninteresting alternative to achieve tight glucose control for diabetic patients.Such a sensor would be implanted in the subcutaneous tissue and wouldwirelessly transmit the glucose measurements to an external handheld de-vice, like the patient’s smartphone (Fig. 1.5). The signal from the sensorwould be sent to the external device via radiofrequency and the power nec-essary for the sensor operation would be transmitted via inductive powertelemetry. The wearable patient control unit would display real-time glu-cose levels updated every few minutes as well as the glucose level trendsbased on the past 20–30 minutes. The sensor would be implanted in thephysician’s office using a minimally invasive procedure (using a trocar forexample) and would operate for up to 12 months.
Compared to existing transcutaneous needle-type sensors, a long termimplantable sensor would eliminate the need to wear an external cumber-some device and to regularly change the needle. Moreover, a stable sensor-tissue interface would be established, whereas the recent implantation of atranscutaneous sensor generates a local inflammation. This is expected todecrease the frequent calibrations generated by a changing local environ-ment.
However, the development of a long term implantable sensor is a chal-lenge with many functional requirements. The implantable sensor should
7

Chapter 1. Introduction
have a very small size allowing minimally invasive implantation. Thedetection method and control electronics should therefore allow extrememiniaturization. In addition, the sensor should operate for up to 12 monthsafter implantation with infrequent recalibration. This requires a glucose de-tection method which is stable and reliable for in vivo long term operation.Finally, the sensor-tissue interface is probably the most critical aspect forthe long term sensor function. After typically 2–3 weeks, the sensor is en-capsulated by a fibrotic capsule, which significantly hinders the glucosediffusion and leads to an increased response time. The sensor-tissue in-terface must therefore be coated with a biocompatible material promotingneovascularization within the matrix of the coating material.
Despite the considerable effort devoted to the development of an im-plantable glucose sensor, the technological challenges for long term in vivomonitoring have not been solved, and to date no product was brought tocommercial realization.
1.4 Critically ill patients monitoring
In critical care, aberrant respiratory, cardiovascular, and other parametersare generally restored to physiologic levels in the belief that such maneu-vers would confer a survival benefit. Glucose homeostasis is often dysreg-ulated in critically ill patients, resulting in hyperglycemia, even those whohave not previously had diabetes. Recently, clinical studies have demon-strated that maintenance of normoglycemia with intensive insulin therapycan reduce morbidity and mortality in critically ill patients [8, 9, 10, 11]. Itis hypothesized that hyperglycemia or relative insulin deficiency may con-fer a predisposition to complications such as severe infections or multiple-organ failure.
Today, tight blood glucose control are performed in certain intensivecare units (ICU), by taking and analyzing blood samples every 30–60 min-utes. Several glucose monitoring handheld devices providing quantitativeglucose measurement of capillary, venous and arterial blood are FDA2 ap-proved for the ICU. However, tight glycemic control increases the nursing
2The Food and Drug Administration (FDA) is an agency within the U.S. Department ofHealth and Human Services protecting the public health by assuring the safety, effective-ness and security of a wide variety of products. In particular, medical devices are regulatedby FDA’s center for Devices and Radiological Health.
8

1.5. Affinity sensing as an alternative method
workload and its implementation may prove to be a challenge as it requiresa change in practice and an adequate education of the nursing staff. A con-tinuous glucose sensor would likely facilitate the implementation of tightblood glucose control, and would also provide alarm signals for impendingglycemic excursions.
Several pilot studies of continuous glucose monitoring and closed-loopcontrol have been performed using subcutaneous needle-type glucose sen-sors [12, 13, 14, 15]. However, commercially available CGM devices are notaccurate and reliable enough for implementing a truly closed-loop control,and blood glucose measurements are still required. Moreover, capillaryblood values obtained by finger stick, or measurements in the interstitialfluid do not appear to be reliable in the ICU setting [16, 17].
There is therefore a strong need for a continuous glucose sensor mon-itoring accurately and reliably in arterial blood. In 2008, Edwards Life-science, a leader in the monitoring of critically ill patients, and DexCom, adeveloper of continuous monitoring systems for diabetic patients, enteredinto a collaboration agreement to develop a continuous sensor for moni-toring blood glucose levels for critically ill patients. This emphasizes thegrowing interest for tight glycemic monitoring in the ICU. However, thereis currently no commercially available product, which indicates that elec-trochemical methods encounter difficulties in accurately and reliably mon-itoring glucose levels in blood.
1.5 Affinity sensing as an alternative method
1.5.1 Advantages of affinity sensing
The development of glucose sensor for in vivo applications that allows forlong term reversibility and stability remains a challenge. In this context,alternative approaches to overcome the limitation of electrochemical meth-ods have been investigated. Research groups focused on affinity sens-ing based on either glucose-specific protein concanavalin A (ConA) [18,19, 20, 21, 22, 23] or acid boronic-based artificial glucose-specific recep-tors [24, 25, 26]. Independent of the type of receptor, affinity sensing of-fers several intrinsic advantages for in vivo monitoring. The absence of anelectrode-based system eliminates its related issues, like potential interfer-
9

Chapter 1. Introduction
ences of electroactive components or the dependence upon oxygen tension.Furthermore, the binding reaction in affinity-based sensors is equilibriumdriven, resulting in a signal sensitivity that is independent on the rate ofglucose diffusion into the sensor. This is an advantage when comparedto electroenzymatic sensors, which consume glucose and therefore dependon its diffusion rate. In particular, biofouling which degrades the sensitiv-ity and stability of electrochemical measurements should only increase theresponse time of the affinity sensor. For these reasons, investigations onaffinity binding sensors have been undertaken using various technologies,such as fluorescence [20, 21, 22, 25] or viscosity-based [19, 27, 28] princi-ples. In particular, Roche (Disetronic) worked on the development of asubcutaneous implantable needle-type glucose sensor relying on monitor-ing glucose-induced changes in the viscosity associated with binding toConA [29, 30].
1.5.2 A novel viscometric affinity biosensor
We propose a novel chemico-mechanical concept which aims at detectingviscosity changes of a solution featuring a selective affinity for glucose. Theinnovation relies in the viscosity detection method, which is based on themeasurement of the flow resistance of a microchannel upon piezoelectricdiaphragm actuation. This piezoelectric-based measurement should pro-vide a very accurate and low-power viscosity detection controlled with ba-sic electronics. In addition, the sensor topology would allow its realizationusing microfabrication technology, thus allowing the required miniaturiza-tion. These characteristics, combined with the intrinsic advantages of affin-ity sensing for in vivo monitoring, make this sensor particularly well suitedfor long term implantable applications. Beside that, microfabrication tech-nology may allow batch manufacturing, and therefore disposable sensorsfor in vivo and ex vivo applications could also be envisioned.
In this thesis, after a brief state-of-the-art of glucose measuring tech-nologies, the sensor principle and modeling are presented in detail, in-cluding the viscosity detection method, the glucose sensitive fluid and thesensor-body interface. The glucose sensor demonstrator and the experi-mental test setup are then presented, followed by the viscosity detectionmethod and model validation using viscosity reference standards. Next,the glucose sensor demonstrator was extensively characterized in isotonic
10

1.5. Affinity sensing as an alternative method
saline solution of varying glucose concentrations, investigating the sensorreversibility, reproducibility and stability. The long term performance ofthe demonstrator was further evaluated regarding its potential applicationas a long term implantable sensor. Finally, the glucose sensor demonstratorwas assessed in human blood serum and plasma for checking its adequacyto detect glucose in biological fluids. Special attention was paid to biofoul-ing of the sensor-body interface and to potential interferences from otherbiomolecules present in blood.
11

Chapter 1. Introduction
12

Chapter 2
Glucose measuringtechnologies
2.1 First glucose sensors
The initial dominant detection technology for glucose sensors was basedon a reflectometer invented by Anton Clemens in 1971, whose work led tothe launch of the first blood glucose measurement system, the Ames Re-flectance Meter. The intrument measured the reflected light from a stripcovered with a chemical reagent whose color was changing with the addi-tion of a drop of blood. Even if the original Ames Reflectance Meter waslarge and expensive, it was a success and led to a variety of products.
In 1975, Yellow Spring Company (YSI) launched the first commercialelectrochemical glucose analyzer for direct measurement of glucose in 25 µLwhole blood samples. The measurement relied on the enzyme glucose ox-idase (GOx) which catalyzes a reaction between glucose and oxygen pro-ducing gluconic acid and hydrogen peroxide (H2O2):
glucose + O2GOx−−−−→ gluconic acid + H2O2
In this original device, glucose oxidase was immobilized between twomembrane layers. An outer polycarbonate membrane confined the enzymewhilst allowing glucose to diffuse. It also reduced the interferences by pre-venting large biomolecules present in the blood from entering into the de-vice. In presence of the enzyme, glucose was oxidized, producing hydro-gen peroxide. This latter diffused through a cellulose acetate membrane
13

Chapter 2. Glucose measuring technologies
Figure 2.1: Sequence of events that occur in mediator-based electrochemi-cal glucose sensors. (Reprinted from [6].)
and was amperometrically measured by a platinum electrode. The secondmembrane acted as a further size exclusion barrier preventing many otherelectroactive compounds from reaching the electrode surface. Since then,the YSI device and its successors have become a standard for clinical diag-nostics used in many hospitals and laboratories.
2.2 Electrochemical test strips
During the 1980s, considerable efforts were devoted to the developmentof electrochemical glucose sensors for home testing. Oxygen was replacedwith a nonphysiological (synthetic) electron acceptor for catalyzing the glu-cose oxidation (Fig. 2.1). This facilitated the electrons transfer to the elec-trode surface, which no longer depended on the local oxygen concentra-tion. Moreover, this allowed to decrease the operating potential, thus re-ducing the interferences from other electroactive compounds and conse-quently enhancing the sensor performance. The electrochemical technol-ogy was further adapted to disposable test strips by using screen-printingtechnology which allowed inexpensive and reproducible test strips man-ufacturing. Screen-printing was widely used in the electronics industry,allowing the deposition of patterned thick-films in a simple and rapid way.The screen-printing technology involves printing patterns of conductorsand insulators onto the surface of planar (plastic, ceramic, metal) substratesbased on pressing the corresponding inks through a patterned mask. Thisprocess was one of the major reasons for the commercial success of electro-chemical glucose sensors.
In 1987, Medisense launched the first glucose sensor for self-monitoringof blood glucose based on electrochemical test strips. Glucose was amper-
14

2.2. Electrochemical test strips
Figure 2.2: Cross section of a commercial strip for self-testing of blood glu-cose (based on the Precision biosensor manufactured by Abbott Inc.): (A)electrode system; (B) hydrophobic layer (drawing the blood). (Reprintedfrom [6].)
ometrically measured using a GOx electrode and a ferrocene mediator [31].Ferrocene and its derivatives were in fact shown to rapidly shuttle electronsfrom GOx to electrodes [32]. Various improvements have been incorpo-rated since the launch of the original device, but the concept has remainedunaffected. Commercial blood glucose self-testing meters commonly relyon the use of ferricyanide or ferrocene mediators [6]. A strip is typically aplastic substrate containing the printed working and reference electrodes,with the working one coated with an enzyme, a redox mediator and otherreagents (Fig. 2.2). A small volume capillary chamber (∼1 µL) is formedover the electrodes by means of an adhesive spacer and a cover layer. Inaddition, various membranes are often incorporated in the test strips toseparate the blood cells and minimize interferences for other biomolecules.
Today, over 40 different commercial strips and pocket-size monitorshave been introduced for self-testing of blood glucose [33]. However, over90% of the market is dominated by four major diagnostics compagnies,including Roche Diagnostics, Abott, Bayer and Lifescan (Table 2.1). The re-cent glucose meters utilize capillary fill which allow sampling small bloodvolumes (0.3–4 µl), thus allowing to decrease the needle size and to reducethe pain associated with finger pricking. In addition to fast response (5–30s), good accuracy (5–10% rms error compared to laboratory standards) andautomatic fill detection, modern glucose meters have extended memory ca-pacity, automatically storing results along with times and dates. Some de-
15
Chapter 2. Glucose measuring technologies
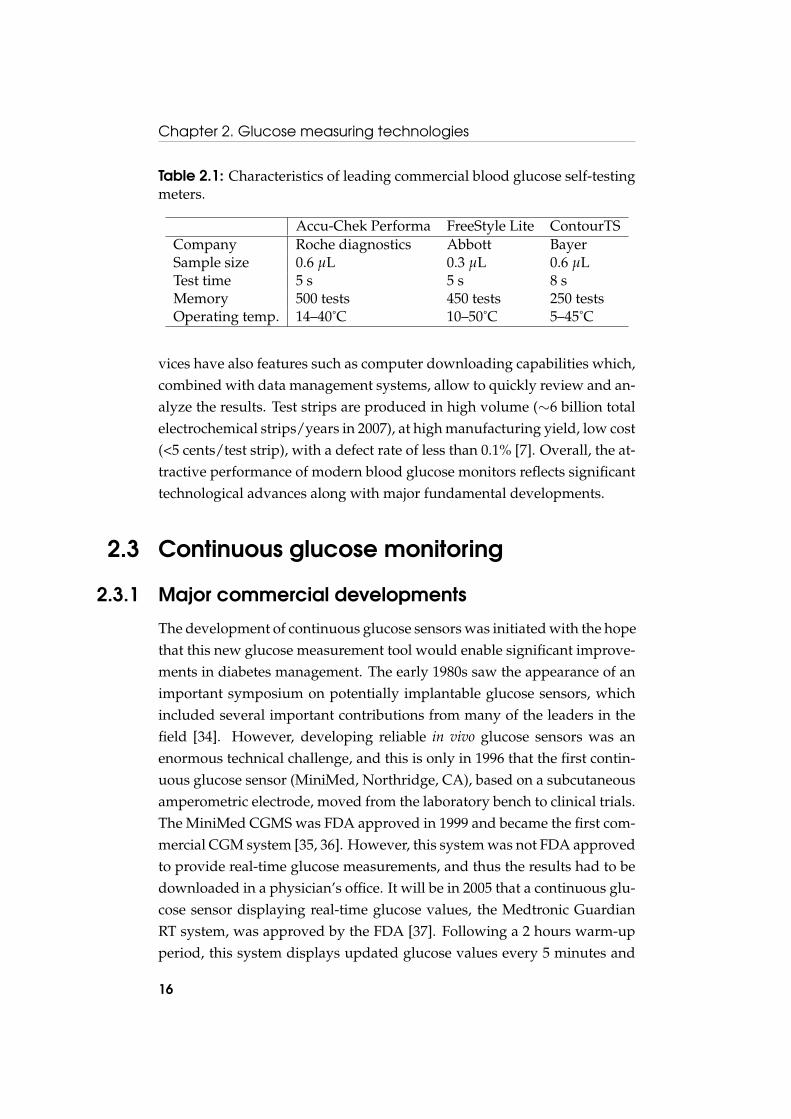
Table 2.1: Characteristics of leading commercial blood glucose self-testingmeters.
Accu-Chek Performa FreeStyle Lite ContourTSCompany Roche diagnostics Abbott BayerSample size 0.6 µL 0.3 µL 0.6 µLTest time 5 s 5 s 8 sMemory 500 tests 450 tests 250 testsOperating temp. 14–40˚C 10–50˚C 5–45˚C
vices have also features such as computer downloading capabilities which,combined with data management systems, allow to quickly review and an-alyze the results. Test strips are produced in high volume (∼6 billion totalelectrochemical strips/years in 2007), at high manufacturing yield, low cost(<5 cents/test strip), with a defect rate of less than 0.1% [7]. Overall, the at-tractive performance of modern blood glucose monitors reflects significanttechnological advances along with major fundamental developments.
2.3 Continuous glucose monitoring
2.3.1 Major commercial developments
The development of continuous glucose sensors was initiated with the hopethat this new glucose measurement tool would enable significant improve-ments in diabetes management. The early 1980s saw the appearance of animportant symposium on potentially implantable glucose sensors, whichincluded several important contributions from many of the leaders in thefield [34]. However, developing reliable in vivo glucose sensors was anenormous technical challenge, and this is only in 1996 that the first contin-uous glucose sensor (MiniMed, Northridge, CA), based on a subcutaneousamperometric electrode, moved from the laboratory bench to clinical trials.The MiniMed CGMS was FDA approved in 1999 and became the first com-mercial CGM system [35, 36]. However, this system was not FDA approvedto provide real-time glucose measurements, and thus the results had to bedownloaded in a physician’s office. It will be in 2005 that a continuous glu-cose sensor displaying real-time glucose values, the Medtronic GuardianRT system, was approved by the FDA [37]. Following a 2 hours warm-upperiod, this system displays updated glucose values every 5 minutes and
16
2.3. Continuous glucose monitoring
sounds an alarm when glucose levels become too high or too low. Sincethen, two other companies received FDA approval for their real-time CGMsystems based on similar electrochemical technologies. The STS glucosemonitor from DexCom, Inc. (San Diego, CA) and the FreeStyle Navigatorglucose monitor from Abbott Diabetes Care (Alameda, CA) were respec-tively approved in 2006 and 2008.
An alternative to implanted electrodes is to use microdialysis as an in-terface between the body and the biosensor. In 2002, Menarini Diagnos-tics (Florence, Italy) received the CE1 approval and since then, commercial-izes the GlucoDay, a glucose monitor based on a microdialysis technique.Clinical trials showed good correlation with blood glucose measurements[38, 39, 40]. However, it was not approved for real-time monitoring andis therefore used by professionals for the retrospective analysis of glucosetrends. A hollow dialysis membrane (in regenerated cellulose) is subcuta-neously inserted and perfused with an isotonic fluid, in which glucose fromthe interstitial fluid diffuses. The isotonic fluid is pumped (with a flow rateof 15–100 µL/min) outside the body, where the glucose is detected usingan amperometric enzyme electrode [41, 42]. As the electrode is outside thebody, this eliminates the issue of subcutaneous oxygen deficit. This is alsoadvantageous regarding biofouling which cannot interfere with the mea-surements. However, as the isotonic fluid has to be pumped to the sensor,a lag time into the measurements is introduced, which could be of concernregarding real-time monitoring.
Beside the currently available needle-type CGM devices, alternative de-tection methods led to commercial developments. The GlucoWatch Biog-rapher developed by Cygnus, Inc. (Redwood, CA), was approved by theFDA in 2001 for real-time display of glucose values. It employed reverseiontophoresis, in which a small current is applied and brings subcutaneousfluid through the skin by attraction of ions [43, 44]. The extracted fluid,which is characterized by a glucose concentration proportional to the sub-cutaneous fluid, is collected in a hydrogel pad and the glucose is detectedelectrochemically. The device is worn like a wristwatch and provides glu-cose measurements every 10 minutes. Despite the FDA approval and clinialtrials [45, 46], it was never widely accepted in the market-place. Sweating,
1"Conformité Européenne", certification required for medical devices in the EuropeanUnion.
17

Chapter 2. Glucose measuring technologies
rapid temperature changes, cold skin or excess movement precluded glu-cose measurements and led to frequent skipped readings. In 2007, AnimasCorp. which purchased Cygnus one year earlier, decided therefore to stopselling the GlucoWatch Biographer system.
Unlike all the other continuous glucose monitoring devices, the Pendradeveloped by Pendragon Medical Ltd. (Zurich, Switzerland), was trulynoninvasive. It operates by impedance spectroscopy, generating a smallelectromagnetic field across the skin in the frequency range of 1–200 MHz.Sodium and potassium transport over the erythrocyte membrane, whichis related to changes in glucose levels, results in a change of impedancedetected with the Pendra device. Initial evaluations of the device werepromising [47, 48], and the Pendra was CE approved for the Europeanmarket in 2004. However, post-market evaluations indicated poor accu-racy and the device also suffered from unsuitability for large number ofpatients due to strong varying skin and subcutaneous properties [49]. Likemost non-invasive methods, the changes in impedance measured by thedevice was likely suffering from interferences due to the complexity of bi-ological tissues. As a consequence, the device was withdrawn from com-mercial distribution and Pendragon Medical filed for bankruptcy in 2005.
2.3.2 Subcutaneous amperometric technology
All commercially available real-time continuous glucose sensors rely on asubcutaneous glucose oxidase (GOx) electrode, a technology which bene-fited from the previous developments of home blood glucose monitors. Inelectrochemical test strips, the enzyme and mediator are typically appliedto the working electrode as a solution and deposited by solvent evapora-tion. However, such a straightforward technique was not compatible withcontinuous in vivo monitoring, as the enzyme and mediator would dissolvein the subcutaneous fluid and diffuse away form the electrode. For a sensorto successfully operates in vivo, the enzyme and mediator have thereforeto be immobilized onto the electrode surface. A variety of techniques forimmobilizing enzymes exists, like adsorption onto insoluble particles, co-valent linking to an insoluble polymer matrix, or enzyme entrapment witha porous polymer membrane. However, the enzyme immobilization re-mains a key factor for in vivo continuous monitoring and the methods usedin commercial sensors are often proprietary and protected as trade secrets.
18

2.3. Continuous glucose monitoring
Figure 2.3: Commercially available transcutaneous sensors. (A) FreeStyleNavigator; (B) Dexcom STS; (C) Guardian RT. (Reprinted from [7].)
Transcutaneous amperometric sensors consist of a thin, sub-1 mm di-ameter, flexible sensor having a working electrode with an immobilizedenzyme (GOx) and an Ag/AgCl reference electrode (Fig. 2.3) [7]. The elec-trooxidation of glucose is mediated by either oxygen, or by an immobi-lized redox mediator. Due to potential leaching and toxicity of the media-tor, most in vivo devices (Guardian RT, Dexcom STS) are mediatorless [50].However, when using oxygen as electron acceptor, the low physiologicaloxygen concentration is an issue regarding to the electrochemical reaction.Both sensors addressed the oxygen deficit limitation using a block copoly-mer membrane, which consists of a hydrophobic polymer highly perme-able to oxygen and impermeable to water and thus glucose, and of a hy-drophilic polymer enabling glucose flux. By varying the ratio of the twopolymers, the oxygen and glucose flux are adjusted to an optimal value forthe redox reaction.
The last approved device (FreeStyle Navigator) is based on an alterna-tive mediator substituting for oxygen, using the enzyme wiring technol-ogy. The enzyme is wired to the electrode surface with a long hydrophilicpolymer backbone having a dense array of covalently linked redox poly-mers. An advantage of the wired enzyme is a lower operating potential,thus reducing the electroactive interferences. However, although the wiredenzyme is not subject to the subcutaneous oxygen deficit, the enzyme con-
19
Chapter 2. Glucose measuring technologies
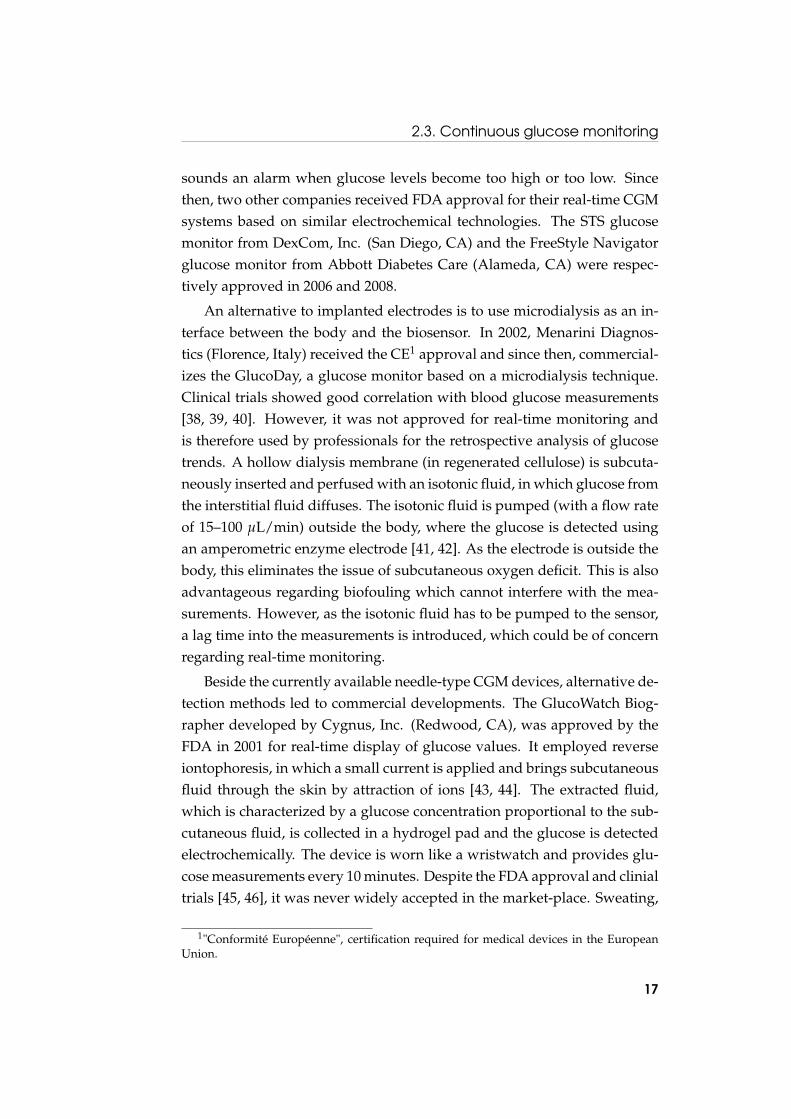
Table 2.2: Characteristics of the three FDA approved real-time continuousmonitoring devices [51].
Guardian RT DexCom STS-7 FreeStyle NavigatorCompany Medtronic DexCom AbbottFDA Approval 2005 2006 2008Enzyme GOx GOx GOxMediator Oxygen Oxygen Redox mediatorLife time 3 days 7 days 5 daysCalibration Every 12h Every 12h At 10, 12, 24 and 72hTest freq. 5 min 5 min 1 min
centration that can be immobilized on the surface of an electrode is lowand saturated at very low glucose levels. A glucose limiting membrane istherefore still required.
2.3.3 Performance of commercial devices
The three commercial real-time devices have similar characteristics (Ta-ble 2.2) [51]. Initially, a suitable break-in period of 1–10 hours has to beobserved, both to equilibrate the sensor with its tissue-environment and tonormalize the insertion-wound perturbed site. After the initial stabiliza-tion period, the sensor has to be calibrated because of the variability ofthe subcutaneous environment. The calibration procedure is performed bytesting the capillary blood glucose concentration using a glucose test strip.The in vivo calibration process has to be repeated during the implantationto correct the sensor output drift, due to the ever-changing wound heal-ing environment and biofouling of the system. The glucose concentrationis measured and displayed in real-time every 1–5 minutes, and dependingon the model, the subcutaneous sensor has to be replaced every 3–7 days.Finally, the precision of CGM devices is very much dependent on the cal-ibration. In fact, as there is a lag time between the blood and interstitialfluid glucose concentration, a calibration performed while the glycemia isfluctuating results in poor precision.
The frequent calibrations and the lack of accuracy and reliability are themajor drawbacks of all approved continuous sensors [52]. At low glucose(below 80 mg/dL), all of the sensors have lower accuracy than they do athigher levels [53], which is critical because the low regions are by far the
20

2.4. Affinity sensing technology
most important. However, these sensors are accurately and reproduciblymeasuring glucose on the bench with no need for calibration, which indi-cates that the main source of sensor inaccuracy comes from the biologicalenvironment in which the sensor is placed. In particular, the high vari-ability of glucose and oxygen in the wound healing site is thought to beresponsible for calibration changes [7]. Biofouling of the device is alsolikely changing the rate-dependent signal of the enzyme electrode. Nowthat the fundamental measurement principle has been demonstrated, im-provements in accuracy and reliability will likely be achieved by ingenioustechnological and manufacturing improvements. A better understandingof the factors causing sensitivity-variation would also help in improving invivo sensor performance.
2.4 Affinity sensing technology
2.4.1 Fluorescence affinity sensors
Due to the problems encountered by the amperometric enzyme electrodefor in vivo sensing, new approaches to glucose sensing have been activelyexplored. Amongst these, affinity sensing received particular attention asit is thought to offer several intrinsic advantages for in vivo monitoring.The affinity detection principle was inspired by immunoassays developedin the 1950s, which consist in measuring the concentration of an antigen inblood using its affinity for a specific antibody. In 1982, early developmentson affinity sensing were reported by Schultz et al., based on the competi-tive binding of glucose and dextran with a glucose-specific binding protein,Concanavalin A (ConA) [18]. The specific affinity of ConA with polysac-charides was previously investigated by Goldstein et al., which reportedthat ConA was interacting with the nonreducing chain ends of the dex-tran molecule [54]. In the sensor described by Schultz et al., ConA wasimmobilized on the inside surface of a hollow dialysis fiber containinga high-molecular-weight dextran labeled with fluorescein isothiocyanate(FITC) (Fig. 2.4). The molecular weight cutoff of the dialysis fiber was lowenough to completely retain dextran within the fiber lumen while glucosewas freely permeating through the membrane. Glucose entering from theexternal medium displaced dextran from ConA and increased the fluores-
21

Chapter 2. Glucose measuring technologies
Immobilized Concanavalin A
Fluorocrome-labeled dextran Hollow fiber membrane
Optical fiber
Excitation
Emission
Glucose
Figure 2.4: Schematic view of the original fluorescence affinity sensorbased on a hollow dialysis fiber proposed by Schultz et al. in 1982 [18].
cence intensity in the lumen, which was recorded using an optical fiber.Preliminary tests of the sensor indicated the feasibility of the approach.
This concept was later adapted by the same laboratory so that mea-surements were based on Fluorescence Resonance Energy Transfer (FRET)[55]. FRET relies on the distance-dependent transfer of energy from a flu-orescent molecule which absorbs the incident radiation (donor molecule)to an other fluorescent molecule to which the energy is subsequently trans-ferred (acceptor molecule). The transfer of energy leads to a reduction inthe donor’s fluorescence intensity and an increase in the acceptor’s emis-sion intensity. In this new fiber-optic sensor, FITC-dextran and rhodamine-ConA were respectively the donor and acceptor molecules. When glucoseis added to the solution, FITC-dextran and rhodamine-ConA move furtherapart, which lead to a decrease in energy transfert and consequently anincrease in the donor fluorescence. The glucose concentration is thereforedirectly related to the FITC fluorescence. The working range of the solu-tion was adjuted to physiological glucose concentration with a good sen-sitivity up to 200 mg/dL. However, the stability of the solution was quitepoor, ConA precipitating and forming aggregates over periods of hours.Chemical procedures were subsequently developed to prevent the ConAaggregation and the solution was shown to be stable over several days
22

2.4. Affinity sensing technology
[56]. Moreover, the ratio ConA-dextran was optimized to achieve glucosedetection up to 1600 mg/dL. The sensor was further improved by usingFITC-dextran, rhodamine-dextran and unmodified ConA in an attempt toavoid chemical modifications of the protein which are time-consuming andcan affect its binding activity [57]. The sensor stability was also enhanced,showing a good measurable fluorescence signal over 11 days.
Ballerstadt and co-workers have further investigated various conceptof fluorescence affinity sensors. In 2000, to avoid the risk of bacterial in-fection related to needle-type sensors, they proposed a concept of subcuta-neous implantation relying on the illumination and fluorescence measure-ment through the skin [21]. To ensure that the fluorescence emission wassufficiently high to be measurable through skin tissue, they increased thefluorescence response intensity by a factor 50, by using immobilized pen-dant glucose moities inside Sephadex beads. The long term stability of thissensor was investigated by continuously cycling glucose test solutions dur-ing 4 months, showing a decrease in fluorescence of 25% per month [20].Aqueous ConA was considered the weakest link due to its involvementin precipitation reactions in response to protein-to-protein aggregation andprotein/dextran-induced precipitation reactions [58, 57]. In an attempt toprevent these adverse precipitation reactions, and therefore increase thestability and lifetime of the sensor, ConA was immobilized within a macro-porous bead matrix, which led to a remarkable long term stability of thesensor (6 months) [59]. They further successfully demonstrated in vivo per-formance of an implanted fluorescence affinity sensor over more than 16days in a rodent model [60].
In conclusion, the technical feasibility of fluorescence affinity sensorshas been clearly demonstrated. Significant improvements to the overallperformance of the sensor have been made since the concept introductionin 1982. However, long term stability remains a challenge, due to inferiorConA stability and inadequate photostability of fluorescent dyes. There-fore, the search for an optimal sensor configuration that fulfills practicalrequirements such as a chemically and optically stable signal continues.
2.4.2 Viscosity-dependent affinity sensors
The change in viscosity of a glucose sensitive fluid was also extensivelyinvestigated as an alternative method to fluorescence for the signal trans-
23

Chapter 2. Glucose measuring technologies
A) B)
1 4
2
3
η15μL/
h
η2
Epidermis
Subcutis
Figure 2.5: GlucOnline device prototype from Disetronic (left) andschematic view of the measuring principle (right): (1) reservoir and pump;(2) microdialysis through the semi-permeable membrane; (3) subcutaneoustissue; (4) collecting vessel. The viscosity is measured using the two pres-sure sensors η1 and η2.
duction of affinity sensors. In 1994, Ballerstadt and Ehwald demonstratedthis variant by filling a hollow fibre of regenerated cellulose with a solutionof dextran and ConA [19]. Air pressure pulses were used for generating os-cillations of the fluid, the amplitude of which was measured with an ocularmicrometer. They further investigated the viscosity response of differentformulations of sensitive fluid based on dextran and ConA [61]. They sug-gested that high-molecular-weight dextran combined with a low value ofbasic viscosity were suitable regarding both the absolute and relative sen-sitivity. Next, the effect of frequency and shear stress on the rheologicalproperties of the sensitive fluid was also assessed with a view to the sensordesign [62].
The same laboratory, in collaboration with Disetronic Medical Systems(Burgdorf, Switzerland), developed a transcutaneous needle-type glucosesensor based on this viscometric principle [29]. The needle encloses a dialy-sis hollow fiber through which the sensitive fluid is continuously pumpedwith low rate (∼5 µL/h). The viscosity is determined by measuring thepressure difference created by the flow at both ends of the fiber using twopressure sensors. The viscometric sensor showed a linear and stable depen-dence on the glucose concentration, with a response time of 5–10 min. Thisdevice was further developed by Disetronic under the trade name Gluc-
24

2.4. Affinity sensing technology
Figure 2.6: Schematic cross view of the MEMS viscometric glucose sensorproposed by Zhao et al. Dimensions indicated in micrometer. (Reprintedfrom [28].)
Online (Fig. 2.5). In 2004, the performance of the sensor was evaluated ina clinical pilot study on twelve type 1 diabetic patients [30]. An error gridanalysis of the results showed that 98.9% of the values were within the clin-ically acceptable zone, but the residual values were clinically unacceptable.Disetronic was acquired by Roche in 2003, which further sold the GlucOn-line project to Sensile Medical. This company was not able to enter themarket with the GlucOnline concept.
The recent advance of microfabrication technolgies, allowing batch fab-rication of miniaturized devices, led to the development of new sensorsbased on a viscometric sensitive fluid. In 2007, Zhao et al. reported aMEMS viscometric sensor based on a magnetically-driven vibrating mi-crocantilever located in a microfluidic chamber filled with a dextran-ConAsensitive fluid [28]. The cantilever was realized by patterning a layer ofSU-8, a commonly used epoxy-based photoresist, and the subsequent de-position of permalloy thin film strips at its free end (Fig. 2.6). The cantileverwas actuated by applying a magnetic field to the permalloy strips, whichinduced a flow of the solution. The damping effect of the flow on the can-tilever vibration, which was directly dependent on the solution viscosity,was recorded using an optical system. The glucose dependence of the can-tilever vibration was demonstrated, although they did not show continu-ous and reversible measurement. They further developed a biocompatibleboronic acid based polymeric sensitive fluid in order to address stabilityissues related to the dextran-ConA solution [26]. The device was also im-proved by fabricating the microcantilever from Parylene, a biocompatible
25

Chapter 2. Glucose measuring technologies
N S
0
50
100
150
200
250
300
350
0 0.1 0.2 0.3 0.4 0.5
Time [s]
Low viscosity
High viscosity
10mm
Acceleration MeasurementMagnetic fieldgeneratorfor acceleration
Hall sensor formeasurement
Sensitivesolution
Magnetic rotor
Watch bearings •Sensitive Fluid with lower glucose level = High viscosity
•Sensitive with higher glucose level = Low viscosityFluid
Nanoporousmembrane
Ro
tati
on
sp
ee
d o
f m
ag
ne
t [r
ps
]
Figure 2.7: Measurement principle of the glucose sensor based on a con-centric rotational microviscometer developed by Kuenzi et al. (Reprintedfrom [3].)
soft polymer, which decreased the resonance frequency of the cantilever to∼30 Hz [27]. Short term (20 hours) continuous reversible measurementswere reported. The last variant of the sensor consisted of a Parylene di-aphragm, whose vibration was measured capacitively [63].
Since 2003, our laboratory has been investigating viscometric affinitysensors for continuous glucose monitoring. A concentric rotational micro-viscometer was developed and extensively characterized using viscosityreference standards [64]. A magnetic cylinder was actuated by a rotationalmagnetic field, and its angular position was recorded with Hall effect sen-sors (Fig. 2.7). The viscosity was measured by the viscous friction pro-duced by the fluid on the rotating magnet. Although this measurementprinciple had a high accuracy, only few successful reversible glucose mea-surements were obtained [65]. Various low viscosity ConA-dextran solu-tions were also investigated using a glass Ubbelohde viscometer combinedto a camera read-out [66]. The results showed that low-viscous mixtures,down to 5 mPas, are well suited for glycemic sensing applications. Furtherwork studied the selective interface between the sensitive fluid and the an-alyzed solution, which has to retain dextran and ConA whilst being per-meable to glucose [3]. Glucose diffusion and ConA retention properties of
26
2.4. Affinity sensing technology
nanoporous alumina membranes and nanoporous polyethylene films werecharacterized. A good ConA retention was achieved by coating 20 nmpores alumina membranes with poly(poly(ethylene glycol) methacrylate)(PPEGMA) brushes.
This work is a continuation of the efforts devoted to the developmentof a viscometric affinity sensor for continuous glucose monitoring. In anattempt to overcome the limitations encountered with the previous device,possibly due to the high shear stress generated by the high rotational speedof the rotor, a novel viscosity detection principle was investigated. This de-tection principle should provide a simple, accurate and low-power viscos-ity measurement.
27

Chapter 2. Glucose measuring technologies
28

Chapter 3
Sensor principle andmodeling
3.1 Introduction
Presently, continuous glucose monitoring devices require frequent calibra-tion and are lacking accuracy and reliability. They are based on electro-chemical detection, which is strongly affected by the biological environ-ment in which the sensor is placed. The development of clinically accuratecontinuous glucose sensors remains therefore a challenge. In this context,we propose an alternative method, based on affinity sensing, which aimsat detecting viscosity changes of a solution with a selective affinity for glu-cose. The innovation relies in the viscosity detection method, based onan induced liquid flow in a microchannel upon piezoelectric diaphragmactuation. The sensitive fluid is based on the competitive binding of glu-cose and dextran with a glucose-specific binding protein, Concanavalin A(ConA). The sensitive fluid is very selective to glucose due to the propertiesof ConA, and particularly sensitive at low glucose concentration, which iscrucial to prevent hypoglycemia.
Basically, the sensor is filled with the sensitive fluid, which is confinedby a semi-permeable membrane completely retaining dextran and ConAwithin the sensor whilst allowing glucose permeation through the mem-brane (Fig. 3.1). The sensor includes both an actuating and a sensing piezo-electric diaphragm as well as a flow-resistive microchannel. In operation,the actuating diaphragm generates a flow through the microchannel which
29

Chapter 3. Sensor principle and modeling
Concanavalin A Dextran Glucose
Nanoporous membrane
Flow inside the microchannel Sensitive fluid
Biological fluid (blood, plasma, interstitial fluid)
Figure 3.1: Sensor measurement principle: glucose diffuses through ananoporous membrane in the sensitive fluid, the viscosity of which is mea-sured by inducing a flow into a microchannel.
is recorded by the sensing diaphragm, while the microchannel exhibits aresistance to the flow which depends upon the viscosity.
This chapter presents in detail the three core technologies of the sensor:the sensitive fluid, the viscosity sensing principle and the semi-permeablemembrane. The sensor modeling is also exposed to provide a better under-standing of the principles involved in this glucose detection.
3.2 Sensitive fluid
3.2.1 Sensing principle
The sensitive fluid used within the sensor is the key element for glucosedetection. This is based on the competitive affinity of two saccharides,namely glucose and dextran, to a specific saccharide-binding protein, Con-canavalin A. The sensing principle was first demonstrated by optical mea-surement of glucose concentration using fluorescence-labelled dextran [18],and then from the change in the viscosity of an aqueous blend of dex-tran and ConA [19]. This competitive affinity process was shown to bereversible and highly sensitive.
30

3.2. Sensitive fluid
GlucoseDextranConcanavalin A
Low glucose concentration
High glucose concentration
High viscosity Low viscosity
Figure 3.2: Principle of the glucose sensitive fluid: competitive binding ofglucose and dextran on ConA in the case of low and high glucose concen-trations.
This viscosity variation of a sensitive fluid using a high-molecular-wei-ght dextran is actually the core of our sensor. At low glucose concentration,dextran molecules are cross-linked by binding to ConA, forming a viscoussolution (Fig. 3.2). Next, when the glucose concentration increases, dex-tran molecules are partially replaced by glucose ones at the binding sites ofConA. As a result, the network ConA-dextran is weakened and the viscos-ity of the sensing solution decreases.
3.2.2 Rheological properties
The viscosity variations are especially strong in the human glycemic range(2–30 mM glucose). Indeed, changes in viscosity as high as one order ofmagnitude in the physiological relevant range were reported [66]. The sen-sitive fluid viscosity can also be tailored for the sensor of interest by modu-lating the proportions of dextran and ConA. We chose a low viscosity sen-sitive fluid which was characterized using a standard capillary viscometer(Fig. 3.3). It is worth noticing that the sensitivity of the fluid is particu-larly high in the hypoglycaemic range (2–4 mM), whereas it decreases inthe hyperglycaemic range (7–30 mM). High accuracy in hypoglycaemic re-
31

Chapter 3. Sensor principle and modeling
0 5 10 15 20 25 302
4
6
8
10
12
14
16
18
20
22
24
20°C 25°C 30°C 37°C
Vis
cosi
ty [m
Pas
]
Glucose concentration [mM]
Figure 3.3: Characteristics of the low viscosity sensitive fluid used withinthe sensor. (Data from [3].)
gion is mandatory to make this sensitive fluid particularly well suited forpatient monitoring. Beside that, the sensitive fluid viscosity is highly tem-perature dependent. When raising the temperature from 25 to 37˚C, thesensitive fluid viscosity decreases on average by 38%. This dependanceshould therefore be taken into account through calibration when workingin physiological conditions.
3.2.3 Concanavalin A properties
The affinity of ConA for glucose, mannose and their polysaccharides wasfirstly described by Goldstein et al. [54], and since then, has been exten-sively studied. The ConA monomer was reported to be a globular proteinof overall dimensions 42× 40× 39 Å [67]. In solution, ConA appears asdimer and tetramer configurations (two or four identical subunits) depend-ing on pH. Below a pH of 5.5, ConA exists as a dimer, and for a pH rang-ing from 5.5–7.0, ConA is at an equilibrium state of dimer-tetramer [68].At pH values higher than 7.0 the tetramer configuration is highly prevail-ing although some dimers seem to remain [69]. Each subunit of ConA hasone specific carbohydrate-binding site [70], which implies that four bind-
32

3.3. Viscosity sensing principle
ing sites are present in tetramer configuration. ConA dimer and tetramerhave respectively a molecular weight of 52 and 104 kDa, and their hydro-dynamic radiuses are respectively 3.3 and 4.4 nm [71].
The glucose binding site of ConA needs to be activated with two metalions per monomer. When two ions are trapped, the protein undergoes aconformational change, forming a so-called locked form, which increasesits affinity for glucose by a factor 1000 [72]. Several transition metals canbind the two binding sites of ConA, the most stable choice being Mn2+
and Ca2+. The average concentration of Ca2+ in blood is 1.18 mM whereasMn2+ only appears as a trace element. Calcium can also be used to activatethe two binding sites, which has the advantage to be closer to in vivo condi-tions. However, the occurrence of precipitation after a substantial time wasreported when using only Ca2+ [73]. Moreover, a high energy barrier sepa-rates the two conformations of ConA [74], the locked form should thereforebe stable even in absence of Mn2+ in the measured fluid. As a result, weselected the most stable configuration (Mn2+ and Ca2+).
ConA has been associated with a variety of toxicological effects in cellcultures and animals, which may be of concern regarding the implantationin human for in vivo glucose monitoring [75, 76, 77]. However, the majorityof adverse biological effects observed in animals are the result of the ad-ministration of large doses of ConA. The small amount of ConA used inmost glucose sensors (10 to 100 times less than dosage tested on animals)suggests that there would be little or no health risk associated with the sen-sor rupture [78].
3.3 Viscosity sensing principle
Basically, viscosity is obtained from the relationship between pressure andflow when the sensitive fluid goes through a channel. The sensor com-prises two microchambers filled with the sensitive fluid that communi-cate through a microchannel and a rigid nanoporous semi-permeable mem-brane (Fig. 3.4). This membrane has two roles: it confines the sensitive fluidinside the sensor (large molecules cannot go through) and ensures that theglucose can pass through, meaning that the concentration in the sensor andin the liquid should be the same. Each chamber is composed of a flexiblepiezoelectric diaphragm which whether deflects under voltage (actuating
33

Chapter 3. Sensor principle and modeling
Actuating diaphragm Sensing diaphragm
Free-standing alumina nanoporous membrane
Sensitive fluid
Microchannel
Figure 3.4: Schematic cross view of the glucose sensor.
diaphragm) or generates a voltage under some pressure load (sensing di-aphragm).
These actuating and sensing piezoelectric diaphragms together with themicrochannel are the basis for viscosity detection. When a voltage is ap-plied on the actuating piezoelectric diaphragm, the latter deflects and tendsto generate a flow through the microchannel. Due to its small section, themicrochannel exhibits a resistance to the flow which depends on the fluidviscosity. Next, the flow through the microchannel is recorded using thevoltage induced by the sensing piezoelectric diaphragm deflection.
Both transient and harmonic electric signals can be used to actuate thediaphragm (Fig. 3.5). The way viscosity is measured will depend on thesewaveforms. In transient mode, a constant voltage is suddenly applied tothe actuating diaphragm for a given time, and then it is switched off. Thesestates generate a strain in the piezoelectric membrane that in turn will cre-ate some pressure in the fluid. Due to its small cross section, the microchan-nel exhibits a resistance to the flow which depends upon the viscosity ofthe sensitive fluid. The system is characterized by a relaxation time thatdepends upon the viscosity of the sensitive fluid: the more viscous the sen-sitive fluid, the larger the relaxation time.
Conversely, under harmonic operation, a sinusoidal voltage is appliedon the actuating diaphragm. This generates an alternative flow inside themicrochannel which in turn generates a sinusoidal deflection and inducedvoltage of the sensing diaphragm. Since the amplitude and the phase shiftbetween the applied and induced piezoelectric voltages characterises theviscosity, we have a simple tool to assess the fluid characteristics: the moreviscous the sensitive fluid, the smaller the deflection and the larger the
34

3.4. Semi-permeable membrane
Actuating voltage
Sensing diaphragm deflection voltage
Harmonic mode
Phase shift
Transient mode
Relaxation time
Figure 3.5: Description of the measurement methods for viscosity detec-tion.
phase shift. In particular, we choose to measure the phase shift between0 to 90 degrees, which revealed to be an accurate and robust measurement.
3.4 Semi-permeable membrane
3.4.1 Function and requirements
The role of the semi-permeable membrane is to retain the essential mo-lecules of the sensitive fluid (ConA and dextran) inside the sensor whilstallowing glucose to diffuse freely in and out. For maintaining the rheo-logical properties of the sensitive fluid constant, the semi-permeable mem-brane has also to prevent some of the biological fluid macromolecules (likepeptides and proteins) to penetrate into the sensor. The main constituentmolecules of the sensitive fluid and of a typical biological fluid (intersti-tial fluid) are sketched in Fig. 3.6. In particular, there may be glycosy-lated molecules which could competitively interfere with the glucose mea-surement. The semi-permeable membrane has therefore to act as a size-selective interface, allowing only the diffusion of molecules of size compa-rable to glucose. In addition, the interface material has to be biocompatibleand has to minimize biofouling by preventing the non-specific adhesion ofbiomolecules.
35

Chapter 3. Sensor principle and modeling
ConA
Stokes radius 0.365 nmMW = 180 DaGlucose
Glucose in the body
Physiologic ionic medium
Extracellular water
Plasma protein Stokes radii4 – 10 nm
Cells ~10 µm diameter
Extracellular MatrixSensitive fluid(inside the sensor)
DextranMW = 3 500 000 Da Stokes radius ~27 nm
MW = 104 000 Da (tetramer) Stokes radius 4.4 nm (tetramer)
3.3 nm (dimer)
WaterMW = 18 Da
SaltsNaCl, MnCl2 , CaCl2
Figure 3.6: Illutration of the relative size of the molecules that the mem-brane has to select. MW is the molecular weight in Dalton. (Reprinted from[3].)
For small molecules like glucose, the intrinsic selectivity of the mem-brane is determined by the pore size distribution which defines the mem-brane molecular weight cut-off (MWCO). For larger biomolecules such asproteins, polymers or peptides, the molecule dimensions depend on thethree-dimensional structure which itself depends on the chemical environ-ment. When dealing with complex biomolecules, the selectivity of a mem-brane is therefore more likely to be compared by the Stokes radius1 than theMWCO. In addition, the effective radius of a protein in the context of mem-brane separation can be considerably larger than the Stokes radius due tothe presence of a diffuse ion cloud that surrounds the charged protein inaqueous solution [79]. For the size-selectivity to act correctly, one couldsimply choose a membrane with pores much smaller than the dimensionsof the molecules to be retained. However, the size difference between glu-
1The Stokes radius, or hydrodynamic radius, is the radius of a hypothetical hard spherethat diffuses at the same rate as the molecule. It is indicative of the apparent size of themolecule, including hydration and shape effects.
36

3.4. Semi-permeable membrane
500 nm
200 nm
2 µm
500 nm
a b
c d
Figure 3.7: SEM pictures of a nanoporous alumina membrane with a bi-layer structure: (a) cross section; (b) support layer with 200 nm pores; (c)zoom over the active layer cross section; (d) active layer with 2–4 nm pores.
cose and ConA dimer is only a factor 9 and thus we have to face the casewhere the molecule size and pore size are comparable. A semi-permeablemembrane with a narrow pore size distribution (1–5 nm) is therefore re-quired.
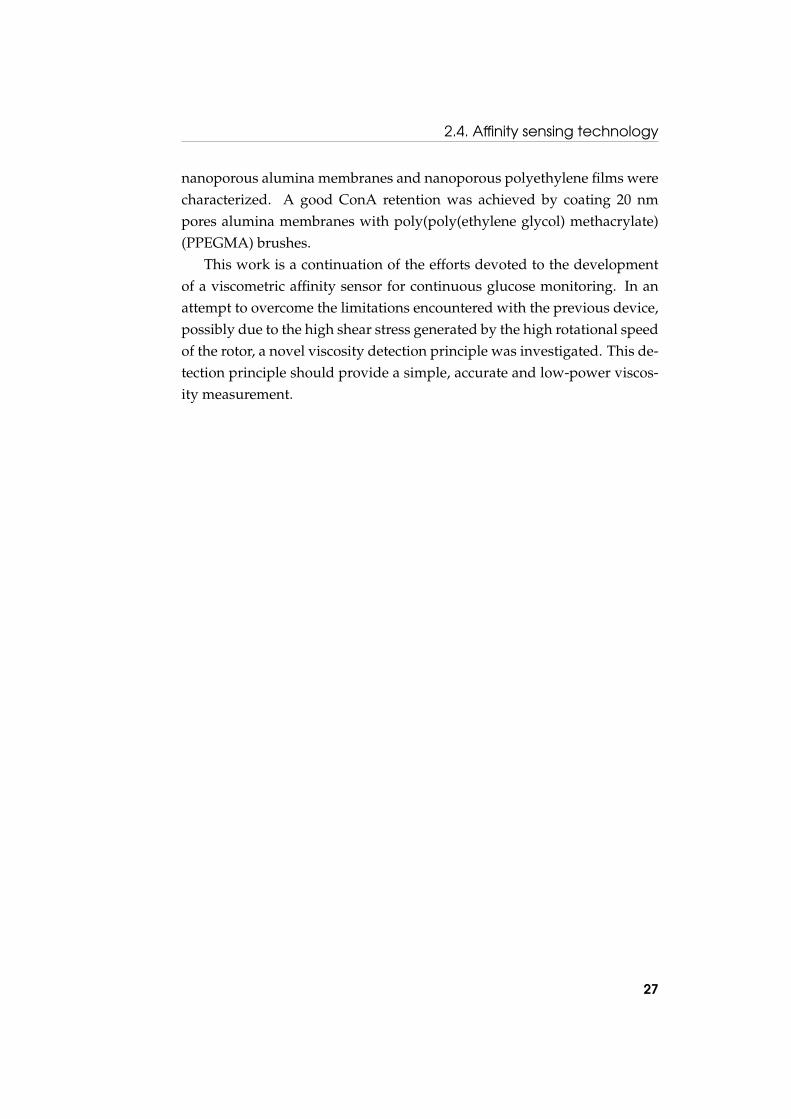
3.4.2 Nanoporous alumina membrane
Nanoporous anodic alumina membranes were selected as selective inter-face for the glucose sensor (Fig. 3.7). These membranes exhibit arrays ofstraight parallel pores of quasi-uniform shape and have the chemical prop-erties of a ceramic. They are formed by an electrochemical process involv-ing the oxidation of high purity aluminium sheets. For small pore sizes,anodic alumina membranes are generally prepared with a bilayer struc-ture. These asymmetrical membranes have a thin active layer and a supportlayer with larger pores. Typically, the active layer is 0.5 µm thick with 10 nmpores and the support layer is 50 µm thick with 200 nm pores. This double
37

Chapter 3. Sensor principle and modeling
layer configuration ensures rigid membranes whilst allowing good diffu-sivity properties. The pore diameter is controlled with great precision andreproducibility, allowing narrow pore size distribution, which is hardlyachieved by other type of membranes. Moreover, annealed anodic aluminamembranes have excellent chemical resistance and long-term stability inaqueous solution. The smallest pore size commercially available is 2–4 nmfrom Synkera Technologies Inc., and they are currently moving towardsmanufacturing of nanofitration membranes with 0.5–1 nm pores. With theright selectivity (pore size and distribution), high permeance, long-termstability in aqueous solution and intrinsic biocompatibility, anodic aluminamembranes seem therefore well-suited to act as size-selective interface onthe glucose sensor.
3.5 Sensor modeling
3.5.1 Viscosity sensing principle
Modelling aspects of the device are quite important to optimize the sen-sor with respect to the expected variation of the sensitive fluid viscosity. Asketch of the sensor principle used for the derivation of the generic analyt-ical solution is explained in Fig. 3.8.
Under quasi static conditions, the laminar viscous flow of a liquid thr-ough a circular channel with a length much greater than its diameter, isdescribed by the Hagen-Poiseuille equation
Q =πD4
128ηL∆P (3.1)
where Q is the volumetric flow rate, D and L are respectively the channeldiameter and length, η is the liquid viscosity and ∆P represents the pres-sure drop across the channel.
On the other hand, the deflection of the center of a piezoelectric di-aphragm depends on the applied voltage and pressure load. Assumingsmall deflections, the relationship is linear and given by
x = αV − βP (3.2)
where x is the deflection of the piezoelectric diaphragm center, V the volt-
38

3.5. Sensor modeling
Actuating chamber (1)Sensing chamber (2)
L
D
R1R2
x1 x2
P1P2
P1 , P2 Pressure in chambers 1, 2x1 , x2 Deflection of the piezoelectric diaphragms 1, 2
R1 , R2 Radius of the piezoelectric diaphragms 1, 2
L Length of the microchannel
D Diameter of the microchannel
Figure 3.8: Schematic representation of the viscosity sensing principle withthe used notations for the theoretical calculations.
age applied to the piezoelectric diaphragm and P the pressure acting a-gainst the diaphragm deflection. The coefficients α and β depend on thediaphragm geometry and material properties. For static deflections of acircular multi-layered piezoelectric diaphragm, their values are obtainedfrom the model of Deshpande et al. [80]. As no external voltage is appliedto the sensing piezoelectric diaphragm, its deflection only depends on thepressure load:
x2 = β2P2 (3.3)
Next, the total volume displaced by a fixed-edge circular diaphragmunder uniform load is given by
V =13
xπR2 (3.4)
where x and R are respectively the deflection of the center and the radius ofthe diaphragm, (note that this equation was derived for a diaphragm underuniform pressure load and not for a multi-layered piezoelectric diaphragm,but we will nevertheless use it as a good approximation).
The volumetric flow rate through the channel is equal to the volume
39

Chapter 3. Sensor principle and modeling
change under the sensing piezoelectric diaphragm:
Q =dVdt
=πR2
23
dxdt
(3.5)
Coupling the Hagen-Poiseuille flow through the channel with the piezo-electric diaphragms deflections, and considering a sinusoidal voltage V1 =
V01 sin(ωt) for actuation, we get the time dependent differential equation:
128ηLR22β1
3D4dx2
dt+
(R2
2β2 + R21β1
R21β2
)x2 = α1V0
1 sin(ωt) (3.6)
The solution of the differential equation is composed of a transient anda stationary part. Here, we are mainly interested in the stationary solutiondescribing the deflection of the sensing piezoelectric diaphragm, which isgiven by:
x2(t) = Asin(ωt− φ) (3.7)
with
A =R2
1β2
R22β2 + R2
1β1
α1V01√
τ2ω2 + 1(3.8)
and
φ = arctan(τω) (3.9)
where τ is the relaxation time of the system. The relaxation time is propor-tional to the liquid viscosity with a constant coefficient depending only onthe geometric and piezoelectric characteristics:
τ = kη (3.10)
with
k =128L3D4
R22R2
1β2β1
R22β2 + R2
1β1(3.11)
This means that when a sinusoidal voltage is applied to the actuatingpiezoelectric diaphragm, the sensing diaphragm will also deflect harmoni-cally, but its amplitude and phase shift will now depend on the relaxationtime of the system which is proportional to the liquid viscosity. Next, these
40
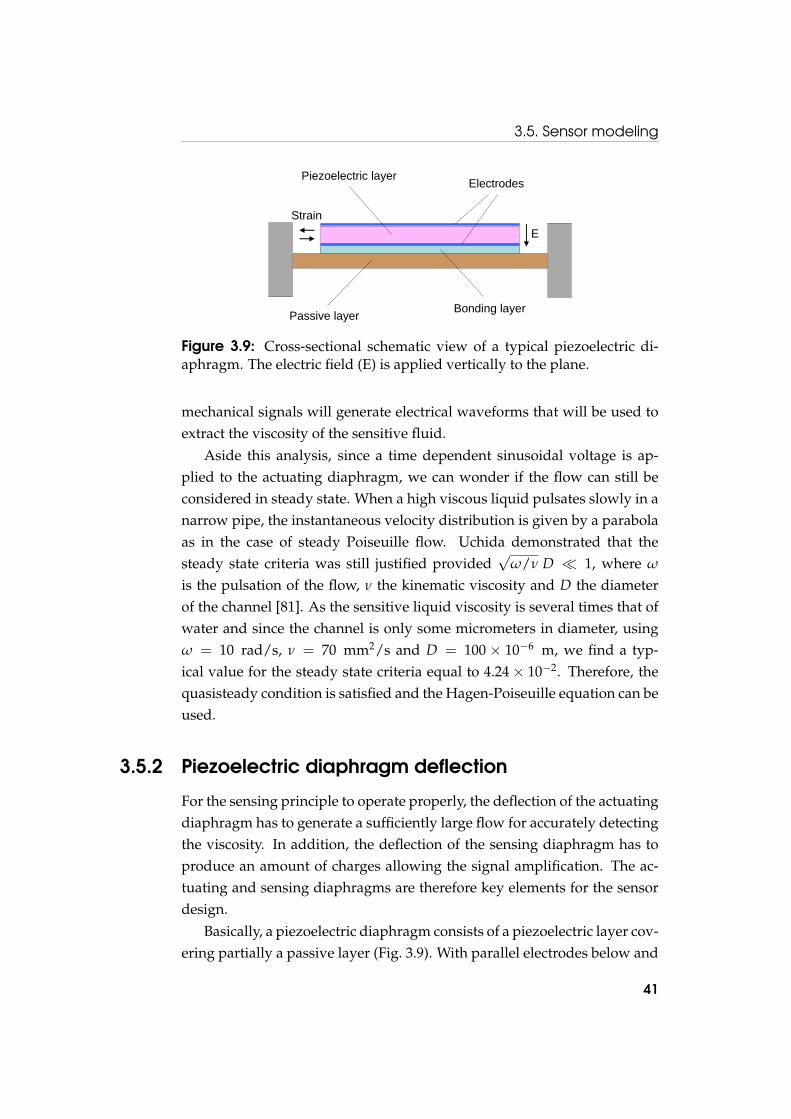
3.5. Sensor modeling
Passive layer
Piezoelectric layer
Bonding layer
Electrodes
StrainE
Figure 3.9: Cross-sectional schematic view of a typical piezoelectric di-aphragm. The electric field (E) is applied vertically to the plane.
mechanical signals will generate electrical waveforms that will be used toextract the viscosity of the sensitive fluid.
Aside this analysis, since a time dependent sinusoidal voltage is ap-plied to the actuating diaphragm, we can wonder if the flow can still beconsidered in steady state. When a high viscous liquid pulsates slowly in anarrow pipe, the instantaneous velocity distribution is given by a parabolaas in the case of steady Poiseuille flow. Uchida demonstrated that thesteady state criteria was still justified provided
√ω/ν D � 1, where ω
is the pulsation of the flow, ν the kinematic viscosity and D the diameterof the channel [81]. As the sensitive liquid viscosity is several times that ofwater and since the channel is only some micrometers in diameter, usingω = 10 rad/s, ν = 70 mm2/s and D = 100 × 10−6 m, we find a typ-ical value for the steady state criteria equal to 4.24× 10⁻². Therefore, thequasisteady condition is satisfied and the Hagen-Poiseuille equation can beused.
3.5.2 Piezoelectric diaphragm deflection
For the sensing principle to operate properly, the deflection of the actuatingdiaphragm has to generate a sufficiently large flow for accurately detectingthe viscosity. In addition, the deflection of the sensing diaphragm has toproduce an amount of charges allowing the signal amplification. The ac-tuating and sensing diaphragms are therefore key elements for the sensordesign.
Basically, a piezoelectric diaphragm consists of a piezoelectric layer cov-ering partially a passive layer (Fig. 3.9). With parallel electrodes below and
41
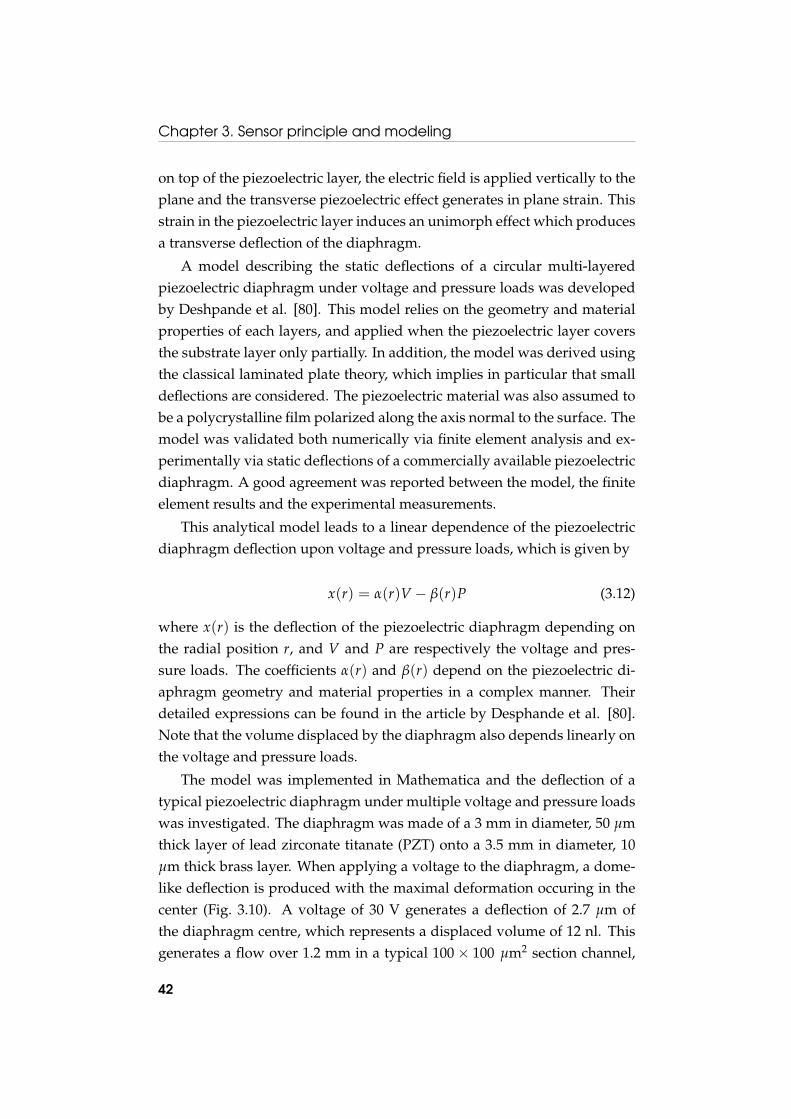
Chapter 3. Sensor principle and modeling
on top of the piezoelectric layer, the electric field is applied vertically to theplane and the transverse piezoelectric effect generates in plane strain. Thisstrain in the piezoelectric layer induces an unimorph effect which producesa transverse deflection of the diaphragm.
A model describing the static deflections of a circular multi-layeredpiezoelectric diaphragm under voltage and pressure loads was developedby Deshpande et al. [80]. This model relies on the geometry and materialproperties of each layers, and applied when the piezoelectric layer coversthe substrate layer only partially. In addition, the model was derived usingthe classical laminated plate theory, which implies in particular that smalldeflections are considered. The piezoelectric material was also assumed tobe a polycrystalline film polarized along the axis normal to the surface. Themodel was validated both numerically via finite element analysis and ex-perimentally via static deflections of a commercially available piezoelectricdiaphragm. A good agreement was reported between the model, the finiteelement results and the experimental measurements.
This analytical model leads to a linear dependence of the piezoelectricdiaphragm deflection upon voltage and pressure loads, which is given by
x(r) = α(r)V − β(r)P (3.12)
where x(r) is the deflection of the piezoelectric diaphragm depending onthe radial position r, and V and P are respectively the voltage and pres-sure loads. The coefficients α(r) and β(r) depend on the piezoelectric di-aphragm geometry and material properties in a complex manner. Theirdetailed expressions can be found in the article by Desphande et al. [80].Note that the volume displaced by the diaphragm also depends linearly onthe voltage and pressure loads.
The model was implemented in Mathematica and the deflection of atypical piezoelectric diaphragm under multiple voltage and pressure loadswas investigated. The diaphragm was made of a 3 mm in diameter, 50 µmthick layer of lead zirconate titanate (PZT) onto a 3.5 mm in diameter, 10µm thick brass layer. When applying a voltage to the diaphragm, a dome-like deflection is produced with the maximal deformation occuring in thecenter (Fig. 3.10). A voltage of 30 V generates a deflection of 2.7 µm ofthe diaphragm centre, which represents a displaced volume of 12 nl. Thisgenerates a flow over 1.2 mm in a typical 100× 100 µm2 section channel,
42

3.5. Sensor modeling
-1.5 -1 -0.5 0 0.5 1 1.5
-1
0
1
2
3
Radial position @mD
Def
lect
ion@mm
D
Radial position [mm]
Def
lect
ion
[µm
]12 kPa8 kPa4 kPa0 kPa
-1.5 -1.0 -0.5 0.0 0.5 1.0 1.5
-1
0
1
2
3
Figure 3.10: Deflections along a diameter of the piezoelectric diaphragmunder a voltage of 30 V and multiple pressure loads.
which should enable precise viscosity sensing.Generally, the piezoelectric layer covers the substrate layer only par-
tially, which reduces the thickness at the edge and thus favours the dia-phragm deflection. More precisely, the deflection depends upon the piezo-electric layer size which can be optimized to maximize the diaphragm de-flection (Fig. 3.11). In this particular case, as the piezoelectric layer is largelythicker than the passive layer, a small reduction of the piezoelectric layeris sufficient to favour the diaphragm deflection. However, when the thick-ness of the piezoelectric and passive layer are closer, the optimal piezo-electric radius decreases. According to the model, the optimal ratio of thepiezoelectric and passive layer radiuses mostly depends upon their respec-tive thicknesses. It does not depend on the voltage or membrane size, andonly slightly on the applied pressure. Note that an optimal piezoelectriclayer size is of primary importance when strong forces are required giventhat in this case the deflection is strongly reduced when decreasing thepiezoelectric layer size.
The piezoelectric and passive layers thicknesses also strongly influencethe diaphragm deflection. Depending on the application, thin layers areused to produce large deflections whereas thicker structures are usefull to
43
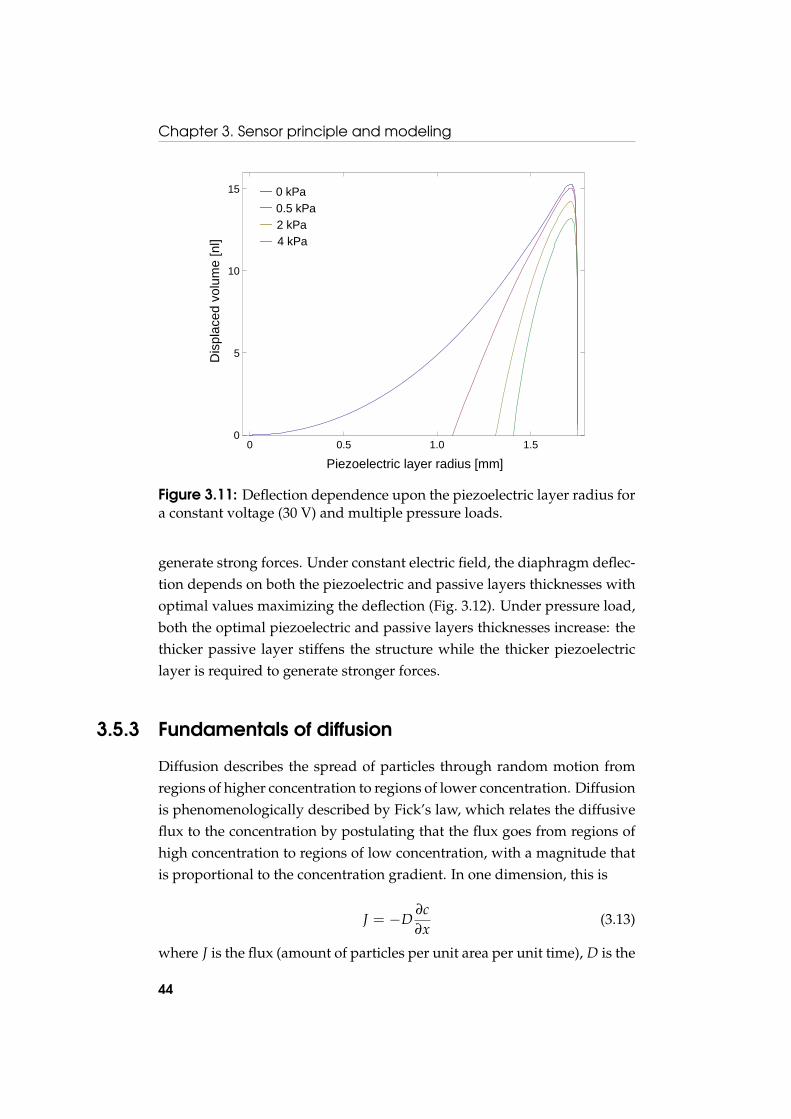
Chapter 3. Sensor principle and modeling
0 0.0005 0.001 0.00150
5
10
15
0 0.5 1.0 1.50
5
10
15
Piezoelectric layer radius [mm]
Dis
plac
edvo
lum
e [n
l] 4 kPa2 kPa0.5 kPa0 kPa
Figure 3.11: Deflection dependence upon the piezoelectric layer radius fora constant voltage (30 V) and multiple pressure loads.
generate strong forces. Under constant electric field, the diaphragm deflec-tion depends on both the piezoelectric and passive layers thicknesses withoptimal values maximizing the deflection (Fig. 3.12). Under pressure load,both the optimal piezoelectric and passive layers thicknesses increase: thethicker passive layer stiffens the structure while the thicker piezoelectriclayer is required to generate stronger forces.
3.5.3 Fundamentals of diffusion
Diffusion describes the spread of particles through random motion fromregions of higher concentration to regions of lower concentration. Diffusionis phenomenologically described by Fick’s law, which relates the diffusiveflux to the concentration by postulating that the flux goes from regions ofhigh concentration to regions of low concentration, with a magnitude thatis proportional to the concentration gradient. In one dimension, this is
J = −D∂c∂x
(3.13)
where J is the flux (amount of particles per unit area per unit time), D is the
44
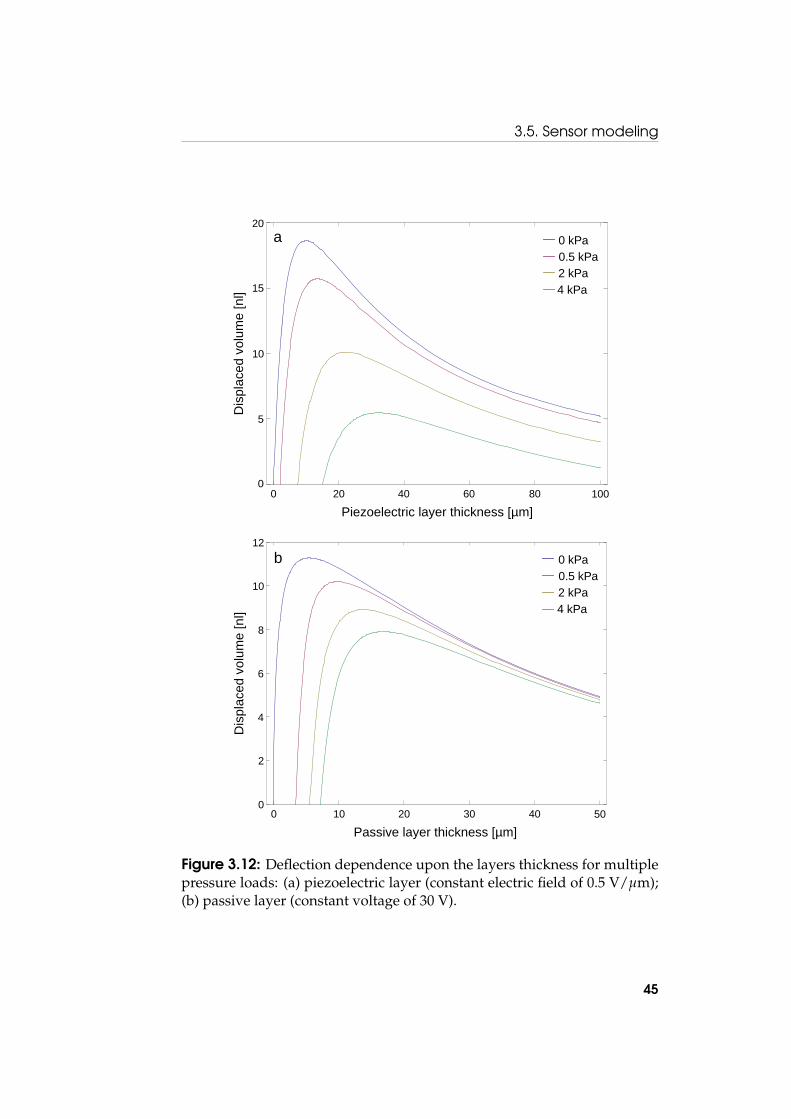
3.5. Sensor modeling
0 0.00002 0.00004 0.00006 0.00008 0.00010
5
10
15
20
Piezoelectric layer thickness
Disp
lace
dvol
ume@n
lD
0 0.00001 0.00002 0.00003 0.00004 0.000050
2
4
6
8
10
12
Piezoelectric layer thickness [µm]
Dis
plac
edvo
lum
e [n
l] 4 kPa2 kPa0.5 kPa0 kPa
0 20 40 60 80 1000
5
10
15
20
Passive layer thickness [µm]
Dis
plac
edvo
lum
e [n
l] 4 kPa2 kPa0.5 kPa0 kPa
0 10 20 30 40 500
2
10
12
4
6
8
a
b
Figure 3.12: Deflection dependence upon the layers thickness for multiplepressure loads: (a) piezoelectric layer (constant electric field of 0.5 V/µm);(b) passive layer (constant voltage of 30 V).
45

Chapter 3. Sensor principle and modeling
diffusion coefficient, c is the concentration, and x is the position.
Combining Fick’s law with the continuity equation which states that a chan-ge in density in any part of the system is due to inflow and outflow of ma-terial, we get the diffusion equation predicting how diffusion causes theconcentration to change with time:
∂c∂t
= D∂2c∂x2 (3.14)
Eintein’s theory of Browian motion relates the diffusion coefficient tothe particle mobility as
D = µkBT (3.15)
where µ is the particle mobility, kB is the Boltzmann’s constant, and T isthe temperature. The frictional coefficient (inverse of mobility) exerted onspherical particles with small Reynolds numbers (Re�1) in a viscous fluidis given by
γ = 6πηr (3.16)
where η is the dynamic viscosity and r is the radius of the spherical particle.Combining (3.15) and (3.16), we get the Einstein-Stokes equation which ex-presses the diffusion coefficient of spherical particles through liquids withlow Reynolds numbers:
D =kBT
6πηr(3.17)
3.5.4 Diffusion in membranes
A simple way of describing diffusion through membranes is to considertwo well-stirred volumes separated by a membrane (Fig. 3.13). In partic-ular, this diffusion cells configuration is used to characterize the diffusionproperties of membranes. To achieve this, a chamber is filled with a solu-tion of known concentration and the other chamber is filled with solvent.Next, the concentration is measured at regular intervals and the diffusioncoefficient is extracted from the concentration dynamics. An exact solu-tion to this problem is elaborate and unnecessary for practical use [82].The useful approximate solution depends on the assumption that the flux
46

3.5. Sensor modeling
Porous membrane
Well-stirred solutions
Chamber 1 Chamber 2
1C 2C
x
l2V1V
)(xc
Figure 3.13: Diffusion through a porous membrane separating two well-stirred solutions. Vi and Ci are respectively the volume and concentrationof the chamber i, and c(x) is the concentration inside the membrane.
across the membrane quickly reaches its steady-state value [83], and that asteady-state flux is approached even though the concentrations in the twochambers are changing with time.
In the case of steady diffusion, each side of the membrane is a well-mixed dilute solution of fixed concentration. In these conditions, the con-centration in the membrane does not change with time and the diffusionequation (3.14) becomes
d2cdx2 = 0 (3.18)
where c is the concentration in the membrane depending on the position x.
The boundary conditions relating the concentration in the membrane tothe fixed concentrations C1 and C2 of the dilute solutions are given by
c = HC1 for x = 0 (3.19)
c = HC2 for x = l
where H is the partition coefficient, which is the concentration in the mem-brane divided by that in the adjacent solution. The partition coefficient isan equilibrium property, which takes into account the relative solubility in
47
Chapter 3. Sensor principle and modeling
the membrane compared with that in the adjacent solutions. For porousmembranes, it also includes the porosity which is the pores-to-membranearea ratio.
The concentration profile in the membrane is obtained by integratingthe diffusion equation (3.18) using the boundary conditions (3.19):
c = HC1 + H (C2 − C1)xl
(3.20)
The solution is a linear change of concentration across the membrane whichdepends upon the membrane properties through the partition coefficient.The flux across the membrane is found by combining the concentration inthe membrane (3.20) with Fick’s law (3.13):
J = −HDl
(C2 − C1) (3.21)
We next write an overall mass balance on the adjacent chambers, expressedby
V1dC1
dt= −SJ (3.22)
V2dC2
dt= +SJ (3.23)
where S is the membrane area. Coupling these mass balance equationswith the flux equation (3.21), we obtain the differential equation for theconcentration of the dilute solutions:
ddt
(C2 − C1) = −HDS
lV1 + V2
V1V2(C2 − C1) (3.24)
The solution of this differential equation is given by
(C2 − C1) = (C2,0 − C1,0) exp(− t
τ
)(3.25)
with
τ =l
HDSV1V2
V1 + V2(3.26)
This means that the concentration of two well-stirred solutions sepa-rated by a porous membrane evolves towards the equilibrium following an
48

3.5. Sensor modeling
exponential relation. The time constant of this diffusion process dependsupon the diffusion coefficient, the membrane geometry and diffusive prop-erties, and the size of both chambers. When considering two chambers withidentical volumes and an effective diffusion coefficient, the time constantbecomes
τ =lV
2DeffS(3.27)
For nanoporous membranes, an effective diffusion coefficient is oftenconsidered, as many effects may restrict diffusion. In particular, the dif-fusion rate may be greatly slowed if the dimensions of the pores are com-parable with those of the diffusing molecules. In fact, it was shown thatthe rates of diffusion of organic non-electrolytes through membranes withvery small pores decrease, as a function of molecular size, far more rapidlythan can be accounted for on the basis of the free diffusion coefficients ofthe test molecules [84]. It also appears that diffusion is severely restrictedeven when the pores are of the order of 20 times larger than the diffusingmolecules [85]. The increased viscous drag in the pore and the particle-porewall interaction could explain this diffusion reduction. A further restrictionto diffusion may result from steric effects at the entrance to the pore, as thediffusing molecules can enter a pore only if they do not strike the edges[86].
With a factor 9 between glucose and ConA hydrodynamic radiuses, oursensor is characterized by a high solute-to-pore ratio, which means that theglucose diffusion through the nanoporous membrane will likely be reducedcompared to diffusion in solution.
3.5.5 Free diffusion
For the glucose concentration to be in equilibrium with the surrounding en-vironment, glucose molecules have first to diffuse across the nanoporousmembrane, and then in the sensitive fluid. This is a free diffusion whichcan be approximately described by the diffusion in a semi-infinite slab(Fig. 3.14). The slab initially contains a uniform concentration of solute. Attime t = 0, the concentration at the interface is suddenly increased, whichis described by the following boundary conditions:
49

Chapter 3. Sensor principle and modeling
Position z
c10 z
Time
c1
Position x
Time
ΔxC0
Cinfinite
Figure 3.14: Free diffusion in a semi-infinite slab. The concentration atthe left is suddenly increased to a higher constant value, which inducesdiffusion in the region to the right. (Reprinted from [87].)
c(x) = C∞ for all x at t = 0 (3.28)
c(x = 0) = C0 at t > 0
c(x = ∞) = C∞ at t > 0
The concentration at x = ∞ is constant because it is so far from the inter-face as to be unaffected by events while the concentration at x = 0 is keptconstant by adding material at the interface.
The solution is found by solving the diffusion equation (3.14) with theboundary conditions (3.28) using the definition of the variable ξ = x/
√4Dt,
(the detailed resolution of this problem can be found in [87]):
c(x, t)− C0
C∞ − C0= erf
(x√4Dt
)(3.29)
where
erf(ξ) =2π
∫ ξ
0exp
(−s2)ds (3.30)
50

3.6. Conclusion
is the error function.The expression ξ = x/
√4Dt completely determines the concentration
at the position x and time t, which means that the same diffusion levelis achieved for ξ constant. The length
√4Dt, called the diffusion length,
provides a measure of how far the concentration has propagated at time t.It is worth noticing that the diffusion time depends quadratically upon thedistance and linearly upon the diffusion coefficient. This implies that thesensor has to be as small as possible to minimize the diffusion length andthus reduce the response time. A good diffusion coefficient is also usefulto favour the diffusion process. According to the Eintein-Stokes relation(3.17), the diffusion constant decreases with the fluid viscosity due to anincreased viscous drag slowing the particle movement. A low-viscositysensitive fluid is therefore also required for rapid measurement.
3.6 Conclusion
In this chapter, we described and modeled the sensing principle relying onthe viscosity variation of a ConA-based sensitive fluid. With a hydrody-namic radius of 3.3 nm, the confinement of ConA require a nanofiltrationmembrane with a narrow pores size distribution. Nanoporous aluminamembranes were selected as they are characterized by a rigid structure, anarrow pores size distribution, and a long term stability in aqueous solu-tion. Concerning the sensor modeling, we showed that when applying asinusoidal voltage the system oscillates harmonically with amplitude andphase shift which depend on the sensitive fluid viscosity. The use of piezo-electric diaphragms was also validated by simulation, showing that smalldiaphragms can produce significant deflections. Finally, we expose a sim-ple exponential model for glucose diffusion in membranes, which allowsto experimentally determine the diffusion constant using diffusion cells.
51

Chapter 3. Sensor principle and modeling
52
Chapter 4
Sensor development andassessment
4.1 Introduction
The sensor topology was designed to allow its realization in microelec-tromechanical system (MEMS) technology. Its flat and stack-based struc-ture is in fact especially well-suited for microfabrication batch processeslike etching, thin film deposition, and patterning. The two chambers andthe microchannel could be etched in silicon using existing microfabrica-tion processes (Fig. 4.1). Such structures are commonly fabricated in sili-con for lab-on-a-chip applications. Piezoelectric thin films and their inte-gration in MEMS technology have also been subject to intensive research,and a number of devices based on PZT (lead zirconate titanate) thin filmswere successfully fabricated [88]. However, piezoelectric thin film fabrica-tion is still a complex technology which is mastered by a limited numberof research groups. Moreover, MEMS technology often brings miniatur-ization issues, especially for microfluidic devices. For these reasons, wechose to demonstrate the sensing principle using macroscopic technologies.The sensor was realized in stereolithography, also known as 3D printing,which allows to create plastic objects using laser-induced polymerizationof a photo-curable resin. The object is created by successively printing thinlayers of ultraviolet curable material on top of each other. Stereolithogra-phy allows rapidly creating prototypes with high accuracy.
In this chapter, the development and assessment of the sensor in iso-
53

Chapter 4. Sensor development and assessment
1.5 mm4 mm
MicrochannelLength 0.8 mmSection 50 × 50 µm2
CavityDiameter 1 mmDepth 295 µm
Filling channelWidth 100 µm Depth 50 µm
0.3 mm
Figure 4.1: Schematic view of the MEMS sensor concept with optimal di-mensions.
tonic saline solution are presented.
4.2 Sensor design
4.2.1 Sensor structure
According to the sensor model, a microchannel of about 50–100 µm was re-quired to detect viscosity with a small size sensor. Such a microchannel isnot feasible by standard stereolithography; with layers thickness of 50 µm,the smallest achievable channel is 300 µm. A glass capillary was thereforeintegrated in the stereolithography housing (Fig. 4.2). In addition, the actu-ating and sensing chambers were both defined by circular apertures in thestereolithography housing and sealed by circular piezoelectric diaphragmsand nanoporous membranes. Two filling channels were also included onboth sides of the stereolithography housing. Finally, the thickness of thechambers was minimized in order to keep a small diffusion length andhence a good response time.
4.2.2 Actuating piezoelectric diaphragm
For accurately detecting viscosity, the actuating diaphragm has to generatea large flow through the microchannel with sufficient pressure. A flow
54
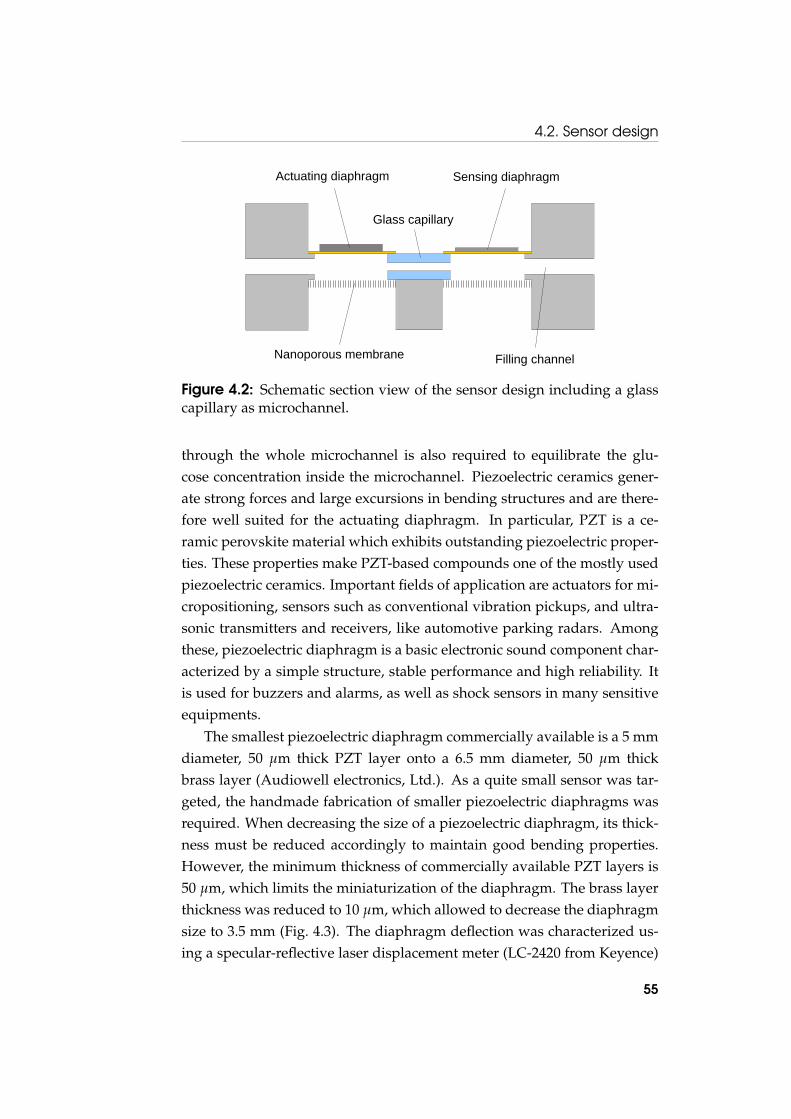
4.2. Sensor design
Actuating diaphragm Sensing diaphragm
Nanoporous membrane
Glass capillary
Filling channel
Figure 4.2: Schematic section view of the sensor design including a glasscapillary as microchannel.
through the whole microchannel is also required to equilibrate the glu-cose concentration inside the microchannel. Piezoelectric ceramics gener-ate strong forces and large excursions in bending structures and are there-fore well suited for the actuating diaphragm. In particular, PZT is a ce-ramic perovskite material which exhibits outstanding piezoelectric proper-ties. These properties make PZT-based compounds one of the mostly usedpiezoelectric ceramics. Important fields of application are actuators for mi-cropositioning, sensors such as conventional vibration pickups, and ultra-sonic transmitters and receivers, like automotive parking radars. Amongthese, piezoelectric diaphragm is a basic electronic sound component char-acterized by a simple structure, stable performance and high reliability. Itis used for buzzers and alarms, as well as shock sensors in many sensitiveequipments.
The smallest piezoelectric diaphragm commercially available is a 5 mmdiameter, 50 µm thick PZT layer onto a 6.5 mm diameter, 50 µm thickbrass layer (Audiowell electronics, Ltd.). As a quite small sensor was tar-geted, the handmade fabrication of smaller piezoelectric diaphragms wasrequired. When decreasing the size of a piezoelectric diaphragm, its thick-ness must be reduced accordingly to maintain good bending properties.However, the minimum thickness of commercially available PZT layers is50 µm, which limits the miniaturization of the diaphragm. The brass layerthickness was reduced to 10 µm, which allowed to decrease the diaphragmsize to 3.5 mm (Fig. 4.3). The diaphragm deflection was characterized us-ing a specular-reflective laser displacement meter (LC-2420 from Keyence)
55

Chapter 4. Sensor development and assessment
3.5 mm
3 mm
50 µm
PZT layer Brass layer
10 µm
3.5 mm
3 mm
28 µm
PVDF layer Brass layer
10 µm
a b
Figure 4.3: Dimensions of the actuating (a) and sensing (b) piezoelectricdiaphragms.
(Fig. 4.4). The piezoelectric diaphragm model describes accurately the di-aphragm deflection for small voltages. However, large deflections are un-derestimated by the model with a quite important deviation from the ex-pected linear behaviour. This could be explained by an increase in polariza-tion with the magnetic field, which would increase the piezoelectric effect.The model relies on a constant piezoelectric coefficient, and therefore thisnon-linear behaviour is not taken into account. However, the theoreticaland experimental values are of the same order of magnitude, which allowsto properly estimate the sensor response.
In operation, a voltage of 30 V was applied to the diaphragm, whichgenerates a deflection of 2.7 µm of the diaphragm center and corresponds toa flow of 1.2 mm in the 100× 100 µm2 section channel. Such a high voltagewas imposed by the sensor design, as a flow through the whole capillaryis required to mix the sensitive fluid inside the microchannel. Since a highvoltage is not compatible for in vivo applications, we can wonder whether alower actuating voltage could also be used. The voltage could be reducedby decreasing the microchannel dimensions, as the flow required to mixthe sensitive fluid would be reduced. For instance, a voltage of 5 V couldbe used with a 500 µm length, 50×50 µm2 section microchannel. The volt-age could also be reduced by decreasing the piezoelectric layer thickness,as an equivalent electric field would be produced with a lower voltage.However, as commercially available piezoelectric diaphragms have a mini-mum thickness of 50 µm, a dedicated fabrication would be required. In thecase of MEMS fabrication, PZT thin-film diaphragms could be directly inte-grated in the device [89]. Finally, the need to produce a flow across the mi-crochannel could be suppressed if glucose could directly diffuse into a mi-
56

4.2. Sensor design
0 10 20 30 400
2
4
6
8 Experimental Model
Def
lect
ion
[μm
]
Voltage [V]
Figure 4.4: Deflection of the actuating piezoelectric diaphragm under volt-age load.
crochannel with a porous side wall. For instance, the alumina nanoporousmembrane could be used to seal an open microchannel. This would be theideal case since the only remaining constraint on the deflection would bethe detection of the sensing signal. Therefore, solutions exists to decreasethe actuating voltage, but this was not the primary focus for this proof ofconcept sensor.
4.2.3 Sensing piezoelectric diaphragm
For the sensing principle to work properly, the sensing diaphragm has tobend more easily than the nanoporous membrane, otherwise the nano-porous membrane would deform instead of the sensing diaphragm andthe flow would not be detected. According to the piezoelectric diaphragmmodel, the PZT diaphragm used as actuator is 1.7 times stiffer than the50 µm thick alumina nanoporous membrane, implying that a more flexi-ble structure has to be used for the sensing side. Polyvinylidene fluoride(PVDF) is a thermoplastic fluoropolymer which exhibits a large piezoelec-tric coefficient as well as a low elastic modulus. The piezoelectric propertiesof PVDF are used to manufacture tactile sensor arrays, inexpensive straingauges and lightweight audio transducers. A 28 µm thick PVDF foil was
57
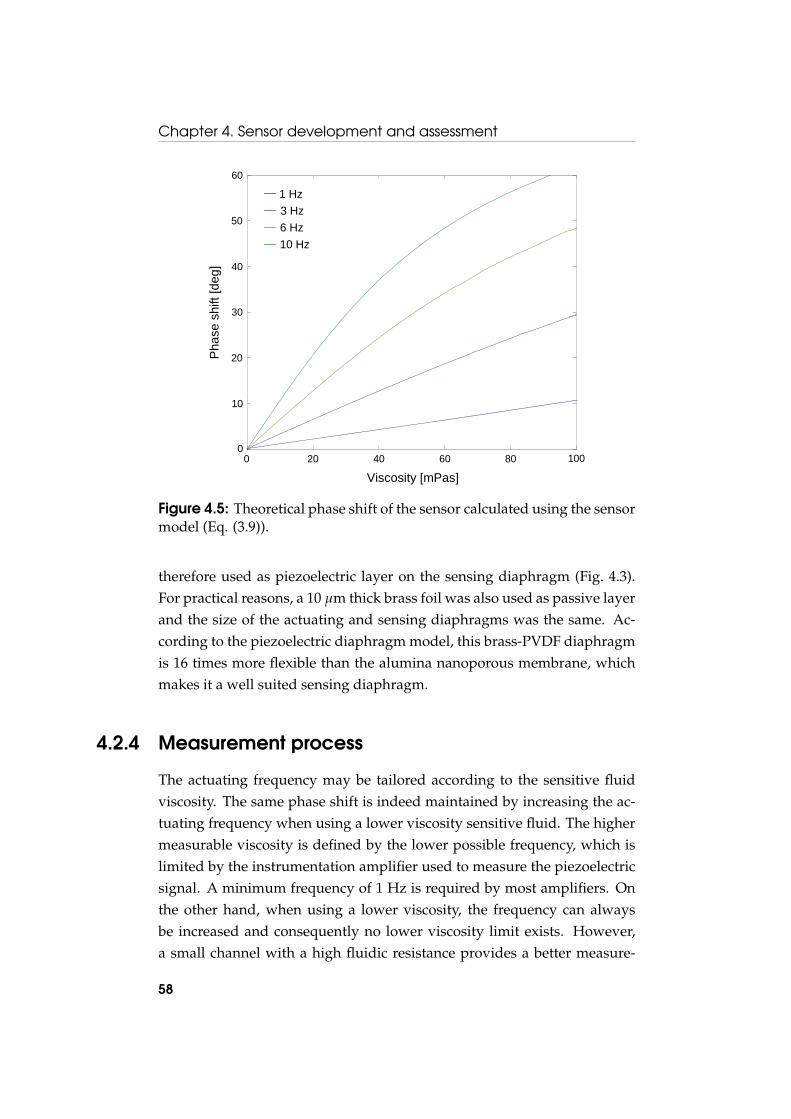
Chapter 4. Sensor development and assessment
0 0.02 0.04 0.06 0.08 0.10
10
20
30
40
50
60
Viscosity @PasD
Pha
sesh
ift@d
egD
Viscosity [mPas]
Pha
se s
hift
[deg
]
10 Hz6 Hz3 Hz1 Hz
0 20 40 60 80 1000
10
20
30
40
50
60
Figure 4.5: Theoretical phase shift of the sensor calculated using the sensormodel (Eq. (3.9)).
therefore used as piezoelectric layer on the sensing diaphragm (Fig. 4.3).For practical reasons, a 10 µm thick brass foil was also used as passive layerand the size of the actuating and sensing diaphragms was the same. Ac-cording to the piezoelectric diaphragm model, this brass-PVDF diaphragmis 16 times more flexible than the alumina nanoporous membrane, whichmakes it a well suited sensing diaphragm.
4.2.4 Measurement process
The actuating frequency may be tailored according to the sensitive fluidviscosity. The same phase shift is indeed maintained by increasing the ac-tuating frequency when using a lower viscosity sensitive fluid. The highermeasurable viscosity is defined by the lower possible frequency, which islimited by the instrumentation amplifier used to measure the piezoelectricsignal. A minimum frequency of 1 Hz is required by most amplifiers. Onthe other hand, when using a lower viscosity, the frequency can alwaysbe increased and consequently no lower viscosity limit exists. However,a small channel with a high fluidic resistance provides a better measure-
58

4.3. Experimental section
Glass capillary location
Actuating diaphragm location
Aperture for the actuating chamber
Actuating and sensing chambers
Locations for the coaxial electric connectors
Filling channel
10 mm
5.5 mm
Figure 4.6: Picture of the sensor housing fabricated by stereolithography.
ment accuracy; it is therefore better to operate at low frequency. A vis-cosity measurement range has therefore to be defined, while the actuatingfrequency is used to tailor the phase shift. Our sensor was designed tomeasure low viscosity sensitive fluids (10–100 mPas) at low frequency (1–10 Hz) (Fig. 4.5).
4.3 Experimental section
4.3.1 Sensor fabrication
The piezoelectric diaphragms were prepared by cutting 4 mm diameterdiscs from a 10 µm thick brass foil (Goodfellow) using laser ablation (LS-520G Nd:YAG 1064 nm from Laser Systems). A 3 mm diameter PZT discwas also cut by laser ablation from a 50 µm thick PZT layer provided by Au-diowell Electronics. Next, a 3 mm diameter disc was punched in a 28 µmthick PVDF foil provided by Measurements Specialties. The piezoelectricdiaphragms assembly was performed by gluing the PZT and PVDF discsonto brass discs using a low-viscosity epoxy adhesive (Loctite M-31CL). In
59

Chapter 4. Sensor development and assessment
Sensing piezoelectric diaphragm
Actuating piezoelectric diaphragm
Nanoporous alumina membrane
a b
Figure 4.7: Pictures of the assembled sensor showing the actuating andsensing piezoelectric diaphragms (a) and the nanoporous alumina mem-branes (b).
addition, electric contacts were achieved by bonding 0.1 mm copper wiresusing a conductive adhesive epoxy (EPO-TEK E4110 from Epoxy Technol-ogy). Finally, the piezoelectric diaphragms were coated with 10 µm pary-lene C to prevent any corrosion caused by water contact. Such coating waschosen because parylene is a chemically very stable polymer deposited atroom temperature.
The sensor housing was manufactured by stereolithography using abiocompatible medical-grade resin (Proform, Part. DSM XC11122) (Fig. 4.6).The housing included two 3.5 mm diameter circular apertures for the ac-tuating and sensing chambers, two 0.3 mm diameter filling holes, as wellas dedicated locations for the glass capillary, the piezoelectric diaphragmsand the alumina membranes. The semi-permeable membrane was a 50 µmthick alumina nanoporous membrane with 2–4 nm diameter pores (SynkeraTechnologies, Inc.). In addition, a 1 mm length, 100×100 µm2 section glasscapillary was used for the microchannel (Vitrocom, Part. ST8510). The sen-sor assembly was realized using medical-grade adhesive epoxy (Loctite M-21HP) using a precision syringe dispenser and a stereoscopic microscope(Fig. 4.7). Finally, the sensor was 200 µm thick, which was imposed by theouter dimension of the glass capillary, and contained 4 µl of sensitive fluid.
60

4.3. Experimental section
4.3.2 Sensitive fluid characteristics
The sensitive fluid consists in 2% [w/w] dextran 3200 (PSS) and 0.4% [w/w]ConA (Sigma) in a buffered saline solution (10mM Tris base, 1mM CaCl2,1mM MnCl2, 0.05% NaN3, 0.15M NaCl). Two metal ions, Mn2+ and Ca2+,were added to the solution to activate the glucose binding site of ConA.This conformational change strongly increases its affinity to glucose. ThepH was adjusted to the physiological value (pH 7.4), which also ensures amaximal proportion of tetrameric ConA able to bind up to 4 glucose groupsand form a large network. The saline concentration was set to its physio-logical value (0.15M NaCl) and NaN3 was added as preservative. The vis-cosity of the sensitive fluid was characterised using a capillary viscometer.Its values were ranging from 5.9 to 16.7 mPas at 25˚C and from 4.2 to 9.4mPas at 37˚C (Fig. 3.3).
4.3.3 Sensitive fluid preparation
To prepare the sensitive fluid, 3 stock solutions were necessary.
Stock solution 1 was prepared by dissolving 20 mM of Trizma bufferpH 7.4 (Sigma, Cat. T-7693), 0.1% [w/w] of sodium azide (Riedel-de Haen,Cat. 13412) and 4 mM D-(+)-glucose anhydrous (Fluka, Cat. 49138) in mil-lipore water.
Stock solution 2 contained 2 mM calcium chloride dehydrate (Fluka,Cat. 21101), 2 mM manganese II chloride tetrahydrate (Riedel-de Haen,Cat. 31422) and 300 mM sodium chloride (Fluka, Cat. 71379).
Stock solution 3 was a 50 mM sodium hydroxide (Fluka, Cat. 71691)aqueous solution, which was used for the pH adjustment of the sensitivefluid.
The sensitive fluid was prepared by dissolving dextran (Polymer Stan-dards Service, Cat. dxtb3m) in stock solution 1 and ConA (Sigma, Cat.C2010) in stock solution 2, as described below.
Solution A: Twice the concentration of the final preparation of dextranwas dissolved in stock solution 1 and mixed at room temperature for atleast 10 h.
Solution B: Twice the concentration of the final preparation of ConAwas dissolved in stock solution 2. The pH was adjusted to 7.4 by carefullyadding stock solution 3. Since this step is very critical, care was taken to
61

Chapter 4. Sensor development and assessment
2 mM 20 mM
6 mM
Waste
12 mM
+- Voltage amplifierActuating voltage
Thermostatic chamber Syringe pump
Figure 4.8: Experimental in vitro setup.
add the sodium hydroxide at a slow and controlled flow rate with constantmixing. If the transition is made too fast ConA tends to be denaturated andprecipitates. However this process should not take too long either, becauseConA has a tendency to precipitate in the absence of dextran. The solutionwas centrifuged at 4600 turns/min for 10 min.
One volume of solution A was put in a new recipient and the samevolume of solution B (filtered through a Millex HV 0.45 µm syringe filter)was added. The obtained preparation was thoroughly mixed by shaking.
4.3.4 Experimental setup
As the viscosity of the sensitive fluid is temperature-dependent, the wholesetup was located in a thermally regulated enclosure (±0.01˚C) (Fig. 4.8).The temperature of the thermostatic chamber was monitored with a highprecision thermometer (GMH 3710 from Greisinger GmbH) and was reg-ulated using a Peltier element controlled by a PID (proportional-integral-derivative) algorithm implemented in LabVIEW.
The sinusoidal voltage generation and acquisition were performed us-
62

4.4. Results and discussion
ing a multifunction data acquisition board (PCI-6052E from National In-strument). The actuating piezoelectric diaphragm was driven with a low-frequency sinusoidal voltage (1-5 Hz) amplified up to 30 V by means of ahigh voltage amplifier (WMA-02 from Falco Systems). The sensing voltagewas amplified using an instrumentation amplifier (AD8661 from AnalogDevice). The voltage generation, acquisition and phase shift computationwere performed using a LabVIEW interface. The phase shift was deter-mined by fitting the sensing signal with a sinusoidal function using theleast square regression method.
To evaluate the characteristics and response of the device, glucose mea-surements were performed in an isotonic saline solution which had thesame composition as the sensitive fluid except dextran and ConA. Thissolution was characterized by physiological values of the pH and salineconcentration. The two metal ions used to activate the glucose binding siteof ConA, Mn2+ and Ca2+, were added to the solution to ensure a goodstability of the sensitive fluid. Sodium azide (NaN3) was used as preserva-tive, and concentrated (2M) D-glucose was added to increase the glucoseconcentration to the desired level.
The sensor was enclosed in a dedicated housing containing the solutionto be measured. Glucose solutions of varying concentrations were pumpedinto the test cell using a computer controlled syringe pump (Tecan CavroXCalibur). A 9-port ceramic valve was used for the evaluation of multipletest solutions.
4.4 Results and discussion
4.4.1 Demonstrating the viscosity sensing principle
Before implementing the glucose sensor, the viscosity sensing principlewas first demonstrated using a system consisting of two piezoelectric di-aphragms and a microchannel, which was filled with viscosity referencestandards (Paragon Scientific, Ltd.). Phase shift measurements were per-formed with five different reference standards exhibiting dynamic viscosi-ties ranging from 3.65–17.25 mPas (Fig. 4.9). As expected from the model,the tangent of the phase shift depends linearly upon the viscosity. Themean standard deviation was about 0.2%, which shows the potential ac-
63

Chapter 4. Sensor development and assessment
2 4 6 8 10 12 14 16 18
0.2
0.3
0.4
0.5
0.6
0.7
0.8
Tang
ent o
f the
pha
se s
hift
Viscosity [mPas]
Figure 4.9: Phase shift measurements of different viscosity reference stan-dards at 20˚C.
curacy of this detection method. Moreover, the deviation from the linearcurve may be due to the need to open and change the viscosity referencestandard, which may lead to systematic errors from one measurement tothe other. This will not be the case for the glucose sensor, and we couldtherefore expect a much better reproducibility.
4.4.2 Sensor characterization at various temperatures
The sensor was characterized at 25 and 37˚C. Stepwise increasing levelsof glucose concentrations (2-4-7-11-16 mM) have been used, followed bysimilar decreasing glucose concentrations (16-11-7-4-2 mM) (Fig. 4.10). Thedata indicates that the sensing principle is highly reversible; the phase shiftcharacterizing a glucose level is the same after increasing or decreasing theglucose concentration.
The reversibility of the sensitive solution was expected since the re-versibility of the ConA-saccharide binding was previously demonstrated.Nevertheless, the difficulty is the confinement of the sensitive fluid in-side the sensor, provided that ConA is a small protein. The ConA hy-drodynamic radius in tetramer configuration (highly prevailing at pH 7.4)is 4.4 nm whereas the nanoporous alumina membrane pores distributionwas 2–4 nm. The high degree of reversibility obtained implies that ConA
64
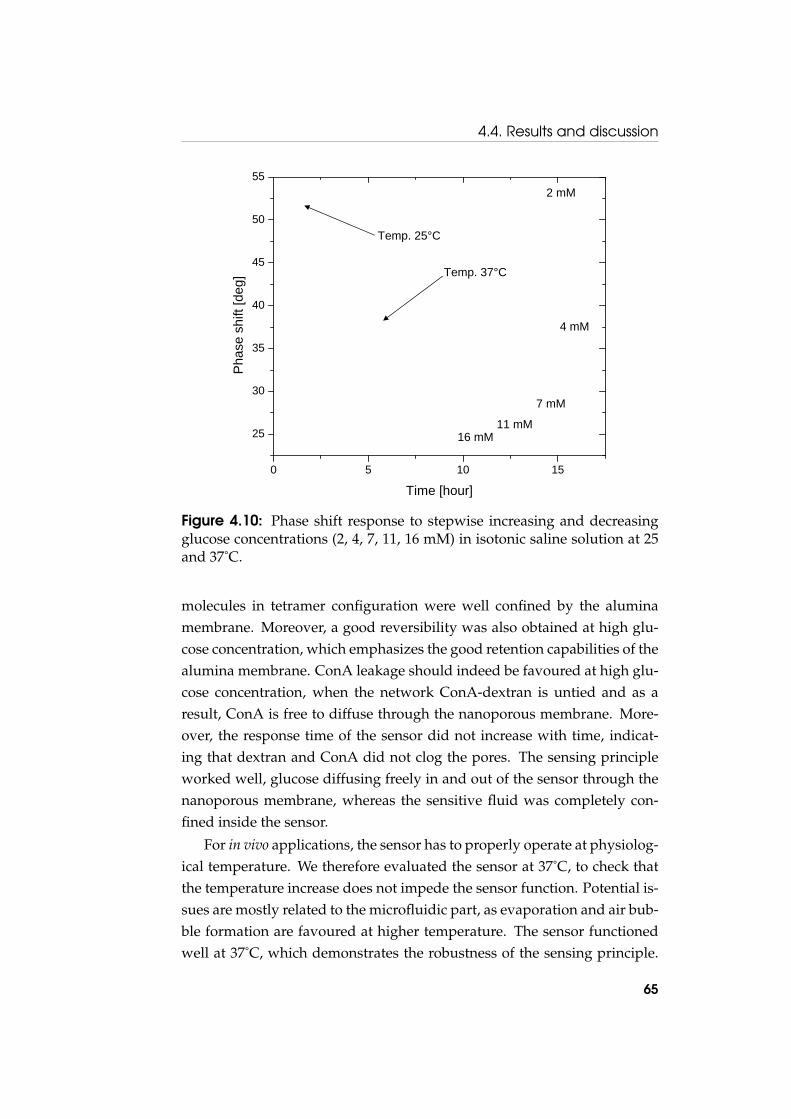
4.4. Results and discussion
0 5 10 15
25
30
35
40
45
50
55
Pha
se s
hift
[deg
]
Time [hour]
2 mM
7 mM
11 mM16 mM
4 mM
Temp. 25°C
Temp. 37°C
Figure 4.10: Phase shift response to stepwise increasing and decreasingglucose concentrations (2, 4, 7, 11, 16 mM) in isotonic saline solution at 25and 37˚C.
molecules in tetramer configuration were well confined by the aluminamembrane. Moreover, a good reversibility was also obtained at high glu-cose concentration, which emphasizes the good retention capabilities of thealumina membrane. ConA leakage should indeed be favoured at high glu-cose concentration, when the network ConA-dextran is untied and as aresult, ConA is free to diffuse through the nanoporous membrane. More-over, the response time of the sensor did not increase with time, indicat-ing that dextran and ConA did not clog the pores. The sensing principleworked well, glucose diffusing freely in and out of the sensor through thenanoporous membrane, whereas the sensitive fluid was completely con-fined inside the sensor.
For in vivo applications, the sensor has to properly operate at physiolog-ical temperature. We therefore evaluated the sensor at 37˚C, to check thatthe temperature increase does not impede the sensor function. Potential is-sues are mostly related to the microfluidic part, as evaporation and air bub-ble formation are favoured at higher temperature. The sensor functionedwell at 37˚C, which demonstrates the robustness of the sensing principle.
65

Chapter 4. Sensor development and assessment
0 1 2 3 4 520
30
40
50
60
70
80
Pha
se s
hift
[deg
]
Time [hour]
2 mM 2 mM
20 mM
Figure 4.11: Sensor response to increasing and decreasing glucose concen-trations fitted with an exponential model.
Finally, we observe that the degree of glucose-induced phase shift changeis reduced by about 55% when the temperature increases. This was ex-pected, since the sensitive fluid viscosity is highly temperature dependent.However, the reduced sensitivity at 37˚C does not represent a practical lim-itation for the detection of the glucose concentration provided that somecalibrations are carried out.
4.4.3 Sensor response dynamics
The sensor kinetics is mostly governed by the glucose diffusion throughthe nanoporous membrane and in the sensitive fluid. Both diffusion pro-cesses are free diffusions, approximately described by the diffusion in asemi-infinite slab whose solution is given by the error function (see section3.5.5). The sensitive fluid is also mixed in the vicinity of the glass capillaryby the alternative flow, which speeds up the sensor response compared toa purely diffusive process.
Experimentally, the diffusion of glucose in-outside of the sensor waswell described by an exponential model (Fig. 4.11). The response time wasdetermined by fitting the sensor response to glucose variations using an
66

4.4. Results and discussion
exponential relationship given by
y = A(1− e−tτ ) + B (4.1)
where τ is the relaxation time. In sensor technology, the response timeis commonly expressed as τ90%, which is the response time of the sensorto reach 90% of the variation amplitude. For this exponential relationship(4.1), the response time is given by τ90% = ln(10)τ.
The response time of the sensor was determined by fitting the sensorresponse to multiple glucose concentrations at 25 and 37˚C. The responsetime was averaged over 20 measurements for each temperature (Fig. 4.12).At 37˚C, the response time of the sensor was 3.6± 0.7 min when increas-ing glucose concentrations, and 12.8± 1.4 min for the decreasing case. Thelonger time constant related to decreasing glucose concentrations could beexplained by a smaller mobility of glucose molecules in the viscous sensi-tive fluid with respect to the isotonic saline solution. This smaller mobilitywould increase the time required for glucose molecules to find a pore, con-sequently slowing down the diffusion process when glucose diffuse out ofthe sensor. Therefore, we expect that the porosity of the semi-permeablemembrane affects more the glucose molecules leaving the sensor than glu-cose molecules entering the sensor.
The sensor kinetics was improved when increasing the temperaturefrom 25 to 37˚C due to the reduction of the sensitive fluid viscosity. Astronger reduction of the response time was observed for increasing glu-cose concentration (51%) than for the decreasing case (16%). As the diffu-sion time in a solution is directly proportional to its viscosity, the responsetime reduction may be compared to the mean viscosity decrease of the sen-sitive fluid (38%). From these results, it seems that the glucose diffusionin the sensor directly depends on the sensitive fluid viscosity, whereas thediffusion out of the sensor is also limited by an other factor. Both diffusionin and out of the sensor were expected to strongly depend upon the vis-cosity and this difference is hardly explained. A hypothesis could be thatthe glucose diffusion out of the sensor is more importantly restricted by themembrane porosity.
The response time achieved by our device was slightly longer than ourtargeted 10 min response time required for a medical device. This responsetime may be shortened by reducing the sensor thickness since this would
67
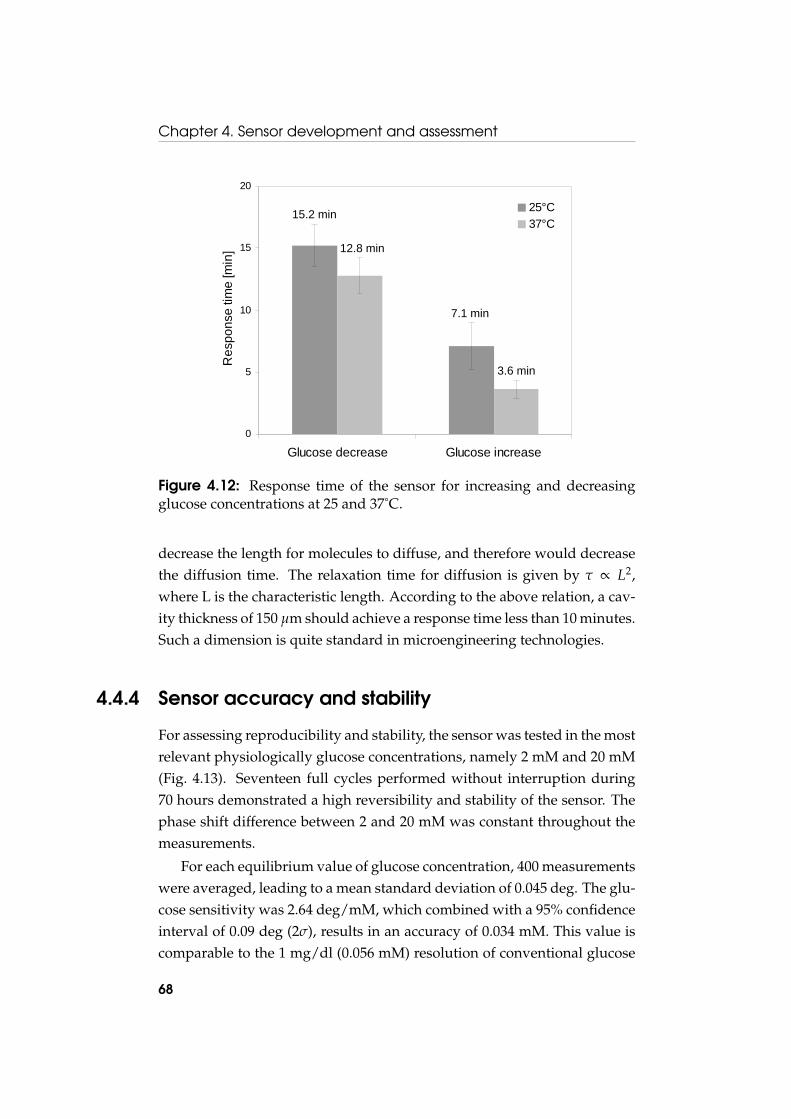
Chapter 4. Sensor development and assessment
0
5
10
15
20
Glucose decrease Glucose increase
Res
pons
e tim
e [m
in]
25°C37°C
15.2 min
7.1 min
12.8 min
3.6 min
Figure 4.12: Response time of the sensor for increasing and decreasingglucose concentrations at 25 and 37˚C.
decrease the length for molecules to diffuse, and therefore would decreasethe diffusion time. The relaxation time for diffusion is given by τ ∝ L2,where L is the characteristic length. According to the above relation, a cav-ity thickness of 150 µm should achieve a response time less than 10 minutes.Such a dimension is quite standard in microengineering technologies.
4.4.4 Sensor accuracy and stability
For assessing reproducibility and stability, the sensor was tested in the mostrelevant physiologically glucose concentrations, namely 2 mM and 20 mM(Fig. 4.13). Seventeen full cycles performed without interruption during70 hours demonstrated a high reversibility and stability of the sensor. Thephase shift difference between 2 and 20 mM was constant throughout themeasurements.
For each equilibrium value of glucose concentration, 400 measurementswere averaged, leading to a mean standard deviation of 0.045 deg. The glu-cose sensitivity was 2.64 deg/mM, which combined with a 95% confidenceinterval of 0.09 deg (2σ), results in an accuracy of 0.034 mM. This value iscomparable to the 1 mg/dl (0.056 mM) resolution of conventional glucose
68
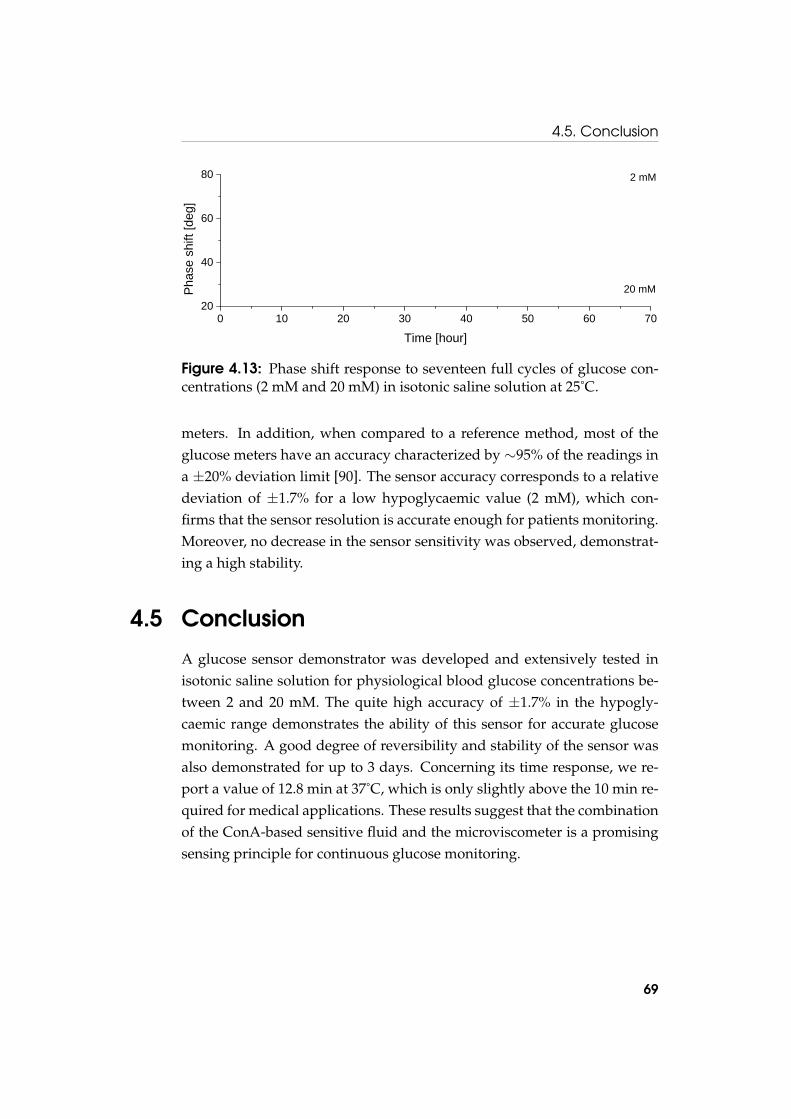
4.5. Conclusion
0 10 20 30 40 50 60 7020
40
60
80Ph
ase
shift
[deg
]
Time [hour]
2 mM
20 mM
Figure 4.13: Phase shift response to seventeen full cycles of glucose con-centrations (2 mM and 20 mM) in isotonic saline solution at 25˚C.
meters. In addition, when compared to a reference method, most of theglucose meters have an accuracy characterized by ∼95% of the readings ina ±20% deviation limit [90]. The sensor accuracy corresponds to a relativedeviation of ±1.7% for a low hypoglycaemic value (2 mM), which con-firms that the sensor resolution is accurate enough for patients monitoring.Moreover, no decrease in the sensor sensitivity was observed, demonstrat-ing a high stability.
4.5 Conclusion
A glucose sensor demonstrator was developed and extensively tested inisotonic saline solution for physiological blood glucose concentrations be-tween 2 and 20 mM. The quite high accuracy of ±1.7% in the hypogly-caemic range demonstrates the ability of this sensor for accurate glucosemonitoring. A good degree of reversibility and stability of the sensor wasalso demonstrated for up to 3 days. Concerning its time response, we re-port a value of 12.8 min at 37˚C, which is only slightly above the 10 min re-quired for medical applications. These results suggest that the combinationof the ConA-based sensitive fluid and the microviscometer is a promisingsensing principle for continuous glucose monitoring.
69

Chapter 4. Sensor development and assessment
70

Chapter 5
Long term performance studyof the sensor
5.1 Introduction
The sensor showed an excellent behaviour up to 3 days, which is promisingfor short term applications. Beside that, a long term implantable sensor isalso highly desirable for diabetic patients. In this chapter, we thereforefocus on the long term stability of the sensor, which is mandatory for suchapplication.
The long term stability of the sensor was investigated by continuouslycycling glucose concentrations at body temperature during 25 days. Wealso studied in detail the 2–4 nm nanoporous alumina membrane, whichis a key for the long term stability since it has to confine the sensitive fluidwhilst allowing fast glucose permeation. As ConA is a small protein, adefect-free membrane with a well defined pore size distribution is requiredfor ensuring a perfect retention.
The size-selective diffusion in nanoporous alumina membranes was in-vestigated using diffusion cells. ConA retention and glucose diffusion weremeasured using respectively ultraviolet absorption spectrometry and re-fractometry. In addition, the pores size distribution and the porosity werecharacterized using scanning electron microscopy. We also evaluated poresnarrowing by atomic layer deposition as a mean to improve the retentionproperties of nanoporous alumina membranes.
71

Chapter 5. Long term performance study of the sensor
Glucose or
ConA6 mm
140 µl 140 µl
Nanoporous alumina membrane
Figure 5.1: Glucose diffusion and ConA retention were evaluated usingdiffusion cells. The concentration of permeating molecules was monitoredby refractometry or UV absorbance spectrometry during tests.
5.2 Experimental description
5.2.1 Diffusion cells
The ConA retention and glucose diffusion properties of 2–4 nm annealednanoporous alumina membranes from Synkera Technologies were assessedusing home-made diffusion cells fabricated in PMMA (poly(methyl metha-crylate)) (Fig. 5.1). The two diffusion cells had a volume of 140 µl with adiffusing surface of about 28 mm2. The two chambers were separated bythe nanoporous membrane, which was glued using medical-grade adhe-sive epoxy (Loctite M-21HP) for ensuring leak-tight measurements. First,a solution with a given concentration of the solute was injected in the firstcell while pure solvent was injected in the second one. Both cells could bestirred by standard PTFE (Teflon) magnetic stirrers. The solute diffusionwas monitored by measuring the solute concentration by either refractom-etry or UV absorbance spectrometry.
5.2.2 Refractometry
The glucose concentration was determined by measuring the refractive in-dex of the solution using a high precision refractometer (Bellingham andStanley RFM 342). A volume as small as 60 µl is required for refractive in-dex measurements carried out at the reference wavelength of 589.3 nm (the
72

5.2. Experimental description
sodium D line). The refractive index depends almost linearly on glucoseconcentration. An accuracy of ∼ 4× 10⁻⁴ is reported, which correspondsto 1.5 mM of glucose concentration.
For determining the glucose diffusion, the two diffusion cells were re-spectively filled with a 100 mM glucose solution and ultrapure water. Be-fore each experiment, a two points calibration curve was performed bymeasuring the refractive index of the 100 mM glucose solution and ul-trapure water. Both chambers were stirred during the whole experimentand measurements were recorded at regular intervals. A sample was with-drawn from the diffusion cell and placed on the refractometer crystal forthe measurement, after what the solution was put back in the diffusioncell. The refractive index values were converted to glucose concentrationsusing the calibration curve.
5.2.3 UV absorbance spectrometry
UV absorbance spectrometry was used to quantify the concentration ofConA in solution. The tyrosine (274 nm) and tryptophan (280 nm) aromaticamino acids were detected as they are the most absorbing components ofproteins. The UV light was transmitted via an optical fiber from the UVlight source (DT-MINI-2-GS from Ocean Optics), then passed through thesample contained in a micro-cuvette (70 µl), and was collected by a spec-trometer (USB4000-UV-VIS from Ocean Optics). The intensity of the trans-mitted UV light was measured by the spectrometer and a reference wasused to determine the relative absorption induced by ConA. A calibrationspectra was determined using isotonic saline solutions containing variousConA concentrations in the range of the sensitive fluid (0.01–0.1% [w/w])(Fig. 5.2). A linear correlation was found between the ConA concentrationand the relative absorbance at 280 nm, which was used to quantify ConAdiffusion.
It is known that ConA is instable in solution and precipitates after afew hours. As its solubility is strongly increased in presence of dextran[91], the retention experiments were performed using the sensitive fluid.The two diffusion cells were respectively filled with the sensitive fluid andthe isotonic saline solution. The glucose concentration of both solutionswas 30 mM, a relatively high concentration where most ConA moleculesare in their unbounded state, which favours their diffusion through the
73

Chapter 5. Long term performance study of the sensor
240 260 280 300 320
0.0
0.2
0.4
0.6
0.8
1.0
1.2
1.4
1.6
0 % 0.01 % 0.02 % 0.05 % 0.10 %
Abs
orba
nce
Wavelength [nm]
ConA concentration
0.00 0.02 0.04 0.06 0.08 0.10
0.0
0.2
0.4
0.6
0.8
1.0
1.2
1.4
Abso
rban
ce @
280
nm
ConA concentration [wt%]
Linear fit: y = 13.51 x
a
b
Figure 5.2: (a) UV absorbance spectra of various ConA concentrations inisotonic saline solution. (b) Calibration curve of the absorbance at 280 nmas a function of ConA concentration.
74

5.3. Results and discussion
Figure 5.3: Long term measurement of glucose concentrations (2 mM and12 mM) in isotonic saline solution at 37˚C.
nanoporous membrane. For determining the ConA diffusion coefficient,a sample of isotonic saline solution was removed from the diffusion celland placed in the micro-cuvette for recording the UV absorption spectrum.The ConA retention was evaluated by measuring its concentration in theisotonic saline solution every 24 hours, after what the solution was replacedby a fresh one.
5.3 Results and discussion
5.3.1 Long term stability of the sensor
The long term stability of the sensor at 37˚C was investigated by varyingglucose concentrations (2 and 12 mM) every 12 hours for a total of 25 days(Fig. 5.3). The sensor worked well during the whole experiment, glucosediffusing freely in and out of the sensor through the nanoporous mem-brane, whereas the sensitive fluid was still confined inside the sensor. Thisgood behaviour throughout the experiment also demonstrates the excellentlong term stability of the membrane in aqueous solution at 37˚C. More-over, the response time of the sensor did not increase with time, indicat-ing neither dextran nor ConA clogged the pores. Beside these promisingcharacteristics, the sensor sensitivity decreased linearly with a reduction
75

Chapter 5. Long term performance study of the sensor
0 5 10 15 20 25
0
5
10
15
20
25
30
Loss
of s
ensi
tivity
[% o
f ini
tial]
Time [day]
Linear fit: y = 1.26 x
Figure 5.4: Loss of sensitivity of the long term measurement expressed aspercentage of the initial sensitivity.
of 1.3% per day (Fig. 5.4). Multiple effects could account for the sensitiv-ity reduction, as an incomplete confinement of the sensitive fluid, ConAdeactivation, or mechanical fatigue of the piezoelectric diaphragms. How-ever, the sensitive fluid showed a good stability, as it was stored at roomtemperature during several months without noticing any loss of sensitiv-ity. In addition, piezoelectric diaphragms are generally used at higher fre-quencies, and thus the number of measuring cycles should not be an issue.Therefore, we hypothesize that the loss of sensitivity was mostly due toprogressive ConA leakage through the nanoporous membrane. The ConAhydrodynamic radius (respectively 3.3 and 4.4 nm in dimer and tetramerconfiguration) is in fact close to the pores size distribution of the 2–4 nmnanoporous membrane.
5.3.2 Glucose diffusion in the nanoporous membrane
The glucose diffusion properties of the 2–4 nm nanoporous alumina mem-brane were characterized by measuring the glucose diffusion in 5 differ-ent membranes (Fig. 5.5). As expected from the diffusion cells model (seesection 3.5.4), the dynamics of glucose diffusion is pretty well fitted by an
76

5.3. Results and discussion
0 20 40 60 80
0
10
20
30
40
50
60
Glu
cose
con
cent
ratio
n [m
M]
Time [min]
Figure 5.5: Dynamics of glucose diffusion through 5 different 2–4 nmnanoporous alumina membranes fitted by an exponential law.
exponential law. The relaxation time determined by best fitting gives amean relaxation time of 15.3±3.5 min. The effective diffusion coefficientwas calculated from the relaxation time following Eq. (3.27), which gives(1.35± 0.31)× 10−4 mm2/s. From these results, it comes out that the glu-cose diffusion coefficient in this membrane is only ∼5 times smaller thanin water (D = 6.73× 10⁻⁴ mm2/s [16]). Considering the relative standarddeviation of 23%, this value is of the same order of magnitude that the dif-fusion coefficient in a 20 nm asymmetric alumina membrane from What-man (1.39× 10⁻⁴ mm2/s) and much higher than its value in a nanoporouspolyethylene membrane (0.18× 10⁻⁴ mm2/s) [92]. This quite high diffu-sivity is remarkable when considering all possible effects impeding diffu-sion in nanoporous membranes. One important factor is the membraneporosity, which strongly reduces the active diffusing surface in nanoporousmembranes. From SEM pictures, the porosity of the active layer with 13±2nm alumina membranes was estimated to be 28.9%, which explains most ofthe reduction in diffusion. In addition, when moving to nanofiltration ap-plication, the free diffusion is progressively restricted when the dimensionsof the pores become comparable with those of the diffusing molecules.
77

Chapter 5. Long term performance study of the sensor
250 260 270 280 290 300
0.00
0.02
0.04
0.06
0.08
0.10
0.12
0.14
1 2 3 7 9 15 20 25 29
Abs
orba
nce
Wavelenth [nm]
Measurement day
Figure 5.6: UV absorbance spectra of the retention test of the 2–4 nm alu-mina nanoporous membrane (unstirred solutions). Each spectrum charac-terizes the ConA permeation during 24 hours.
Factors explaining this limited diffusion may include an increased viscousdrag in the pore, particle-pore wall interactions, as well as steric effects atthe entrance of the pore [93]. With a factor of about 4 between the glucosehydrodynamic radius (0.365 nm [94]) and the pores size, we are typicallyin a situation where the high solute-to-pore ratio may restrict diffusion.This is confirmed by previous results which reported that glucose diffu-sion was already substantially reduced in a 7 nm nanoporous silicon ni-tride membrane [95]. However, from the quite good diffusion properties ofthe present membrane, it seems that the diffusion is only slightly affected,which is explained by the asymmetrical structure of the membrane. In fact,only a very thin active layer (0.5–1.5 µm) restricts diffusion whereas mostof the diffusion takes place in the support layer (50 µm), which is charac-terized by larger pores (150–200 nm) which do not impede diffusion.
5.3.3 ConA retention by the nanoporous membrane
The ConA retention properties of 2–4 nm alumina membranes from Syn-kera Technologies were investigated during 35 days. We recorded the UV
78
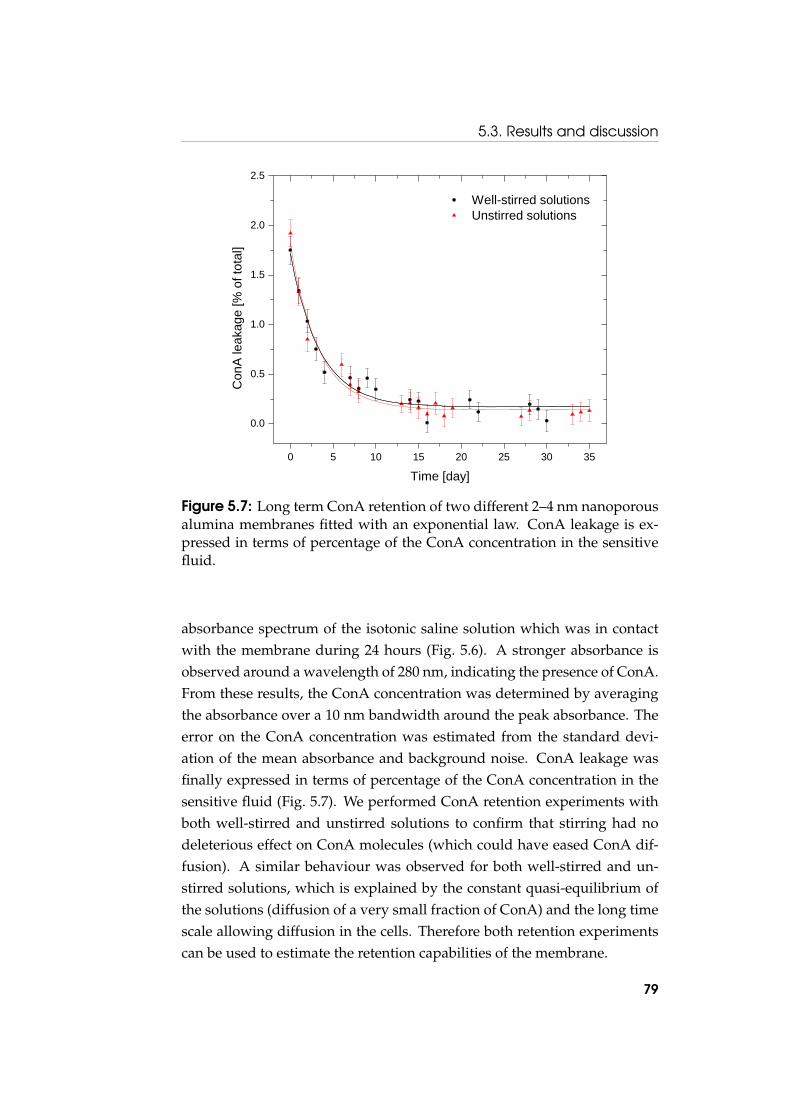
5.3. Results and discussion
0 5 10 15 20 25 30 35
0.0
0.5
1.0
1.5
2.0
2.5
Well-stirred solutions Unstirred solutions
Con
A le
akag
e [%
of t
otal
]
Time [day]
Figure 5.7: Long term ConA retention of two different 2–4 nm nanoporousalumina membranes fitted with an exponential law. ConA leakage is ex-pressed in terms of percentage of the ConA concentration in the sensitivefluid.
absorbance spectrum of the isotonic saline solution which was in contactwith the membrane during 24 hours (Fig. 5.6). A stronger absorbance isobserved around a wavelength of 280 nm, indicating the presence of ConA.From these results, the ConA concentration was determined by averagingthe absorbance over a 10 nm bandwidth around the peak absorbance. Theerror on the ConA concentration was estimated from the standard devi-ation of the mean absorbance and background noise. ConA leakage wasfinally expressed in terms of percentage of the ConA concentration in thesensitive fluid (Fig. 5.7). We performed ConA retention experiments withboth well-stirred and unstirred solutions to confirm that stirring had nodeleterious effect on ConA molecules (which could have eased ConA dif-fusion). A similar behaviour was observed for both well-stirred and un-stirred solutions, which is explained by the constant quasi-equilibrium ofthe solutions (diffusion of a very small fraction of ConA) and the long timescale allowing diffusion in the cells. Therefore both retention experimentscan be used to estimate the retention capabilities of the membrane.
79

Chapter 5. Long term performance study of the sensor
ConA fragments leakage
Figure 5.8: Initial sensitivity reduction of the sensor which may be due toConA fragments leakage.
The ConA retention experiments showed a higher initial ConA leak-age just after the beginning of the experiment. Then, after about 5–10 daysthe leakage stabilized at a lower level. In particular, ConA leakage waswell described by an exponential model reaching a constant value. Initialhigher leakage could be attributed to ConA fragments which are presentin commercial ConA [96]. These fragments do not form tetramer and havea molecular weight 2–3 times smaller than the unaltered subunit. Due totheir smaller size, ConA fragments could diffuse through the nanoporousmembrane. An initial viscosity decrease of the sensitive fluid, which maybe explained by leakage of ConA fragments, was also observed with thesensor. In fact, when the sensor was immersed for the first time in isotonicsaline solution, the phase shift at low glucose concentration decreased dur-ing several measurements before reaching a stable value (Fig. 5.8). How-ever, this should not affect the accuracy of the sensor and this process maybe considered as a purification of the sensitive fluid. ConA could also bepurified prior the preparation of the sensitive fluid if a better stability isrequired at the beginning of the measurement.
After that initial ConA leakage, a lower and stable value was observedwith a mean leakage per day of 0.14±0.07% of the initial concentration.As the measured ConA concentrations were small (±0.001% [w/w]) andclose to the resolution of the UV absorbance spectrometer, the error on thedetermination of ConA leakage was quite high. However, ConA leakage isin the same range for both experiments, thus validating the experimental
80

5.3. Results and discussion
procedure despite the limited accuracy.An almost complete retention was achieved by the membranes, which
has to be emphasized given that ConA is a small protein (3.3 nm in dimerconfiguration). This also explains the good sensor stability observed forshort-term measurements, as well as the reduction in sensitivity at largetime scales. According to similar dimensions between the ConA moleculesand the membrane pores size, we could have expected a complete reten-tion. Several hypotheses could account for this small constant ConA dif-fusion, like a pore size distribution not as narrow as expected or some de-fects in the membrane structure. Therefore, ConA molecules would dif-fuse through a small fraction of pores outside the main distribution. Thesmall leakage rate could also suggest that most of the ConA moleculesare well confined by the nanoporous membrane. At physiological pH, theConA tetramer configuration is highly prevailing whereas a small fractionof dimers remains. ConA tetramers would be confined by the membranewhereas dimers would freely diffuse in the isotonic saline solution. Witha constant fraction of dimers and tetramers (determined by the chemicalenvironment), the mechanism explaining constant ConA leakage would bea continuous dimer formation and diffusion.
Finally, the small constant diffusion also shows that the nanoporousmembranes are close to achieve a complete retention of the sensitive fluid,which is emphasized by the much slower diffusion of ConA fragmentsthan glucose out of the sensor (Fig. 5.8). The ConA fragments diffusionis slowed down by a reduced apparent porosity (small fraction of largerpores) and/or by interactions with the pores wall of the membrane (mean-ing that the pores are close to the confinement).
5.3.4 Pores size distribution
The nanoporous alumina membranes structure was investigated by scan-ning electron microscopy (SEM) (Fig. 5.9). These pictures confirm the highlyordered structure and well defined pores size that is expected for nano-porous alumina membranes. The 2–4 nm pores were close to the resolu-tion of the microscope and thus we were not able to get well focused pic-tures. We therefore investigated the pores size distribution on a similaralumina membrane with larger pores (13± 2 nm from Synkera Technolo-gies). The pores size distribution was experimentally determined using
81
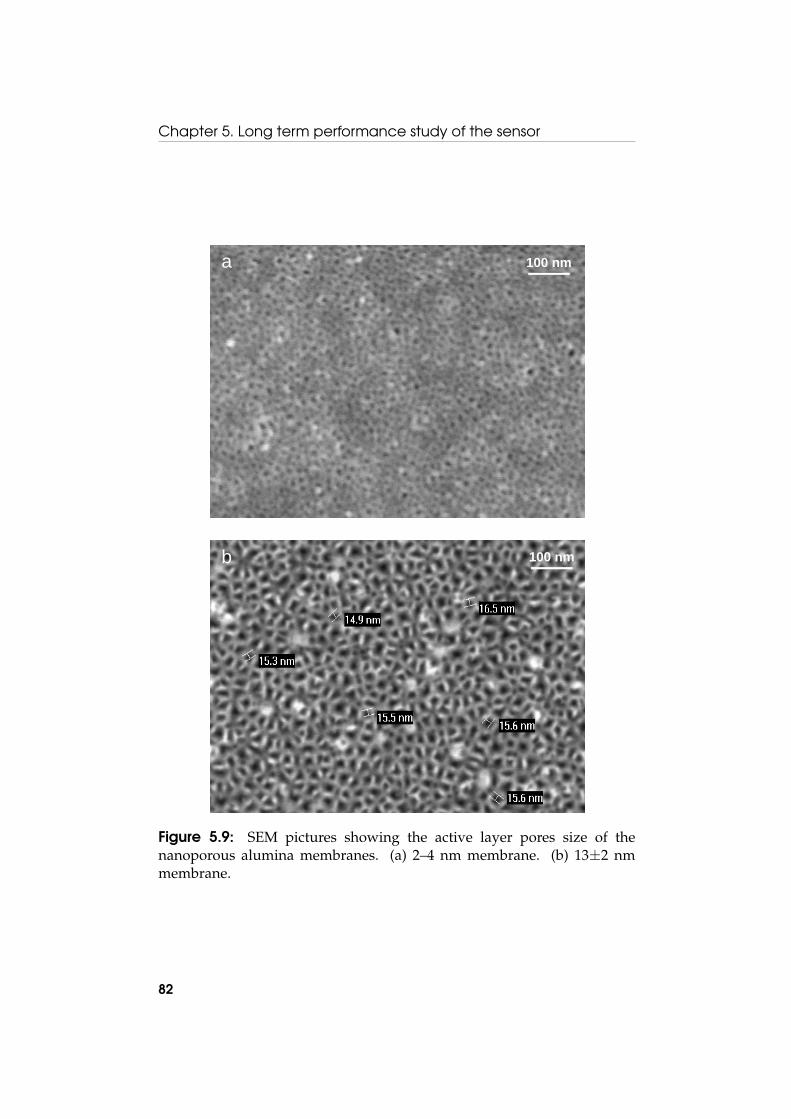
Chapter 5. Long term performance study of the sensor
100 nm
100 nm
b
a
Figure 5.9: SEM pictures showing the active layer pores size of thenanoporous alumina membranes. (a) 2–4 nm membrane. (b) 13±2 nmmembrane.
82

5.3. Results and discussion
0 5 10 15 20 25 300
2
4
6
8
10
12
14
16
Frac
tion
of p
ores
[%]
Pores diameter [nm]
Figure 5.10: Experimental characterization (SEM pictures) of the pores sizedistribution of the 13± 2 nm membrane fitted with a Gaussian.
particles analysis. An area encompassing 2583 pores was measured on 5SEM pictures (Fig. 5.10). The pores size distribution is well described by aGaussian with a mean pores diameter of 16.49 nm and a standard deviationof 4.93 nm, confirming a regular pores size distribution. The mean poros-ity is 28.9±0.7%, which can be compared to the 37% reported for Whatmanalumina membranes having a nominal pores size of 20 nm [23]. These mea-surements confirm that these alumina nanoporous membranes have a dis-tribution not as narrow as expected, and as a consequence, a small fractionof pores is outside the main distribution with dimensions as large as 30 nm.The pores size distribution is also probably larger than expected for the 2-4nm alumina membrane, which may explain the small ConA diffusion atlarge time scales.
5.3.5 Pores narrowing by atomic layer deposition
In numerous applications of nanofiltration in biotechnology and bioman-ufacturing, the precision and repeatability of the pores size of nanofiltra-tion membranes is of high importance. Membrane manufacturing com-
83

Chapter 5. Long term performance study of the sensor
0 20 40 60 80 100 120
0
10
20
30
40
50
No coating Thin Medium ThickG
luco
se c
once
ntra
tion
[mM
]
Time [min]
Figure 5.11: Glucose diffusion properties of 2–4 nm alumina nanoporousmembranes coated with various thicknesses of Al2O3 using atomic layerdeposition.
panies are therefore actively working on achieving precise pores size con-trol below 2 nm while retaining narrow pore size distribution. With suchmembranes characteristics, we could expect a much better long term sta-bility of the sensor in the future. For the moment, alternative solutionscould be considered, like pores size reduction by atomic layer deposition.This is a gas-based, surface-driven deposition technique that is uniquelysuited to coating ultrahigh aspect ratio structures such as nanopores in alu-mina membranes. Due to its characteristics, atomic layer deposition makesatomic scale deposition control possible, obtaining a resolution as fine as0.1 Å per cycle.
We investigated this technology by coating the 2–4 nm membrane withAl2O3 (coating performed by Synkera Technologies). The coated mem-branes (3 different thicknesses) were characterized by their glucose dif-fusion properties and compared to the non-modified 2–4 nm membrane(Fig. 5.11). The thinner coating did not change the diffusion characteristics,the medium coating increased the diffusion time by 50%, and the thickercoating almost blocked the glucose diffusion. Even if the coating thickness
84
5.4. Conclusion
fine tuning was experimental, and that several iterations were required toarrive at a moderate pores size reduction, atomic layer deposition was ef-fective in reducing the pores size. However, the major drawback of poresnarrowing is the reduction of the porosity, which would significantly in-crease the response time of the sensor. The medium coating, which is char-acterized by an increase in the diffusion time of 50%, should correspondto a pores size of ∼1.6–3.2 nm. The pores size coating could therefore ad-vantageously be used for small pores size adjustments but is more criticalwhen large reductions are required.
5.4 Conclusion
The long term stability of the sensor was investigated, showing a loss ofsensitivity of 1.3% per day during 25 days. As the nanoporous aluminamembrane is a key for the sensor stability, its diffusion and retention prop-erties were characterized in details. The very thin active layer of the mem-branes (0.5–1.5 µm) and quite high porosity (28.9%) gives remarkable diffu-sion properties, with only a 5-fold reduction compared to free diffusion inwater. We also report an almost complete retention of ConA and a good sta-bility in aqueous solution up to 35 days. However, a small ConA leakage re-mains, which could partly explain the reduction in sensitivity at large timescales. SEM pictures also confirm the highly ordered structure and welldefined pores size that is expected for nanoporous alumina membranes.Finally, atomic layer deposition was effective in pores size reduction, butthe porosity was strongly affected, which means that this technique canonly be used for small pores size reduction. Therefore, these results con-firm that nanoporous alumina membranes are well suited as size-selectiveinterface for this sensor. However, improvements in membrane technologywould be required for achieving a better long term stability.
85

Chapter 5. Long term performance study of the sensor
86
Chapter 6
Determination of glucose inbiological fluids
6.1 Introduction
The sensor is intended to be used in biological fluids such as blood orplasma, which are by far more complex than the physiological solutionin which the measurements were demonstrated. Blood plasma essentiallycontains dissolved proteins, glucose, clotting factors, mineral ions, hor-mones and carbon dioxide. The small biomolecules present in blood plasmacould diffuse into the sensor and potentially interfere with the measure-ment. In particular, small glycosylated biomolecules like peptides or lipidsmay compete with the binding of glucose to ConA. Moreover, the adhesionof biomolecules to surfaces could lead to biofouling of the semi-permeablemembrane, which may hinder the glucose diffusion. In addition, Mn2+
which is used to activate one of the binding sites of ConA, only appears astrace element in blood, which could affect the stability of ConA. Checkingthe adequacy of our sensor for measurements in biological fluids is there-fore not trivial.
In this chapter, the sensor performance in human blood serum andplasma is evaluated. The determination of glucose was first evaluated inserum, which has the advantage to contain no anticoagulant potentiallyinterfering with the measurement. We also assessed the sensor in bloodplasma containing two widely used anticoagulants, heparin and EDTA(ethylenediaminetetraacetic acid). Blood plasma is in fact more complete
87

Chapter 6. Determination of glucose in biological fluids
than serum, still containing fibrinogens and other clotting proteins, and istherefore closer to the blood. It was also useful to assess the potential inter-ferences with anticoagulants as an anticoagulant is added to the blood inhospital applications.
6.2 Experimental description
The sensor and experimental setup used for the measurements in humanblood serum and plasma were as described in section 4.3.4. The sensor wasfilled with a sensitive fluid containing 2.25% [w/w] of dextran and 0.45%[w/w] of ConA. The actuating voltage and frequency were respectively30 V and 2.5 Hz. Prior and after the measurement in serum and plasma, thesensor was exposed to the same glucose concentrations in isotonic salinesolution. These reference measurements were used to assess the sensitivityand stability of the sensor in serum and plasma.
The human serum and plasma were stored frozen at −20˚C. Before use,0.1% sodium azide (NaN3) was added as preservative, then the humanserum was filtered (Millex HV 0.45 µm syringe filter) to remove aggre-gates which may clog the semi-permeable membrane. The blood serumand plasma samples were not dialyzed to keep all the small biomoleculeswhich could potentially interfere with the measurement. The lower glu-cose concentration was therefore defined by the intrinsic concentration ofserum and plasma, which was measured using a standard glucose meter(Accu-Chek). The intrinsic glucose concentration was in the physiologicalrange (5 mM) and concentrated D-glucose (2 M) was added to increase theconcentration to a hyperglycaemic value (20 mM).
6.3 Results and discussion
6.3.1 Measurements in human serum and plasma
The sensor was tested in human serum with glucose concentrations of 5mM and 20 mM (Fig. 6.1). Nine changes of low and high glucose concen-trations were performed during 17 hours. A good degree of reversibilityand stability was observed, which is promising considering all possible is-sues arising in biological fluids. Moreover, the response time did not in-
88

6.3. Results and discussion
5 mM
20 mM
Figure 6.1: In vitro determination of glucose in human blood serum. Mea-surements carried out in original (5 mM) and glucose added (20 mM)serum at 25˚C.
5 mM
20 mM
Figure 6.2: In vitro determination of glucose in human blood plasma con-taining heparin as anticoagulant.
crease with time, indicating that biofouling due to protein adsorption onthe semi-permeable membrane, if any, was not an issue and that aluminananoporous membranes are well-suited for biosensors size-selective inter-face in biological fluids.
In plasma containing heparin, a quite good reversibility was also ob-served during 16 hours (Fig. 6.2). The loss of sensitivity in plasma (heparin)is comparable to the loss of sensitivity in serum, suggesting that heparindoes not interfere with the glucose determination. Heparin is a polysac-charide with multiple hydroxyl groups, which is characterized by a molec-ular weight ranging from 3 to 30 kDa. Therefore, heparin could diffuse
89

Chapter 6. Determination of glucose in biological fluids
5 mM
20 mM
Figure 6.3: In vitro determination of glucose in human blood plasma con-taining EDTA as anticoagulant.
through the nanoporous membrane and potentially interfere with ConA. Itwas shown that heparin binds boronic acid moieties, which are also char-acterized by a high specific affinity for glucose [97]. A loss of sensitivity of30% was reported in plasma containing heparin with a hydrogel-based glu-cose sensor. Fortunately, unlike boronic acid moieties, these results suggestthat heparin does not interfere with ConA.
A progressive and high loss of sensitivity was observed in plasma con-taining EDTA (Fig. 6.3). The demonstrator did not recover its initial sensi-tivity when subsequently immersed in isotonic saline solution, suggestingthat EDTA irreversibly altered the sensitive fluid. EDTA is known to bea strong chelating agent, sequestering metal ions such as Ca2+ and Fe3+.After being bound by EDTA, metal ions remain in solution but exhibit areduced reactivity. EDTA is therefore probably binding the two metal ions,Mn2+ and Ca2+, which are used to activate the glucose binding sites ofConA. As a result, the protein undergoes a conformational change whichstrongly decreases its affinity for glucose. EDTA is therefore not compatiblewith this ConA-based measurement. However, this does not matter much,given that EDTA is used for blood samples but never in the human body.However, if required, a sensitive fluid based on boronic acid moieties couldbe used, as it was shown to measure glucose in plasma containing EDTAwith a good sensitivity [97].
90
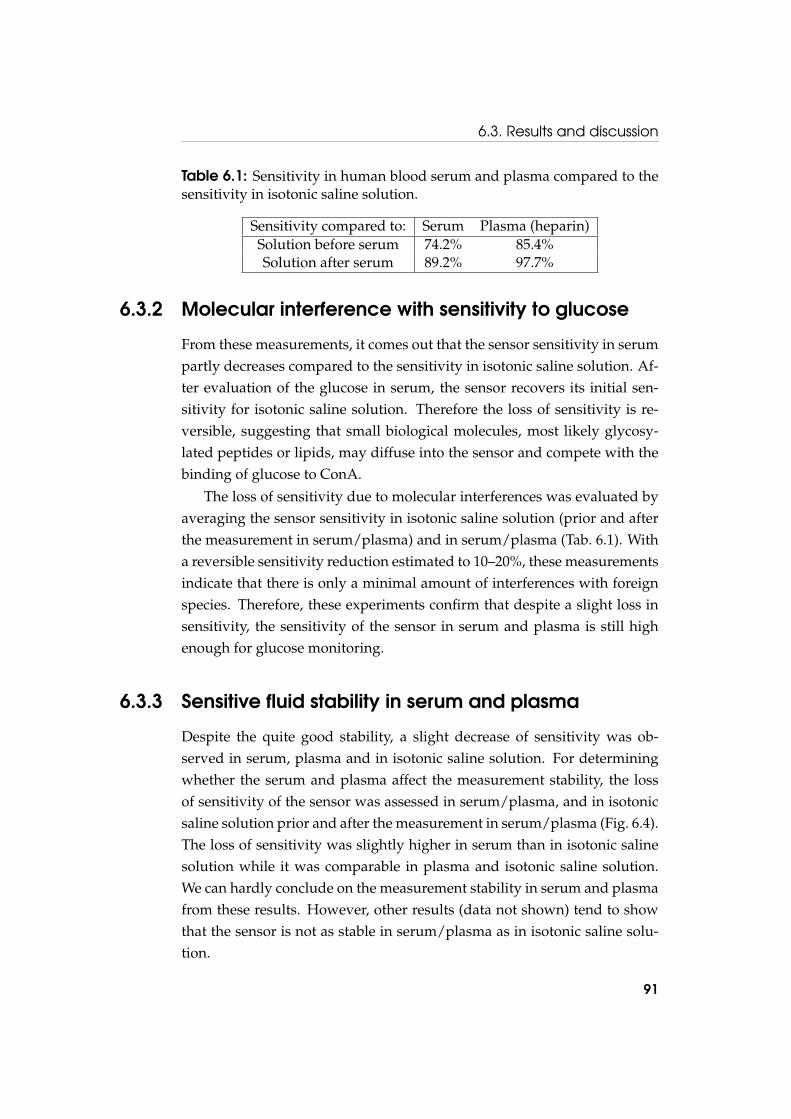
6.3. Results and discussion
Table 6.1: Sensitivity in human blood serum and plasma compared to thesensitivity in isotonic saline solution.
Sensitivity compared to: Serum Plasma (heparin)Solution before serum 74.2% 85.4%Solution after serum 89.2% 97.7%
6.3.2 Molecular interference with sensitivity to glucose
From these measurements, it comes out that the sensor sensitivity in serumpartly decreases compared to the sensitivity in isotonic saline solution. Af-ter evaluation of the glucose in serum, the sensor recovers its initial sen-sitivity for isotonic saline solution. Therefore the loss of sensitivity is re-versible, suggesting that small biological molecules, most likely glycosy-lated peptides or lipids, may diffuse into the sensor and compete with thebinding of glucose to ConA.
The loss of sensitivity due to molecular interferences was evaluated byaveraging the sensor sensitivity in isotonic saline solution (prior and afterthe measurement in serum/plasma) and in serum/plasma (Tab. 6.1). Witha reversible sensitivity reduction estimated to 10–20%, these measurementsindicate that there is only a minimal amount of interferences with foreignspecies. Therefore, these experiments confirm that despite a slight loss insensitivity, the sensitivity of the sensor in serum and plasma is still highenough for glucose monitoring.
6.3.3 Sensitive fluid stability in serum and plasma
Despite the quite good stability, a slight decrease of sensitivity was ob-served in serum, plasma and in isotonic saline solution. For determiningwhether the serum and plasma affect the measurement stability, the lossof sensitivity of the sensor was assessed in serum/plasma, and in isotonicsaline solution prior and after the measurement in serum/plasma (Fig. 6.4).The loss of sensitivity was slightly higher in serum than in isotonic salinesolution while it was comparable in plasma and isotonic saline solution.We can hardly conclude on the measurement stability in serum and plasmafrom these results. However, other results (data not shown) tend to showthat the sensor is not as stable in serum/plasma as in isotonic saline solu-tion.
91

Chapter 6. Determination of glucose in biological fluids
0 10 20 30 40
0
10
20
30
Before serum Human serum After serum
Loss
of s
ensi
tivity
[%]
Time [hour]
0 5 10 15 20
0
10
20
30
Before plasma Human plasma After plasma
Loss
of s
ensi
tivity
[%]
Time [hour]
a
b
(linear trendlines)
(linear trendlines)
Figure 6.4: Loss of sensitivity of the sensor in human blood serum (a) andplasma (b) compared to isotonic saline solution (prior and after the mea-surement in serum/plasma).
92

6.4. Conclusion
Given the complexity of the serum/plasma composition, the lower sta-bility in serum/plasma may have multiple origins. A hypothesis explain-ing this lower stability may be ConA deactivation. In isotonic saline solu-tion, the two metal ions used to activate the glucose binding sites of ConA(Ca2+ and Mn2+) are present, whereas in blood only Ca2+ appears in a sig-nificant concentration. Therefore, ConA stability in serum/plasma couldbe altered by the lack of Mn2+. This hypothesis could be confirmed bytesting the sensor in isotonic saline solution without Mn2+, or alternativelyby adding Mn2+ in serum/plasma. If this hypothesis proves to be correct,Ca2+ could be used for the two binding sites of ConA, which would havethe advantage to be closer to in vivo conditions, and may therefore improvethe sensor stability. Alternative hypotheses could include a favoured ConAleakage through the nanoporous membrane or a deleterious effect of smalldiffusing biomolecules on ConA. More testing would be required to fullycharacterize the stability of the sensitive fluid in biological fluids. However,although the stability seems lower in serum and plasma, it still remainsgood enough for short term monitoring.
6.4 Conclusion
The sensor was assessed in human blood serum and plasma, showing aquite good reversibility and stability. The response time did not increasewith time, indicating that biofouling of the nanoporous membrane, if any,was not an issue. We report a reversible sensitivity reduction of 10–20%which is attributed to molecular interferences, most likely small glycosy-lated biomolecules. The sensor stability is also not as good in serum andplasma as in isotonic saline solution, which may be explained by the lack ofMn2+ in blood which could favour ConA deactivation. However, the sen-sitivity and stability is still high enough for short term monitoring, whichis promising given the difficulty in measuring in biological fluids. The sen-sor is also compatible with heparin, which could be of high importancefor hospital applications. Potential improvements include using Ca2+ forthe two binding sites of ConA as Ca2+ is present in blood, and reducingthe pores size of the nanoporous membrane to prevent most of interferingbiomolecules from entering the sensor.
93

Chapter 6. Determination of glucose in biological fluids
94

Chapter 7
Conclusion
A viscosity-dependent affinity sensor for continuous monitoring of glu-cose in biological fluids was developed using Concanavalin A in dextran assensing fluid. A nanoporous alumina membrane was used as size-selectiveinterface and the viscosity was detected using a flow-resisting microchan-nel. An analytical model was derived, showing that the relaxation timeof the system is directly proportional to the liquid viscosity. The sensorwas extensively tested in isotonic saline solution for physiological bloodglucose concentrations between 2 and 20 mM, demonstrating an excellentreversibility and stability for up to 3 days. The quite low standard devia-tion of about 0.017 mM demonstrates the ability of this sensor for accurateglucose monitoring. Concerning its time response, we report a value of12.8 min at 37 ˚C, which is in line with the 10 min required for medicalapplications.
The long term stability of the sensor was further investigated for eval-uating its potential as an implantable glucose sensor. Despite the excellentshort term stability, a progressive loss of sensitivity of about 1.3% per daywas observed. Concanavalin A retention by the alumina nanoporous mem-brane was assessed by ultraviolet absorbance spectrometry. We measuredConcanavalin A leakage of about 0.2% per day, which at least partly ex-plains the long term sensitivity reduction of the sensor.
The sensor was finally evaluated in human blood serum and plasma,showing a good degree of reversibility and stability over 17 hours, mean-ing that the sensitive fluid remained chemically quite stable in presence ofplasma and that biofouling of the alumina membrane, if any, was not anissue. A reversible decrease in sensitivity of 10–20% was observed, sug-
95

Chapter 7. Conclusion
gesting that small biological molecules, most likely glycosylated peptidesor lipids, may diffuse into the sensor and compete with the binding of glu-cose to ConA. However, these experiments confirm that despite a slightloss in sensitivity, the sensitivity of the sensor in blood plasma is still highenough for glucose monitoring.
In conclusion, these results suggest that the combination of the ConA-based sensitive fluid and the microviscometer is a promising sensing prin-ciple for continuous glucose monitoring in blood. The overall performanceof the sensor still need to be improved, but technological solutions exit.Companies are actively working on nanofiltration membranes, which shou-ld increase the long term stability of the sensor by allowing a better reten-tion of the sensitive fluid. In addition, a higher molecular weight sensitivefluid like a boronic acid based polymeric mixture could also be consideredfor improving the sensor stability. Finally, future research should addressthe sensor miniaturization using microfabrication technologies. Furtherwork could also include extensive testing in human whole blood.
96

Bibliography
[1] D. M. Nathan. Long-term complications of diabetes mellitus. The NewEngland Journal of Medicine, 328:1676–1685, 1993.
[2] C. D. Saudek, R. L. Derr, and R. R. Kalyani. Assessing glycemia in dia-betes using self-monitoring blood glucose and hemoglobin A1c. Jour-nal of the American Medical Association, 295:1688–1697, 2006.
[3] A. Barraud. Molecular selective interface for an implantable glucose sen-sor based on the viscosity variation of a sensitive fluid containing dextranand concanavalin A. PhD thesis, Ecole Polytechnique Fédérale de Lau-sanne, 2009.
[4] G. Reach and G. S. Wilson. Can continuous glucose monitoring beused for the treatment of diabetes. Analytical Chemistry, 64(6):381–386,1992.
[5] D. C. Klonoff. Continuous glucose monitoring roadmap for 21st cen-tury diabetes therapy. Diabetes Care, 28(5):1231–1239, 2005.
[6] J. Wang. Electrochemical glucose biosensors. Chemical Reviews,108(2):814–825, 2008.
[7] A. Heller and B. Feldman. Electrochemical glucose sensors and theirapplications in diabetes management. Chemical Reviews, 108(7):2482–2505, 2008.
[8] S. J. Finney, C. Zekveld, A. Elia, and T. W. Evans. Glucose controland mortality in critically ill patients. Journal of the American MedicalAssociation, 290(15):2041–2047, 2003.
[9] G. Van den Bergue, P. Wouters, F. Weekers, C. Verwaest, F. Brun-yninckx, M. Schetz, D. Vlasselaers, P. Ferdinande, P. Lauwers, andR. Bouillon. Intensive insulin therapy in critically ill patients. TheNew England Journal of Medicine, 345(19):1359–1367, 2001.
97

Bibliography
[10] J. S. Krinsley. Association between hyperglycemia and increased hos-pital mortality in a heterogeneous population of critically ill patients.Mayo Clinic Proceedings, 78:1471–1478, 2003.
[11] J. S. Krinsley. Effect of an intensive glucose management protocol onthe mortality of critically ill adult patients. Mayo Clinic Proceedings,79(8):992–1000, 2004.
[12] P. A. Goldberg, M. D. Siegel, R. R. Russell, R. S. Sherwin, J. I. Halick-man, D. A. Cooper, J. D. Dziura, and S. E. Inzucchi. Experience withthe Continuous Glucose Monitoring System R© in a medical intensivecare unit. Diabetes Technology & Therapeutics, 6(3):339–347, 2004.
[13] H. G. Piper, J. L. Alexander, A. Shukla, F. Pigula, J. M. Costello, P. C.Laussen, T. Jaksic, and M. S. D. Agus. Real-time continuous glucosemonitoring in pediatric patients during and after cardiac surgery. Pe-diatrics, 118(3):1176–1184, 2006.
[14] U. Holzinger, J. Warszawska, R. Kitzberg, M. Wewalka, W. Miehsler,H. Herkner, and C. Mald. Real-time continuous glucose monitoringin critically ill patients a prospective randomized trial. Diabetes Care,33(3):467–472, 2010.
[15] A. M. Corstjens, J. J. M. Ligtenberg, I. C. C. Van der Horst, R. Spanjers-berg, J. S. W. Lind, J. E. Tulleken, J. H. J. M. Meertens, and J. G. Zijlstra.Accuracy and feasibility of point-of-care and continuous blood glu-cose analysis in critically ill ICU patients. Critical Care, 10(5):135–142,2006.
[16] S. Kanji, J. Buffie, B. Hutton, P. Bunting, A. Singh, K. McDonald, D. Fer-gusson, L. McIntyre, and P. Hebert. Reliability of point-of-care testingfor glucose measurement in critically ill adults. Critical Care Medicine,33(12):2778–2785, 2005.
[17] D. Vlasselaers, L. Schaupp, I. Van den Heuvel, J. Mader, M. Bodenlenz,M. Suppan, P. Wouters, M. Ellmerer, and G. Van den Berghe. Monitor-ing blood glucose with microdialysis of interstitial fluid in critically illchildren. Clinical Chemistry, 53:536–537, 2007.
98

Bibliography
[18] J. S. Schultz, S. Mansouri, and I. J. Goldstein. Affinity sensor: a newtechnique for developing implantable sensors for glucose and othermetabolites. Diabetes Care, 5(3):245–253, 1982.
[19] R. Ballerstadt and R. Ehwald. Suitability of aqueous dispersions ofdextran and concanavalin A for glucose sensing in different variantsof the affinity sensor. Biosensors and Bioelectronics, 9(8):557–567, 1994.
[20] R. Ballerstadt, A. Polak, A. Beuhler, and J. Frye. In vitro long-termperformance study of a near-infrared fluorescence affinity sensor forglucose monitoring. Biosensors and Bioelectronics, 19(8):905–914, 2004.
[21] R. Ballerstadt and J. S. Schultz. A fluorescence affinity hollow fibersensor for continuous transdermal glucose monitoring. AnalyticalChemistry, 72(17):4185–4192, 2000.
[22] S. Mansouri and J. S. Schultz. A miniature optical glucose sensor basedon affinity binding. Nature biotechnology, 2:885–890, 1984.
[23] R. J. Russell and M. V. Pishko. A fluorescence-based glucose biosen-sor using concanavalin A and dextran encapsulated in a poly(ethyleneglycol) hydrogel. Analytical Chemistry, 71(15):3126–3132, 1999.
[24] T. D. James, K. R. A. S. Sandanayake, and S. Shinkai. Saccharidesensing with molecular receptors based on boronic acid. AngewandteChemie International Edition in English, 35:1910–1922, 1996.
[25] H. Fang, G. Kaur, and B. Wang. Progress in boronic acid-based fluo-rescent glucose sensors. Journal of Fluorescence, 14(5):481–489, 2004.
[26] S. Li, E. N. Davis, J. Anderson, Q. Lin, and Q. Wang. Development ofboronic acid grafted random copolymer sensing fluid for continuousglucose monitoring. Biomacromolecules, 10(1):113–118, 2009.
[27] X. Huang, S. Li, J. S. Schultz, Q. Wang, and Q. Lin. A MEMS affin-ity glucose sensor using a biocompatible glucose-responsive polymer.Sensors and Actuators B: Chemical, 140(2):603–609, 2009.
[28] Y. Zhao, S. Li, A. Davidson, B. Yang, Q. Wang, and Q. Lin. A MEMSviscometric sensor for continuous glucose monitoring. Journal of Mi-cromechanics and Microengineering, 17:2528–2537, 2007.
99

Bibliography
[29] U. Beyer, D. Schafer, A. Thomas, H. Aulich, U. Haueter, B. Reihl, andR. Ehwald. Recording of subcutaneous glucose dynamics by visco-metric affinity sensor. Diabetologia, 44:416–423, 2001.
[30] P. Diem, L. Kalt, U. Haueter, L. Krinelke, R. Fajfr, B. Reihl, andU. Beyer. Clinical performance of a continuous viscometric affinitysensor for glucose. Diabetes Technology & Therapeutics, 6(6):790–799,2004.
[31] K. O. Kyvik, J. Traulsen, B. Reinholdt, and A. Frøland. The exactechblood glucose testing system. Diabetes Research and Clinical Practice,10(1):85–90, 1990.
[32] A. E. G. Cass, G. Davis, G. D. Francis, H. A. O. Hill, W. J. Aston, I. J.Higgins, E. V. Plotkin, D. L. Scott, and A. P. F. Turner. Ferrocene-mediated enzyme electrode for amperometric determination of glu-cose. Analytical Chemistry, 56(4):667–671, 1984.
[33] J. D. Newman and A. P. F. Turner. Home blood glucose biosensors:a commercial perspective. Biosensors and Bioelectronics, 20(12):2435–2453, 2005.
[34] Symposium on potentially implantable glucose sensors. Diabetes Care,5:147–283, 1982.
[35] J. Mastrototaro. The Minimed continuous glucose monitoring sys-tem (CGMS). Journal of Pediatric Endocrinology & Metabolism, 12(Suppl3):751–758, 1999.
[36] J. Mastrototaro. The Minimed continuous glucose monitoring system.Diabetes Technology & Therapeutics, 2(Suppl 1):S13–S18, 2000.
[37] J. S. Skyler. Continuous glucose monitoring: an overview of its devel-opment. Diabetes Technology & Therapeutics, 11(Suppl 1):S5–S10, 2009.
[38] K. J. Wientjes, P. Vonk, Y. Vonk-van Klei, A. J. M. Schoonen, and N. W.Kossen. Microdialysis of glucose in subcutaneous adipose tissue upto 3 weeks in healthy volunteers. Diabetes Care, 21(9):1481–1488, 1998.
[39] A. Maran, C. Crepaldi, A. Tiengo, G. Grassi, E. Vitali, G. Pagano,S. Bistoni, G. Calabrese, F. Santeusanio, F. Leonetti, M. Ribaudo,
100

Bibliography
U. Di Mario, G. Annuzzi, S. Genovese, G. Riccardi, M. Previti, D. Cu-cinotta, F. Giorgino, A. Bellomo, R. Giorgino, A. Poscia, and M. Varalli.Continuous subcutaneous glucose monitoring in diabetic patients. Di-abetes Care, 25(2):347–352, 2002.
[40] T. Kubiak, B. Wörle, B. Kuhr, I. Nied, G. Gläsner, N. Hermanns,B. Kulzer, and T. Haak. Microdialysis-based 48-hour continuous glu-cose monitoring with glucoDay: Clinical performance and patients’acceptance. Diabetes Technology & Therapeutics, 8(5):570–575, 2006.
[41] A. Poscia, M. Mascini, D. Moscone, M. Luzzana, G. Caramenti, P. Cre-monesi, F. Valgimigli, C. Bongiovanni, and M. Varalli. A microdialysistechnique for continuous subcutaneous glucose monitoring in diabeticpatients (part 1). Biosensors and Bioelectronics, 18(7):891–898, 2003.
[42] M. Varalli, G. Marelli, A. Maran, S. Bistoni, M. Luzzana, P. Cremonesi,G. Caramenti, F. Valgimigli, and A. Poscia. A microdialysis techniquefor continuous subcutaneous glucose monitoring in diabetic patients(part 2). Biosensors and Bioelectronics, 18(7):899–905, 2003.
[43] J. A. Tamada, N. J. V. Bohannon, and R. O. Potts. Measurement ofglucose in diabetic subjects using noninvasive transdermal extraction.Nature Medicine, 1:1198–1201, 1995.
[44] M. J. Tierney, Y. J. Jayalakshmi, N. A. Parris, M. P. Reidy, C. Uhegbu,and P. Vijayakumar. Design of a biosensor for continual, transdermalglucose monitoring. Clinical Chemistry, 45:1681–1683, 1999.
[45] S. K. Garg, R. O. Potts, N. R. Ackerman, S. J. Fermi, J. A. Tamada, andH. P. Chase. Correlation of fingerstick blood glucose measurementswith GlucoWatch biographer glucose results in young subjects withtype 1 diabetes. Diabetes Care, 22(10):1708–1714, 1999.
[46] H. P. Chase, R. Beck, W. Tamborlane, B. Buckingham, N. Mauras,E. Tsalikian, T. Wysocki, S. Weinzimer, C. Kollman, K. Ruedy, andD. Xing. A randomized multicenter trial comparing the glucowatchbiographer with standard glucose monitoring in children with type 1diabetes. Diabetes Care, 28(5):1101–1106, 2005.
101

Bibliography
[47] A. Caduff, E. Hirt, Y. Feldman, Z. Ali, and L. Heinemann. First humanexperiments with a novel non-invasive, non-optical continuous glu-cose monitoring system. Biosensors and Bioelectronics, 19(3):209–217,2003.
[48] A. Pfützner, A. Caduff, M. Larbig, T. Schrepfer, and T. Forst. Impactof posture and fixation technique on impedance spectroscopy used forcontinuous and noninvasive glucose monitoring. Diabetes Technology& Therapeutics, 6(4):435–441, 2004.
[49] I. M. E. Wenthold, J. B. Hoekstra, A. Zwart, and J. H. DeVries. Pen-dra goes dutch: lessons for the CE mark in Europe. Diabetologia,48(6):1055–1058, 2005.
[50] G. McGarraugh. The chemistry of commercial continuous glucosemonitors. Diabetes Technology & Therapeutics, 11:S17–S24, 2009.
[51] C. M. Girardin, C. Hulot, M. Gonthier, and D. Delvin. Continuousglucose monitoring: A review of biochemical perspectives and clinicaluse in type 1 diabetes. Clinical Biochemistry, 42(3):136–142, 2009.
[52] J. Brauker. Continuous glucose sensing: Future technology develop-ments. Diabetes Technology & Therapeutics, 11(Suppl 1):S25–S36, 2009.
[53] J. Mastrototaro, J. Shin, A. Marcus, and G. Sulur. The accuracy andefficacy of real-time continuous glucose monitoring sensor in patientswith type 1 diabetes. Diabetes Technology & Therapeutics, 10(5):385–390,2008.
[54] I. J. Goldstein, C. E. Hollerman, and E. E. Smith. Protein-carbohydrateinteraction. II. Inhibition studies on the interaction of concanavalin Awith polysaccharides. Biochemistry, 4(5):876–883, 1965.
[55] D. Meadows and J. S. Schultz. Fiber-optic biosensors based on fluo-rescence energy transfer. Talanta, 35(2):145–150, 1988.
[56] D. L. Meadows and J. S. Schultz. Design, manufacture and character-ization of an optical fiber glucose affinity sensor based on an homo-geneous fluorescence energy transfer assay system. Analytica ChimicaActa, 280(1):21–30, 1993.
102

Bibliography
[57] R. Ballerstadt and J. S. Schultz. Competitive-binding assay methodbased on fluorescence quenching of ligands held in close proximity bya multivalent receptor. Analytica Chimica Acta, 345:203–212, 1997.
[58] G. H. McKenzie, W. H. Sawyer, and L. W. Nichol. The molecularweight and stability of concanavalin A. Biochimica et Biophysica Acta(BBA) - Protein Structure, 263(2):283–293, 1972.
[59] R. Ballerstadt, A. Gowda, and R. McNichols. Fluorescence resonanceenergy transfer-based near-infrared fluorescence sensor for glucosemonitoring. Diabetes Technology & Therapeutics, 6(2):191–200, 2004.
[60] R. Ballerstadt, C. Evans, A. Gowda, and R. McNichols. In vivo per-formance evaluation of a transdermal near-infrared fluorescence reso-nance energy transfer affinity sensor for continuous glucose monitor-ing. Diabetes Technology & Therapeutics, 8(3):296–311, 2006.
[61] R. Ehwald, R. Ballerstadt, and H. Dautzenberg. Viscometric affinityassay. Analytical biochemistry, 234:1–8, 1996.
[62] U. Beyer, Ehwald R., and L.-G. Fleischer. Post-stress thickening ofdextran/concanavalin A solutions used as sensitive fluids in a viscosi-metric affinity assay for glucose. Biotechnology Progress, 13(6):722–726,1997.
[63] X. Huang, S. Li, J. Schultz, Q. Wang, and Q. Lin. A capacitive MEMSviscometric sensor for affinity detection of glucose. Journal of Micro-electromechanical Systems, 18(6):1246–1254, 2009.
[64] S. Kuenzi, E. Meurville, E. Grandjean, S. Straessler, and P. Ryser. Con-tactless rotational concentric microviscometer. Sensors and Actuators A:Physical, 167(2):194–203, 2011.
[65] S. Kuenzi. Implantable glucose sensor: an approach based on a rotating mi-croviscometer combined with a sensitive liquid containing dextran and con-canavalin A. PhD thesis, Ecole Polytechnique Fédérale de Lausanne,2007.
[66] S. Kuenzi, E. Meurville, and P. Ryser. Automated characterization ofdextran/concanavalin A mixtures–a study of sensitivity and temper-
103
Bibliography
ature dependence at low viscosity as basis for an implantable glucosesensor. Sensors and Actuators B: Chemical, 146(1):1–7, 2010.
[67] G. M. Edelman, B. A. Cunningham, G. N. Reeke, J. W. Becker, M. J.Waxdal, and J. L. Wang. The covalent and three-dimensional structureof concanavalin A. Proceedings of the National Academy of Sciences of theUnited States of America, 69(9):2580–2584, 1972.
[68] D. F. Senear and D. C. Teller. Effects of saccharide and salt bind-ing on dimer-tetramer equilibrium of concanavalin A. Biochemistry,20(11):3083–309, 1981.
[69] M. Huet. Factors affecting the molecular structure and the aggluti-nating ability of concanavalin A and other lectins. European Journal ofBiochemistry, 59(2):627–632, 1975.
[70] G. M. Bradbrook, T. Gleichmann, S. J. Harrop, J. Habash, J. Raftery,J. Kalb, J. Yariv, I. H. Hillier, and J. R. Helliwell. X-ray and moleculardynamics studies of concanavalin A glucoside and mannoside com-plexes. relating structure to thermodynamics of binding. Journal of theChemical Society, Faraday Transactions, 94(11):1603–1611, 1998.
[71] G. N. Reeke, J. W. Becker, and G. M. Edelman. The covalent and three-dimensional structure of concanavalin A. IV. Atomic coordinates, hy-drogen bonding, and quaternary structure. Journal of Biological Chem-istry, 250(4):1525–1547, 1975.
[72] S. H. Koenig, C. F. Brewer, and R. D. Brown. Conformation asthe determinant of saccharide binding in concanavalin A: Ca2+–concanavalin A complexes. Biochemistry, 17(20):4251–4260, 1978.
[73] C. E. Richardson and W. D. Behnke. Physical-chemical studies onrole of metal-ions in concanavalin A. Journal of Molecular Biology,102(3):441–451, 1976.
[74] R. D. Brown, C. F. Brewer, and S. H. Koenig. Conformation statesof concanavalin A: Kinetics of transitions induced by interaction withMn2+ and Ca2+ ions. Biochemistry, 16(17):3883–3896, 1977.
104

Bibliography
[75] J. Andersson, G. M. Edelman, G. Möller, and O. Sjöberg. Activationof B lymphocytes by locally concentrated concanavalin A. EuropeanJournal of Immunology, 2(3):233–235, 1972.
[76] G. R. Gunther, J. L. Wang, I. Yahara, B. A. Cunningham, and G. M.Edelman. Concanavalin A derivatives with altered biological activi-ties. Proceedings of the National Academy of Sciences of the United States ofAmerica, 70(4):1012–1016, 1973.
[77] M. Leist and A. Wende. A novel mechanism of murine hepatocytedeath inducible by concanavalin A. Journal of Hepatology, 25:948–959,1996.
[78] R. Ballerstadt, C. Evans, R. McNichols, and A. Gowda. ConcanavalinA for in vivo glucose sensing: A biotoxicity review. Biosensors andBioelectronics, 22(2):275–284, 2006.
[79] N. S. Pujar and A. L. Zydney. Electrostatic and electrokinetic interac-tions during protein-transport through narrow pore membranes. In-dustrial & Engineering Chemistry Research, 33(10):2473–2482, 1994.
[80] M. Deshpande and L. Saggere. An analytical model and workingequations for static deflections of a circular multi-layered diaphragm-type piezoelectric actuator. Sensors and Actuators A: Physical,136(2):673–689, 2007.
[81] S. Uchida. The pulsating viscous flow superposed on the steady lam-inar motion of incompressible fluid in a circular pipe. Zeitschrift fürAngewandte Mathematik und Physik, 7(5):403–422, 1956.
[82] C. Barnes. Diffusion through a membrane. Journal of General and Ap-plied Physics, 5(1):4–8, 1934.
[83] J. Robinson and R. H. Stokes. Electrolyte Solution. Butterworths, 2ndedition, 1959.
[84] R. Collander. Über die durchlässigkeit der kupferferrozyanidnieder-schlagmembran für nichtelektrolyte. Kolloid-Beihelfe, 19:72–106, 1924.
[85] E. Manegold. Die dialyse durch kollodiummembranen und derzusammenhang zwischen dialyse, diffusion und membranstruktur.Kolloid Zeitschrift, 49:372–395, 1929.
105
Bibliography
[86] J. R. Pappenheimer. Passage of molecules through capillary walls.Physiological Reviews, 33:387–423, 1953.
[87] E. L. Cussler. Diffusion. Mass Transfer in Fluid Systems. CambridgeUniversity Press, 3rd edition, 2007.
[88] P. Muralt. PZT thin films for microsensors and actuators: Where dowe stand? IEEE Transactions on Ultrasonics Ferroelectrics and FrequencyControl, 47(4):903–915, 2000.
[89] E. Hong, S. Trolier-McKinstry, R. L. Smith, S. V. Krishnaswamy, andC. B. Freidhoff. Design of MEMS PZT circular diaphragm actuatorsto generate large deflections. Journal of Microelectromechanical Systems,15(4):832–839, 2006.
[90] G. A. Brunner, M. Ellmerer, G. Sendlhofer, A. Wutte, Z. Trajanoski,L. Schaupp, F. Quehenberger, P. Wach, G. J. Krejs, and T. R. Pieber.Validation of home blood glucose meters with respect to clinical andanalytical approaches. Diabetes Care, 21(4):585–590, 1998.
[91] J. J. Kim and K. Park. Glucose-binding property of pegylated con-canavalin A. Pharmaceutical Research, 18(6):794–799, 2001.
[92] H. Uehara, M. Kakiage, M. Sekiya, D. Sakuma, T. Yamonobe,N. Takano, A. Barraud, E. Meurville, and Ryser P. Size-selective diffu-sion in nanoporous but flexible membranes for glucose sensors. ACSNano, 3(4):924–932, 2009.
[93] J. R. Pappenheimer, E. M. Renkin, and L. M. Borrero. Filtration, diffu-sion and molecular sieving through peripheral capillary membranes;a contribution to the pore theory of capillary permeability. AmericanJournal of Physiology, 167:13–46, 1951.
[94] A. Bouchoux, H. Roux-de Balmann, and F. Lutin. Nanofiltration ofglucose and sodium lactate solutions: Variations of retention betweensingle- and mixed-solute solutions. Journal of Membrane Science, 258(1–2):123–132, 2005.
[95] L. Leoni, A. Boiarski, and T. A. Desai. Characterization of nanoporousmembranes for immunoisolation: Diffusion properties and tissue ef-fects. Biomedical Microdevices, 4(2):131–139, 2002.
106

Bibliography
[96] J. L. Wang, B. A. Cunningham, and G. M. Edelman. Unusual frag-ments in the subunit structure of concanavalin A. Proceedings of theNational Academy of Sciences of the United States of America, 68(6):1130–1134, 1971.
[97] S. Tierney, B. Falch, D. Hjelme, and B. Stokke. Determination of glu-cose levels using a functionalized hydrogel optical fiber biosensor:Toward continuous monitoring of blood glucose in vivo. AnalyticalChemistry, 81(9):3630–3636, 2009.
107

Curriculum Vitae
108

Curriculum Vitae
Christophe BossLes Chênes 171029 Villars-Ste-Croix+41 78 738 50 [email protected]
27 years oldSwiss citizenSingle
EDUCATION
2007–2012 PhD in MicroengineeringEcole Polytechnique Fédérale de LausanneField of Biomedical Engineering
Development of a viscosity-dependent affinity sensor forcontinuous monitoring of glucose in biological fluids
2002–2007 Master in PhysicsEcole Polytechnique Fédérale de LausanneOrientation in Biophysics
PROFESSIONAL EXPERIENCES
2007–2012 Research AssistantLaboratory of Microengineering for Manufacturing (EPFL)
Publication of 4 scientific articles as main author
Presentation of the research work at various internationalconferencesDirection of student projects on Master level
109

Curriculum Vitae
2010–2012 Industrial collaboration with Baxter Healthcare
Project of the Swiss Commission for Technology and Inno-vation (CTI) involving Baxter, the Univertiy Hospital of Lau-sanne (CHUV) and EPFLDevelopment of calcium, glucose and pH sensors for patientmonitoring in the intensive care units of hospitals (patentedtechnology)
RESEARCH PROJECT
2006–2007 Master thesis in Biomechanics – Laboratory of Hemody-namics and Cardiovascular Technology (EPFL)Histology, imaging, mechanical tests and simulation of thearterial wall
Work published in Journal of Biorheology
CONTINUING EDUCATION
2008–2009 Management of Technology and Innovation, EPFL Tech-nology Transfer Office
2008–2009 Accounting and Finance, EPFL Career Center
LANGUAGES
French Mother tongue
English Fluent
German High school level
COMPUTER SKILLS
Office (MS Office), Data analysis (Origin), Computation (Mathematica,MATLAB), Design (SolidWorks), Instrumentation (LabVIEW)
INTERESTS AND ACTIVITIES
Medical technologies and biotechnologies (Member of the Swiss Soci-ety for Biomedical Engineering)My hobbies are tennis, volleyball, skiing, and running
110

Curriculum Vitae
PUBLICATIONS
Peer-reviewed journals
C. Boss, E. Meurville, J. M. Sallese, and P. Ryser. Size-selective diffusionin nanoporous alumina membranes for a glucose affinity sensor, Journalof Membrane Science, doi:10.1016/j.memsci.2012.02.004, 2012.
C. Boss, E. Meurville, J. M. Sallese, and P. Ryser. A viscosity-dependentaffinity sensor for continuous monitoring of glucose in biological fluids.Biosensors and Bioelectronics, 30(1):223–228, 2011.
S. Roy, C. Boss, R. Rezakhaniha, and N. Stergiopulos. Experimental char-acterization of the distribution of collagen fiber recruitment. Journal ofBiorheology, 24(2):84–93, 2010.
Conference proceedings
C. Boss, E. Meurville, P. Ryser, F. Schmitt, L. Juillerat-Jeanneret, P. Dosil-Rosende, and D. De Souza. Multi-analyte detection for biological flu-ids: Towards continuous monitoring of glucose, ionized calcium and pHusing a viscometric affinity biosensor. In Proceedings of the InternationalConference on Biomedical Electronics and Devices, pages 295–298, SciTePress,2011.
C. Boss, E. Meurville, J. M. Sallese, and P. Ryser. Novel chemico-mechanical approach towards long-term implantable glucose sensing. InProceedings of the Eurosensors XXIII conference, Procedia Chemistry, 1(1):313–316, 2009.
111