a trident scholar - defense technical … trident scholar project report ad-a257 115 no. 197...
TRANSCRIPT

A TRIDENT SCHOLAR
PROJECT REPORT
AD-A257 115 NO. 197
"THE INFLUENCE OF HEAT TREATMENT ON THE PERFORMANCE
OF HIGHLY CORROSION RESISTANT ALUMINUM ALLOYS"
DTICS ELECTE
S~AC12Vlg1997. IIfl
UNITED STATES NAVAL ACADEMY
ANNAPOLIS, MARYLAND
92-=.29338lf./3

U.S.N.A. - Trident Scholar project report; no. 197 (1992)
"THE INFLUENCE OF HEAT TREATMENT ON THE PERFORMANCEOF HIGHLY CORROSION RESISTANT ALUMINUM ALLOYS"
A Trident Scholar Project Report
by
Midshipman Frederick G. Schenk, Class of 1992
U.S. Naval Academy
Annapolis, Maryland
12CQtlr
Accesion For
Adviser: Assoc./)fof. Patrick J. Moran NTIS CRA&tDepartment of Mechanical Engineering DTIC TAB LI
U'iannouiced r-
J •s tificaiionJ:15 ific tio ........................
By ....... ............... .....
Dist;bjAtion I
Accepted for Trident Scholar Committee Av.i. a• !orDist
Chair
Date
USNA-1531-2

REPORT DOCUMENTATION PAGE o, ,2 .o ;,*~b.b reportin b-den qoiIt, ghAcoietfion of ifl-alieoo to r4i1m4ie Iv.' ftp " o r' .rOnt n.d hq c n11-1 C~c . n.,,t 1 ~ ,,n - - r...ig Cý9A Ulfiin andmi-nfJ - fthe data necdrd. and comott-n ..d I 1011e<1-n of . tio,, , .rec -- , "-dinq 1hh *ny ite, om" . 0- &,Wc tta.i~i of ,if -,Ioi. .ndie-q %v~9gntiL.O,, to, ,,'duang thatc bu,iden to *..ii'qln "edqvanem. Se~i~c-- 07in t-ci ,in or aniircn O trttonl and R ,oc 2'a&-cNi~gh- 8.11,Scf 1204. Alhiiqftri. VA 22202.Ad102. M. to th~e Otic~e of M i,*qenMn-X And Biadge- P.Oei-..oi ciion ien(0 104-OiB6
8) Wc.f,iin,q , OC 2a o 3g
1. AGENCY USE ONLY (Leave blank) 2. REPORT OATE 3. REPOR. TYPt AND DATES COVERED8 May 1992 Final 1991/92
4. TITLE AND SUBTITLE S. FUNDING NUMBERS
THE INFLUENCE OF HEAT TREATMENT ON THE PERORMANCE OF HIGHLYCORROSION RESISTANT ALUMINUM ALLOYS
6. AUTHOR(S)
Schenk, Frederick G.
7. PERFORMING ORGANIZATION NAME(S) AND AOORESS(ES) 8. PERFORMING ORGANIZATIONREPORT NUMBER
U.S.Naval Academy, Annapolis, Md. U.S.N.A. - TSPR;
197 (1992)
S. SPONSORING /MONITORING AGENCY NAME(S) AND ADDRESS(ES) 10. SPONSORING / MONITORINGAGENCY REPORT NUMBER
11. SUPPLEMENTARY NOTES
Accepted by the U.S.Trident Scholar Committee
12a. DISTRIBUTION IAVAILABIUTY STATEMENT 12b. DISTRIBUTION CODE
This document has been approved for public release; itsdistribution is UNLIMITED.
13. ABSTRACT (Maximum 200 wor&)New "stainless aluminum" alloys must be produced using expensive processing methodssuch as co-sputter deposition and ion implantation. To determine the influence oftemperature on the sputter deposited alloys heat treatments were conducted. Theseheat treatments caused pitting potential to decrease from the "as processed" values,but did not cause a total loss of corrosion properties relative to pure aluminum.Constant potential tests beglow the determine. pitting potential were conducted on bothheat treated and "as processed" sputter deposited alloys in an attempt to confirm theheat treatment data. Anodic currents were observed for both conditions. Some mechanicEfailure has been nioted with these thin film alloys, which could result in crevicecorrosion, possibly causing the anodic currents detected. This contradictory resultrequires further investigation.
I4. SUBJECT TERMS 15. NUMBER OF PAGESaluminum alloys - corrosion; aluminum alloys - heat treatment; .1c'6rrosion resistant materials; sea-water corrnsion 16. PR•CE CODE
17. SECURITY CLASSIFICATION 18. SECURITY CLASSIFICATION 19. SECURITY CLASSIFICATION 20. UMITATION OF ABSTRACOF REPORT OF THIS PAGE OF ABSTRACTUNCLASSIFIED i UNCLASSIFIED UNCLASSIFIED
-NSN 7540-01-280-5500 Standard Form 298 (Rev. 2-89)I Id t" I II NI Sd L39-14
1,7ii.
ABSTRACT
Aluminum and conventional aluminum alloys are used
extensively throughout the Navy. Their application ranges
from lightweight aircraft components to the superstructures
on various ships. Though these alloys have good mechanical
propertieb, they do not exhibit excellent resistance to
corrosion in the marine environment. In an effort to
alleviate these problems, transition metals, used to make
stainless steels, have been alloyed with aluminum. These
new "Stainless Aluminum" alloys cannot be produced by
conventional alloying techniques because the alloying
elements utilized have very low solubility limits in
aluminum. Expensive processing methods such as co-sputter
deposition and ion implantation must be used to produce
alloys that exist in a supersaturated solid solution (the
alloying element exceeding the solubility limit). Co-
sputter deposition was used in this project to produce Al-
8.5wt% Ta and Al-llwt% W thin film alloys. Potentiodynamic
polarization ixperiments were done on the "as processed"
alloys to determine their pitting potential. Large
improvements relative to pure aluminum were achieved.
With the alloying element exceeding the solubility
limit, these materials existed in a nonequilibrium state.
Since the alloys would prefer to be in a two phase material,
their behavior when exposed to elevated temperature is of
interest. To determine the influence of temperature on the

2
sputter deposited alloys heat treatments at 2000, 3000, and
4000 C for 30, 60, 180, 360, and 720 minutes were conducted.
These heat treatments caused the pitting potential to
decrease from the "as processed" values, but did not cause a
total loss of corrosion properties relative to pure
aluminum. Scanning electron microscopy showed that the heat
treatment resulted in the formation of second phase
precipitates. It was determined that pitting attack
occurred at precipitates, but not all precipitate sites
experienced attack.
Bulk material produced through the rapid solidification
process, spray forming, was evaluated. For both materials,
Al-l.0 wt% Ta and Al-l.0 wt% W, it was noted that large
precipitates, up to 5 microns, existed within the material.
No corrosion improvement over pure aluminum was observed.
Scanning electron microscopy showed that attack occurred
around the precipitates like the sputter deposited samples.
Constant potential tests below the determined pitting
potential were conducted on both heat treated and "as
processed" sputter deposited alloys in an attempt to confirm
the heat treatment data. Anodic currents were observed for
both conditions. Some mechanical failure has been noted
with these thin film alloys, which could result in crevice
corrosion, possibly causing the anodic currents detected.
This contradictory result requires further investigation.
3
TABLE OF CONTENTS
INTRODUCTION AND OBJECTIVES. . . ....... o . ..... o oo.o.o. ......... o. .oo4
RESULTS AND DISCUSSION. .o . . .. .................. o.. . . . . .o .. o. .oo.45
ACKNOWLEDGEMENTS. .. . .. o . ................ .o. . o . o . .o . . .. o. . . .. .* . *7 9
REFERENCESo. o. . . o.. . . . .. . o. . .. .. .... oo .o. o o .. .* **** ***S SS5.* 80

4
INTRODUCTION AND OBJECTIVES
Aluminum alloys are used extensively in the United
States Navy and range from lightweight, high strength
aircraft components to large shipboard applications such as
the superstructures on the Ticonderoga class cruisers.
However, the corrosive marine environment has caused
considerable problems with these conventional alloys because
the elements typically added to aluminum to improve
mechanical properties such as copper, magnesium, and zinc
generally do not increase the corrosion resistance. In an
effort to alleviate these problems, the Naval Research
Laboratory and others have developed new high corrosion
resistant aluminum alloys that have been termed "Stainless
Aluminums" [6,7]. These alloys are composed of an aluminum
matrix with elements such as tungsten or tantalum suspended
in a supersaturated solid solution. The alloys exist in the
supersaturated state because the solubility limits of
tantalum and tungsten are very small in aluminum. Also, the
superior corrosion properties are only achieved if the
alloying element is kept in the supersaturated condition.
To produce these types of alloys either a cold process or a
rapid solidification process is needed. Some methods used
to date are co-sputter deposition of thin film alloys and
ion implantation [2,3,4,5,6,7]. Both of these processes
have produced alloys that have shown the superior corrosion
5
properties. Co-sputter deposition has limited application
because it produces very thin films, about one thousand
angstroms, of the aluminum alloy on a substrate. Thicker
deposits can be made, but the process is very difficult and
expensive. Ion implantation, on the other hand, could be
used to treat the surface of a large structure and "stitch"
the alloying element into the aluminum exceeding the
solubility limit. This, however, is an extremely expensive
process and has only been done to small specimens. Both the
co-sputter deposition and the ion implantation involve
little or no heat generation, and thus do not allow the
alloying element to precipitate into its equilibrium phase,
thereby achieving the necessary supersaturated solid
solution condition. Explosion compaction powder metallurgy
and spray forming, two rapid solidification processes, have
been used to make bulk material. The rapid cooling of the
liquid metal could trap the alloying element in a
supersaturated solid solution, and thus yield a bulk piece
of material that exhibits the same properties as the cold
processed specimens. Previous research has shown that the
dynamically compacted material does not show any corrosion
improvement, and in fact, exhibited properties similar to
pure aluminum. The objectives of this project were two-
fold. The first was to determine the influence of heat
treatments at different temperatures for varying amounts of
time on the corrosion resistance of the sputter deposited

6
Al-Ta and Al-W alloys. The second objective was to
determine if spray forming, a rapid solidification process,
would yield bulk alloys that exhibit the superior corrosion
properties of the "Stainless Aluminums."
BACKGROUND
Aluminum, like all other metals, comes from an ore that
is found within the earth. This thermodynamically stable
ore is then processed by a refinery which adds energy to the
elements, and a thermodynamically usable metal is produced.
This piece of aluminum or aluminum alloy exists in an
unsiable phase, an. Lhus will tend to revert to its stable
form; in other words, it will corrode [9]. However, during
this reaction with the environment the aluminum produces
corrosion products, usually oxides, on its surface. Thse
products will create a thin film and will generally inhibit
the metal from reverting back to its thermodynamically
stable state [9]. When this occurs, the metal is said to be
passive. Presently, there are two accepted and debated
definitions of passivity: 1) A metal is passive if, on
increasing its potential to more positive values, the rate
of dissolution decreases, exhibiting low rates at high
potentials. 2) A metal is passive if it substantially
resists corrosion in an environment where there is a large

7
thermodynamic driving force for its oxidation (known as
thick film passivity). Different theories have been
developed to prove each of the definitions, and some argue
that it is the metal which determines the definition to be
applied [9,12). However, independent of which definition is
chosen to explain the underlying mechanism of passivity,
there is a certain phenomenology of active passive metals
that can be shown [12]. This phenomenology is best shown by
the polarization curve in Figure 1. This is a plot of the
electrochemical potential versus the log of the current
density for an active passive metal, like aluminum, in a
solution of neutral pH. The current density is proportional
to the corrosion rate. This means that the greater the
current density, the faster the metal is corroding. The
curve shows how the metal will react to an increasing
potential [12]. In the lower region aluminum will freely
corrode with an increase in potential. This is referred to
as the active region. As the potential increases, the metal
will reach a point (EPand I,,) where the current density,
which is directly proportional to corrosion rate, will fall
off drastically to very low passive values (I•). This is
the passive region. In this region, the film that has
formed on the surface of the aluminum will protect the metal
from corroding, and will reform rapidly if it should be
scratched or damaged [1). It is within this region that
engineers attempt to keep aluminum so that it will not

Epit
'Iiv-mIpa "* Epass. _
Icrit Active
FIGURE 1: Typical behavior of an active-passive metal
With increasing POtential

9
corrode. As the potential continues to increase, the
aluminum will generally reach a potential at which the
passive film breaks down and pitting ensues (E•1 ). This is
termed the pitting potential. At potentials above the
pitting potential the material is damaged by pitting.
The described parameters (E,, Eý1 ,, I,,, I..)
characterize passivity, and depend on both the metal and the
environment [12]. The presence of an oxidizer, such as
dissolved oxygen, can cause aluminum to become spontaneously
passive and thus will not exhibit the active region in
Figure 1. The active nose of the polarization curve becomes
hidden by the hydrogen evolution line shown in Figure 2
[12]. The polarization curve without the active region
takes on a different shape, Figure 3. This is the shape of
the curves that were generated during this study.
When the potential reaches •,, the passive film will
break down and the sample will begin to corrode. The
aluminum will not corrode uniformly over the whole surface,
but will instead be subject to localized corrosion. The
sample will be attacked at discrete sites where the passive
film breaks down. The actual mechanism by which this
happens is subject to much debate, but again the
phenomenology has been well documented [9,12]. Since
aluminum passivates, it is subject to a form of localized

- - --- - -0
+ ~P 0V- -
2:~ ~ O heoatoof the hydrogen evelatiofl line is shown above
the active regionl which causes 'Ile mtlt pftno~ 8 sv
Lo& Z
F IGUPIE 3-: The shape 0, a Poiarizatlofl cu(jve when
1 the
metal has sp 0ntaneois" pssvae
11
corrosion known as pitting. Pitting can be broken down into
two phases: initiation and propagation. During the
initiation phase, there is little or no change in the
surface conditions. However, upon initiation of pitting,
discrete sites of attack propagate and new sites continue to
develop [12). Some of the pits will repassivate, but others
will continue to propagate into the aluminum and will
eventually cause the piece to fail [10]. Though the
initiation of pitting is a much debated issue, it is agreed
upon that the local attack occurs at inhomogeneities on the
metal's surface [12]. These imperfections could be either
in the metal, in the film, or in the solution.
The environment, or solution, can have a dramatic
effect on the pitting potential. Pitting is generally
accelerated in an environment of aggressive chloride anions
like the ocean [8]. For the two alloys studied in this
project (Al-W and Al-Ta), the increase in chloride
concentration in the solution has been shown to rapidly
decrease the pitting potential. This effect has been
determined to be a linear relationship for these alloys with
Al-Ta having a slope much greater than 250 mV/percent of
solute, and the Al-W alloy having a slope of approximately
550 mV/percent of solute (4]. For naval applications,
aluminum is often coupled with steel. This electrical
contact between the two metals causes a galvanic couple to
form. This galvanic couple can affect the passivity of the

12
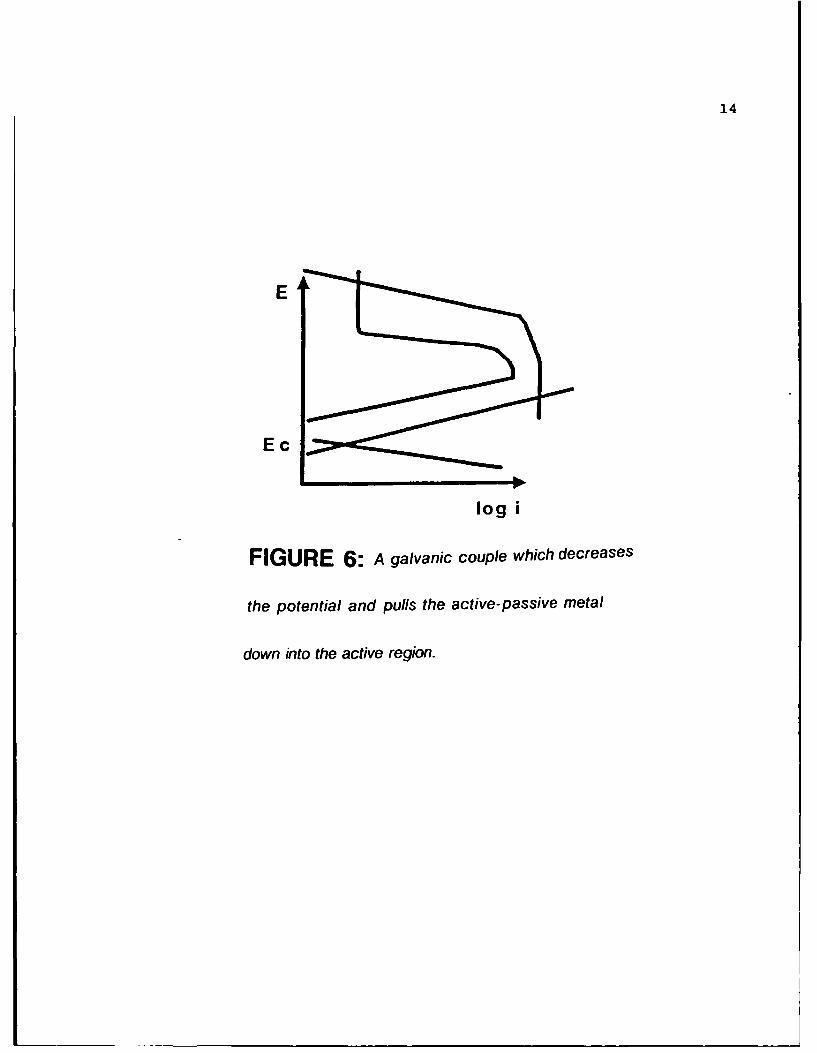
aluminum in one of three ways: "1) increasing the potential
so that passivity can occur for conditions under which it
otherwise would not, 2) increase the potential to the point
that localized corrosion can occur, and 3) decrease the
potential so that passivity cannot be maintained and active
dissolution occurs on the (previously) passive metal" [12].
These three cases are shown in Figures 4, 5, and 6. Two of
these three cases are detrimental to the passivity of the
aluminum. Unfortunately, the aluminum steel galvanic couple
falls under case 2. This is shown by the use of the
galvanic series, Figure 7, which shows the rest potential or
E•, of different metals and alloys in the ocean environment.
From this series, the rest potential of steel ranges from
-700 mV to -550 mY; the rest potential of aluminum alloys
ranges from -1000 mV to -750 mV. These are shown in Figure
8. When these two metals are electrically connected, they
form a galvanic couple which will achieve a rest potential
around -700 mV depending on the area ratio. This is the
approximate pitting potential for aluminum and conventional
aluminum alloys in a 3.5 wt% NaCl solution. This means
that the couple will likely cause the aluminum to move out
of the passive region and begin to pit. If the pitting
potential of the aluminum alloy could be increased to a
value higher than -700 mV, such as -550 mV, then the
aluminum alloy would remain in its passive region and would
not corrode. This has been accomplished with the new

13E
E c
log i
FIGURE 4: A galvanic couple which
increases the potential and pulls the active-
passive metal into the passive region
E
Ec
1I!9 i
FIGURE 5: A galvanic couple which
increases the potential and pulls the active-
passive metal into the region where it will
corrode
14
E
log i
FIGURE 6: A galvanic couple which decreases
the potential and pulls the active-passive metal
down into the active region.

15ACTIVE - POTENTIAL (V) vs. SCE -- NOBLE
-1.6 -11A -1.2 -1.0 -0.8 -06 -04 -02 0 0,2
GraphiteIHSPlatinum
Ni-Cr-MO1 Allay CTitanium
Ni-Cr-Mo-Cu-Si Alloy G68
Nickel-iron-c hromium Alloy 825
Alloy 20 stainless steels, cast and wrought
Stai-nless steel Types 31 6.337 17j
I Nickel-coýPper Alloys' 400. K-S5 1111
Stainless steel Tes302. 304.3211.347'1101Silver U
Nickel 200Silver-bronze all~oys
Nickel-chromiumn Alloy 600 Oil
Nickel-aluminum bronze
70-30 copper nickel
I ILeadStainltess steel Type 430 1111
80-20 copper-nickelII
go- 10 copper-nickel
Nickel SilverStainless steel Types 410. 416 11111w
Tin bironzes (G & M)WSilicon bronze (11
Manganese biron~ze 50
Admiralty brass, aluminum brass PER
50 Pb-SO Sni solder IMCopper M
Naval brass, yellow brass, red brass~
Aluminumi o~
Austenilici niCkcl cast iron
Low-al~loy steel
Lowcarbonll steel, cast Pron,
Cadn-Lium lAILuIirinPon alloys
Berylliumn 0
5 Magrcsrirr LZinc
FIGURE 7: Galvanic Series showing the range of Ecort for various
metals and alloys in seawater.

16
Pitting Potential of pure Al
A] alloys Steel
l .Ov -O.8V -722mV .'6 V
FIGURE 8: This diagram shows the ranges of Ecorr for aluminum
alloys and steel in seawater.
17
"Stainless Aluminum" allcys as will now be discussed.
The new "Stainless Aluminum" alloys that have been
developed to alleviate the corrosion problem in the marine
environment have been researched extensively by Martin
Marietta Laboratories in Baltimore, Maryland, and by the
Naval Research Laboratory in Washington, DC. The funding
for these efforts has been through the Office of Naval
Research. Martin Marietta has produced several different
supersaturated solid solution aluminum alloys by co-sputter
deposition in order to analyze which alloy would exhibit the
highest pitting potential. The elements that have been
introduced into aluminum are the same elements that have
been used to produce stainless steels, thus giving the new
aluminum alloys the name "Stainless Aluminum" [5]. These
transition elements, such as Mo, Ta, W, and Cr, are not
usually alloyed with aluminum because of their very low
solubility limit, less than 1 at.%. "However, the amount of
solute in solid solution can be increased, by several orders
of magnitude, and corrosion performance significantly
enhanced if the alloys are produced using nonequilibrium
alloying methods" [5].
The Naval Research Lab (NRL) has used the process of
ion implantation to produce the "Stainless Aluminums". This
is different from the sputter deposition process used by
Martin Marietta in that "ion implantation offers a method of
producing solid solution surface alloys unattainable by

18
conventional alloying techniques" [6]. Ion implantation is
a line of sight process where atoms of a particular element
are ionized, focused into an ion beam, accelerated, and then
bombarded into a host material, Figure 9. Though expensive,
ion implantation is a very versatile process. Any solid
material can be used as a host material, including metals,
semiconductors, and insulators, and almost any element from
hydrogen to uranium can be implanted [6,7]. The elements
can be driven into the host material to depths of 100 to
10000 angstroms, and the concentration can be varied from
trace amounts to 50 atomic percent [6,7]. Ion implantation
offers several advantages over other techniques: 1) No
sacrifice of bulk properties, 2) Low temperature process, 3)
Solid solubility limit can be exceeded, 4) No change in
sample dimensions, 5) Depth-concentration distribution is
controllable, 6) Precise location of implanted area [6,7].
Presently, ion implantation has only been done on small
samples due to the constraints of the apparatus. However,
this process does have the potential to be applied to large
structures such as aircraft, or shipboard components.
A supersaturated solid solution occurs when a metal is
alloyed with an element to a concentration beyond the
solubility limit in such a way that the alloying element
does not precipitate out as a new phase. This is shown by
the phaise diagram of tantalum and aluminum shown in Figure
10, with tantalum having a solubility limit of 0.25 wt% in

19
0 -C MM C
> 0
zM n
FIUR 9: Agceai fteI mlnainpoes

20
At.% Ta
0.01 0.02 .5OFLiq. 4 . . .. ....
SALiq. + TaAI310001400
0.10 ,940 °K."'""10-25%
Al Al + TaAI800 3 1000
~~.__ _ _____
Al 0.2 0.4
Wt.% Ta
FIGURE 10: The phase diagram of Al-Ta. Note
the very low solubility limit of tantalum in aluminum.
21
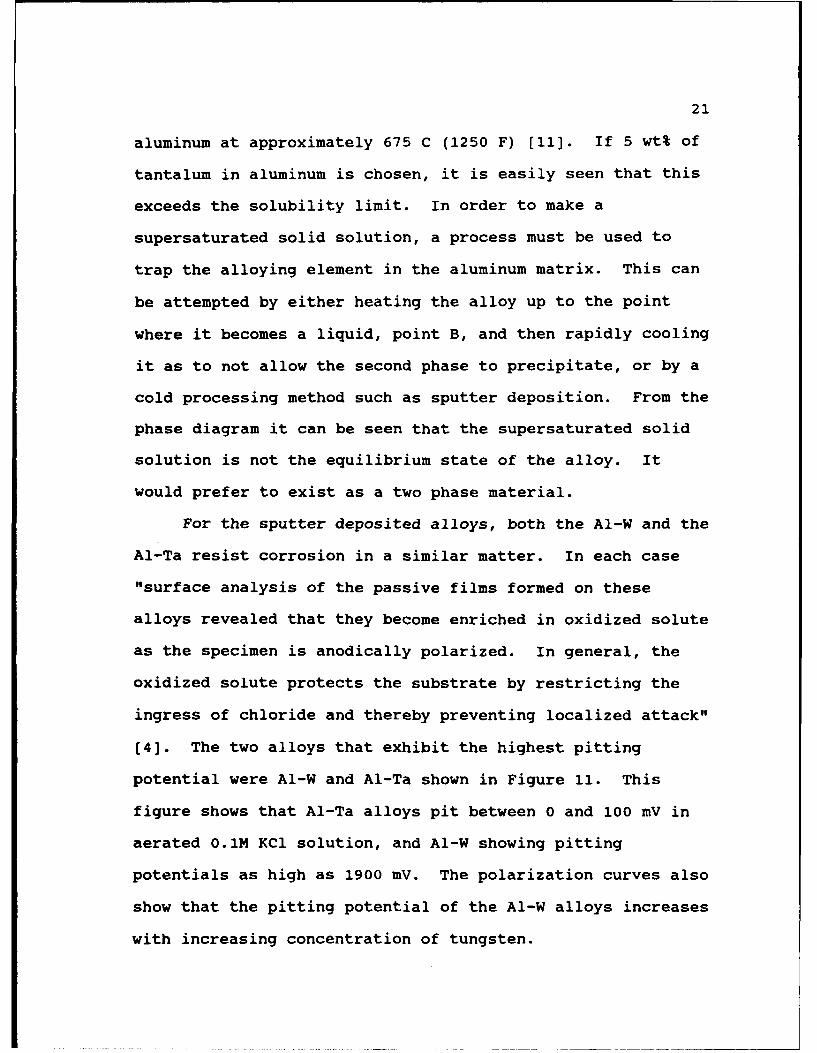
aluminum at approximately 675 C (1250 F) [11]. If 5 wt% of
tantalum in aluminum is chosen, it is easily seen that this
exceeds the solubility limit. In order to make a
supersaturated solid solution, a process must be used to
trap the alloying element in the aluminum matrix. This can
be attempted by either heating the alloy up to the point
where it becomes a liquid, point B, and then rapidly cooling
it as to not allow the second phase to precipitate, or by a
cold processing method such as sputter deposition. From the
phase diagram it can be seen that the supersaturated solid
solution is not the equilibrium state of the alloy. It
would prefer to exist as a two phase material.
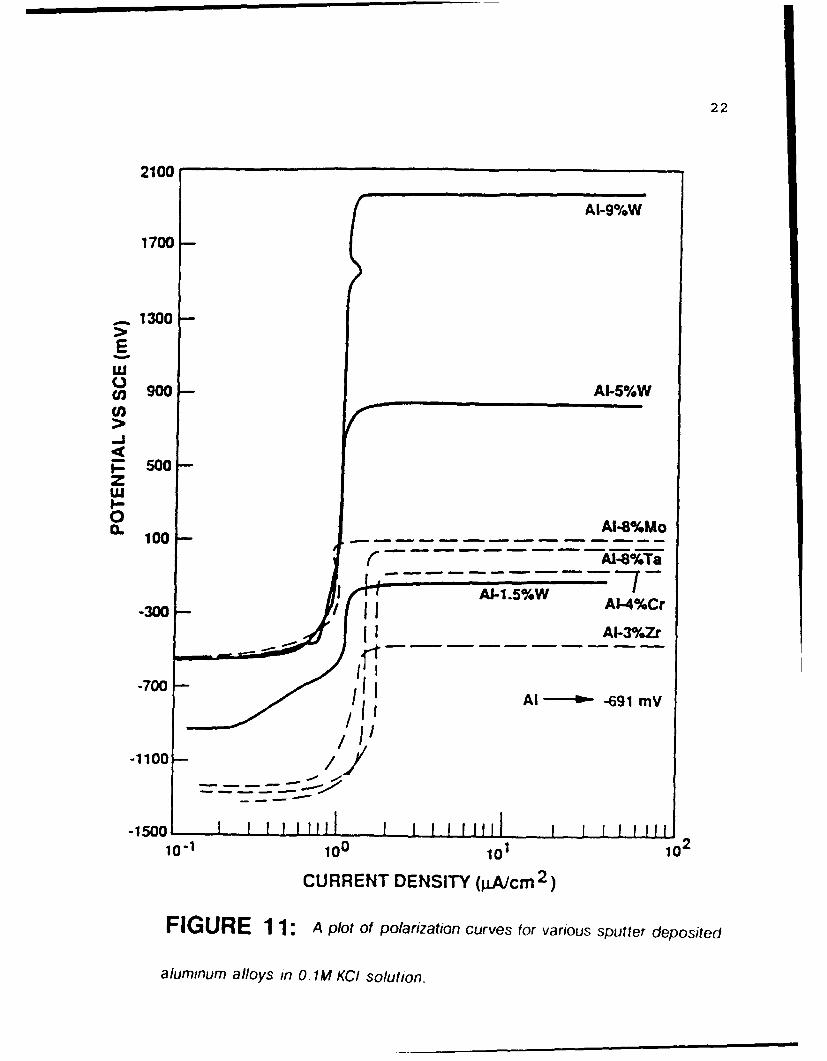
For the sputter deposited alloys, both the Al-W and the
Al-Ta resist corrosion in a similar matter. In each case
"surface analysis of the passive films formed on these
alloys revealed that they become enriched in oxidized solute
as the specimen is anodically polarized. In general, the
oxidized solute protects the substrate by restricting the
ingress of chloride and thereby preventing localized attack"
[4]. The two alloys that exhibit the highest pitting
potential were Al-W and Al-Ta shown in Figure 11. This
figure shows that Al-Ta alloys pit between 0 and 100 mV in
aerated 0.1M KCI solution, and Al-W showing pitting
potentials as high as 1900 mV. The polarization curves also
show that the pitting potential of the Al-W alloys increases
with increasing concentration of tungsten.
22
2100
AI-9%W
1700-
1300
LU( 90- AI-5%W
5 00--J
5000L 100 --
( AI1-8%T8
AI-1.5%W 7-,.300 - IAI-4%Cr
-A3030Zr
-700- /• Al -691 mV
-11oo0-/
-1500 1 1 0- L, L I I I II l fL 2 lO- 00 10
CURRENT DENSITY (gAlcm 2)
FIGURE 11: A plot of polarization curves for various sputter deposited
aluminum alloys in 0. 1M KCI solution.
23
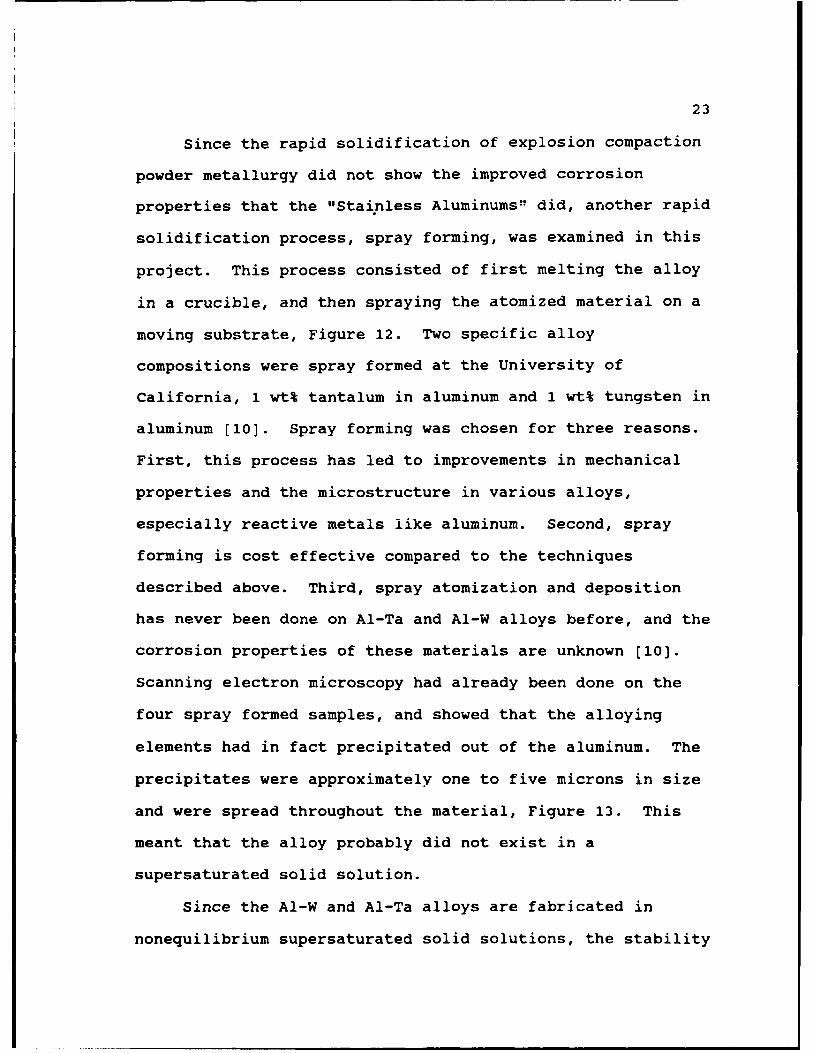
Since the rapid solidification of explosion compaction
powder metallurgy did not show the improved corrosion
properties that the "Stainless Aluminums" did, another rapid
solidification process, spray forming, was examined in this
project. This process consisted of first melting the alloy
in a crucible, and then spraying the atomized material on a
moving substrate, Figure 12. Two specific alloy
compositions were spray formed at the University of
California, 1 wt% tantalum in aluminum and 1 wt% tungsten in
aluminum [10]. Spray forming was chosen for three reasons.
First, this process has led to improvements in mechanical
properties and the microstructure in various alloys,
especially reactive metals like aluminum. Second, spray
forming is cost effective compared to the techniques
described above. Third, spray atomization and deposition
has never been done on Al-Ta and Al-W alloys before, and the
corrosion properties of these materials are unknown [10].
Scanning electron microscopy had already been done on the
four spray formed samples, and showed that the alloying
elements had in fact precipitated out of the aluminum. The
precipitates were approximately one to five microns in size
and were spread throughout the material, Figure 13. This
meant that the alloy probably did not exist in a
supersaturated solid solution.
Since the Al-W and Al-Ta alloys are fabricated in
nonequilibrium supersaturated solid solutions, the stability

24
SPRAY FORMIl GMOLTEN METAL
TUNDISH/CRUCIBLE NITROGEN
ATOMIZING GASGAS-ATOMIZER
SPRAY OF TRANSFERPARTI CLESPARTICLE MECHANISM
SPRAY-DEPOSITEDPREFORMA
COLLECTOR DISCHARGE CHAMBER
PREFORM FURTHER
SPRAY CHAMBER PROCESSED BY FORGING,EXTRUDING, ROLLING. ETC.
FIGURE 12: A schematic of the spray forming process-

25
FIGURE 13: A SEM photograph showing large
precipitates, up to 5 microns, on the surface of the
spray formed material.
26
of the alloys needed to be examined. A critical question is
whether time and/or temperature would promote precipitation
of the second phase, and diminish the corrosion properties.
Martin Marietta characterized samples immediately after they
were sputtered, and again after one year of being maintained
at room temperature. No precipitation of the second phase
was noted in the Al-W and Al-Ta alloys [2,3,4,5]. It was
determined that the precipitation of the second phase would
be detrimental to the corrosion properties of the material.
To prove this, and to see just how much the alloys would be
affected by the second phase, heat treatments were done at
400 C for one hour and twenty-four hours. The only alloys
to retain some of their corrosion properties after the heat
treatment and the formation of an intermetalic phase were
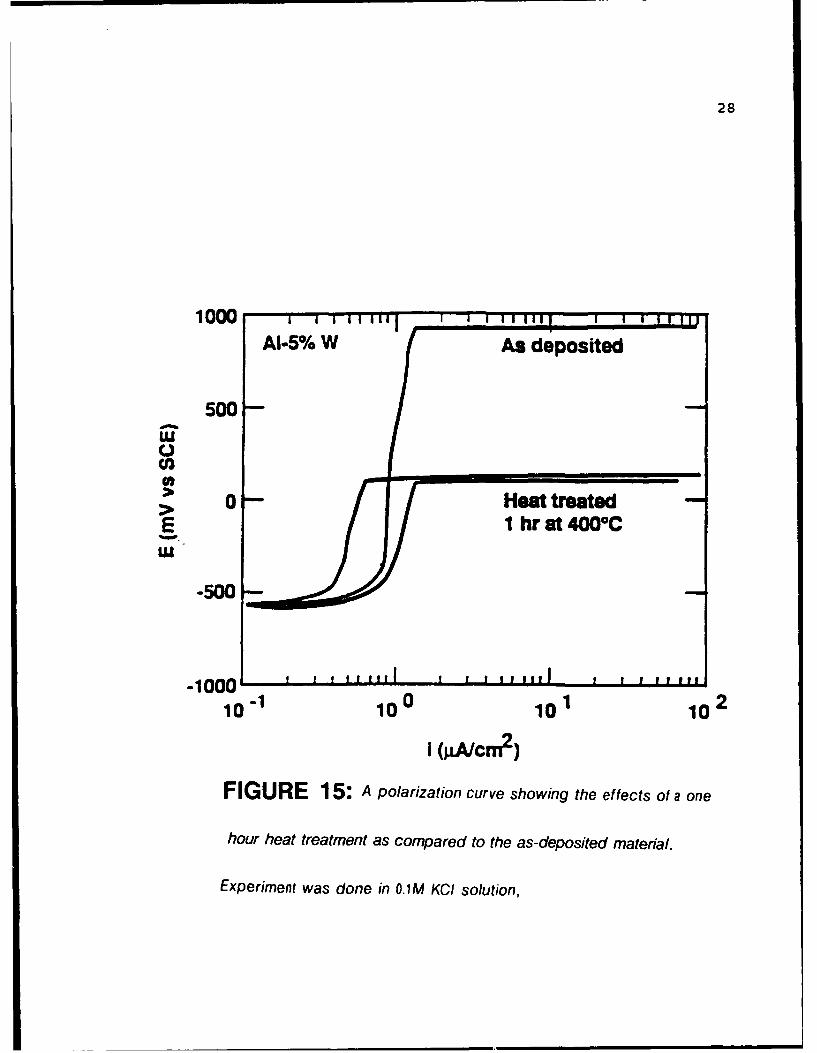
the Al-W and Al-Ta alloys. The Al-W alloy still had a small
passive region of 200 to 300 mV shown in Figures 14 and 15
[3,5]. This limited study has been the only work reported
on the influence of heat treatment on the corrosion
properties of "Stainless Aluminum" alloys prior to this
Trident Scholar report.

27
-300Al-i1.5W
-400 As-deposited
L Heat-treated 24h 4000C()-5W00C4)
LU -6 W0
-700
4o0 ! I I10-2 10-1 100 101 102 103
I (pJA/cm 2)
FIGURE 14: A polarization curve showing the effects of a twenty-four
hour heat treatment on the same material as compared to the as-deposited
Experiment was done in O. 1 M KCI solution.
28
1000AI-5% W As deposited
C.)Co
. 0- Heat treated,-E I hr at 4000C
ILl
-500
-1000' 0 2 ,,, , ,I I I, ,
10- 100 101 102
I (gA/cm2 )
FIGURE 15: A polarization curve showing the effects of a one
hour heat treatment as compared to the as-deposited material.
Experiment was done in OGM KCI solution,
29
PROCEDURE
The first step was to identify the pitting potential of
pure aluminum and three conventional aluminum alloys in a
3.5 wt% NaCI solution. To do this, a mounted 99.999% pure
aluminum sample was obtained from The Johns Hopkins
University, and three conventional bulk alloys, 6061-T6,
7075-T6, and 2024-T4, vere mounted using a hot process. A
hot mount could be used on these conventional alloys because
they are not in a supersaturated solid solution, and thus
elevated temperature would not affect their corrosion
properties. The three alloys were first cut into small
pieces using a Leco model CM-12 cut saw. The small chunks
were placed into a Buehler Simplimet II mounter along with a
Buehler Green Phenolic Premold on top. The press was
preloaded to 29 MPa, and the heat was applied. Once the
pressure went to zero the heat was removed and the heat sink
was put in place to quickly cool the samples down. The
samples were removed after cooling, and then were polished
(polishing details are given later in this section). The
next step was to attach a 24 gauge wire so the electrical
connection could be made. A small hole was drilled through
the mounting material and into the metal. The wire was then
coated with silver paint and inserted into the hole. When
the paint dried, the electrical connection was checked with
a Fluke model 77/BN multimeter. The wire was secured with a

30
Cole and Palmer extra fast setting three to five minute
epoxy. The completed samples, Figure 16, were then ready to
be potentiodynamically polarized to find their pitting
potential.
Two methods were used to produce the Aluminum Tantalum
(Al-Ta) and Aluminum Tungsten (Al-W) samples used in this
project. They were co-sputter deposition of thin film
alloys and spray forming. The cold process of co-sputter
deposition was used to produce the samples that were used
for the heat treatments, and comprised the majority of the
research. This was done at The Johns Hopkins University
using a Kurt J. Lesker Co. Sputter Coater. This machine
produced samples of 8.5 wt% Tantalum in Aluminum and 11 wt%
Tungsten in Aluminum on glass slides. These samples were
then brought back to the laboratory at the Naval Academy in
a dry environment to be cut and heat treated. Each sputter
run was cut into eight separate samples using a Buehler
Isomet Slow Cut saw and a clean Buehler Diamond blade. In
order to avoid any contamination, a new blade was used and
devoted only to cutting the sputter deposited samples. A
total of eleven sputter runs were done, seven Al-Ta and four
Al-W. The spray formed samples were produced at the
University of California using an Osprey machine.
Since the spray formed samples were bulk material like
the conventional aluminum alloys, they needed to be mounted
31
FIGURE 16: A photo of a completed mount of a conventional
aluminum alloy The sample is 1 cm on each side.

32
using a conventional mounting method. However, to avoid
further precipitation of the second phase, the spray formed
samples could not be mounted using the described process.
Instead, the samples were mounted using a cold process.
First, the bulk material was cut on a metal saw to get large
cylindrical pieces shown in Figure 17. These pieces were
then cut into quarters, Figure 18, using a bandsaw. One of
the quarters was then trimmed on the isomet slow cut saw
with the uncontaminated diamond blade to insure that no
steel or other metals were on the specific surface that was
to be polished and scanned. A 24 gage wire was then mounted
to the sample by drilling a small hole in the material,
coating the end of the wire with silver paint, and inserting
the wire into the hole. The silver paint was allowed to dry
for about an hour, and the resistance of the connection was
checked with the Fluke multimeter. Once a low resistance
connection was achieved, the wire was fastened to the sample
with the three to five minute epoxy. The sample was then
mounted using Buehler Sampl-Kwick two part potting material.
The potting material consisted of two parts by volume of
number 20-3562 Sampl-Kwick Powder with one part number 20-
3564 Sampl-Kwick Liquid. The two portions were measured in
separate graduated cylinders, and then mixed in a small
paper cup. The samples were placed in small molds which
were coated with Buehler silicone mold release in order to
allow the mount to slip out of the mold.

33
7
cut made "., ==--,,.
about here
FIGURE 17: The initial cut was made on the spray formed
samples in order to get a small cylinder.

34
FIGURE 18: The small cylinder was then cut into quarters.
The sample has a diameter of 2 in.

35
The potting material was poured over the sampie until the
sample was entirely immersed in the liquid. Once the
potting material set, about twenty minutes, the mold was
removed and the mounting material was allowed to dry for 24
hours. The completed sample, shown in Figure 19, was then
polished.
Both the spray formed samples, the three conventional
alloys, and the pure aluminum sample were polished to a near
mirror finish in order to minimize crevice corrosion. This
was done through a two step process. The samples were first
polished using a Buehler Handimet Grinder and Buehler
Carbimet paper strips of grit 240, 300, 400, 600. The
samples were first polished by hand on the 240 grit, being
careful to keep the sample flat. Once the entire surface
was touched, the sample was rotated 90 degrees and pulished
on the 300 grit paper. The sample was sanded until all the
scratches from the previous polishing paper had left. This
process was repeated for the two remaining polishing papers.
The sample was then inserted into a Buehler Whirlmet
Polisher, and No 40-6351 AB polishing alumina with particle
size of 0.5 micron was used to give a near mirror finish.
To potentiodynamically polarize the samples, a cell had
to be prepared which would approximate the chloride
concentration in the ocean environment. To do this, a 3.5
wt% NaCl solution was made using 14 grams of NaCl and

36
FIGURE 19: A completed mount of a spray formed sample.
The entire mount has a diameter of 1 in.

37
400 ml of distilled water. The NaCI was measured on an
Ohaus Dial-O-Gram balance and put into a 500 ml beaker.
Then the 400 ml of distilled water were measured using a
graduated cylinder and poured into the beaker. The solution
was mixed with a glass stirring rod until all the salt was
in solution. A carbon rod counter electrode was suspended
in the solution along with a Fisher saturated calomel
reference electrode. The sample was then suspended in the
solution facing the carbon rod. This completed the basic
cell arrangement. But, because these alloys corrode at or
near their E, a few modifications had to be made. First,
a tube with a bubbling frit was put into the cell, and the
cell was then covered with plastic, Figure 20. The tube was
connected to a bottle of nitrogen and the gas was bubbled
into the cell at a moderate rate in order to displace the
oxygen in the solution. With less oxygen present the rest
potential, or E, of the alloys would decrease to a lower
value and prevent corrosion at the rest potential.
Once the cell was set up, a Model 273A Princeton
Applied Research Potentiostat was connected. The sample was
attached to the working electrode of the electrometer. The
carbon rod was attached to the counter electrode and the
reference electrode was plugged into the reference electrode
plug. The cell was then given a short period of time to
settle at Ec. During this time, the M342C SoftCorr
38
FIGURE 20: The modified cell used when nitrogen
bubbling was necessary.

39
Corrosion Software was programmed to potentiodynamically
polarize the sample at a rate of 0.2 mV per second. The
experiment began at E., and was stopped once the sample
began to pit or once the current density exceeded 50
microamperes per centimeter squared.
The sputter deposited samples were then heat treated in
a Thermolyne Type 47900 Furnace at 2000, 3000, and 4000 C,
and for time intervals of 30, 60, 180, 360, and 720 minutes
at each temperature. Since these alloys are reactive to
oxygen and various other gases, it was necessary to heat
treat the samples in an inert environment of argon gas. To
do this, one or two samples were put in a large test tube
and sealed with a rubber stopper. Two tubes, one to pump
argon into the test tube and one to allow the gases to
escape, were inserted into the test tube through the rubber
stopper. A thermocouple was also inserted into the test
tube through the rubber stopper in order to measure the
temperature inside the tube. The test tube arrangement is
shown in Figure 21. Argon gas was then vigorously pumped
into the test tube for five minutes to displace any oxygen
or other gases that may have been present. Since argon is
heavier than air, it naturally settled to the bottom of the
tube where the sample was and forced the atmospheric air out
of the tube. After five minutes, the flow rate of the argon
was turned down so that a slight overpressure was maintained
in the test tube as to not allow air to seep back in. Once

40
FIGURE 21: The test tube setup that was used
to heat treat the samples. The two gas tubes and
the thermocouple can be seen.

41
the flow rate was turned down, the sample was ready to be
inserted into the furnace. The furnace was brought up to
the temperature of the heat treatment and the test tube was
inserted into the top of the furnace. The time for the
sample to heat up to temperature was recorded. Once the
sample achieved the heat treatment temperature, the time of
the heat treatment began. At the completion of the heat
treatment, the test tube was removed from the furnace and
the flow rate of argon was increased in order to speed up
the cooling process. The cooling time was also recorded.
Once the heat treatment was complete, the samples were
mounted so that they could be potentiodynamically scanned.
A wire was attached to the sample and the edges were coated
with an epoxy so that the solution would not penetrate
between the glass slide and the thin film. The first step
was to silver paint a 24 gauge wire to the sample. The
silver paint was then allowed to thoroughly dry for about an
hour, and the resistance of the connection was measured with
the Fluke multimeter. The wire connection was then securely
fastened to the slide using a three to five minute epoxy.
When this was completed, the resistance was again measured
to insure a proper electrical connection. The next step was
to coat the edges of the glass slide with Interlux Barrier-
Kote Two Part Epoxy Primer, which consisted of a Number 404
Base and a Number 414 Reactor. The West System Two Part
Epoxy was initially used to coat the edges of the sample,

42
but due to difficulty in controlling the epoxy, and a
possible crevice corrosion problem, Interlux was used.
Polarization curves done on samples with the Interlux had
the same characteristics as those generated when the West
System was used. Interlux had been shown to resist crevice
corrosion in similar experiments conducted at both Johns
Hopkins University and Pennsylvania State University. This
proved that a crevice corrosion problem did not exist, but
due to the ease of application the Interlux was used for the
rest of the project. This epoxy was allowed to dry for
about 24 hours, and the samples were ready to be scanned.
The sputter deposited samples were potentiodynamically
polarized in a cell similar to the one used for the
conventional aluminum alloys. It was not necessary,
however, to use nitrogen bubbling for these specimens
because their pitting potentials were much higher than their
rest potentials. Therefore, the bubbling frit and tube were
removed from the cell, and no plastic covering was required,
Figure 22. The samples were suspended in the solution, and
the M342C SoftCorr Corrosion Software was programmed to
polarize the samples at 0.2 mV per second.
After the samples were pitted and the scans were
finished, a hard copy of the polarization curves was printed
out on an Epson FX-85 Dot Matrix Printer. The M342C
Corrosion Software was then used to view the data and see

43
FIGURE 22: The electrochemical cell setup that
was used to potentiodynamica/ly polarize specimens.

44
the breakdown potential for each sample. The pitting
potential was taken at the point where the current density
reached a value of 50 microamperes per centimeter squared.
This value was recorded, and then plotted on a pitting
potential versus time graph for each temperature.
In an effort to characterize the microstructure of the
samples before and after heat treatments, a Jeol JSM-6100
Scanning Electron Microscope was used. The samples were
physically and electrically connected to a stage that was
placed into the microscope. The electrical connection was
made so that the sample would not collect the emitted
electrons and become invisible. The chamber was then pumped
to a vacuum and the electron beam was initiated. The
samples were viewed at a low magnification, 500X, to
characterize the overall surface. The magnification was
then increased to 10,OOOX to view any defects, pits, or
precipitates that may have been present. The magnification
was then increased to 12,OOOX, and the surface texture of
the thin films was examined. Photographs were taken at the
different magnifications for both heat treated and unheat
treated samples in order to compare the microstructure of
the two. The spray formed samples were also characterized
in the SEM.
In an attempt to verify the collected data,
potentiostatic holds were done on the samples. The set up
for these experiments was the same as the potentiodynamic

45
polarization except for the programming of the software.
Instead of increasing the potential at increments of 0.2 mV
per second, the potential was held at a constant value.
These holds were done for 24 hours each. Both the as
received samples and samples that were heat treated at 4000
C for three hours were held at -550 mV and the current
density was monitored. Additional holds were also done at
-700 mV on as processed Al-Ta and Al-W samples. At the
termination of the experiment, a hardcopy of the data was
made in the form of a current density versus time plot.
RESULTS AND DISCUBSON
Potentiodynamic polarization experiments were done on
pure aluminum and some common aluminum alloys in order to
establish a baseline pitting potential that could be
compared to the pitting potential achieved by the "Stainless
Aluminums." Along with 99.999% aluminum (pure aluminum),
the three conventional aluminum alloys that were scanned
were 6061-T6, 7075-T6, and 2024-T4. They showed pitting
potentials of -722 mV for pure aluminum, and -725 mV, -761
mV, and -663 mV, respectively, for the conventional alloys,
Figure 23. When galvanically coupled to steel, these alloys
would be pulled up to or near their pitting potential

46
-620 . 2024PURE ALL•M
2 "7075.......... ..
04-980
-1100 . .. ... . ,,I,..*! . ,. ....31 I , 133 .. ... I 3. , .. I . ,,.-3 -. -1I 0 I 3
10 10 10 0 0 1 10
CURRENT (microamps/cm 2)
FIGURE 23: Polarization curves of pure aluminum and
conventional aluminum alloys.

47
because steel has a rest potential higher than that of
aluminum and aluminum alloys in seawater, Figure 8. This
would cause the conventional alloys to experience pitting.
The four spray formed samples were composed of 1 wt% Ta
in aluminum (Al-0.51wt% Ta actual), and 1 wt% W in aluminum
(Al-0.57wt% W actual) [10]. Two samples of each
concentration were produced yielding a total of four bulk
samples. It was theorized that the fast solidification rate
of the spray forming process would trap the alloy in a super
saturated solid solution and exhibit good corrosion
properties. The data collected on the alloys was not very
encouraging, however. The pitting potentials of the four
samples ranged from -686 mV to -721 mV, which is
approximately the pitting potential exhibited by pure
aluminum. The pitting potential of each specimen is shown
in Table 1. The low pitting potentials that were realized
by these alloys could be due to two factors. First, the
concentration of the alloying element may have been too low.
If 5 wt% tungsten or tantalum was used, some of the alloying
element could have been trapped in solid solution, which may
have yielded improved corrosion properties. Second, if a
faster solidification rate could be used, then the alloying
element may become trapped in a solid solution.
The co-sputter deposited samples (Al-Bwt% Ta and Al-
llwt% W) were the main focus of the research. Before any
heat treating could be done on the thin films, a pitting

48
TABLE #1Sample PittingNumber Potential (mV)
241_ -714246 -713247 -686249 -721
The pitting potentials of Al-Ta (247 and 249) and
AI-W (241 and 246) in 3.5wt% NaCI solution.

49
potential for the "as procc.ssed" samples had to be
determined. For each sputter run, one or more unheat
treated samples were potentiodynamically polarized. The Al-
Ta samples yielded pitting potentials which ranged from +73
mV to -293 mV between the different sputter runs, Table 2.
The Al-W samples yielded pitting potentials which ranged
from -147 mV to -236 mV for varying sputter runs, Table 3.
These are very large improvements over the pitting potential
of pure aluminum (-722 mV), and are consistent with previous
work on these alloys. This tremendous improvement showed
that "Stainless Aluminums" were definitely produced, and
that the alloys were in a supersaturated solid solution.
Once the baseline pitting potential was determined, the
heat treatments were done. The first set of heat treatments
was done on the Al-Ta samples at temperatures of 2000, 3000,
and 4000 C for varying amounts of time. The data is shown
in Tables 4-6 and is plotted on a pitting potential versus
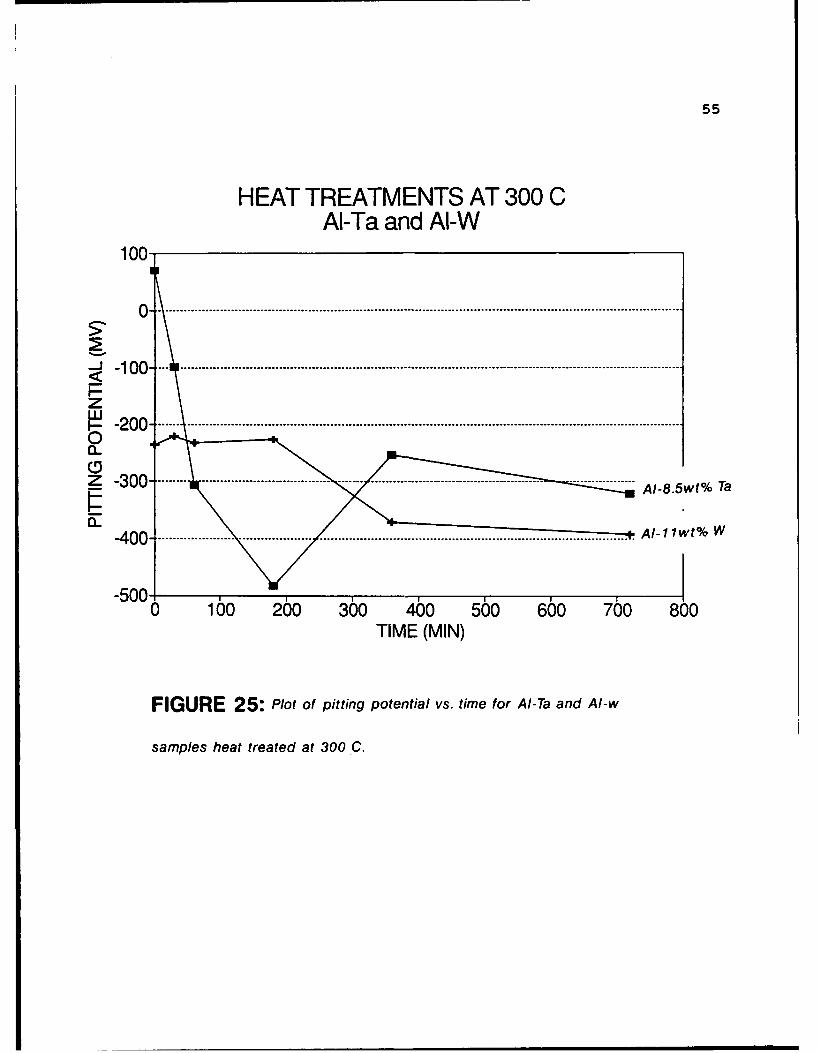
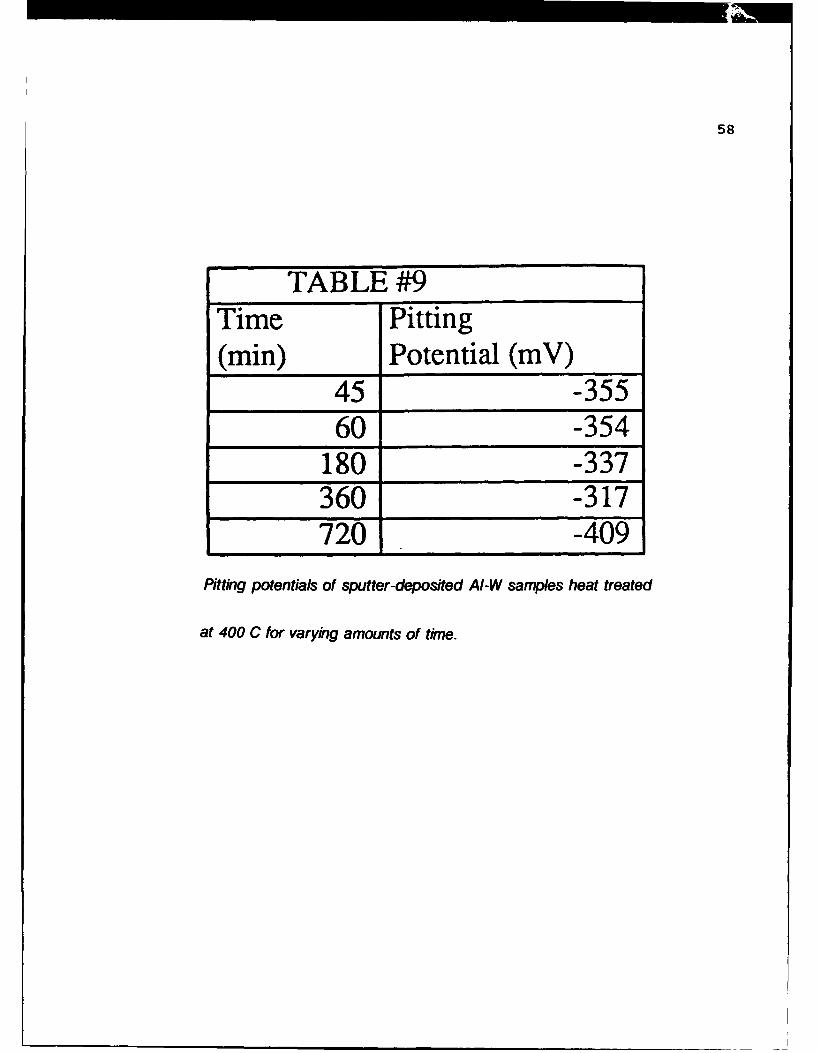
time graph, Figures 24 through 26. The Al-W samples were
then heat treated at 2000, 3000, and 4000 C for varying
amounts of time. This data is shown in Tables 7, 8, and 9
and is plotted in Figures 24 through 26. In each case, the
curves show that the alloys experience a sharp decrease in
pitting potential initially, and then continued to decrease
slightly with increasing time. The data also shows that as
the temperature increased, the pitting potential fell off to
lower values. This is consistent with the limited data

50
TABLE #2Sputter PittingRun Potential (mV)
-1 -2471 73I -2722 -1922 -2092 -893 73 904 -2934 -2905 -1985 -2186 -1507 -213
The "As-Processed" pitting potential for each Al-Ta sputtering run.

51
TABLE #3Sputter PittingRun Potential (mV)
1 -1491 -1472 -2183 -2364 -174
The "As-Processed" pitting potential for each AI-W
sputtering run.

TABLE #4 52
Time Pitting(min) Potential (mV)
-7115 -4530 -6260 -265
180 -139360 -162720 -173
Pittuig potentials of sputter-deposited AI-Ta samples heat treated
at 200 C for varying amounts of time.
TABLE #5Time Pitting(min) Potential (mV)
15 -4530 -9845 560 -307
180 -482360 -254720 -322
Pitting potentials of sputter-deposited AI-Ta samples heat treated
at 300 C for varying amounts of time.

53
TABLE #6Time Pitting(min) Potential (mv)
15 -43830 -47045 -43560 -478
180 -465360 -446720 -439
Pitting potentials of sputter-deposited AI-Ta samples heat treated
at 400 C for varying amounts of time.

54
HEAT TREATMENTS AT 200 CAI-Ta and AI-W
100
_ 0• ..............................................................................................-J1
-25
-00
z
0~
0 1-0 200 300 4()0 5()0 6-0 760 800
TIME (MIN)
FIGURE 24: Plot of pitting potential vs. time for Al-Ta and AI-w
samples heat treated at 200 C.
55
HEAT TREATMENTS AT 300 CAI-Ta and AI-W
100-
z1u -200 .........---------------.-----------------------------------------------------------------------
0
Z-300 ...................... ....................................................... A-1t
0 160 260 360 460 560 660 760 800TIME (MIN)
FIGURE 25: Plot of pitting potential vs. time for Al-Ta and AI-w
samples heat treated at 300 C.

56
HEAT TREATMENTS AT 400 CAI-Ta and AI-W
-150-_200 ................................................................................................
-MJ
wI.-
AI-8.5wt% Ta
-5000 100 200 360 4(0 560 660 760 800
TIME (MIN)
FIGURE 26: Plot of pitting potential vs. time for Al-Ta and AI-w
samples heat treated at 400 C.

57
TABLE #7Time Pitting(min) Potential (mV)
30 -235
60 -237180 -255360 -203720 -245
Pitting potentials of sputter-deposited AI-W samples heat treated
at 200 C for varying amounts of time.
TABLE #8Time Pitting(min) Potential (mV)
30 -22060 -232
180 -226360 -371720 -392
Pitting potentials of sputter-deposited AI-W samples heat treated
at 300 C for varying amounts of time.
58
TABLE #9Time Pitting(min) Potential (mV)
45 -355.60 -354
180 -337360 -317720 -409
Pitting potentials of sputter-deposited AI-W samples heat treated
at 400 C for varying amounts of time.

59
presented by Martin Marietta Laboratories. Their heat
treatments for one hour at 4000 C and 12 hours at 400 0 C both
showed decreases in pitting potential, but not a total loss
of the improved corrosion properties.
The polarization curves that were generated during this
study did not share the same characteristics as the
polarization curves presented in the literature. Initially,
it was theorized that a crevice corrosion problem existed.
However, the use of the Interlux epoxy disproved that
theory. The other possible explanation was the aggressive
solution that was used. In the literature, a 0.1 M KCl
solution has been used when polarization experiments were
done [2,3,4,5]. The solution that was used in this study
was 3.5 wt% NaCl in distilled water, which was used to
approximate the ocean environment. This equates to a 0.599
M NaCl solution, or about six times more chloride
concentration than the solution in the literature. This
large increase in chloride could be the reason why the
baseline pitting potentials of the as received samples were
lower than the literature, and why the polarization curves
did not exhibit the same characteristics. The curves showed
a good passive region and breakdown when the samples were
not heat treated, or heat treated for short periods of time.
However, when the samples were held at elevated temperatures
for extended periods of time, the polarization curves did
not show a passive region with a definite breakdown, or
60
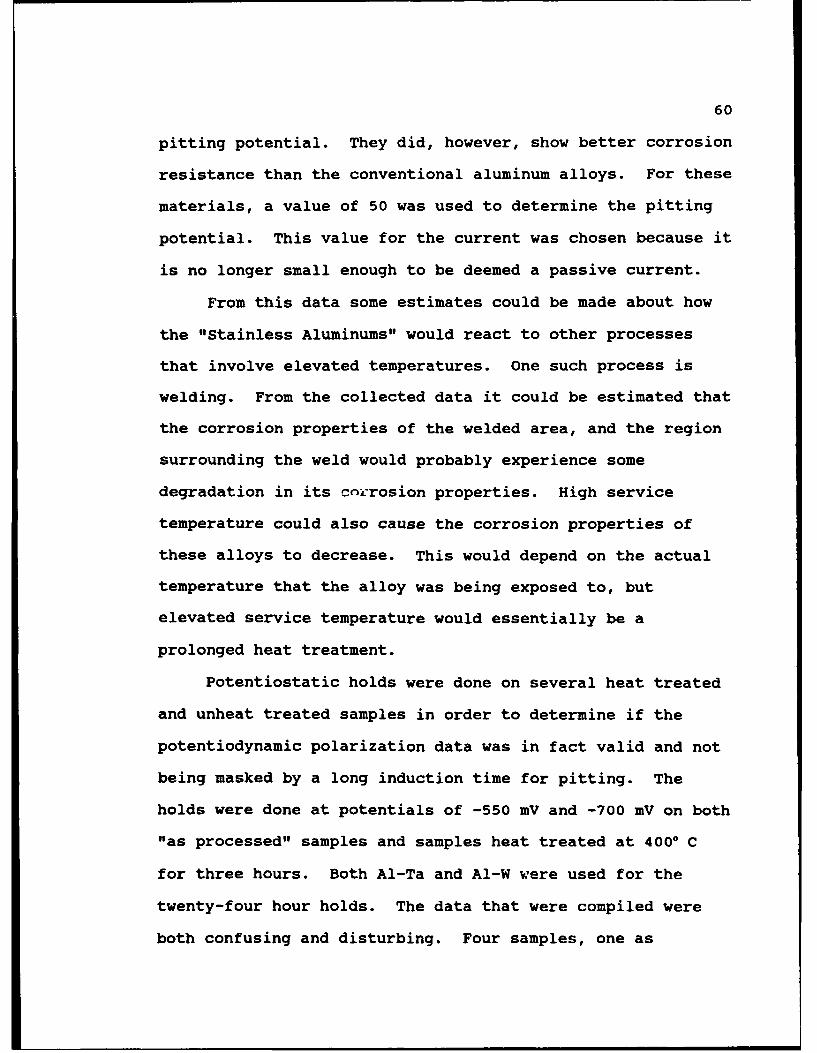
pitting potential. They did, however, show better corrosion
resistance than the conventional aluminum alloys. For these
materials, a value of 50 was used to determine the pitting
potential. This value for the current was chosen because it
is no longer small enough to be deemed a passive current.
From this data some estimates could be made about how
the "Stainless Aluminums" would react to other processes
that involve elevated temperatures. One such process is
welding. From the collected data it could be estimated that
the corrosion properties of the welded area, and the region
surrounding the weld would probably experience some
degradation in its corrosion properties. High service
temperature could also cause the corrosion properties of
these alloys to decrease. This would depend on the actual
temperature that the alloy was being exposed to, but
elevated service temperature would essentially be a
prolonged heat treatment.
Potentiostatic holds were done on several heat treated
and unheat treated samples in order to determine if the
potentiodynamic polarization data was in fact valid and not
being masked by a long induction time for pitting. The
holds were done at potentials of -550 mV and -700 mV on both
"as processed" samples and samples heat treated at 4000 C
for three hours. Both Al-Ta and Al-W were used for the
twenty-four hour holds. The data that were compiled were
both confusing and disturbing. Four samples, one as
61
received Al-W, one as received Al-Ta, one Al-W heat treated
at 4000 C for three hours, and one Al-Ta heat treated at 4000
C for three hours were held at a static potential of -550
mV. All four of the samples showed anodic currents
(corrosion) within the first five hours. The two heat
treated samples showed anodic currents for much longer
periods of time, Figure 27 and Figure 28, and the films were
completely removed from the glass slide after the 24 hour
period. The two as processed samples showed sharp increases
in anodic currents initially, but then fell back to little
or no current, Figure 29 and Figure 30. The Al-Ta film was
removed from the glass slide again, but the Al-W remained
intact. Since the holds at -550 mV were not successful,
additional holds were done at -700 mV for only "as
processed" samples. Again four samples were scanned, two
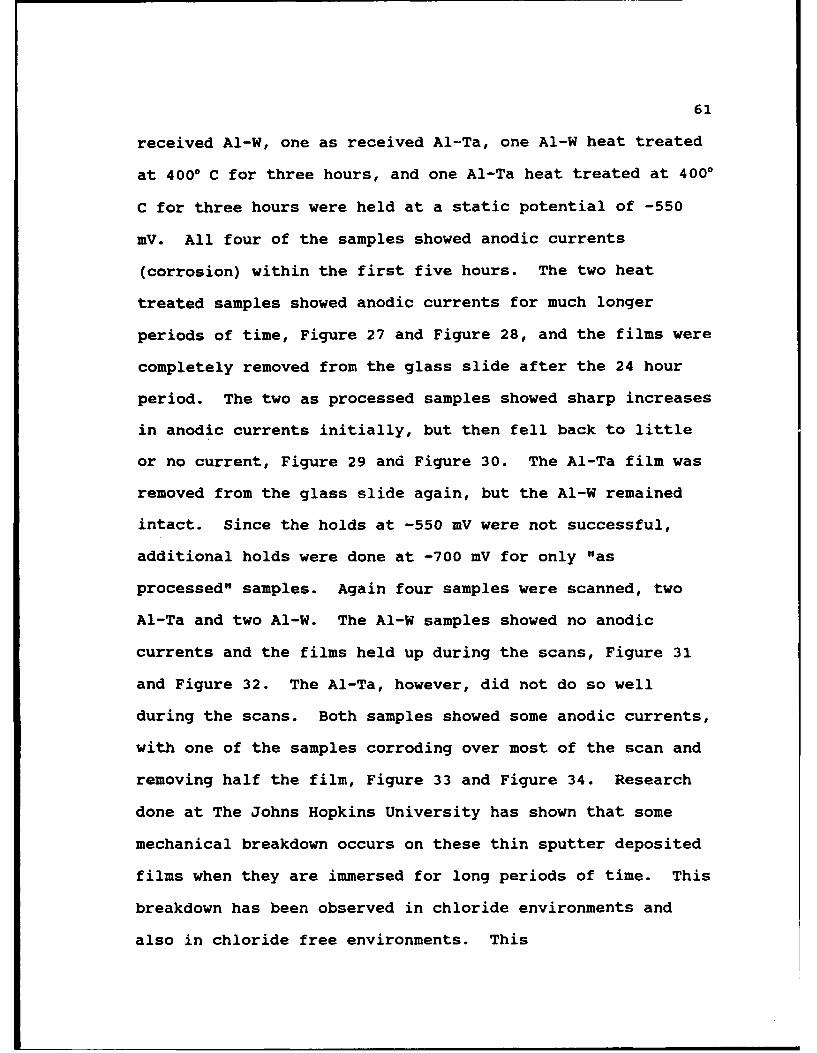
Al-Ta and two Al-W. The Al-W samples showed no anodic
currents and the films held up during the scans, Figure 31
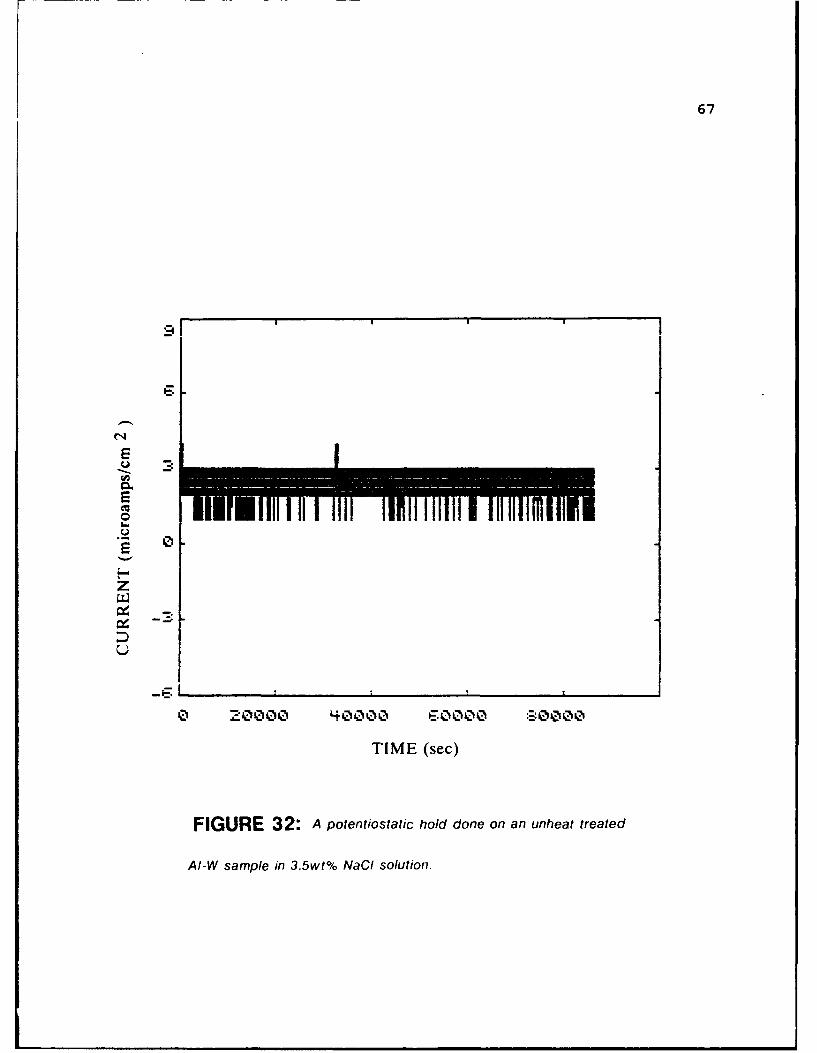
and Figure 32. The Al-Ta, however, did not do so well
during the scans. Both samples showed some anodic currents,
with one of the samples corroding over most of the scan and
removing half the film, Figure 33 and Figure 34. Research
done at The Johns Hopkins University has shown that some
mechanical breakdown occurs on these thin sputter deposited
films when they are immersed for long periods of time. This
breakdown has been observed in chloride environments and
also in chloride free environments. This

62
30
"0 0
"2 -15s
z
• -30
0 20000 4*000O E0000 80000
TIME (sec)
FIGURE 27: A potentiostatic hold done on a an AI-W sample
heat treated at 400 C for three hours.

63
E
E
I--
z
TIME (sec)
FIGURE 28: A potentiostatic hold done on an Al-Ta sample
heat treated at 400 C for three hours,

64
0
E
LL
z
Q
0 20000 40000 60000 80000
TIME (sec)
FIGURE 29: A potentiostatic hold done on an unheat treated
AI-W sample.

65
0
L.E
zS-is
0 .000020 0 L S0000
TIME (sec)
FIGURE 30: A potentiostatic hold done on an unheat treated
AI-Ta sample.

66
10
E
E
E
z[,-E
A A "p 304NI'N E A%'2 20000'I2 40000 0000 .2.000
TIME (sec)
FIGURE 31: A potentiostatic hold done on an unheat treated
AI-W sample in 3.5wt% NaCI solution.
67
S
"0a-.r4.
TIME (sec)
FIGURE 32: A potentiostatic hold done on an unheat treated
AI-W sample in 3.5wt% NaCI solution.
68
1=
w 11
is I
[..,
U I-
0 0430 0 404200 IF0000 -30000
TIME (sec)
FIGURE 33: A potentiostatic hold done on an unheat treated AI-Ta
sample in 3.5wt% NaCI solution.

69
EE
L
,-C
•.- 10
TIME (sec)
FIGURE 34: A potentiostatic hold done on an unheat treated Al-Ta
samp!e in 3.5wt% NaCl solution.

70
mechanical damage could be causing crevices to develop and
thus initiate crevice corrosion. This would give a false
indication of the resistance to pitting. Although these
potentiostatic holds have caused some concern, the tests are
not conclusive at this stage.
Scanning electron microscopy was done on both the "as
processed" samples and the heat treated samples in order to
characterize the microstructure. First, Al-Ta and Al-W "as
processed" films were viewed in the microscope. The surface
was shown to be uniform, and generally free from any
precipitates. Next, Al-Ta and Al-W films that were heat
treated at 2000, 3000, and 4000 C for one hour, and a sample
that was heat treated at 4000 C for 12 hours were examined
in the microscope to view the effects of elevated
temperature on the films. It was shown that with increasing
temperature, precipitates larger in size (from one micron to
10 microns), and more numerous, developed (Figures 35 and
36). It was also noted that with increased time and
temperature, some of the precipitates tended to form into
long lines, Figures 37 and 38. When samples that had been
pitted were viewed in the microscope, it was noted that
pitting almost always occurred at precipitates, and that the
aluminum surrounding the precipitate was corroded away,
Figure 39 and 40. However, pitting was not initiated at
every precipitate on the film, and seemed to occur more
often at larger precipitates.

71
FIGURE 35: SEM photo of an AI-W sample
heat treated at 200 C for one hour.
'01'
FIGURE 36: SEM photo of an AI-W sample
heat treated at 400 C for one hour.

72
"-- •Z7 "• • S .,_ , .. I--.' ,,i..
-I E H•
FIGURE 37: SEM photo of an AI-W sample
heat treated at 400 C for twelve hours.
FIGURE 38: SEM photo of an AI-Ta sample
heat treated at 400 C for one hour.

! IT SLO P73
FIGURE 39: SEM photo of a pitted region
on a thin film. The brightness is caused by
charging on the glass slide.
FIGURE 40: The same pitted region, however
the precipitate can be seen in the center of
the pit.

74
The spray formed samples were also characterized in the
scanning electron microscope before and after polarization.
Before polarization, large precipitates of approximately one
to five microns could be seen in the material. After
polarization and the initiation of pitting, it was noted
that the attack occurred in the region around the
precipitates, Figures 41 and 42.

t 11 , ,
FIGURE 41: SEM photo of a precipitate on
the surface of the spray formed sample. The
photo was taken after the initiation of pitting.
: ._. . , ]
NN,/4-
S~F1 L81
5.OKU X2,500 5• 18m WD12>MONI A
FIGURE 42: The inverse of the same image
clearly shows the precipitate in the center of a
corroded region.
76
CONCLUSIONS
Based upon the data collected and microstructure
characterization presented above, the following conclusions
can be drawn:
1. Conventional aluminum alloys show very little, if any,
increase in their pitting potential over pure aluminum.
2. Spray forming, a rapid solidification process, did not
trap the tungsten or tantalum in a supersaturated solid
solution.
3. Neither the spray formed Al-l.Owt% Ta nor the spray
formed Al-l.Owt% W showed any improvement in pitting
potential over pure aluminum.
4. Pitting attack appeared to be concentrated around the
large precipitates in the two spray formed materials.
5. The "as processed" Ai-8wt% Ta and Al-llwt% W
demonstrated large increases, as much as 790 my, in
pitting potential as compared to pure aluminum or
conventional aluminum alloys.
6. Heat treatments caused the pitting potential to
decrease for both sputter deposited materials.
Increasing the temperature caused a relatively larger
decrease in pitting potential, as well as increasing
the amount of time of the heat treatment. Elevated
temperature did not totally destroy the corrosion

77
properties of the material, however, and even after
12 hours, the pitting potential was not reduced to
that of pure aluminum.
7. Scanning electron microscopy showed that the "as
processed" sputtered specimens were generally free of
precipitates and were composed of a uniform surface
with some surface texture. Once the samples were
subject to heat treatments at 2000 C for even 30
minutes, precipitate growth was noted.
8. For increased temperature, the precipitates became more
abundant, and increased in size. Likewise, with
increasing amounts of time, the precipitates were more
numerous and larger.
9. After pitting was initiated, the attack was observed to
be around the precipitates in the material. However,
attack was not observed around every precipitate.
10. Potentiostatic holds for 24 hours at -550 mV
showed anodic currents, or corrosion, for both the
samples that were heat treated at 4000 C for three
hours and the unheat treated Al-Ta and AI-W samples.
Both of the Al-Ta films, heat treated and unheat
treated were completely removed from the substrate.
The Al-W samples showed some pitting, but remained
intact. Holds done at -700 mV on unheat treated
samples, two of each alloy, showed similar results.
Experiments done at The Johns Hopkins University have

78
shown some mechanical damage to these alloys during
potentiostatic experiments, and could be the cause of
the pitting. However, these experiments are
inconclusive at this time.

79
ACKNOWLEDGEMENTS
I would like to gratefully acknowledge Professor
Patrick J. Moran for his continual guidance and help during
this project. I would like to thank R. Scott Lillard and
Christopher Streinz for their help in the production of the
sputter deposited samples, and their continual advice
throughout the project. I would also like to thank
laboratory technicians, John Hien, Robert Woody, and Louise
Bechnel for their help in the mechanics of the project.
Furthermore, I would like to acknowledge Professor Joseph F.
Lomax and the Chemistry department for help in doing the
initial heat treatments on the sputter deposited samples.
I would also like to thank Dr. Angela Moran at the David
Taylor Research Center for supplying the spray formed
samples.

80
REFERENCES
1. Callister, W.D., "Materials Science and Engineering."John Wiley and Sons, Inc. New York, New York. 1991.
2. Cote, G.O., Davis, G.D., Fritz, T.L., Moshier, W.C.,"Evolution of the Chemistry of Passive Films ofSputtered-Deposited, Supersaturated Al Alloys." MartinMarietta Laboratories Technical Report 89-12c, January1989.
3. Davis, G.D., Fritz, T.L., Moshier, W.C., Rees, B.J.,Shaw, B.A., "A Study of the Influence of AlloyingAdditions on the Passivity of Aluminum." MartinMarietta Laboratories Technical Report 91-10c, March 1,1991.
4. Davis, G.D., Fritz, T.L., Shaw, B.A., "A Study of theInfluence of Alloying Additions on the Passivity ofAluminum." Martin Marietta Laboratories TechnicalReport 90-28c, February 1990.
5. Davis, G.D., Fritz, T.L., Moshier, W.C., Rees, B.J.,Shaw, B.A., "The Influence of Tungsten AlloyingAdditions on the Passivity of Aluminum." 1991-1992.
6. Hubler, G.K., Kant, R.A., McCafferty, E., Moore, P.G.,Natishan, P.M., Sartwell, B.D., "Naval ResearchLaboratory Surface Modification Program: Ion Beam andLaser Processing of Metal Surfaces for ImprovedCorrosion Resistance." Naval Research Laboratory, May5, 1986.
7. Hubler, G.K., McCafferty, E., Natishan, P.M., "SurfaceCharge C•,itidcarions in the Pitting of Ion-ImplantedAluminum." Naval Research Laboratory, February, 1988.
8. Janik-Czachor, M., Tlompson, G.E., Wood, G.C.,"Assessment of the Process Leading to Pit Nicleation."
9. Kruger, J., "Passivily of Metals - A Materials SciencePerspective." The Institute of Metals and ASMInternational, 1988.
10. Lavernia, E.J., "Spray Atomization and Deposition:Ceramic Particle Injection and Experiments With A!-Ta,And Al-W." Materials Science and EngineeringDepartment of Mechanical and Aerospace EngineeringUniversity of California, December 5, 1991.

81
11. Mondelfo, L.F., "Aluminum Alloys Structures andProperties." Butterworths. Boston, Mass. 1976.
12. Booklet from, "Electrochemical Techniques in CorrosionEngineering", Short Course University of Virginia,1991.