a trend analysis of npas of banks in india fo r 2008-2018
TRANSCRIPT

23
Business Analyst, ISSN 0973 - 211X, 41(1), 23-53, ©SRCC
A TREND ANALYSIS OF NPAS OF BANKS IN INDIA FO
2008-2018
Amit Kumar Singh and Renuka Prasad
ABSTRACT
Non-Performing Assets (NPAs) are one of the indicators indicating the performance
of banks in India. As Indian Financial system is banking dominated, its health
reflects the health of the economy. This paper discusses the Gross NPA, Gross
Advances and thus the Asset Quality of Public Sector banks, Private Sector banks
and Foreign banks from 2008-2018. The objectives of the paper are to analyse the
trends in banking sector, highlight individual banks and understand few dynamics.
The data is mainly secondary in nature collected from the RBI website. The study
finds that Public Sector banks have deteriorating performance than other banks in
the period. The asset quality deteriorated to 11.2% in 2018 as highest peak.It also
found that there exists positive relation of Gross NPA ratioamong PSB, PV and FB.
Also there was significant difference in the Gross NPA (in amount) and Gross NPA
ratio of different structure of banks measured by ANOVA. PSB advances are less
affected by Gross NPA as compared to others.
Keywords: Non Performing Assets, Asset Quality, Gross Advances and Gross NPA,
Public Sector Banks, Private Sector Banks and Foreign Banks
INTRODUCTION
The basic function of banks to accept deposits and give out loans on the basis of trust
makes it vulnerable to various risks. One such risk is credit risk which is risk of non-
R
* **
*Associate Professor, Department of Commerce, Delhi School of Economics, University of Delhi,
Delhi, Email: [email protected]**
Research Scholar, Department of Commerce, Delhi School of Economics, University of Delhi, Delhi,
Email: [email protected]

24
repayment of loans in the form of principal or loans.After the implementation of
Liberalisation, Privatisation and Globalisation (LPG) in the Indian Economy in th1991, a committee under Maidavolu Narasimham (13 Governor of the RBI) was
formed to look into all aspects of the financial system in India, popularly known as
Finance Sector reforms. The committee recommended various measures to improve
and strengthen the banking system. The recommendations ranged from
consolidation of banks to de regulation of interest rates to setting up of Asset
Reconstruction Companies to deal with the problems relating to mounting NPAs.
From then series of measures has been undertaken by RBI to deal with mounting
problems of NPA. It varied from reducing the time period of NPA classification from
180 to 90 days to introduction of PCA to Special Mention accounts to IBC Code of
2016.
As per bis.org “There is no comparable internationally harmonised framework that 1
governs NPA measurement”. Every country follows different measures of
identifying NPA.
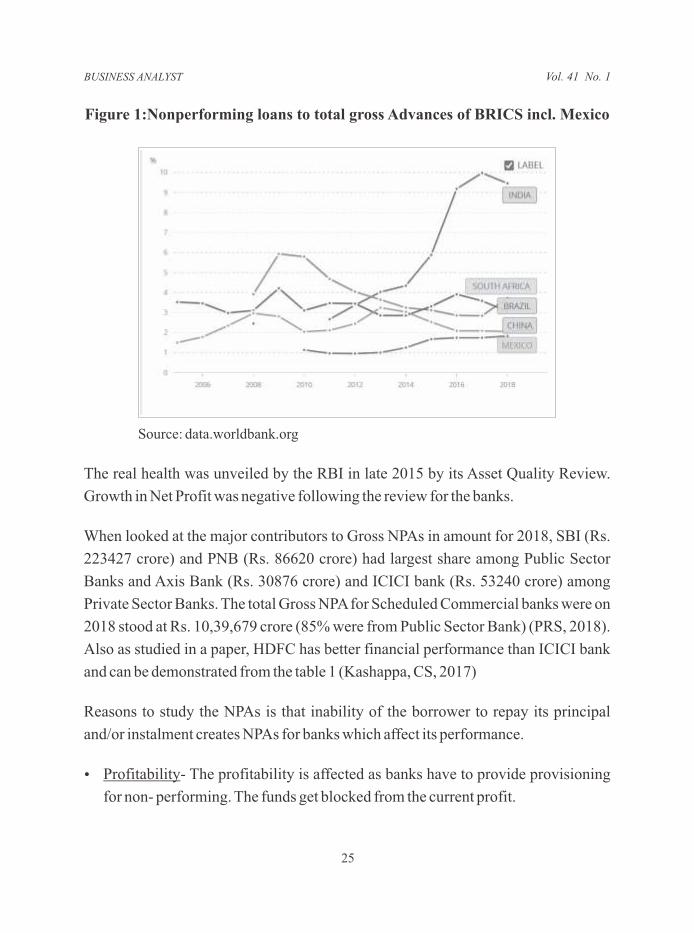
When comparing performance of India with respect to BRICS, India was worst
performer as indicated by the World Bank.
1
April 2018 retrieved on 04-04-2020
See: https://www.bis.org/fsi/publ/insights7.pdf published by Bank for International Settlements on
A TREND ANALYSIS OF NPAS OF BANKS IN INDIA FOR 2008-2018
BUSINESS ANALYST
25
Figure 1:Nonperforming loans to total gross Advances of BRICS incl. Mexico
Source: data.worldbank.org
The real health was unveiled by the RBI in late 2015 by its Asset Quality Review.
Growth in Net Profit was negative following the review for the banks.
When looked at the major contributors to Gross NPAs in amount for 2018, SBI (Rs.
223427 crore) and PNB (Rs. 86620 crore) had largest share among Public Sector
Banks and Axis Bank (Rs. 30876 crore) and ICICI bank (Rs. 53240 crore) among
Private Sector Banks. The total Gross NPA for Scheduled Commercial banks were on
2018 stood at Rs. 10,39,679 crore (85% were from Public Sector Bank) (PRS, 2018).
Also as studied in a paper, HDFC has better financial performance than ICICI bank
and can be demonstrated from the table 1 (Kashappa, CS, 2017)
Reasons to study the NPAs is that inability of the borrower to repay its principal
and/or instalment creates NPAs for banks which affect its performance.
Ÿ - The profitability is affected as banks have to provide provisioning
for non- performing. The funds get blocked from the current profit.
Profitability
Vol. 41 No. 1
26
Ÿ
pass on the deteriorated quality of assets to the borrowers in the form of high
lending rates resulting in increasing NIM.
Ÿ Management of NPAs: The management of NPAs burdens the banks. It requires
administrative burden, case filings, follow-ups, delayed recoveries, etc.
Ÿ Credit crunch: When banks have large NPAs, they are reluctant to lend in the
economy. This leads to credit crunch for the industries and ripple effect in the
economy.
Ÿ Negative outlook: When banks reports high Gross NPAs, it signals lower asset
quality of banks and thus affects share price of the banks. This leads to decrease in
shareholders wealth as pointed in some of the studies.
REVIEW OF LITERATURE
The importance of NPAs levels in India could be checked by looking at various
measures undertaken by the RBI and the government. Budget 2019 had Rs. 70000 crore
for capitalisation of banks in India. There have been ample of studies on the presence of
NPAs in banking sector. The studies range from determining the factors affecting NPA
levels in India to their management. They have been undertaken in relation to various
aspects of NPAs. Below are listed few areas where studies have been conducted.
Arunkumar and Koteshwar (2006) and Kadanda and Raj (2018)showed that
concentration risk is an important component of credit risk and are directly related to
higher NPAs in both public and private sector. Declining trend of NPAs can be
associated credit portfolio diversification.A report by (PWC, 2014) showed that
majority of the stressed assets in 2013 held with the banks were from Infrastructure
sector. Credit rating is highly regarded for getting loans from the banks. As banks can
develop their own credit rating model, ratings can be validated from that of the public
credit rating agencies. RBI (2020) in its report stated that the credit rating agencies
Monetary transmission- Banks with low NPAs or low gross NPAs ratio are able to
A TREND ANALYSIS OF NPAS OF BANKS IN INDIA FOR 2008-2018

BUSINESS ANALYST
27
were responding in lag with the asset turning bad. This showed their inefficiency in
timely reporting.
Many studies have been undertaken to study the determinants impacting the asset
quality or NPA of banks.
Bardhan and Mukherjee (2016) checked the time persistence of NPAs in the banking
structure for a period 17 years from 1995- 96 to 2011-12 of Indian banks with bank
specific factors.NPAs not written off previously as reflected on the balance sheet gets
piled up. Lagged profit or lower profit due to less repayment supports Bad
Management hypothesis (Berger and DeYoung (1997). Lagged bank size effect
(which showed that large banks may take risky decisions on the basis of past
performance of the loan whereas small banks could be efficient) was significantly
positive.Kadanda and Raj (2018) found high presence of NPAs in Public Sector
banks due to decreasing trend in profitability post recession and identified factors
affecting them such as past NPAs, theoperating efficiency of the bank, capital
adequacy, GDP growth rate, and interest rate. The result of lagged capital adequacy
ratio (Moral hazard hypothesis), lagged GDP positively related to GNPAs (bad
management hypothesis) and lagged operating ratio (Skimping Hypothesis)
(Hypotheses given by Berger and DeYoung); Kadanda (2019)found that Interest
coverage ratio (ICR) of firms was lower than the standard showing that the firms
were weak and vulnerable to distress post GFC. Plus, ICR and debt at risk is higher
and increasing indicating possibility of default and poor asset quality. Profitability as
measured by Return on Assets (ROA) was declining since GFC causing trouble to the
asset quality of the banks.
Kaur Bawa, Goyal, Mitra & Basu (2019) conducted analysis of performance of
banks in India using 31 financial ratios for 2007-2014 i.e. for 8 years. One of the
findings include that bank intermediation cost was negatively related to NPAs.
Financial Intermediation cost is “cost is the total operating expenses for a bank as it
represents the total cost involved for lending. This ratio is calculated using the total
operating expenses to total assets
Vol. 41 No. 1

28
NPAs studied in different aspects and its management:
Swain and Das (2019)analysed relationship between NPAs and profitability of banks
using correlation and regression and found positive relation between NPAs and
profitability for PSB, negative relation for PVB and Foreign banks from 2011 to
2015. Whereas Bhanumurthy and Gupta (2015)in their paper showed that Off
balance sheet items have severely affected profitability of banks as compared to
NPAs from 1998-2007. They also stated that foreign banks are at the high risk level
due to exposure to off balance sheet items.Following this RBI (2016) researched
thatNPA creates hindrances to monetary rate transmission or policy rate changes as
initiated by it, period April 2010- June 2017.They found that when GNPAs are high
and rising, banks did not lent aggressively and could not protect their NIM in the
competitive environment (banks are not responsive to rate cuts).
Agarwala (2019)studied the period from 2010-2017 of the Indian banking system. It
found that DCB had better performance than Axis bank whereas Andhra Bank,
Punjab and Sindh bank and IDBI banks low performance than Vijaya bank and Bank
of Maharashtra in terms of growth in NPAs.
Gupta and Dharwal (2017)conducted a study on recovery of NPAs in Public sector
banks in the period 2001-02 to 2012-13. The study revealed that SARFAESI Act
2002 was more effective initiative than Debt Recovery Tribunal and Lok Adalats as
the percentage of recovery was significant; Economic Survey (2020) suggested PSB
to use big data, machine learning and Artificial Intelligence for loan disbursements
similar to GSTN. This way every large investment can be properly screened and
continuously monitored. The collateralised assets can be geo tagged (GPS enabled)
to help lenders track the location of the assets. AI-machine learning can be developed
for credit rating of corporate (doing way with internal rating system of banks)
Meher et.al(2020) tried capturing opinions of bankers. Most of the bankers favoured
wilful defaulters, government schemes and weak project appraisal as major
contributor to NPAs. Bankers used Preventive measures less frequently due to
A TREND ANALYSIS OF NPAS OF BANKS IN INDIA FOR 2008-2018
BUSINESS ANALYST
29
structural problems.
Objectives, Research Methodology and Hypotheses
The objectives of undertaking the current study are listed below:
Ÿ To determine the trends of Asset Quality of public sector, private sector and
foreign banks in India
Ÿ To bring into light the individual banks in PSBs and PVBs sectors contributing to
high NPA
Ÿ To study the dynamics of asset quality among banks
The study is undertaken to analyse the Gross NPAs and Gross Advances of banks in
India to check the trend. The study covers ten years from 2008 to 2018. The period is
post Financial Crisis and includes Asset quality review and Insolvency and
Bankruptcy Code 2016. In totality PSB, PVB and Foreign Banks. Individually, SBI
& its associates, Nationalised banks, new private sector and Old Private Sector banks
are taken. The sample is taken from 44 banks. Gross NPAs and Gross Advances have
been used as variables. The data is primarily secondary in nature collected from the
RBI. It includes Trends & Progress Reports, Handbook on Indian Economy,
Statistical tables and Financial Stability reports and other government websites.
Statistical tools such as Karl Pearson's Correlation Analysis and Simple Regression
and Descriptive Statistics are used.
Hypotheses: Following are the hypotheses formed to study, these are:
Ÿ Ho1 (Null Hypothesis): There is no significant difference in the Gross NPAs (Rs.
Crore) between different structures of banks (PSB, PVB and FB) in the study
period.
Ÿ Ho2: There is no significant difference in the GNPAs ratio (measure of asset
Vol. 41 No. 1

30
quality) of the different structures of banks (PSB, PVB and FB) in the study period
Data Analysis and Results
After the global financial crisis 2008-09, Indian banking system faced the brunt of it.
The growth in advances of banks started crumbling down due to liquidity issues i.e.
advances were increasing at a decreasing rate. After 2011, growth rate in GNPAs
crossed the growth rate in advances deteriorating the asset quality of the
banks.(Figure 2 and Figure 3)
Figure 2: Growth rates of GNPAs and Advances of SCB
Source: dbie.rbi.org.in
Figure 3: GNPAs ratio of all Scheduled Commercial Banks
Source: dbie.rbi.org.in
0.0%
20.0%
40.0%
60.0%
80.0%
100.0%
2009 2010 2011 2012 2013 2014 2015 2016 2017 2018
Growth in NPA
Growth in advances
2.3% 2.3% 2.5% 2.4% 2.9% 3.2% 3.8% 4.3%
7.5%
9.3%11.2%
0.0%
2.0%
4.0%
6.0%
8.0%
10.0%
12.0%
2008 2009 2010 2011 2012 2013 2014 2015 2016 2017 2018
A TREND ANALYSIS OF NPAS OF BANKS IN INDIA FOR 2008-2018

31
BUSINESS ANALYST
Figures 4 and 5shows the Gross advances as a percentage of Gross loans of
Scheduled Commercial Banks and Gross NPAs as a percentage of Gross NPAs of
Scheduled Commercial Banks
Figure 4: Gross Advances of PSBs, PVBs and Foreign Banks in India
Source: dbie.rbi.org.in and Trend & Progress Reports
The major lender of credit in the economy remains Public Sector Banks followed by
Private Sector and Foreign Banks. According to the IMF Staff Country Report of
December 2019, PSBs account for 61% of the banking system's assets. The Banking
assets for the Indian Economy stood at US$ 1,350.29 billion.
The proportion of advances of PSBs has been highest in 2010 at 77.23% and
thereafter there has been continuous decline every year. The GNPAs are shooting
every year with highest in 2016 at 86.48%.Contrast to this, PVB's advances after a
decline in 2014, is increasing rapidly. This is accompanied by declining GNPAs in
Total GNPAs reflecting healthy position of PVBs
72.66 75.49 77.23 77.07 76.37 76.36 75.86 74.29 71.25 69.20 66.28
25.45 23.33 22.56 22.79 23.76 23.8519.78 21.26 24.14 26.74 29.42
6.42 5.49 5.91 4.83 4.88 4.36 4.36 4.45 4.61 4.05 3.92
0.00
10.00
20.00
30.00
40.00
50.00
60.00
70.00
80.00
90.00
2008 2009 2010 2011 2012 2013 2014 2015 2016 2017 2018Gross Advances
PSB
PVB
Foreign
Vol. 41 No. 1

32
Figure 5: Gross NPAs of Public Sector, Private Sector and Foreign Banks in
India
Source: dbie.rbi.org.in and Trend & Progress Reports
When inspected further to find which banks under PSBs and PVBs contributed the
most to the GNPAs and Gross Advances, we have-
Table 1: Gross NPA of Top three banks contributing highest GNPAs in
amount in Rs. crores
Source: dbie.rbi.org
State Bank of India has remained the highest contributor to the Gross GNPAs
followed by Punjab National bank and ICICI Bank Ltd. This indicated larger share of
lending to the riskier projects by the PSB.
71.7365.67
70.1375.61
82.10 85.31 86.39 86.22 88.28 86.48 86.15
27.21 28.33 25.58 22.9016.36 13.23
9.16 10.41 9.12 11.77 12.445.30
10.30 8.69 5.32 4.53 4.10 4.37 3.31 2.57 1.72 1.330.00
10.00
20.00
30.00
40.00
50.00
60.00
70.00
80.00
90.00
100.00
2008 2009 2010 2011 2012 2013 2014 2015 2016 2017 2018
Gross NPA
PSB
PVB
Foreign
Year 2008 2009 2010 2011 2012 2013 2014 2015 2016 2017 2018
SBI 12837 16346 17836 23074 37156 51189 61605 56725 98173 112343 223427
PNB 3319 2767 3214 4379 8690 13466 18880 55818 55370 86620
ICICI 7580 9649 9267 9816 9293 9608 10506 26221 42159 53240
25695
15095
A TREND ANALYSIS OF NPAS OF BANKS IN INDIA FOR 2008-2018

33
BUSINESS ANALYST
Asset Quality
An attempt is made to study Asset quality of various banks in the bank wise segment.
Asset can be defined as the quality of loan portfolios of the banks (loans and
advances being the majority of the assets of the banks). It is used to assess the credit
risk of the portfolio. The risk involves non repayment of interest on loans and
investments and principal repayment.
Figure 6: GNPAs ratio of banks in India in comparison to SCB
Source: dbie.rbi.org & Trends and Progress Reports
The above figure 6 shows GNPA ratio bank wise over the period of 10 years. Initially,
the GNPA ratio was constant for Public Sector banks whereas Private sector had high
GNPA. The deterioration of asset quality worsened for foreign banks for the period
2008-2011 (it rose to 4.3% in 2009) as foreign banks saw tremendous growth in
GNPAs in 2009 (figure 9). Later it converged with other banks in 2011 when growth
in GNPAs was negative and growth in advances was falling (figure 9).Asset quality
started deteriorating for PSBs which rose from 2.3% in 2011 when growth in GNPAs
and Advances was almost constant to 4.7% in 2018 while advances were declining.
The GNPAs spiked in 2016 at 93.9% when advances were continuously falling
(figure 7).
The trend for private sector was different where growth in GNPAs was lower than the
0.0
2.0
4.0
6.0
8.0
10.0
12.0
14.0
16.0
2008 2009 2010 2011 2012 2013 2014 2015 2016 2017 2018
PSB
PVB
Foreign
SCB
Vol. 41 No. 1

34
growth in advances till 2015. After 2015, growth in GNPAs was higher than the growth
in Advances. Private Sector banks took dip in the ratio and was minimum of all from
2011 (2.4% in 2011)till 2017 (4.1% 2017) and then started increasing. In the mean time
foreign banks were worse than PVBsand only after 2017 it improved (figure 8).
Figure 7: Growth in GNPAs and Advances of PSBs
Figure 8: Growth in GNPAs and Gross Advances of PVBs
Figure 9: Growth in GNPAs and Advances of Foreign Banks
Source: Own Computation from data retrieved from dbie.rbi.org and other reports
0.0%20.0%40.0%60.0%80.0%
100.0%
2009
2010
2011
2012
2013
2014
2015
2016
2017
2018
Growth in gnpa
Growth in advances
-20.0%
0.0%
20.0%
40.0%
60.0%
80.0%
2009
2010
2011
2012
2013
2014
2015
2016
2017
2018
Growth in gnpa
Growth in advances
-50%
0%
50%
100%
150%
2009
2010
2011
2012
2013
2014
2015
2016
2017
2018
Growth in gnpa
Growth in advances
A TREND ANALYSIS OF NPAS OF BANKS IN INDIA FOR 2008-2018

35
On analysing individual banks of PSBs and PVBs we get the following table for
different years for banks which have the highest GNPA ratio in the category.
Table 2: Year wise highest Gross NPAs ratio of PSB and PVB
Source: dbie.rbi.org
Year PSBs GNPA ratio PVBG NPA ratio
2008 Central Bank of India 3.16% RBL Bank 6.00%
2009 State Bank of India 2.98% DCB Bank Ltd. 8.78%
2010 Indian Overseas Bank 4.71% DCB Bank Ltd. 8.69%
2011 State Bank of India 3.48% DCB Bank Ltd. 5.86%
2012 State Bank of India 4.90% ICICI 4.83%
2013 UCO Bank 5.42% Lakshmi Vilas 3.87%
2014 United Bank of India 10.47% Lakshmi Vilas 4.19%
2015 United Bank of India 9.49% J&K Bank 5.97%
2016 Indian Overseas Bank 17.40% J&K Bank 8.32%
2017 State Bank of Mysore 25.68% J&K Bank 11.20%
2018 IDBI Bank 27.95% Lakshmi Vilas 9.98%
BUSINESS ANALYST Vol. 41 No. 1

36
An analysis of the above table is as follows-
Table 3: Highest Gross NPA ratio
PSB
Ÿ IDBI in 2018: It has the highest ratio among all the years, a GNPA ratio of 28% in 2018 showing its deteriorating condition.
Ÿ IDBI was already in the troubled condition due to its reckless lending.
Ÿ It was put under PCA by RBI and later in 2019 taken over by the LIC India and now is treated as Private Bank.
Ÿ State Bank of Mysore: It had highest GNPA ratio in 2017 at 25.68%.
Ÿ This bank was merged with State Bank of India in 2018.
Ÿ Indian Overseas Bank: The performance of Indian Overseas at 17.40% in 2016 reflects the Asset Quality Review exercise.
Ÿ The loans given by this bank was mainly to small and large
2companies.
Ÿ These loans had high credit risk
PVB
Ÿ Lakshmi Vilas bank in 2018: had 9.98% GNPA ratio in 2018.
Ÿ The bank had reduced the growth rate in its lending whereas it NPA shoot up after 2016 due to Asset quality review.
Ÿ Therefore, they had to provision more for that rise
Ÿ J&K bank had 11.20% of Gross NPA ratio in 2017.
Ÿ The reason attributed to this high percentage is the huge corporate loans, delay in r e c o v e r i e s a n d p o o r management.
Ÿ DCB Bank Ltd.: DCB Bank ltd. in 2009 had 8.9% of assets as deteriorated assets which was highest among all other Private Banks.
Ÿ DCB was highly dependent on Unsecured Personal loans till 2010
Hig
hes
t G
ross
NP
A r
atio
in
th
e ta
ble
2See: https://www.firstpost.com/business/indian-overseas-bank-npa-at-20-will-govt-burn-a-hole-in-taxpayers-
pockets-again-2946228.html written by Dinesh Unnikrishnan dated 10-08-2016 retrieved on 08-04-2020
A TREND ANALYSIS OF NPAS OF BANKS IN INDIA FOR 2008-2018

37
BUSINESS ANALYST
Table 4: Lowest Gross NPA ratio
Source: Various news reports
Private Sector banks have performed well in comparison to Public Sector in
maintaining their Asset quality.
PSB
Ÿ SBI : SBI had 3.48% in 2011 and in following years it performed satisfactorily.
Ÿ SBI merged with State Bank of Indore in 2010 which impacted its NPA in the next year.
Ÿ Central Bank of India had 3.16% as GNPA in 2008. It was the lowest among the PSBs.
Ÿ It was later put under PCA in 2017
Ÿ State Bank of India : It had the highest ratio at 2.98% as SBI merged with State Bank of Saurashtra, one of the associate banks in 2008.
Ÿ But when comparing it to later years it is one of the lowest
PVB
Ÿ ICICI Bank has lowest GNPA ratio of 4.83% in 2012
Ÿ Lakshmi Vilas bank : In 2014, GNPA rose at 18.8% and Advances grew at 9.63%.
Ÿ The Gross NPA ratio was 4.19%
Ÿ T h e b a n k f o l l o w e d restructuring of many loans.
Ÿ Lakshmi Vilas Bank : In 2013, Gross NPA grew at 49.48% and Gross Advances grew at 15.14%
Ÿ The Gross NPA ratio was 3.87%
Low
est
Gro
ss N
PA
rat
io i
n t
he
tab
le
Vol. 41 No. 1

38
On analysing the descriptive statistics for the GNPAs ratio or Asset quality measured
in percentages, it can be seen that Public Sector Banks have the highest variability
among banks at 79% followed by Scheduled Commercial banks. The mean statistic
is higher for Public Sector banks (5.495%) and lowest for Private Sector Banks
(2.708%). The descriptive have been calculated for 10 years.
After analysing the descriptive statistics, individual bank wise analysis was made.
On Individual bank level, IDBI bank had the highest Coefficient of Variation for
GNPAs ratio of 118.7%. It had satisfactory growth in GNPAs whereas growth in
advances has been declining since 2016. IDBI was the troubled bank where
government made many efforts to revive but it fall short and finally was merged with
the LIC India. IDBI now is a private sector bank. According to the Public Accounts
Committee report "increasing gross NPAs and net NPA of IDBI Bank at Rs44,752
crore (21.25%) and Rs25,206 crore (13.21%), respectively as on March 2017
compared with gross NPA of Rs24875 crore (10.98%) and net NPA of Rs14,643
crore (6.78%) as on March 2016, are indeed alarming". This led IDBI fall into
Prompt Corrective Action of the RBI in 2016.
SBI recorded minimum variation in the mean value of GNPAs ratio 45.93%. The
GNPA ratio for SBI has been increasing consistently. It recorded highest variation in
growth in advances due to mergers with its associates that are State Bank of
Saurashtra (in 2009), State Bank of Indore (in 2011), State Bank of Mysore (in 2018),
State Bank of Patiala (in 2018) and State Bank of Travancore (in 2018) and Bhartiya
Mahila Bank (in 2018).
Following the same, Axis bank (New Private sector) and RBL bank (Old Private
sector) had highest CV for GNPA ratio at 95.9% and 92.7% respectively. RBL bank
hadincreasing asset quality prior to 2014 but after the asset quality started
deteriorating (in 2013, 2014, 2015 Gross NPA ratio was 0.40%, 0.79% and 0.77%
respectively). Keeping 2008 (6%) as base year, asset quality in 2018 was 14.32 times
of 2018 (1.40%). This was due to its exposure of loans toagriculture which were
A TREND ANALYSIS OF NPAS OF BANKS IN INDIA FOR 2008-2018
39
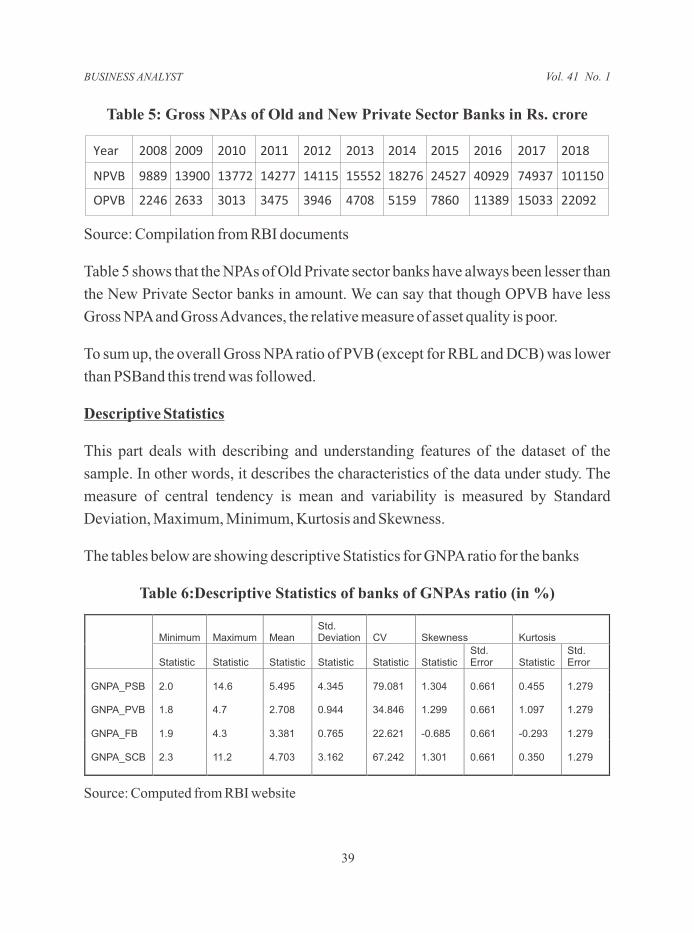
Table 5: Gross NPAs of Old and New Private Sector Banks in Rs. crore
Source: Compilation from RBI documents
Table 5 shows that the NPAs of Old Private sector banks have always been lesser than
the New Private Sector banks in amount. We can say that though OPVB have less
Gross NPA and Gross Advances, the relative measure of asset quality is poor.
To sum up, the overall Gross NPA ratio of PVB (except for RBL and DCB) was lower
than PSBand this trend was followed.
Descriptive Statistics
This part deals with describing and understanding features of the dataset of the
sample. In other words, it describes the characteristics of the data under study. The
measure of central tendency is mean and variability is measured by Standard
Deviation, Maximum, Minimum, Kurtosis and Skewness.
The tables below are showing descriptive Statistics for GNPA ratio for the banks
Table 6:Descriptive Statistics of banks of GNPAs ratio (in %)
Source: Computed from RBI website
Year 2008 2009 2010 2011 2012 2013 2014 2015 2016 2017 2018
NPVB 9889 13900 13772 14277 14115 15552 18276 24527 40929 74937 101150
OPVB 2246 2633 3013 3475 3946 4708 5159 7860 11389 15033 22092
Minimum Maximum MeanStd. Deviation CV Skewness Kurtosis
Statistic Statistic Statistic Statistic Statistic StatisticStd. Error Statistic
Std. Error
GNPA_PSB 2.0 14.6 5.495 4.345 79.081 1.304 0.661 0.455 1.279
GNPA_PVB 1.8 4.7 2.708 0.944 34.846 1.299 0.661 1.097 1.279
GNPA_FB 1.9 4.3 3.381 0.765 22.621 -0.685 0.661 -0.293 1.279
GNPA_SCB 2.3 11.2 4.703 3.162 67.242 1.301 0.661 0.350 1.279
BUSINESS ANALYST Vol. 41 No. 1

40
waived off. After 2014, the growth in advances started declining and growth in NPAs
started increasing.
Axis bank also had highest GNPAs ratio variability after RBL bank. The GNPA ratio
started increasing from 2013 and it spiked five times in 2017. The growth in advances
has been declining with relatively lower variation than others.
Similarly, HDFC bank has lowest variation in Asset quality of 29.8%. The GNPAs ratio
had been smooth throughout with marginal increase and decrease each year. It was the
highest in growth of advances with mean of 24% among other new private sector
Correlation Analysis
The correlation analysis is conducted to check correlation of PSBs, PVBs and
Foreign banks on the basis of GNPAs, Gross Advances, Growth of GNPAs and
Growth of Gross Advances.
Table 7: Correlation between Gross NPA and Gross Advances (Bank wise)
Source: Computed from RBI website
FB Gross NPA 0.84906 0.72323 1
SCB Gross NPA 0.99980 0.97507 0.84215 1
PSB Gross Advances 0.82801 0.70225 0.90495 0.81979 1
PVB Gross Advances 0.97329 0.91864 0.86919 0.97062 0.91918 1
FB Gross Advances 0.85550 0.72024 0.93875 0.84667 0.98216 0.92146 1
SCB Gross Advances 0.89091 0.78277 0.91720 0.88423 0.99214 0.95906 0.98418 1
PSB GrossNPA
PVB Gross NPA
FB Gross NPA
SCB Gross NPA
PSB Gross Advances
PVB Gross Advances
FB Gross Advances
SCB Gross Advances
PSB Gross NPA 1
PVB Gross NPA 0.97061 1
A TREND ANALYSIS OF NPAS OF BANKS IN INDIA FOR 2008-2018

41
BUSINESS ANALYST
The table 7 showing correlation between Advances and Gross Non-performing
assets shows that there exists positive relation between these two variables among all
the types of banks. Analysis of these correlations can help to find which type of bank
is highly inclined to GNPAs with respect to its advances.
There exists very strong correlation between SCB NPAs and PSB NPAs of 0.99980
as the share of Gross NPA of PSB was about 86% of the total Gross NPAs of SCB.
The correlation between PSB Gross NPA and PVB Gross NPA is 0.97061. This
shows the NPAs of both banks moved in the period 2008-2018 with the changes
introduced or prevailing financial climate in the economy. The correlation between
PSB Gross NPAs with its advances was 0.82801 lesser than with PVB advances of
0.97329. This can be mainly due to the decline in the advances of the PSB and small
increase in PVB advances in the economy leading to positive correlations.There
exists correlation of 0.8550 between PSB Gross NPAs and Foreign bank advances
and 0.89091 between PSB GNPA and SCB advances.
The correlation between PVB GNPAs and SCB GNPAs was 0.97507 because of
marginal increase in advances of PVBs after 2014. PVBs were 0.91864 correlate
with their advances meaning as advances increased, many among them may turn
NPAs. In total gross advances of SCBs, PVB GNPAs was correlated at 0.72024
showing better management of NPA than PSB.
The correlation between Gross NPAs of FB and SCB GNPA was 0.84215 because of
the small size of foreign banks in the Indian economy. The advances of FB were
highly correlated to its GNPAs as compared to PSB and PVB. There existed a
correlation of 0.86919 between FB NPA and PVB Gross advances, 0.90495 with
PSB Gross Advances and 0.91720 with SCB gross advances. FBs were also major
contributor of NPAs in India. Therefore, foreign banks GNPAs had high positive
correlation with SCB Gross Advances.
The correlation of Gross Advances of PSB and Gross Advances of PVB was
0.91918, with FB Advances was 0.98216 and with SCB advances was 0.99214.
Vol. 41 No. 1

42
Table 8: Correlation between Gross NPA ratio and growth in GNPAs
(Bank wise)
Source: Computed from RBI website
The table 8shows correlation between Gross NPA ratio and growth rate of Gross NPA
or correlation between Asset Quality and Growth rate of NPA of banks. The analysis
was made to see correlation and its degree between Asset qualities of a bank with the
growth in NPA of another bank. A positive and relatively lower correlation exists
between Gross NPA ratios (Asset quality) of bank with itsgrowth of Gross NPA.
There were positive correlations between Asset quality of PSB, PVB and FB. Strong
and positive correlation was between asset quality of PSB and SCB at 0.99952 and
between asset quality of PVB and SCB at 0.82783. Weak correlation existed between
asset quality of FB and SCB at 0.47784.
The correlation between Gross NPA ratio (asset quality) of PSB and growth in Gross
NPA of PSB was at 0.29313. This is because of Asset quality of PSB has been
declining throughout but growth in Gross NPAs has been rough with ups and downs.
The Gross NPA increased at a decreasing rate from 2012- 2015, spiked in 2016 and
started declining again. The correlation between PSB Gross NPA ratio and growth in
PSB GNPA PVB GNPA ratio
FB GNPA ratio
SCB GNPA ratio
PSB GNPA growth
PVB GNPA growth
FB GNPA growth
SCB GNPA growth
PSB GNPA ratio 1
PVB GNPA ratio 0.81815 1
FB GNPA ratio 0.45945 0.42459 1
SCB GNPA ratio 0.99952 0.82783 0.47784 1
PSB GNPA growth 0.29313 -0.10070 0.32456 0.28898 1
PVB GNPA growth 0.73826 0.60271 0.58038 0.74976 0.35963 1
FB GNPA growth -0.21802 -0.15056 0.52121 -0.20851 0.11729 0.04687 1
SCB GNPA growth 0.38341 -0.00726 0.48072 0.38214 0.96915 0.50381 0.27363 1
A TREND ANALYSIS OF NPAS OF BANKS IN INDIA FOR 2008-2018

43
BUSINESS ANALYST
Gross NPAs of PVB was 0.73826 and PSB asset quality stood negative to the growth
in Gross NPAs of FB at -0.21802. Also the Gross NPA ratio of PSB was weakly
correlated with SCB growth in Gross NPAs.
The correlation betweenGross NPA ratio (asset quality) of PVB and growth in its
Gross NPA was 0.60271. This shows moderate and highest correlation among other
banks. This implies that pattern can be seen in the movement of these two variables.
The correlation of Gross NPA ratio of PVB with growth in Gross NPA of PSB was
negative with -0.10070, with growth in Gross NPA of FB was -0.15056 and with
growth in Gross NPA of SCB was -0.00726. The Gross NPA ratio of PVB was weakly
correlated with Gross NPA ratio of FB at 0.42459.
The correlation of Gross NPA ratio of FB was weak at 0.32456 with growth in Gross
NPA of PSB. Similarly, it had weak correlation with growth in advances of PVB at
0.58038 and only 0.48072 with growth in advances of SCBs.
ANOVA Testing
In order to test Hypotheses 1 and 2 as stated earlier, One Way ANOVA testing is used.
One way ANOVA testing is used to check whether there is any difference between
the means of three or more independent groups.
Ÿ Ho1 (Null Hypothesis): There is no significant difference in the Gross NPA (Rs.
Crore) between different structures of banks (PSB, PVB and FB) in the study
period.
Ha1 (Alternate Hypothesis): There is significant difference in the Gross NPA (Rs.
Crore) between different structures of banks (PSB, PVB and FB) in the study
period.
k
i=1
Vol. 41 No. 1

44
Table 9: ANOVA test for Gross NPA in amount
*Significance level at 5% Source: Computed from RBI website
As can be observed from the table above, p < 0.05 i.e., 0.001212 < 0.05. As a result of
this null hypothesis stands rejected and alternate hypothesis is accepted. Therefore,
there exists significant difference between the different structures of banks with
respect to their Gross NPA.
Ÿ Ho2: There is no significant difference in the asset quality of the different
structures of banks (PSB, PVB and FB) in the study period
Ha2: There is significant difference in the asset quality of the different structures
of banks (PSB, PVB and FB) in the study period
Table10: ANOVA testing for Gross NPA/ Gross Advances
*Significance level at 5% Source: Computed from RBI website
As can be observed from the table, p < 0.05 i.e. 0.045657 < 0.5. As a result of this, null
hypothesis stands rejected and alternate hypothesis is accepted. Therefore, there
exists significant difference between the Gross NPA ratios between different
structures of the banks.
Source of Variation SS df MS F P-value* F crit
Between Groups 4.93264E+11 2 2.46632E+11 8.470345309 0.001212 3.31583
Within Groups 8.73513E+11 30 29117104485
Total 1.36678E+12 32
Source of Variation SS df MS F P-value* F crit
Between Groups 46.50742424 2 23.25371212 3.427106967 0.045657 3.31583
Within Groups 203.5569273 30 6.785230909
Total 250.0643515 32
A TREND ANALYSIS OF NPAS OF BANKS IN INDIA FOR 2008-2018

45
BUSINESS ANALYST
Regression Analysis
In order to gauge the relationship between Gross Advances and Gross NPAs of PSB, PVB
and FB, regression analysis is undertaken. For this, independent variable is taken as Gross
NPA and dependent variable is taken as Gross Advances for the period of 2008-2018.
Table 11: Regression Statistics for PSB, PVB and FB
Source: Computed from RBI website
From table 11, it can be observed that there is positive correlation between Gross
Advances and GrossNPA of PSB, PVB and FB. The highest correlation is for FB at
0.938 followed by PVB at 0.9186 and PSB at 0.828. The R square value of FB is 0.88
which is greater than 0.60 and can be considered as good model fit between the
variables. The R square for PVB is 0.843 which also indicates good fit model
between the variables. In comparison to FB and PVB, PSB has comparatively lower
R Square of 0.68 signifying that some advances are not dependent on the NPA or
shows good recovery mechanism in process. Therefore, PSB can be said to be better
manager of NPA.
CONCLUSION AND LIMITATION
The asset turning low in its quality is a result of many factors affecting the borrower
as well as the lender (banks). Majority of banks in India are Public Sector banks
Regression Statistics PSB PVB FB
Multiple R 0.828008342 0.918637604 0.938752222
R Square 0.685597814 0.843895047 0.881255734
Adjusted R Square 0.650664237 0.826550052 0.868061927
Standard Error 956383.0336 285948.8884 29770.39909
Observations 11 11 11
Vol. 41 No. 1

46
th(having 3/4 of the deposits) intended to do all the activities for the benefit of the
people. Sometimes this is politicised to gain from elections.When these high amount
loans turn bad wither intentionally or willfully, depositors start losing confidence in
the bank and this affects the reputation of the banks leading to decline in the deposits.
This leads to build up for crisis.
India does not have full developed bond market. As a result banks are left with high
risk projects particularly power, infrastructure, etc. During 2008-09 and before,
banks were involved in indiscriminate lending with less attention paid for the credit
appraisal of the loans going with global sentiments.Initially, there was sharp increase
in Gross NPA of banks with less growth in its advances. Later after 2009, there was
contrast in the movement of growth in Gross NPAs and Gross Advances. Gross NPAs
spurt up and credit growth started falling. For PSB in 2016, Gross NPA grew at 93%
whereas credit grew at 4%.The asset quality among banks is varied and differs from
each other. Foreign banks have decreasing trend in their growth in Gross NPA ratio.
After 2015, PVB have increasing trend in Gross NPAs ratio and PSB had increasing
trend in Gross NPA ratio throughout.
There is significant difference between the Gross NPAs and the Asset quality of
banks in India. When looking at Gross Advances and Gross NPAs relationship, PSB
have less effect on Gross Advances due to NPAs. This shows better management on
the part of PSBs. Whereas Gross advances of foreign banks are affected by its Gross
NPA. IBC has also made recoveries of NPA possible in timely manner.The increasing
trend in the Gross NPA is likely to continue i.e. asset quality would degrade all over
the banks. Every individual bank has growing Gross NPA ratio. Early warning
system, proper monitoring, effective screening of advances, training employees with
required skill sets in analysing as well as employing technology in the whole process
can act as preventive and corrective measures to control NPAs growth (Dhakappa,
2017). Insolvency and Bankruptcy Code 2016 is playing a major role in recovery of
assets within stipulated time. As of March 2018, Out of 701 cases registered 176
cases have been resolved from IBC (PRS, 2018). As the RBI cannot print notes
recklessly to recapitalise these institutions, the burden is on the government's
A TREND ANALYSIS OF NPAS OF BANKS IN INDIA FOR 2008-2018

47
BUSINESS ANALYST
expenditure or taxpayer's pocket. Governance and transparency should be increased
to increase efficiency in banks. The recapitalisation of PSBs will provide them with
some relief. Otherwise these banks are merged and acquired by large
bank.Development Finance Institutions (DFIs) could be set up with private equity to
lessen the burden on banks and bringing into full force of Bad banks
(Mukhopadhyay, 2018).
As every study has few limitations, so does this study has.The study undertaken
focuses on different aspects of Gross NPAs. Keeping all other factors affecting NPA
as constant, banks are studied in one dimension. The time period is 10 years only for
PSB and PVB banks.
While this study has attempted to study all aspects of GNPA, the horizon of the study
can be increased by including Net NPAs, Provisioning, Slippage Ratio, etc as well as
macroeconomic factors such as GDP, stock market, etc. The time period of the study
can be widened to study longer period to study new development in Covid times.
Agarwala, V., & Agarwala, N. (2019). A critical review of non-performing assets in
the Indian banking industry. Emerald .
Arunkumar, R., & Kotreshwar, G. (2006). Risk Management in Commercial Banks
(a Case Study of Public and Private Sector Banks). Indian Institute of Capital
Markets 9th Capital Markets Conference Paper .
Bank, L. V. (2014). Letter of Issue. sebi.gov.in.
bank, R. (2019). Disclosure under SEBI (Listing Obligations and Disclosure
Requirements) Regulations, 2015. ir.rblbank.com.
Bardhan, S., & Mukherjee, V. (2016). Bank-specific determinants of nonperforming
assets of Indian banks. International Economics and Economic Policy volume ,
483–498.
REFERENCES
Vol. 41 No. 1

48
Bhanumurthy, K., & Gupta, L. (2015). Risk and Return in banking industry in India:
Concept and measurement. The Indian Journal of Commerce , 53-63.
DCB. (2009-10). Banking in the neighbourhood (Annual Report 2009-10).
dcbbank.com.
Dhakappa, B. (2017, September 20). How to lessen NPA burden, and where the
shareholder comes in. The Hindu Thread . The Hindu.
Dhakappa, B. (2017, September 7). How to lessen NPA burden, and where the
shareholder comes in. The Hindu thread .
Dhananjaya, K. (2019). Corporate Distress and Non-performing Assets in India.
Sage Journal .
Fund, I. M. (2019). ndia : 2019 Article IV Consultation-Press Release; Staff Report;
Staff Statement and Statement by the Executive Director for India. IMF.
(2020). Golden Jubilee of Bank Nationalisation: Taking Stock. Economic Survey.
Gupta, L., & Dharwal, M. (2017). A Comparative Evaluation of NPAs Recovery
Mechanisms by Public Sector Banks in India. Journal of Finance and Accounting .
IBEF. (2020). Indian Banking Industry Report. ibef.org.
IMF, Global Stability Report. World Bank Group.
John, J., Mitra, A., Raj, J., & Prasad Rath, D. (2016). Asset Quality and Monetary
Transmission in India. RBI Occasional papers.
Kadanda, D., & Raj, K. (2018). Non-performing assets (NPAs) and its determinants:
a study of Indian public sector banks. Journal of Social and Economic Development
volume , 193–212.
Kashappa, L., & CS, B. (2017). Comparative Performance Analysis of the ICICI
Bank and the HDFC Bank. The Indian Journal of Commerce , 58-64.
A TREND ANALYSIS OF NPAS OF BANKS IN INDIA FOR 2008-2018

49
BUSINESS ANALYST
Kaur Bawa, J., Goyal, V., Mitra, S., & Basu, S. (2019). An analysis of NPAs of Indian
banks: Using a comprehensive framework of 31 financial ratios. IIMB Management
review , 51-62.
Kumar Meher, B., Puntambekar, G., Thonse Hawaldar, I., Spulbar, C., Birau, R., &
Rebegea, C. (2020). An Effectiveness Assessment of Preventive Management
Strategies in order to Manage Non Performing Assets in Indian banks: A Case Study.
Scientific Annals of Economics and Business , 235-258.
Mukhopadhyay, A. (2018). Finding innovative solutions to India's NPA woes. ORF
Issue Brief .
paul, A. (2018, September 13). PRS India. Retrieved February 1, 2020, from
www.prsindia.org/content/examining-rise-non-performing-assets-india
PWC. (2014). Growing NPAs in banks Efficacy of credit rating agencies.
Rajan, R. G. (2018, September 12). The Indian Express. Retrieved December 2019,
from https://indianexpress.com/article/explained/raghuram-rajan-bad-loans-npa-
indian-banking-system-economy-5351347/
RBI. (December, 2019). 20th Financial Stability Report . RBI.
RBI. (2020). Efficacy of Credit Ratings in Assessing Asset Quality: An Analysis of
Large Borrowers. RBI.
RBI. (Various year). Trends and Progress Report. RBI.
Saha, M. (2016, July 17). The Hindu. Retrieved March 2020, from
https://www.thehindu.com/business/Industry/Asset-Quality-Review-and-its-
impact-on-banks/article14494282.ece
Swain, R. K., & Das, C. P. (2019). Nonperforming Assets and its Impact on Financial
Performance: A Study on Indian Banking Sector. The Indian Journal of Commerce ,
166-176.
Vol. 41 No. 1

50
Appendix
Asset quality of Public Sector Banks
Source: Computed from the data retrieved from dbie.rbi.org.in
*IDBI Bank Limited has been re-categorised as Private sector bank with effect from January 21, 2019
PUBLIC SECTOR BANKS
Year
SBI&Associates Nationalised banks
SBB
J
SBH
SBI
SBM
SBP
SBT
Alla
hab
ad B
ank
An
dh
ra B
ank
Ban
k o
f B
aro
da
Ban
k o
f In
dia
Ban
k o
f M
ahar
ash
tra
Can
ara
Ban
k
CEN
TRA
L B
AN
K O
F
IND
IA
CO
RP
OR
ATI
ON
BA
NK
DEN
A B
AN
K
IDB
I BA
NK
LIM
ITED
*
IND
IAN
BA
NK
IN
DIA
N O
VER
SEA
S B
AN
K
OR
IEN
TAL
BA
NK
OF
CO
MM
ERC
E
PU
NJA
B A
ND
SIN
D
BA
NK
PU
NJA
B N
ATIO
NA
L B
AN
K
SYN
DIC
ATE
BA
NK
UC
O B
AN
K
UN
ION
BA
NK
OF
IND
IAU
NIT
ED B
AN
K O
F
IND
IAV
IJA
YA B
AN
K
20
08
1.7
%
0.9
%
3.0
4%
1.7
%
1.4
%
2.0
%
2.0
%
1.1
%
1.8
%
1.7
%
2.6
%
1.3
%
3.2
%
1.5
%
2.5
%
1.9
%
1
.2%
1
.6%
2
.3%
0
.7%
2
.7%
2.7
%
3.0
%
2.2
%
2.7
%
1.6
%
20
09
1.6
%
1.1
%
2.9
8%
1.4
%
1.3
%
1.7
%
1.8
%
0.8
%
1.3
%
1.7
%
2.3
%
1.6
%
2.7
%
1.1
%
2.1
%
1.4
%
0
.9%
2
.5%
1
.5%
0
.7%
1
.8%
1.9
%
2.2
%
2.0
%
2.9
%
1.9
%
20
10
1.7
%
1.2
%
3.2
8%
2.0
%
2.1
%
1.7
%
1.7
%
0.9
%
1.6
%
3.3
%
3.0
%
1.5
%
2.3
%
1.0
%
1.8
%
1.5
%
0
.8%
4
.7%
1
.7%
0
.6%
1
.7%
2.4
%
2.1
%
2.3
%
3.2
%
2.4
%
20
11
2.0
%
1.8
%
3.4
8%
2.5
%
2.6
%
1.8
%
1.8
%
1.4
%
1.6
%
2.6
%
2.5
%
1.5
%
1.8
%
0.9
%
1.9
%
1.8
%
1
.0%
2
.7%
2
.0%
1
.0%
1
.8%
2.7
%
3.3
%
2.4
%
2.5
%
2.6
%
20
12
3.3
%
2.6
%
4.9
0%
3.7
%
2.9
%
2.7
%
1.9
%
2.1
%
1.9
%
2.9
%
2.3
%
1.7
%
4.8
%
1.3
% 1
.7%
2.6
% 1
.9%
2.8
% 3
.2%
1.6
% 3
.1%
2.7
%
3.7
%
3.2
%
3.4
%
2.9
%
20
13
3.6
%
3.5
%
4.7
5%
4.5
%
3.3
%
2.6
%
3.9
%
3.7
%
2.4
%
3.0
%
1.5
%
2.6
%
4.8
%
1.7
%
2.2
%
3.2
%
3
.3%
4
.0%
3
.2%
3
.0%
4
.3%
2.0
%
5.4
%
3.0
%
4.3
%
2.2
%
20
14
4.2
%
5.9
%
4.9
5%
5.5
%
4.8
%
4.3
%
5.7
%
5.3
%
2.9
%
3.2
%
3.2
% 2
.5%
6.3
% 3
.4%
3.3
% 4
.9%
3.7
%
5.0
%
4.0
%
4.4
%
5.2
%
2.6
%
4.3
%
4.1
%
10
.5%
2.4
%
20
15
4.1
%
4.6
%
4.2
5%
4.0
%
5.4
%
3.4
%
5.5
%
5.3
%
3.7
%
5.4
%
6.3
%
3.9
%
6.1
%
4.8
%
5.4
%
5.9
%
4
.4%
8
.3%
5
.2%
4
.8%
6
.5%
3.1
%
6.8
%
5.0
%
9.5
%
2.8
%
20
16
4.6
%
5.8
%
6.5
0%
6.6
%
7.9
%
4.8
%
9.8
%
8.4
%
10
.0%
13
.1%
9.3
%
9.4
%
11
.9%
10
.0%
1
0.0
%
11
.0%
6
.7%
1
7.4
%
9
.6%
6
.5%
1
2.9
%
6.7
%
16
.1%
8.7
%
13
.3%
6.6
4%
20
17
15
.5%
20
.8%
6.9
0%
25
.7%
23
.1%
16
.8%
13
.1%
12
.3%
10
.5%
13
.2%
16
.9%
9.6
%
17
.8%
11
.7%
1
6.3
%
21
.2%
7
.5%
2
2.4
%
1
3.7
%
1
0.5
%
1
2.5
%
8.5
%
17
.1%
11
.2%
15
.5%
6.5
9%
20
18
5.0
%
5.6
%
10
.91
%
6.1
%
6.3
%
4.4
%
16
.0%
17
.1%
12
.3%
16
.6%
19
.5%
11
.8%
21
.5%
17
.4%
22
.0%
28
.0%
7.4
%
25
.3%
17
.6%
11
.2%
18
.4%
11
.5%
24
.6%
15
.7%
24
.1%
6.3
4%
A TREND ANALYSIS OF NPAS OF BANKS IN INDIA FOR 2008-2018

51
BUSINESS ANALYST
Asset quality of Private Sector Banks
Source: Computed from the data retrieved from dbie.rbi.org.in
Private Sector Banks
Year New Private Sector Banks Old Private Sector Banks
Axi
s B
ank
Ltd
.
DC
B B
ank
Ltd
.
HD
FC B
ank
Ltd
.
ICIC
I Ban
k Lt
d.
Ind
usI
nd
Ban
k Lt
d.
Ko
tak
Mah
ind
ra B
ank
Ltd
.
Yes
Ban
k Lt
d.
Cat
ho
lic S
yria
n B
ank
Ltd
.C
ity
Ban
k U
nio
n L
td.
Fed
eral
Ban
k Lt
d.
Jam
mu
& K
ash
mir
Ban
k Lt
d.
Kar
nat
aka
Ban
k Lt
d.
Kar
uru
Vys
ya B
ank
Ltd
.
Laks
hm
i Vila
s B
ank
Ltd
.
Nai
nit
al B
ank
Ltd
.
RB
L B
ank
Ltd
.
Sou
th In
dia
n B
ank
Ltd
.
Tam
ilnad
Mer
can
tile
B
ank
Ltd
.
2008
0.81
%
1.53
%
1.41
%
3.30
%
3.04
%
2.88
%
0.12
%
3.87
%
1.81
%
2.43
%
2.53
%
3.42
%
2.
03%
3.
51%
1.
90%
6.00
%
1.77
%
2.25
%
2009
1.08
%
8.78
%
1.98
%
4.32
%
1.61
%
4.31
%
0.68
%
4.56
%
1.80
%
2.57
%
2.64
%
3.66
%
1.
95%
2.
71%
1.
67%
2.13
%
2.18
% -
2010
1.39
%
8.69
%
1.44
%
6.52
%
1.23
%
3.62
%
0.27
%
3.29
%
1.36
%
2.97
%
1.97
%
3.73
%
1.
72%
5.
12%
1.
81%
2.33
%
1.32
%
1.37
%
2011
1.28
%
5.86
%
1.06
%
5.80
%
1.01
%
2.03
%
0.23
%
3.05
%
1.21
%
3.49
%
1.95
%
3.97
%
1.
26%
1.
93%
1.
27%
1.12
%
1.11
%
1.30
%
2012
1.18
%
4.40
%
0.95
%
4.83
%
0.98
%
1.56
%
0.22
%
2.35
%
1.01
%
3.35
%
1.54
% 3.
27%
1.33
% 2.
98%
1.61
%
0.80
%
0.97
%
1.28
%
2013
1.19
%
3.18
%
0.85
%
3.22
%
1.03
%
1.55
%
0.20
%
2.35
%
1.13
%
3.44
%
1.62
%
2.51
%
0.
96%
3.
87%
3.
09%
0.40
%
1.36
%
1.31
%
2014
1.29
%
1.69
%
0.91
%
3.03
%
1.12
%
1.98
%
0.31
%
3.77
% 1.
81%
2.46
% 1.
66%
2.92
%
0.82
%
4.1
9%
2.47
%
0.79
%
1.19
%
2.46
%
2015
1.36
%
1.76
%
0.89
%
3.78
%
0.81
%
1.85
%
0.41
%
4.96
%
1.86
%
2.04
%
5.97
%
2.95
%
1.
85%
2.
75%
2.
98%
0.77
%
1.71
%
1.63
%
2016
1.71
%
1.51
%
0.92
%
5.82
%
0.87
%
2.36
%
0.76
%
5.62
%
2.41
%
2.84
%
8.32
%
3.44
%
1.
29%
1.
97%
4.
42%
0.98
%
3.77
%
1.84
%
2017
5.21
%
1.59
%
1.04
%
8.74
%
0.93
%
2.59
%
1.52
%
7.25
%
2.83
%
2.33
%
11.2
0%
4.21
%
3.
58%
2.
67%
5.
01%
1.20
%
2.45
%
2.9
1%
2018
6.79
%
1.79
%
1.28
%
9.90
%
1.17
%
2.22
%
1.28
%
7.89
%
3.03
%
3.00
%
9.96
%
4.92
%
6.56
%
9.98
%
4.87
%
1.40
%
3.59
%
3.60
%
Vol. 41 No. 1
52
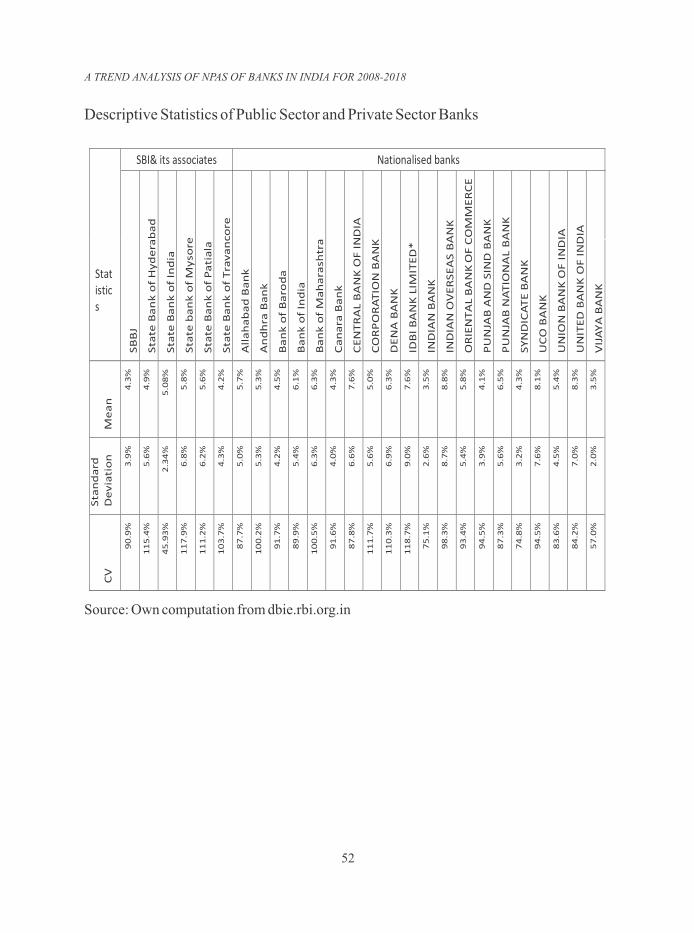
Descriptive Statistics of Public Sector and Private Sector Banks
Source: Own computation from dbie.rbi.org.in
Statistics
SBI& its associates Nationalised banks
SB
BJ
Sta
te B
an
k o
f
Hy
de
rab
ad
Sta
te B
an
k o
f In
dia
Sta
te b
an
k o
f
My
sore
Sta
te B
an
k o
f
Pa
tia
la
Sta
te B
an
k o
f
Tra
va
nco
re
All
ah
ab
ad
Ba
nk
An
dh
ra B
an
k
Ba
nk
of
Ba
rod
a
Ba
nk
of
Ind
ia
Ba
nk
of
M
ah
ara
shtr
a
Ca
na
ra B
an
k
CE
NT
RA
L B
AN
K O
F
IN
DIA
C
OR
PO
RA
TIO
N
B
AN
K
D
EN
A B
AN
K
IDB
I B
AN
K
LIM
ITE
D*
IND
IAN
BA
NK
IN
DIA
N O
VE
RS
EA
S
B
AN
K
OR
IEN
TA
L B
AN
K
O
F C
OM
ME
RC
E
PU
NJA
B A
ND
SIN
D
B
AN
K
PU
NJA
B N
AT
ION
AL
B
AN
K
SY
ND
ICA
TE
BA
NK
UC
O B
AN
K
UN
ION
BA
NK
OF
IND
IA
UN
ITE
D B
AN
K O
F
IN
DIA
VIJ
AY
A B
AN
K
Me
an
4.3
%
4.9
%
5.0
8%
5.8
%
5.6
%
4.2
%
5.7
%
5.3
%
4.5
%
6.1
%
6.3
%
4.3
%
7.6
%
5.0
%
6.3
%
7.6
%
3
.5%
8
.8%
5
.8%
4
.1%
6.5
%
4.3
%
8.1
%
5.4
%
8.3
%
3.5
%
Sta
nd
ard
D
ev
iati
on
3.9
%
5.6
%
2.3
4%
6.8
%
6.2
%
4.3
%
5.0
%
5.3
%
4.2
%
5.4
%
6.3
%
4.0
%
6.6
%
5.6
%
6.9
%
9.0
%
2
.6%
8
.7%
5
.4%
3
.9%
5.6
%
3.2
%
7.6
%
4.5
%
7.0
%
2.0
%
CV
90
.9%
11
5.4
%
45
.93
%
11
7.9
%
11
1.2
%
10
3.7
%
87
.7%
10
0.2
%
91
.7%
89
.9%
10
0.5
%
91
.6%
87
.8%
11
1.7
%
11
0.3
%
11
8.7
%
7
5.1
%
9
8.3
%
9
3.4
%
9
4.5
%
87
.3%
74
.8%
94
.5%
83
.6%
84
.2%
57
.0%
A TREND ANALYSIS OF NPAS OF BANKS IN INDIA FOR 2008-2018

BUSINESS ANALYST
53
Source: Own computation from dbie.rbi.org.in
istics
Axis
Ba
nk
Ltd
.
DC
B B
an
k
Lt
d.
HD
FC
Ba
nk
Ltd
.
ICIC
I B
an
k
Lt
d.
Ind
usI
nd
Ba
nk
Ltd
.
Ko
tak
B
an
k L
td.
M
ah
ind
ra
Ye
s B
an
k
Lt
d.
Ca
tho
lic
Sy
ria
n B
an
k
Lt
d.
C
ity
Ba
nk
U
nio
n L
td.
Fe
de
ral
Ba
nk
Ltd
.
Jam
mu
&
Ka
shm
ir
B
an
k L
td.
Ka
rna
tak
a
B
an
k L
td.
K
aru
ru
Vy
sya
Ba
nk
Ltd
.
Lak
shm
i B
an
k L
td.
V
ila
s
Na
init
al
B
an
k L
td.
RB
L B
an
k
Lt
d.
So
uth
Ind
ian
Ba
nk
Ltd
.
Ta
mil
na
d
Me
rca
nti
le
Ba
nk
Ltd
.
Me
an
2.1
%
3.7
%
1.2
%
5.4
%
1.3
%
2.5
%
0.5
%
4.5
%
1.8
%
2.8
%
4.5
%
3.5
%
2
.1%
3
.8%
2
.8%
1
.6%
1
.9%
2
.0%
Sta
nd
ard
D
ev
iati
on
2.0
%
2.9
%
0.3
%
2.3
%
0.6
%
0.9
%
0.5
%
1.9
%
0.7
%
0.5
%
3.7
%
0.7
%
1
.6%
2
.3%
1
.4%
1
.6%
1
.0%
0
.8%
CV
92
.7%
77
.0%
29
.8%
42
.3%
50
.2%
35
.2%
85
.9%
41
.6%
36
.7%
17
.3%
82
.5%
18
.9%
7
7.7
%
5
9.7
%
4
8.5
%
9
5.9
%
4
9.7
%
3
9.9
%
Stat
New Private Sector Banks Old Private Sector Banks
Vol. 41 No. 1
