a survey of consumer behavior and perceptions … · a survey of consumer behavior and perceptions...
TRANSCRIPT
A Survey of Consumer Behavior and Perceptions
Findings From a Spring 2011 Survey of Primary Household Food Shoppers in Western North Carolina
Prepared for
The Appalachian Sustainable Agriculture Project
by
TJH Research and Strategy
Survey conducted April 8 - April 22, 2011
Contents Key Findings ...................................................................... 3 Methodology ...................................................................... 6 I. Locally Grown Food Self-Reported Consumer Behavior................................ 7 Advertising and Materials Promoting Local Food.......... 20 Perceptions of Locally Grown Food............................... 25 II. Forest Products Salience ....................................................................... 42 Forest Foods .................................................................43 Forest Products ............................................................. 50

A Survey of Consumer Behavior and Perceptions in WNC
Appalachian Sustainable Agriculture Project (ASAP) 3
KEY FINDINGS
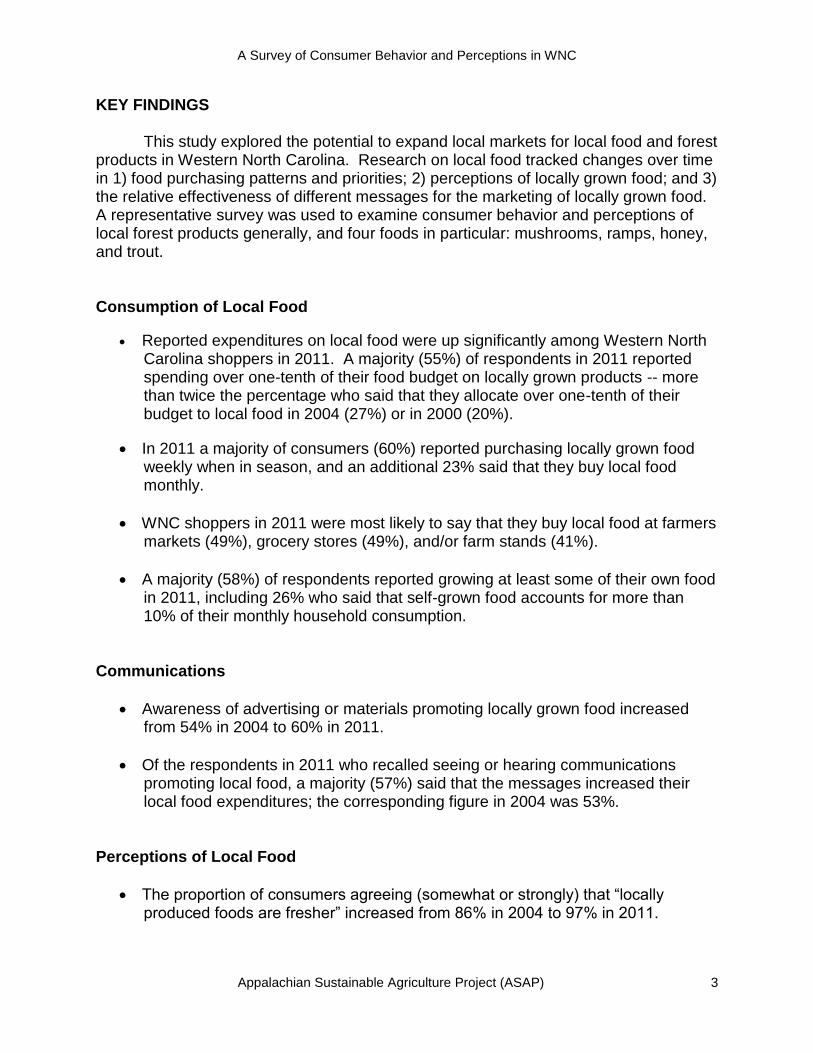
This study explored the potential to expand local markets for local food and forest products in Western North Carolina. Research on local food tracked changes over time in 1) food purchasing patterns and priorities; 2) perceptions of locally grown food; and 3) the relative effectiveness of different messages for the marketing of locally grown food. A representative survey was used to examine consumer behavior and perceptions of local forest products generally, and four foods in particular: mushrooms, ramps, honey, and trout. Consumption of Local Food
Reported expenditures on local food were up significantly among Western North Carolina shoppers in 2011. A majority (55%) of respondents in 2011 reported spending over one-tenth of their food budget on locally grown products -- more than twice the percentage who said that they allocate over one-tenth of their budget to local food in 2004 (27%) or in 2000 (20%).
In 2011 a majority of consumers (60%) reported purchasing locally grown food weekly when in season, and an additional 23% said that they buy local food monthly.
WNC shoppers in 2011 were most likely to say that they buy local food at farmers markets (49%), grocery stores (49%), and/or farm stands (41%).
A majority (58%) of respondents reported growing at least some of their own food in 2011, including 26% who said that self-grown food accounts for more than 10% of their monthly household consumption.
Communications
Awareness of advertising or materials promoting locally grown food increased from 54% in 2004 to 60% in 2011.
Of the respondents in 2011 who recalled seeing or hearing communications promoting local food, a majority (57%) said that the messages increased their local food expenditures; the corresponding figure in 2004 was 53%.
Perceptions of Local Food
The proportion of consumers agreeing (somewhat or strongly) that ―locally produced foods are fresher‖ increased from 86% in 2004 to 97% in 2011.
A Survey of Consumer Behavior and Perceptions in WNC
Appalachian Sustainable Agriculture Project (ASAP) 4
Perceptions of Local Food (Continued)
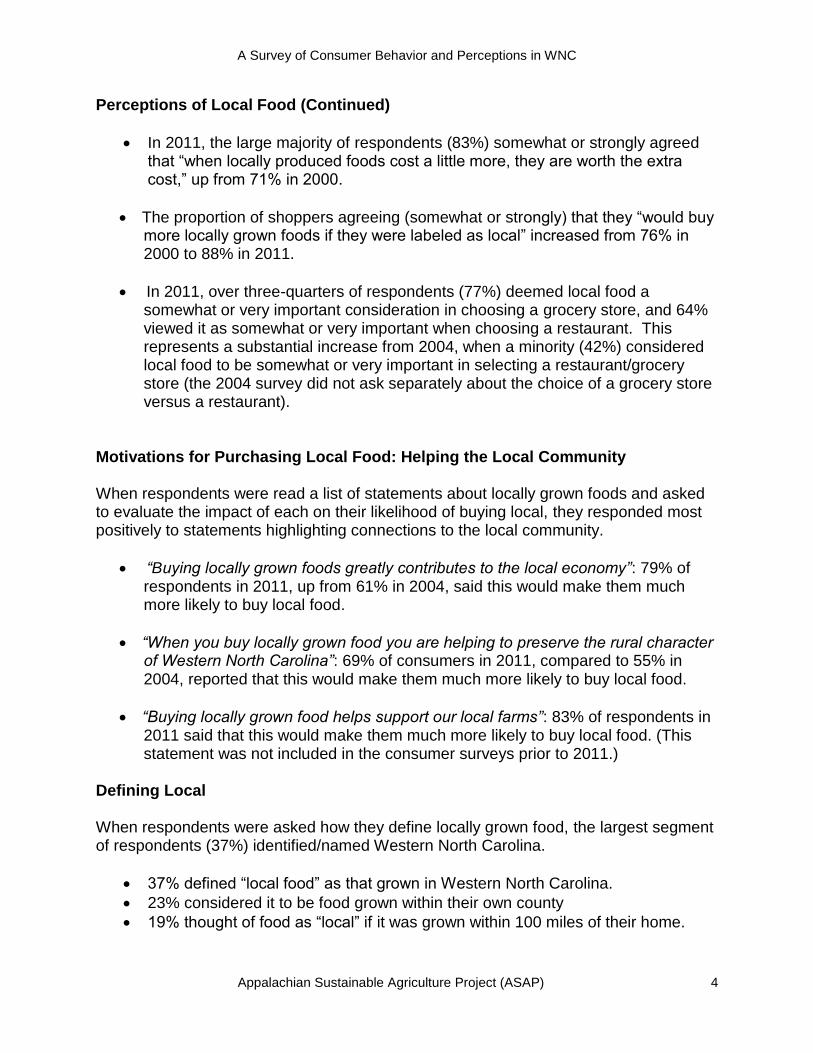
In 2011, the large majority of respondents (83%) somewhat or strongly agreed that ―when locally produced foods cost a little more, they are worth the extra cost,‖ up from 71% in 2000.
The proportion of shoppers agreeing (somewhat or strongly) that they ―would buy more locally grown foods if they were labeled as local‖ increased from 76% in 2000 to 88% in 2011.
In 2011, over three-quarters of respondents (77%) deemed local food a somewhat or very important consideration in choosing a grocery store, and 64% viewed it as somewhat or very important when choosing a restaurant. This represents a substantial increase from 2004, when a minority (42%) considered local food to be somewhat or very important in selecting a restaurant/grocery store (the 2004 survey did not ask separately about the choice of a grocery store versus a restaurant).
Motivations for Purchasing Local Food: Helping the Local Community When respondents were read a list of statements about locally grown foods and asked to evaluate the impact of each on their likelihood of buying local, they responded most positively to statements highlighting connections to the local community.
“Buying locally grown foods greatly contributes to the local economy”: 79% of respondents in 2011, up from 61% in 2004, said this would make them much more likely to buy local food.
“When you buy locally grown food you are helping to preserve the rural character of Western North Carolina”: 69% of consumers in 2011, compared to 55% in 2004, reported that this would make them much more likely to buy local food.
“Buying locally grown food helps support our local farms”: 83% of respondents in 2011 said that this would make them much more likely to buy local food. (This statement was not included in the consumer surveys prior to 2011.)
Defining Local When respondents were asked how they define locally grown food, the largest segment of respondents (37%) identified/named Western North Carolina.
37% defined ―local food‖ as that grown in Western North Carolina.
23% considered it to be food grown within their own county
19% thought of food as ―local‖ if it was grown within 100 miles of their home.

A Survey of Consumer Behavior and Perceptions in WNC
Appalachian Sustainable Agriculture Project (ASAP) 5
Perceptions of Forest Products
For a majority of shoppers in 2011, the terms ―Appalachian forest product‖ and ―local forest product‖ did not bring anything to mind, either positive or negative.
Perceptions of Forest Products (Continued)
To the extent that consumers indicate having any impression of forest products, positive connotations far outweigh negative ones. Overall, nearly one-third (29%) of all 2011 respondents associated ―Appalachian forest product‖ with something favorable, compared to 6% who said that the term brought something negative to mind. Similarly, ―local forest product‖ was more than twice as likely to bring positive impressions to mind (39%) than to trigger negative associations (15%).
Consumers see purchasing local forest products as having positive effects for the local community. In 2011, 9 in 10 respondents (90%) found it at least ―somewhat believable‖ that ―buying local forest products helps support our local community,‖ including approximately two-thirds (65%) who considered this statement ―very believable.‖
87% of respondents in 2011 said that they believed ―buying local forest products helps diversify the Western North Carolina economy,‖ including 55% who found this very believable.
Similarly, 87% of 2011 shoppers found it believable that ―buying local forest products helps preserve the heritage and culture of Appalachia‖ (53% very believable).
Markets for Specific Forest Foods
Of the four specific forest foods examined in the 2011 survey – local honey, mushrooms, ramps, and trout – demand was highest for honey. In 2011, 8 in 10 shoppers (80%) reported being at least ―somewhat interested‖ in purchasing honey, including a majority (56%) who were ―very interested.‖
Demand for honey was also closest to being met or exceeded, of the four forest foods considered. 71% of all respondents in 2011 said either that there is ―just enough‖ or that there is more local honey available than they want.
Ramps were least in demand in 2011. Roughly one-third (35%) of respondents expressed some interest in buying ramps, including 19% who were ―very interested.‖
The largest gap between expressed interest and perceived availability was for local mushrooms. Of the shoppers in 2011 who expressed strong interest in purchasing mushrooms, half (51%) reported a shortage in supply.
A Survey of Consumer Behavior and Perceptions in WNC
Appalachian Sustainable Agriculture Project (ASAP) 6
Methodology
A representative telephone survey was used to interview a total of 703 Western North Carolina residents in April 2011. Of these 703 interviews, 403 respondents were drawn proportionally from Buncombe, Henderson, and Madison counties. An additional sample of 300 respondents was drawn from Cherokee, Clay, Graham, Jackson, Macon and Swain counties, with 50 interviews completed in each county. Respondents were screened to ensure that only primary household shoppers were interviewed. The data were weighted to reflect the demographic composition of the population in the region. The margin of error is +/- 3.7 percentage points overall, and is higher for subgroups.
On items where similar question wording permitted tracking, results from the 2011 survey were compared with those from two previous Appalachian Sustainable Agriculture Project (ASAP) consumer surveys, conducted in 2000 and 2004. The tracked questions, while similar across surveys, are not identical. Although the small differences in phrasing affect the precision of comparisons between years, these items are sufficiently alike from one year to another to permit rough measures of change over time. The 2000 and 2004 surveys sampled only Buncombe, Henderson, and Madison county residents. For purposes of comparability, analysis of the 2011 survey data was restricted to the base sample of Buncombe, Henderson and Madison counties (403 respondents) when examining trends over time.
A Survey of Consumer Behavior and Perceptions in WNC
Appalachian Sustainable Agriculture Project (ASAP) 7
I. LOCALLY GROWN FOOD Self-Reported Consumer Behavior In 2011, as in 2000 and 2004, respondents were asked to estimate their total monthly food expenditures (“Generally, how much does your household spend on food each month?”),1 as well as the proportion of their monthly food budget allocated to locally grown food (“About what percent of your monthly food bill is spent on food grown in Western North Carolina?”).2 The 2011 survey also included a question about the frequency of local food purchases, which was not asked in 2000 or 2004: “When shopping for your household, do you typically purchase locally grown foods weekly (when in season), monthly (when in season), a few times a year, once a year, or never?”
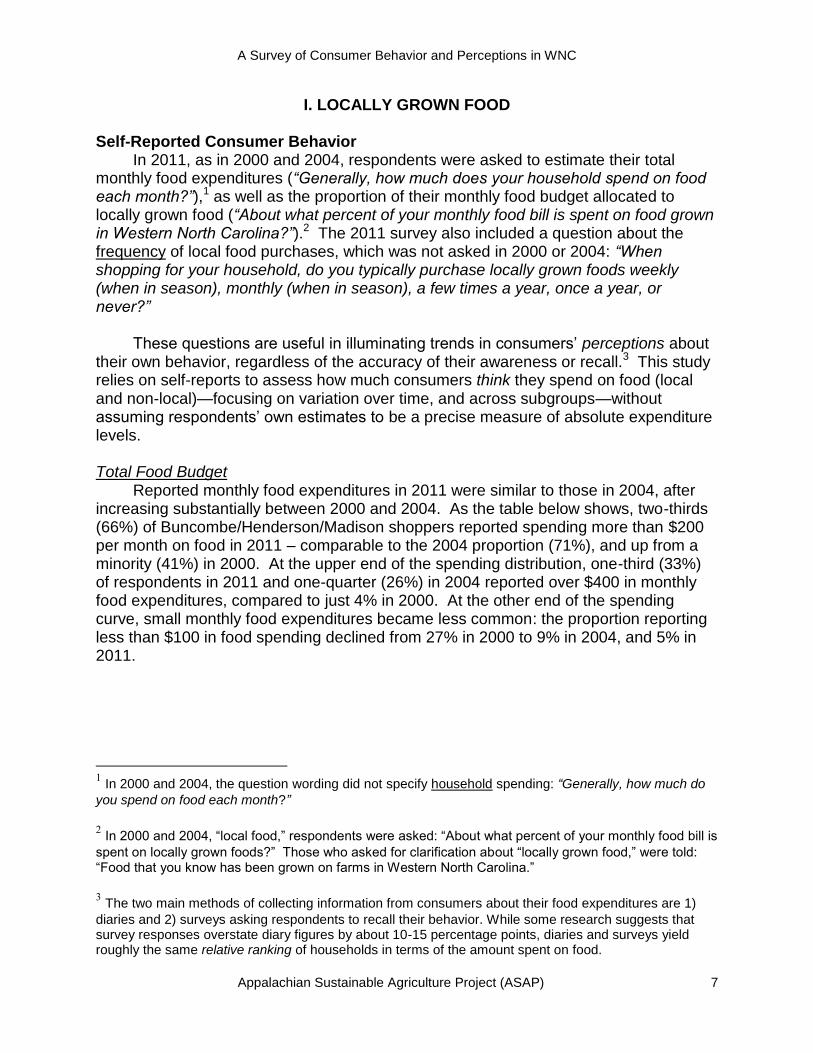
These questions are useful in illuminating trends in consumers’ perceptions about their own behavior, regardless of the accuracy of their awareness or recall.3 This study relies on self-reports to assess how much consumers think they spend on food (local and non-local)—focusing on variation over time, and across subgroups—without assuming respondents’ own estimates to be a precise measure of absolute expenditure levels. Total Food Budget Reported monthly food expenditures in 2011 were similar to those in 2004, after increasing substantially between 2000 and 2004. As the table below shows, two-thirds (66%) of Buncombe/Henderson/Madison shoppers reported spending more than $200 per month on food in 2011 – comparable to the 2004 proportion (71%), and up from a minority (41%) in 2000. At the upper end of the spending distribution, one-third (33%) of respondents in 2011 and one-quarter (26%) in 2004 reported over $400 in monthly food expenditures, compared to just 4% in 2000. At the other end of the spending curve, small monthly food expenditures became less common: the proportion reporting less than $100 in food spending declined from 27% in 2000 to 9% in 2004, and 5% in 2011.
1 In 2000 and 2004, the question wording did not specify household spending: “Generally, how much do
you spend on food each month?”
2 In 2000 and 2004, ―local food,‖ respondents were asked: ―About what percent of your monthly food bill is
spent on locally grown foods?‖ Those who asked for clarification about ―locally grown food,‖ were told: ―Food that you know has been grown on farms in Western North Carolina.‖
3 The two main methods of collecting information from consumers about their food expenditures are 1)
diaries and 2) surveys asking respondents to recall their behavior. While some research suggests that survey responses overstate diary figures by about 10-15 percentage points, diaries and surveys yield roughly the same relative ranking of households in terms of the amount spent on food.
A Survey of Consumer Behavior and Perceptions in WNC
Appalachian Sustainable Agriculture Project (ASAP) 8
Reported Food Expenditures Over Time - Core 3 Counties, 2000/2004/2011
60%
37%
4%
30%
45%
26%
34%33% 33%
0%
10%
20%
30%
40%
50%
60%
70%
< $200 $201 - $400 $400+
2000 2004 2011
< $100$100 -
$150
$151 -
$200
$201 -
$300
$301 -
$400$400+ Total
2000 27% 16% 17% 16% 21% 4% 100%
2004 9% 4% 17% 25% 20% 26% 100%
2011 5% 11% 18% 17% 16% 33% 100%
pct pt
change
2000
to
2011-22 -5 +1 +1 -5 +29
2004
to
2011
-4 +7 +1 -8 -4 +7
Reported Monthly Food Expenditures
“Generally, how much does your household spend on food each month?” *
Note: Percentages do not always sum to 100 due to rounding.
Reported Monthly Food Expenditures
* In 2000 and 2004, respondents were asked: “Generally, how much do you spend on food each month?” Reported amounts above $400 were not available disaggregated for 2000 or 2004.
5%
12%
1%
21%
29%
20%
33%
48%
23%
0%
10%
20%
30%
40%
50%
< 35 yrs 35-54 yrs 55+ yrs
2000 2004 2011
“Generally, how much does your household spend on food each month?” *
Age< $100
$100 -
$150
$151 -
$200
$201 -
$300
$301 -
$400$400+
< 35 yrs
2000 18% 5% 29% 18% 24% 5%
2004 4% 5% 14% 36% 21% 21%
2011 4% -- 33% 25% 6% 33%
35-54 yrs
2000 16% 11% 14% 15% 33% 12%
2004 13% 5% 16% 23% 20% 29%
2011 2% 4% 14% 14% 18% 48%
55+ yrs
2000 34% 17% 17% 18% 13% 1%
2004 17% 11% 20% 20% 12% 20%
2011 7% 19% 18% 16% 17% 23%
All Reported Monthly Food Expenditures
Proportion Reporting Over $400 in
Monthly Food Expenditures
AgeNote: Percentages do not always sum to 100 due to rounding.
Reported Food Expenditures Over Time, by Age - Core 3 Counties, 2000/2004/2011
* In 2000 and 2004, respondents were asked: “Generally, how much do you spend on food each month?” Reported amounts above $400 were not available disaggregated for 2000 or 2004.
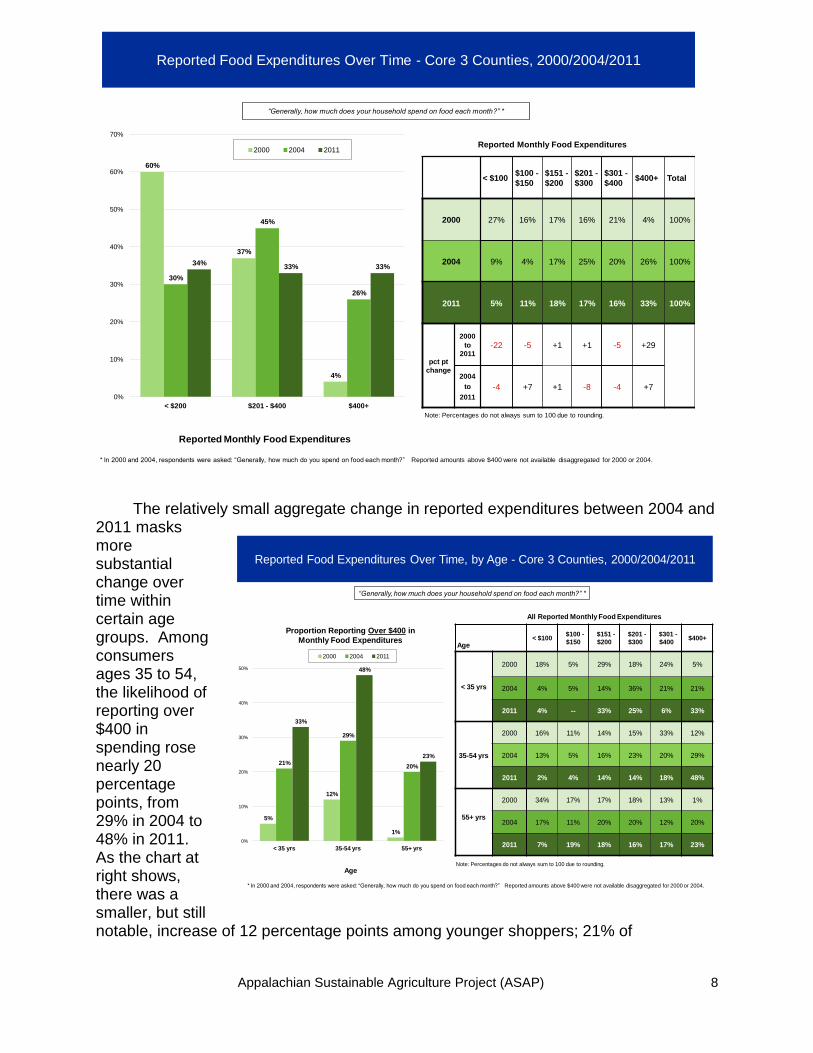
The relatively small aggregate change in reported expenditures between 2004 and 2011 masks more substantial change over time within certain age groups. Among consumers ages 35 to 54, the likelihood of reporting over $400 in spending rose nearly 20 percentage points, from 29% in 2004 to 48% in 2011. As the chart at right shows, there was a smaller, but still notable, increase of 12 percentage points among younger shoppers; 21% of
A Survey of Consumer Behavior and Perceptions in WNC
Appalachian Sustainable Agriculture Project (ASAP) 9
Reported Monthly Food Expenditures by Geography, 2011
Geography
< $100$100 -
$150
$151 -
$200
$201 -
$300
$301 -
$400
$401 -
$500
$501 -
$750$751+ Total
Core 3 Counties
(Buncombe, Madison,
Henderson)
6% 8% 22% 15% 15% 14% 15% 5% 100%
Other 6 Counties
(Cherokee, Graham,
Jackson, Macon,
Swain, and Clay)
6% 9% 17% 23% 22% 12% 9% 3% 100%
Total
(9 Counties)6% 10% 17% 20% 17% 14% 12% 5% 100%
Reported Monthly Food Expenditures
“Generally, how much does your household spend on food each month?” *
Note: Percentages do not always sum to 100 due to rounding. ―Don’t knows‖ excluded from the analysis.
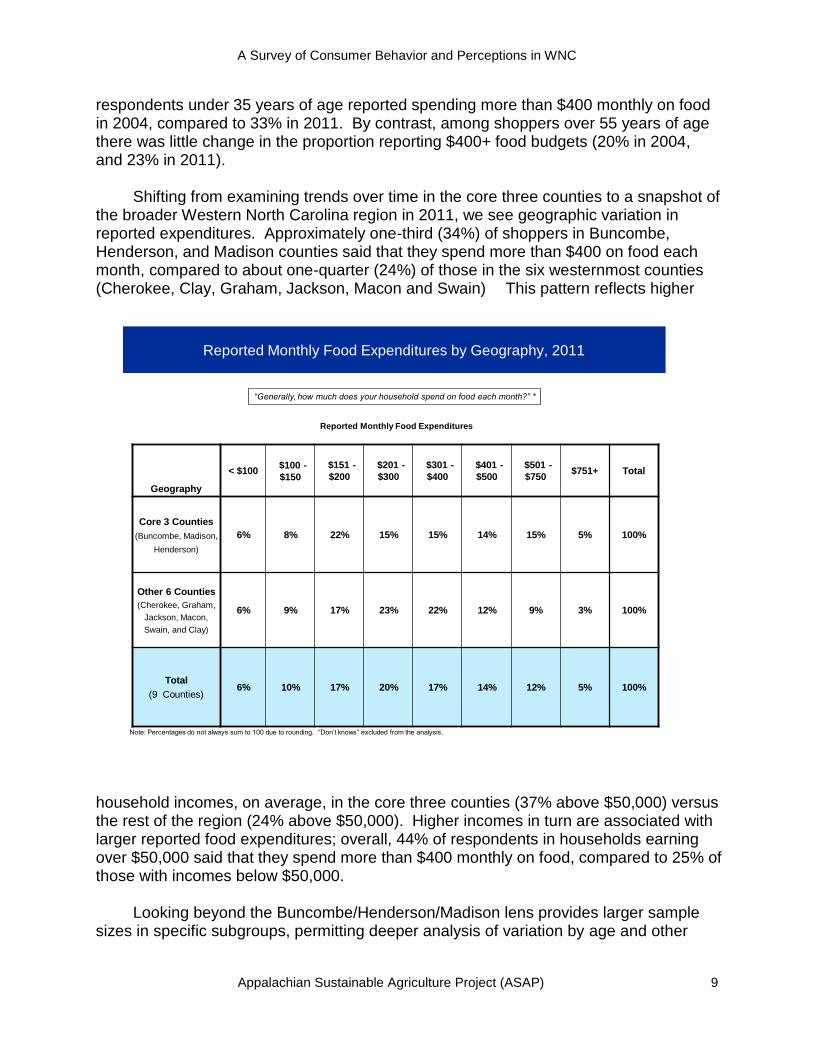
respondents under 35 years of age reported spending more than $400 monthly on food in 2004, compared to 33% in 2011. By contrast, among shoppers over 55 years of age there was little change in the proportion reporting $400+ food budgets (20% in 2004, and 23% in 2011). Shifting from examining trends over time in the core three counties to a snapshot of the broader Western North Carolina region in 2011, we see geographic variation in reported expenditures. Approximately one-third (34%) of shoppers in Buncombe, Henderson, and Madison counties said that they spend more than $400 on food each month, compared to about one-quarter (24%) of those in the six westernmost counties (Cherokee, Clay, Graham, Jackson, Macon and Swain) This pattern reflects higher
household incomes, on average, in the core three counties (37% above $50,000) versus the rest of the region (24% above $50,000). Higher incomes in turn are associated with larger reported food expenditures; overall, 44% of respondents in households earning over $50,000 said that they spend more than $400 monthly on food, compared to 25% of those with incomes below $50,000. Looking beyond the Buncombe/Henderson/Madison lens provides larger sample sizes in specific subgroups, permitting deeper analysis of variation by age and other
A Survey of Consumer Behavior and Perceptions in WNC
Appalachian Sustainable Agriculture Project (ASAP) 10
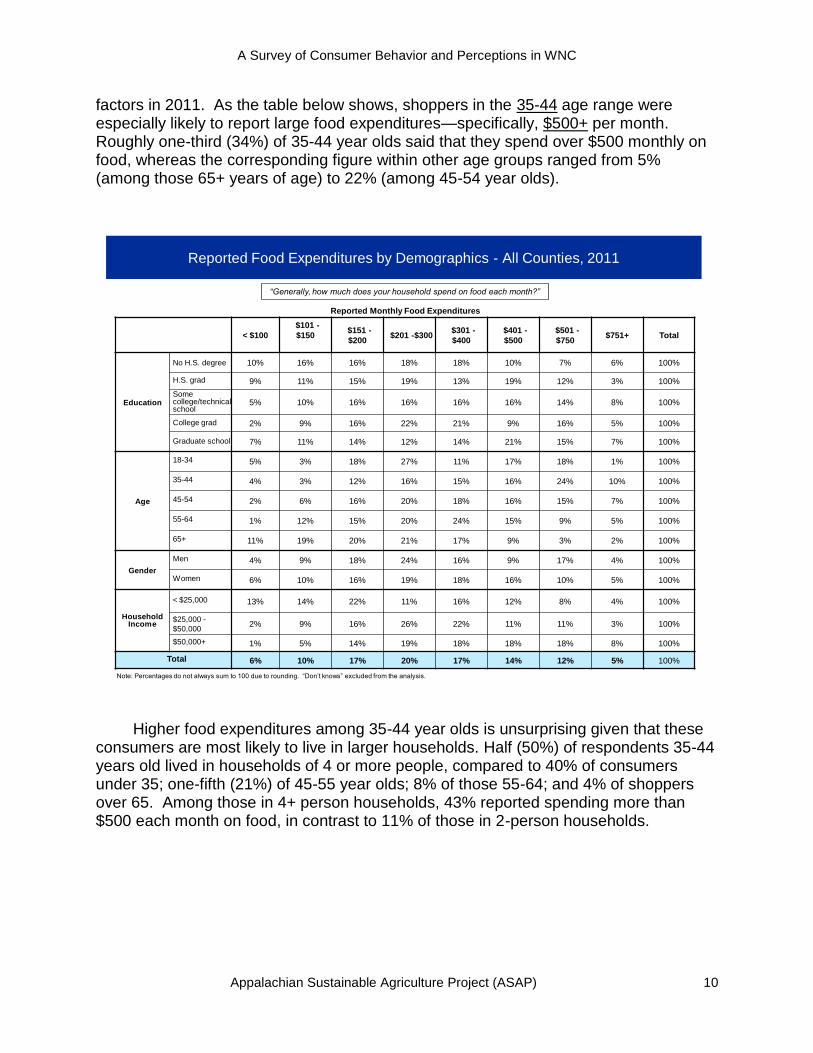
factors in 2011. As the table below shows, shoppers in the 35-44 age range were especially likely to report large food expenditures—specifically, $500+ per month. Roughly one-third (34%) of 35-44 year olds said that they spend over $500 monthly on food, whereas the corresponding figure within other age groups ranged from 5% (among those 65+ years of age) to 22% (among 45-54 year olds).
Higher food expenditures among 35-44 year olds is unsurprising given that these consumers are most likely to live in larger households. Half (50%) of respondents 35-44 years old lived in households of 4 or more people, compared to 40% of consumers under 35; one-fifth (21%) of 45-55 year olds; 8% of those 55-64; and 4% of shoppers over 65. Among those in 4+ person households, 43% reported spending more than $500 each month on food, in contrast to 11% of those in 2-person households.
Reported Food Expenditures by Demographics - All Counties, 2011
< $100
$101 -
$150$151 -
$200$201 -$300
$301 -
$400
$401 -
$500
$501 -
$750$751+ Total
Education
No H.S. degree 10% 16% 16% 18% 18% 10% 7% 6% 100%
H.S. grad 9% 11% 15% 19% 13% 19% 12% 3% 100%
Some college/technical school
5% 10% 16% 16% 16% 16% 14% 8% 100%
College grad 2% 9% 16% 22% 21% 9% 16% 5% 100%
Graduate school 7% 11% 14% 12% 14% 21% 15% 7% 100%
Age
18-34 5% 3% 18% 27% 11% 17% 18% 1% 100%
35-44 4% 3% 12% 16% 15% 16% 24% 10% 100%
45-54 2% 6% 16% 20% 18% 16% 15% 7% 100%
55-64 1% 12% 15% 20% 24% 15% 9% 5% 100%
65+ 11% 19% 20% 21% 17% 9% 3% 2% 100%
Gender
Men 4% 9% 18% 24% 16% 9% 17% 4% 100%
Women 6% 10% 16% 19% 18% 16% 10% 5% 100%
Household Income
< $25,000 13% 14% 22% 11% 16% 12% 8% 4% 100%
$25,000 -
$50,0002% 9% 16% 26% 22% 11% 11% 3% 100%
$50,000+ 1% 5% 14% 19% 18% 18% 18% 8% 100%
Total 6% 10% 17% 20% 17% 14% 12% 5% 100%
Reported Monthly Food Expenditures
“Generally, how much does your household spend on food each month?”
Note: Percentages do not always sum to 100 due to rounding. ―Don’t knows‖ excluded from the analysis.
A Survey of Consumer Behavior and Perceptions in WNC
Appalachian Sustainable Agriculture Project (ASAP) 11
49%
39%
11%
51%
37%
12%
18%
50%
33%
0%
10%
20%
30%
40%
50%
60%
0-5% 6-20% > 20%
2000 2004 20110-5% 6-10% 11-20% > 20% Total
2000 49% 30% 9% 11% 100%
2004 51% 22% 15% 12% 100%
2011 18% 28% 22% 33% 100%
pct pt
change
2000
to
2011-31 -2 +13 +22
2004
to
2011
-31 -2 +13 +21
Reported % of Monthly Food Bill Spent on Local Food
Reported % of Monthly Bill Spent on Local Food
“About what percent of your monthly food bill is spent on food grown in Western North Carolina?” *
* In 2000 and 2004, respondents were asked: “About what percent of your monthly food bill is spent on locally grown foods?” Respondent who asked for clarification about ―locally grown food‖
were told: ―Food that you know has been grown on farms in Western North Carolina.” Responses in the 0-5% and > 20% ranges were not available further disaggregated for 2000 or 2004.
Note: Percentages do not always sum to 100 due to rounding.
―Don’t knows‖ excluded from the analysis.
Reported Spending on Local Food Over Time - Core 3 Counties, 2000/2004/2011
9%7%
4%
22%
13%12%
45%
34%
24%
0%
10%
20%
30%
40%
50%
< $25,000 $25-$50,000 $50,000+
2000 2004 2011
Household Income0-5% 6-10% 11-20% > 20% Total
Less than
$25,000
2000 64% 17% 9% 9% 100%
2004 37% 33% 7% 22% 100%
2011 19% 23% 14% 45% 100%
$25,000 -
$50,000
2000 50% 36% 8% 7% 100%
2004 64% 15% 9% 13% 100%
2011 16% 26% 24% 34% 100%
$50,000+
2000 56% 28% 12% 4% 100%
2004 42% 26% 20% 12% 100%
2011 18% 31% 27% 24% 100%
“About what percent of your monthly food bill is spent on food grown in Western North Carolina?” *
Reported % of Monthly Food Bill Spent on Local Food
* In 2000 and 2004, respondents were asked: “About what percent of your monthly food bill is spent on locally grown foods?” Respondent who asked for clarification about ―locally grown food‖
were told: ―Food that you know has been grown on farms in Western North Carolina.” Responses in the 0-5% and > 20% ranges were not available further disaggregated for 2000 or 2004.
Note: Percentages do not always sum to 100 due to rounding. ―Don’t knows‖ excluded from the analysis.
Reported Spending on Local Food Over Time, by Income -
Core 3 Counties, 2000/2004/2011
Household Income
Proportion Reporting Over 20% of Monthly
Food Bill Allocated to Local Food
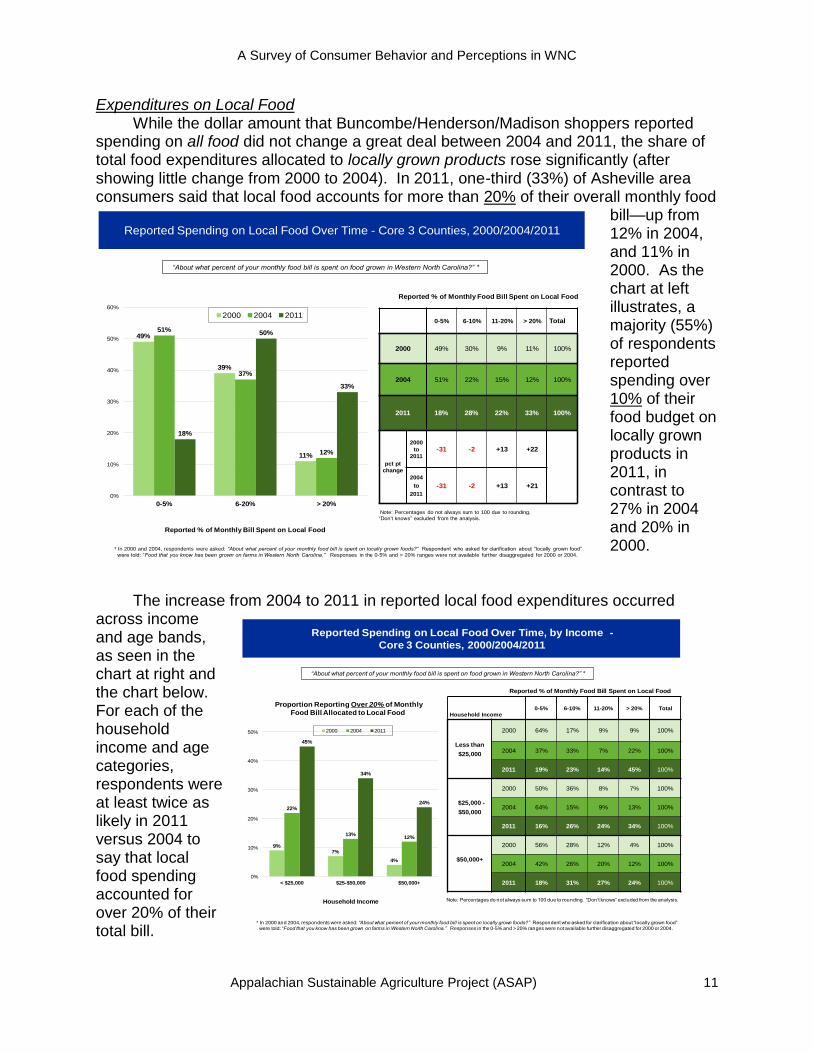
Expenditures on Local Food While the dollar amount that Buncombe/Henderson/Madison shoppers reported spending on all food did not change a great deal between 2004 and 2011, the share of total food expenditures allocated to locally grown products rose significantly (after showing little change from 2000 to 2004). In 2011, one-third (33%) of Asheville area consumers said that local food accounts for more than 20% of their overall monthly food
bill—up from 12% in 2004, and 11% in 2000. As the chart at left illustrates, a majority (55%) of respondents reported spending over 10% of their food budget on locally grown products in 2011, in contrast to 27% in 2004 and 20% in 2000.
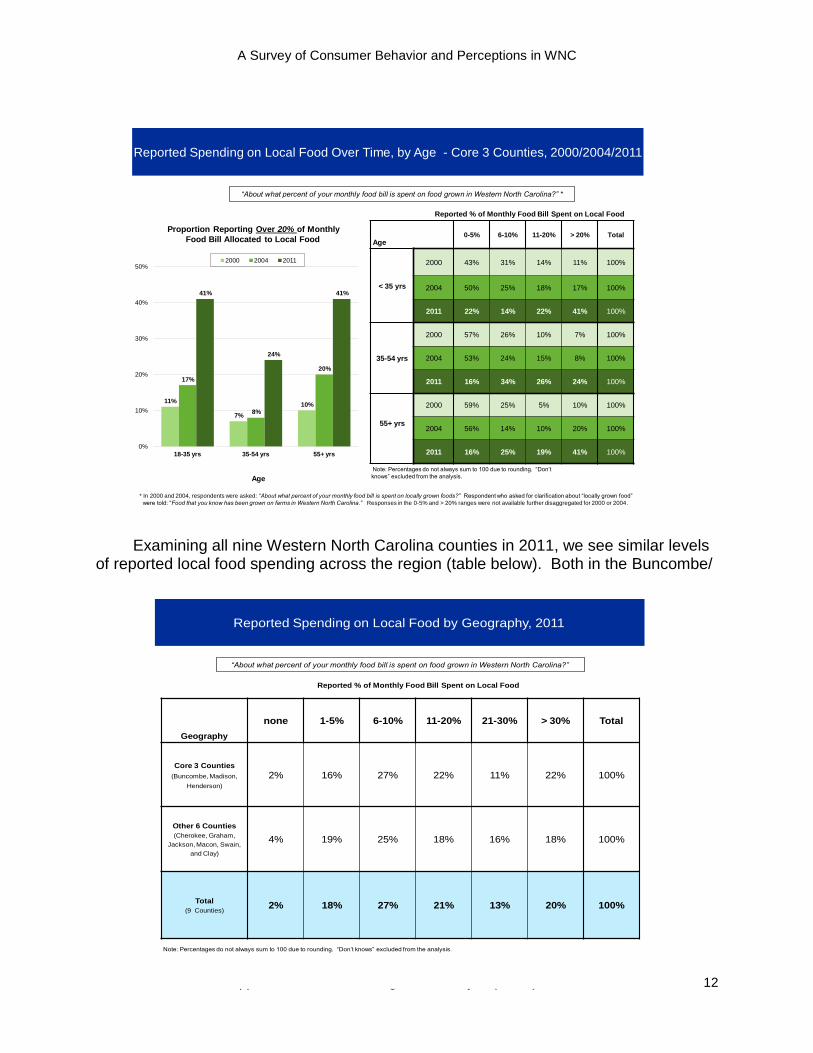
The increase from 2004 to 2011 in reported local food expenditures occurred
across income and age bands, as seen in the chart at right and the chart below. For each of the household income and age categories, respondents were at least twice as likely in 2011 versus 2004 to say that local food spending accounted for over 20% of their total bill.
A Survey of Consumer Behavior and Perceptions in WNC
Appalachian Sustainable Agriculture Project (ASAP) 12
11%
7%
10%
17%
8%
20%
41%
24%
41%
0%
10%
20%
30%
40%
50%
18-35 yrs 35-54 yrs 55+ yrs
2000 2004 2011
Age0-5% 6-10% 11-20% > 20% Total
< 35 yrs
2000 43% 31% 14% 11% 100%
2004 50% 25% 18% 17% 100%
2011 22% 14% 22% 41% 100%
35-54 yrs
2000 57% 26% 10% 7% 100%
2004 53% 24% 15% 8% 100%
2011 16% 34% 26% 24% 100%
55+ yrs
2000 59% 25% 5% 10% 100%
2004 56% 14% 10% 20% 100%
2011 16% 25% 19% 41% 100%
“About what percent of your monthly food bill is spent on food grown in Western North Carolina?” *
Reported % of Monthly Food Bill Spent on Local Food
Age
Reported Spending on Local Food Over Time, by Age - Core 3 Counties, 2000/2004/2011
* In 2000 and 2004, respondents were asked: “About what percent of your monthly food bill is spent on locally grown foods?” Respondent who asked for clarification about ―locally grown food‖
were told: ―Food that you know has been grown on farms in Western North Carolina.” Responses in the 0-5% and > 20% ranges were not available further disaggregated for 2000 or 2004 .
Note: Percentages do not always sum to 100 due to rounding. ―Don’t
knows‖ excluded from the analysis.
Proportion Reporting Over 20% of Monthly
Food Bill Allocated to Local Food
Geography
none 1-5% 6-10% 11-20% 21-30% > 30% Total
Core 3 Counties
(Buncombe, Madison,
Henderson)
2% 16% 27% 22% 11% 22% 100%
Other 6 Counties
(Cherokee, Graham,
Jackson, Macon, Swain,
and Clay)
4% 19% 25% 18% 16% 18% 100%
Total
(9 Counties)2% 18% 27% 21% 13% 20% 100%
“About what percent of your monthly food bill is spent on food grown in Western North Carolina?”
Reported % of Monthly Food Bill Spent on Local Food
Reported Spending on Local Food by Geography, 2011
Note: Percentages do not always sum to 100 due to rounding. ―Don’t knows‖ excluded from the analysis .
Examining all nine Western North Carolina counties in 2011, we see similar levels of reported local food spending across the region (table below). Both in the Buncombe/
A Survey of Consumer Behavior and Perceptions in WNC
Appalachian Sustainable Agriculture Project (ASAP) 13
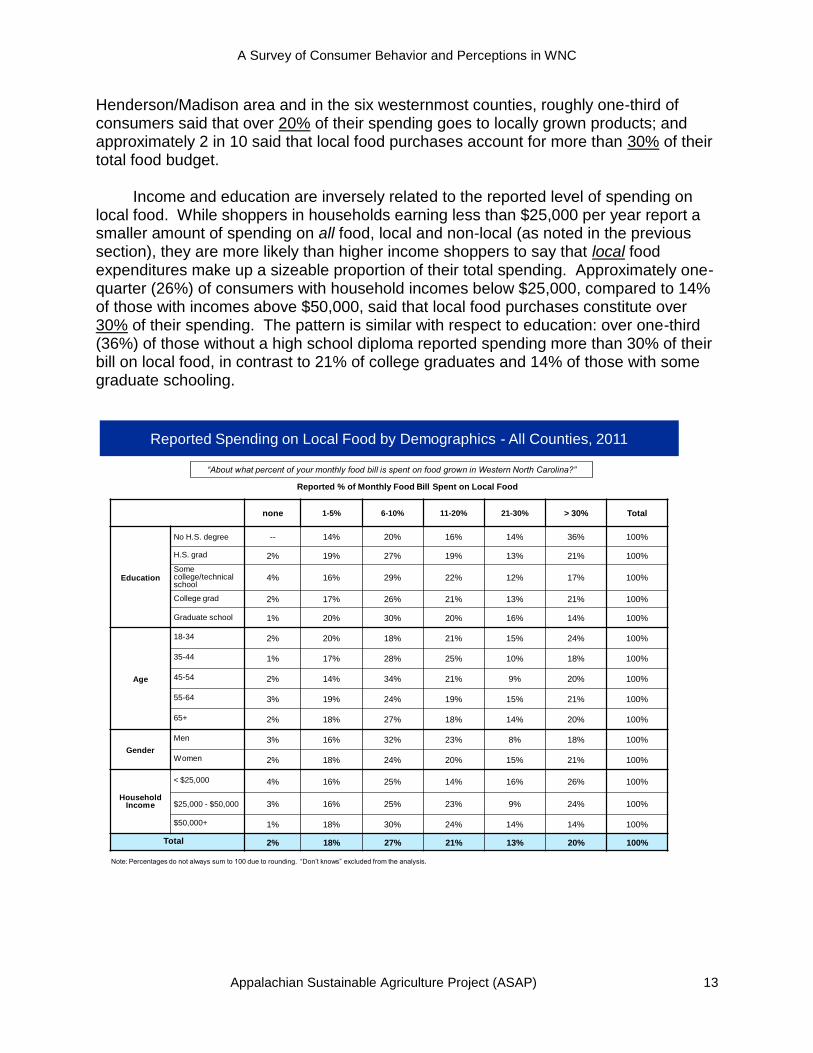
Henderson/Madison area and in the six westernmost counties, roughly one-third of consumers said that over 20% of their spending goes to locally grown products; and approximately 2 in 10 said that local food purchases account for more than 30% of their total food budget. Income and education are inversely related to the reported level of spending on local food. While shoppers in households earning less than $25,000 per year report a smaller amount of spending on all food, local and non-local (as noted in the previous section), they are more likely than higher income shoppers to say that local food expenditures make up a sizeable proportion of their total spending. Approximately one-quarter (26%) of consumers with household incomes below $25,000, compared to 14% of those with incomes above $50,000, said that local food purchases constitute over 30% of their spending. The pattern is similar with respect to education: over one-third (36%) of those without a high school diploma reported spending more than 30% of their bill on local food, in contrast to 21% of college graduates and 14% of those with some graduate schooling.
none 1-5% 6-10% 11-20% 21-30% > 30% Total
Education
No H.S. degree -- 14% 20% 16% 14% 36% 100%
H.S. grad 2% 19% 27% 19% 13% 21% 100%
Some college/technical school
4% 16% 29% 22% 12% 17% 100%
College grad 2% 17% 26% 21% 13% 21% 100%
Graduate school 1% 20% 30% 20% 16% 14% 100%
Age
18-34 2% 20% 18% 21% 15% 24% 100%
35-44 1% 17% 28% 25% 10% 18% 100%
45-54 2% 14% 34% 21% 9% 20% 100%
55-64 3% 19% 24% 19% 15% 21% 100%
65+ 2% 18% 27% 18% 14% 20% 100%
Gender
Men 3% 16% 32% 23% 8% 18% 100%
Women 2% 18% 24% 20% 15% 21% 100%
Household Income
< $25,000 4% 16% 25% 14% 16% 26% 100%
$25,000 - $50,000 3% 16% 25% 23% 9% 24% 100%
$50,000+ 1% 18% 30% 24% 14% 14% 100%
Total 2% 18% 27% 21% 13% 20% 100%
“About what percent of your monthly food bill is spent on food grown in Western North Carolina?”
Reported % of Monthly Food Bill Spent on Local Food
Reported Spending on Local Food by Demographics - All Counties, 2011
Note: Percentages do not always sum to 100 due to rounding. ―Don’t knows‖ excluded from the analysis.

A Survey of Consumer Behavior and Perceptions in WNC
Appalachian Sustainable Agriculture Project (ASAP) 14
Local Food – Frequency of Purchases Respondents’ estimates of how often they buy locally grown food provide additional data on expenditure patterns. The 2011 survey asked: “When shopping for your household, do you typically purchase locally grown foods weekly (when in season), monthly (when in season), a few times a year, once a year, or never?” Six in ten Western North Carolina consumers (60%) reported weekly purchases of local foods products, when in season. Approximately one-quarter (23%) said that they make monthly purchases, and 16% reported buying local products a few times a year or less. The reported frequency of local food expenditures is correlated with the share of the total food bill spent on locally grown products. Among shoppers who said that they spend less than 5% of their total budget on local food, fewer than half (46%) reported weekly local food purchases (chart below). By contrast, among those who reported spending more than 10% of their budget on local products, about 7 in 10 (69%) said that they purchase locally grown foods each week.
Just as there is little difference between shoppers in the core three counties versus the six westernmost counties with respect to the reported share of the budget allocated to local food (see previous section), likewise there is little geographic variation in the
2%1%
13%
23%
60%
0%
10%
20%
30%
40%
50%
60%
70%
Never Once a year Few times/year Monthly Weekly
Frequency of Local Food Purchases - All Counties, 2011
“When shopping for your household, do you typically purchase locally grown foods weekly
(when in season), monthly (when in season), a few times a year, once a year, or never?”
Reported Frequency of Local Food Purchases
% of Total Food
Budget Spent on
Local Food
neveronce a
year
few
times/yrmonthly weekly Total
0-5% 4% 3% 27% 21% 46% 100%
6-10% -- -- 8% 32% 61% 100%
11-20% 1% 2% 13% 16% 69% 100%
over 20% 2% 1% 9% 19% 69% 100%
Total
(9 Counties)2% 1% 13% 23% 60% 100%
Note: Percentages do not always sum to 100 due to rounding. ―Don’t knows‖ excluded from the analysis.
A Survey of Consumer Behavior and Perceptions in WNC
Appalachian Sustainable Agriculture Project (ASAP) 15
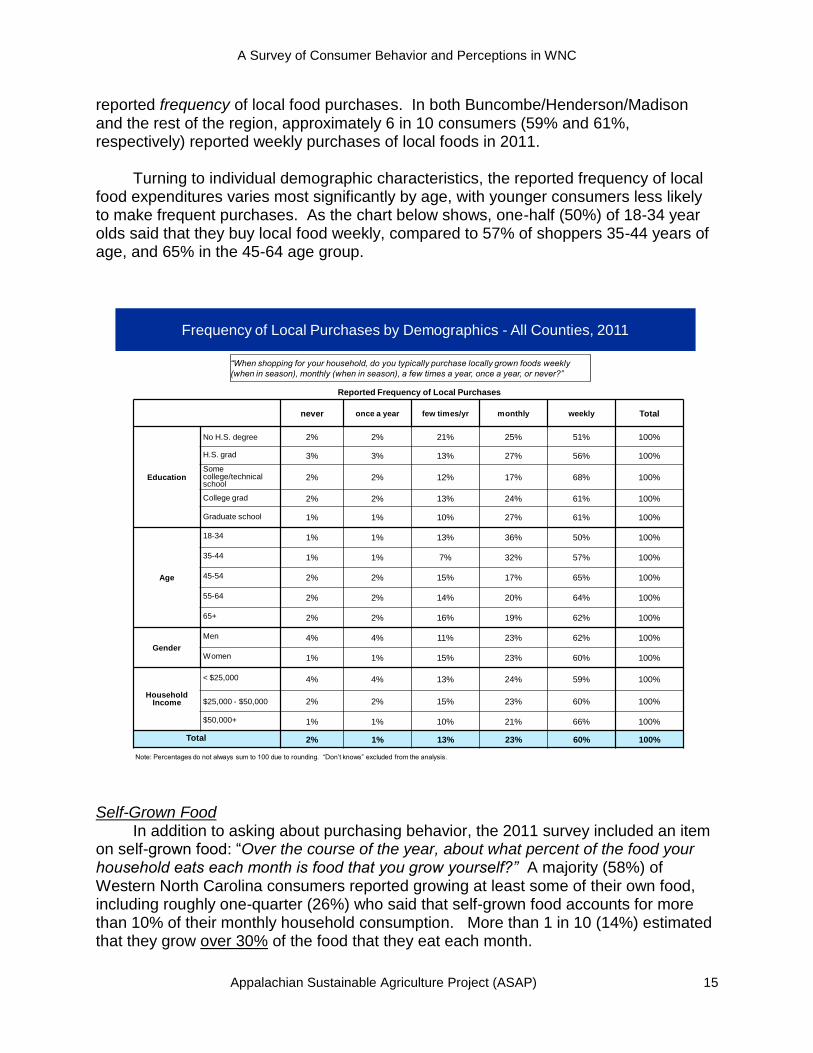
reported frequency of local food purchases. In both Buncombe/Henderson/Madison and the rest of the region, approximately 6 in 10 consumers (59% and 61%, respectively) reported weekly purchases of local foods in 2011. Turning to individual demographic characteristics, the reported frequency of local food expenditures varies most significantly by age, with younger consumers less likely to make frequent purchases. As the chart below shows, one-half (50%) of 18-34 year olds said that they buy local food weekly, compared to 57% of shoppers 35-44 years of age, and 65% in the 45-64 age group.
never once a year few times/yr monthly weekly Total
Education
No H.S. degree 2% 2% 21% 25% 51% 100%
H.S. grad 3% 3% 13% 27% 56% 100%
Some college/technical school
2% 2% 12% 17% 68% 100%
College grad 2% 2% 13% 24% 61% 100%
Graduate school 1% 1% 10% 27% 61% 100%
Age
18-34 1% 1% 13% 36% 50% 100%
35-44 1% 1% 7% 32% 57% 100%
45-54 2% 2% 15% 17% 65% 100%
55-64 2% 2% 14% 20% 64% 100%
65+ 2% 2% 16% 19% 62% 100%
Gender
Men 4% 4% 11% 23% 62% 100%
Women 1% 1% 15% 23% 60% 100%
Household Income
< $25,000 4% 4% 13% 24% 59% 100%
$25,000 - $50,000 2% 2% 15% 23% 60% 100%
$50,000+ 1% 1% 10% 21% 66% 100%
Total 2% 1% 13% 23% 60% 100%
Frequency of Local Purchases by Demographics - All Counties, 2011
Note: Percentages do not always sum to 100 due to rounding. ―Don’t knows‖ excluded from the analysis.
“When shopping for your household, do you typically purchase locally grown foods weekly
(when in season), monthly (when in season), a few times a year, once a year, or never?”
Reported Frequency of Local Purchases
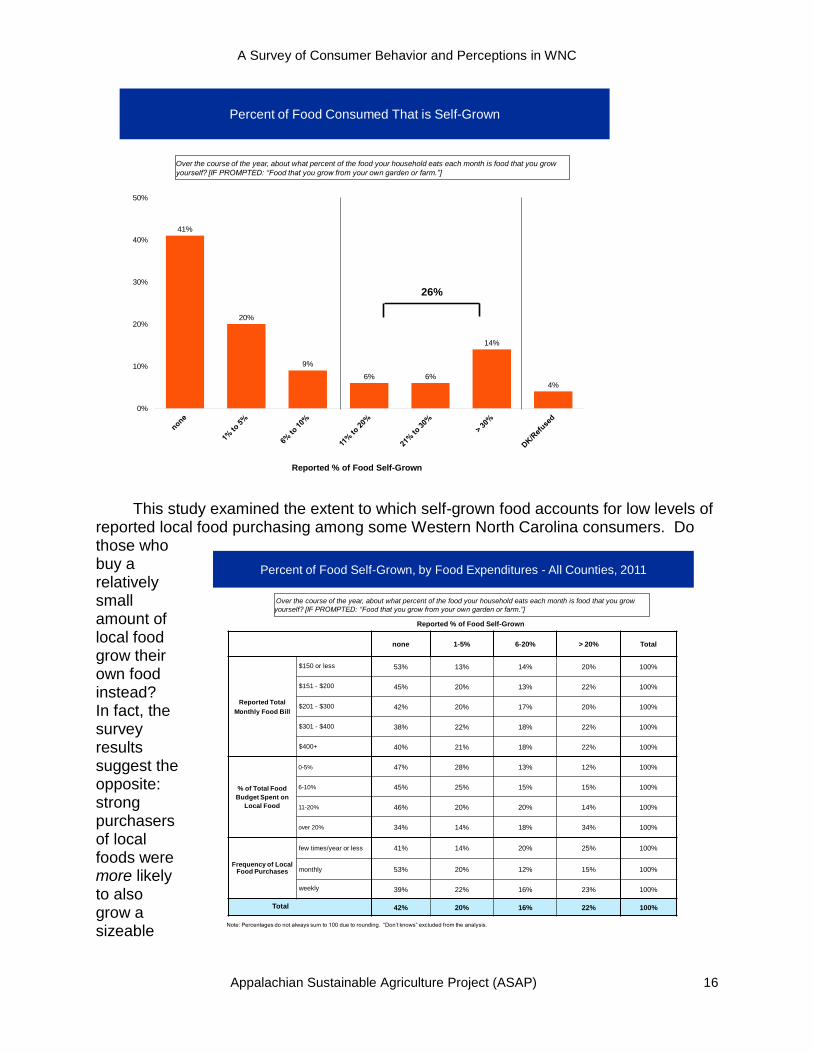
Self-Grown Food In addition to asking about purchasing behavior, the 2011 survey included an item on self-grown food: ―Over the course of the year, about what percent of the food your household eats each month is food that you grow yourself?” A majority (58%) of Western North Carolina consumers reported growing at least some of their own food, including roughly one-quarter (26%) who said that self-grown food accounts for more than 10% of their monthly household consumption. More than 1 in 10 (14%) estimated that they grow over 30% of the food that they eat each month.
A Survey of Consumer Behavior and Perceptions in WNC
Appalachian Sustainable Agriculture Project (ASAP) 16
This study examined the extent to which self-grown food accounts for low levels of reported local food purchasing among some Western North Carolina consumers. Do those who buy a relatively small amount of local food grow their own food instead? In fact, the survey results suggest the opposite: strong purchasers of local foods were more likely to also grow a sizeable
Percent of Food Consumed That is Self-Grown
41%
20%
9%
6% 6%
14%
4%
0%
10%
20%
30%
40%
50%
Over the course of the year, about what percent of the food your household eats each month is food that you grow
yourself? [IF PROMPTED: “Food that you grow from your own garden or farm.”]
Reported % of Food Self-Grown
26%
none 1-5% 6-20% > 20% Total
Reported Total
Monthly Food Bill
$150 or less 53% 13% 14% 20% 100%
$151 - $200 45% 20% 13% 22% 100%
$201 - $300 42% 20% 17% 20% 100%
$301 - $400 38% 22% 18% 22% 100%
$400+ 40% 21% 18% 22% 100%
% of Total Food
Budget Spent on
Local Food
0-5% 47% 28% 13% 12% 100%
6-10% 45% 25% 15% 15% 100%
11-20% 46% 20% 20% 14% 100%
over 20% 34% 14% 18% 34% 100%
Frequency of Local Food Purchases
few times/year or less 41% 14% 20% 25% 100%
monthly 53% 20% 12% 15% 100%
weekly 39% 22% 16% 23% 100%
Total 42% 20% 16% 22% 100%
Percent of Food Self-Grown, by Food Expenditures - All Counties, 2011
Note: Percentages do not always sum to 100 due to rounding. ―Don’t knows‖ excluded from the analysis.
Reported % of Food Self-Grown
Over the course of the year, about what percent of the food your household eats each month is food that you grow
yourself? [IF PROMPTED: “Food that you grow from your own garden or farm.”]
A Survey of Consumer Behavior and Perceptions in WNC
Appalachian Sustainable Agriculture Project (ASAP) 17
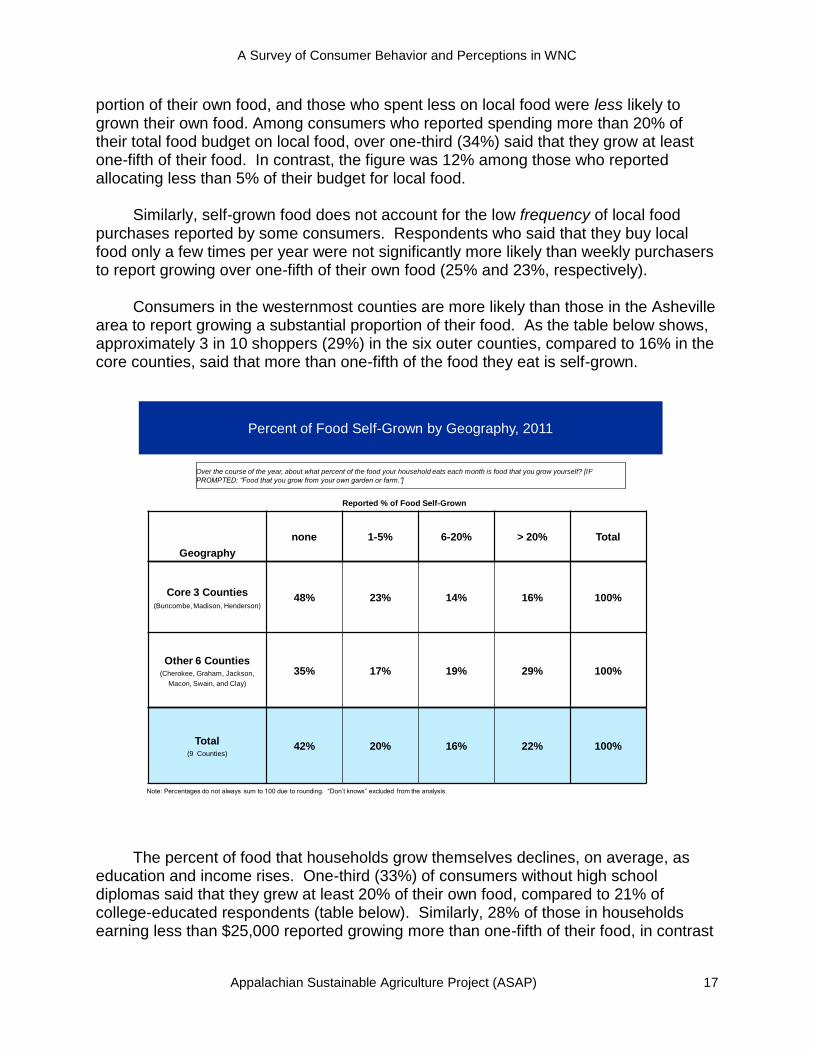
portion of their own food, and those who spent less on local food were less likely to grown their own food. Among consumers who reported spending more than 20% of their total food budget on local food, over one-third (34%) said that they grow at least one-fifth of their food. In contrast, the figure was 12% among those who reported allocating less than 5% of their budget for local food. Similarly, self-grown food does not account for the low frequency of local food purchases reported by some consumers. Respondents who said that they buy local food only a few times per year were not significantly more likely than weekly purchasers to report growing over one-fifth of their own food (25% and 23%, respectively). Consumers in the westernmost counties are more likely than those in the Asheville area to report growing a substantial proportion of their food. As the table below shows, approximately 3 in 10 shoppers (29%) in the six outer counties, compared to 16% in the core counties, said that more than one-fifth of the food they eat is self-grown.
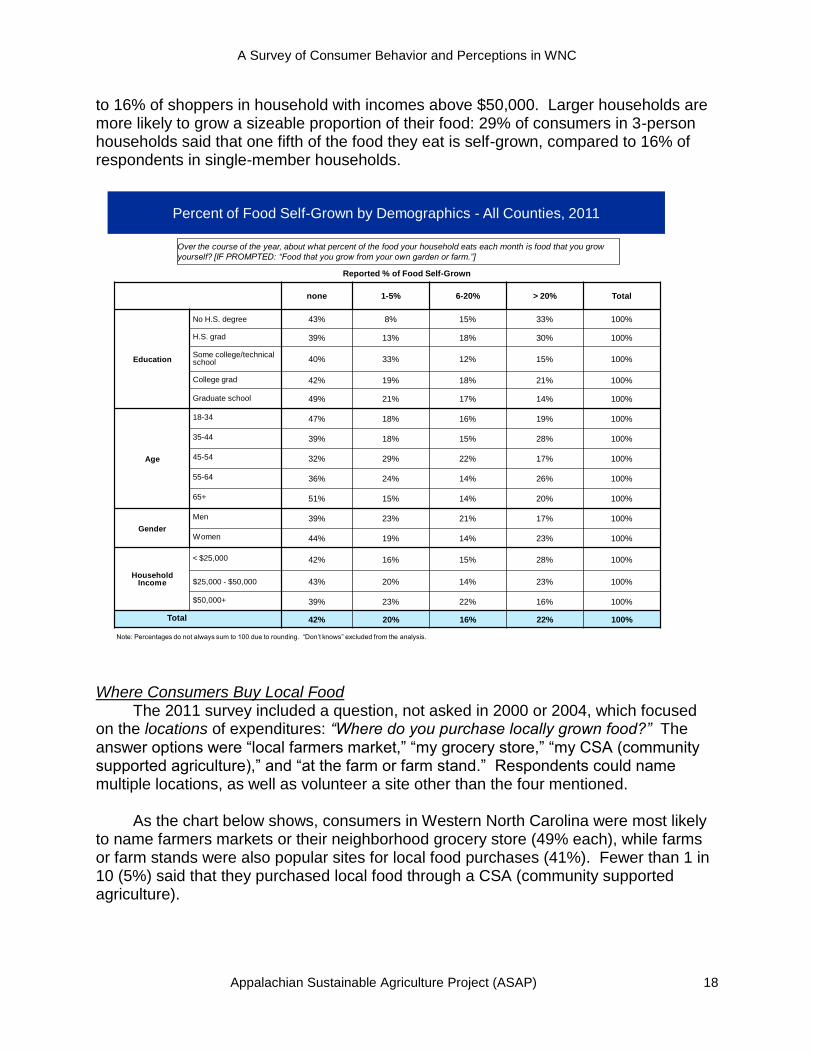
The percent of food that households grow themselves declines, on average, as education and income rises. One-third (33%) of consumers without high school diplomas said that they grew at least 20% of their own food, compared to 21% of college-educated respondents (table below). Similarly, 28% of those in households earning less than $25,000 reported growing more than one-fifth of their food, in contrast
Geography
none 1-5% 6-20% > 20% Total
Core 3 Counties(Buncombe, Madison, Henderson)
48% 23% 14% 16% 100%
Other 6 Counties(Cherokee, Graham, Jackson,
Macon, Swain, and Clay)
35% 17% 19% 29% 100%
Total (9 Counties)
42% 20% 16% 22% 100%
Reported % of Food Self-Grown
Percent of Food Self-Grown by Geography, 2011
Note: Percentages do not always sum to 100 due to rounding. ―Don’t knows‖ excluded from the analysis.
Over the course of the year, about what percent of the food your household eats each month is food that you grow yourself? [IF
PROMPTED: “Food that you grow from your own garden or farm.”]
A Survey of Consumer Behavior and Perceptions in WNC
Appalachian Sustainable Agriculture Project (ASAP) 18
to 16% of shoppers in household with incomes above $50,000. Larger households are more likely to grow a sizeable proportion of their food: 29% of consumers in 3-person households said that one fifth of the food they eat is self-grown, compared to 16% of respondents in single-member households.
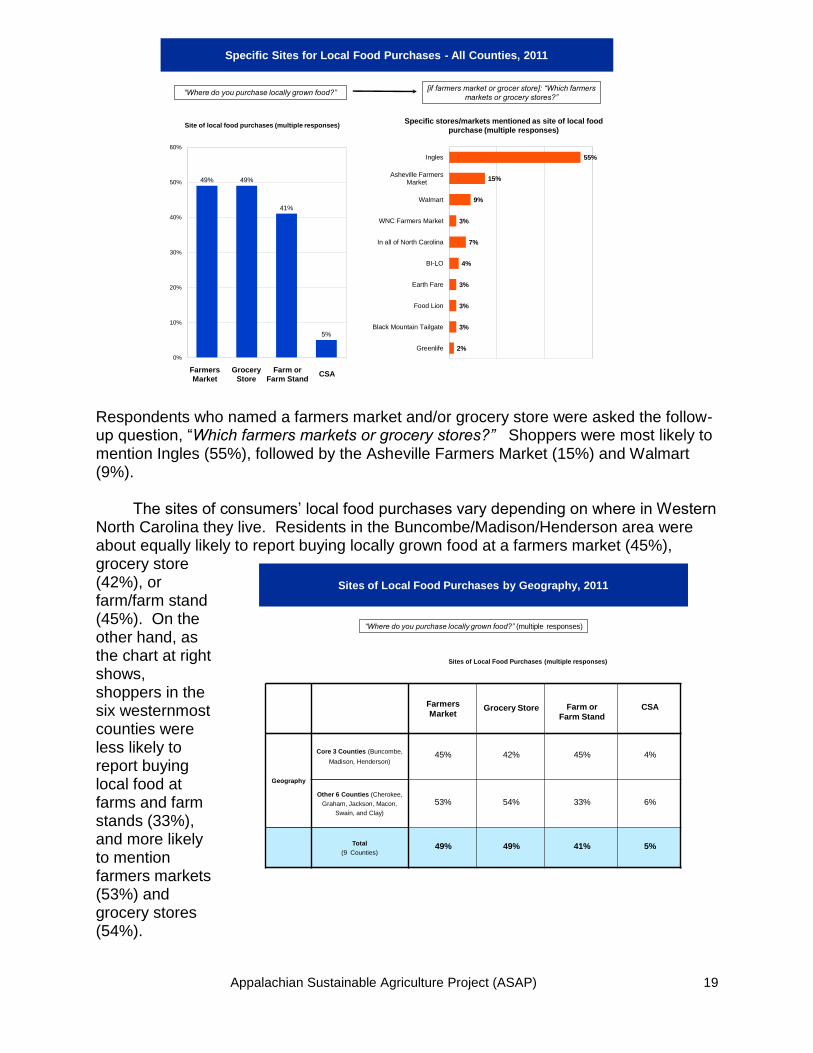
Where Consumers Buy Local Food The 2011 survey included a question, not asked in 2000 or 2004, which focused on the locations of expenditures: “Where do you purchase locally grown food?” The answer options were ―local farmers market,‖ ―my grocery store,‖ ―my CSA (community supported agriculture),‖ and ―at the farm or farm stand.‖ Respondents could name multiple locations, as well as volunteer a site other than the four mentioned. As the chart below shows, consumers in Western North Carolina were most likely to name farmers markets or their neighborhood grocery store (49% each), while farms or farm stands were also popular sites for local food purchases (41%). Fewer than 1 in 10 (5%) said that they purchased local food through a CSA (community supported agriculture).
none 1-5% 6-20% > 20% Total
Education
No H.S. degree 43% 8% 15% 33% 100%
H.S. grad 39% 13% 18% 30% 100%
Some college/technical school 40% 33% 12% 15% 100%
College grad 42% 19% 18% 21% 100%
Graduate school 49% 21% 17% 14% 100%
Age
18-34 47% 18% 16% 19% 100%
35-44 39% 18% 15% 28% 100%
45-54 32% 29% 22% 17% 100%
55-64 36% 24% 14% 26% 100%
65+ 51% 15% 14% 20% 100%
Gender
Men 39% 23% 21% 17% 100%
Women 44% 19% 14% 23% 100%
Household Income
< $25,000 42% 16% 15% 28% 100%
$25,000 - $50,000 43% 20% 14% 23% 100%
$50,000+ 39% 23% 22% 16% 100%
Total 42% 20% 16% 22% 100%
Percent of Food Self-Grown by Demographics - All Counties, 2011
Note: Percentages do not always sum to 100 due to rounding. ―Don’t knows‖ excluded from the analysis.
Reported % of Food Self-Grown
Over the course of the year, about what percent of the food your household eats each month is food that you grow
yourself? [IF PROMPTED: “Food that you grow from your own garden or farm.”]
A Survey of Consumer Behavior and Perceptions in WNC
Appalachian Sustainable Agriculture Project (ASAP) 19
Respondents who named a farmers market and/or grocery store were asked the follow-up question, ―Which farmers markets or grocery stores?” Shoppers were most likely to mention Ingles (55%), followed by the Asheville Farmers Market (15%) and Walmart (9%). The sites of consumers’ local food purchases vary depending on where in Western North Carolina they live. Residents in the Buncombe/Madison/Henderson area were about equally likely to report buying locally grown food at a farmers market (45%), grocery store (42%), or farm/farm stand (45%). On the other hand, as the chart at right shows, shoppers in the six westernmost counties were less likely to report buying local food at farms and farm stands (33%), and more likely to mention farmers markets (53%) and grocery stores (54%).
49% 49%
41%
5%
0%
10%
20%
30%
40%
50%
60%
Site of local food purchases (multiple responses)
Farmers
Market
Grocery
Store
Farm or
Farm StandCSA
55%
15%
9%
3%
7%
4%
3%
3%
3%
2%
Ingles
Asheville FarmersMarket
Walmart
WNC Farmers Market
In all of North Carolina
BI-LO
Earth Fare
Food Lion
Black Mountain Tailgate
Greenlife
“Where do you purchase locally grown food?”[if farmers market or grocer store]: “Which farmers
markets or grocery stores?”
Specific stores/markets mentioned as site of local food
purchase (multiple responses)
Specific Sites for Local Food Purchases - All Counties, 2011
Farmers
MarketGrocery Store Farm or
Farm StandCSA
Geography
Core 3 Counties (Buncombe,
Madison, Henderson)45% 42% 45% 4%
Other 6 Counties (Cherokee,
Graham, Jackson, Macon,
Swain, and Clay)
53% 54% 33% 6%
Total
(9 Counties)49% 49% 41% 5%
“Where do you purchase locally grown food?” (multiple responses)
Sites of Local Food Purchases by Geography, 2011
Sites of Local Food Purchases (multiple responses)

A Survey of Consumer Behavior and Perceptions in WNC
Appalachian Sustainable Agriculture Project (ASAP) 20
The reported locations of consumers’ local food purchases were generally similar across individual demographics, including gender, income, age, education, length of residence in Western North Carolina, and household size. Advertising and Materials Promoting Local Food Awareness of Communications In both 2004 and 2011, respondents were asked: “Have you seen or heard any advertising or materials promoting locally grown food in the past 12 months?” Those who responded affirmatively were asked a follow up question about the sources of information: “Did you read or hear about it from . . .”
As the chart above shows, in the core three counties 6 in 10 shoppers (60%) recalled seeing or hearing advertising promoting locally grown foods in 2011, up from 53% in 2004. Among those who recalled exposure to advertising, newspapers were the most commonly cited source of information in both 2004 and 2011 (30% and 29%, respectively). In 2011, respondents were also likely to report seeing or hearing about locally grown food through word-of-mouth communication (26%), television (23%), bumper stickers (20%), and magazines (20%). Moving to an analysis of the entire sample of Western North Carolina consumers
30%
0%
20%
12%
6%
0%
0%
0%
0%
0%
29%
26%
23%
20%
20%
13%
13%
8%
5%
4%
0% 10% 20% 30%
Newspapers
Word of Mouth
Television
Bumper sticker
Magazine
Radio
Billboard
Websites
Social media
Books
Read or heard about it from....
53%
47%
60%
40%
0%
10%
20%
30%
40%
50%
60%
70%
2004
2011
Yes No
Seen or Heard Advertising
“Have you seen or heard any advertising or materials promoting
locally grown food in the past 12 months?”[if yes]: “Did you read or hear about it from . . .”
Seen Or Heard Promotional Materials - Core 3 Counties, 2004/2011
+7
A Survey of Consumer Behavior and Perceptions in WNC
Appalachian Sustainable Agriculture Project (ASAP) 21
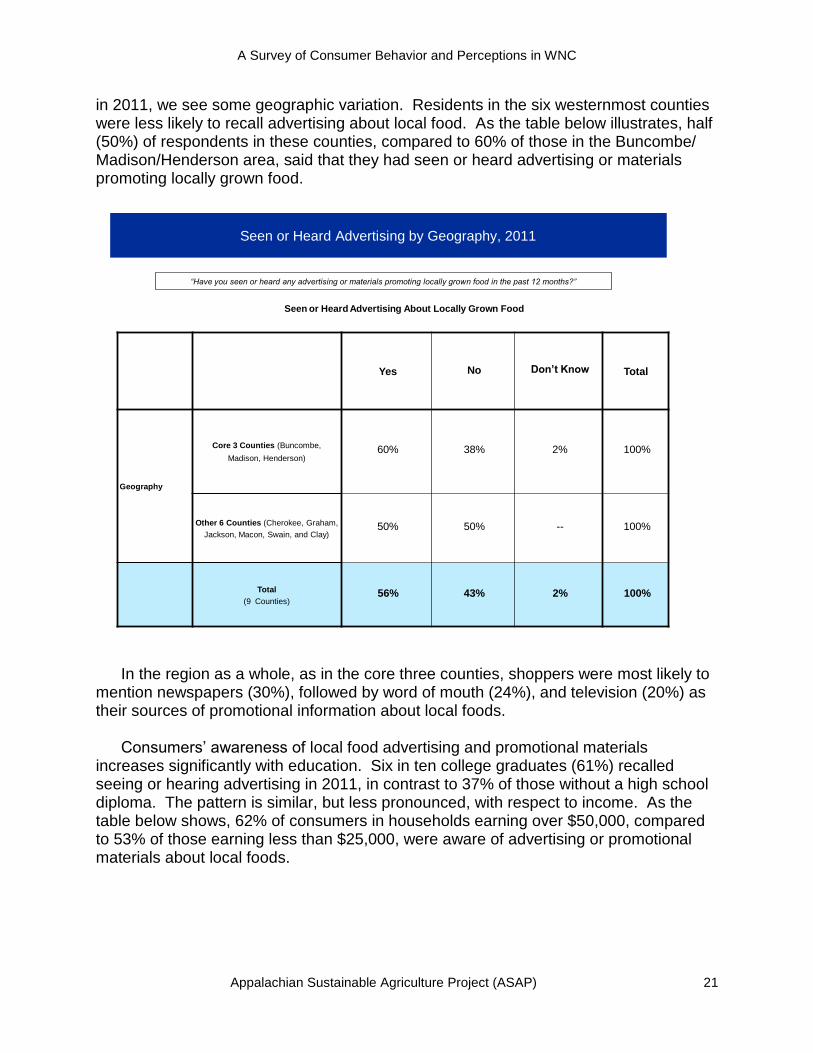
in 2011, we see some geographic variation. Residents in the six westernmost counties were less likely to recall advertising about local food. As the table below illustrates, half (50%) of respondents in these counties, compared to 60% of those in the Buncombe/ Madison/Henderson area, said that they had seen or heard advertising or materials promoting locally grown food.
In the region as a whole, as in the core three counties, shoppers were most likely to mention newspapers (30%), followed by word of mouth (24%), and television (20%) as their sources of promotional information about local foods.
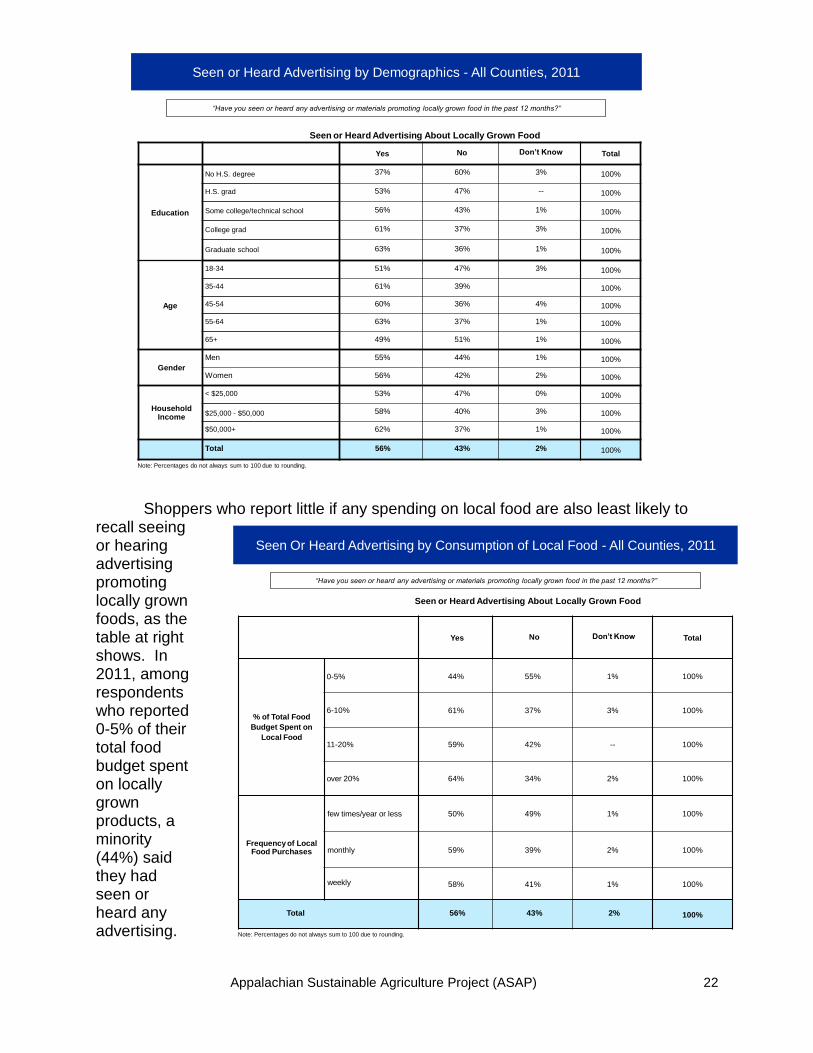
Consumers’ awareness of local food advertising and promotional materials increases significantly with education. Six in ten college graduates (61%) recalled seeing or hearing advertising in 2011, in contrast to 37% of those without a high school diploma. The pattern is similar, but less pronounced, with respect to income. As the table below shows, 62% of consumers in households earning over $50,000, compared to 53% of those earning less than $25,000, were aware of advertising or promotional materials about local foods.
Yes No Don’t Know Total
Geography
Core 3 Counties (Buncombe,
Madison, Henderson)60% 38% 2% 100%
Other 6 Counties (Cherokee, Graham,
Jackson, Macon, Swain, and Clay)50% 50% -- 100%
Total
(9 Counties)56% 43% 2% 100%
Seen or Heard Advertising by Geography, 2011
Seen or Heard Advertising About Locally Grown Food
“Have you seen or heard any advertising or materials promoting locally grown food in the past 12 months?”
A Survey of Consumer Behavior and Perceptions in WNC
Appalachian Sustainable Agriculture Project (ASAP) 22
Yes No Don’t Know Total
Education
No H.S. degree 37% 60% 3% 100%
H.S. grad 53% 47% -- 100%
Some college/technical school 56% 43% 1% 100%
College grad 61% 37% 3% 100%
Graduate school 63% 36% 1% 100%
Age
18-34 51% 47% 3% 100%
35-44 61% 39% 100%
45-54 60% 36% 4% 100%
55-64 63% 37% 1% 100%
65+ 49% 51% 1% 100%
Gender
Men 55% 44% 1% 100%
Women 56% 42% 2% 100%
Household Income
< $25,000 53% 47% 0% 100%
$25,000 - $50,000 58% 40% 3% 100%
$50,000+ 62% 37% 1% 100%
Total 56% 43% 2% 100%
Seen or Heard Advertising by Demographics - All Counties, 2011
Seen or Heard Advertising About Locally Grown Food
“Have you seen or heard any advertising or materials promoting locally grown food in the past 12 months?”
Note: Percentages do not always sum to 100 due to rounding.
Shoppers who report little if any spending on local food are also least likely to
recall seeing or hearing advertising promoting locally grown foods, as the table at right shows. In 2011, among respondents who reported 0-5% of their total food budget spent on locally grown products, a minority (44%) said they had seen or heard any advertising.
Yes No Don’t Know Total
% of Total Food
Budget Spent on
Local Food
0-5% 44% 55% 1% 100%
6-10% 61% 37% 3% 100%
11-20% 59% 42% -- 100%
over 20% 64% 34% 2% 100%
Frequency of Local Food Purchases
few times/year or less 50% 49% 1% 100%
monthly 59% 39% 2% 100%
weekly 58% 41% 1% 100%
Total 56% 43% 2% 100%
Seen Or Heard Advertising by Consumption of Local Food - All Counties, 2011
Note: Percentages do not always sum to 100 due to rounding.
Seen or Heard Advertising About Locally Grown Food
“Have you seen or heard any advertising or materials promoting locally grown food in the past 12 months?”
A Survey of Consumer Behavior and Perceptions in WNC
Appalachian Sustainable Agriculture Project (ASAP) 23
Influence of Advertising on Purchasing Over Time - Core Counties, 2004/2011
53%
45%
2%
57%
43%
1%
0%
10%
20%
30%
40%
50%
60%
70%
2004
2011
+4
53%
47%
60%
40%
0%
10%
20%
30%
40%
50%
60%
70%
Yes No
“Have you seen or heard any advertising or materials promoting
locally grown food in the past 12 months?”[If yes]: Have these messages or what you learned about locally grown
food increased your purchases of locally grown food?
Messages Increased Local Food PurchasesSeen or Heard Advertising
YesNo, already
purchase all I need
No, do not
purchase
+7
Note: Percentages do not always sum to 100 due to rounding. ―Don’t knows‖ excluded from the analysis.
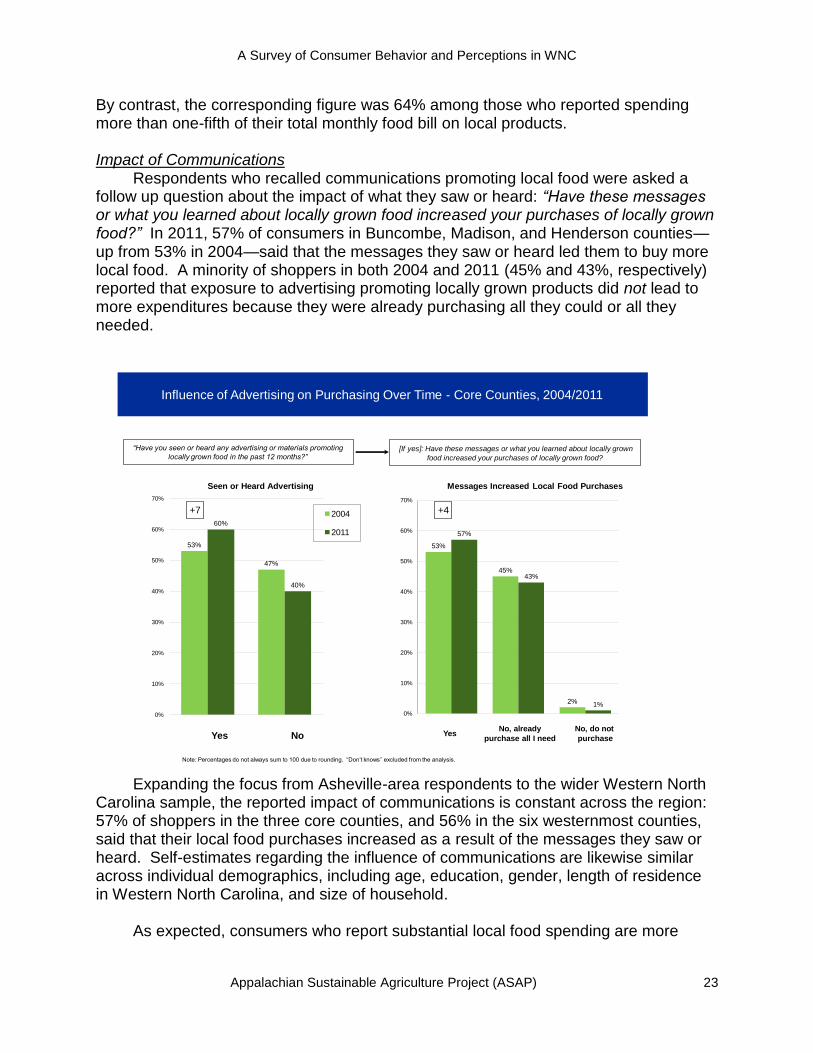
By contrast, the corresponding figure was 64% among those who reported spending more than one-fifth of their total monthly food bill on local products. Impact of Communications Respondents who recalled communications promoting local food were asked a follow up question about the impact of what they saw or heard: “Have these messages or what you learned about locally grown food increased your purchases of locally grown food?” In 2011, 57% of consumers in Buncombe, Madison, and Henderson counties— up from 53% in 2004—said that the messages they saw or heard led them to buy more local food. A minority of shoppers in both 2004 and 2011 (45% and 43%, respectively) reported that exposure to advertising promoting locally grown products did not lead to more expenditures because they were already purchasing all they could or all they needed.
Expanding the focus from Asheville-area respondents to the wider Western North Carolina sample, the reported impact of communications is constant across the region: 57% of shoppers in the three core counties, and 56% in the six westernmost counties, said that their local food purchases increased as a result of the messages they saw or heard. Self-estimates regarding the influence of communications are likewise similar across individual demographics, including age, education, gender, length of residence in Western North Carolina, and size of household. As expected, consumers who report substantial local food spending are more
A Survey of Consumer Behavior and Perceptions in WNC
Appalachian Sustainable Agriculture Project (ASAP) 24
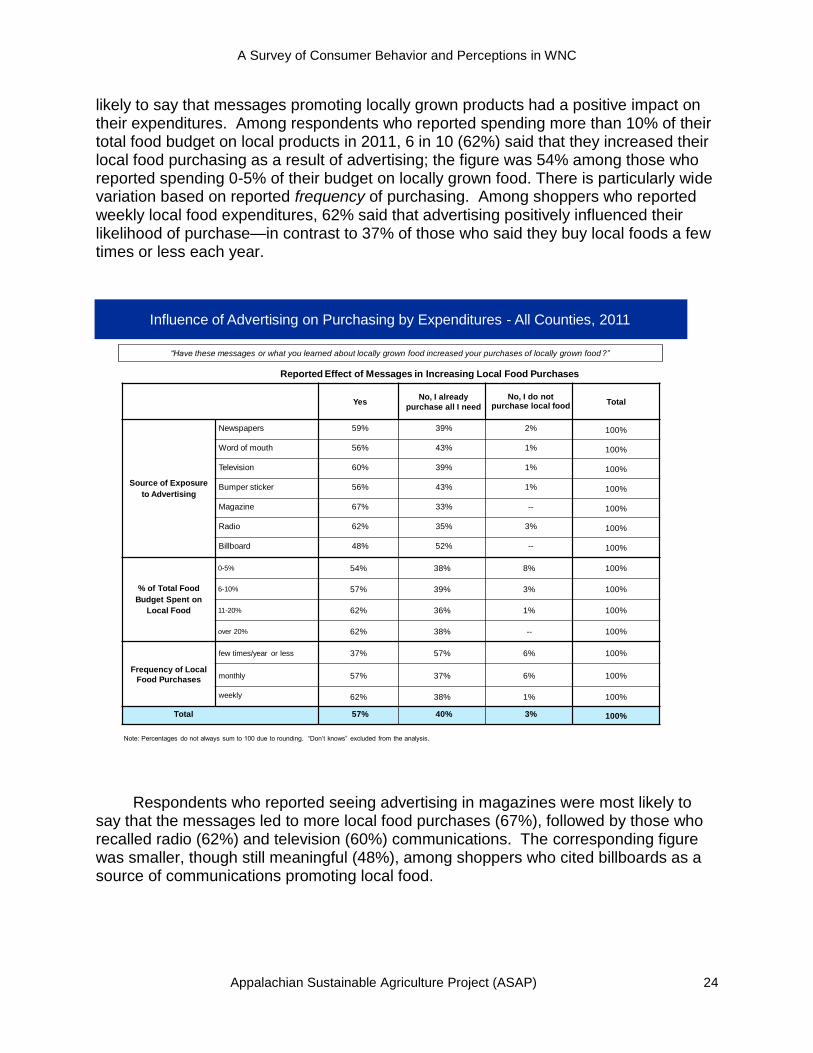
likely to say that messages promoting locally grown products had a positive impact on their expenditures. Among respondents who reported spending more than 10% of their total food budget on local products in 2011, 6 in 10 (62%) said that they increased their local food purchasing as a result of advertising; the figure was 54% among those who reported spending 0-5% of their budget on locally grown food. There is particularly wide variation based on reported frequency of purchasing. Among shoppers who reported weekly local food expenditures, 62% said that advertising positively influenced their likelihood of purchase—in contrast to 37% of those who said they buy local foods a few times or less each year.
Respondents who reported seeing advertising in magazines were most likely to say that the messages led to more local food purchases (67%), followed by those who recalled radio (62%) and television (60%) communications. The corresponding figure was smaller, though still meaningful (48%), among shoppers who cited billboards as a source of communications promoting local food.
YesNo, I already
purchase all I need
No, I do not purchase local food
Total
Source of Exposure
to Advertising
Newspapers 59% 39% 2% 100%
Word of mouth 56% 43% 1% 100%
Television 60% 39% 1% 100%
Bumper sticker 56% 43% 1% 100%
Magazine 67% 33% -- 100%
Radio 62% 35% 3% 100%
Billboard 48% 52% -- 100%
% of Total Food
Budget Spent on
Local Food
0-5% 54% 38% 8% 100%
6-10% 57% 39% 3% 100%
11-20% 62% 36% 1% 100%
over 20% 62% 38% -- 100%
Frequency of Local
Food Purchases
few times/year or less 37% 57% 6% 100%
monthly 57% 37% 6% 100%
weekly 62% 38% 1% 100%
Total 57% 40% 3% 100%
Note: Percentages do not always sum to 100 due to rounding. ―Don’t knows‖ excluded from the analysis.
Influence of Advertising on Purchasing by Expenditures - All Counties, 2011
Reported Effect of Messages in Increasing Local Food Purchases
“Have these messages or what you learned about locally grown food increased your purchases of locally grown food?”
A Survey of Consumer Behavior and Perceptions in WNC
Appalachian Sustainable Agriculture Project (ASAP) 25
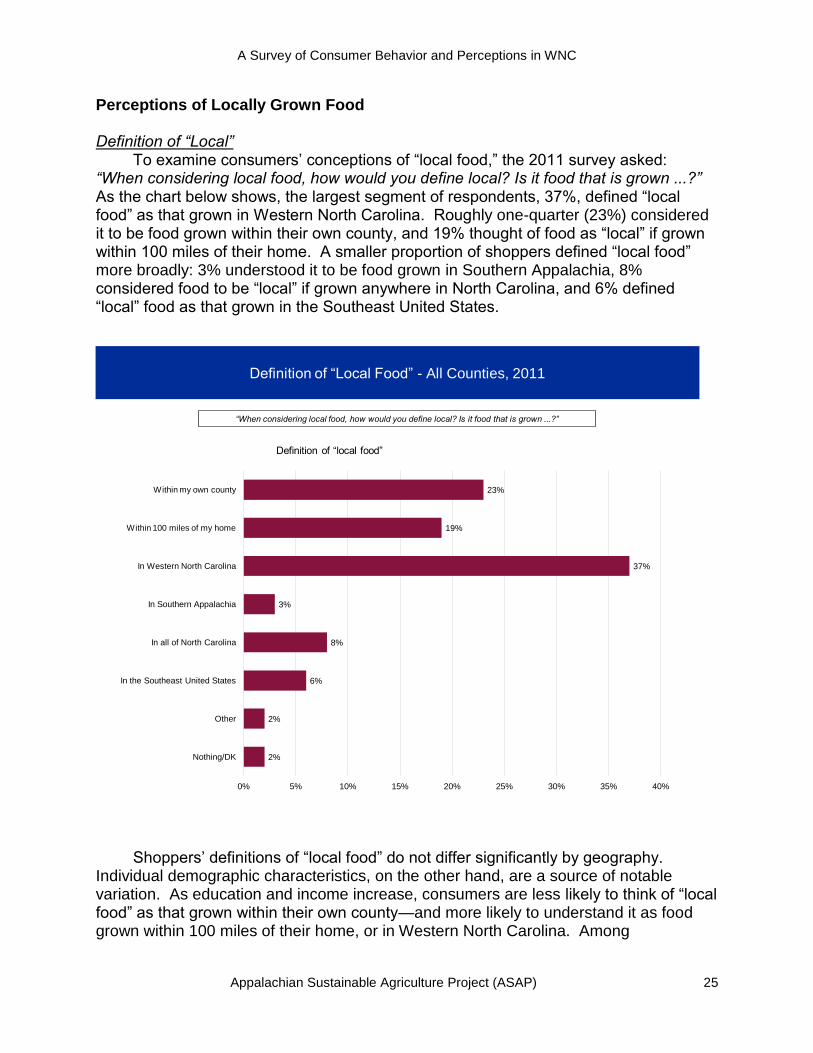
Perceptions of Locally Grown Food Definition of “Local” To examine consumers’ conceptions of ―local food,‖ the 2011 survey asked: “When considering local food, how would you define local? Is it food that is grown ...?” As the chart below shows, the largest segment of respondents, 37%, defined ―local food‖ as that grown in Western North Carolina. Roughly one-quarter (23%) considered it to be food grown within their own county, and 19% thought of food as ―local‖ if grown within 100 miles of their home. A smaller proportion of shoppers defined ―local food‖ more broadly: 3% understood it to be food grown in Southern Appalachia, 8% considered food to be ―local‖ if grown anywhere in North Carolina, and 6% defined ―local‖ food as that grown in the Southeast United States.
Shoppers’ definitions of ―local food‖ do not differ significantly by geography. Individual demographic characteristics, on the other hand, are a source of notable variation. As education and income increase, consumers are less likely to think of ―local food‖ as that grown within their own county—and more likely to understand it as food grown within 100 miles of their home, or in Western North Carolina. Among
Definition of ―Local Food‖ - All Counties, 2011
23%
19%
37%
3%
8%
6%
2%
2%
0% 5% 10% 15% 20% 25% 30% 35% 40%
Within my own county
Within 100 miles of my home
In Western North Carolina
In Southern Appalachia
In all of North Carolina
In the Southeast United States
Other
Nothing/DK
Definition of “local food”
“When considering local food, how would you define local? Is it food that is grown ...?”
A Survey of Consumer Behavior and Perceptions in WNC
Appalachian Sustainable Agriculture Project (ASAP) 26
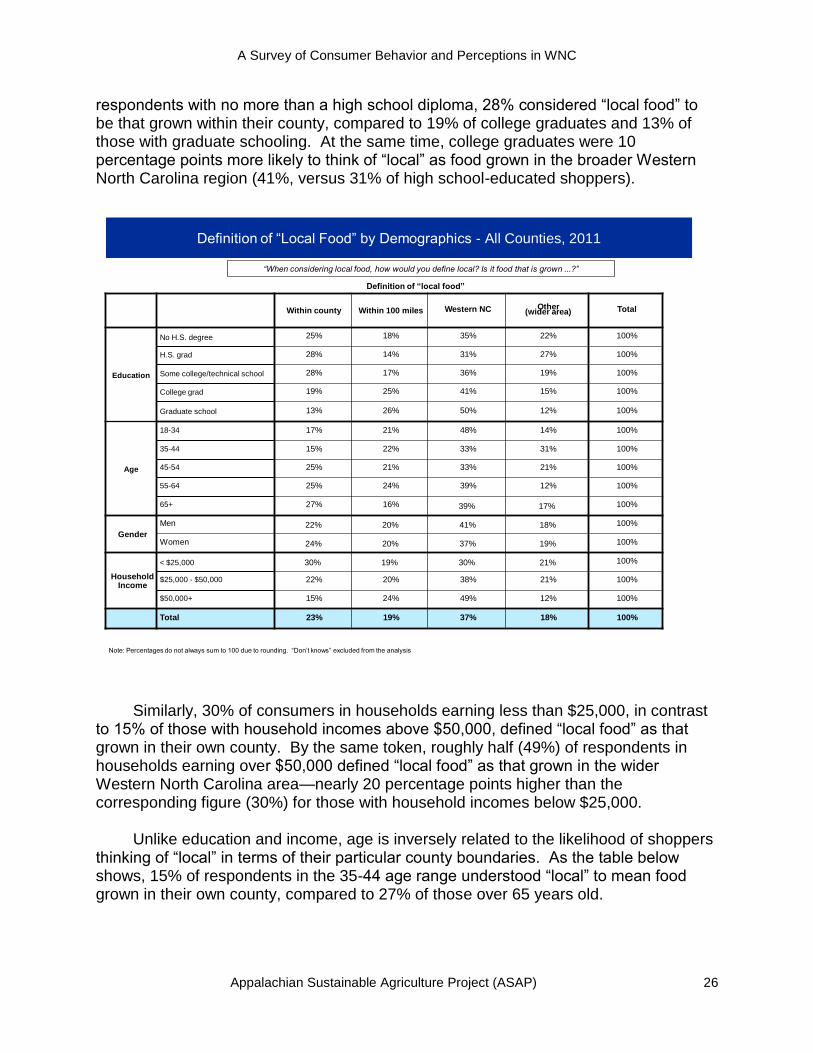
respondents with no more than a high school diploma, 28% considered ―local food‖ to be that grown within their county, compared to 19% of college graduates and 13% of those with graduate schooling. At the same time, college graduates were 10 percentage points more likely to think of ―local‖ as food grown in the broader Western North Carolina region (41%, versus 31% of high school-educated shoppers).
Similarly, 30% of consumers in households earning less than $25,000, in contrast to 15% of those with household incomes above $50,000, defined ―local food‖ as that grown in their own county. By the same token, roughly half (49%) of respondents in households earning over $50,000 defined ―local food‖ as that grown in the wider Western North Carolina area—nearly 20 percentage points higher than the corresponding figure (30%) for those with household incomes below $25,000. Unlike education and income, age is inversely related to the likelihood of shoppers thinking of ―local‖ in terms of their particular county boundaries. As the table below shows, 15% of respondents in the 35-44 age range understood ―local‖ to mean food grown in their own county, compared to 27% of those over 65 years old.
Within county Within 100 miles Western NC Other (wider area) Total
Education
No H.S. degree 25% 18% 35% 22% 100%
H.S. grad 28% 14% 31% 27% 100%
Some college/technical school 28% 17% 36% 19% 100%
College grad 19% 25% 41% 15% 100%
Graduate school 13% 26% 50% 12% 100%
Age
18-34 17% 21% 48% 14% 100%
35-44 15% 22% 33% 31% 100%
45-54 25% 21% 33% 21% 100%
55-64 25% 24% 39% 12% 100%
65+ 27% 16% 39% 17% 100%
Gender
Men 22% 20% 41% 18% 100%
Women 24% 20% 37% 19% 100%
Household Income
< $25,000 30% 19% 30% 21% 100%
$25,000 - $50,000 22% 20% 38% 21% 100%
$50,000+ 15% 24% 49% 12% 100%
Total 23% 19% 37% 18% 100%
Definition of ―Local Food‖ by Demographics - All Counties, 2011
“When considering local food, how would you define local? Is it food that is grown ...?”
Note: Percentages do not always sum to 100 due to rounding. ―Don’t knows‖ excluded from the analysis
Definition of “local food”
A Survey of Consumer Behavior and Perceptions in WNC
Appalachian Sustainable Agriculture Project (ASAP) 27
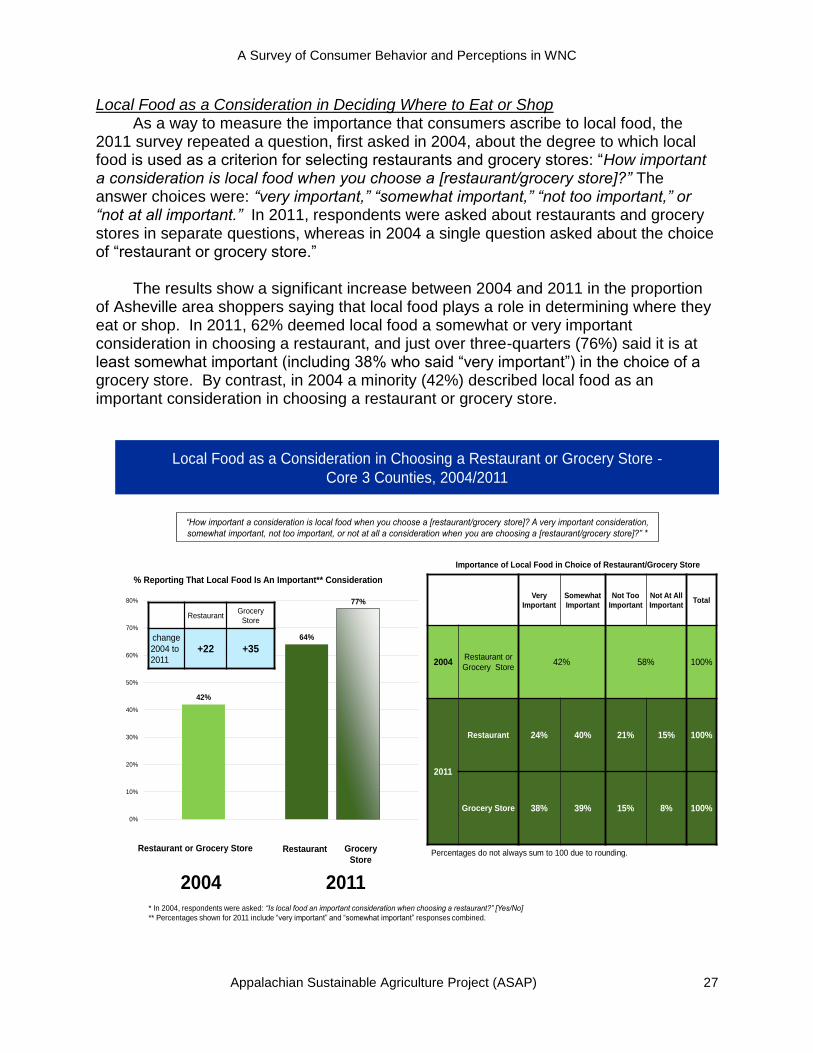
Local Food as a Consideration in Deciding Where to Eat or Shop As a way to measure the importance that consumers ascribe to local food, the 2011 survey repeated a question, first asked in 2004, about the degree to which local food is used as a criterion for selecting restaurants and grocery stores: ―How important a consideration is local food when you choose a [restaurant/grocery store]?” The answer choices were: “very important,” “somewhat important,” “not too important,” or “not at all important.” In 2011, respondents were asked about restaurants and grocery stores in separate questions, whereas in 2004 a single question asked about the choice of ―restaurant or grocery store.‖ The results show a significant increase between 2004 and 2011 in the proportion of Asheville area shoppers saying that local food plays a role in determining where they eat or shop. In 2011, 62% deemed local food a somewhat or very important consideration in choosing a restaurant, and just over three-quarters (76%) said it is at least somewhat important (including 38% who said ―very important‖) in the choice of a grocery store. By contrast, in 2004 a minority (42%) described local food as an important consideration in choosing a restaurant or grocery store.
42%
64%
77%
0%
10%
20%
30%
40%
50%
60%
70%
80%
% Reporting That Local Food Is An Important** Consideration
Local Food as a Consideration in Choosing a Restaurant or Grocery Store -
Core 3 Counties, 2004/2011
Very
Important
Somewhat
Important
Not Too
Important
Not At All
ImportantTotal
2004Restaurant or
Grocery Store42% 58% 100%
2011
Restaurant 24% 40% 21% 15% 100%
Grocery Store 38% 39% 15% 8% 100%
2004 2011
Restaurant or Grocery Store Restaurant Grocery
Store
“How important a consideration is local food when you choose a [restaurant/grocery store]? A very important consideration,
somewhat important, not too important, or not at all a consideration when you are choosing a [restaurant/grocery store]?” *
Percentages do not always sum to 100 due to rounding.
* In 2004, respondents were asked: “Is local food an important consideration when choosing a restaurant?” [Yes/No]
** Percentages shown for 2011 include ―very important‖ and ―somewhat important‖ responses combined.
RestaurantGrocery
Store
change
2004 to
2011+22 +35
Importance of Local Food in Choice of Restaurant/Grocery Store
A Survey of Consumer Behavior and Perceptions in WNC
Appalachian Sustainable Agriculture Project (ASAP) 28
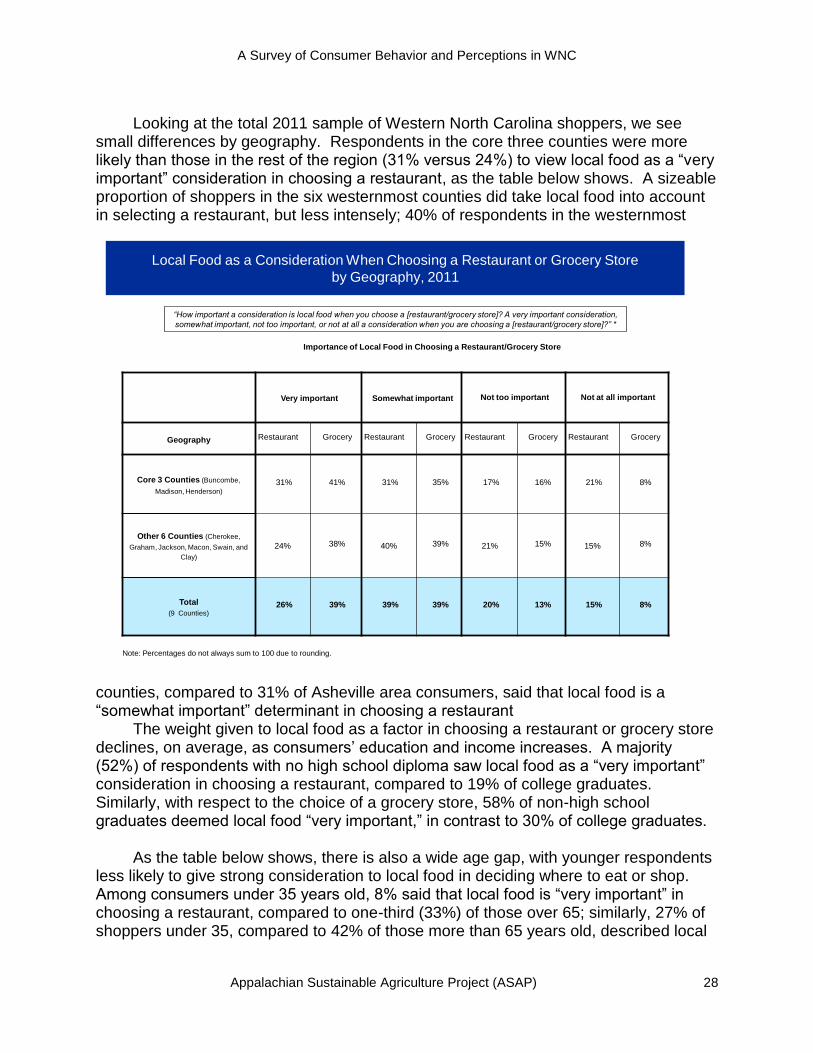
Looking at the total 2011 sample of Western North Carolina shoppers, we see small differences by geography. Respondents in the core three counties were more likely than those in the rest of the region (31% versus 24%) to view local food as a ―very important‖ consideration in choosing a restaurant, as the table below shows. A sizeable proportion of shoppers in the six westernmost counties did take local food into account in selecting a restaurant, but less intensely; 40% of respondents in the westernmost
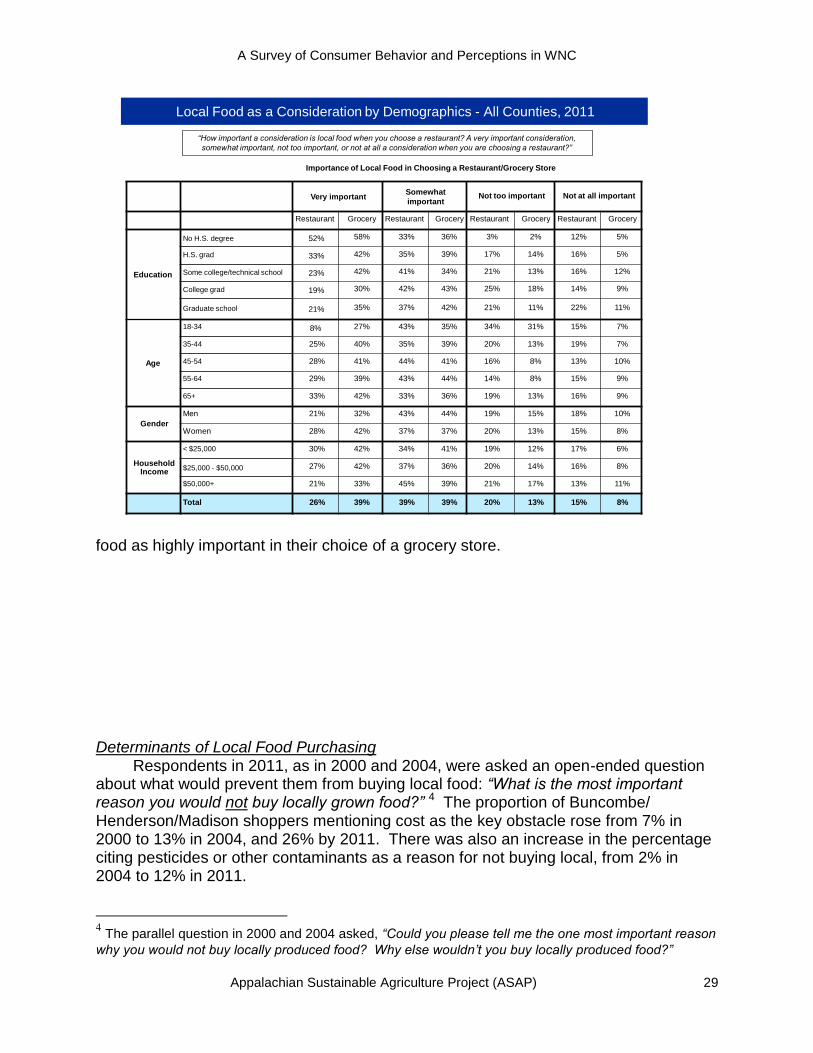
counties, compared to 31% of Asheville area consumers, said that local food is a ―somewhat important‖ determinant in choosing a restaurant The weight given to local food as a factor in choosing a restaurant or grocery store declines, on average, as consumers’ education and income increases. A majority (52%) of respondents with no high school diploma saw local food as a ―very important‖ consideration in choosing a restaurant, compared to 19% of college graduates. Similarly, with respect to the choice of a grocery store, 58% of non-high school graduates deemed local food ―very important,‖ in contrast to 30% of college graduates. As the table below shows, there is also a wide age gap, with younger respondents less likely to give strong consideration to local food in deciding where to eat or shop. Among consumers under 35 years old, 8% said that local food is ―very important‖ in choosing a restaurant, compared to one-third (33%) of those over 65; similarly, 27% of shoppers under 35, compared to 42% of those more than 65 years old, described local
Local Food as a Consideration When Choosing a Restaurant or Grocery Store
by Geography, 2011
Very important Somewhat important Not too important Not at all important
Geography Restaurant Grocery Restaurant Grocery Restaurant Grocery Restaurant Grocery
Core 3 Counties (Buncombe,
Madison, Henderson)
31% 41% 31% 35% 17% 16% 21% 8%
Other 6 Counties (Cherokee,
Graham, Jackson, Macon, Swain, and
Clay)
24% 38% 40% 39% 21% 15% 15% 8%
Total
(9 Counties)26% 39% 39% 39% 20% 13% 15% 8%
“How important a consideration is local food when you choose a [restaurant/grocery store]? A very important consideration,
somewhat important, not too important, or not at all a consideration when you are choosing a [restaurant/grocery store]?” *
Importance of Local Food in Choosing a Restaurant/Grocery Store
Note: Percentages do not always sum to 100 due to rounding.
A Survey of Consumer Behavior and Perceptions in WNC
Appalachian Sustainable Agriculture Project (ASAP) 29
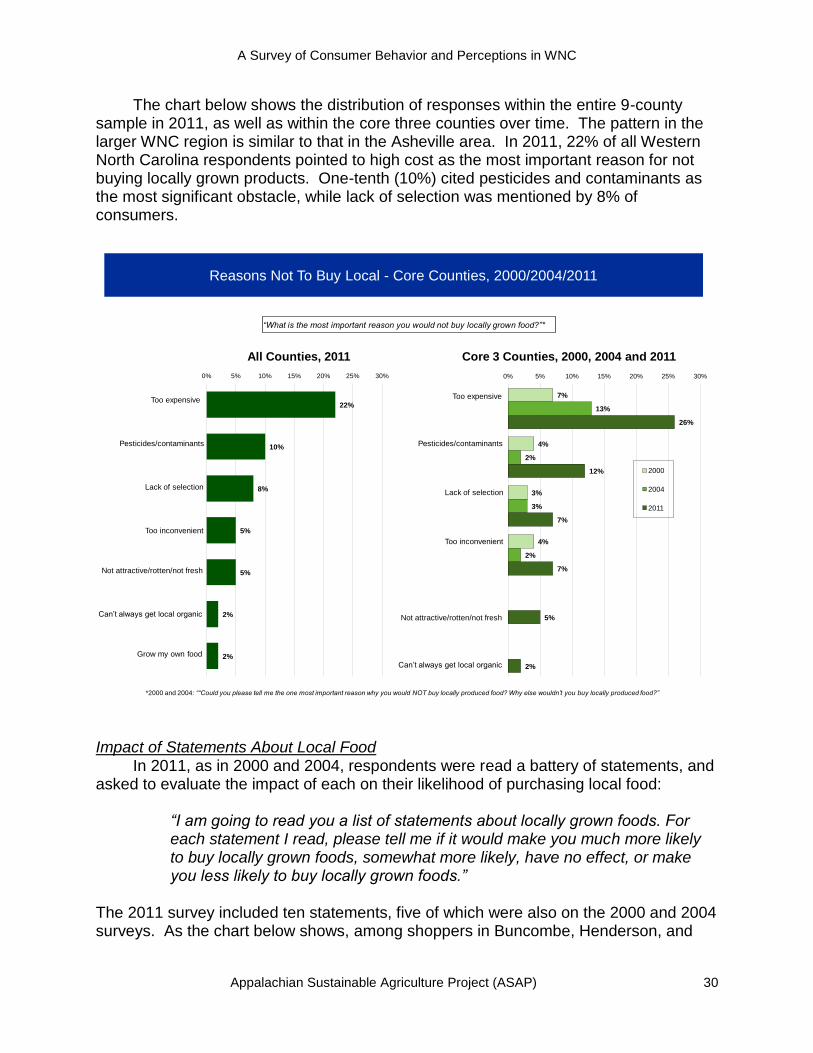
food as highly important in their choice of a grocery store. Determinants of Local Food Purchasing Respondents in 2011, as in 2000 and 2004, were asked an open-ended question about what would prevent them from buying local food: “What is the most important reason you would not buy locally grown food?” 4 The proportion of Buncombe/ Henderson/Madison shoppers mentioning cost as the key obstacle rose from 7% in 2000 to 13% in 2004, and 26% by 2011. There was also an increase in the percentage citing pesticides or other contaminants as a reason for not buying local, from 2% in 2004 to 12% in 2011.
4 The parallel question in 2000 and 2004 asked, “Could you please tell me the one most important reason
why you would not buy locally produced food? Why else wouldn‟t you buy locally produced food?”
Very importantSomewhat
importantNot too important Not at all important
Restaurant Grocery Restaurant Grocery Restaurant Grocery Restaurant Grocery
Education
No H.S. degree 52% 58% 33% 36% 3% 2% 12% 5%
H.S. grad 33% 42% 35% 39% 17% 14% 16% 5%
Some college/technical school 23% 42% 41% 34% 21% 13% 16% 12%
College grad 19% 30% 42% 43% 25% 18% 14% 9%
Graduate school 21% 35% 37% 42% 21% 11% 22% 11%
Age
18-34 8% 27% 43% 35% 34% 31% 15% 7%
35-44 25% 40% 35% 39% 20% 13% 19% 7%
45-54 28% 41% 44% 41% 16% 8% 13% 10%
55-64 29% 39% 43% 44% 14% 8% 15% 9%
65+ 33% 42% 33% 36% 19% 13% 16% 9%
Gender
Men 21% 32% 43% 44% 19% 15% 18% 10%
Women 28% 42% 37% 37% 20% 13% 15% 8%
Household Income
< $25,000 30% 42% 34% 41% 19% 12% 17% 6%
$25,000 - $50,000 27% 42% 37% 36% 20% 14% 16% 8%
$50,000+ 21% 33% 45% 39% 21% 17% 13% 11%
Total 26% 39% 39% 39% 20% 13% 15% 8%
Local Food as a Consideration by Demographics - All Counties, 2011
“How important a consideration is local food when you choose a restaurant? A very important consideration,
somewhat important, not too important, or not at all a consideration when you are choosing a restaurant?”
Importance of Local Food in Choosing a Restaurant/Grocery Store
A Survey of Consumer Behavior and Perceptions in WNC
Appalachian Sustainable Agriculture Project (ASAP) 30
The chart below shows the distribution of responses within the entire 9-county sample in 2011, as well as within the core three counties over time. The pattern in the larger WNC region is similar to that in the Asheville area. In 2011, 22% of all Western North Carolina respondents pointed to high cost as the most important reason for not buying locally grown products. One-tenth (10%) cited pesticides and contaminants as the most significant obstacle, while lack of selection was mentioned by 8% of consumers.
Impact of Statements About Local Food In 2011, as in 2000 and 2004, respondents were read a battery of statements, and asked to evaluate the impact of each on their likelihood of purchasing local food:
“I am going to read you a list of statements about locally grown foods. For each statement I read, please tell me if it would make you much more likely to buy locally grown foods, somewhat more likely, have no effect, or make you less likely to buy locally grown foods.”
The 2011 survey included ten statements, five of which were also on the 2000 and 2004 surveys. As the chart below shows, among shoppers in Buncombe, Henderson, and
22%
10%
8%
5%
5%
2%
2%
0% 5% 10% 15% 20% 25% 30%
Too expensive
Pesticides/contaminants
Lack of selection
Too inconvenient
Not attractive/rotten/not fresh
Can’t always get local organic
Grow my own food
Reasons Not To Buy Local - Core Counties, 2000/2004/2011
7%
4%
3%
4%
13%
2%
3%
2%
26%
12%
7%
7%
5%
2%
0% 5% 10% 15% 20% 25% 30%
2000
2004
2011
Core 3 Counties, 2000, 2004 and 2011All Counties, 2011
Too expensive
Pesticides/contaminants
Lack of selection
Too inconvenient
Not attractive/rotten/not fresh
Can’t always get local organic
“What is the most important reason you would not buy locally grown food?”*
*2000 and 2004: ““Could you please tell me the one most important reason why you would NOT buy locally produced food? Why else wouldn‟t you buy locally produced food?”
A Survey of Consumer Behavior and Perceptions in WNC
Appalachian Sustainable Agriculture Project (ASAP) 31
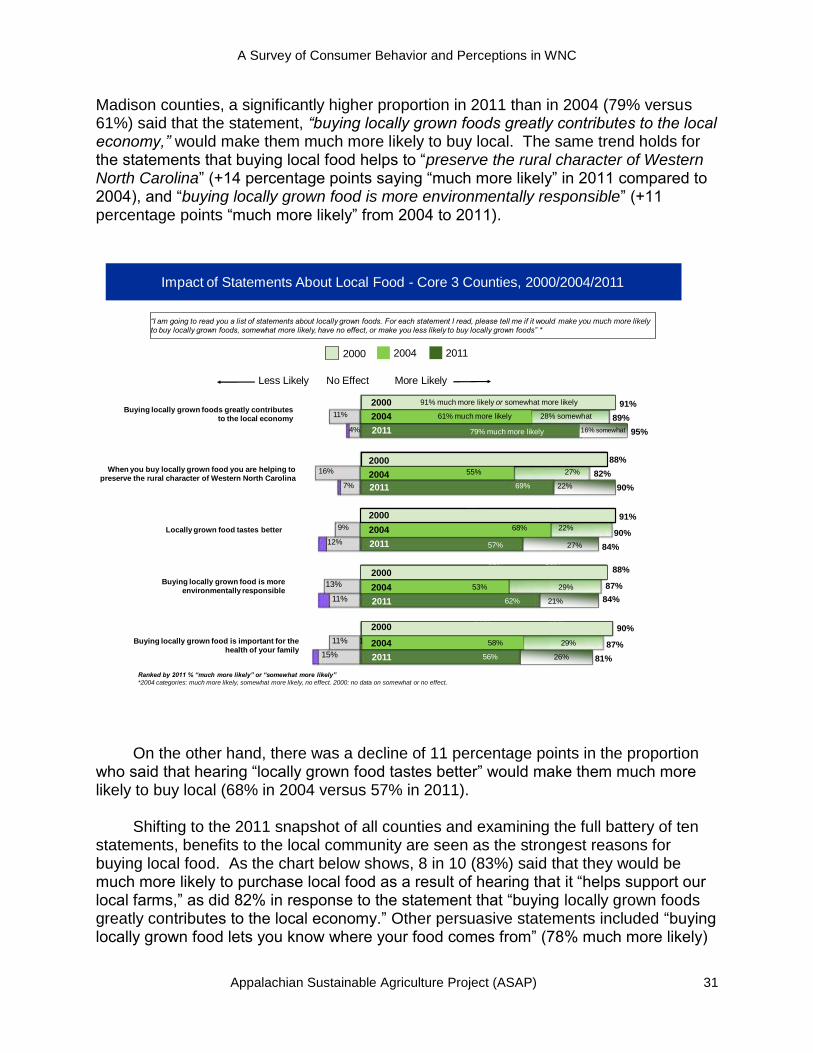
Madison counties, a significantly higher proportion in 2011 than in 2004 (79% versus 61%) said that the statement, “buying locally grown foods greatly contributes to the local economy,” would make them much more likely to buy local. The same trend holds for the statements that buying local food helps to ―preserve the rural character of Western North Carolina‖ (+14 percentage points saying ―much more likely‖ in 2011 compared to 2004), and ―buying locally grown food is more environmentally responsible‖ (+11 percentage points ―much more likely‖ from 2004 to 2011).
95%
90%
More LikelyLess Likely
79% much more likely
“I am going to read you a list of statements about locally grown foods. For each statement I read, please tell me if it would make you much more likely to buy locally grown foods, somewhat more likely, have no effect, or make you less likely to buy locally grown foods” *
Impact of Statements About Local Food - Core 3 Counties, 2000/2004/2011
No Effect
Locally grown food tastes better
11%
4%
16%
12%
69%
56%
62%
57%
89%
91%
84%
84%
81%
Ranked by 2011 % “much more likely” or “somewhat more likely”
*2004 categories: much more likely, somewhat more likely, no effect. 2000: no data on somewhat or no effect.
90%
87%
87%
82%
88%
88%
91%
90%
9%
13%
11%
7%
201120042000
11% 28% somewhat61% much more likely
91% much more likely or somewhat more likely
2011
2004
2000
21%
27%
25%
20%
55% 27%
22%
29%
29%
68%
58%
53%
2011
2004
2000
2011
2004
2000
2011
2004
2000
2011
2004
2000
Buying locally grown foods greatly contributes to the local economy
Buying locally grown food is important for the health of your family
When you buy locally grown food you are helping to preserve the rural character of Western North Carolina
Buying locally grown food is more environmentally responsible
7%
15%
11%
13%
9%
69%
62%
57%
56%
22%
27%
26%
21%
16% somewhat
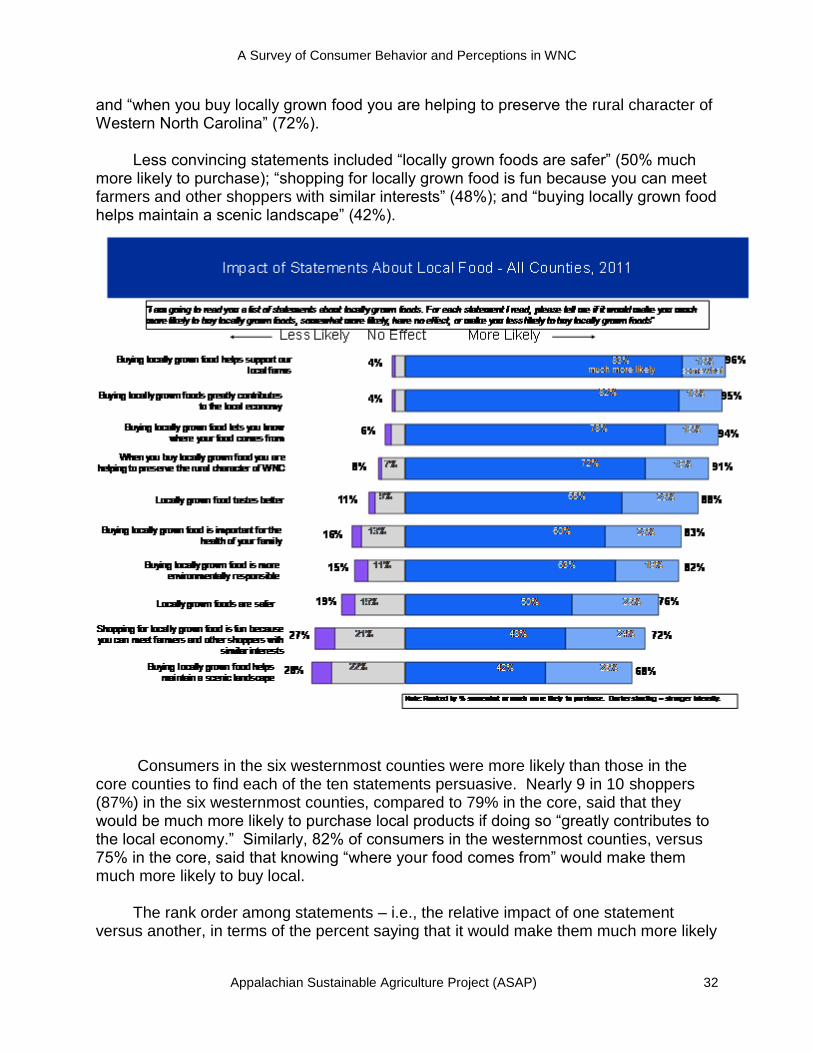
On the other hand, there was a decline of 11 percentage points in the proportion who said that hearing ―locally grown food tastes better‖ would make them much more likely to buy local (68% in 2004 versus 57% in 2011). Shifting to the 2011 snapshot of all counties and examining the full battery of ten statements, benefits to the local community are seen as the strongest reasons for buying local food. As the chart below shows, 8 in 10 (83%) said that they would be much more likely to purchase local food as a result of hearing that it ―helps support our local farms,‖ as did 82% in response to the statement that ―buying locally grown foods greatly contributes to the local economy.‖ Other persuasive statements included ―buying locally grown food lets you know where your food comes from‖ (78% much more likely)
A Survey of Consumer Behavior and Perceptions in WNC
Appalachian Sustainable Agriculture Project (ASAP) 32
and ―when you buy locally grown food you are helping to preserve the rural character of Western North Carolina‖ (72%). Less convincing statements included ―locally grown foods are safer‖ (50% much more likely to purchase); ―shopping for locally grown food is fun because you can meet farmers and other shoppers with similar interests‖ (48%); and ―buying locally grown food helps maintain a scenic landscape‖ (42%).
Consumers in the six westernmost counties were more likely than those in the core counties to find each of the ten statements persuasive. Nearly 9 in 10 shoppers (87%) in the six westernmost counties, compared to 79% in the core, said that they would be much more likely to purchase local products if doing so ―greatly contributes to the local economy.‖ Similarly, 82% of consumers in the westernmost counties, versus 75% in the core, said that knowing ―where your food comes from‖ would make them much more likely to buy local. The rank order among statements – i.e., the relative impact of one statement versus another, in terms of the percent saying that it would make them much more likely
A Survey of Consumer Behavior and Perceptions in WNC
Appalachian Sustainable Agriculture Project (ASAP) 33
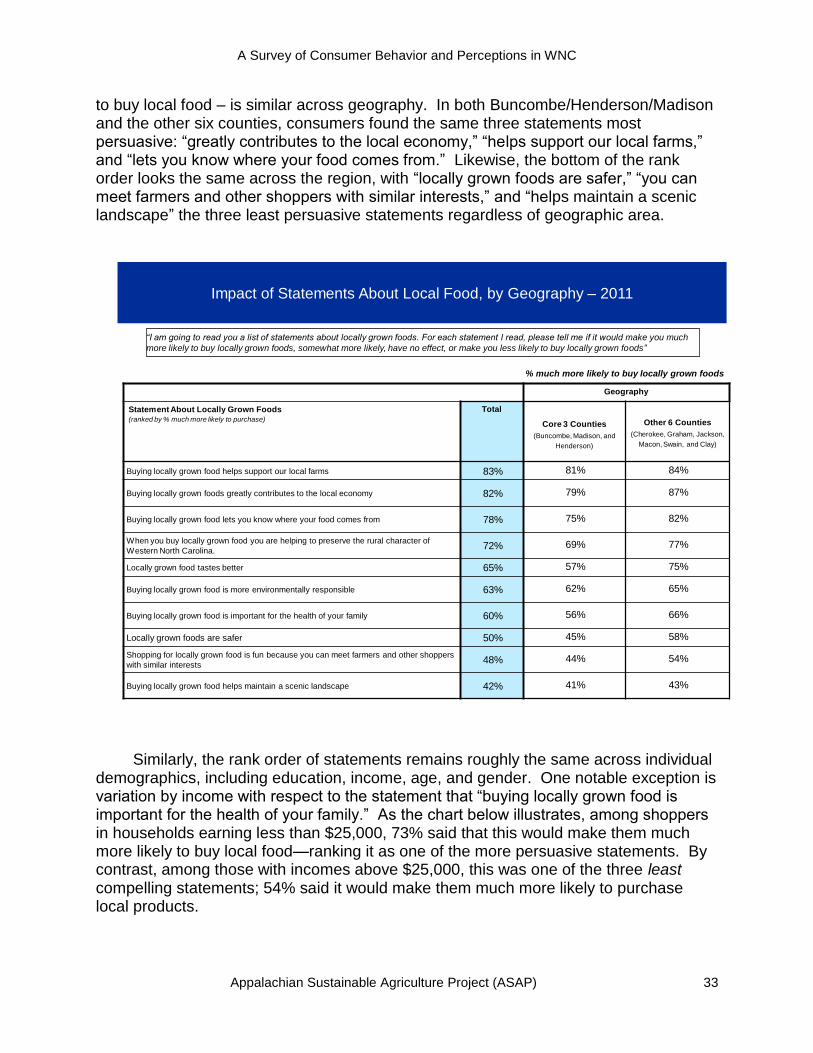
to buy local food – is similar across geography. In both Buncombe/Henderson/Madison and the other six counties, consumers found the same three statements most persuasive: ―greatly contributes to the local economy,‖ ―helps support our local farms,‖ and ―lets you know where your food comes from.‖ Likewise, the bottom of the rank order looks the same across the region, with ―locally grown foods are safer,‖ ―you can meet farmers and other shoppers with similar interests,‖ and ―helps maintain a scenic landscape‖ the three least persuasive statements regardless of geographic area.
Geography
Statement About Locally Grown Foods(ranked by % much more likely to purchase)
Total
Core 3 Counties
(Buncombe, Madison, and
Henderson)
Other 6 Counties
(Cherokee, Graham, Jackson,
Macon, Swain, and Clay)
Buying locally grown food helps support our local farms 83% 81% 84%
Buying locally grown foods greatly contributes to the local economy 82% 79% 87%
Buying locally grown food lets you know where your food comes from 78% 75% 82%
When you buy locally grown food you are helping to preserve the rural character of
Western North Carolina.72% 69% 77%
Locally grown food tastes better 65% 57% 75%
Buying locally grown food is more environmentally responsible 63% 62% 65%
Buying locally grown food is important for the health of your family 60% 56% 66%
Locally grown foods are safer 50% 45% 58%
Shopping for locally grown food is fun because you can meet farmers and other shoppers
with similar interests48% 44% 54%
Buying locally grown food helps maintain a scenic landscape 42% 41% 43%
Impact of Statements About Local Food, by Geography – 2011
% much more likely to buy locally grown foods
“I am going to read you a list of statements about locally grown foods. For each statement I read, please tell me if it would make you much
more likely to buy locally grown foods, somewhat more likely, have no effect, or make you less likely to buy locally grown foods”
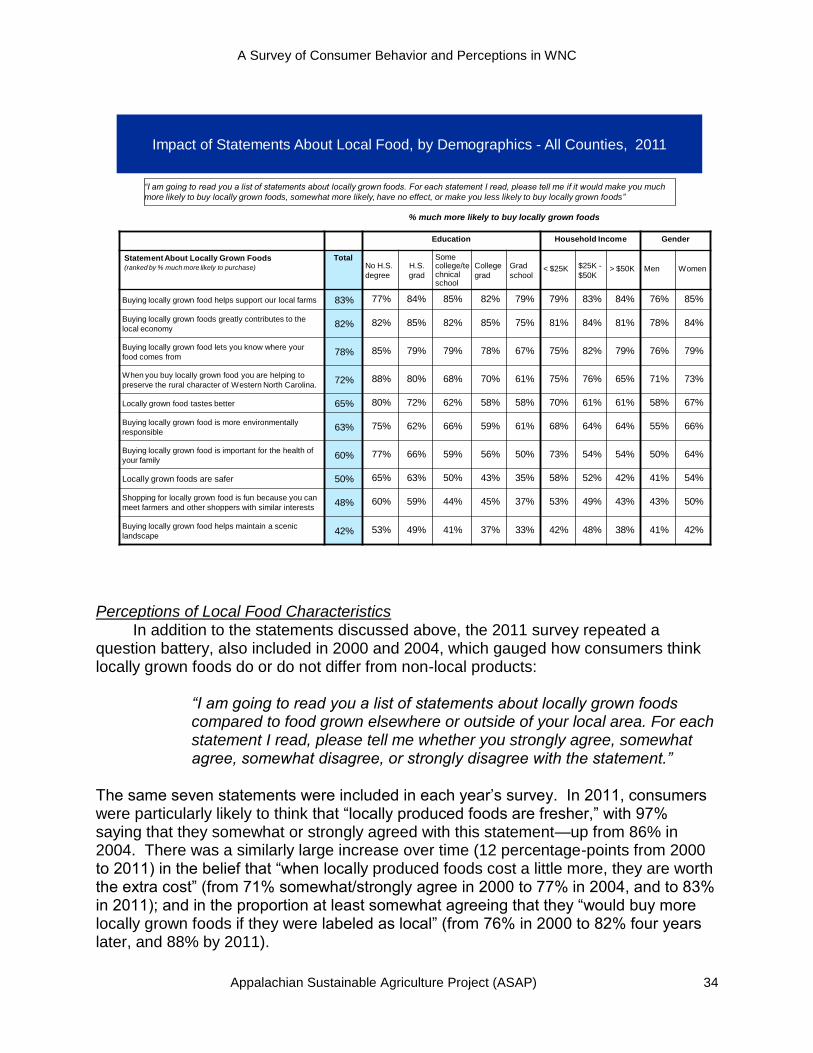
Similarly, the rank order of statements remains roughly the same across individual demographics, including education, income, age, and gender. One notable exception is variation by income with respect to the statement that ―buying locally grown food is important for the health of your family.‖ As the chart below illustrates, among shoppers in households earning less than $25,000, 73% said that this would make them much more likely to buy local food—ranking it as one of the more persuasive statements. By contrast, among those with incomes above $25,000, this was one of the three least compelling statements; 54% said it would make them much more likely to purchase local products.
A Survey of Consumer Behavior and Perceptions in WNC
Appalachian Sustainable Agriculture Project (ASAP) 34
Education Household Income Gender
Statement About Locally Grown Foods(ranked by % much more likely to purchase)
TotalNo H.S.
degree
H.S.
grad
Some college/technical school
College
grad
Grad
school< $25K $25K -
$50K> $50K Men Women
Buying locally grown food helps support our local farms 83% 77% 84% 85% 82% 79% 79% 83% 84% 76% 85%
Buying locally grown foods greatly contributes to the
local economy82% 82% 85% 82% 85% 75% 81% 84% 81% 78% 84%
Buying locally grown food lets you know where your
food comes from 78% 85% 79% 79% 78% 67% 75% 82% 79% 76% 79%
When you buy locally grown food you are helping to
preserve the rural character of Western North Carolina.72% 88% 80% 68% 70% 61% 75% 76% 65% 71% 73%
Locally grown food tastes better 65% 80% 72% 62% 58% 58% 70% 61% 61% 58% 67%
Buying locally grown food is more environmentally
responsible63% 75% 62% 66% 59% 61% 68% 64% 64% 55% 66%
Buying locally grown food is important for the health of
your family60% 77% 66% 59% 56% 50% 73% 54% 54% 50% 64%
Locally grown foods are safer 50% 65% 63% 50% 43% 35% 58% 52% 42% 41% 54%
Shopping for locally grown food is fun because you can
meet farmers and other shoppers with similar interests48% 60% 59% 44% 45% 37% 53% 49% 43% 43% 50%
Buying locally grown food helps maintain a scenic
landscape42% 53% 49% 41% 37% 33% 42% 48% 38% 41% 42%
Impact of Statements About Local Food, by Demographics - All Counties, 2011
% much more likely to buy locally grown foods
“I am going to read you a list of statements about locally grown foods. For each statement I read, please tell me if it would make you much
more likely to buy locally grown foods, somewhat more likely, have no effect, or make you less likely to buy locally grown foods”
Perceptions of Local Food Characteristics In addition to the statements discussed above, the 2011 survey repeated a question battery, also included in 2000 and 2004, which gauged how consumers think locally grown foods do or do not differ from non-local products:
“I am going to read you a list of statements about locally grown foods compared to food grown elsewhere or outside of your local area. For each statement I read, please tell me whether you strongly agree, somewhat agree, somewhat disagree, or strongly disagree with the statement.”
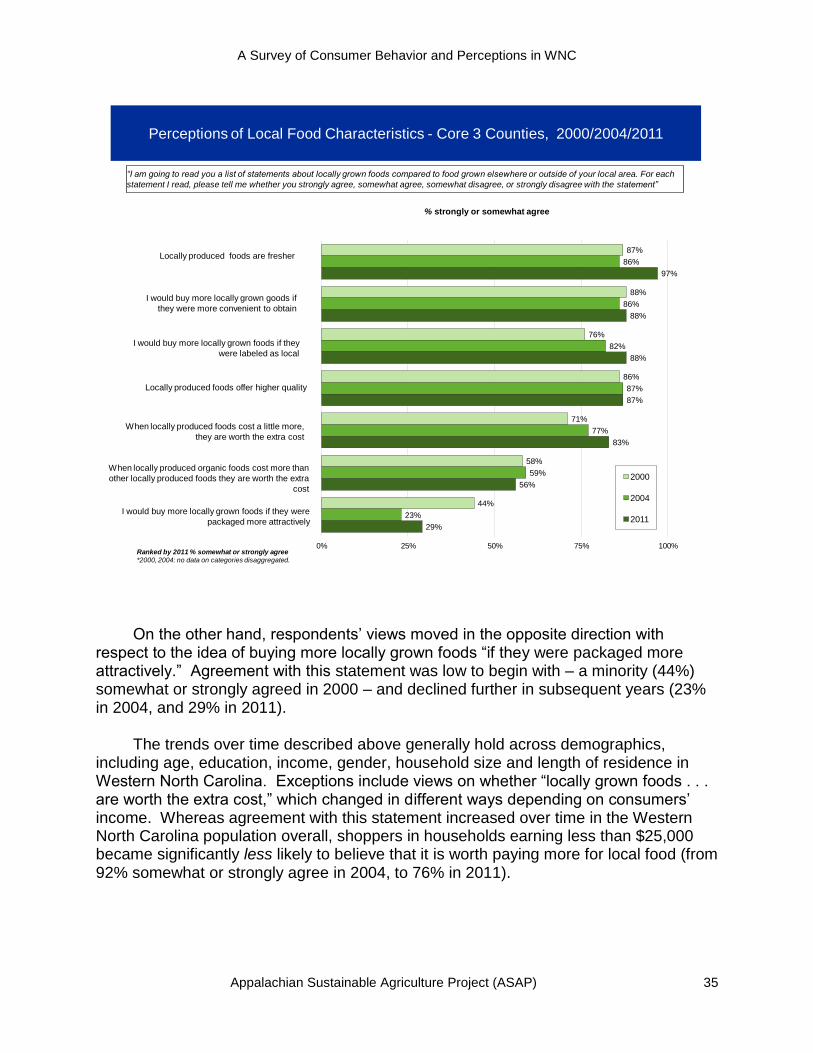
The same seven statements were included in each year’s survey. In 2011, consumers were particularly likely to think that ―locally produced foods are fresher,‖ with 97% saying that they somewhat or strongly agreed with this statement—up from 86% in 2004. There was a similarly large increase over time (12 percentage-points from 2000 to 2011) in the belief that ―when locally produced foods cost a little more, they are worth the extra cost‖ (from 71% somewhat/strongly agree in 2000 to 77% in 2004, and to 83% in 2011); and in the proportion at least somewhat agreeing that they ―would buy more locally grown foods if they were labeled as local‖ (from 76% in 2000 to 82% four years later, and 88% by 2011).
A Survey of Consumer Behavior and Perceptions in WNC
Appalachian Sustainable Agriculture Project (ASAP) 35
87%
88%
76%
86%
71%
58%
44%
86%
86%
82%
87%
77%
59%
23%
97%
88%
88%
87%
83%
56%
29%
0% 25% 50% 75% 100%
2000
2004
2011
Locally produced foods are fresher
I would buy more locally grown goods if
they were more convenient to obtain
I would buy more locally grown foods if they
were labeled as local
Locally produced foods offer higher quality
When locally produced foods cost a little more,
they are worth the extra cost
When locally produced organic foods cost more than
other locally produced foods they are worth the extra
cost
I would buy more locally grown foods if they were
packaged more attractively
Ranked by 2011 % somewhat or strongly agree
*2000, 2004: no data on categories disaggregated.
Perceptions of Local Food Characteristics - Core 3 Counties, 2000/2004/2011
% strongly or somewhat agree
“I am going to read you a list of statements about locally grown foods compared to food grown elsewhere or outside of your local area. For each
statement I read, please tell me whether you strongly agree, somewhat agree, somewhat disagree, or strongly disagree with the statement”
On the other hand, respondents’ views moved in the opposite direction with respect to the idea of buying more locally grown foods ―if they were packaged more attractively.‖ Agreement with this statement was low to begin with – a minority (44%) somewhat or strongly agreed in 2000 – and declined further in subsequent years (23% in 2004, and 29% in 2011). The trends over time described above generally hold across demographics, including age, education, income, gender, household size and length of residence in Western North Carolina. Exceptions include views on whether ―locally grown foods . . . are worth the extra cost,‖ which changed in different ways depending on consumers’ income. Whereas agreement with this statement increased over time in the Western North Carolina population overall, shoppers in households earning less than $25,000 became significantly less likely to believe that it is worth paying more for local food (from 92% somewhat or strongly agree in 2004, to 76% in 2011).

A Survey of Consumer Behavior and Perceptions in WNC
Appalachian Sustainable Agriculture Project (ASAP) 36
AgreeDisagree
78% strongly agree
67%
62%
53%
44%
24%
Perceptions of Local Food Characteristics - All Counties, 2011
98%Locally produced foods are fresher
Locally produced foods offer higher quality
When locally produced foods cost a little more, they are
worth the extra cost
When locally produced organic foods cost more than other
locally produced foods they are worth the extra cost
I would buy more locally grown foods if they were
labeled as local
I would buy more locally grown goods if they were more
convenient to obtain
I would buy more locally grown foods if they were
packaged more attractively
89%
57%
31%
89%
88%
89%
65%35%
strongly disagree
18%39%
11%
9%
9%
12%
8%
“I am going to read you a list of statements about locally grown foods compared to food grown elsewhere or outside of your local area. For each
statement I read, please tell me whether you strongly agree, somewhat agree, somewhat disagree, or strongly disagree with the statement”
20% somewhat agree
22%
27%
36%
44%
33%
20%30%
somewhat disagree
21%
*Ranked by % somewhat or strongly agree
In the overall 9-county region, beliefs about local food parallel those in the core three counties. In 2011, virtually all respondents (98%) agreed that ―locally produced are fresher,‖ including 78% who strongly agreed. At the other end of the spectrum, 65%
Age Household Income
Statement about Locally Grown Foods 18-34 35-54 55+ < $25K $25K -
$50K> $50K Total
Locally produced foods are fresher
2000 76% 88% 86% 87% 86% 87% 87%
2004 83% 89% 76% 84% 81% 91% 86%
2011 100% 99% 95% 95% 97% 99% 97%
I would buy more locally grown goods if they were more
convenient to obtain
2000 92% 95% 86% 88% 93% 94% 88%
2004 86% 87% 82% 91% 77% 89% 86%
2011 81% 90% 89% 81% 86% 91% 88%
I would buy more locally grown foods if they were labeled
as local
2000 73% 71% 78% 75% 80% 81% 76%
2004 75% 83% 75% 89% 79% 83% 82%
2011 82% 92% 86% 83% 90% 93% 88%
Locally produced foods offer higher quality
2000 -- -- -- -- -- -- --
2004 83% 89% 83% 96% 85% 88% 87%
2011 96% 87% 86% 81% 87% 92% 87%
When locally produced foods cost a little more, they are
worth the extra cost
2000 71% 72% 77% 80% 80% 69% 71%
2004 83% 81% 76% 92% 73% 86% 77%
2011 71% 80% 88% 76% 87% 82% 83%
When locally produced organic foods cost more than other
locally produced foods they are worth the extra cost
2000 51% 53% 74% 63% 61% 60% 58%
2004 74% 52% 45% 91% 61% 62% 59%
2011 39% 59% 59% 45% 50% 62% 56%
I would buy more locally grown foods if they were
packaged more attractively
2000 40% 31% 49% 53% 42% 41% 44%
2004 34% 21% 27% 78% 24% 23% 23%
2011 28% 25% 32% 35% 36% 19% 29%
Perceptions of Local Food Characteristics, by Age and Income –
Core 3 Counties, 2000/2004/2011
% strongly or somewhat agree
“I am going to read you a list of statements about locally grown foods compared to food grown elsewhere or outside of your lo cal area. For each
statement I read, please tell me whether you strongly agree, somewhat agree, somewhat disagree, or strongly disagree with the statement”
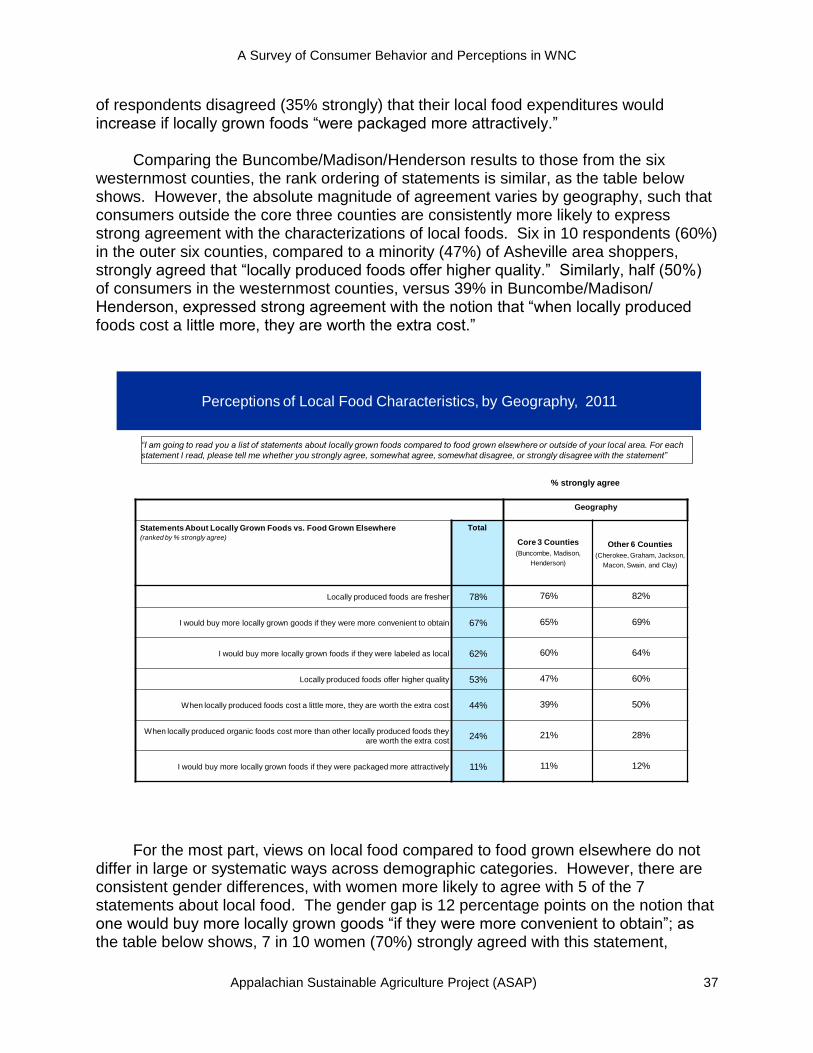
A Survey of Consumer Behavior and Perceptions in WNC
Appalachian Sustainable Agriculture Project (ASAP) 37
of respondents disagreed (35% strongly) that their local food expenditures would increase if locally grown foods ―were packaged more attractively.‖ Comparing the Buncombe/Madison/Henderson results to those from the six westernmost counties, the rank ordering of statements is similar, as the table below shows. However, the absolute magnitude of agreement varies by geography, such that consumers outside the core three counties are consistently more likely to express strong agreement with the characterizations of local foods. Six in 10 respondents (60%) in the outer six counties, compared to a minority (47%) of Asheville area shoppers, strongly agreed that ―locally produced foods offer higher quality.‖ Similarly, half (50%) of consumers in the westernmost counties, versus 39% in Buncombe/Madison/ Henderson, expressed strong agreement with the notion that ―when locally produced foods cost a little more, they are worth the extra cost.‖
Geography
Statements About Locally Grown Foods vs. Food Grown Elsewhere(ranked by % strongly agree)
Total
Core 3 Counties
(Buncombe, Madison,
Henderson)
Other 6 Counties
(Cherokee, Graham, Jackson,
Macon, Swain, and Clay)
Locally produced foods are fresher 78% 76% 82%
I would buy more locally grown goods if they were more convenient to obtain 67% 65% 69%
I would buy more locally grown foods if they were labeled as local 62% 60% 64%
Locally produced foods offer higher quality 53% 47% 60%
When locally produced foods cost a little more, they are worth the extra cost 44% 39% 50%
When locally produced organic foods cost more than other locally produced foods they
are worth the extra cost24% 21% 28%
I would buy more locally grown foods if they were packaged more attractively 11% 11% 12%
Perceptions of Local Food Characteristics, by Geography, 2011
% strongly agree
“I am going to read you a list of statements about locally grown foods compared to food grown elsewhere or outside of your local area. For each
statement I read, please tell me whether you strongly agree, somewhat agree, somewhat disagree, or strongly disagree with the statement”
For the most part, views on local food compared to food grown elsewhere do not differ in large or systematic ways across demographic categories. However, there are consistent gender differences, with women more likely to agree with 5 of the 7 statements about local food. The gender gap is 12 percentage points on the notion that one would buy more locally grown goods ―if they were more convenient to obtain‖; as the table below shows, 7 in 10 women (70%) strongly agreed with this statement,
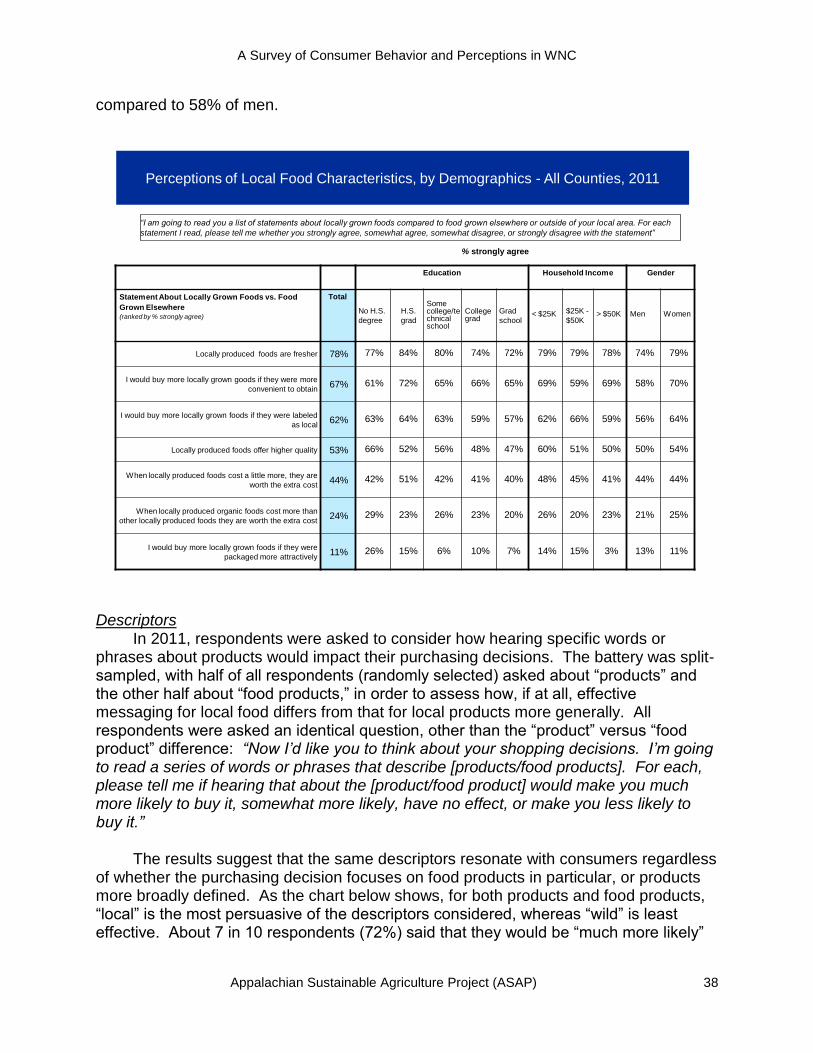
A Survey of Consumer Behavior and Perceptions in WNC
Appalachian Sustainable Agriculture Project (ASAP) 38
compared to 58% of men.
Education Household Income Gender
Statement About Locally Grown Foods vs. Food
Grown Elsewhere(ranked by % strongly agree)
Total
No H.S.
degree
H.S.
grad
Some college/technical school
College grad
Grad
school< $25K $25K -
$50K> $50K Men Women
Locally produced foods are fresher 78% 77% 84% 80% 74% 72% 79% 79% 78% 74% 79%
I would buy more locally grown goods if they were more
convenient to obtain67% 61% 72% 65% 66% 65% 69% 59% 69% 58% 70%
I would buy more locally grown foods if they were labeled
as local62% 63% 64% 63% 59% 57% 62% 66% 59% 56% 64%
Locally produced foods offer higher quality 53% 66% 52% 56% 48% 47% 60% 51% 50% 50% 54%
When locally produced foods cost a little more, they are
worth the extra cost44% 42% 51% 42% 41% 40% 48% 45% 41% 44% 44%
When locally produced organic foods cost more than
other locally produced foods they are worth the extra cost24% 29% 23% 26% 23% 20% 26% 20% 23% 21% 25%
I would buy more locally grown foods if they were
packaged more attractively11% 26% 15% 6% 10% 7% 14% 15% 3% 13% 11%
Perceptions of Local Food Characteristics, by Demographics - All Counties, 2011
% strongly agree
“I am going to read you a list of statements about locally grown foods compared to food grown elsewhere or outside of your local area. For each
statement I read, please tell me whether you strongly agree, somewhat agree, somewhat disagree, or strongly disagree with the statement”
Descriptors In 2011, respondents were asked to consider how hearing specific words or phrases about products would impact their purchasing decisions. The battery was split-sampled, with half of all respondents (randomly selected) asked about ―products‖ and the other half about ―food products,‖ in order to assess how, if at all, effective messaging for local food differs from that for local products more generally. All respondents were asked an identical question, other than the ―product‖ versus ―food product‖ difference: “Now I‟d like you to think about your shopping decisions. I‟m going to read a series of words or phrases that describe [products/food products]. For each, please tell me if hearing that about the [product/food product] would make you much more likely to buy it, somewhat more likely, have no effect, or make you less likely to buy it.” The results suggest that the same descriptors resonate with consumers regardless of whether the purchasing decision focuses on food products in particular, or products more broadly defined. As the chart below shows, for both products and food products, ―local‖ is the most persuasive of the descriptors considered, whereas ―wild‖ is least effective. About 7 in 10 respondents (72%) said that they would be ―much more likely‖
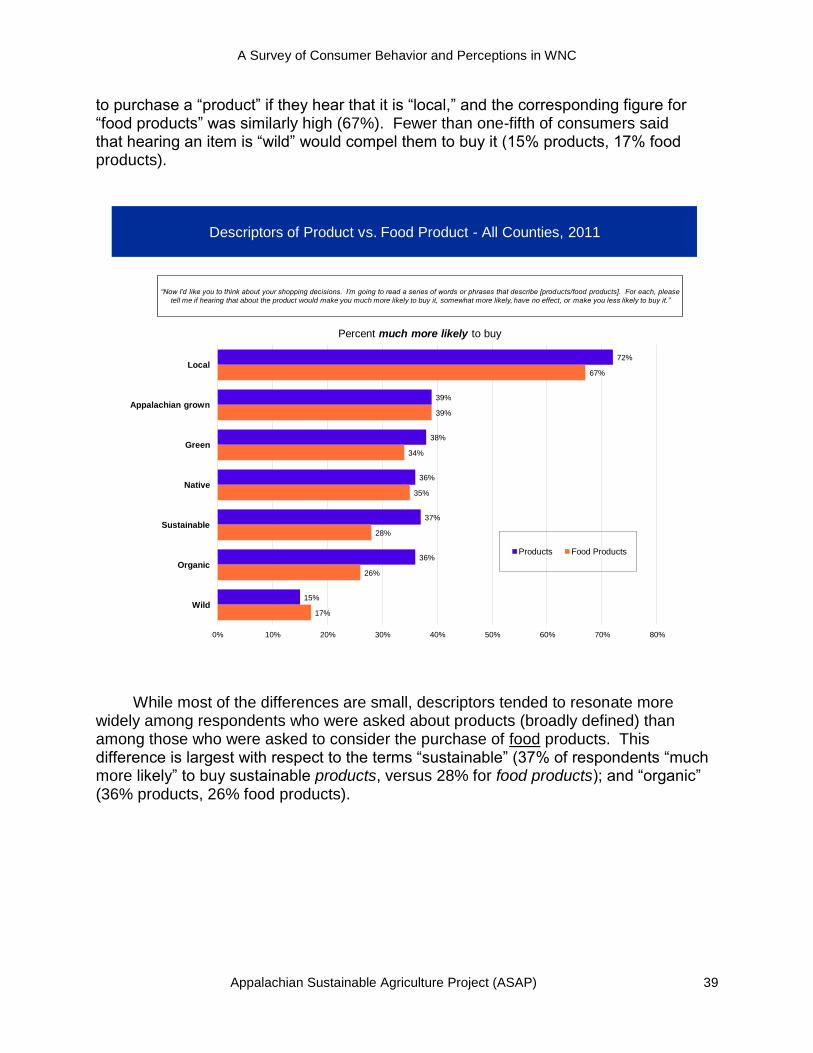
A Survey of Consumer Behavior and Perceptions in WNC
Appalachian Sustainable Agriculture Project (ASAP) 39
to purchase a ―product‖ if they hear that it is ―local,‖ and the corresponding figure for ―food products‖ was similarly high (67%). Fewer than one-fifth of consumers said that hearing an item is ―wild‖ would compel them to buy it (15% products, 17% food products).
Descriptors of Product vs. Food Product - All Counties, 2011
72%
39%
38%
36%
37%
36%
15%
67%
39%
34%
35%
28%
26%
17%
0% 10% 20% 30% 40% 50% 60% 70% 80%
Local
Appalachian grown
Green
Native
Sustainable
Organic
Wild
Products Food Products
“Now I‟d like you to think about your shopping decisions. I‟m going to read a series of words or phrases that describe [products/food products]. For each, please
tell me if hearing that about the product would make you much more likely to buy it, somewhat more likely, have no effect, or make you less likely to buy it.”
Percent much more likely to buy
While most of the differences are small, descriptors tended to resonate more widely among respondents who were asked about products (broadly defined) than among those who were asked to consider the purchase of food products. This difference is largest with respect to the terms ―sustainable‖ (37% of respondents ―much more likely‖ to buy sustainable products, versus 28% for food products); and ―organic‖ (36% products, 26% food products).
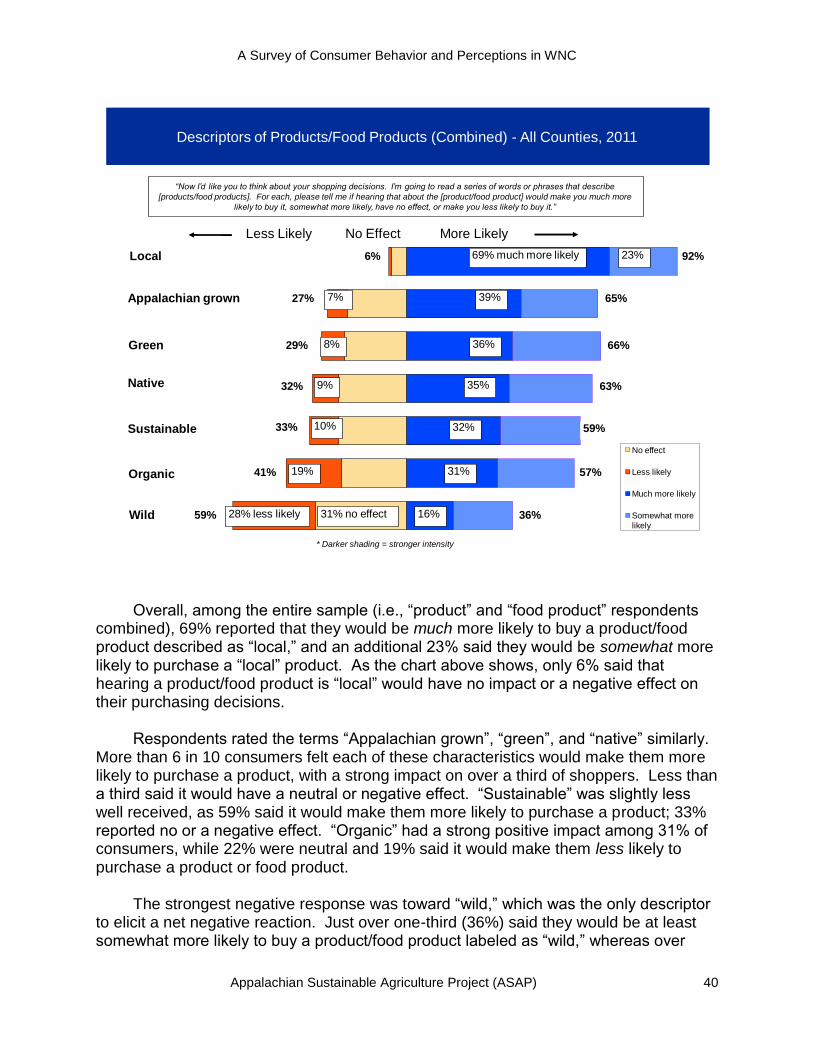
A Survey of Consumer Behavior and Perceptions in WNC
Appalachian Sustainable Agriculture Project (ASAP) 40
No effect
Less likely
Much more likely
Somewhat more likely
Less Likely More Likely
69% much more likely
36%
39%
92%
* Darker shading = stronger intensity
Wild
Local
“Now I‟d like you to think about your shopping decisions. I‟m going to read a series of words or phrases that describe
[products/food products]. For each, please tell me if hearing that about the [product/food product] would make you much more
likely to buy it, somewhat more likely, have no effect, or make you less likely to buy it.”
No Effect
35%
32%
31%
16%
Appalachian grown
Green
Native
Sustainable
Organic
65%
59%
66%
63%
57%
36%28% less likely59%
6%
31% no effect
41%
27%
29%
32%
33%
19%
10%
23%
9%
8%
7%
Descriptors of Products/Food Products (Combined) - All Counties, 2011
Overall, among the entire sample (i.e., ―product‖ and ―food product‖ respondents combined), 69% reported that they would be much more likely to buy a product/food product described as ―local,‖ and an additional 23% said they would be somewhat more likely to purchase a ―local‖ product. As the chart above shows, only 6% said that hearing a product/food product is ―local‖ would have no impact or a negative effect on their purchasing decisions. Respondents rated the terms ―Appalachian grown‖, ―green‖, and ―native‖ similarly. More than 6 in 10 consumers felt each of these characteristics would make them more likely to purchase a product, with a strong impact on over a third of shoppers. Less than a third said it would have a neutral or negative effect. ―Sustainable‖ was slightly less well received, as 59% said it would make them more likely to purchase a product; 33% reported no or a negative effect. ―Organic‖ had a strong positive impact among 31% of consumers, while 22% were neutral and 19% said it would make them less likely to purchase a product or food product. The strongest negative response was toward ―wild,‖ which was the only descriptor to elicit a net negative reaction. Just over one-third (36%) said they would be at least somewhat more likely to buy a product/food product labeled as ―wild,‖ whereas over
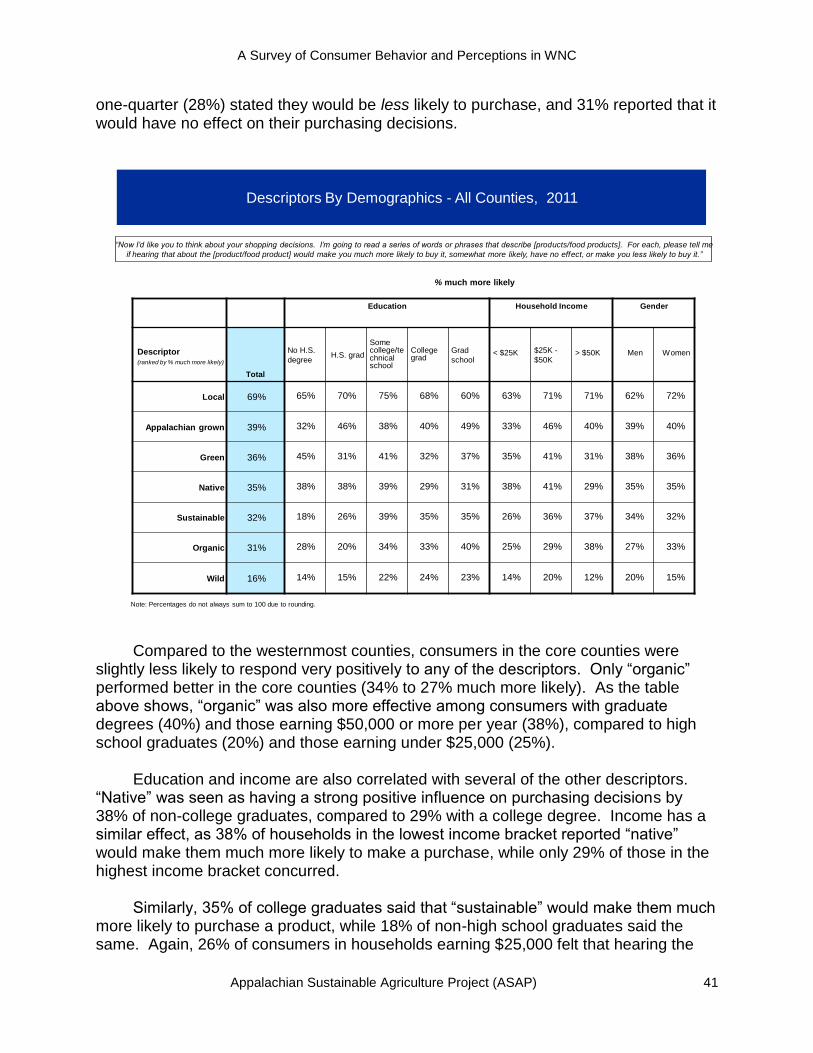
A Survey of Consumer Behavior and Perceptions in WNC
Appalachian Sustainable Agriculture Project (ASAP) 41
one-quarter (28%) stated they would be less likely to purchase, and 31% reported that it would have no effect on their purchasing decisions.
Education Household Income Gender
Descriptor (ranked by % much more likely)
Total
No H.S.
degreeH.S. grad
Some college/technical school
College grad
Grad
school< $25K $25K -
$50K> $50K Men Women
Local 69% 65% 70% 75% 68% 60% 63% 71% 71% 62% 72%
Appalachian grown 39% 32% 46% 38% 40% 49% 33% 46% 40% 39% 40%
Green 36% 45% 31% 41% 32% 37% 35% 41% 31% 38% 36%
Native 35% 38% 38% 39% 29% 31% 38% 41% 29% 35% 35%
Sustainable 32% 18% 26% 39% 35% 35% 26% 36% 37% 34% 32%
Organic 31% 28% 20% 34% 33% 40% 25% 29% 38% 27% 33%
Wild 16% 14% 15% 22% 24% 23% 14% 20% 12% 20% 15%
Descriptors By Demographics - All Counties, 2011
% much more likely
“Now I‟d like you to think about your shopping decisions. I‟m going to read a series of words or phrases that describe [products/food products]. For each, please tell me
if hearing that about the [product/food product] would make you much more likely to buy it, somewhat more likely, have no effect, or make you less likely to buy it.”
Note: Percentages do not always sum to 100 due to rounding.
Compared to the westernmost counties, consumers in the core counties were slightly less likely to respond very positively to any of the descriptors. Only ―organic‖ performed better in the core counties (34% to 27% much more likely). As the table above shows, ―organic‖ was also more effective among consumers with graduate degrees (40%) and those earning $50,000 or more per year (38%), compared to high school graduates (20%) and those earning under $25,000 (25%). Education and income are also correlated with several of the other descriptors. ―Native‖ was seen as having a strong positive influence on purchasing decisions by 38% of non-college graduates, compared to 29% with a college degree. Income has a similar effect, as 38% of households in the lowest income bracket reported ―native‖ would make them much more likely to make a purchase, while only 29% of those in the highest income bracket concurred. Similarly, 35% of college graduates said that ―sustainable‖ would make them much more likely to purchase a product, while 18% of non-high school graduates said the same. Again, 26% of consumers in households earning $25,000 felt that hearing the
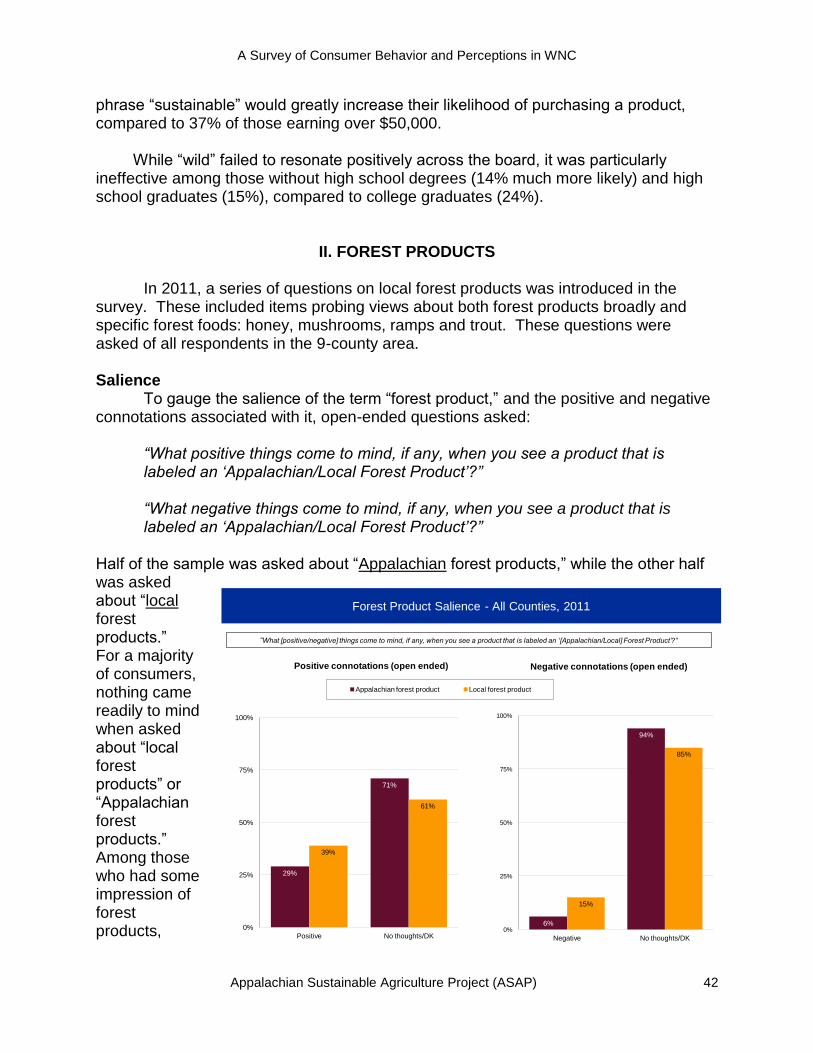
A Survey of Consumer Behavior and Perceptions in WNC
Appalachian Sustainable Agriculture Project (ASAP) 42
Forest Product Salience - All Counties, 2011
29%
71%
39%
61%
0%
25%
50%
75%
100%
Positive No thoughts/DK
Positive connotations (open ended)
Appalachian forest product Local forest product
6%
94%
15%
85%
0%
25%
50%
75%
100%
Negative No thoughts/DK
Negative connotations (open ended)
“What [positive/negative] things come to mind, if any, when you see a product that is labeled an „[Appalachian/Local] Forest Product‟?”
phrase ―sustainable‖ would greatly increase their likelihood of purchasing a product, compared to 37% of those earning over $50,000. While ―wild‖ failed to resonate positively across the board, it was particularly ineffective among those without high school degrees (14% much more likely) and high school graduates (15%), compared to college graduates (24%).
II. FOREST PRODUCTS
In 2011, a series of questions on local forest products was introduced in the
survey. These included items probing views about both forest products broadly and specific forest foods: honey, mushrooms, ramps and trout. These questions were asked of all respondents in the 9-county area. Salience To gauge the salience of the term ―forest product,‖ and the positive and negative connotations associated with it, open-ended questions asked:
“What positive things come to mind, if any, when you see a product that is labeled an „Appalachian/Local Forest Product‟?” “What negative things come to mind, if any, when you see a product that is labeled an „Appalachian/Local Forest Product‟?”
Half of the sample was asked about ―Appalachian forest products,‖ while the other half was asked about ―local forest products.‖ For a majority of consumers, nothing came readily to mind when asked about ―local forest products‖ or ―Appalachian forest products.‖ Among those who had some impression of forest products,
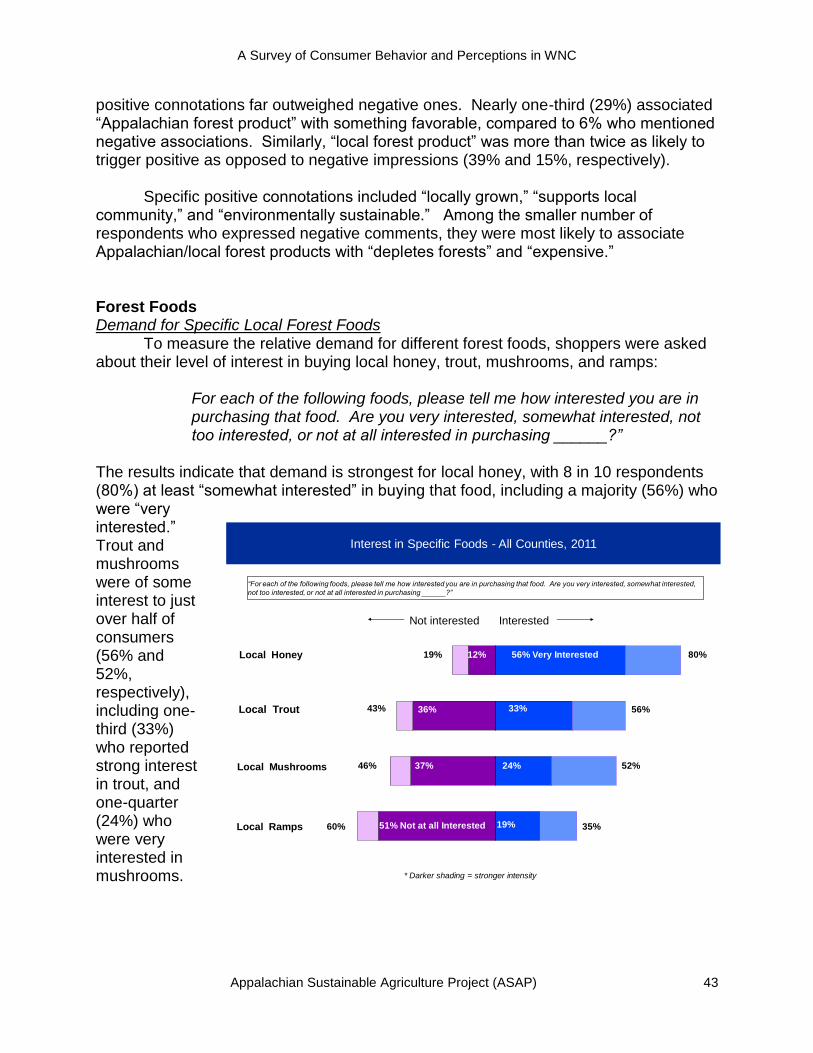
A Survey of Consumer Behavior and Perceptions in WNC
Appalachian Sustainable Agriculture Project (ASAP) 43
positive connotations far outweighed negative ones. Nearly one-third (29%) associated ―Appalachian forest product‖ with something favorable, compared to 6% who mentioned negative associations. Similarly, ―local forest product‖ was more than twice as likely to trigger positive as opposed to negative impressions (39% and 15%, respectively).
Specific positive connotations included ―locally grown,‖ ―supports local community,‖ and ―environmentally sustainable.‖ Among the smaller number of respondents who expressed negative comments, they were most likely to associate Appalachian/local forest products with ―depletes forests‖ and ―expensive.‖ Forest Foods Demand for Specific Local Forest Foods
To measure the relative demand for different forest foods, shoppers were asked about their level of interest in buying local honey, trout, mushrooms, and ramps:
For each of the following foods, please tell me how interested you are in purchasing that food. Are you very interested, somewhat interested, not too interested, or not at all interested in purchasing ______?”
The results indicate that demand is strongest for local honey, with 8 in 10 respondents (80%) at least ―somewhat interested‖ in buying that food, including a majority (56%) who were ―very interested.‖ Trout and mushrooms were of some interest to just over half of consumers (56% and 52%, respectively), including one-third (33%) who reported strong interest in trout, and one-quarter (24%) who were very interested in mushrooms.
Interest in Specific Foods - All Counties, 2011
Not interested Interested
12% 56% Very Interested
36%
37%
51% Not at all Interested 19%
24%
33% 56%
80%
52%
35%
* Darker shading = stronger intensity
Local Ramps
Local Mushrooms
Local Trout
Local Honey
60%
46%
43%
19%
“For each of the following foods, please tell me how interested you are in purchasing that food. Are you very interested, somewhat interested,
not too interested, or not at all interested in purchasing ______?”
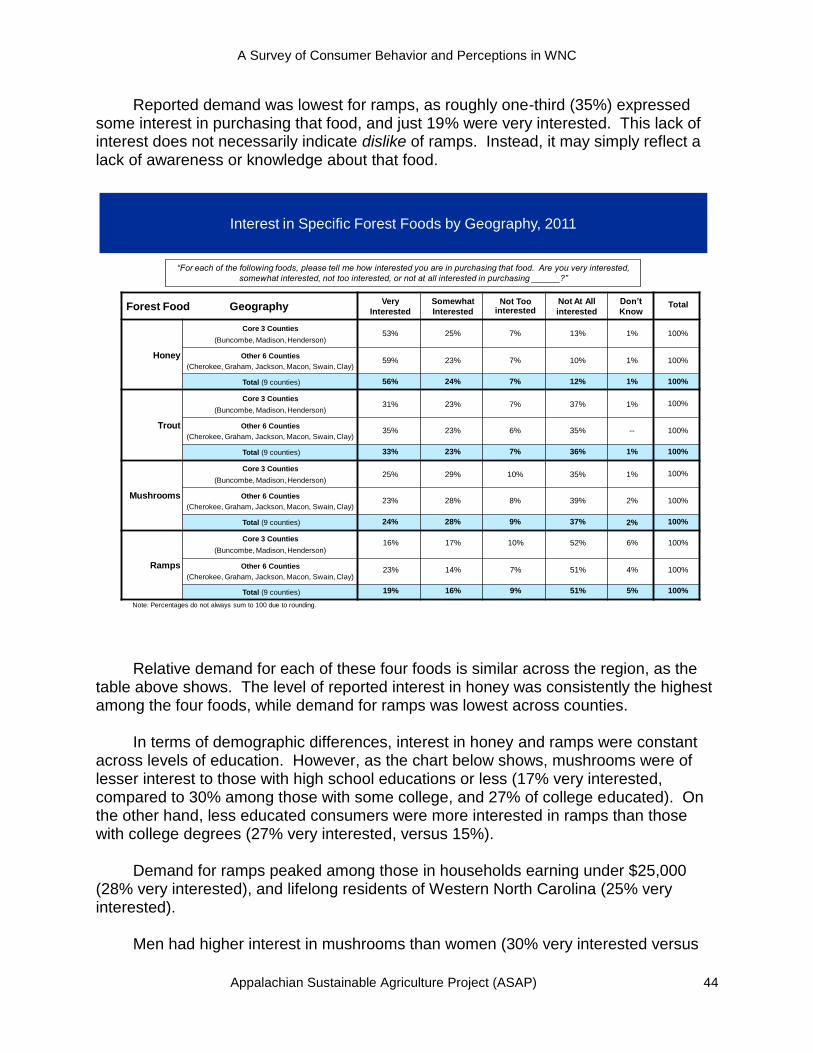
A Survey of Consumer Behavior and Perceptions in WNC
Appalachian Sustainable Agriculture Project (ASAP) 44
Reported demand was lowest for ramps, as roughly one-third (35%) expressed some interest in purchasing that food, and just 19% were very interested. This lack of interest does not necessarily indicate dislike of ramps. Instead, it may simply reflect a lack of awareness or knowledge about that food.
Forest Food GeographyVery
Interested
Somewhat
Interested
Not Too interested
Not At All
interested
Don’t
KnowTotal
Honey
Core 3 Counties
(Buncombe, Madison, Henderson)53% 25% 7% 13% 1% 100%
Other 6 Counties
(Cherokee, Graham, Jackson, Macon, Swain, Clay)59% 23% 7% 10% 1% 100%
Total (9 counties) 56% 24% 7% 12% 1% 100%
Trout
Core 3 Counties
(Buncombe, Madison, Henderson)31% 23% 7% 37% 1% 100%
Other 6 Counties
(Cherokee, Graham, Jackson, Macon, Swain, Clay)35% 23% 6% 35% -- 100%
Total (9 counties) 33% 23% 7% 36% 1% 100%
Mushrooms
Core 3 Counties
(Buncombe, Madison, Henderson)25% 29% 10% 35% 1% 100%
Other 6 Counties
(Cherokee, Graham, Jackson, Macon, Swain, Clay)23% 28% 8% 39% 2% 100%
Total (9 counties) 24% 28% 9% 37% 2% 100%
Ramps
Core 3 Counties
(Buncombe, Madison, Henderson)16% 17% 10% 52% 6% 100%
Other 6 Counties
(Cherokee, Graham, Jackson, Macon, Swain, Clay)23% 14% 7% 51% 4% 100%
Total (9 counties) 19% 16% 9% 51% 5% 100%
Interest in Specific Forest Foods by Geography, 2011
Note: Percentages do not always sum to 100 due to rounding.
“For each of the following foods, please tell me how interested you are in purchasing that food. Are you very interested,
somewhat interested, not too interested, or not at all interested in purchasing ______?”
Relative demand for each of these four foods is similar across the region, as the table above shows. The level of reported interest in honey was consistently the highest among the four foods, while demand for ramps was lowest across counties. In terms of demographic differences, interest in honey and ramps were constant across levels of education. However, as the chart below shows, mushrooms were of lesser interest to those with high school educations or less (17% very interested, compared to 30% among those with some college, and 27% of college educated). On the other hand, less educated consumers were more interested in ramps than those with college degrees (27% very interested, versus 15%). Demand for ramps peaked among those in households earning under $25,000 (28% very interested), and lifelong residents of Western North Carolina (25% very interested). Men had higher interest in mushrooms than women (30% very interested versus
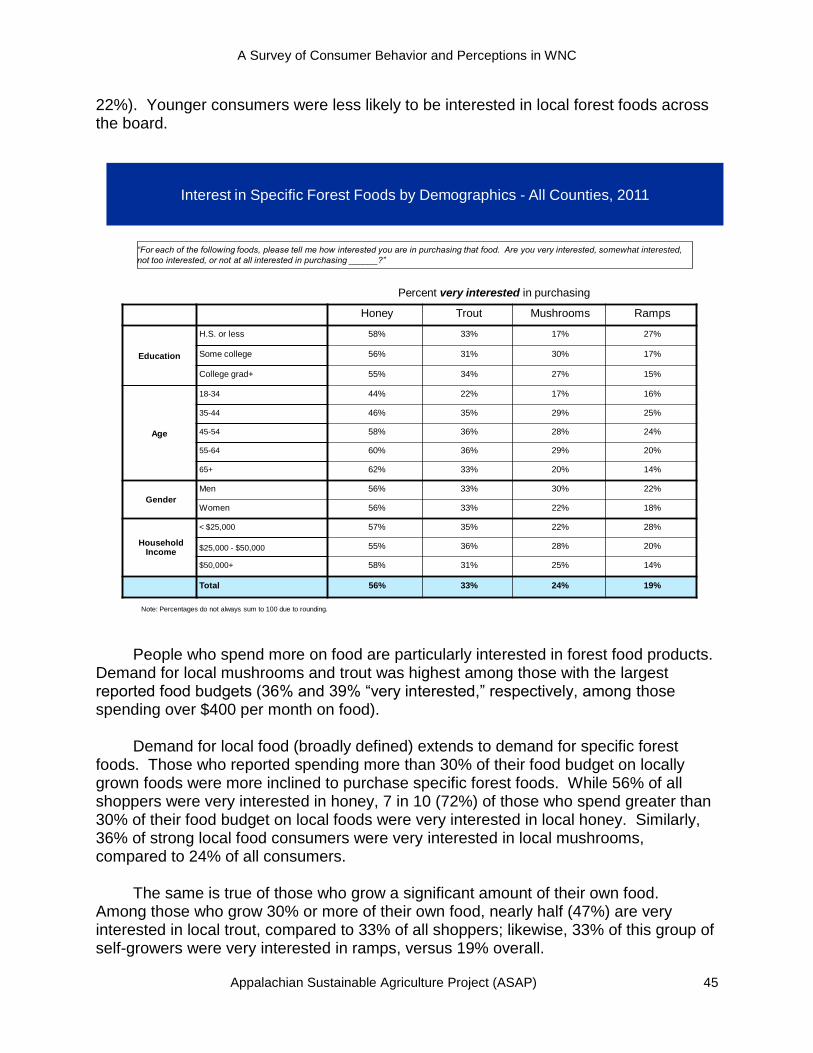
A Survey of Consumer Behavior and Perceptions in WNC
Appalachian Sustainable Agriculture Project (ASAP) 45
22%). Younger consumers were less likely to be interested in local forest foods across the board.
Honey Trout Mushrooms Ramps
Education
H.S. or less 58% 33% 17% 27%
Some college 56% 31% 30% 17%
College grad+ 55% 34% 27% 15%
Age
18-34 44% 22% 17% 16%
35-44 46% 35% 29% 25%
45-54 58% 36% 28% 24%
55-64 60% 36% 29% 20%
65+ 62% 33% 20% 14%
Gender
Men 56% 33% 30% 22%
Women 56% 33% 22% 18%
Household Income
< $25,000 57% 35% 22% 28%
$25,000 - $50,000 55% 36% 28% 20%
$50,000+ 58% 31% 25% 14%
Total 56% 33% 24% 19%
Note: Percentages do not always sum to 100 due to rounding.
Percent very interested in purchasing
Interest in Specific Forest Foods by Demographics - All Counties, 2011
“For each of the following foods, please tell me how interested you are in purchasing that food. Are you very interested, somewhat interested,
not too interested, or not at all interested in purchasing ______?”
People who spend more on food are particularly interested in forest food products. Demand for local mushrooms and trout was highest among those with the largest reported food budgets (36% and 39% ―very interested,‖ respectively, among those spending over $400 per month on food). Demand for local food (broadly defined) extends to demand for specific forest foods. Those who reported spending more than 30% of their food budget on locally grown foods were more inclined to purchase specific forest foods. While 56% of all shoppers were very interested in honey, 7 in 10 (72%) of those who spend greater than 30% of their food budget on local foods were very interested in local honey. Similarly, 36% of strong local food consumers were very interested in local mushrooms, compared to 24% of all consumers. The same is true of those who grow a significant amount of their own food. Among those who grow 30% or more of their own food, nearly half (47%) are very interested in local trout, compared to 33% of all shoppers; likewise, 33% of this group of self-growers were very interested in ramps, versus 19% overall.
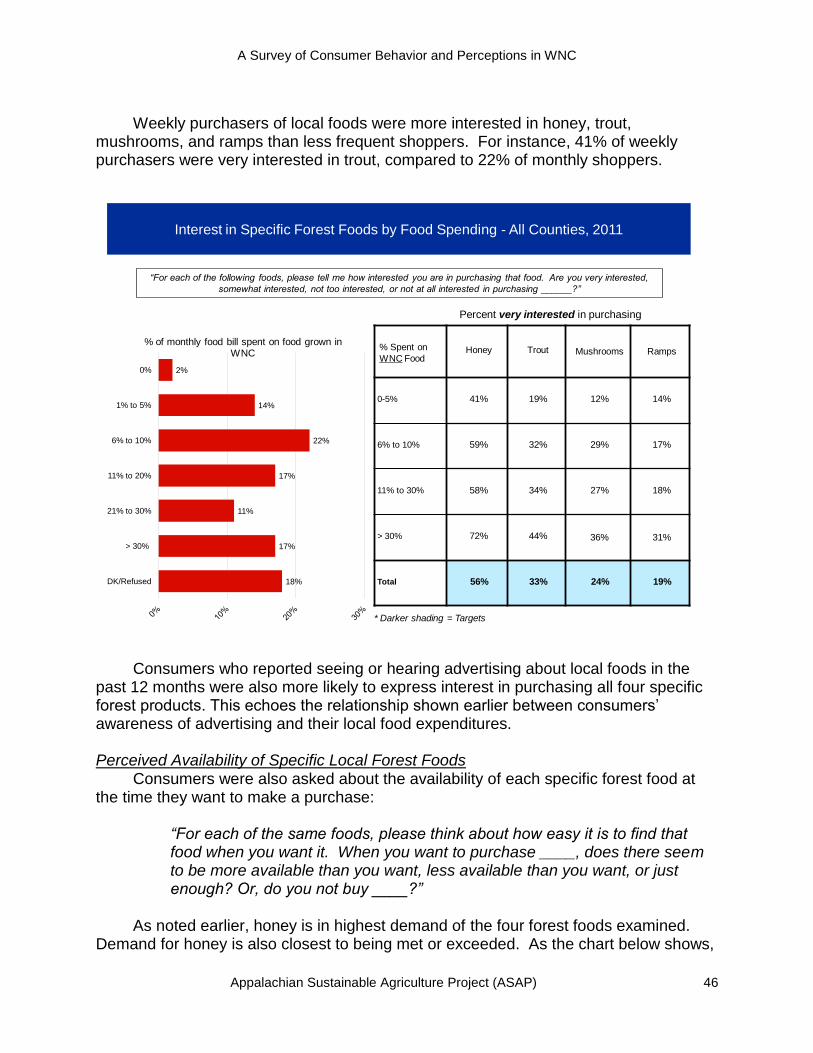
A Survey of Consumer Behavior and Perceptions in WNC
Appalachian Sustainable Agriculture Project (ASAP) 46
Weekly purchasers of local foods were more interested in honey, trout, mushrooms, and ramps than less frequent shoppers. For instance, 41% of weekly purchasers were very interested in trout, compared to 22% of monthly shoppers.
2%
14%
22%
17%
11%
17%
18%
0%
1% to 5%
6% to 10%
11% to 20%
21% to 30%
> 30%
DK/Refused
% of monthly food bill spent on food grown in WNC
% Spent on
WNC FoodHoney Trout Mushrooms Ramps
0-5% 41% 19% 12% 14%
6% to 10% 59% 32% 29% 17%
11% to 30% 58% 34% 27% 18%
> 30% 72% 44% 36% 31%
Total 56% 33% 24% 19%
Percent very interested in purchasing
“For each of the following foods, please tell me how interested you are in purchasing that food. Are you very interested,
somewhat interested, not too interested, or not at all interested in purchasing ______?”
Interest in Specific Forest Foods by Food Spending - All Counties, 2011
* Darker shading = Targets
Consumers who reported seeing or hearing advertising about local foods in the past 12 months were also more likely to express interest in purchasing all four specific forest products. This echoes the relationship shown earlier between consumers’ awareness of advertising and their local food expenditures. Perceived Availability of Specific Local Forest Foods Consumers were also asked about the availability of each specific forest food at the time they want to make a purchase:
“For each of the same foods, please think about how easy it is to find that food when you want it. When you want to purchase ____, does there seem to be more available than you want, less available than you want, or just enough? Or, do you not buy ____?”
As noted earlier, honey is in highest demand of the four forest foods examined. Demand for honey is also closest to being met or exceeded. As the chart below shows,
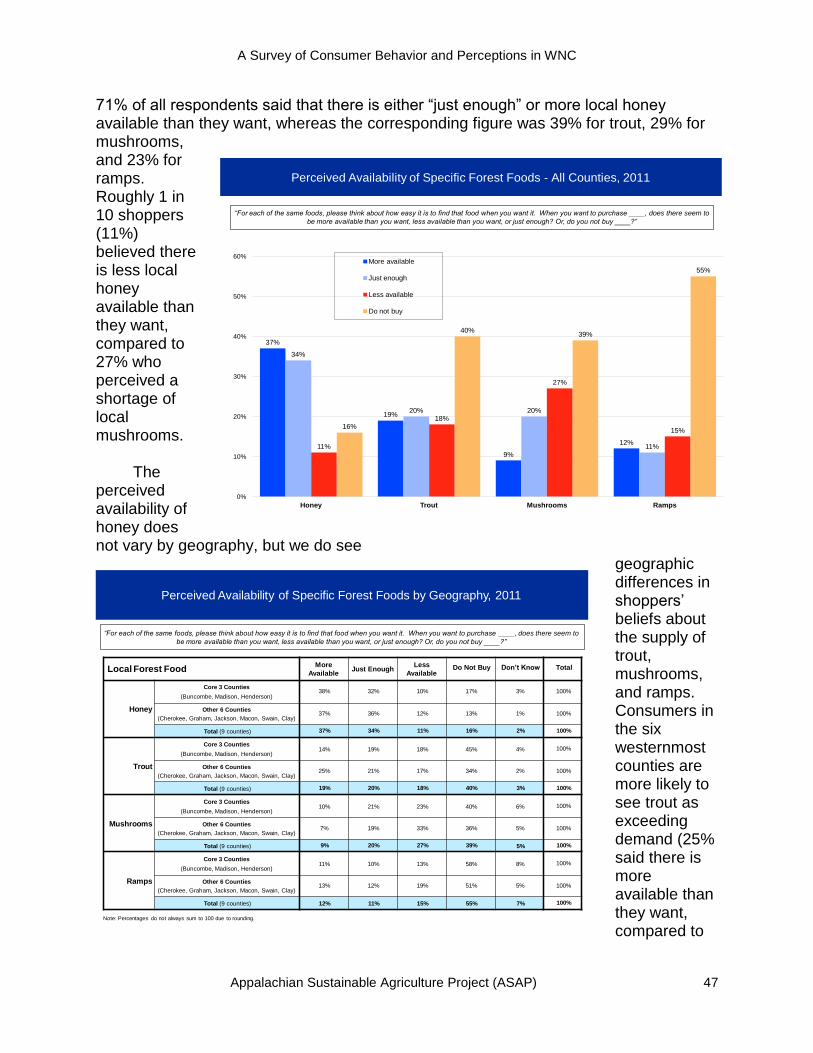
A Survey of Consumer Behavior and Perceptions in WNC
Appalachian Sustainable Agriculture Project (ASAP) 47
Local Forest FoodMore
AvailableJust Enough
Less
AvailableDo Not Buy Don’t Know Total
Honey
Core 3 Counties
(Buncombe, Madison, Henderson)38% 32% 10% 17% 3% 100%
Other 6 Counties
(Cherokee, Graham, Jackson, Macon, Swain, Clay)37% 36% 12% 13% 1% 100%
Total (9 counties) 37% 34% 11% 16% 2% 100%
Trout
Core 3 Counties
(Buncombe, Madison, Henderson)14% 19% 18% 45% 4% 100%
Other 6 Counties
(Cherokee, Graham, Jackson, Macon, Swain, Clay)25% 21% 17% 34% 2% 100%
Total (9 counties) 19% 20% 18% 40% 3% 100%
Mushrooms
Core 3 Counties
(Buncombe, Madison, Henderson)10% 21% 23% 40% 6% 100%
Other 6 Counties
(Cherokee, Graham, Jackson, Macon, Swain, Clay)7% 19% 33% 36% 5% 100%
Total (9 counties) 9% 20% 27% 39% 5% 100%
Ramps
Core 3 Counties
(Buncombe, Madison, Henderson)11% 10% 13% 58% 8% 100%
Other 6 Counties
(Cherokee, Graham, Jackson, Macon, Swain, Clay)13% 12% 19% 51% 5% 100%
Total (9 counties) 12% 11% 15% 55% 7% 100%
Perceived Availability of Specific Forest Foods by Geography, 2011
Note: Percentages do not always sum to 100 due to rounding.
“For each of the same foods, please think about how easy it is to find that food when you want it. When you want to purchase ____, does there seem to
be more available than you want, less available than you want, or just enough? Or, do you not buy ____?”
71% of all respondents said that there is either ―just enough‖ or more local honey available than they want, whereas the corresponding figure was 39% for trout, 29% for mushrooms, and 23% for ramps. Roughly 1 in 10 shoppers (11%) believed there is less local honey available than they want, compared to 27% who perceived a shortage of local mushrooms. The perceived availability of honey does not vary by geography, but we do see
geographic differences in shoppers’ beliefs about the supply of trout, mushrooms, and ramps. Consumers in the six westernmost counties are more likely to see trout as exceeding demand (25% said there is more available than they want, compared to
Perceived Availability of Specific Forest Foods - All Counties, 2011
37%
19%
9%
12%
34%
20% 20%
11%11%
18%
27%
15%16%
40%39%
55%
0%
10%
20%
30%
40%
50%
60%
Honey Trout Mushrooms Ramps
More available
Just enough
Less available
Do not buy
“For each of the same foods, please think about how easy it is to find that food when you want it. When you want to purchase ____, does there seem to
be more available than you want, less available than you want, or just enough? Or, do you not buy ____?”
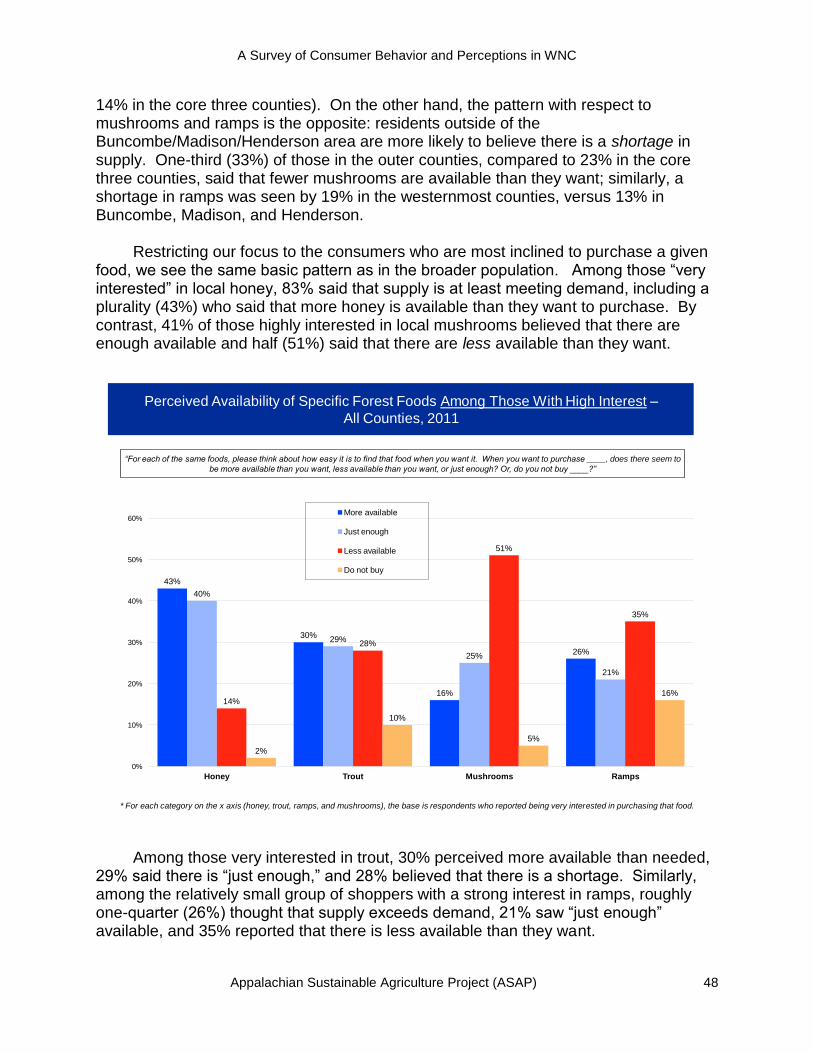
A Survey of Consumer Behavior and Perceptions in WNC
Appalachian Sustainable Agriculture Project (ASAP) 48
Perceived Availability of Specific Forest Foods Among Those With High Interest –
All Counties, 2011
43%
30%
16%
26%
40%
29%
25%
21%
14%
28%
51%
35%
2%
10%
5%
16%
0%
10%
20%
30%
40%
50%
60%
Honey Trout Mushrooms Ramps
More available
Just enough
Less available
Do not buy
“For each of the same foods, please think about how easy it is to find that food when you want it. When you want to purchase ____, does there seem to
be more available than you want, less available than you want, or just enough? Or, do you not buy ____?”
* For each category on the x axis (honey, trout, ramps, and mushrooms), the base is respondents who reported being very interested in purchasing that food.
14% in the core three counties). On the other hand, the pattern with respect to mushrooms and ramps is the opposite: residents outside of the Buncombe/Madison/Henderson area are more likely to believe there is a shortage in supply. One-third (33%) of those in the outer counties, compared to 23% in the core three counties, said that fewer mushrooms are available than they want; similarly, a shortage in ramps was seen by 19% in the westernmost counties, versus 13% in Buncombe, Madison, and Henderson.
Restricting our focus to the consumers who are most inclined to purchase a given food, we see the same basic pattern as in the broader population. Among those ―very interested‖ in local honey, 83% said that supply is at least meeting demand, including a plurality (43%) who said that more honey is available than they want to purchase. By contrast, 41% of those highly interested in local mushrooms believed that there are enough available and half (51%) said that there are less available than they want.
Among those very interested in trout, 30% perceived more available than needed, 29% said there is ―just enough,‖ and 28% believed that there is a shortage. Similarly, among the relatively small group of shoppers with a strong interest in ramps, roughly one-quarter (26%) thought that supply exceeds demand, 21% saw ―just enough‖ available, and 35% reported that there is less available than they want.
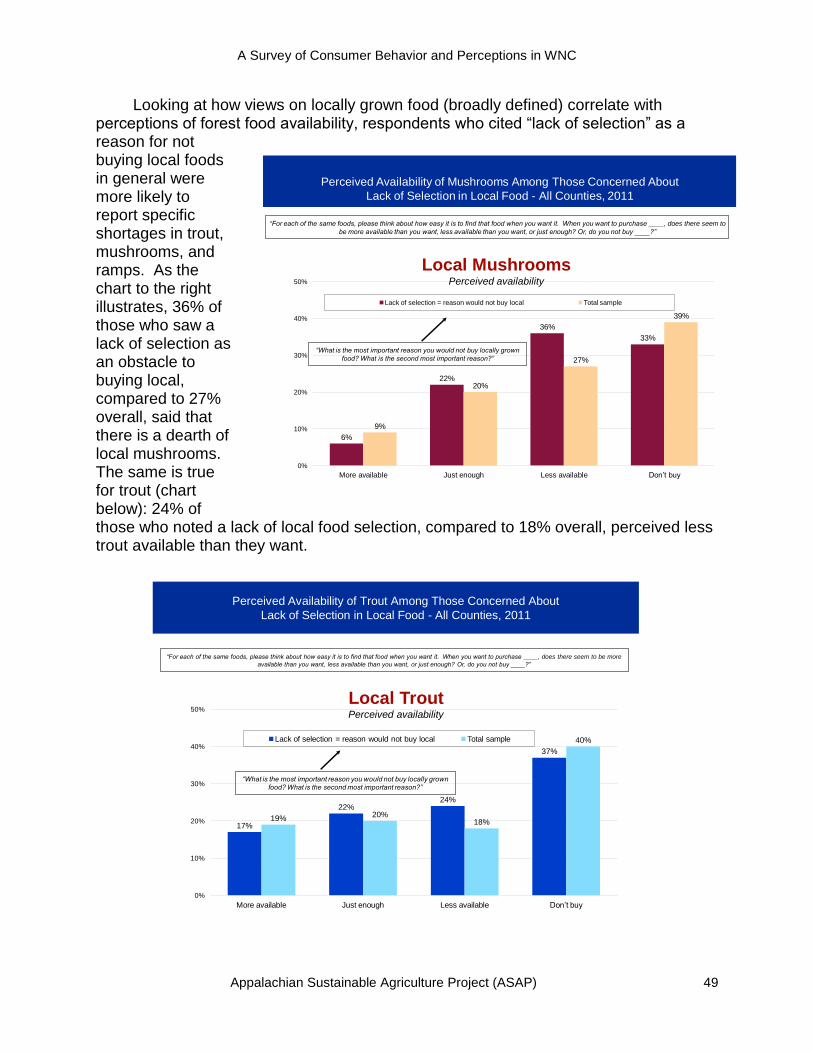
A Survey of Consumer Behavior and Perceptions in WNC
Appalachian Sustainable Agriculture Project (ASAP) 49
Looking at how views on locally grown food (broadly defined) correlate with perceptions of forest food availability, respondents who cited ―lack of selection‖ as a reason for not buying local foods in general were more likely to report specific shortages in trout, mushrooms, and ramps. As the chart to the right illustrates, 36% of those who saw a lack of selection as an obstacle to buying local, compared to 27% overall, said that there is a dearth of local mushrooms. The same is true for trout (chart below): 24% of those who noted a lack of local food selection, compared to 18% overall, perceived less trout available than they want.
Perceived Availability of Mushrooms Among Those Concerned About
Lack of Selection in Local Food - All Counties, 2011
6%
22%
36%
33%
9%
20%
27%
39%
0%
10%
20%
30%
40%
50%
More available Just enough Less available Don’t buy
Lack of selection = reason would not buy local Total sample
Local MushroomsPerceived availability
“For each of the same foods, please think about how easy it is to find that food when you want it. When you want to purchase ____, does there seem to
be more available than you want, less available than you want, or just enough? Or, do you not buy ____?”
“What is the most important reason you would not buy locally grown
food? What is the second most important reason?”
Perceived Availability of Trout Among Those Concerned About
Lack of Selection in Local Food - All Counties, 2011
17%
22%24%
37%
19%20%
18%
40%
0%
10%
20%
30%
40%
50%
More available Just enough Less available Don’t buy
Lack of selection = reason would not buy local Total sample
Local TroutPerceived availability
“For each of the same foods, please think about how easy it is to find that food when you want it. When you want to purchase ____, does there seem to be more
available than you want, less available than you want, or just enough? Or, do you not buy ____?”
“What is the most important reason you would not buy locally grown
food? What is the second most important reason?”
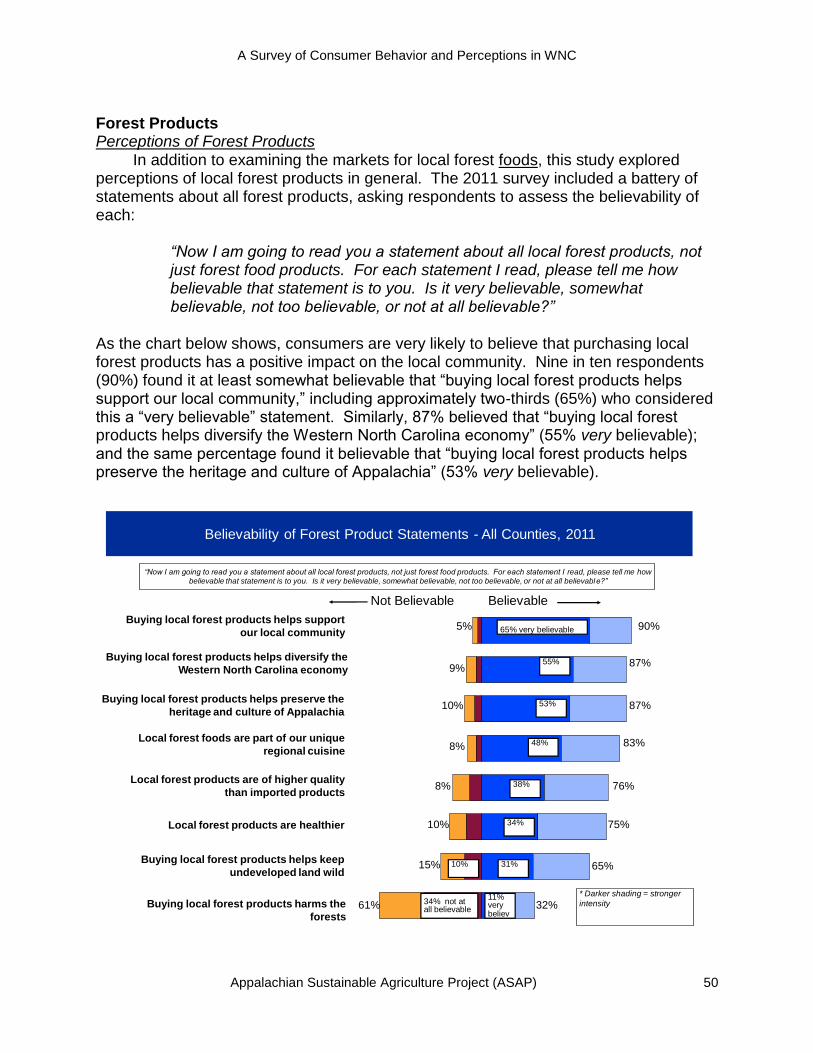
A Survey of Consumer Behavior and Perceptions in WNC
Appalachian Sustainable Agriculture Project (ASAP) 50
Forest Products Perceptions of Forest Products In addition to examining the markets for local forest foods, this study explored perceptions of local forest products in general. The 2011 survey included a battery of statements about all forest products, asking respondents to assess the believability of each:
“Now I am going to read you a statement about all local forest products, not just forest food products. For each statement I read, please tell me how believable that statement is to you. Is it very believable, somewhat believable, not too believable, or not at all believable?”
As the chart below shows, consumers are very likely to believe that purchasing local forest products has a positive impact on the local community. Nine in ten respondents (90%) found it at least somewhat believable that ―buying local forest products helps support our local community,‖ including approximately two-thirds (65%) who considered this a ―very believable‖ statement. Similarly, 87% believed that ―buying local forest products helps diversify the Western North Carolina economy‖ (55% very believable); and the same percentage found it believable that ―buying local forest products helps preserve the heritage and culture of Appalachia‖ (53% very believable).
Believability of Forest Product Statements - All Counties, 2011
5%
9%
10%
8%
8%
10%
15%
61%
90%
87%
87%
83%
76%
75%
32%
65%
BelievableNot Believable
65% very believable
55%
34%
53%
48%
38%
31%
11% very believ
34% not at all believable
10%
Buying local forest products helps support
our local community
Buying local forest products harms the
forests
“Now I am going to read you a statement about all local forest products, not just forest food products. For each statement I read, please tell me how
believable that statement is to you. Is it very believable, somewhat believable, not too believable, or not at all believable?”
Buying local forest products helps diversify the
Western North Carolina economy
Buying local forest products helps preserve the
heritage and culture of Appalachia
Local forest foods are part of our unique
regional cuisine
Local forest products are of higher quality
than imported products
Local forest products are healthier
Buying local forest products helps keep
undeveloped land wild
* Darker shading = stronger
intensity
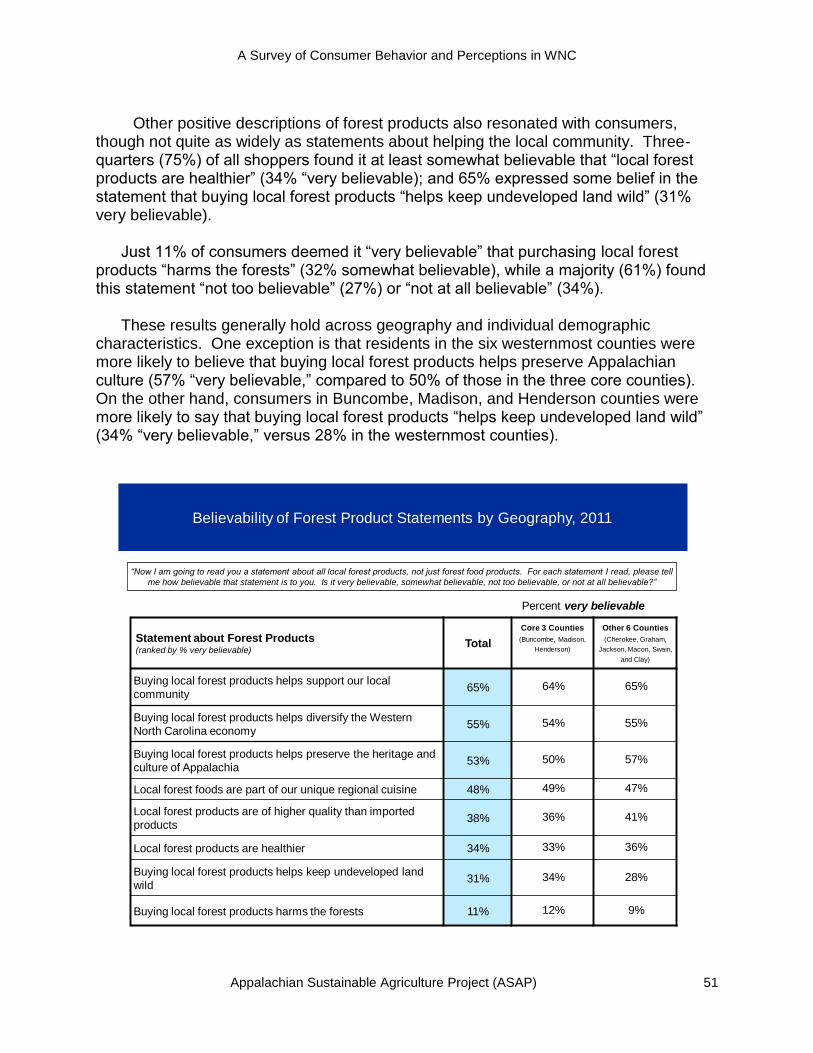
A Survey of Consumer Behavior and Perceptions in WNC
Appalachian Sustainable Agriculture Project (ASAP) 51
Other positive descriptions of forest products also resonated with consumers, though not quite as widely as statements about helping the local community. Three-quarters (75%) of all shoppers found it at least somewhat believable that ―local forest products are healthier‖ (34% ―very believable); and 65% expressed some belief in the statement that buying local forest products ―helps keep undeveloped land wild‖ (31% very believable). Just 11% of consumers deemed it ―very believable‖ that purchasing local forest products ―harms the forests‖ (32% somewhat believable), while a majority (61%) found this statement ―not too believable‖ (27%) or ―not at all believable‖ (34%). These results generally hold across geography and individual demographic characteristics. One exception is that residents in the six westernmost counties were more likely to believe that buying local forest products helps preserve Appalachian culture (57% ―very believable,‖ compared to 50% of those in the three core counties). On the other hand, consumers in Buncombe, Madison, and Henderson counties were more likely to say that buying local forest products ―helps keep undeveloped land wild‖ (34% ―very believable,‖ versus 28% in the westernmost counties).
Statement about Forest Products(ranked by % very believable)
Total
Core 3 Counties
(Buncombe, Madison,
Henderson)
Other 6 Counties
(Cherokee, Graham,
Jackson, Macon, Swain,
and Clay)
Buying local forest products helps support our local
community65% 64% 65%
Buying local forest products helps diversify the Western
North Carolina economy55% 54% 55%
Buying local forest products helps preserve the heritage and
culture of Appalachia53% 50% 57%
Local forest foods are part of our unique regional cuisine 48% 49% 47%
Local forest products are of higher quality than imported
products38% 36% 41%
Local forest products are healthier 34% 33% 36%
Buying local forest products helps keep undeveloped land
wild31% 34% 28%
Buying local forest products harms the forests 11% 12% 9%
Believability of Forest Product Statements by Geography, 2011
“Now I am going to read you a statement about all local forest products, not just forest food products. For each statement I read, please tell
me how believable that statement is to you. Is it very believable, somewhat believable, not too believable, or not at all believable?”
Percent very believable
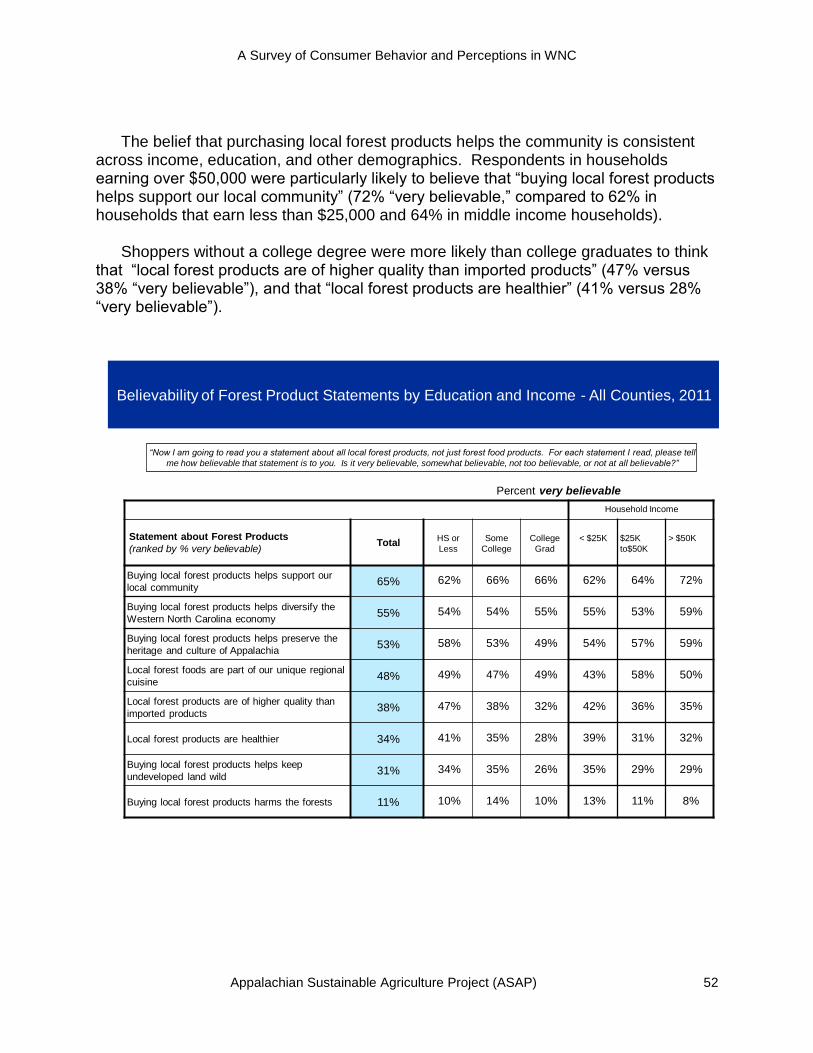
A Survey of Consumer Behavior and Perceptions in WNC
Appalachian Sustainable Agriculture Project (ASAP) 52
The belief that purchasing local forest products helps the community is consistent across income, education, and other demographics. Respondents in households earning over $50,000 were particularly likely to believe that ―buying local forest products helps support our local community‖ (72% ―very believable,‖ compared to 62% in households that earn less than $25,000 and 64% in middle income households). Shoppers without a college degree were more likely than college graduates to think that ―local forest products are of higher quality than imported products‖ (47% versus 38% ―very believable‖), and that ―local forest products are healthier‖ (41% versus 28% ―very believable‖).
Household Income
Statement about Forest Products
(ranked by % very believable)Total
HS or
Less
Some
College
College
Grad
< $25K $25K
to$50K
> $50K
Buying local forest products helps support our
local community65% 62% 66% 66% 62% 64% 72%
Buying local forest products helps diversify the
Western North Carolina economy55% 54% 54% 55% 55% 53% 59%
Buying local forest products helps preserve the
heritage and culture of Appalachia53% 58% 53% 49% 54% 57% 59%
Local forest foods are part of our unique regional
cuisine48% 49% 47% 49% 43% 58% 50%
Local forest products are of higher quality than
imported products38% 47% 38% 32% 42% 36% 35%
Local forest products are healthier 34% 41% 35% 28% 39% 31% 32%
Buying local forest products helps keep
undeveloped land wild31% 34% 35% 26% 35% 29% 29%
Buying local forest products harms the forests 11% 10% 14% 10% 13% 11% 8%
Believability of Forest Product Statements by Education and Income - All Counties, 2011
“Now I am going to read you a statement about all local forest products, not just forest food products. For each statement I read, please tell
me how believable that statement is to you. Is it very believable, somewhat believable, not too believable, or not at all believable?”
Percent very believable