a surlyn® ionomer as a self-healing and self-sensing...
TRANSCRIPT
A Surlyn® Ionomer as a Self-Healing and Self-Sensing Composite
Phillip John Reynolds ID 618 217
A thesis submitted to the University of Birmingham
for the degree of MRes in the Science and Engineering of Materials
Department of Metallurgy and Materials University of Birmingham December 2011

University of Birmingham Research Archive
e-theses repository This unpublished thesis/dissertation is copyright of the author and/or third parties. The intellectual property rights of the author or third parties in respect of this work are as defined by The Copyright Designs and Patents Act 1988 or as modified by any successor legislation. Any use made of information contained in this thesis/dissertation must be in accordance with that legislation and must be properly acknowledged. Further distribution or reproduction in any format is prohibited without the permission of the copyright holder.
A Surlyn® Ionomer as a Self-Healing and Self-Sensing Composite
Abstract
The ionomer known by its trademark name as Surlyn® has recently become an area of interest
as it reportedly has the ability to self-heal. In this project, new techniques were employed to
investigate three grades of Surlyn® (PC2000, 9910 and 1706) with a view to the development
of a self-healing and self-sensing composite. The study initially focused on the development
of Surlyn plaques and Surlyn fibres; reporting on both the self-healing and self-sensing
capabilities of Surlyn®. Grade PC2000 fibres were shown to have the highest light
transmission results and clearly showed the ability to act as self-sensing light guides. The
crack healing ability of Surlyn® fibres and Surlyn® film was studied during mode I fracture
tests and Surlyn® was shown to act as a crack arrestor increasing the fracture toughness of
carbon-fibre and also suggesting that Surlyn® is able to self-heal. Surlyn® films and Surlyn®
fibres were then fabricated with VTM 264 glass-fibre pre-preg with a view to producing a
self-healing and self-sensing composite. Further investigation into the self-healing and self-
sensing abilities of the fabricated Surlyn® composites and Surlyn® fibres is discussed.

Acknowledgements
I would like to thank Dr. Stephen Kukureka and Professor Gerard Fernando for their guidance
and help during the course of the project and also to Abilash Nair, Dee Harris and Jonathon
Burns for their assistance. I would also like to thank my family who have supported me
throughout my studies and have always believed in me when I doubted myself. I will always
be thankful.
iv
Table of Contents
Page
1.0 Introduction……………………………………………………………………….. 1
2.0 Aims………………………………………………………………………………... 3
3.0 Literature Review…………………………………………………………………. 4
3.1 Ionomers........................................................................................................ 4
3.1.1 Ionomer Definition…………………………………………………. 4
3.1.2 Production of Ionomers…………………………………………….. 4
3.1.3 Ionomer Composition………………………………………………. 5
3.1.4 Ionomer Morphology……………………………………………….. 5
3.1.4.1 Ionic Aggregate Formation………………………………... 5
3.1.4.2 The Effect of Ionic Aggregate on Thermal, Mechanical and
Physical Properties………………………………………… 8
3.2 Surlyn®……………………………………………………………………... 10
3.2.1 Surlyn® Definition…………………………………………………... 10
3.2.2 Production of Surlyn®………………………………………………. 10
3.2.3 Properties and Applications…………………………………………. 11
3.3 Self-healing Capacity of Surlyn® and other Ionomers….………………….. 12
v
3.4 Other Self-healing Mechanisms and Systems……………………………… 21
3.4.1 Intrinsic Self-healing Mechanisms………………………………….. 22
3.4.1.1 Diels-Alder based polymers……………………………….. 22
3.4.1.2 Photodimerization based polymers………………………… 22
3.4.1.3 Hydrogen bonded and Metal-ligand coordination polymers. 23
3.4.2 Extrinsic Self-healing Mechanisms…………………………………. 24
3.4.2.1 Hollow tubes and Glass fibres……………………………... 24
3.4.2.2 Microcapsules……………………………………………… 26
3.4.2.3 Microvascular Networks…………………………………… 28
3.5 Self-sensing Composites………………………………………………. …... 30
4.0 Methodology………………………………………………………………………... 34
4.1 Materials…………………………………………………………………….. 34
4.1.1 Surlyn Grades®………………………………………………………. 34
4.2 Sample Preparation and Preliminary Characterisation……………………… 34
4.2.1 Preparation of Thin Plaques from Pellets……………………………. 34
4.2.2 Density Measurements....……………………………………………. 35
4.2.3 Differential Scanning Calorimetry…………………………………… 36
4.2.4 Fourier Transform Infrared Spectroscopy…………………………… 37
4.2.5 Refractive Index Measurements……………………………………… 37
vi
4.3 Production of Surlyn® PC2000 and Surlyn® 9910 Thick Plaques…………... 38
4.3.1 Production of Thick Plaques…………………………………………. 38
4.3.2 Monitoring the Temperature Profile within a Thick Plaque (Surlyn®
PC2000 and Surlyn® 9910)…………………………………………… 39
4.4 Production of Surlyn® Composites (PC2000)……………………………….. 41
4.4.1 Production of Glass Fibre Reinforced Surlyn® Composites…………. 41
4.5 Extrusion of Surlyn® Fibres…………………………………………………. 42
4.5.1 Development of a Methodology to Extrude Surlyn® fibres………….. 42
4.6 Characterisation of the Light Transmission…………………………………. 44
4.6.1 Light Transmission through the Extruded Surlyn® fibres……………. 44
4.6.2 Comparison of Light Transmission between Surlyn PC2000 and
PMMA fibres………………………………………………………… 45
4.6.3 Effect of Fibre Connection on Light Transmission Measurements….. 45
4.6.4 Light Transmission Distance Measurements for Extruded Thin
Surlyn® fibres………………………………………………………… 46
4.6.5 Fibre Connection Methods using SMA Connectors…………………. 46
4.6.6 Light Transmission Measurements through Extruded Thin Surlyn®
fibres…………………………………………………………………. 47
4.6.7 Attenuation Experiments…………………………………………….. 49
4.7 Fibre Characterisation……………………………………………………….. 50
vii
4.7.1 Fibre Density Measurements…………………………………..…….. 50
4.7.2 Differential Scanning Calorimetry…………………………………… 50
4.8 Fibre Analysis……………………………………………………………….. 50
4.9 Sample Storage………………………………………………………………. 51
4.10 Surlyn® Composite Development………………………………………….. 51
4.10.1 Production of Composites………………………………………….. 51
4.10.1.1 General Pre-preg Lay-up………………………………….. 51
4.10.1.2 Vacuum Bagging Procedure………………………………. 52
4.10.1.3 Curing of Composite Samples…………………………….. 53
4.10.2 Self-healing Composite Development……………………………… 55
4.10.3 Self-healing/Self-sensing Composite Development………………... 57
4.10.4 Crack Arrestor Composites…………………………………………. 58
4.10.4.1 Crack Arrestors……………………………………………. 59
4.10.4.2 Composite Set-up………………………………………….. 60
4.10.4.3 G1c Sample Preparation……………………………………. 61
4.10.4.4 G1c Test Procedure………………………………………… 62
4.10.4.5 G1c Calculation…………………………………………….. 63
4.10.4.6 Test Specimen Analysis…………………………………… 65
5.0 Results and Discussion……………………………………………………………... 66
viii
5.1 Preliminary Characterisation………………………………………………… 67
5.1.1 Density Measurements……………………………………………….. 67
5.1.2 Differential Scanning Calorimetry…………………………………… 68
5.1.3 Fourier Transform Infrared Spectroscopy…………………………… 72
5.1.4 Refractive Index Measurements……………………………………… 74
5.2 Production of Surlyn PC2000 and Surlyn 9910 Thick Plaques…………... 76
5.2.1 Production of Thick Plaques…………………………………………. 76
5.2.2 Monitoring the Temperature Profile within a Thick Plaque
(Surlyn PC2000 and 9910)…………………………………………. 78
5.3 Production of Surlyn Composites………………………………………… 80
5.3.1 Production of Glass Fibre Reinforced Composites………………….. 80
5.4 Extrusion of Surlyn Fibres…………………………………………………. 82
5.4.1 Development of a Methodology to Extrude Surlyn Fibres…………. 82
5.5 Characterisation of the Light Transmission…………………………………. 89
5.5.1 Light Transmission measurements through extruded thick Surlyn
fibres………………………………………………………………….. 89
5.5.2 Comparison of Light Transmission between Surlyn PC2000 and
PMMA fibres…………………………………………………………. 93
5.5.3 Effect of Fibre Connection on Light Transmission Measurements….. 95
ix
5.5.4 Light Transmission Distance Measurements for Extruded Thin
Surlyn fibres………………………………………………………… 97
5.5.5 Fibre Connection Methods using SMA Connectors…………………. 100
5.5.6 Light Transmission Measurements through Extruded Thin Surlyn
fibres………………………………………………………………….. 101
5.5.7 Attenuation Experiments…………………………………………….. 105
5.6 Fibre Characterisation……………………………………………………….. 108
5.6.1 Density Measurements……………………………………………….. 108
5.6.2 Differential Scanning Calorimetry…………………………………… 109
5.7 Self-Healing and Self-sensing Composite Development……………………. 112
5.7.1 Self-Healing Composite Development………………………………. 112
5.7.2 Self-Healing and Self-Sensing Composite Development……………. 114
5.7.3 Crack Arrestor Composites…………………………………………... 116
5.7.3.1 Reference Samples………………………………………….. 117
5.7.3.2 Surlyn PC2000 Fibre Samples…………………………….. 121
5.7.3.3 Surlyn 1706 Film Samples………………………………… 125
5.7.3.4 Surlyn 1706 Punctured Film Samples……………………... 130
6.0 Conclusion………………………………………………………………………….. 138
7.0 Future Work……………………………………………………………………....... 140
x
8.0 Appendices…………………………………………………………………………... 142
A1.1 Figure 1a – Raw data for Surlyn PC2000 density measurements………... 142
A1.2 Figure 1b - Raw data for Surlyn 9910 density measurements…………… 142
A1.3 Figure 1c – Raw data for Surlyn 1706 density measurements…………… 142
A2.1 Figure 2a – DSC trace of Surlyn 9910; one cycle………………………... 143
A2.2 Figure 2b – DSC trace of Surlyn 1706; one cycle………………………... 144
A3.1 Figure 3a – DSC trace of Surlyn 9910; three cycles……………………… 145
A3.2 Figure 3b - DSC trace of Surlyn 1706; three cycles……………………… 147
A4. Figure 4 - (a) Typical Load versus displacement curve and (b) interlaminar
fracture toughness (GIc) versus crack length for reference
samples two – five……………………………………………….. 149
A5. Figure 5 - (a) Typical Load versus displacement curve and (b) interlaminar
fracture toughness (GIc) versus crack length for Surlyn
PC2000 fibre samples two, three and five……………………….. 151
A6. Figure 6 - (a) Typical Load versus displacement curve and (b) interlaminar
fracture toughness (GIc) versus crack length for Surlyn 1706 film,
samples one, three, four and five………………………………… 152
A7. Figure 7 - (a) Typical Load versus displacement curve and (b) interlaminar
fracture toughness (GIc) versus crack length for punctured
Surlyn 1706 film, samples one, two, four and five…………….. 154
9.0 References…………………………………………………………………………… 156
xi
List of Figures
Page
Figure 1 – Proposed conformations of structures of ionomers…………....................... 5
Figure 2 – Schematic representation of the Eisenberg-Hird-More model…….............. 6
Figure 3 – Schematic diagram showing the growth of multiplets and the
formation of clusters with increases in ionic content……………………… 8
Figure 4 – Diagram showing the model for the order-disorder transition of
ionic clusters………………………………………………………………. 9
Figure 5 – Diagram of EMAA neutralized with sodium……………………………… 11
Figure 6 – Schematic diagram of the order-disorder healing theory presented
by Fall……………………………………………………………………... 12
Figure 7 – Thermal IR image of React-A-seal® following puncture from a
9 mm bullet (pink area ~ 98 oC and blue area ~ 28 oC)…………………… 13
Figure 8 – Image of elastic hinge after sawing of React-A-Seal®…………………….. 15
Figure 9 – Image of the peel test sample……………………………………………… 16
xii
Figure 10 – Diagram of healing mechanism in hollow fiber-based self-healing
composites………………………………………………………………… 26
Figure 11 – Diagram of microencapsulated healing system…………………………... 27
Figure 12 – S.E.M. image of urea-formaldehyde microcapsules…………………….... 28
Figure 13 – Schematic diagram of the self-healing structure composed of a
micro vascular substrate and a brittle epoxy coating containing an
embedded catalyst……………………………………………….………... 29
Figure 14 – Schematic diagram of interpenetrating microvascular network………….. 30
Figure 15 – Picture showing fabrication set-up for producing thick Surlyn
plaque incorporating a k-type thermocouple……………………………... 39
Figure 16 – Schematic diagram of the location of the thermocouples in the
thick Surlyn plaque; thermocouples were spaced 2 mm apart………….. 40
Figure 17 - Schematic diagram of the custom-made PTFE mould that was used
to fabricate the SDOF reinforced Surlyn composites…………………… 41
Figure 18 – A photograph showing the experimental set-up for extruding and
hauling off different diameter Surlyn fibres…………………………….. 42
xiii
Figure 19 – Photograph of light transmission intensity measurement set-up…............. 45
Figure 20 – Photograph of fibre light guide measurement set-up…………………….. 46
Figure 21 – Schematic diagram showing the three different methods used to
connect thin Surlyn PC2000 fibres with SMA connectors……………… 47
Figure 22 – Photograph of light transmission intensity measurement set-up…............. 48
Figure 23 – Schematic diagram of vacuum bagging procedure………………............. 53
Figure 24 – Photograph of autoclave used to cure composite samples……………….. 54
Figure 25 – Schematic diagrams showing different lay-up sequences for the
Surlyn 1706 film and glass fibre composite samples……………............ 56
Figure 26 – Schematic diagrams showing different lay-up sequences for the
Surlyn PC2000 fibres and glass fibre composite samples………............. 58
Figure 27 – Photograph of custom made puncture device…………………………….. 59
Figure 28 – Schematic diagram showing the set-up at the centre of the 16 ply
Surlyn film composite plate………………………………….................. 60
xiv
Figure 29 – Photograph of G1c test specimen…………………………………............. 61
Figure 30 – Photograph of Mode I experimental set-up………………………………. 62
Figure 31 – Data and geometry for CBT and MCC calculations……………………... 64
Figure 32 – DSC of Surlyn PC2000; one cycle……………………………………… 69
Figure 33 - DSC of Surlyn PC2000; three cycles……………………………………. 71
Figure 34 – MFTIR transmission spectrum of Surlyn (a) PC2000, (b) 9910
and (c) 1706………………………………………………………………. 74
Figure 35 – Heating/Cooling curves for production of thick Surlyn plaques
(a) PC2000 and (b) 9910………………………………………………….. 77
Figure 36 – Image of thick Surlyn PC2000 plaque containing a k – type
thermocouple……………………………………………………………… 78
Figure 37 – Graphs showing monitored heat flow through thick Surlyn
plaques……………………………………………………………………. 79
Figure 38 – Photograph of plaque made from Surlyn PC2000 and
small diameter optical fibres……………………………………………... 81
xv
Figure 39 – Photograph demonstrating the Surlyn composite bleeding light……….. 81
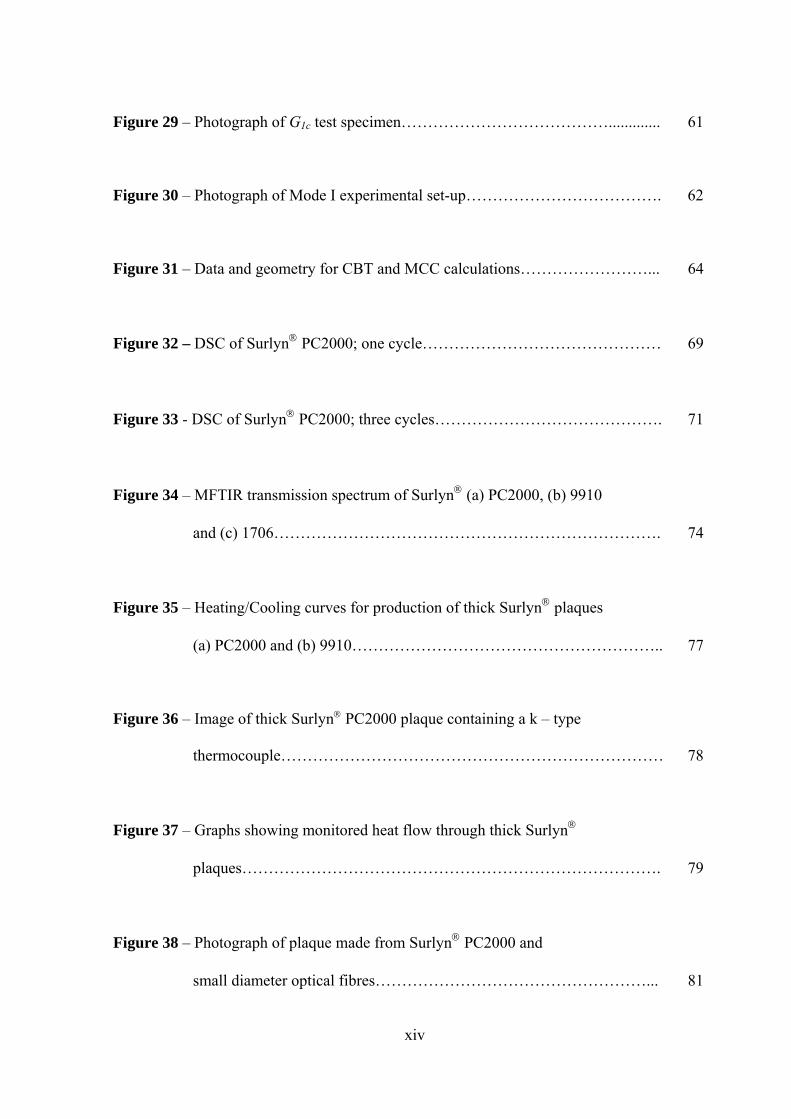
Figure 40 – Graph showing average diameter of thick Surlyn PC2000 fibres………. 83
Figure 41 – (a) 5x magnification image of extruded Surlyn PC2000 fibre
(10 kg) surface area and (b) SEM image of Surlyn PC2000 fibre
(10 kg) cleaved end………………………………………………............. 84
Figure 42 – Graph showing average diameter of thick Surlyn 9910 fibres….............. 85
Figure 43 – (a) 5x magnification image of extruded Surlyn PC2000 fibre
(10 kg) surface area and (b) SEM image of Surlyn PC2000 fibre
(10 kg) cleaved end………………………………………………………. 86
Figure 44 – Graph showing average diameter of fibres extruded using adapted
haul off machine…………………………………………………………. 87
Figure 45 – (a) 5x magnification image of extruded thin Surlyn PC2000 fibre
(Setting six) surface area and (b) SEM image of Surlyn PC2000
fibre (Setting six) cleaved end…………………………………………… 88
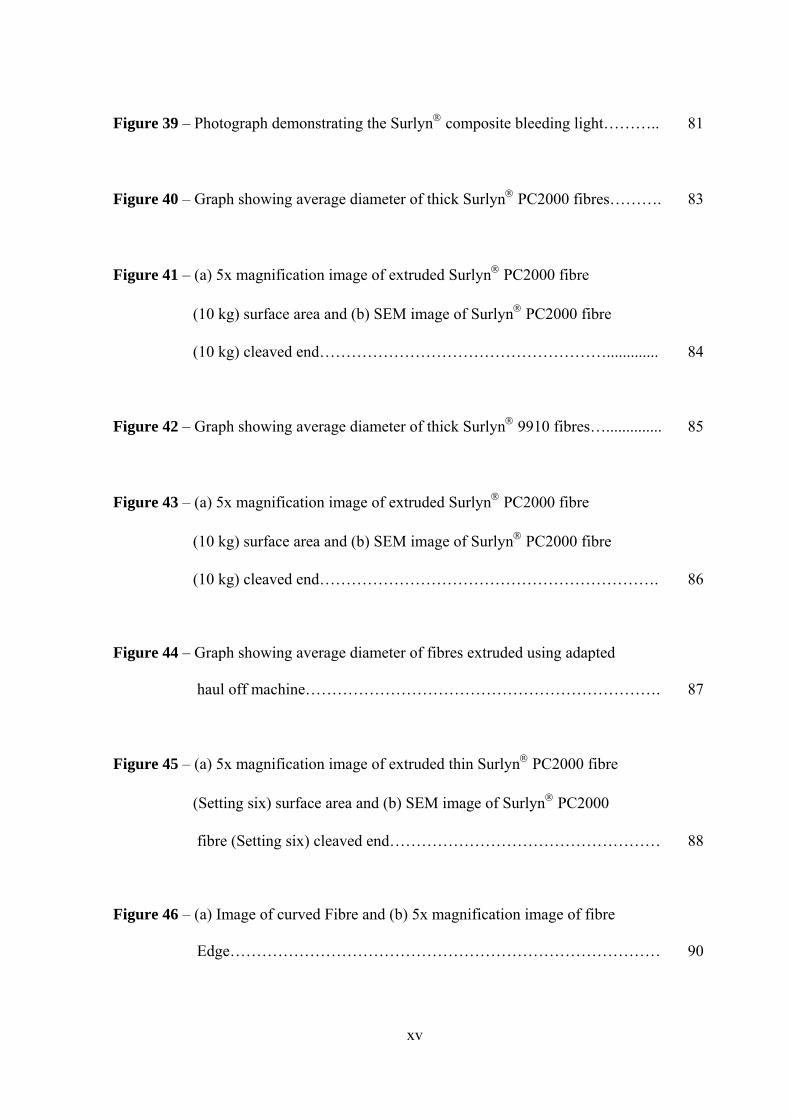
Figure 46 – (a) Image of curved Fibre and (b) 5x magnification image of fibre
Edge……………………………………………………………………… 90
xvi
Figure 47 – (a) Image of fibre and (b) 5x magnification image of fibre edge………… 91
Figure 48 - (a) Image of fibre and (b) 5x magnification image of fibre edge………… 92
Figure 49 – (a) Image of fibre and (b) 5x magnification image of fibre edge………… 92
Figure 50 – Photograph of Surlyn PC2000 fibre transmitting light………………….. 95
Figure 51 – 10x magnification image of Surlyn PC2000 fibre transmitting
light following method one connection………………………………….. 100
Figure 52 – Light transmission curves for (a) 40 cm, (b) 30 cm, (c) 20 cm and
(d) 10 cm Surlyn PC2000 fibres during the 1 cm cut test………………. 104
Figure 53 – Light transmission curve for the Surlyn PC2000, 20 cm fibre
hauled off using setting one. ……………………………………………... 105
Figure 54 – Light attenuation curves for Surlyn PC2000 fibre hauled off
using setting 1; (a) 10 g, (b) 50 g , (c) 100 g, (d) 500 g, (e) 1000 g
and (f) 2000 g…………………………………………………………….. 106
Figure 55 –DSC of extruded Surlyn PC2000 fibre (setting six); one cycle………….. 109
Figure 56 - DSC of extruded Surlyn PC2000 fibre (setting six); three cycles………. 111
xvii
Figure 57 – Images and schematic diagrams (not to scale) of 50 mm x 50 mm
(a) single ply, (b) Two ply and (c) four ply glass fibre/Surlyn
(b) 1706 film composites…………………………………………………. 113
Figure 58 – Images of (a) Surlyn fibres and glass-fibre. (b) Surlyn fibres,
PMMA fibres and glass-fibre. (c) Surlyn Fibres, S2 hollow glass-
fibres and glass-fibre. (d) Surlyn fibres, SDOF and glass-fibre.
(e) Surlyn fibres, standard optical fibres and glass-fibre
composites………………………………………………………………... 116
Figure 59 – Cross-sectional image of G1c reference test specimen
(magnification – 10x)…………………………………………………….. 118
Figure 60 – (a) Typical Load versus displacement curve and (b) interlaminar
fracture toughness (GIc) versus crack length for reference sample
one………………………………………………………………………… 120
Figure 61 – S.E.M images of reference sample following Mode I fracture
testing……………………………………………………………………... 121
Figure 62 - Cross sectional image of G1c Surlyn PC2000 fibre test specimen
(magnification – 10x)…………………………………………………….... 122
xviii
Figure 63 – (a) Typical Load versus displacement curve and (b) interlaminar
fracture toughness (GIc) versus crack length for Surlyn PC2000
fibres, sample one…………………………………………………............ 124
Figure 64 – S.E.M images of Surlyn PC2000 fibre sample following Mode I
fracture testing……………………………………………………………. 125
Figure 65 - Cross sectional image of G1c Surlyn 1706 film test specimen
(Magnification – 10x)……………………………………………………... 126
Figure 66 – (a) Typical Load versus displacement curve and (b) interlaminar
fracture toughness (GIc) versus crack length for Surlyn 1706 film,
sample two………………………………………………………………... 128
Figure 67 – S.E.M images of Surlyn 1706 film sample following mode I
fracture testing……………………………………………………………. 130
Figure 68 – S.E.M image of punctured Surlyn 1706 film……………………............ 131
Figure 69 - Cross sectional image of G1c punctured Surlyn 1706 film test
specimen (Magnification – 10x)………………………………………….. 131

xix
Figure 70 - (a) Typical Load versus displacement curve and (b) interlaminar
fracture toughness (GIc) versus crack length for punctured Surlyn
1706 film, sample two…………………………………………………….. 133
Figure 71 – S.E.M images of punctured Surlyn 1706 film sample following
mode I fracture testing……………………………………………………. 135
xx
List of Tables
Page
Table 1 – Summary of the Grades of Surlyn used in this study along with
selected properties…………………………………………………………... 34
Table 2 – Table containing a summary of the processing conditions that were
used to manufacture the thin film…………………………………………... 35
Table 3 – Table containing temperature ramps used to programme the DSC………… 36
Table 4 – Dimensions of the samples used for the MID spectroscopy……………….. 37
Table 5 – Summary of the moulding conditions that were used to produce the
thick Surlyn plaques………………………………………………………. 38
Table 6 – Summary of the heating ramp sequence that was used to measure the
temperature profile around the centre point of the Surlyn plaque………... 40
Table 7 – Summary showing weights that were applied to the base of the
extruded fibres……………………………………………………………… 43
Table 8 – Experimentally derived relationship between the setting on the
Minimat motor drive and the RPM of the acetyl mandrel…………………. 44
xxi
Table 9 – Summary of light transmission procedures carried out on thin
Surlyn PC2000 fibres…………………………………………………….. 48
Table 10 – Weights used during attenuation experiments…………………………….. 49
Table 11 - Material processing schedule………………………………………............ 54
Table 12 – Surlyn crack arrestors used during Mode I fracture testing....................... 59
Table 13 – G1c test procedure with accordance to British Standard
BS ISO15024……………………………………………………………… 63
Table 14 – Density measurement for all three grades of Surlyn
Table 15 – Thermal characteristics of Surlyn PC2000, 9910 and 1706……………... 69
Table 16 – Refractive Indices for Surlyn PC2000, 9910 and 1706………………….. 75
Table 17 – Average diameter of Extruded Surlyn PC2000 fibres…………………… 83
Table 18 – Average diameter of Extruded Surlyn 9910 fibres………………............ 85
Table 19 – Fibre diameter measurements for Surlyn PC2000………………………. 87
xxii
Table 20 – Light transmission measurements through extruded Surlyn
PC2000 and 9910 thick fibres……………………………………………... 89
Table 21 – Light intensity and average diameter measurements for Surlyn
PC2000 and PMMA fibres………………………………………………... 94
Table 22 – Light transmission, fibre end diameters and fibre diameter for
Surlyn PC2000 fibres……………………………………………………. 96
Table 23 - Light transmission, fibre end diameters and fibre diameter for
Surlyn 9910 fibres………………………………………………………... 96
Table 24 – Average diameter and light guide distance for settings
one - three Surlyn PC2000 and 9910 fibres………………………............ 98
Table 25 - Average diameter and light guide distance for thin Surlyn PC2000
fibres……………………………………………………………………….. 99
Table 26 – Light transmission readings for test one to three (N/R – no reading)…….. 101
Table 27 – Density measurement results for Surlyn PC2000 fibre, setting six……… 108
Table 28 - Thermal characteristics of extruded Surlyn PC2000 fibre
(setting six)………………………………………………………………… 110
xxiii
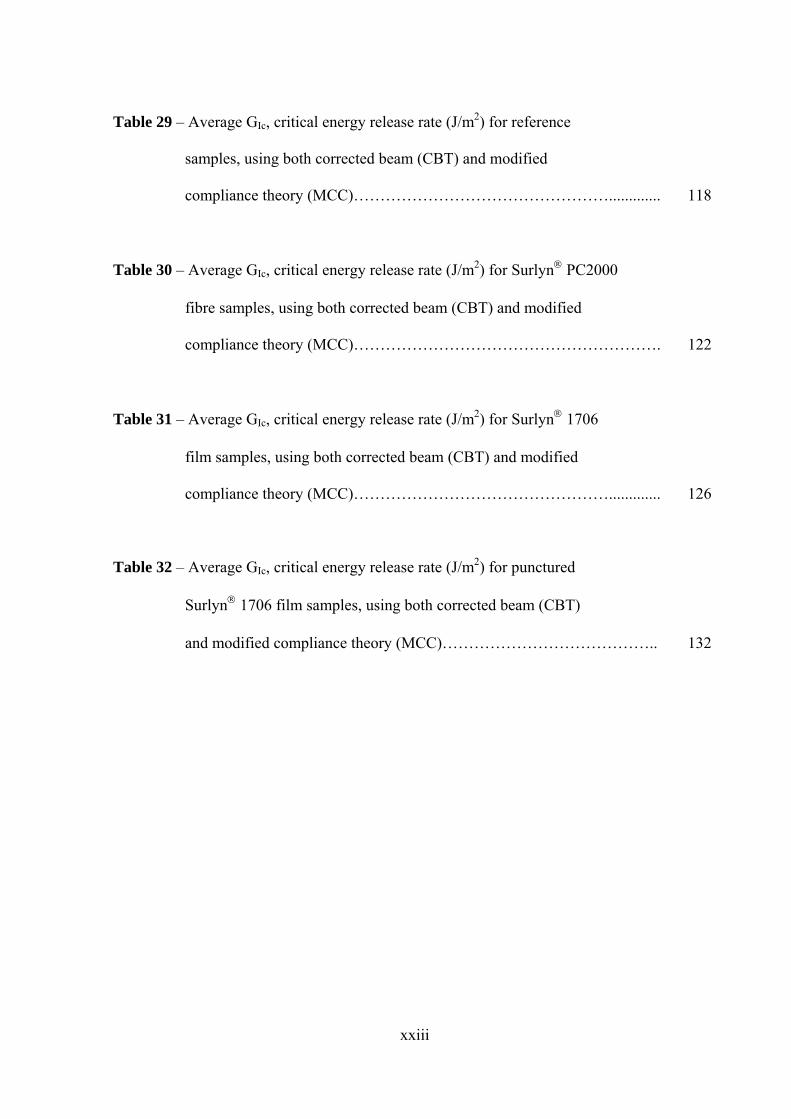
Table 29 – Average GIc, critical energy release rate (J/m2) for reference
samples, using both corrected beam (CBT) and modified
compliance theory (MCC)…………………………………………............. 118
Table 30 – Average GIc, critical energy release rate (J/m2) for Surlyn PC2000
fibre samples, using both corrected beam (CBT) and modified
compliance theory (MCC)…………………………………………………. 122
Table 31 – Average GIc, critical energy release rate (J/m2) for Surlyn 1706
film samples, using both corrected beam (CBT) and modified
compliance theory (MCC)…………………………………………............. 126
Table 32 – Average GIc, critical energy release rate (J/m2) for punctured
Surlyn 1706 film samples, using both corrected beam (CBT)
and modified compliance theory (MCC)………………………………….. 132
- 1 -
1.0 Introduction
Surlyn® is the trademark name given to an ethylene based material known as an ionomer.
Surlyn® is used for such applications; including food and cosmetics packaging.1
Other types of ionomers include styrene, butadiene, urethane and sulfone. Although these
materials have been around since the 1960’s, it is only recently that this class of material;
particularly Surlyn® has been studied and observed to contain self-healing properties.
Self-healing is defined as the complete or passive repair of minor damage without the need for
detection or any type of manual intervention.2 Self-healing is classified into two types known
as extrinsic and intrinsic healing. Extrinsic healing involves an embedded healing agent and
intrinsic healing materials are able to heal by themselves.3
Previous studies have subjected Surlyn® to different ballistic, indentation and also sawing
studies. Surlyn® is an example of an intrinsic self-healing material and healing is said to take
place due to thermally reversible cross-links and intermolecular interactions helping close the
damaged area.4
Due to this reported self-healing property, Surlyn® shows a potential for future use in a wide
variety of unique applications and this is shown by recent developments and research
undertaken by both the Navy and N.A.S.A.5, 6

- 2 -
Future development and understanding of Surlyn® and its self-healing behaviour will allow
for the development of materials where damage is detected and repaired in-situ extending
their life time and reliability during use.
A number of new techniques were employed during the course of study to further investigate
the self-healing and light guide capabilities of three different grades of Surlyn® in the interest
of developing a self-healing and self-sensing composite material. This then leads to the main
aims of the project.

- 3 -
2.0 Aims
2.1 To carry out a literature review on the polymer known by its trade names as Surlyn®
and its self-healing capacity.
2.2 To employ different techniques to characterise Surlyn® and the three different grades
used during this study.
2.3 Development of techniques for production of thick and thin Surlyn® plaques and
extrusion of Surlyn® fibres; to a view of developing a self-sensing composite.
2.4 To investigate the crack healing capacity of Surlyn® and the light transmission (self-
sensing) capabilities of Surlyn® fibres; to a view of developing a self-healing and self-
sensing composite.

- 4 -
3.0 Literature Review
3.1 Ionomers
3.1.1 Ionomer Definition
Ionomers were originally defined as olefin-based polymers containing a relatively small
percentage of ionic groups which had strong ionic inter chain forces controlling their
properties.7, 8 As new polymer backbones and more ionic character were being incorporated
into ionomers it was clear there were problems with this definition due to the lack of division
between such systems and polyelectrolytes and related materials.
Due to this lack of distinction a new definition stated that ionomers are polymers in which the
bulk properties are governed by ionic interactions in discrete regions of the material,
specifically in materials where the ion group content is ~ 15 mol %.9, 10 Behaviour of
ionomers were therefore attributed to their properties and not their composition enabling a
differentiation between an ionomer and a polyelectrolyte.11
3.1.2 Production of Ionomers
Production of ionomers involves a process known as copolymer neutralization. The process
involves ionomers being derived from precursor copolymers containing both ionic and non
ionic repeat groups.4
The ionic component is then neutralized forming an ionic pair with a metallic cation.12 - 15
This process produces the ionomer with ionic groups as part of the polymer structure. The
- 5 -
number of acid groups neutralized influences the amount of ionic content present in the
ionomer.4
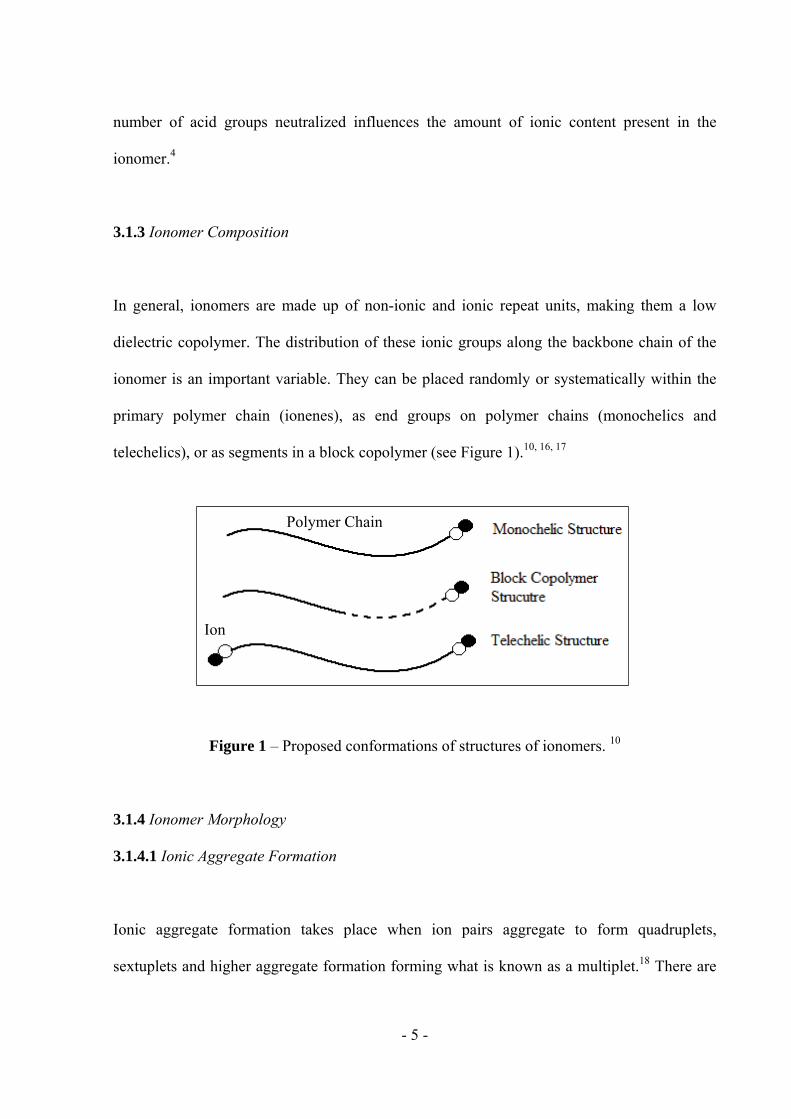
3.1.3 Ionomer Composition
In general, ionomers are made up of non-ionic and ionic repeat units, making them a low
dielectric copolymer. The distribution of these ionic groups along the backbone chain of the
ionomer is an important variable. They can be placed randomly or systematically within the
primary polymer chain (ionenes), as end groups on polymer chains (monochelics and
telechelics), or as segments in a block copolymer (see Figure 1).10, 16, 17
Figure 1 – Proposed conformations of structures of ionomers. 10
3.1.4 Ionomer Morphology
3.1.4.1 Ionic Aggregate Formation
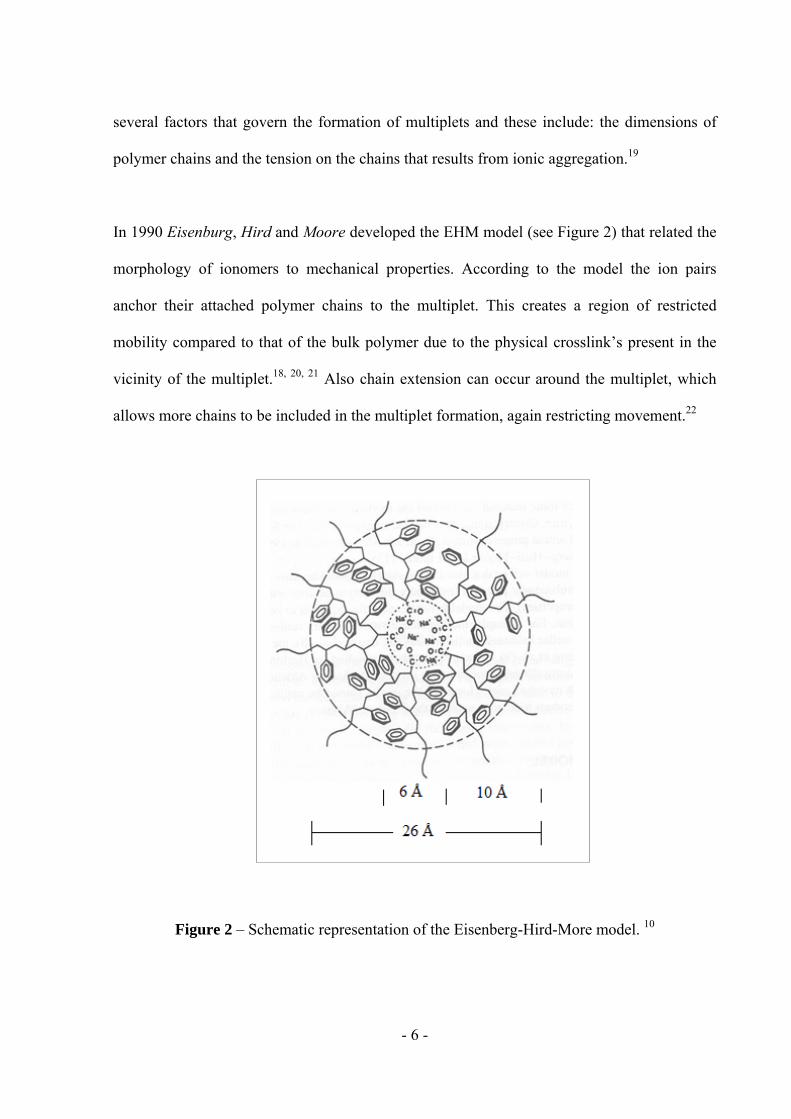
Ionic aggregate formation takes place when ion pairs aggregate to form quadruplets,
sextuplets and higher aggregate formation forming what is known as a multiplet.18 There are
Polymer Chain
Ion
- 6 -
several factors that govern the formation of multiplets and these include: the dimensions of
polymer chains and the tension on the chains that results from ionic aggregation.19
In 1990 Eisenburg, Hird and Moore developed the EHM model (see Figure 2) that related the
morphology of ionomers to mechanical properties. According to the model the ion pairs
anchor their attached polymer chains to the multiplet. This creates a region of restricted
mobility compared to that of the bulk polymer due to the physical crosslink’s present in the
vicinity of the multiplet.18, 20, 21 Also chain extension can occur around the multiplet, which
allows more chains to be included in the multiplet formation, again restricting movement.22
Figure 2 – Schematic representation of the Eisenberg-Hird-More model. 10

- 7 -
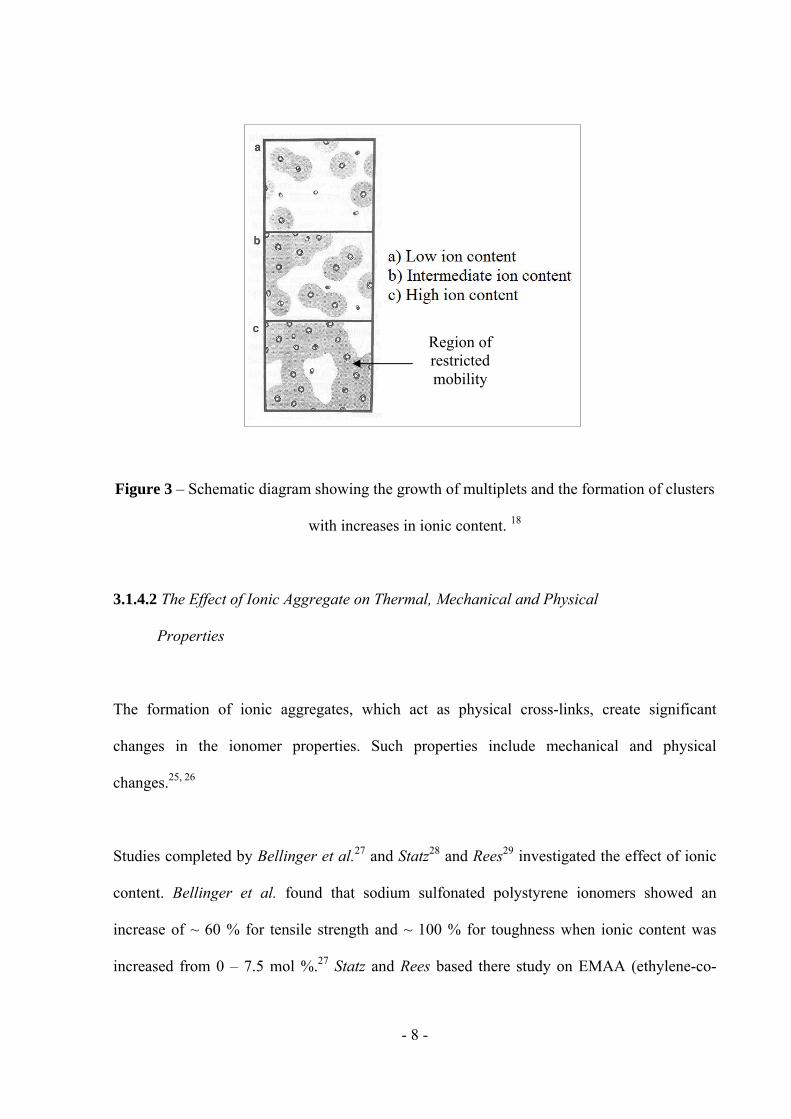
The next phase involved in the morphology of ionomers involves the term known as an ionic
cluster. A cluster is formed when there is an increase in ionic content. This causes increased
numbers of mulitplets to form. At a certain ion content, the number and size of the regions of
restricted mobility begin to increase and eventually overlapping takes place forming a cluster
(see Figure 3).18, 20
At low levels of ion content, the restricted mobility regions do not overlap one another and
only one Tg is present. As ion levels are increased a large overlap of the restricted mobility
regions becomes apparent and thus two Tg’s are expected; one for the multiplet region and
one for the bulk polymer.10, 18
Techniques including small angle x-ray scattering, mechanical and dielectric measurements
and electron microscopy were responsible for imaging the presence of ionic clusters within
ionomers.23, 24
- 8 -
Figure 3 – Schematic diagram showing the growth of multiplets and the formation of clusters
with increases in ionic content. 18
3.1.4.2 The Effect of Ionic Aggregate on Thermal, Mechanical and Physical
Properties
The formation of ionic aggregates, which act as physical cross-links, create significant
changes in the ionomer properties. Such properties include mechanical and physical
changes.25, 26
Studies completed by Bellinger et al.27 and Statz28 and Rees29 investigated the effect of ionic
content. Bellinger et al. found that sodium sulfonated polystyrene ionomers showed an
increase of ~ 60 % for tensile strength and ~ 100 % for toughness when ionic content was
increased from 0 – 7.5 mol %.27 Statz and Rees based there study on EMAA (ethylene-co-
Region of restricted mobility
- 9 -
methacrylic acid) materials.28, 29 They both found a 2:5 fold increase in modulus for ionic
content levels up to 40 %.28, 29
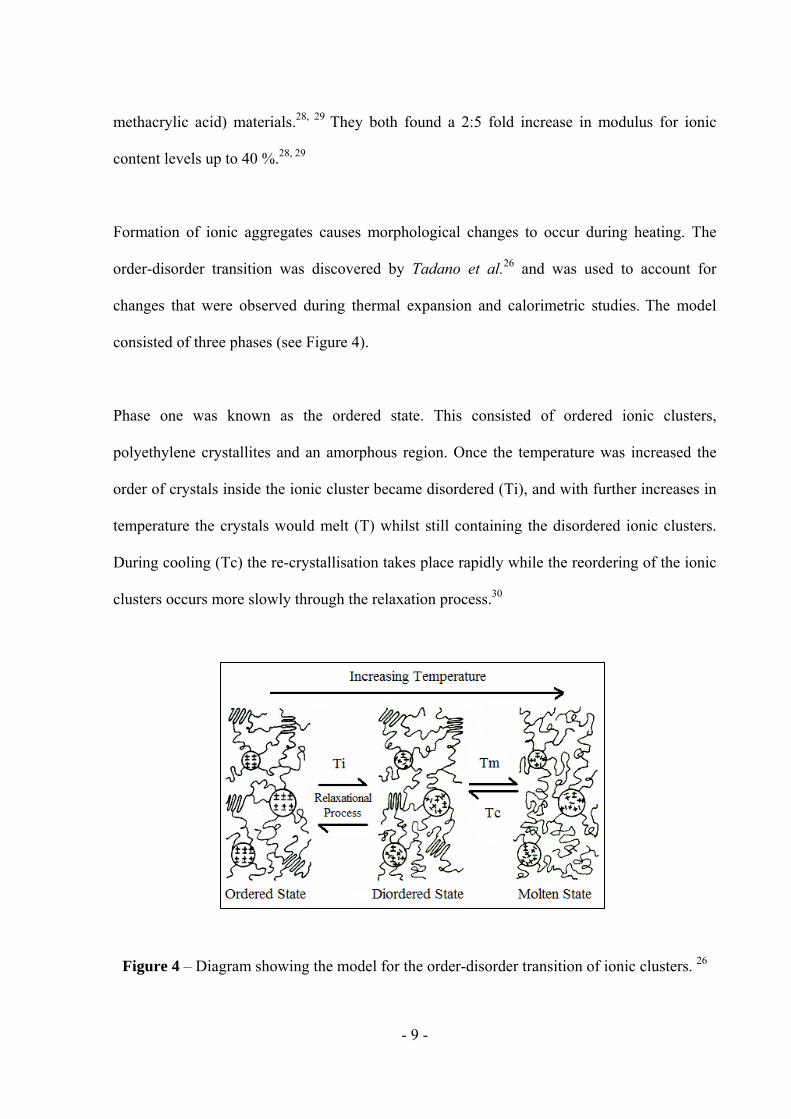
Formation of ionic aggregates causes morphological changes to occur during heating. The
order-disorder transition was discovered by Tadano et al.26 and was used to account for
changes that were observed during thermal expansion and calorimetric studies. The model
consisted of three phases (see Figure 4).
Phase one was known as the ordered state. This consisted of ordered ionic clusters,
polyethylene crystallites and an amorphous region. Once the temperature was increased the
order of crystals inside the ionic cluster became disordered (Ti), and with further increases in
temperature the crystals would melt (T) whilst still containing the disordered ionic clusters.
During cooling (Tc) the re-crystallisation takes place rapidly while the reordering of the ionic
clusters occurs more slowly through the relaxation process.30
Figure 4 – Diagram showing the model for the order-disorder transition of ionic clusters. 26
- 10 -
As discussed the ionic content plays a significant role in controlling the properties of
ionomers. The ionomer of interest; known as Surlyn®, will be discussed in detail further on in
this review.
3.2 Surlyn®
3.2.1 Surlyn® Definition
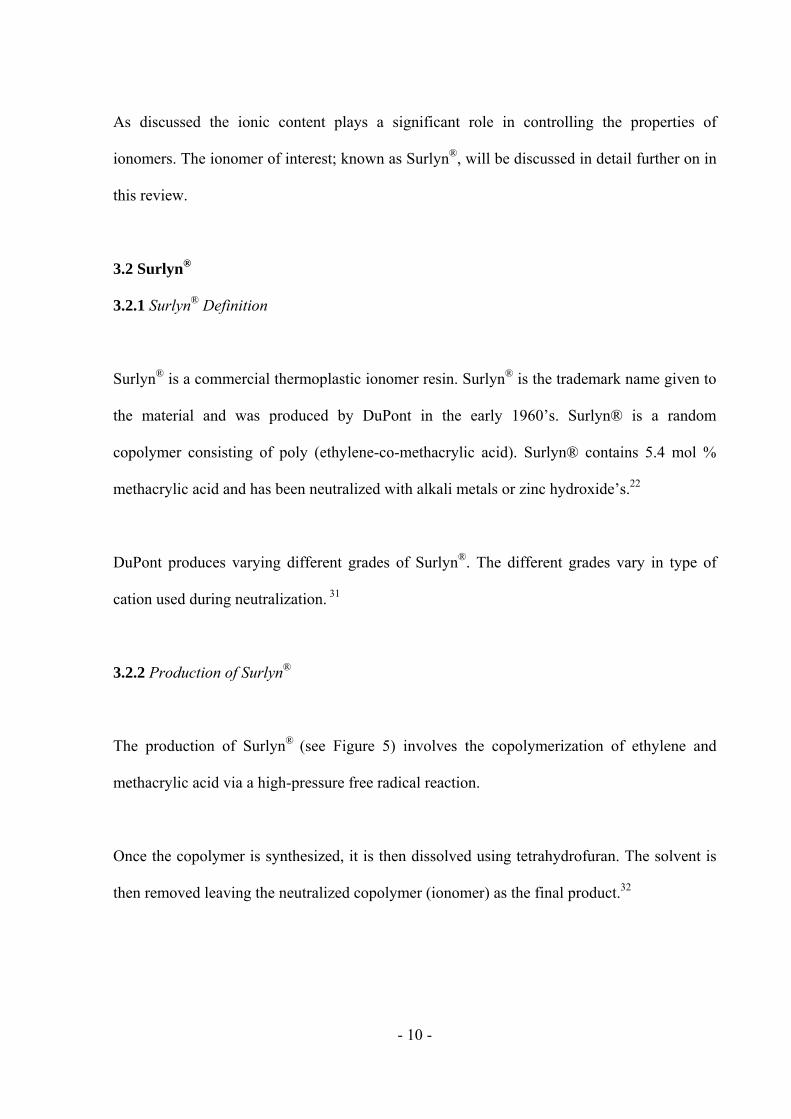
Surlyn® is a commercial thermoplastic ionomer resin. Surlyn® is the trademark name given to
the material and was produced by DuPont in the early 1960’s. Surlyn® is a random
copolymer consisting of poly (ethylene-co-methacrylic acid). Surlyn® contains 5.4 mol %
methacrylic acid and has been neutralized with alkali metals or zinc hydroxide’s.22
DuPont produces varying different grades of Surlyn®. The different grades vary in type of
cation used during neutralization. 31
3.2.2 Production of Surlyn®
The production of Surlyn® (see Figure 5) involves the copolymerization of ethylene and
methacrylic acid via a high-pressure free radical reaction.
Once the copolymer is synthesized, it is then dissolved using tetrahydrofuran. The solvent is
then removed leaving the neutralized copolymer (ionomer) as the final product.32
- 11 -
Figure 5 – Diagram of EMAA neutralized with sodium.
3.2.3 Properties and Applications
Properties such as sealing performance, clarity and oil/grease resistance have made them
highly suitable for food packaging. The increased clarity; which is a desirable feature needed
for packaging such products as food, comes from the reduction of crystallinity present in the
copolymer.30 The material is also used in sporting applications including golf ball covers and
ski boots due to its high strength and toughness properties.
Poly (ethylene – co – methacrylic acid) Ethylene Methacrylic acid
Polymerize
After neutralizing the acid with sodium
This then produces Surlyn®
- 12 -
3.3 Self-Healing Capacity of Surlyn® and other Ionomers
Surlyn® is the most well known ionomer believed to exhibit self-healing properties. The first
significant study into the self-healing properties of Surlyn® was carried out by Fall.22 The
study carried out bullet-puncture tests on Surlyn® 8920 and 8940. These polymers vary in
ionic content and are neutralized with sodium ions.22
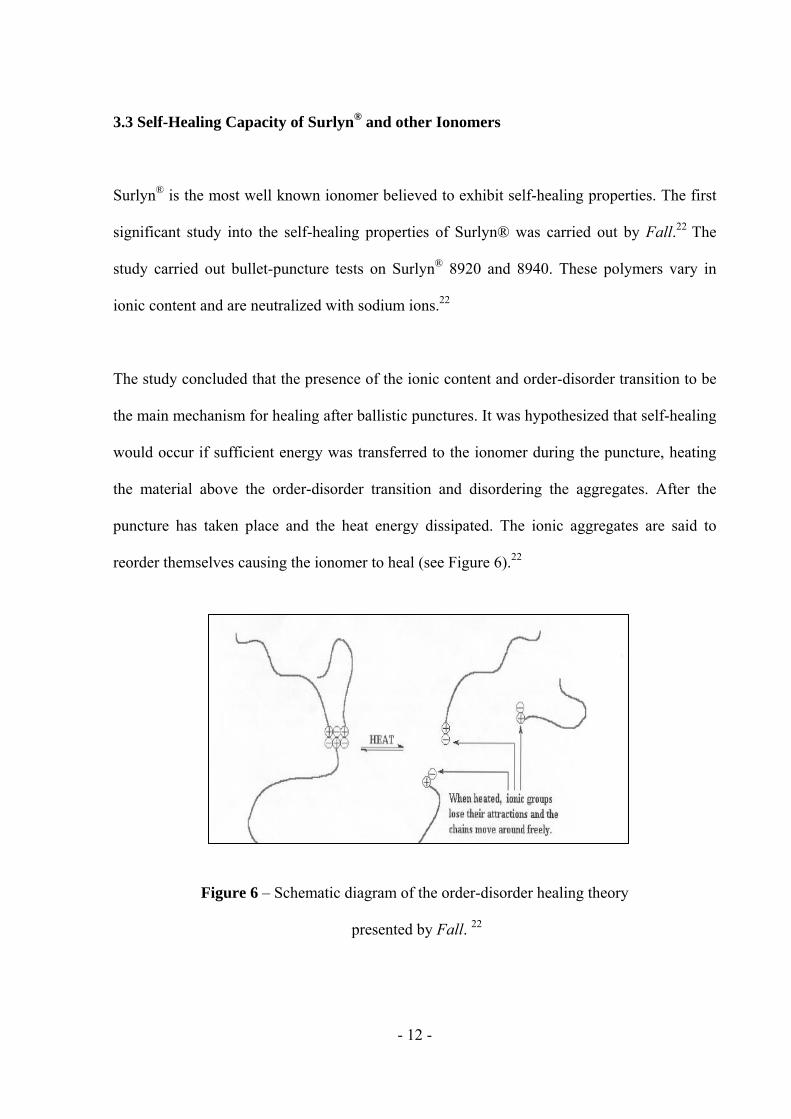
The study concluded that the presence of the ionic content and order-disorder transition to be
the main mechanism for healing after ballistic punctures. It was hypothesized that self-healing
would occur if sufficient energy was transferred to the ionomer during the puncture, heating
the material above the order-disorder transition and disordering the aggregates. After the
puncture has taken place and the heat energy dissipated. The ionic aggregates are said to
reorder themselves causing the ionomer to heal (see Figure 6).22
Figure 6 – Schematic diagram of the order-disorder healing theory
presented by Fall. 22
- 13 -
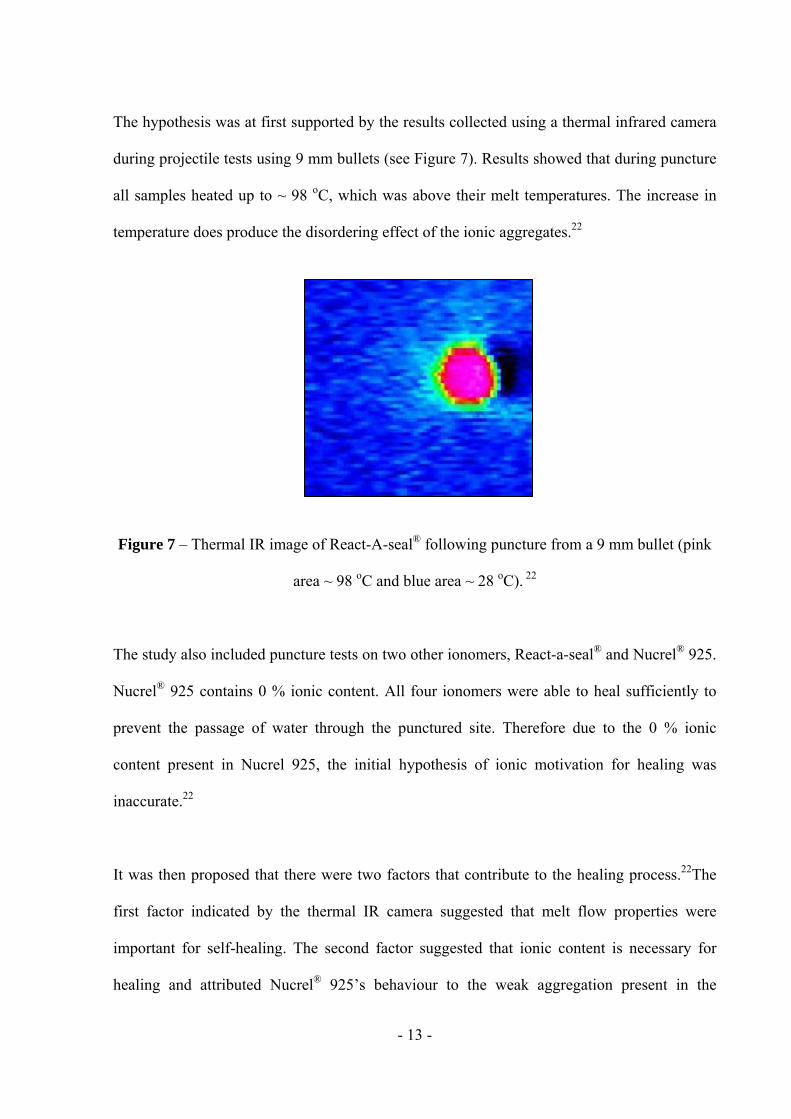
The hypothesis was at first supported by the results collected using a thermal infrared camera
during projectile tests using 9 mm bullets (see Figure 7). Results showed that during puncture
all samples heated up to ~ 98 oC, which was above their melt temperatures. The increase in
temperature does produce the disordering effect of the ionic aggregates.22
Figure 7 – Thermal IR image of React-A-seal® following puncture from a 9 mm bullet (pink
area ~ 98 oC and blue area ~ 28 oC). 22
The study also included puncture tests on two other ionomers, React-a-seal® and Nucrel® 925.
Nucrel® 925 contains 0 % ionic content. All four ionomers were able to heal sufficiently to
prevent the passage of water through the punctured site. Therefore due to the 0 % ionic
content present in Nucrel 925, the initial hypothesis of ionic motivation for healing was
inaccurate.22
It was then proposed that there were two factors that contribute to the healing process.22The
first factor indicated by the thermal IR camera suggested that melt flow properties were
important for self-healing. The second factor suggested that ionic content is necessary for
healing and attributed Nucrel® 925’s behaviour to the weak aggregation present in the
- 14 -
material. Finally, it was concluded that “the increased elastic character of the melt, due to
viscosity, primarily drives the healing phenomenon.” 22
The next study to focus on the self-healing properties of Surlyn® was carried out by Kalista.4
The materials investigated, included two partially neutralized ionomers (Surlyn® 8920, 8940)
and also two materials without ionic neutralization (Nucrel® 925, 960). React-a-seal® and a
low density polyethylene (LDPE) for comparisons were also investigated.
Projectile impact was the first damage mode used. Films of Surlyn® 8940 were impacted with
three types of bullets; spherical, flat headed and pointed pellets. The pointed pellet was the
only pellet to penetrate and exit the film leaving the sample healed. Due to this, further tests
were carried out using the pointed pellet. The mass of the pellet was ~ 0.51 grams and was
fired at a velocity of ~ 182 m/s.4
Using the pointed pellet, multiple punctures and puncture of multiple films were carried out.
Surlyn® 8940 was used during the experiments. The films were shown to heal after multiple
punctures; however results showed that there would be a limit to healing due to scarring. 100
% LDPE was used as a comparison, and after impact, the samples did not express the healing
response that was observed when puncturing Surlyn® 8940. It was stated that the lack of self-
healing in LPDE indicates the importance of the ionic functionality.4
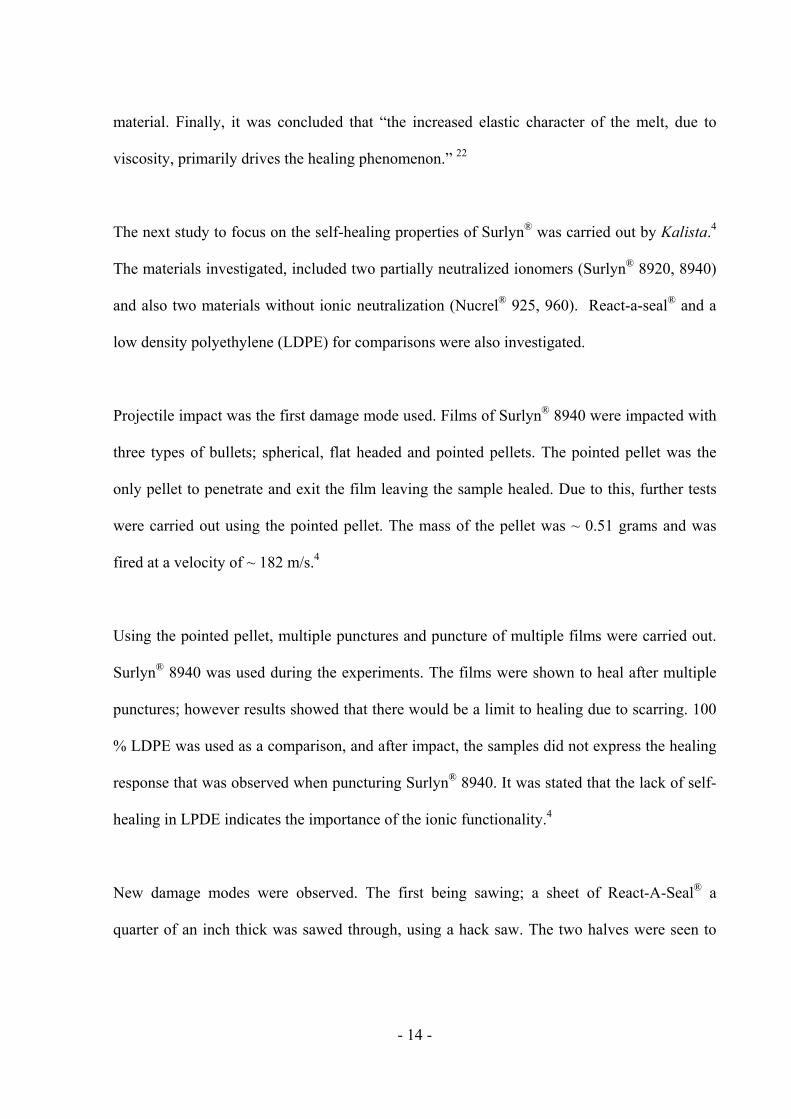
New damage modes were observed. The first being sawing; a sheet of React-A-Seal® a
quarter of an inch thick was sawed through, using a hack saw. The two halves were seen to
- 15 -
heal leaving an elastic hinge emphasizing the importance of heat energy during healing (see
Figure 8).4
Figure 8 – Image of elastic hinge after sawing of React-A-Seal®. 4
The final three damage modes investigated were cutting; nail puncture and sewing needle
puncture. All three damage modes were tested on films of Surlyn® 8940 and no healing
behaviour was observed.4
Following the studied damage modes, Kalista raised the question of whether increased
temperatures could be enough to elicit the self-healing response of the materials. Therefore
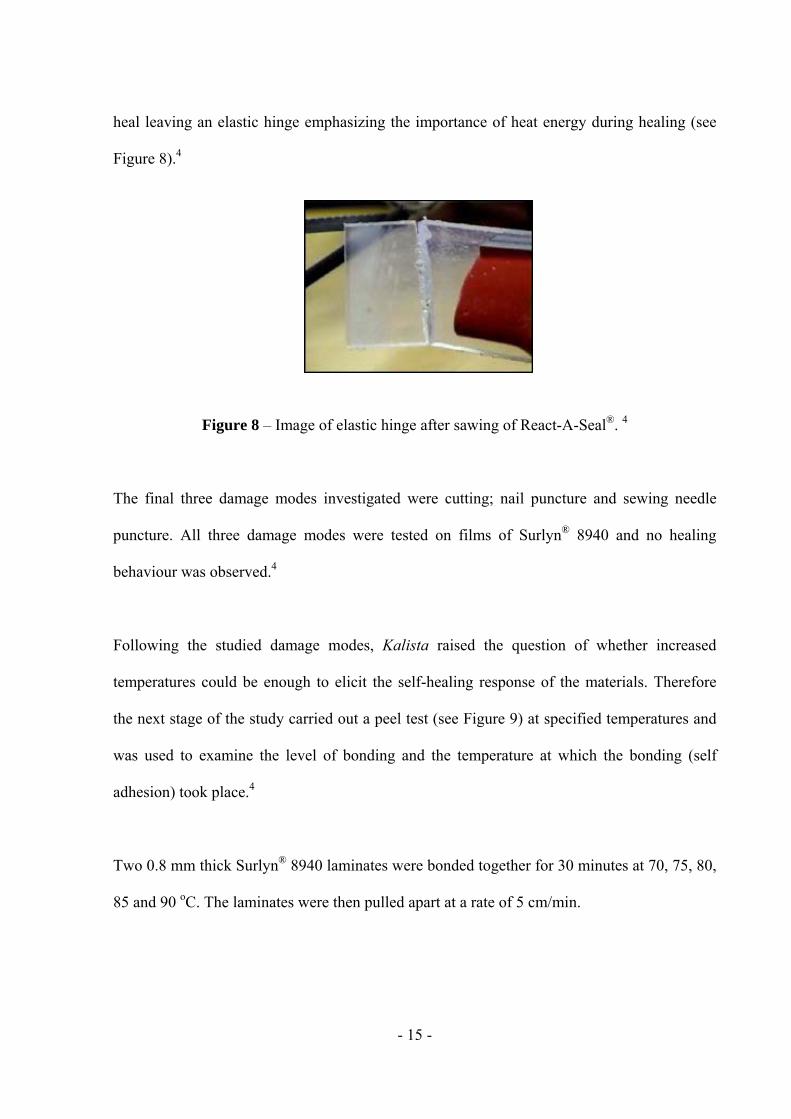
the next stage of the study carried out a peel test (see Figure 9) at specified temperatures and
was used to examine the level of bonding and the temperature at which the bonding (self
adhesion) took place.4
Two 0.8 mm thick Surlyn® 8940 laminates were bonded together for 30 minutes at 70, 75, 80,
85 and 90 oC. The laminates were then pulled apart at a rate of 5 cm/min.
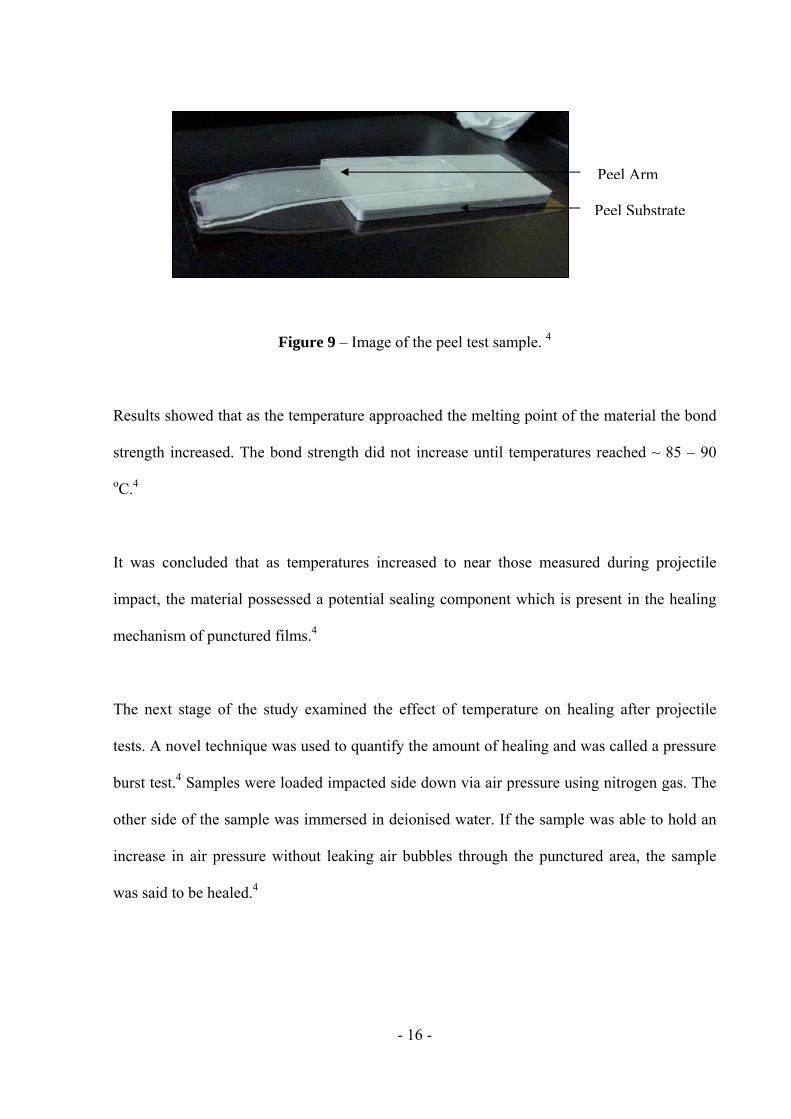
- 16 -
Figure 9 – Image of the peel test sample. 4
Results showed that as the temperature approached the melting point of the material the bond
strength increased. The bond strength did not increase until temperatures reached ~ 85 – 90
oC.4
It was concluded that as temperatures increased to near those measured during projectile
impact, the material possessed a potential sealing component which is present in the healing
mechanism of punctured films.4
The next stage of the study examined the effect of temperature on healing after projectile
tests. A novel technique was used to quantify the amount of healing and was called a pressure
burst test.4 Samples were loaded impacted side down via air pressure using nitrogen gas. The
other side of the sample was immersed in deionised water. If the sample was able to hold an
increase in air pressure without leaking air bubbles through the punctured area, the sample
was said to be healed.4
Peel Arm
Peel Substrate
- 17 -
Surlyn® (8920, 8940) and Nucrel® (925, 960) were shot with a pointed pellet. The velocity of
the projectile was 182 m/s. Samples were left to equilibrate to test temperatures of 60, 70, 80
and 90 °C for five minutes, prior to the impact tests.4
For experiments carried out at room temperature; results revealed that ionic content is not
necessary for healing to take place. Samples tested above 70 oC did not heal. Though this was
unexpected, room temperature healing was said to take place through an elastic mechanism.
This behaviour differed to the viscous response present at elevated temperatures, which
distributed impact energy, preventing elastic recovery to take place around the puncture site.4
Data collected from the pressurized burst test showed that Nucrel® 960 and Surlyn® 8920 had
the poorest healing behaviour. Nucrel® 925 performed the best with no failures and Surlyn®
8940 also showed healing of punctured samples. Sample thickness was shown to affect the
healing of Surlyn® and not Nucrel®. It was also stated that ionic content is unnecessary for
healing and may even inhibit healing in Surlyn® 8920 which contains the most ionic groups.4
The final part of the study investigated fabricating carbon nanotubes with Surlyn® 8940. This
was done to investigate the possibility of producing a composite with both self-healing and
enhanced mechanical properties.4
Composite samples were subjected to mechanical and projectile tests. During mechanical
testing rectangular bars of ~ 1.3 x 6.35 cm were uniaxially deformed in an Instron machine at
a rate of 2 mm/min. The young’s modulus increased by 21 %, the tensile strength increased
by 13 % and finally the toughness increased by 14 % for the composite material. Projectile

- 18 -
puncture showed that the composite material did heal following puncture at room
temperature; however that the quality of healing had decreased.4
The study concluded that ionic content is not necessary for self-healing properties to be
present in the materials. Therefore the two main requirements expected to produce self-
healing are a local melt state in the polymer material and sufficient elasticity in the melt to
help close the puncture site.4
The area of self-healing became a very attractive area for study outside the academic
community. The Navy looked into Surlyn® for the survivability of aircraft.5 Surlyn® was
investigated for lightweight fuel tanks for planes, ships and ground vehicles, taking advantage
of the self-healing properties. However results showed that Surlyn® degraded once in contact
with jet fuel.5
The interest in the self-healing capacity of Surlyn® was also of interest to NASA. They aimed
to understand and generalize the phenomenon of self-healing; therefore the mechanical
properties responsible for this ability were explored.6
Experimental work involved using a moderate rate impression test. Surlyn® 8940 films
measuring 6 – 10 mm in thickness were tested. A cylindrical probe; 1.6 – 0.8 mm in diameter
was mounted to a 445 N load-cell. Three cross-head speeds were used and the depth of
indentation was kept constant at 2.5 mm.
The higher the indentation speed used, resulted in the greater degree of healing. The films also
healed more with additional recovery time. Healing was also increased; when room
temperature indentions were heated following indentation.
- 19 -
Once indentation tests were carried out at increased temperatures, the degree of healing was
shown to decrease (71 % vs. 74 %) and it was concluded that healing at room temperature,
related to an elastic recovery of large-strain deformation with relaxation times, ranging from
less than a second to several days.6
Following Kalista’s initial work into the self–healing phenomena of ionomers, it was
proposed that self-healing occurs through a two-stage process.6 Stage one involves the
polymer elastically rebounding under melt conditions, closing the puncture site. In stage two
the puncture site is then sealed through autohesion and interdiffusion of the polymer chains.4
The following study looked to verify the theory of the two stage model.33
Surlyn® (8940, 8920) and Nucrel® (925, 960) were used during the investigation. Kalista and
Ward performed puncture tests using the same set-up as before; however the ability to
puncture films at elevated temperatures and below room temperature were introduced.33 Films
were tested at room temperature, sub-ambient temperatures of 10 oC, - 10 oC and – 30 oC and
elevated temperatures of 60 oC, 70 oC, 80 oC and 90 oC. The pressure burst test was employed
to quantify the healing response.33
Healing did occur at sub-ambient temperatures due to the significant temperature rise into the
viscoelastic melt state. Two observations verify this rise in temperature and support the two
stage healing model. Stage one, the polymer is believed to elastically retract to close the hole
under molten conditions. It is theorized to then weld together (stage two) to produce sealing
as verified previously.33 On a whole, low temperature puncture results have shown that not
only does healing persist into low sub ambient temperatures, but may also perform better in
some cases given the results for Surlyn® 8940 and Nucrel® 960. The study concluded that
- 20 -
Surlyn® and Nucrel® required high energy (increased temperatures) for healing to take
place.33
A more recent study carried out in 2008 studied the self-healing capacity of Surlyn® through
three different strategies.33, 34 The first strategy involved SEM of impact surfaces following
ballistic impacts for a range of projectiles at specified velocities. The second strategy
investigated the healing mechanism; using a method that mimics the elastic response to
impact in a controlled environment. Finally the third strategy investigated the role of the
viscous response during impact and found that increased molecular mobility in the melt was
critical to achieving optimal healing.33, 34
It was confirmed that both elastomeric and viscous behaviour was present around the impact
regions. The elastic response which is critical for closure of the hole following impact was
shown to be dependent upon ionic content present in the material. The viscous response
showed that if there is sufficient molecular mobility and time, polymer chains will diffuse
across boundaries and heal. 33, 34
The self-healing capacity of Surlyn® was demonstrated to be repeatable confirming that
healing is inherent to the chemical structure and morphology of the ionomer.33
The self-healing capacity of Surlyn® was shown to heal following ballistic puncture and other
damage modes where sufficient heat energy was produced.

- 21 -
Early studies into the self-healing property; accredited it to the ionic aggregate present within
the material; however further investigation using ballistic penetration showed that other
ionomers (Nucrel®) without ionic content also healed.
Healing was then said to be caused by thermally reversible cross-links and intermolecular
interactions, which were present in the melt state, helping close the punctured area.
Surlyn® shows huge potential for application, and as this class of material develops and the
exact cause of the healing is uncovered, this will allow for the design of a new polymeric
material possessing the self-healing property.
3.4 Other Self-healing Mechanisms and Systems
The application of a self-healing polymeric material is a very advantageous concept; therefore
other self-healing systems have been studied. Many new concepts have been inspired by
biological systems, where healing is triggered and completed in an autonomic fashion.35, 36
Other materials and systems with the ability to self-heal are classified into two categories.
They are divided into intrinsic and extrinsic, where intrinsic materials are able to heal by
themselves and extrinsic materials where a healing agent is embedded in the material.37 These
categories have also been termed as reversible and non-reversible systems.38
- 22 -
3.4.1 Intrinsic Self-healing Mechanisms
The self-healing properties present in these materials are unable to heal autonomically and
therefore require stimulation for healing to take place (generally heating). The reversible
systems work by the polymer reverting back to its constituents following damage, repairing
itself. The reversible bonds or cross-links present within the polymer are categorized as
covalent and non-covalent bonds.38
Covalently bound systems include; diels-alder based polymers and photodimerization based
polymers. Non-covalently bound systems include hydrogen bonded polymers and metal-
ligand coordination polymers.38
3.4.1.1 Diels-Alder based polymers
Work carried out by Chen et al. designed a polymer with a matrix containing weak chemical
bonds which break when damaged and reform when heated.37-42 The matrix is produced by a
thermally reversible Diels-Alder (DA) cycloaddition of multi-furan and multi-maleimide.
Healing takes place through covalent bonds and was shown to be fully reversible and could be
used to restore damaged areas multiple times.37-42
3.4.1.2 Photodimerization based polymers
The application of photo-induced reversible polymers is very advantageous, as the use of light
is clean, cheap and readily available. A study presented by Chung et al. focused on an ethane

- 23 -
based polymer that under went photodimerization to produce a highly cross-linked matrix.43
However after tests were carried out on an original and then a damaged and healed sample;
strength measurements had decreased raising doubts over the self-healing ability of the
polymer.34, 41
3.4.1.3 Hydrogen bonded and Metal-ligand coordination polymers
Non-covalently bound polymers cross-link when intermolecular interactions of the monomer
units takes place. The reversibility of these bonds allows the polymer to change in length,
extent of cross-links present, constitution and structure. This results in one of their inherent
traits being the ability to self-heal.38, 41
Hydrogen bonding is the most popular way of achieving a reversible supramolecular polymer
and the main challenge involved in producing the material is finding the right balance
between the association constant and the reversible system.41
Another way of producing these supramolecular polymers is to use metal-ligand coordination.
The ligands are introduced into the system in three ways; copolymerization of functionalized
monomer, functionalization of end or side groups of preformed polymers, or by using
functionalized initiators and/or end cappers in living or controlled polymerizations.38, 40
- 24 -
3.4.2 Extrinsic Self-healing Mechanisms
Some polymers do not have the ability to self-heal; therefore a healing agent is embedded into
the material.40 Healing occurs when damage in the form of cracks causes the release of the
encapsulated healing agent into the crack planes.
There are two types of healing agent; single and two-component. Single-component healents
are able to cure under the induction of air and therefore make them unsuitable for damage that
occurs deep inside the material. The two-component healent consists of a resin and a
hardener. Damage causes the two-components too meet causing polymerisation and bonding
of the damaged material.44
For healing to take place, certain conditions are required. The liquid agent must be compatible
with the encapsulation method. The catalyst must be tolerant of the matrix it is embedded in
and once damage occurs, polymerisation must occur quickly at room temperature. Finally the
ratio of monomer and catalyst must be relatively insensitive due to the random distribution of
microcapsules within the matrix material.45 Healing agent storage methods include hollow
glass tubes, glass-fibres, microcapsules and microvascular networks.
3.4.2.1 Hollow tubes or Glass fibres
The use of hollow glass tubes (see Figure 10) was first proposed by Dry who identified them
as a possible container for a repair system.46 They were initially studied as part of a repair
- 25 -
system for damaged concrete.47 Dry also looked at using the system in a polymeric matrix and
used a single part cyanaocrylate resin encapsulated in glass pipette tubes.48
A study carried out by Bleay et al. argued that previous work used hollow glass fibres that
were too large and may cause the material to fail.49 Therefore the focus of their study was to
use hollow fibres which acted as both structural reinforcement and as a container for repair
resins.49 An epoxy resin system was used and results showed that following impact testing,
potential improvements were present after the application of heat and vacuum to the impacted
panel.
Bond and other researchers continued the work based on producing polymer composites
including hollow fibres.50 – 54 The studies investigated using epoxy based healing agents and
UV dye with hollow fibres. This would then allow self-healing and in-situ damage detection.
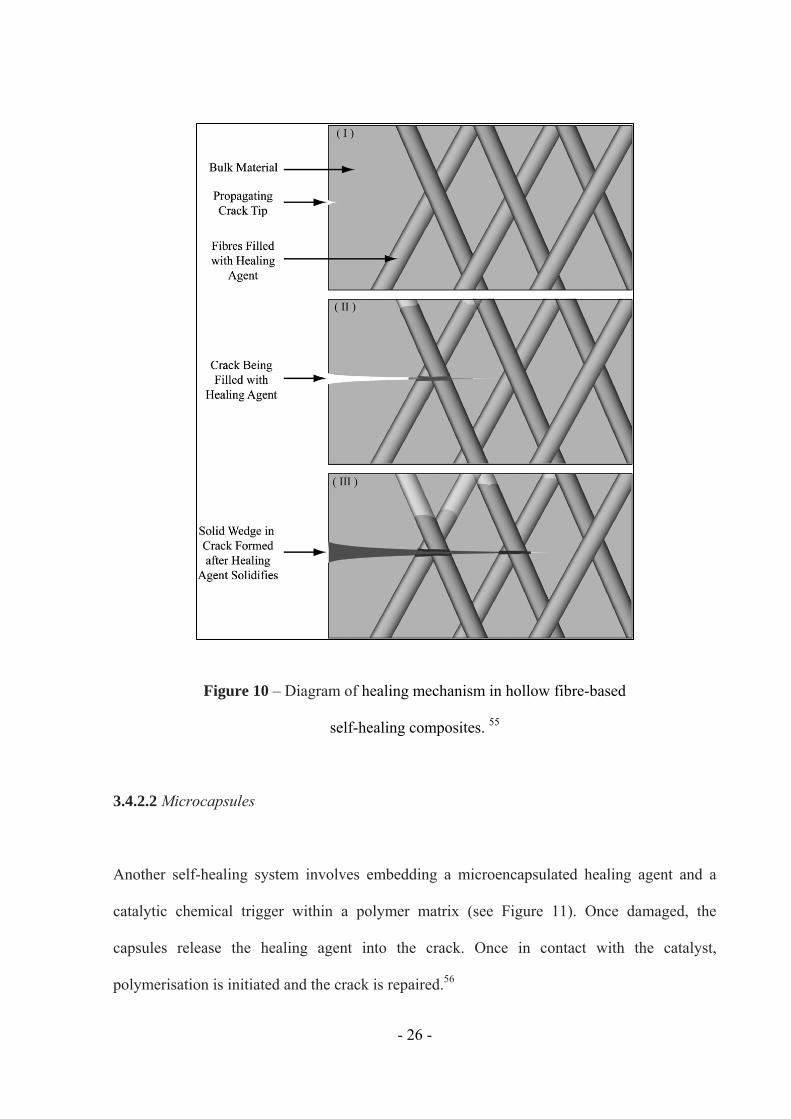
- 26 -
Figure 10 – Diagram of healing mechanism in hollow fibre-based
self-healing composites. 55
3.4.2.2 Microcapsules
Another self-healing system involves embedding a microencapsulated healing agent and a
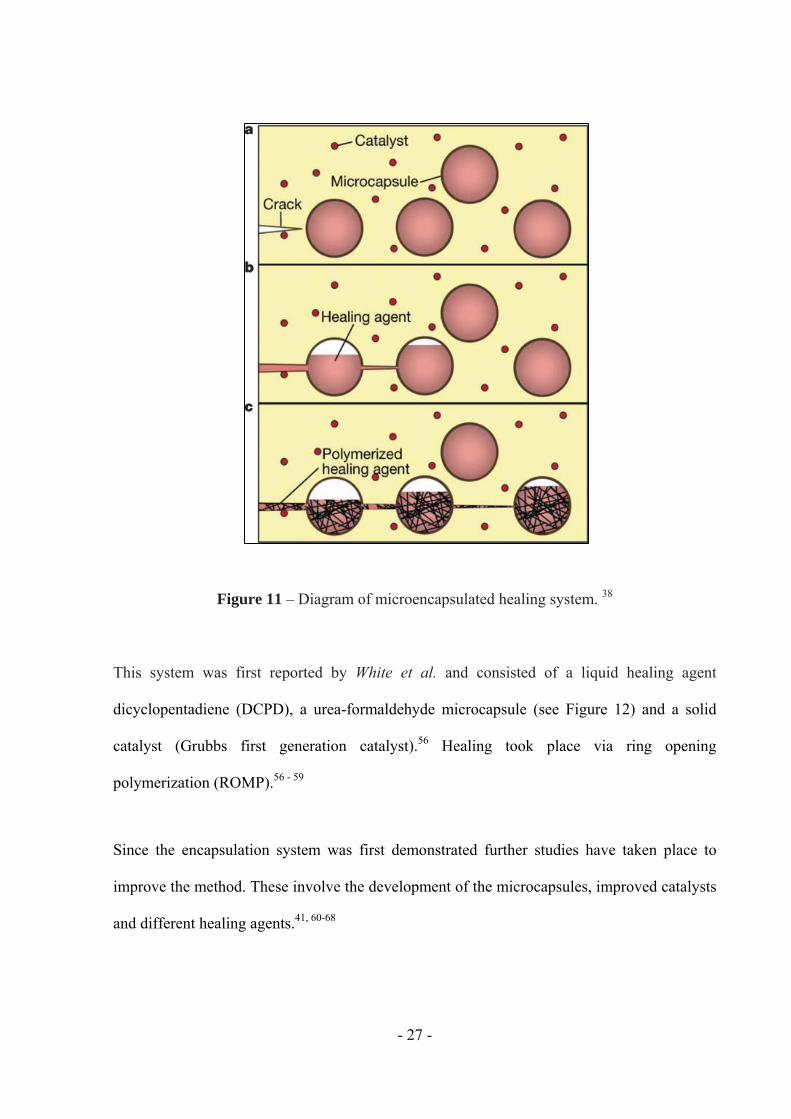
catalytic chemical trigger within a polymer matrix (see Figure 11). Once damaged, the
capsules release the healing agent into the crack. Once in contact with the catalyst,
polymerisation is initiated and the crack is repaired.56
- 27 -
Figure 11 – Diagram of microencapsulated healing system. 38
This system was first reported by White et al. and consisted of a liquid healing agent
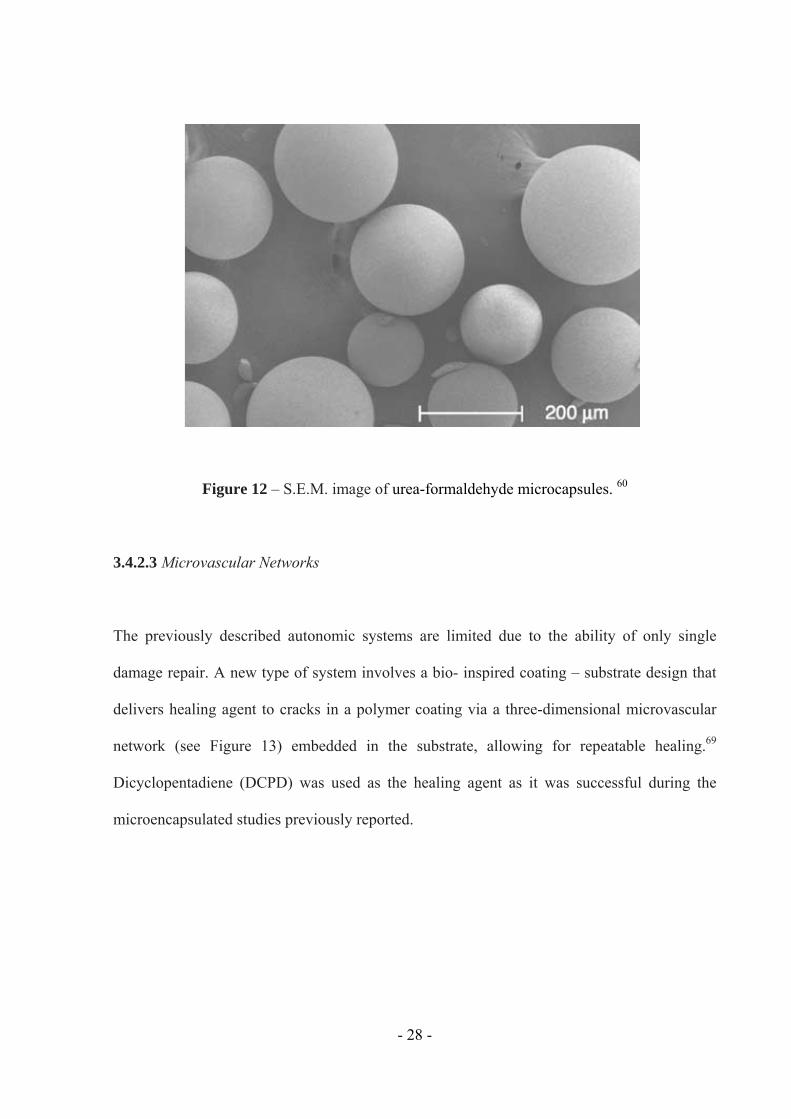
dicyclopentadiene (DCPD), a urea-formaldehyde microcapsule (see Figure 12) and a solid
catalyst (Grubbs first generation catalyst).56 Healing took place via ring opening
polymerization (ROMP).56 - 59
Since the encapsulation system was first demonstrated further studies have taken place to
improve the method. These involve the development of the microcapsules, improved catalysts
and different healing agents.41, 60-68
- 28 -
Figure 12 – S.E.M. image of urea-formaldehyde microcapsules. 60
3.4.2.3 Microvascular Networks
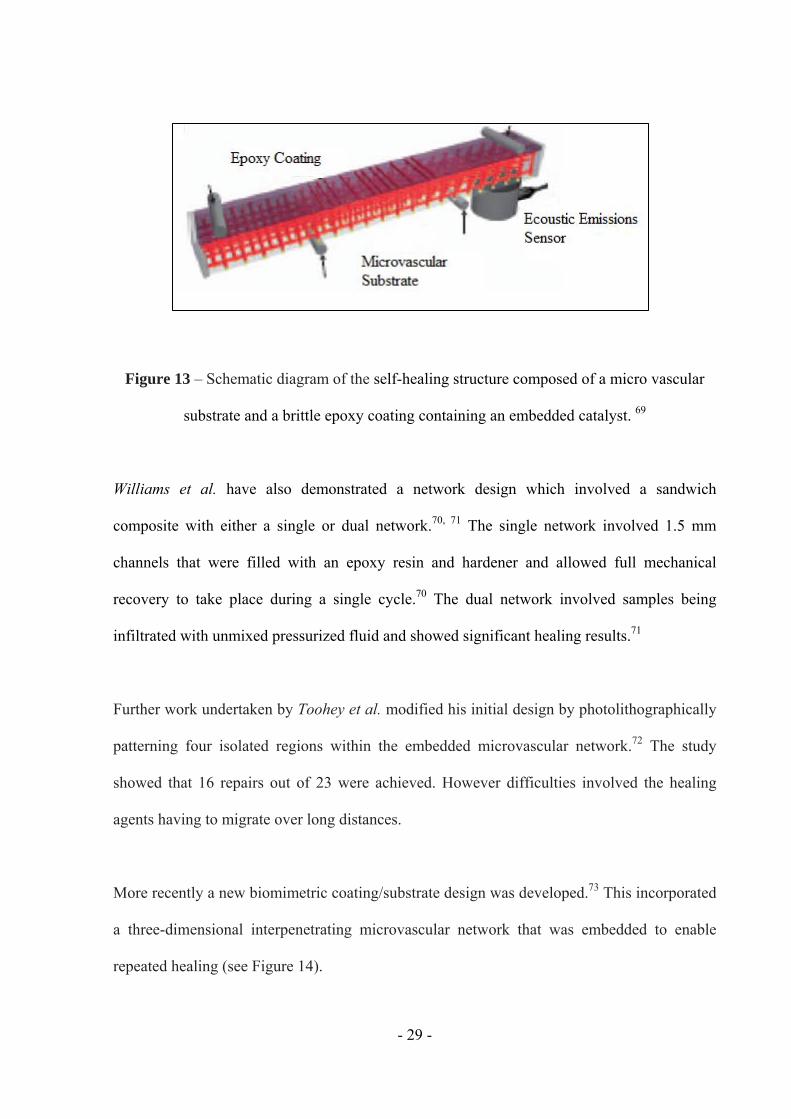
The previously described autonomic systems are limited due to the ability of only single
damage repair. A new type of system involves a bio- inspired coating – substrate design that
delivers healing agent to cracks in a polymer coating via a three-dimensional microvascular
network (see Figure 13) embedded in the substrate, allowing for repeatable healing.69
Dicyclopentadiene (DCPD) was used as the healing agent as it was successful during the
microencapsulated studies previously reported.
- 29 -
Figure 13 – Schematic diagram of the self-healing structure composed of a micro vascular
substrate and a brittle epoxy coating containing an embedded catalyst. 69
Williams et al. have also demonstrated a network design which involved a sandwich
composite with either a single or dual network.70, 71 The single network involved 1.5 mm
channels that were filled with an epoxy resin and hardener and allowed full mechanical
recovery to take place during a single cycle.70 The dual network involved samples being
infiltrated with unmixed pressurized fluid and showed significant healing results.71
Further work undertaken by Toohey et al. modified his initial design by photolithographically
patterning four isolated regions within the embedded microvascular network.72 The study
showed that 16 repairs out of 23 were achieved. However difficulties involved the healing
agents having to migrate over long distances.
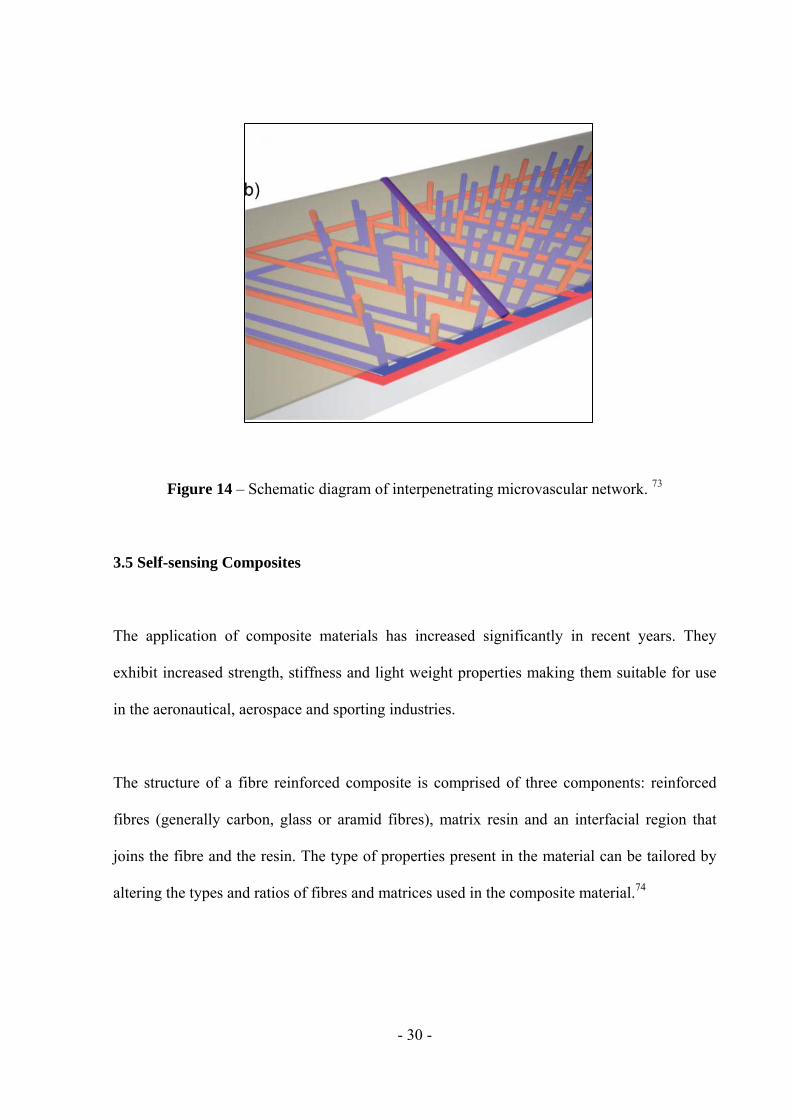
More recently a new biomimetric coating/substrate design was developed.73 This incorporated
a three-dimensional interpenetrating microvascular network that was embedded to enable
repeated healing (see Figure 14).
- 30 -
Figure 14 – Schematic diagram of interpenetrating microvascular network. 73
3.5 Self-sensing Composites
The application of composite materials has increased significantly in recent years. They
exhibit increased strength, stiffness and light weight properties making them suitable for use
in the aeronautical, aerospace and sporting industries.
The structure of a fibre reinforced composite is comprised of three components: reinforced
fibres (generally carbon, glass or aramid fibres), matrix resin and an interfacial region that
joins the fibre and the resin. The type of properties present in the material can be tailored by
altering the types and ratios of fibres and matrices used in the composite material.74
- 31 -
During the lifetime of a fibre reinforced composite, the structure may suffer from damage due
to aging, mechanical fatigue, corrosion, thermal stress and other environmental factors.
Therefore the monitoring and detection of damage is of paramount importance, allowing
repair or replacement of the structure.75
Damage monitoring known also as structural health monitoring involves the use of damage
sensors. Conventional methods involve embedding the sensors (fibre optic sensors) in the
material or attachment of the sensor onto the surface of the material (piezoelectric sensors).
These methods are high in cost, show poor durability and also affect the mechanical
properties of the structures.75
Recent development within the field of fibre reinforced composite materials has focused on
the structural material itself acting as the sensor, therefore removing the need for an
embedded or attached sensor to monitor damage. The term is known as “self-sensing” and
alleviates the issues previously described with embedding and attaching sensors.75
In 1997 Hayes et al. used a commercially available quartz reinforcing fibre (9m in
diameter) to develop a novel composite system in which the fibre used acted as a light guide.
During manufacture, the fibre coating was de-sized and recoated with a silicon resin. The
resultant light guide was termed a “self-sensing” fibre. These fibres were then embedded
inside a 16 ply carbon-fibre reinforced composite panel. These panels were subjected to
impact testing investigating whether these fibres could act as a damage detection system.76
- 32 -
In comparison to three types of conventional optical fibre (30, 50 and 125 m in diameter) the
results indicated that the self-sensing fibres were more sensitive to impact damage and
capable of detecting damage as low as 2 J from impacts carried out using a 20 mm
hemispherical tup.76
Due to the high costs of quartz fibres, in 2004 Kister et al. used conventional reinforcing E-
glass fibres to detect impact damage. The fibres were converted into light guides by applying
an appropriate cladding material (epoxy and polyurethane based resin system). The E-glass
fibres were embedded within a 16 ply glass-fibre reinforced composite. Results demonstrated
that the concept could be used to study in-situ and in real time the failure processes in the
composite material. Damaged areas on the self-sensing composites were highlighted by
bleeding light from the damaged E-glass fibres.77
Another type of self-sensing composite was reported by Wang et al. Self-sensing was attained
in a carbon-fibre polymer matrix composite by using the interlaminar interface as a sensor.
The interlaminar interface was used as a thermistor, a thermocouple junction, a stress sensor,
a damage sensor and a moisture sensor.78 Wang et al. also demonstrated the self-sensing of
damage in a carbon-fibre polymer matrix composite by measurement of the electrical
resistance or potential away from the damaged region. It was demonstrated in the laminates of
a quasi-isotropic continuous carbon-fibre epoxy matrix composite under impact.75
The reported studies show how composite materials are able to sense damage. However these
smart materials only have the ability to sense and not repair the damage, highlighting the

- 33 -
importance of the following study investigating Surlyn as a self-healing and self-sensing
composite material.
- 34 -
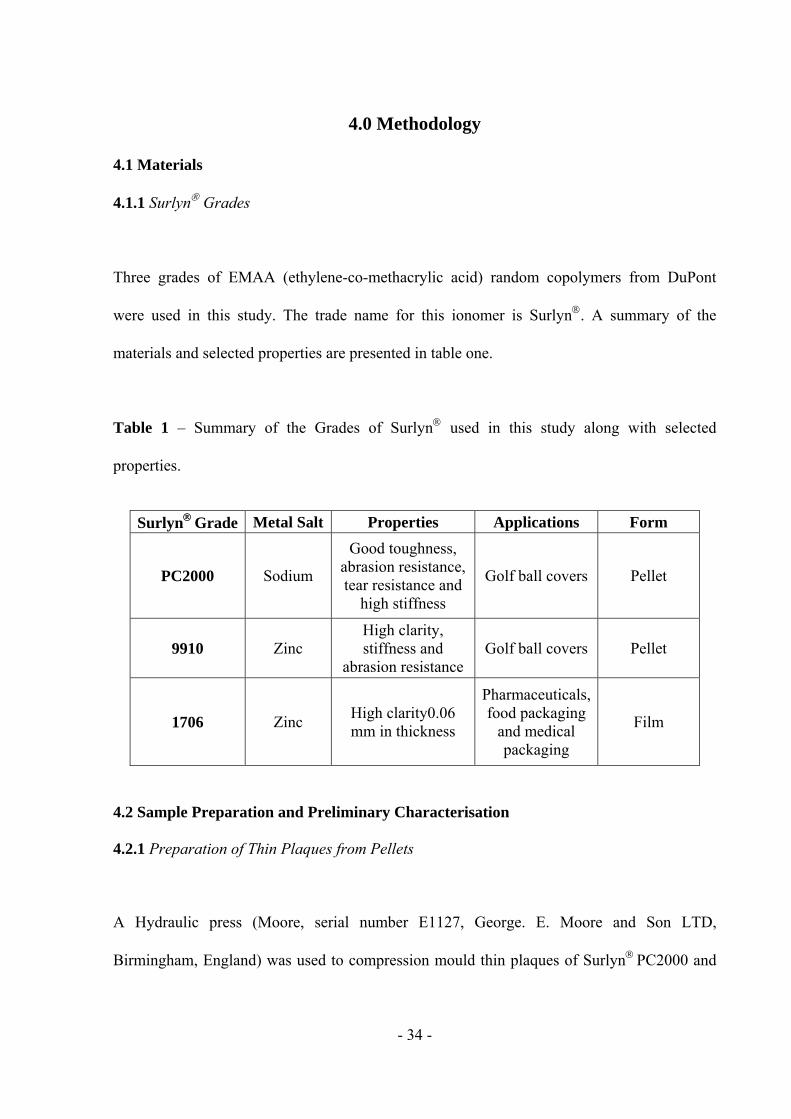
4.0 Methodology
4.1 Materials
4.1.1 Surlyn Grades
Three grades of EMAA (ethylene-co-methacrylic acid) random copolymers from DuPont
were used in this study. The trade name for this ionomer is Surlyn. A summary of the
materials and selected properties are presented in table one.
Table 1 – Summary of the Grades of Surlyn used in this study along with selected
properties.
4.2 Sample Preparation and Preliminary Characterisation
4.2.1 Preparation of Thin Plaques from Pellets
A Hydraulic press (Moore, serial number E1127, George. E. Moore and Son LTD,
Birmingham, England) was used to compression mould thin plaques of SurlynPC2000 and
SurlynGrade Metal Salt Properties Applications Form
PC2000 Sodium
Good toughness, abrasion resistance, tear resistance and
high stiffness
Golf ball covers Pellet
9910 Zinc High clarity, stiffness and
abrasion resistance Golf ball covers Pellet
1706 Zinc High clarity0.06 mm in thickness
Pharmaceuticals, food packaging
and medical packaging
Film

- 35 -
9910. The pellets were placed into the metal mould, which was sandwiched by two metal
backing plates and two PTFE sheets and placed into the press. The mould dimensions were
100 mm x 100 mm x 1 mm. Surlyn1706 was tested in as received film form.
Table 2 – Table containing a summary of the processing conditions that were used to
manufacture the thin film.
4.2.2 Density Measurements
Density measurements were determined using a microbalance that had a density kit
incorporated into the set-up. Five 10 mm x 10 mm samples were tested for each grade.
Samples were weighed in atmospheric air and then in the less dense liquid (n–heptane). The
following equation was then used to determine the density:
Sample Weight in Air / Sample Buoyancy x Density of Liquid (n-heptane) (1)
Material Weight of Polymer
Press Temperature
Press Force
Stabilisation Time
Pressing Time
Cooling Time
Surlyn PC2000
60 g 165 oC 10
Ton 5 mins 3 mins 30 mins
Surlyn 9910
During cooling the sample was kept under the press force.
- 36 -
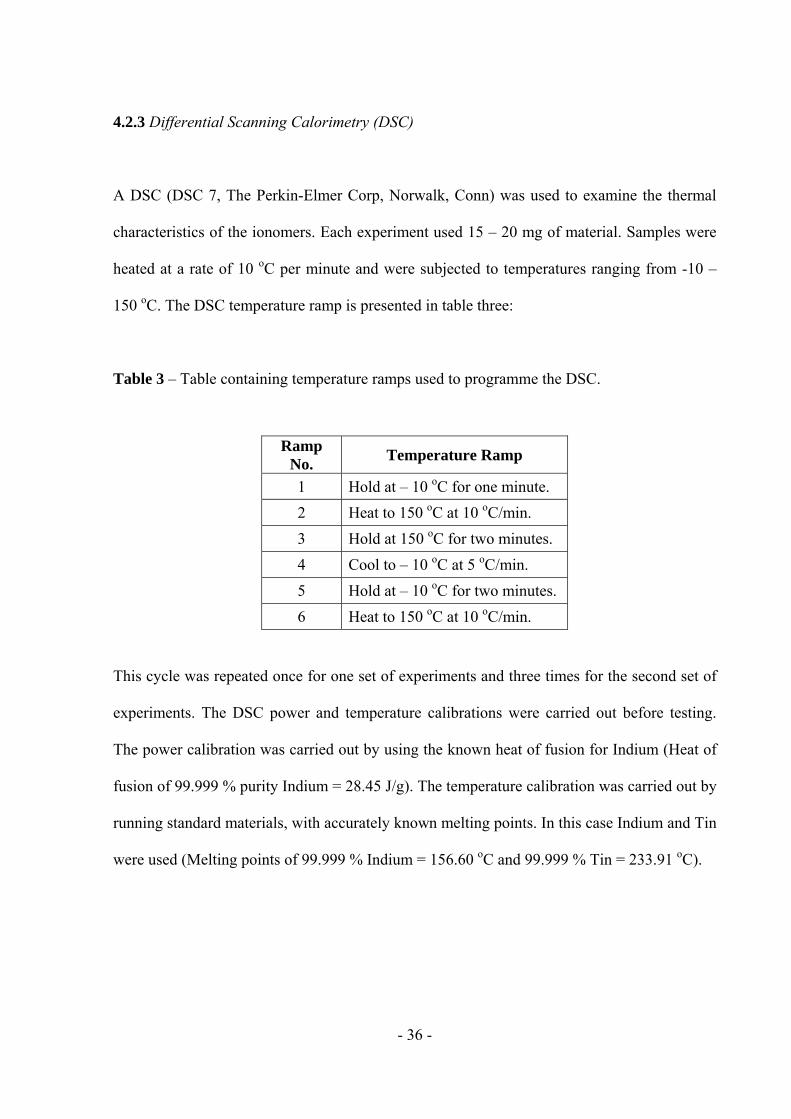
4.2.3 Differential Scanning Calorimetry (DSC)
A DSC (DSC 7, The Perkin-Elmer Corp, Norwalk, Conn) was used to examine the thermal
characteristics of the ionomers. Each experiment used 15 – 20 mg of material. Samples were
heated at a rate of 10 oC per minute and were subjected to temperatures ranging from -10 –
150 oC. The DSC temperature ramp is presented in table three:
Table 3 – Table containing temperature ramps used to programme the DSC.
This cycle was repeated once for one set of experiments and three times for the second set of
experiments. The DSC power and temperature calibrations were carried out before testing.
The power calibration was carried out by using the known heat of fusion for Indium (Heat of
fusion of 99.999 % purity Indium = 28.45 J/g). The temperature calibration was carried out by
running standard materials, with accurately known melting points. In this case Indium and Tin
were used (Melting points of 99.999 % Indium = 156.60 oC and 99.999 % Tin = 233.91 oC).
Ramp No.
Temperature Ramp
1 Hold at – 10 oC for one minute.
2 Heat to 150 oC at 10 oC/min.
3 Hold at 150 oC for two minutes.
4 Cool to – 10 oC at 5 oC/min.
5 Hold at – 10 oC for two minutes.
6 Heat to 150 oC at 10 oC/min.
- 37 -
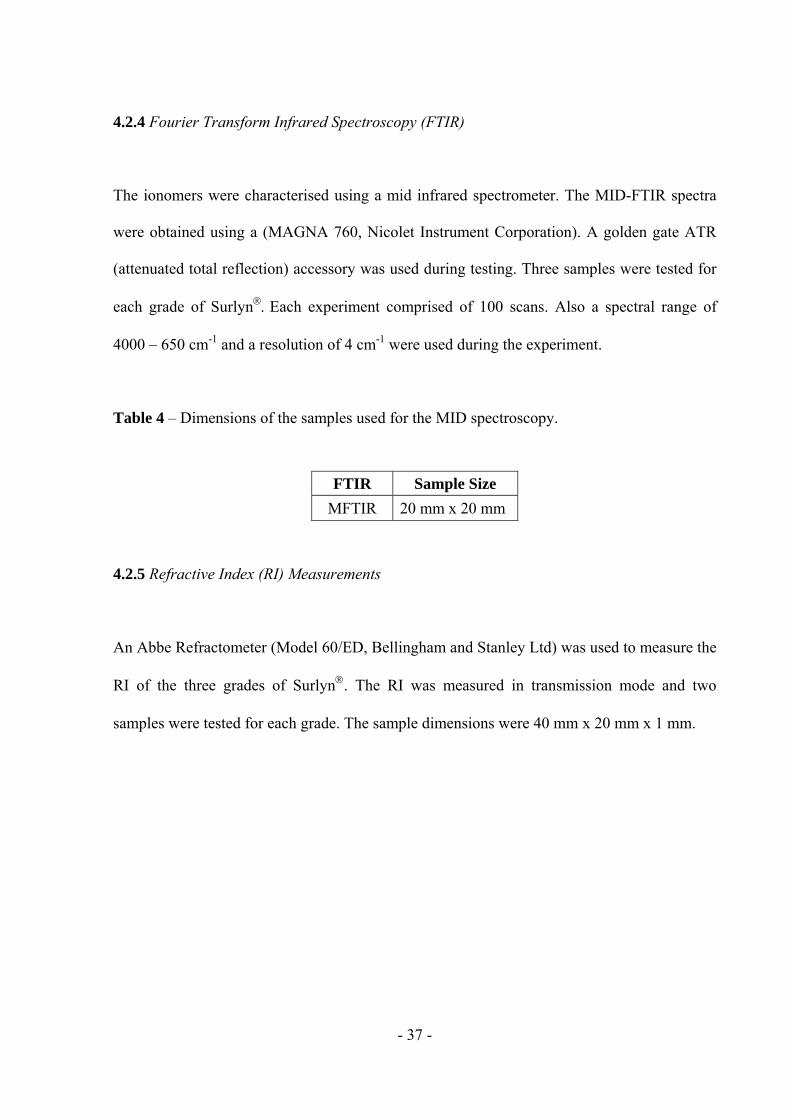
4.2.4 Fourier Transform Infrared Spectroscopy (FTIR)
The ionomers were characterised using a mid infrared spectrometer. The MID-FTIR spectra
were obtained using a (MAGNA 760, Nicolet Instrument Corporation). A golden gate ATR
(attenuated total reflection) accessory was used during testing. Three samples were tested for
each grade of SurlynEach experiment comprised of 100 scans. Also a spectral range of
4000 – 650 cm-1 and a resolution of 4 cm-1 were used during the experiment.
Table 4 – Dimensions of the samples used for the MID spectroscopy.
4.2.5 Refractive Index (RI) Measurements
An Abbe Refractometer (Model 60/ED, Bellingham and Stanley Ltd) was used to measure the
RI of the three grades of Surlyn. The RI was measured in transmission mode and two
samples were tested for each grade. The sample dimensions were 40 mm x 20 mm x 1 mm.
FTIR Sample Size
MFTIR 20 mm x 20 mm
- 38 -
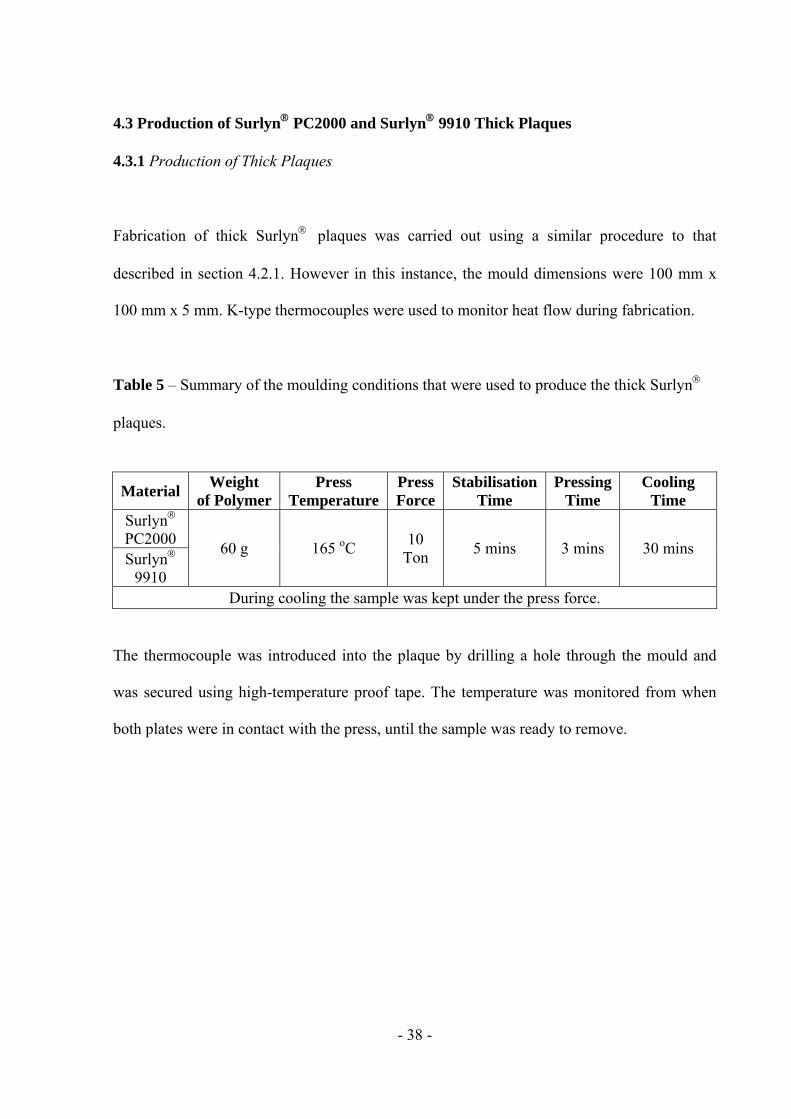
4.3 Production of Surlyn PC2000 and Surlyn 9910 Thick Plaques
4.3.1 Production of Thick Plaques
Fabrication of thick Surlyn plaques was carried out using a similar procedure to that
described in section 4.2.1. However in this instance, the mould dimensions were 100 mm x
100 mm x 5 mm. K-type thermocouples were used to monitor heat flow during fabrication.
Table 5 – Summary of the moulding conditions that were used to produce the thick Surlyn
plaques.
The thermocouple was introduced into the plaque by drilling a hole through the mould and
was secured using high-temperature proof tape. The temperature was monitored from when
both plates were in contact with the press, until the sample was ready to remove.
Material Weight
of Polymer Press
Temperature Press Force
Stabilisation Time
Pressing Time
Cooling Time
Surlyn
PC2000 60 g 165 oC
10 Ton
5 mins 3 mins 30 mins Surlyn
9910 During cooling the sample was kept under the press force.
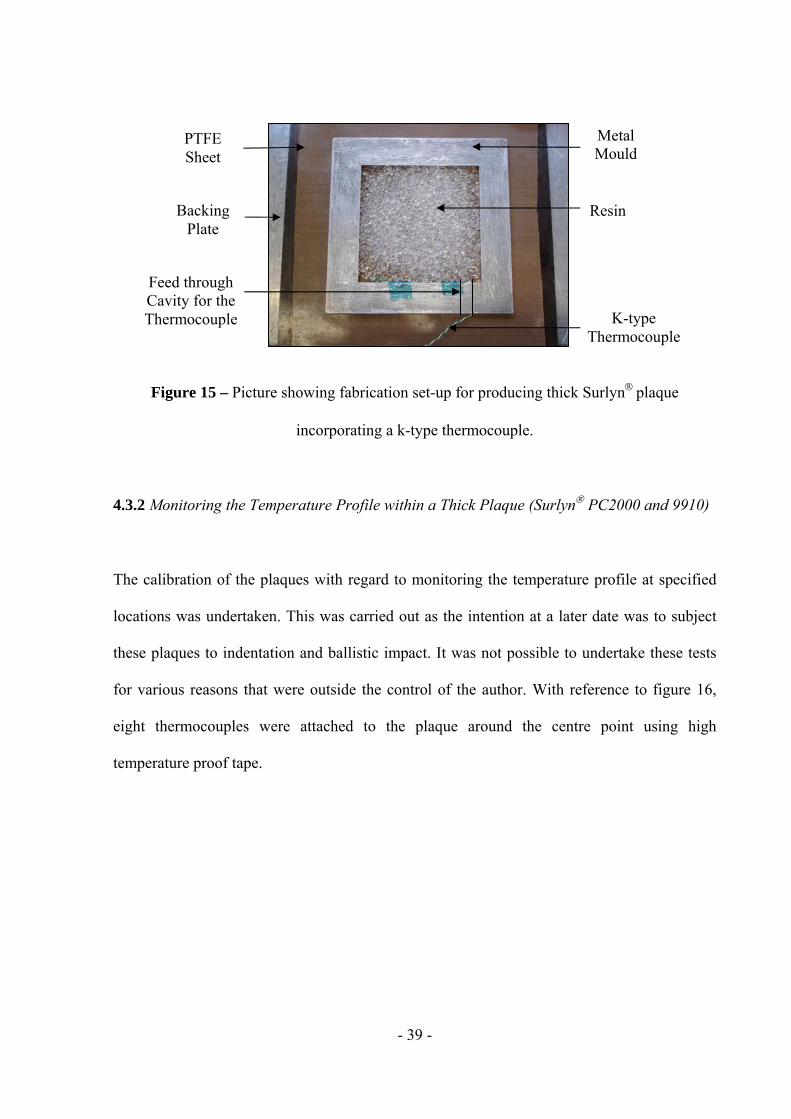
- 39 -
Figure 15 – Picture showing fabrication set-up for producing thick Surlynplaque
incorporating a k-type thermocouple.
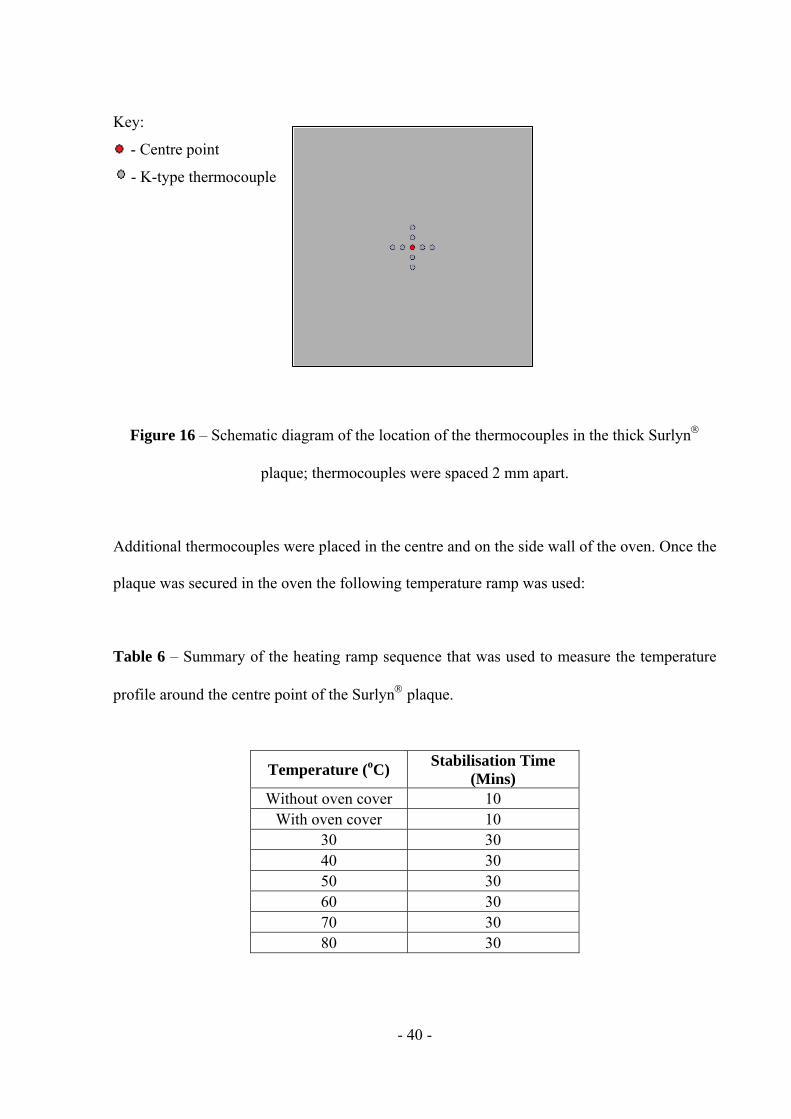
4.3.2 Monitoring the Temperature Profile within a Thick Plaque (Surlyn PC2000 and 9910)
The calibration of the plaques with regard to monitoring the temperature profile at specified
locations was undertaken. This was carried out as the intention at a later date was to subject
these plaques to indentation and ballistic impact. It was not possible to undertake these tests
for various reasons that were outside the control of the author. With reference to figure 16,
eight thermocouples were attached to the plaque around the centre point using high
temperature proof tape.
Metal Mould
K-type Thermocouple
Resin
PTFE Sheet
Backing Plate
Feed through Cavity for the Thermocouple
- 40 -
Key:
- Centre point
- K-type thermocouple
Figure 16 – Schematic diagram of the location of the thermocouples in the thick Surlyn
plaque; thermocouples were spaced 2 mm apart.
Additional thermocouples were placed in the centre and on the side wall of the oven. Once the
plaque was secured in the oven the following temperature ramp was used:
Table 6 – Summary of the heating ramp sequence that was used to measure the temperature
profile around the centre point of the Surlyn plaque.
Temperature (oC) Stabilisation Time
(Mins) Without oven cover 10
With oven cover 10 30 30 40 30 50 30 60 30 70 30 80 30
- 41 -
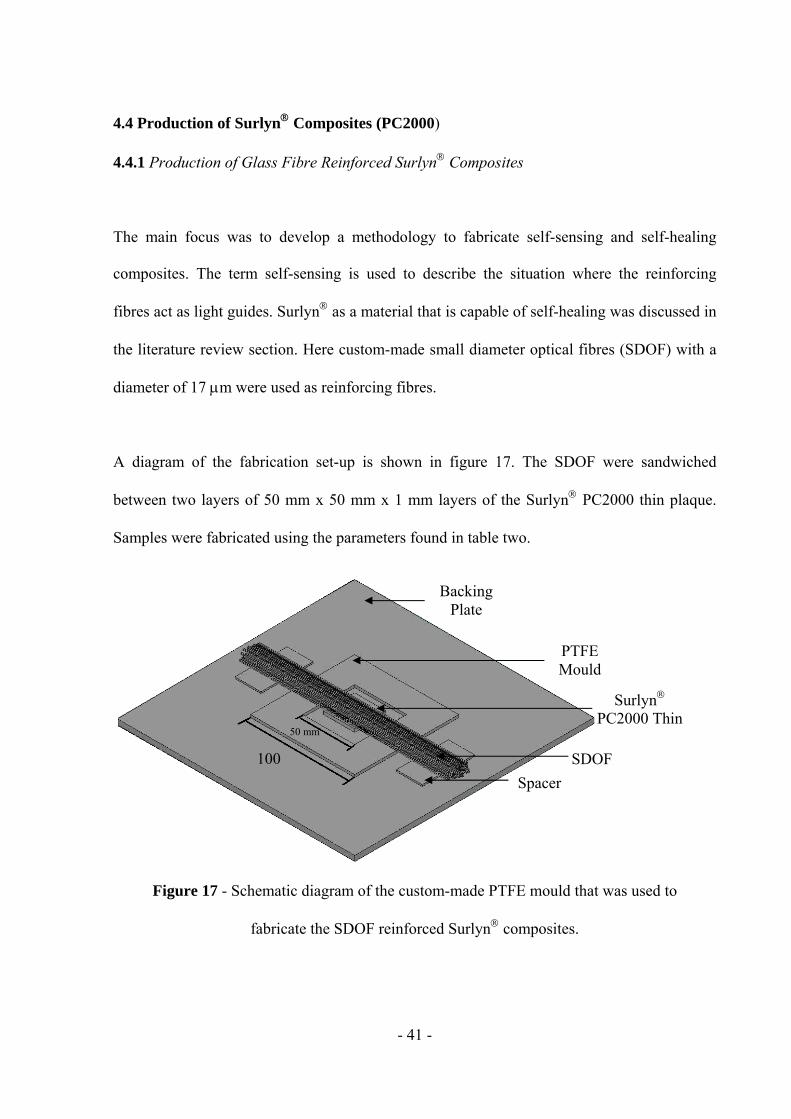
4.4 Production of Surlyn Composites (PC2000)
4.4.1 Production of Glass Fibre Reinforced Surlyn Composites
The main focus was to develop a methodology to fabricate self-sensing and self-healing
composites. The term self-sensing is used to describe the situation where the reinforcing
fibres act as light guides. Surlyn as a material that is capable of self-healing was discussed in
the literature review section. Here custom-made small diameter optical fibres (SDOF) with a
diameter of 17 m were used as reinforcing fibres.
A diagram of the fabrication set-up is shown in figure 17. The SDOF were sandwiched
between two layers of 50 mm x 50 mm x 1 mm layers of the Surlyn PC2000 thin plaque.
Samples were fabricated using the parameters found in table two.
Figure 17 - Schematic diagram of the custom-made PTFE mould that was used to
fabricate the SDOF reinforced Surlyn composites.
PTFE Mould
SDOF
Surlyn PC2000 Thin
Spacer
50 mm
100
Backing Plate
- 42 -
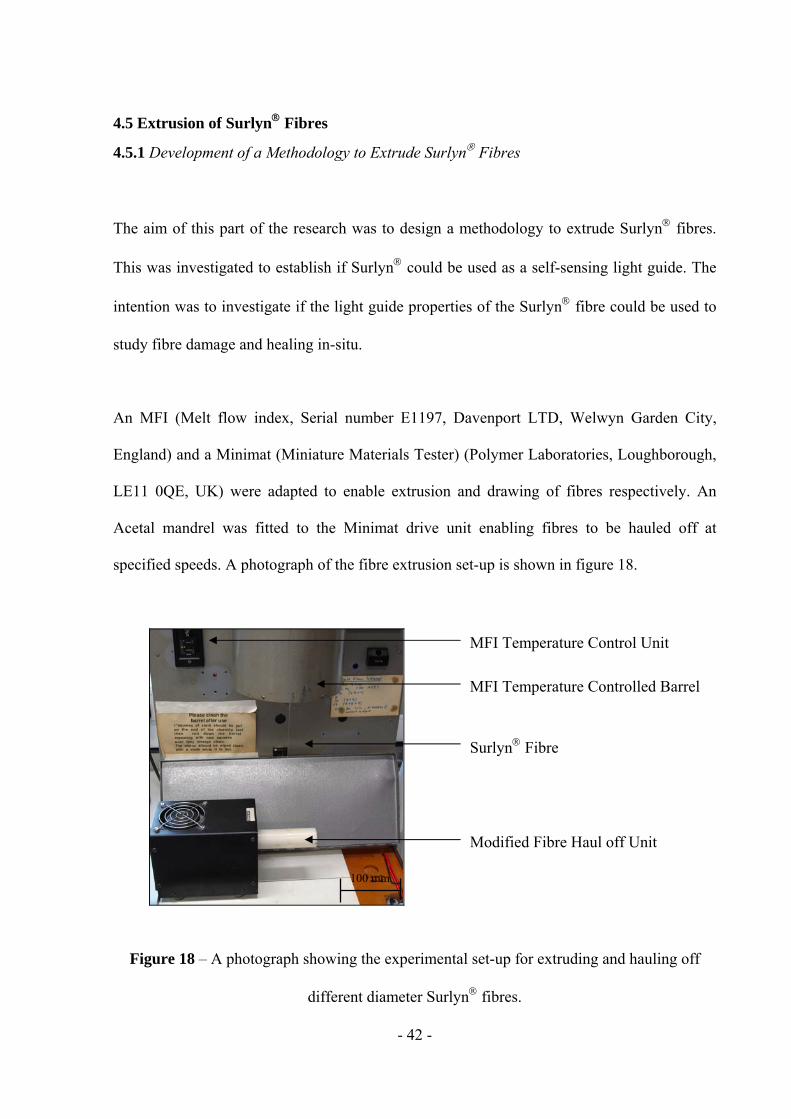
4.5 Extrusion of Surlyn Fibres
4.5.1 Development of a Methodology to Extrude Surlyn Fibres
The aim of this part of the research was to design a methodology to extrude Surlyn fibres.
This was investigated to establish if Surlyn could be used as a self-sensing light guide. The
intention was to investigate if the light guide properties of the Surlyn fibre could be used to
study fibre damage and healing in-situ.
An MFI (Melt flow index, Serial number E1197, Davenport LTD, Welwyn Garden City,
England) and a Minimat (Miniature Materials Tester) (Polymer Laboratories, Loughborough,
LE11 0QE, UK) were adapted to enable extrusion and drawing of fibres respectively. An
Acetal mandrel was fitted to the Minimat drive unit enabling fibres to be hauled off at
specified speeds. A photograph of the fibre extrusion set-up is shown in figure 18.
Figure 18 – A photograph showing the experimental set-up for extruding and hauling off
different diameter Surlyn fibres.
MFI Temperature Control Unit
MFI Temperature Controlled Barrel
Surlyn Fibre
Modified Fibre Haul off Unit
100 mm
- 43 -
The polymers used in this study were Surlyn PC2000 and 9910. The extrusion of Surlyn
fibres was as follows:
The barrel was set to 165 oC for both grades of Surlyn. Approximately five grams of Surlyn
pellets were packed into the barrel with a 2 mm diameter die. A 10 kg weight was applied to
the piston to extrude the fibres. Different diameter fibres were extruded by applying specified
weights to the base of the fibres. The specified weights are summarised in table seven.
Table 7 – Summary showing weights that were applied to the base of the extruded fibres.
Once approximately 200 mm of the fibre was extruded, it was cleaved off at the exit of the
barrel with a razor blade. Smaller diameter fibres were extruded by using the previously
mentioned haul off unit. The settings on the haul off machine were correlated to the
revolutions per minute of the acetal mandrel; a summary of this relationship is presented in
table eight.
Surlyn
PC2000 Surlyn
9910 3 g 7 g
5 g 10 g
7 g 20 g
- 44 -
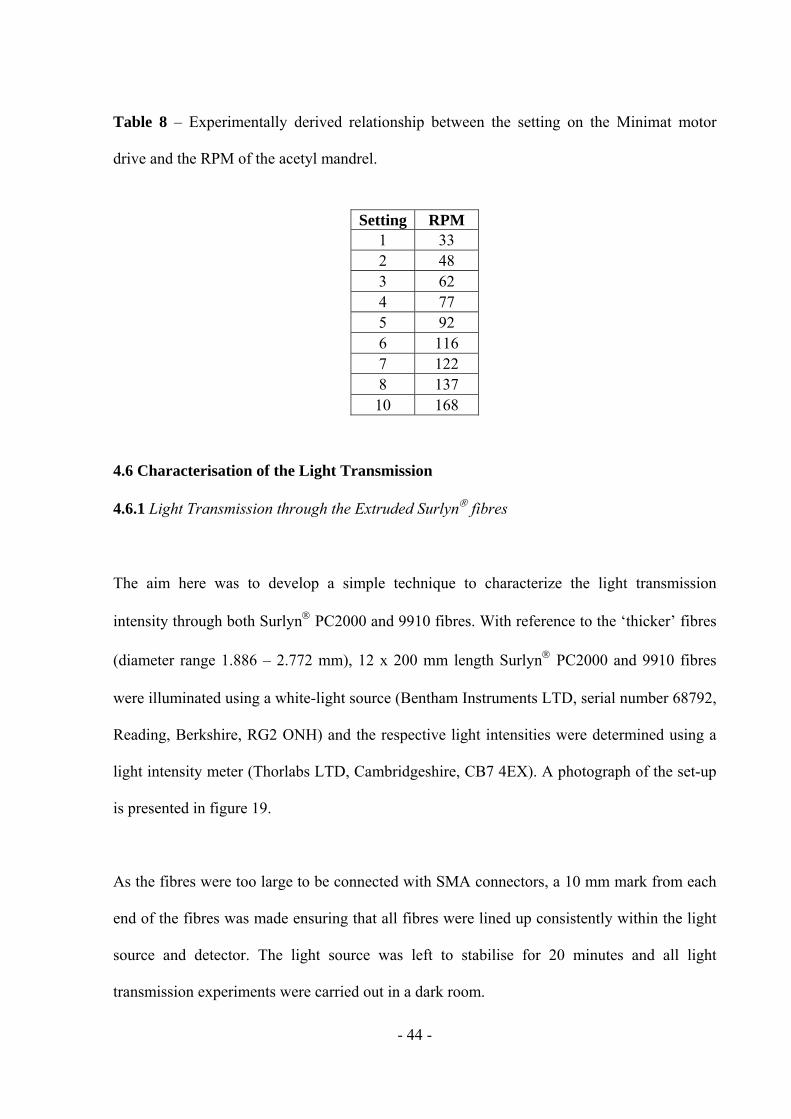
Table 8 – Experimentally derived relationship between the setting on the Minimat motor
drive and the RPM of the acetyl mandrel.
4.6 Characterisation of the Light Transmission
4.6.1 Light Transmission through the Extruded Surlyn fibres
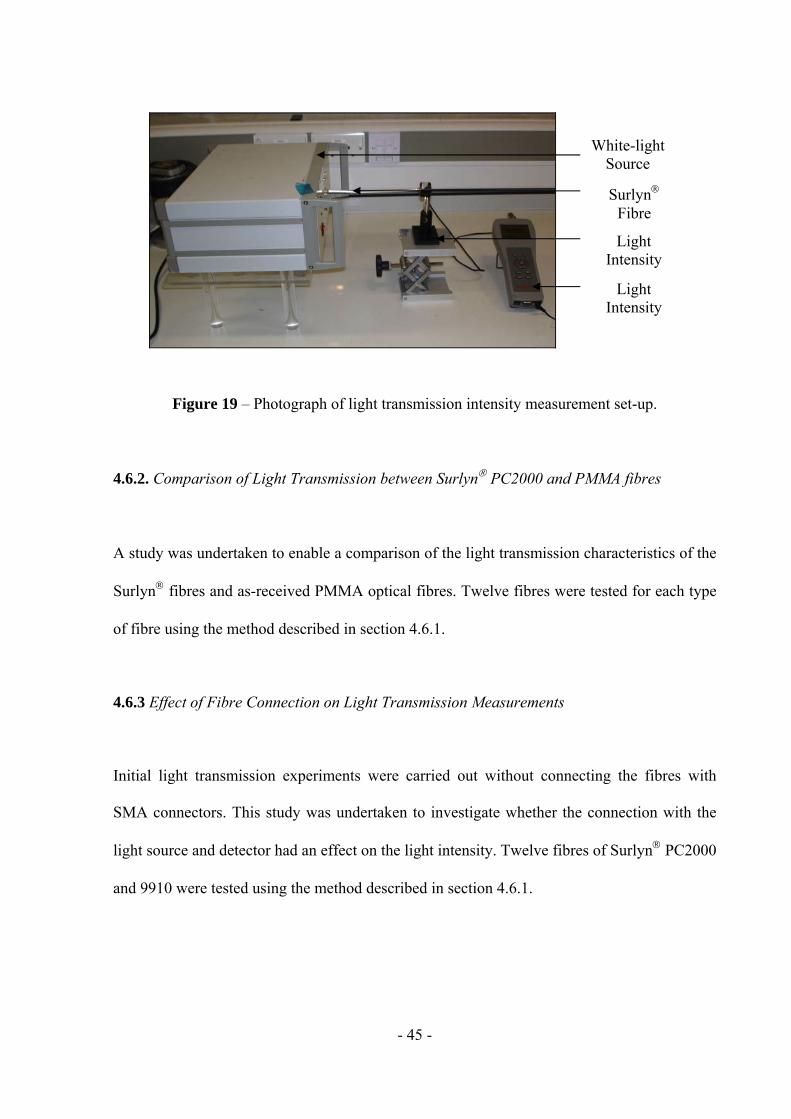
The aim here was to develop a simple technique to characterize the light transmission
intensity through both Surlyn PC2000 and 9910 fibres. With reference to the ‘thicker’ fibres
(diameter range 1.886 – 2.772 mm), 12 x 200 mm length Surlyn PC2000 and 9910 fibres
were illuminated using a white-light source (Bentham Instruments LTD, serial number 68792,
Reading, Berkshire, RG2 ONH) and the respective light intensities were determined using a
light intensity meter (Thorlabs LTD, Cambridgeshire, CB7 4EX). A photograph of the set-up
is presented in figure 19.
As the fibres were too large to be connected with SMA connectors, a 10 mm mark from each
end of the fibres was made ensuring that all fibres were lined up consistently within the light
source and detector. The light source was left to stabilise for 20 minutes and all light
transmission experiments were carried out in a dark room.
Setting RPM 1 33 2 48 3 62 4 77 5 92 6 116 7 122 8 137 10 168
- 45 -
Figure 19 – Photograph of light transmission intensity measurement set-up.
4.6.2. Comparison of Light Transmission between Surlyn PC2000 and PMMA fibres
A study was undertaken to enable a comparison of the light transmission characteristics of the
Surlyn fibres and as-received PMMA optical fibres. Twelve fibres were tested for each type
of fibre using the method described in section 4.6.1.
4.6.3 Effect of Fibre Connection on Light Transmission Measurements
Initial light transmission experiments were carried out without connecting the fibres with
SMA connectors. This study was undertaken to investigate whether the connection with the
light source and detector had an effect on the light intensity. Twelve fibres of Surlyn PC2000
and 9910 were tested using the method described in section 4.6.1.
Surlyn Fibre
Light Intensity
Light Intensity
White-light Source
- 46 -
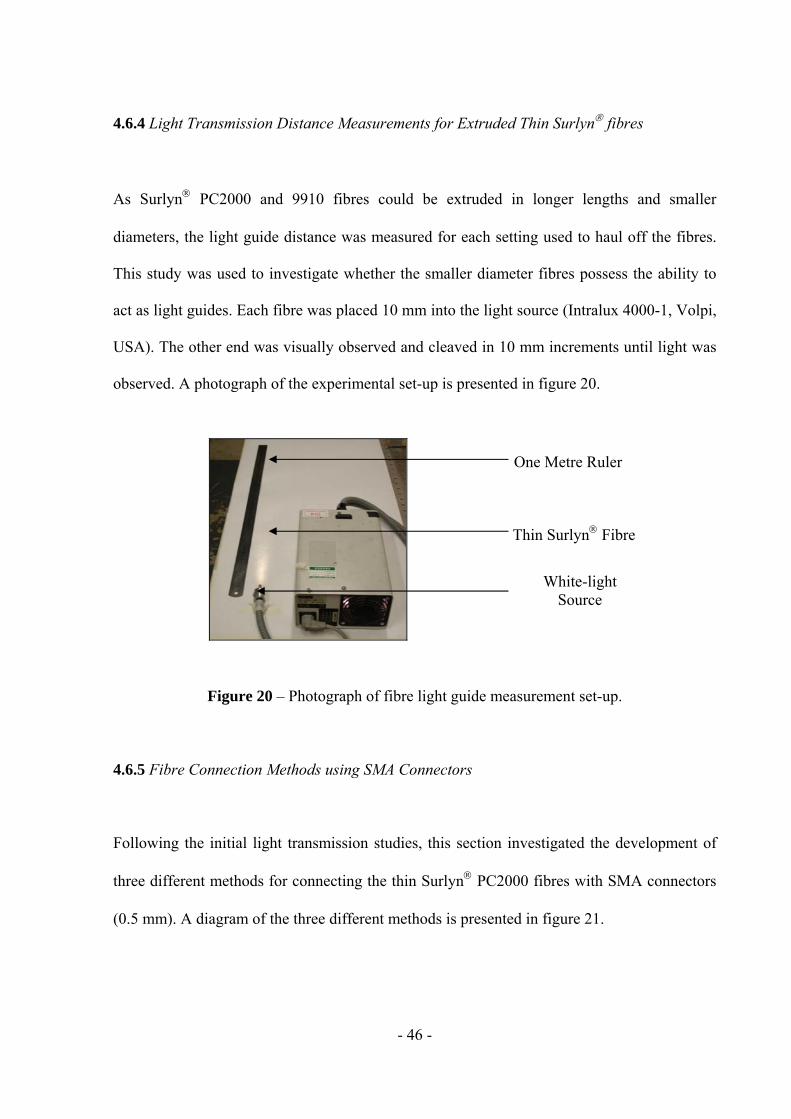
4.6.4 Light Transmission Distance Measurements for Extruded Thin Surlyn fibres
As Surlyn PC2000 and 9910 fibres could be extruded in longer lengths and smaller
diameters, the light guide distance was measured for each setting used to haul off the fibres.
This study was used to investigate whether the smaller diameter fibres possess the ability to
act as light guides. Each fibre was placed 10 mm into the light source (Intralux 4000-1, Volpi,
USA). The other end was visually observed and cleaved in 10 mm increments until light was
observed. A photograph of the experimental set-up is presented in figure 20.
Figure 20 – Photograph of fibre light guide measurement set-up.
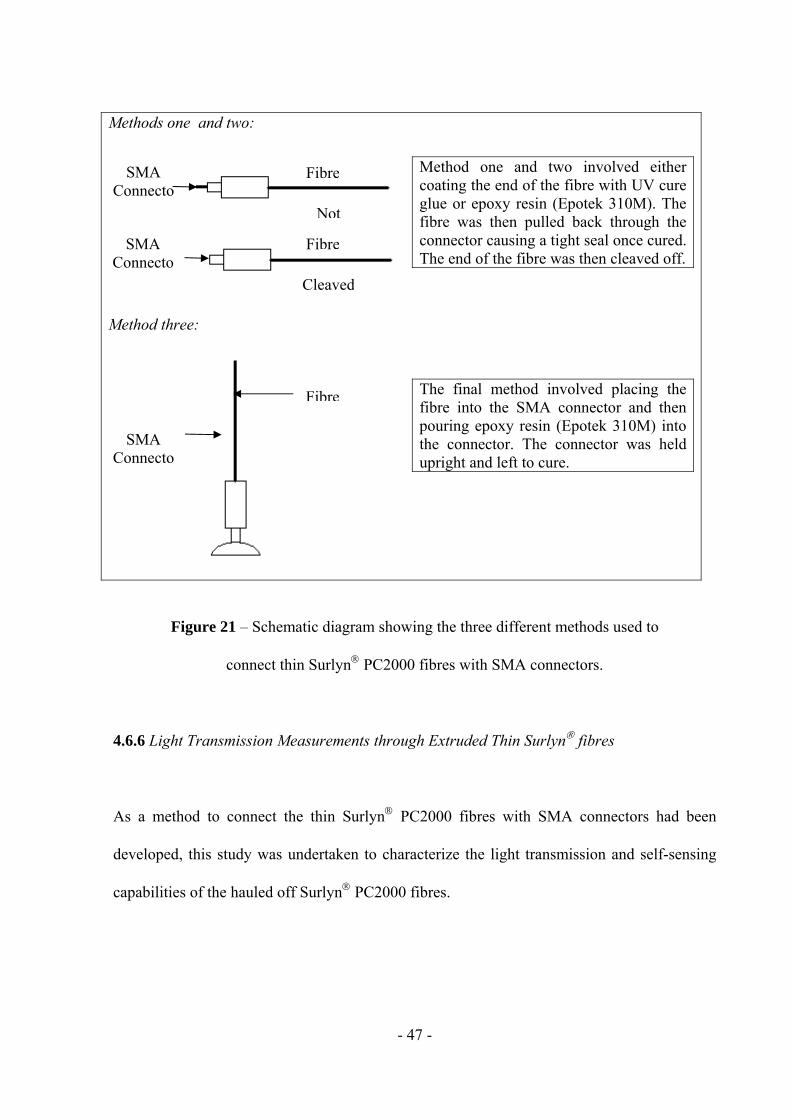
4.6.5 Fibre Connection Methods using SMA Connectors
Following the initial light transmission studies, this section investigated the development of
three different methods for connecting the thin Surlyn PC2000 fibres with SMA connectors
(0.5 mm). A diagram of the three different methods is presented in figure 21.
White-light Source
One Metre Ruler
Thin Surlyn Fibre
- 47 -
Methods one and two:
Method three:
Method one and two involved either coating the end of the fibre with UV cure glue or epoxy resin (Epotek 310M). The fibre was then pulled back through the connector causing a tight seal once cured. The end of the fibre was then cleaved off.
The final method involved placing the fibre into the SMA connector and then pouring epoxy resin (Epotek 310M) into the connector. The connector was held upright and left to cure.
Figure 21 – Schematic diagram showing the three different methods used to
connect thin Surlyn PC2000 fibres with SMA connectors.
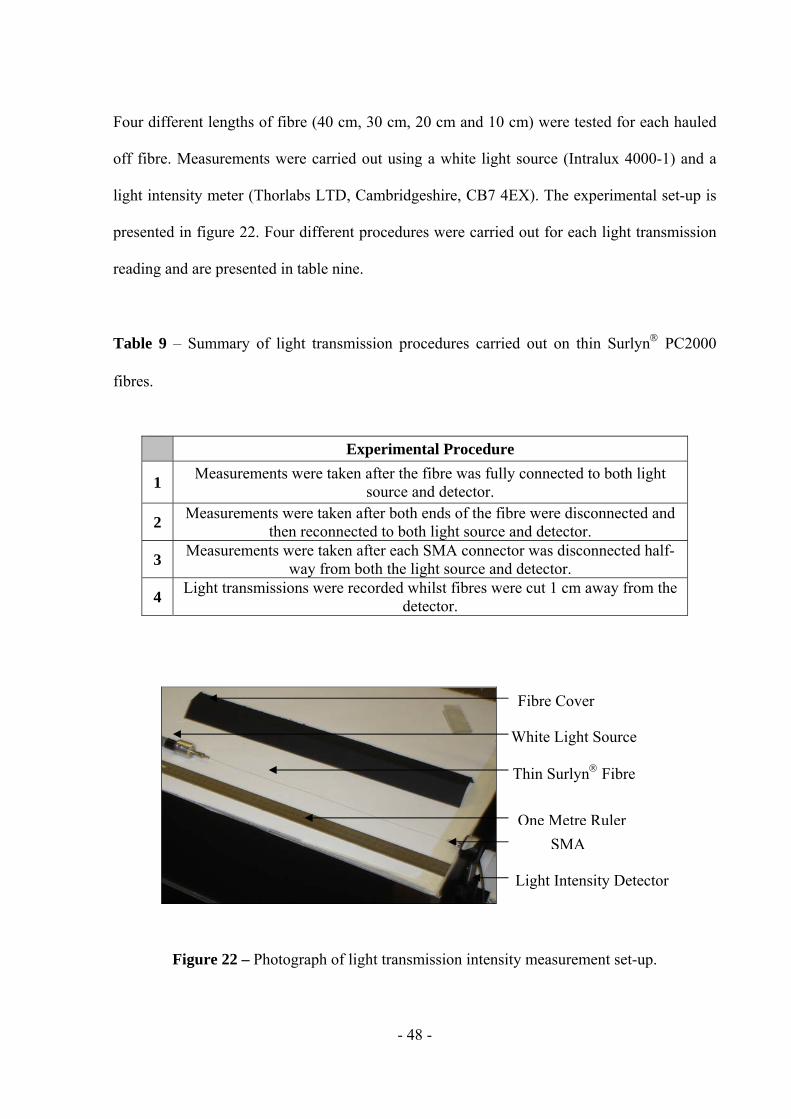
4.6.6 Light Transmission Measurements through Extruded Thin Surlyn fibres
As a method to connect the thin Surlyn PC2000 fibres with SMA connectors had been
developed, this study was undertaken to characterize the light transmission and self-sensing
capabilities of the hauled off Surlyn PC2000 fibres.
SMA Connecto
Fibre
SMA Connecto
Fibre
SMA Connecto
Fibre
Not
Cleaved
- 48 -
Four different lengths of fibre (40 cm, 30 cm, 20 cm and 10 cm) were tested for each hauled
off fibre. Measurements were carried out using a white light source (Intralux 4000-1) and a
light intensity meter (Thorlabs LTD, Cambridgeshire, CB7 4EX). The experimental set-up is
presented in figure 22. Four different procedures were carried out for each light transmission
reading and are presented in table nine.
Table 9 – Summary of light transmission procedures carried out on thin Surlyn PC2000
fibres.
Experimental Procedure
1 Measurements were taken after the fibre was fully connected to both light
source and detector.
2 Measurements were taken after both ends of the fibre were disconnected and
then reconnected to both light source and detector.
3 Measurements were taken after each SMA connector was disconnected half-
way from both the light source and detector.
4 Light transmissions were recorded whilst fibres were cut 1 cm away from the
detector.
Figure 22 – Photograph of light transmission intensity measurement set-up.
Fibre Cover
White Light Source
Thin Surlyn Fibre
One Metre Ruler
SMA
Light Intensity Detector
- 49 -
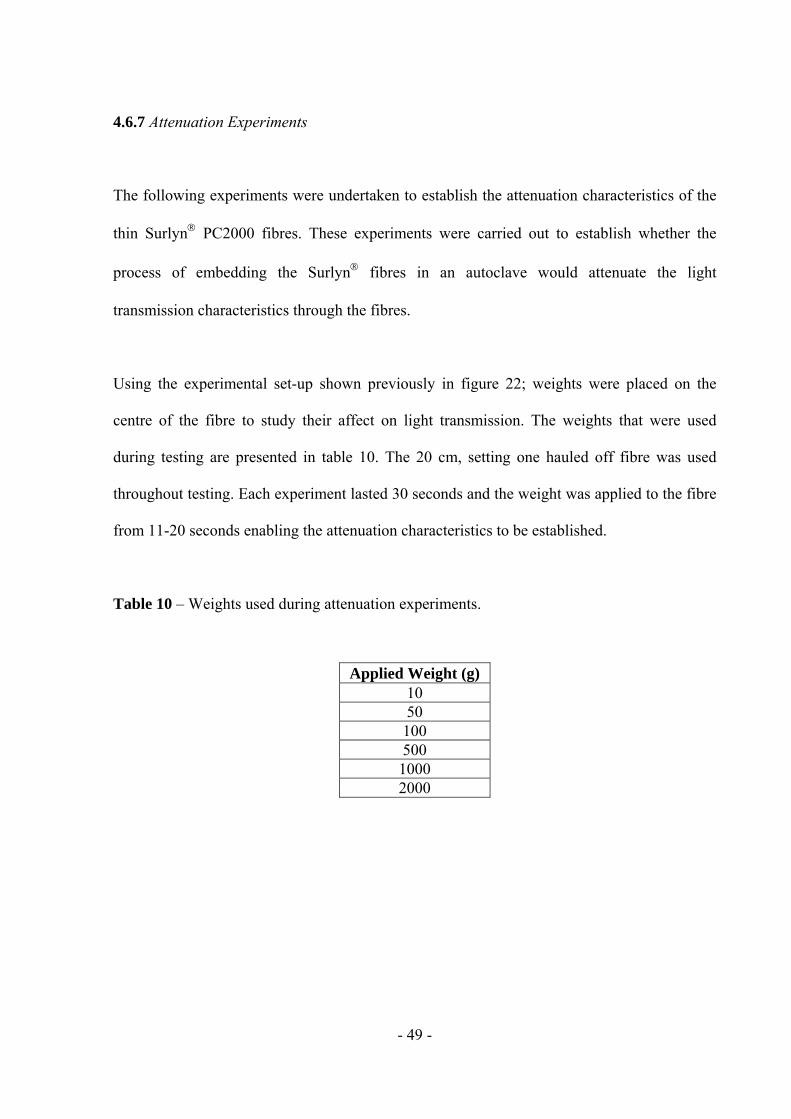
4.6.7 Attenuation Experiments
The following experiments were undertaken to establish the attenuation characteristics of the
thin Surlyn PC2000 fibres. These experiments were carried out to establish whether the
process of embedding the Surlyn fibres in an autoclave would attenuate the light
transmission characteristics through the fibres.
Using the experimental set-up shown previously in figure 22; weights were placed on the
centre of the fibre to study their affect on light transmission. The weights that were used
during testing are presented in table 10. The 20 cm, setting one hauled off fibre was used
throughout testing. Each experiment lasted 30 seconds and the weight was applied to the fibre
from 11-20 seconds enabling the attenuation characteristics to be established.
Table 10 – Weights used during attenuation experiments.
Applied Weight (g) 10 50 100 500 1000 2000

- 50 -
4.7 Fibre Characterisation
Following the preliminary characterisation of both Surlyn PC2000 and 9910 plaques, this
section was carried out to investigate whether extruding the fibre has caused any changes in
such properties as the density and crystallinity.
The Surlyn PC2000 fibre (setting six) was studied as this fibre was shown to have the best
light guide distance and was involved during further testing.
4.7.1 Fibre Density Measurements
Using the procedure that was previously described in section 4.2.2, density measurements
were carried out on five 20 mm samples.
4.7.2 Differential Scanning Calorimetry (DSC)
Using the temperature ramps previously described in section 4.2.3, the thermal characteristics
of the fibre were studied.
4.8 Fibre Analysis
Both image analysis and scanning electron microscopy were used to analyse the surface area
and cleaved area of chosen fibres.
- 51 -
4.9 Sample Storage
All samples were handled with surgical gloves and stored inside a desiccator until needed for
testing.
4.10 Surlyn Composite Development
The main focus of this section was to develop and fabricate Surlyn composites with both
self-healing and self-sensing capabilities. Both Surlyn PC2000 fibres (setting six) and
Surlyn 1706 film were incorporated with glass-fibre pre-preg. The intention was to subject
samples to both indentation and ballistic experiments investigating their capabilities, however
it was not possible to undertake these tests due to various reasons that were outside the control
of the author.
4.10.1 Production of Composites
4.10.1.1 General Pre-preg Lay-up
Each laminate was cut to size using a Stanley knife. The laminates were then laid on top of
each other at the required orientation. A custom made tool was designed to assist with the
alignment of the laminates and consolidation of the laminates was carried out using a wooden
roller.

- 52 -
4.10.1.2 Vacuum Bagging Procedure
Before the samples could be consolidated using an autoclave, the sample has to go through a
procedure known as ‘vacuum bagging’. This allows both pressure and vacuum to be applied
resulting in greater interlaminar bonding and lower void content.
Before carrying out the procedure a release agent (Chem Trend Monocoat 1367L) was applied
to the aluminium tooling plate allowing the sample to be easily removed from the autoclave
following consolidation. The vacuum bagging procedure and materials required are presented
in figure 23.
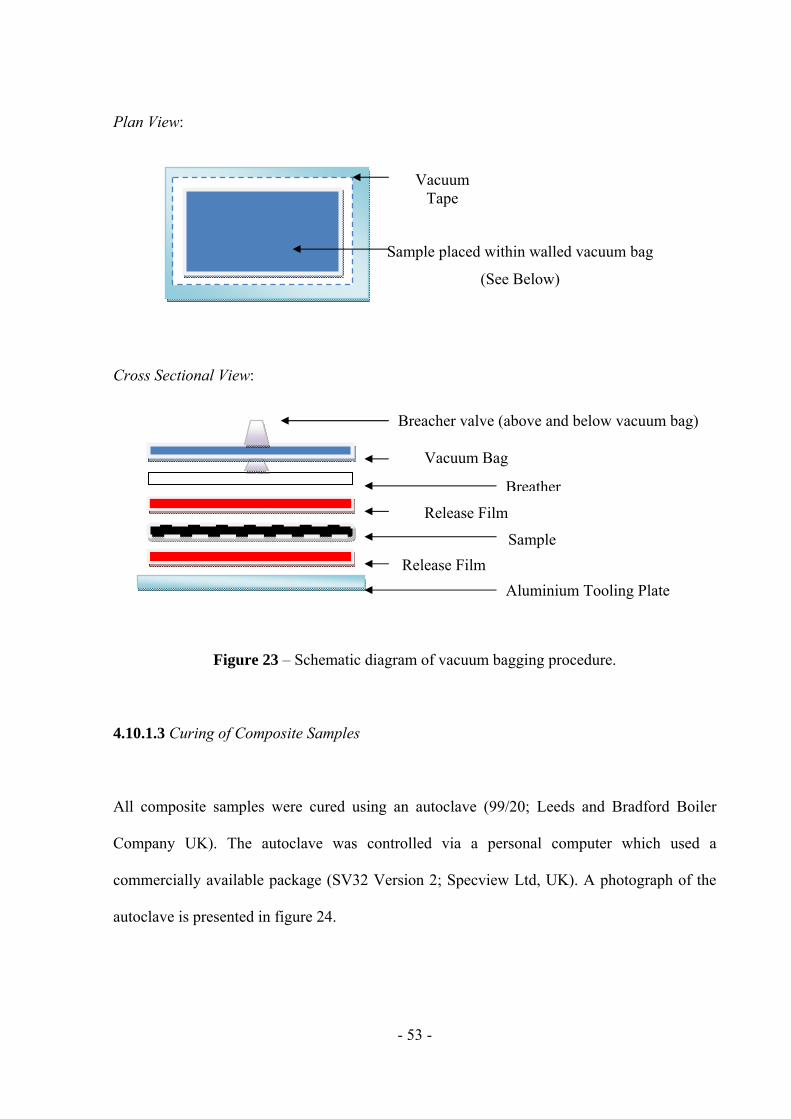
- 53 -
Plan View:
Cross Sectional View:
Vacuum Bag Release Film
Figure 23 – Schematic diagram of vacuum bagging procedure.
4.10.1.3 Curing of Composite Samples
All composite samples were cured using an autoclave (99/20; Leeds and Bradford Boiler
Company UK). The autoclave was controlled via a personal computer which used a
commercially available package (SV32 Version 2; Specview Ltd, UK). A photograph of the
autoclave is presented in figure 24.
Vacuum Tape
Sample placed within walled vacuum bag
(See Below)
Breacher valve (above and below vacuum bag)
Release Film
Breather
Sample
Aluminium Tooling Plate
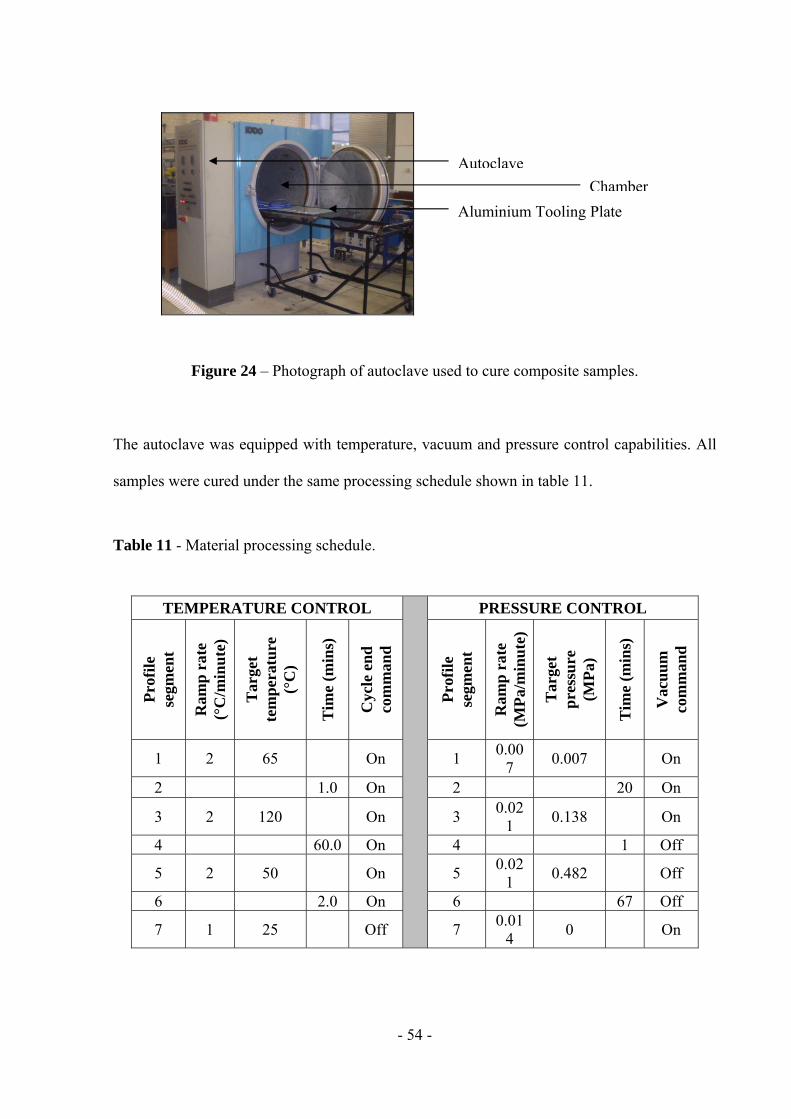
- 54 -
Figure 24 – Photograph of autoclave used to cure composite samples.
The autoclave was equipped with temperature, vacuum and pressure control capabilities. All
samples were cured under the same processing schedule shown in table 11.
Table 11 - Material processing schedule.
TEMPERATURE CONTROL
PRESSURE CONTROL
Pro
file
se
gmen
t
Ram
p r
ate
(°C
/min
ute
)
Tar
get
tem
per
atu
re
(°C
)
Tim
e (m
ins)
Cyc
le e
nd
co
mm
and
Pro
file
se
gmen
t
Ram
p r
ate
(MP
a/m
inu
te)
Tar
get
pre
ssu
re
(MP
a)
Tim
e (m
ins)
Vac
uu
m
com
man
d
1 2 65 On 1 0.00
7 0.007 On
2 1.0 On 2 20 On
3 2 120 On 3 0.02
1 0.138 On
4 60.0 On 4 1 Off
5 2 50 On 5 0.02
1 0.482 Off
6 2.0 On 6 67 Off
7 1 25 Off 7 0.01
4 0 On
Chamber
Aluminium Tooling Plate
Autoclave
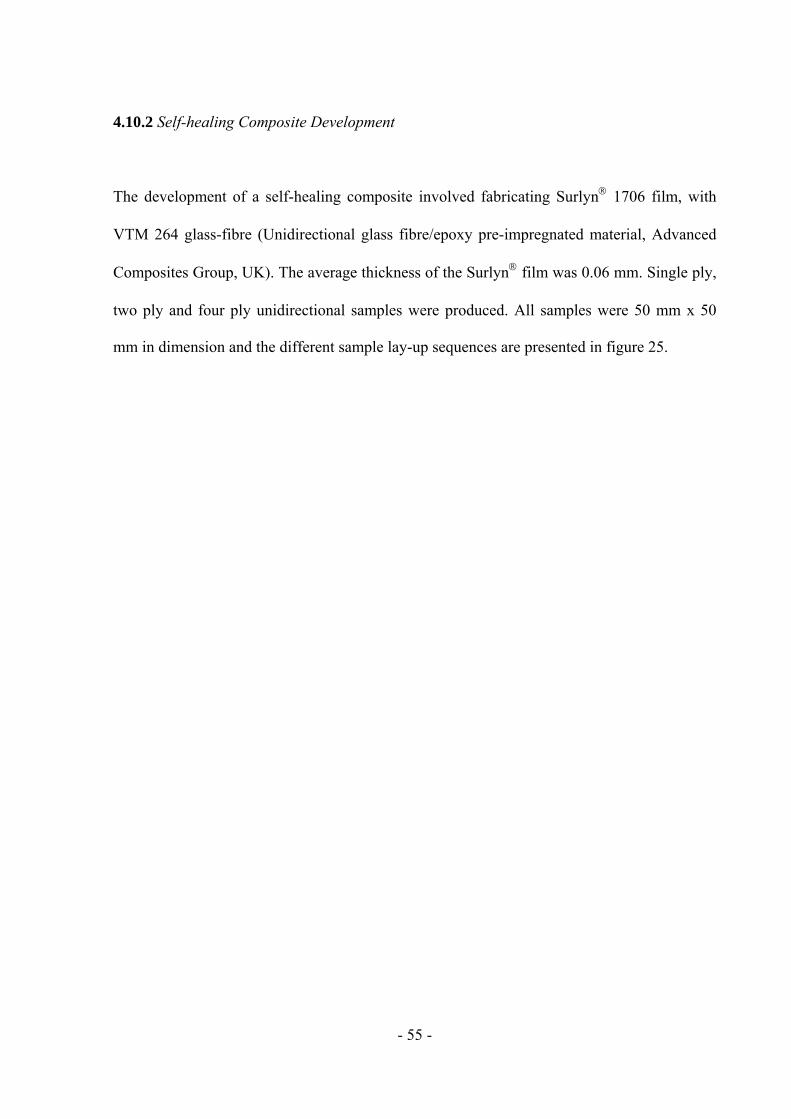
- 55 -
4.10.2 Self-healing Composite Development
The development of a self-healing composite involved fabricating Surlyn 1706 film, with
VTM 264 glass-fibre (Unidirectional glass fibre/epoxy pre-impregnated material, Advanced
Composites Group, UK). The average thickness of the Surlyn film was 0.06 mm. Single ply,
two ply and four ply unidirectional samples were produced. All samples were 50 mm x 50
mm in dimension and the different sample lay-up sequences are presented in figure 25.
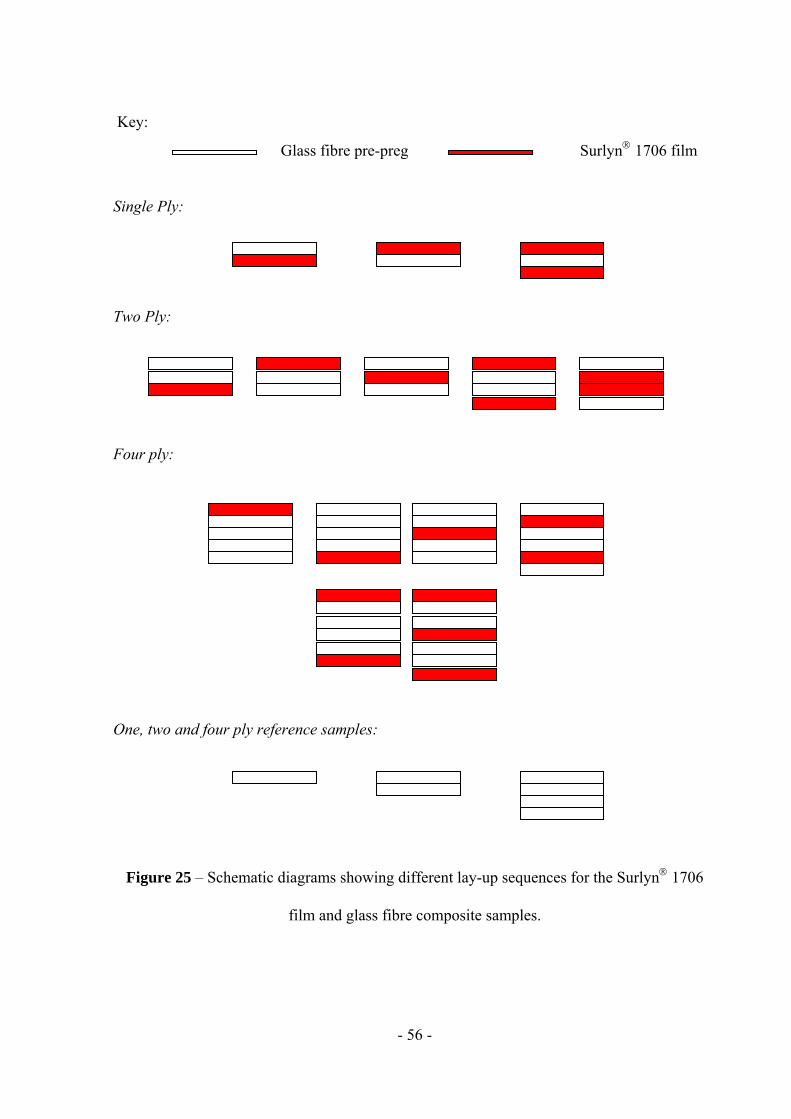
- 56 -
Key:
Glass fibre pre-preg Surlyn 1706 film
Single Ply:
Two Ply:
Four ply:
One, two and four ply reference samples:
Figure 25 – Schematic diagrams showing different lay-up sequences for the Surlyn 1706
film and glass fibre composite samples.

- 57 -
4.10.3 Self-healing/Self-sensing Composite Development
Composites were fabricated using VTM 264 glass-fibre and five different types of fibre.
Surlyn PC2000 fibres (setting six) were added to all composite samples. The aim of this
aspect of the research was to develop a composite with both self-healing and self-sensing
capabilities, where Surlyn with its reputation for self-healing could also be used to sense
fibre damage.
All five samples were 50 mm x 50 mm and single ply. All fibres were 150 mm in length. The
composite set-up and different fibres used during fabrication of the samples is presented in
figure 26.
Key: VTM 264 glass-fibre Surlyn PC2000 fibre
Sample 1: Sample 2:
33 SurlynPC2000 fibres 10 SurlynPC2000 fibres
11 PMMA fibres
- 58 -
Sample 3: Sample 4:
8 SurlynPC2000 fibres 9 SurlynPC2000 fibres
9 bundles of S2 hollow glass-fibres 9 bundles of small diameter optical fibres
Sample 5:
10 SurlynPC2000 fibres
11 Stripped standard optical fibres
Figure 26 – Schematic diagrams showing different lay-up sequences for the Surlyn PC2000
fibres and glass-fibre composite samples.
4.10.4 Crack Arrestor Composites
The main focus of this part of the study was to investigate whether Surlyn would act as a
crack arrestor when incorporated into a carbon-fibre composite. Mode I fracture tests were
carried out and were used to determine the G1c, the critical energy release rate, of the fibre
reinforced composites.
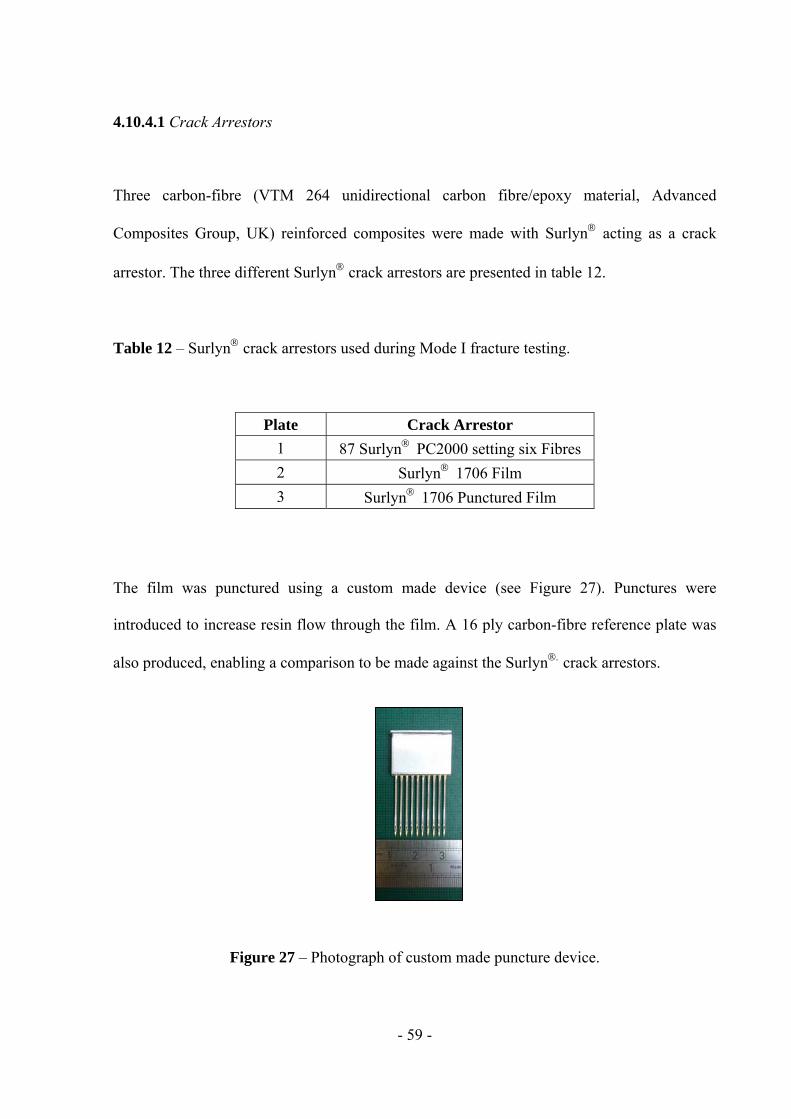
- 59 -
4.10.4.1 Crack Arrestors
Three carbon-fibre (VTM 264 unidirectional carbon fibre/epoxy material, Advanced
Composites Group, UK) reinforced composites were made with Surlyn acting as a crack
arrestor. The three different Surlyn crack arrestors are presented in table 12.
Table 12 – Surlyn crack arrestors used during Mode I fracture testing.
The film was punctured using a custom made device (see Figure 27). Punctures were
introduced to increase resin flow through the film. A 16 ply carbon-fibre reference plate was
also produced, enabling a comparison to be made against the Surlyn crack arrestors.
Figure 27 – Photograph of custom made puncture device.
Plate Crack Arrestor
1 87 Surlyn PC2000 setting six Fibres
2 Surlyn 1706 Film
3 Surlyn 1706 Punctured Film
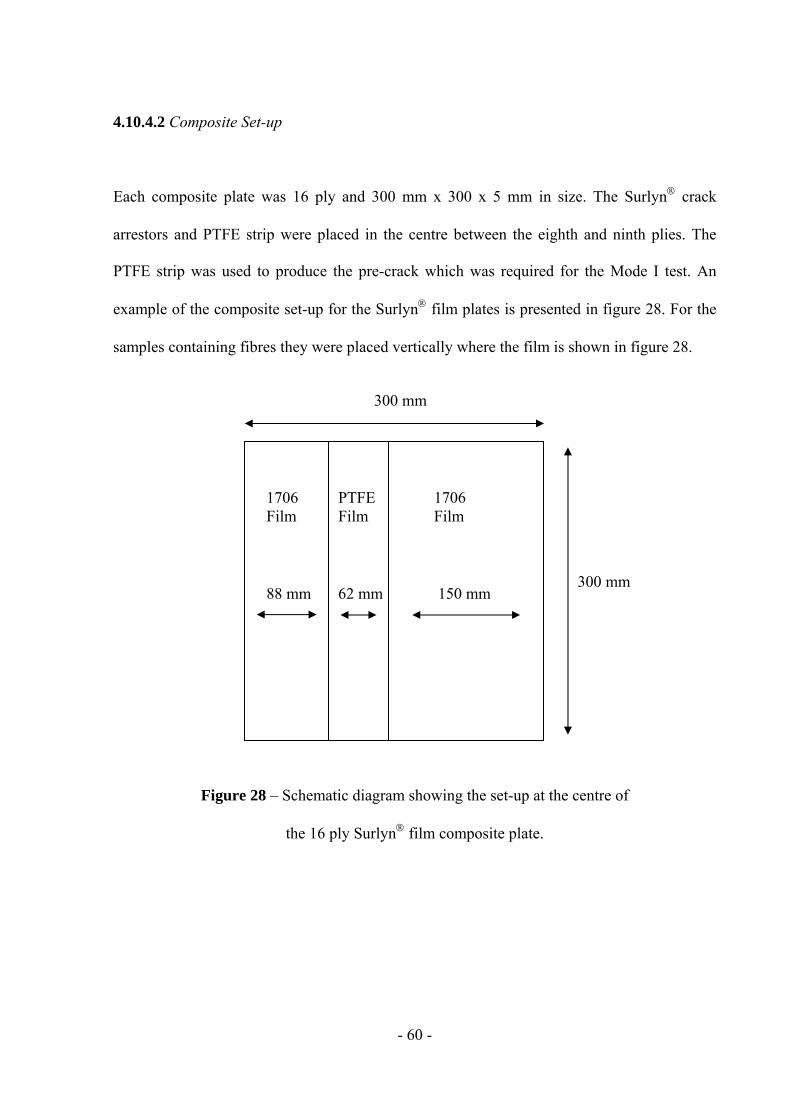
- 60 -
4.10.4.2 Composite Set-up
Each composite plate was 16 ply and 300 mm x 300 x 5 mm in size. The Surlyn crack
arrestors and PTFE strip were placed in the centre between the eighth and ninth plies. The
PTFE strip was used to produce the pre-crack which was required for the Mode I test. An
example of the composite set-up for the Surlyn film plates is presented in figure 28. For the
samples containing fibres they were placed vertically where the film is shown in figure 28.
Figure 28 – Schematic diagram showing the set-up at the centre of
the 16 ply Surlyn film composite plate.
300 mm
300 mm 88 mm 62 mm 150 mm
1706 Film
1706 Film
PTFE Film
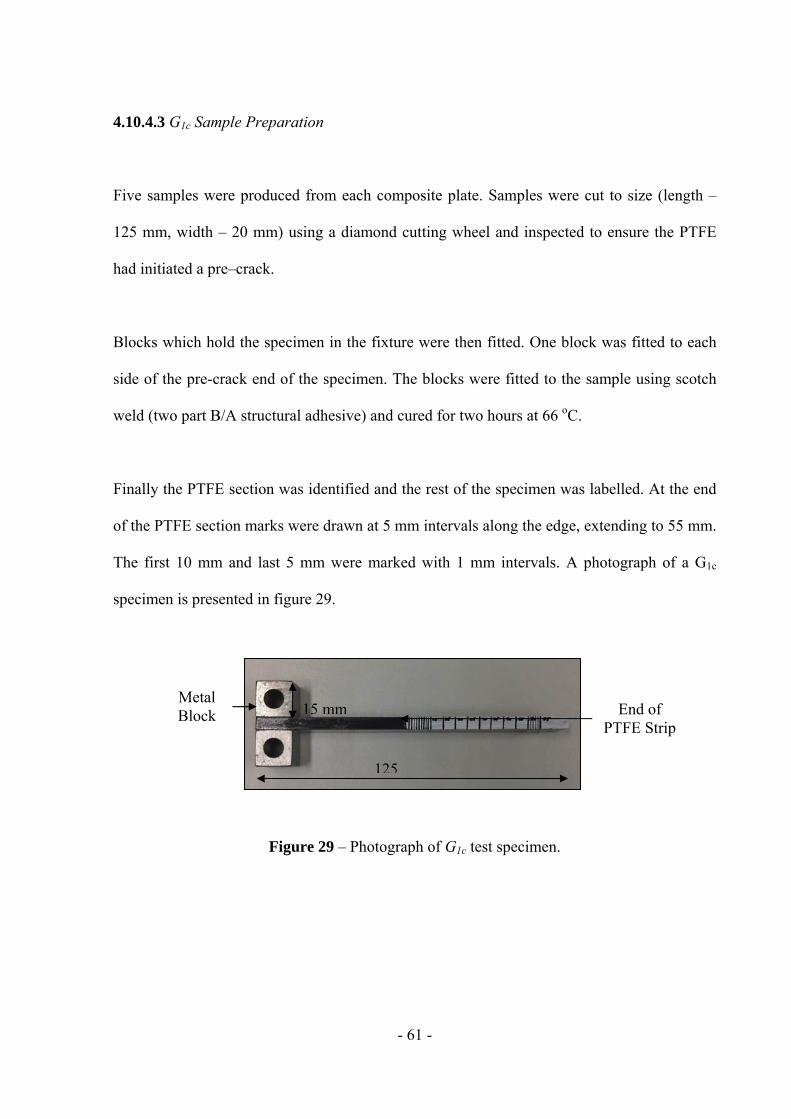
- 61 -
4.10.4.3 G1c Sample Preparation
Five samples were produced from each composite plate. Samples were cut to size (length –
125 mm, width – 20 mm) using a diamond cutting wheel and inspected to ensure the PTFE
had initiated a pre–crack.
Blocks which hold the specimen in the fixture were then fitted. One block was fitted to each
side of the pre-crack end of the specimen. The blocks were fitted to the sample using scotch
weld (two part B/A structural adhesive) and cured for two hours at 66 oC.
Finally the PTFE section was identified and the rest of the specimen was labelled. At the end
of the PTFE section marks were drawn at 5 mm intervals along the edge, extending to 55 mm.
The first 10 mm and last 5 mm were marked with 1 mm intervals. A photograph of a G1c
specimen is presented in figure 29.
Figure 29 – Photograph of G1c test specimen.
Metal Block
125
15 mm End of PTFE Strip
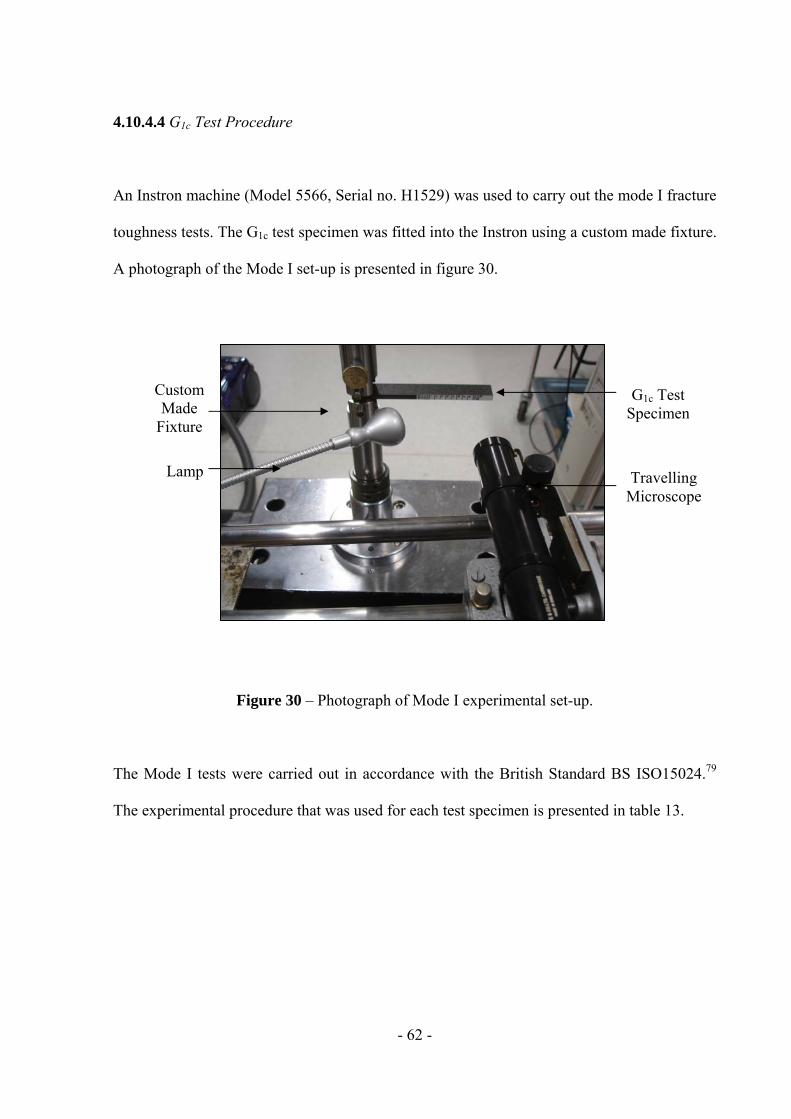
- 62 -
4.10.4.4 G1c Test Procedure
An Instron machine (Model 5566, Serial no. H1529) was used to carry out the mode I fracture
toughness tests. The G1c test specimen was fitted into the Instron using a custom made fixture.
A photograph of the Mode I set-up is presented in figure 30.
Figure 30 – Photograph of Mode I experimental set-up.
The Mode I tests were carried out in accordance with the British Standard BS ISO15024.79
The experimental procedure that was used for each test specimen is presented in table 13.
G1c Test Specimen
Travelling Microscope
Custom Made
Fixture
Lamp
- 63 -
Table 13 – G1c test procedure with accordance to British Standard BS ISO15024.79
Procedure – With accordance to British Standard BS ISO15024
Test Set-up The G1c test specimen was fitted into the fixture ensuring that the
beam was perpendicular with direction of the applied load.
Initial Loading (Pre-crack)
The specimen was loaded at 1 mm/min to produce a pre-crack of 3 mm. The specimen was then unloaded at 5 mm/min.
Re-loading The specimen was re-loaded at 1 mm/min without stopping until the
final delamination increment was reached or the specimen failed. The specimen was then unloaded at 5 mm/min.
Data
Throughout the test the load and displacement values were recorded continuously by the Instron. A microscope was used to monitor crack propagation and AE Win software was used to manually trigger the
delamination increments which were then matched up with the displacement and load from the Instron data.
4.10.4.5 G1c Calculation
Using the data collected and a database (Excel spreadsheet); fracture toughness G1c values
were determined from the corresponding points on the load-displacement curve. From this
curve a value of (P) is calculated as the onset of crack growth. This point is also calculated as
the point at which delamination is visually observed (VIS). The corrected beam theory (CBT)
(A) and modified compliance calibration (MCC) (B) were the two data reduction methods
used to calculate the critical energy release rate G1c. Figure 31 presents the data required to
carry out both analysis methods.
A0 Initial delamination length
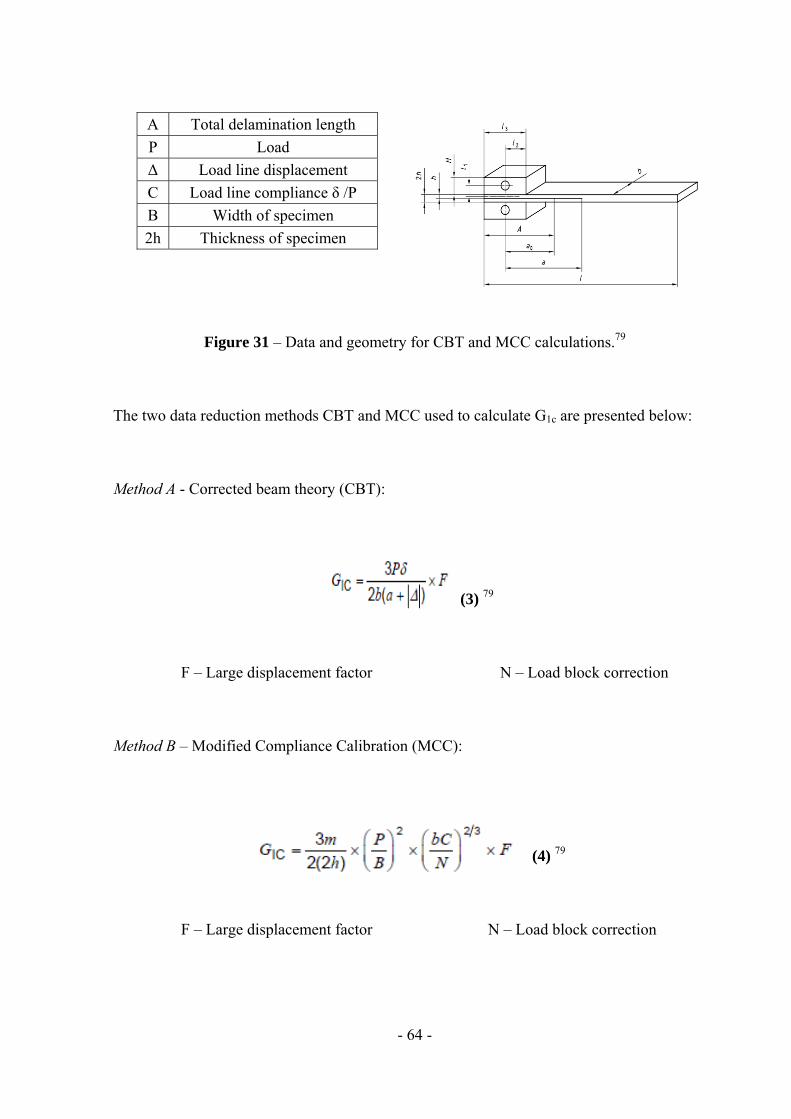
- 64 -
Figure 31 – Data and geometry for CBT and MCC calculations.79
The two data reduction methods CBT and MCC used to calculate G1c are presented below:
Method A - Corrected beam theory (CBT):
(3) 79
F – Large displacement factor N – Load block correction
Method B – Modified Compliance Calibration (MCC):
(4) 79
F – Large displacement factor N – Load block correction
A Total delamination length
P Load
Δ Load line displacement
C Load line compliance δ /P
B Width of specimen
2h Thickness of specimen

- 65 -
4.10.4.6 G1c Test Specimen Analysis
Before testing image analysis was carried out on one sample from each crack arrestor type.
Following testing S.E.M was carried out on the fracture surface of one of the failed samples
from each type of investigated crack arrestor.
- 66 -
5.0 Results and Discussion
The focal point of the study was to develop Surlyn as a self-healing and self-sensing
composite. The ability of Surlyn (8940) as a self-healing material was discussed during the
literature review section. The following results aim to investigate the self-healing ability of
Surlyn and establish the self-sensing ability of Surlyn.
Initial characterisation experiments were employed to obtain information about the three
grades of Surlynused during the study.
The development of thick Surlyn plaques was studied for self-healing aspects, whilst the
self-sensing capabilities of Surlyn were investigated through the development of Surlyn
fibres which were subjected to various light transmission studies.
Surlyn film and fibres were then incorporated with glass-fibre and carbon-fibre pre-
impregnated materials.
The crack healing capacity of Surlyn was studied along with the development of a Surlyn
composite, with a view to developing a self-sensing and self-healing Surlyn composite.
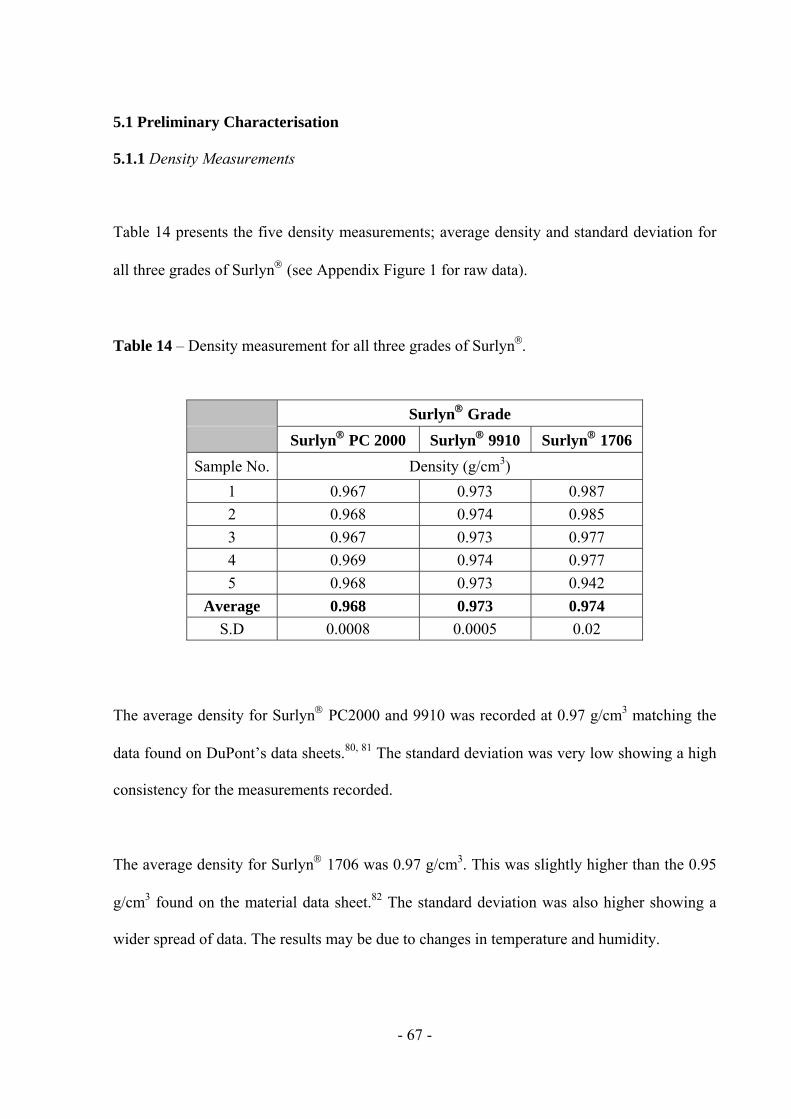
- 67 -
5.1 Preliminary Characterisation
5.1.1 Density Measurements
Table 14 presents the five density measurements; average density and standard deviation for
all three grades of Surlyn (see Appendix Figure 1 for raw data).
Table 14 – Density measurement for all three grades of Surlyn
The average density for Surlyn PC2000 and 9910 was recorded at 0.97 g/cm3 matching the
data found on DuPont’s data sheets.80, 81 The standard deviation was very low showing a high
consistency for the measurements recorded.
The average density for Surlyn 1706 was 0.97 g/cm3. This was slightly higher than the 0.95
g/cm3 found on the material data sheet.82 The standard deviation was also higher showing a
wider spread of data. The results may be due to changes in temperature and humidity.
Surlyn Grade
Surlyn PC 2000 Surlyn 9910 Surlyn 1706
Sample No. Density (g/cm3)
1 0.967 0.973 0.987
2 0.968 0.974 0.985
3 0.967 0.973 0.977
4 0.969 0.974 0.977
5 0.968 0.973 0.942
Average 0.968 0.973 0.974
S.D 0.0008 0.0005 0.02
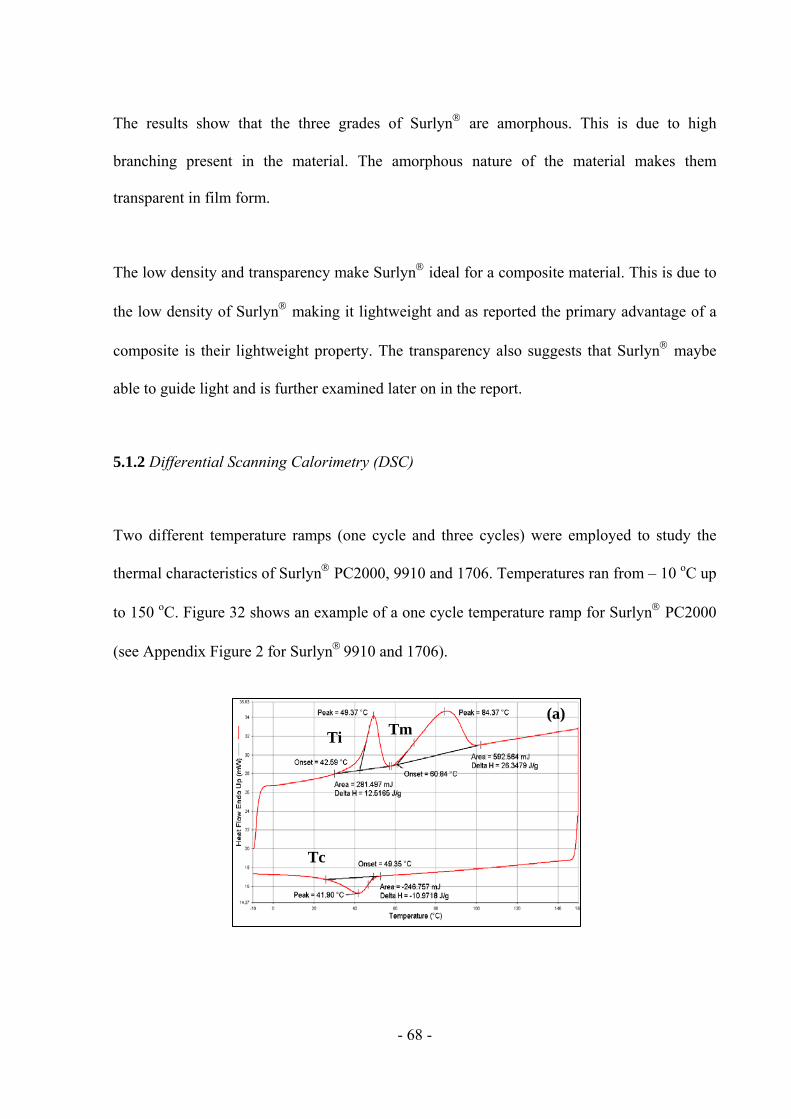
- 68 -
The results show that the three grades of Surlyn are amorphous. This is due to high
branching present in the material. The amorphous nature of the material makes them
transparent in film form.
The low density and transparency make Surlyn ideal for a composite material. This is due to
the low density of Surlyn making it lightweight and as reported the primary advantage of a
composite is their lightweight property. The transparency also suggests that Surlyn maybe
able to guide light and is further examined later on in the report.
5.1.2 Differential Scanning Calorimetry (DSC)
Two different temperature ramps (one cycle and three cycles) were employed to study the
thermal characteristics of Surlyn PC2000, 9910 and 1706. Temperatures ran from – 10 oC up
to 150 oC. Figure 32 shows an example of a one cycle temperature ramp for Surlyn PC2000
(see Appendix Figure 2 for Surlyn9910 and 1706).
Ti Tm
Tc
(a)
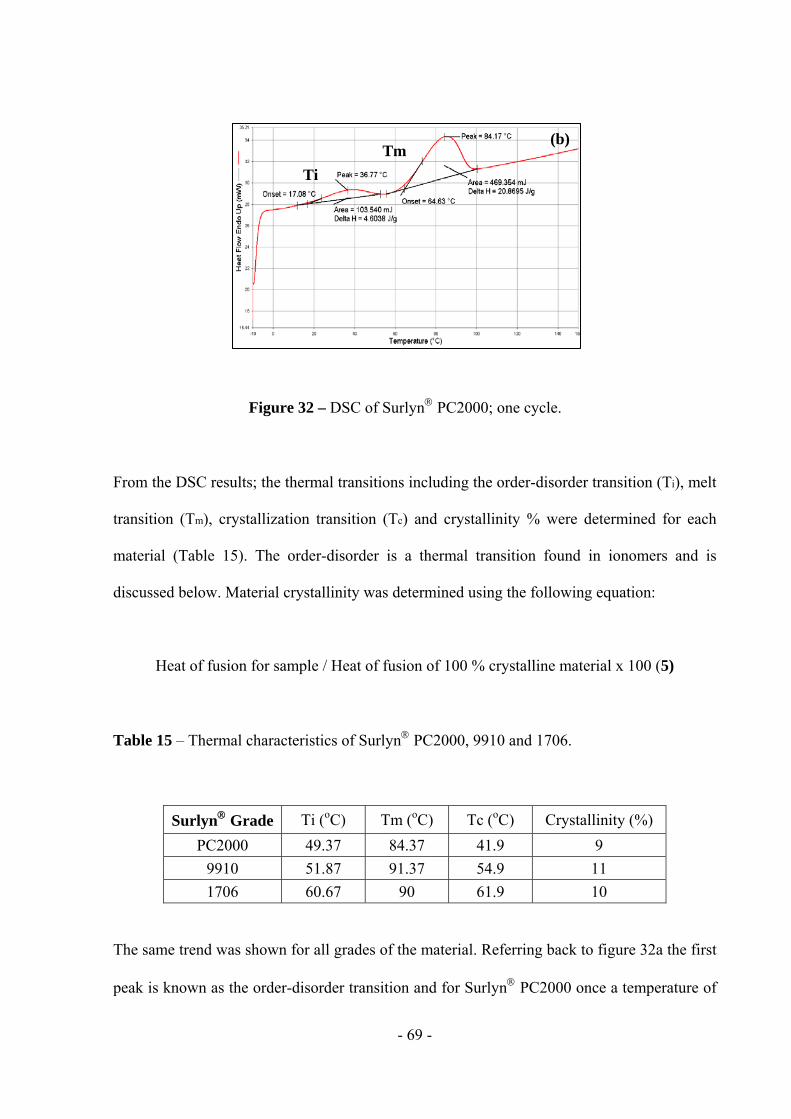
- 69 -
Figure 32 – DSC of Surlyn PC2000; one cycle.
From the DSC results; the thermal transitions including the order-disorder transition (Ti), melt
transition (Tm), crystallization transition (Tc) and crystallinity % were determined for each
material (Table 15). The order-disorder is a thermal transition found in ionomers and is
discussed below. Material crystallinity was determined using the following equation:
Heat of fusion for sample / Heat of fusion of 100 % crystalline material x 100 (5)
Table 15 – Thermal characteristics of Surlyn PC2000, 9910 and 1706.
Surlyn Grade Ti (oC) Tm (oC) Tc (oC) Crystallinity (%)
PC2000 49.37 84.37 41.9 9
9910 51.87 91.37 54.9 11
1706 60.67 90 61.9 10
The same trend was shown for all grades of the material. Referring back to figure 32a the first
peak is known as the order-disorder transition and for Surlyn PC2000 once a temperature of
Ti
Tm (b)
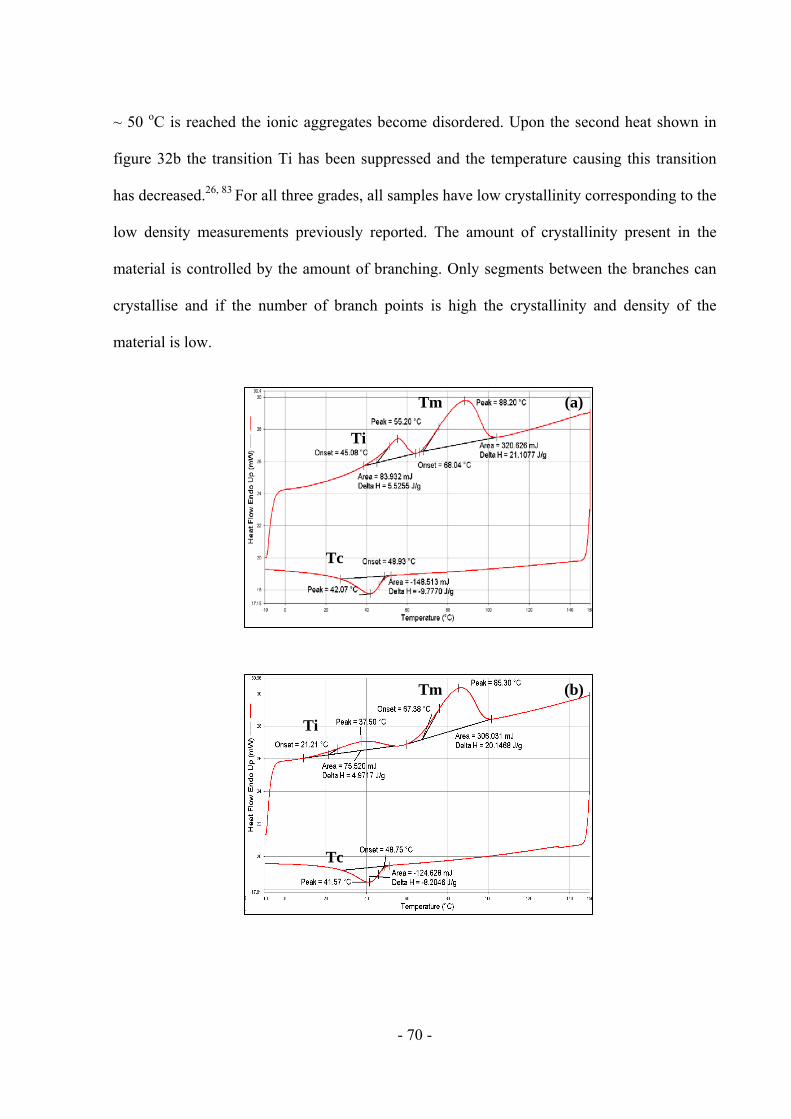
- 70 -
~ 50 oC is reached the ionic aggregates become disordered. Upon the second heat shown in
figure 32b the transition Ti has been suppressed and the temperature causing this transition
has decreased.26, 83 For all three grades, all samples have low crystallinity corresponding to the
low density measurements previously reported. The amount of crystallinity present in the
material is controlled by the amount of branching. Only segments between the branches can
crystallise and if the number of branch points is high the crystallinity and density of the
material is low.
Tm
Tm
Ti
Tc
Ti
Tc
(a)
(b)
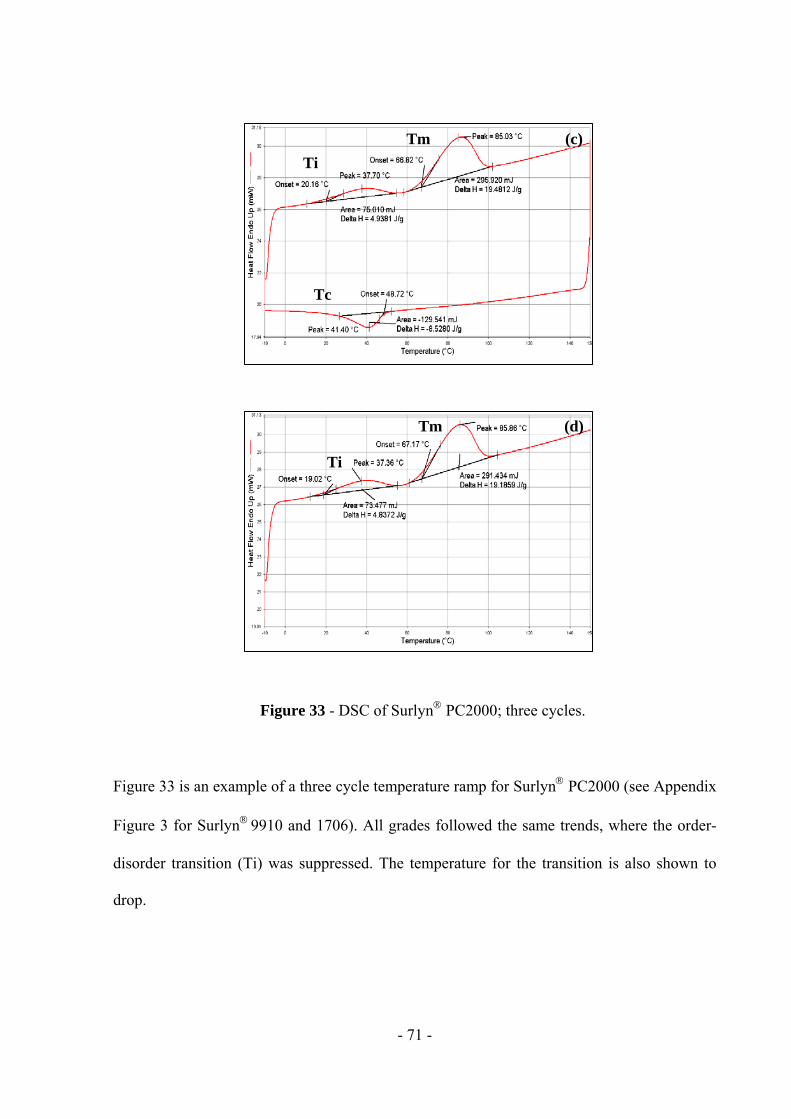
- 71 -
(d)
Figure 33 - DSC of Surlyn PC2000; three cycles.
Figure 33 is an example of a three cycle temperature ramp for Surlyn PC2000 (see Appendix
Figure 3 for Surlyn9910 and 1706). All grades followed the same trends, where the order-
disorder transition (Ti) was suppressed. The temperature for the transition is also shown to
drop.
Tm
Tm
Ti
Tc
Ti
(c)
(d)
- 72 -
Further studies have shown that when the sample (Surlyn 8940) is left for a short period of
time (one hour) the ionic aggregates are said to re-order and the suppressed Ti peak return.26
Overall a clear link is shown between the DSC results and density measurements suggesting
that Surlyn is a low density, amorphous material. Information obtained will enable further
understanding and development during the study.
5.1.3 Fourier Transform Infrared Spectroscopy (FTIR)
MFTIR was used to examine the molecular structures of Surlyn PC2000, 9910 and 1706.
Figure 34 contains spectra for all three grades of SurlynThe MFTIR had a spectral range of
4000 – 700 cm-1.
From the spectra collected for all three grades of Surlyn analysis showed that the sharp band
at ~ 720 cm-1 is caused by methylene rocking in the pendant backbone.84 The ~ 1260 cm-1
peak found on the PC2000 spectra is due to C-O stretching vibrations of COOH groups in the
hydrogen bonded dimers.85 The other bands found between ~ 1400 – 1550 cm-1 are due to
CO3 groups.86
The peak with a wavelength of ~ 1700 cm-1 is due to C=O stretching vibrations in H bonded
carboxylic acid dimers where both C=O groups are in H bands.87 Finally the two large peaks
are present due to CH3 groups (~ 2850 cm-1) and methyl groups (~ 2920 cm-1) present in the
materials.88, 89
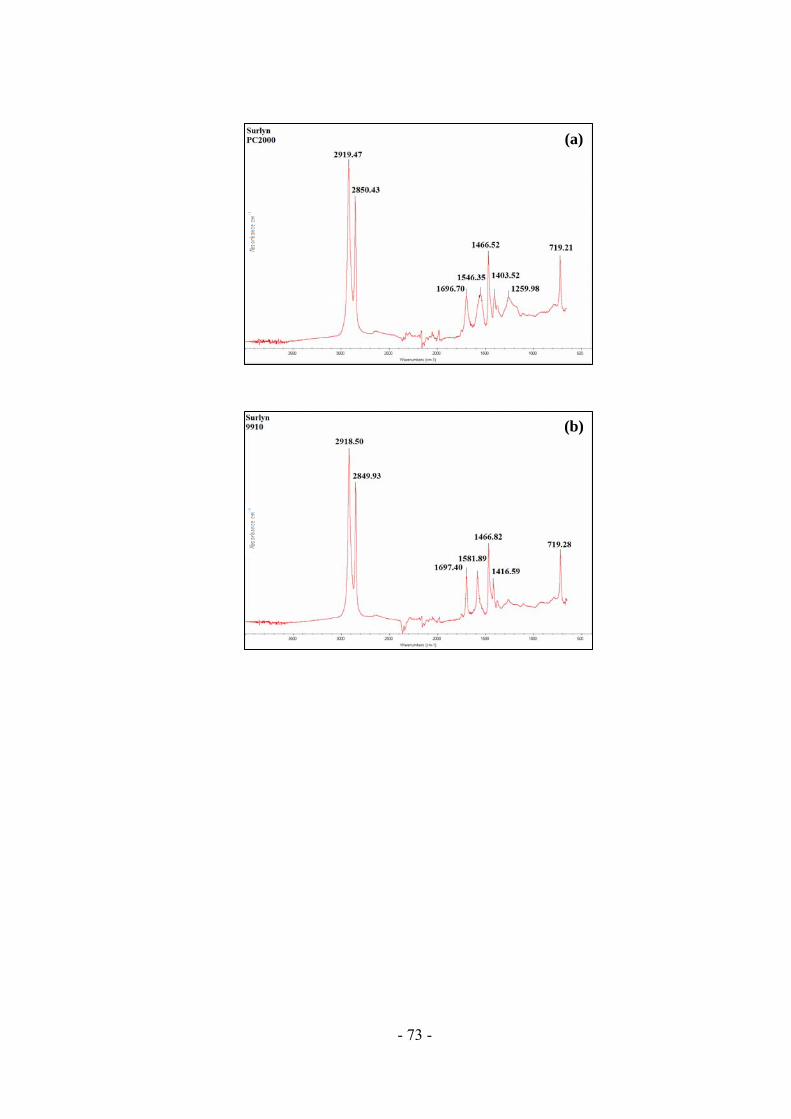
- 73 -
(a)
(b)
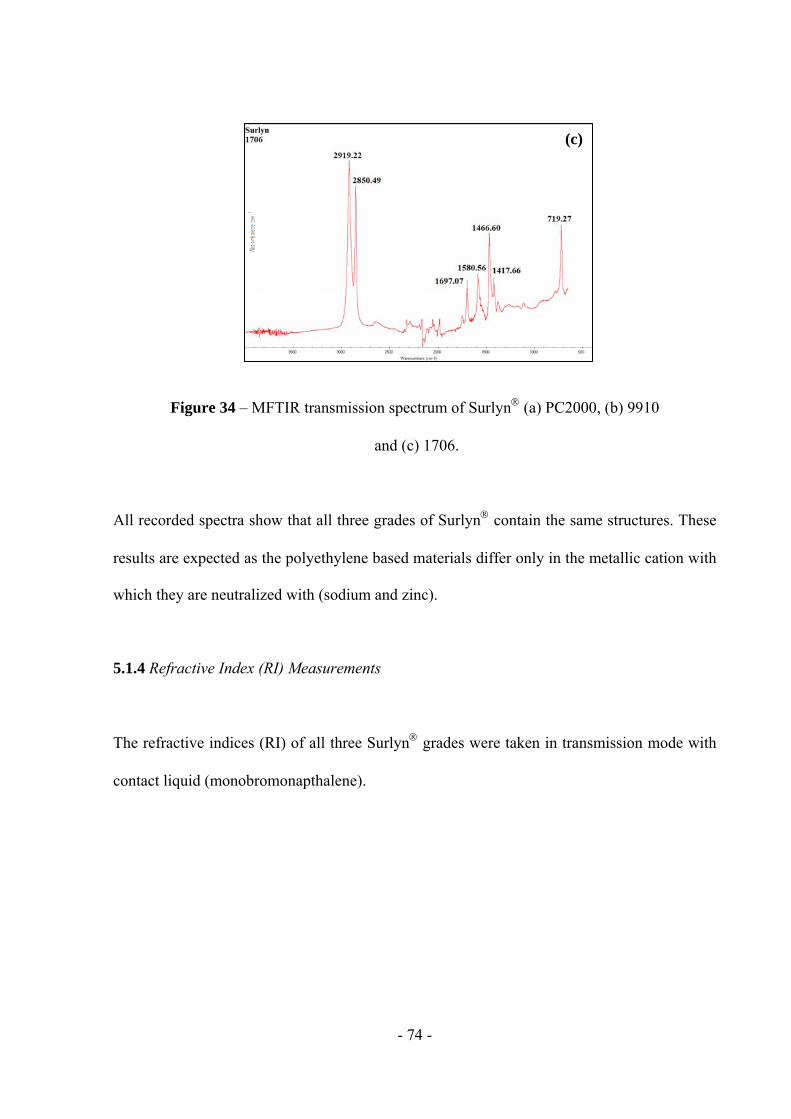
- 74 -
Figure 34 – MFTIR transmission spectrum of Surlyn (a) PC2000, (b) 9910
and (c) 1706.
All recorded spectra show that all three grades of Surlyn contain the same structures. These
results are expected as the polyethylene based materials differ only in the metallic cation with
which they are neutralized with (sodium and zinc).
5.1.4 Refractive Index (RI) Measurements
The refractive indices (RI) of all three Surlyn grades were taken in transmission mode with
contact liquid (monobromonapthalene).
(c)
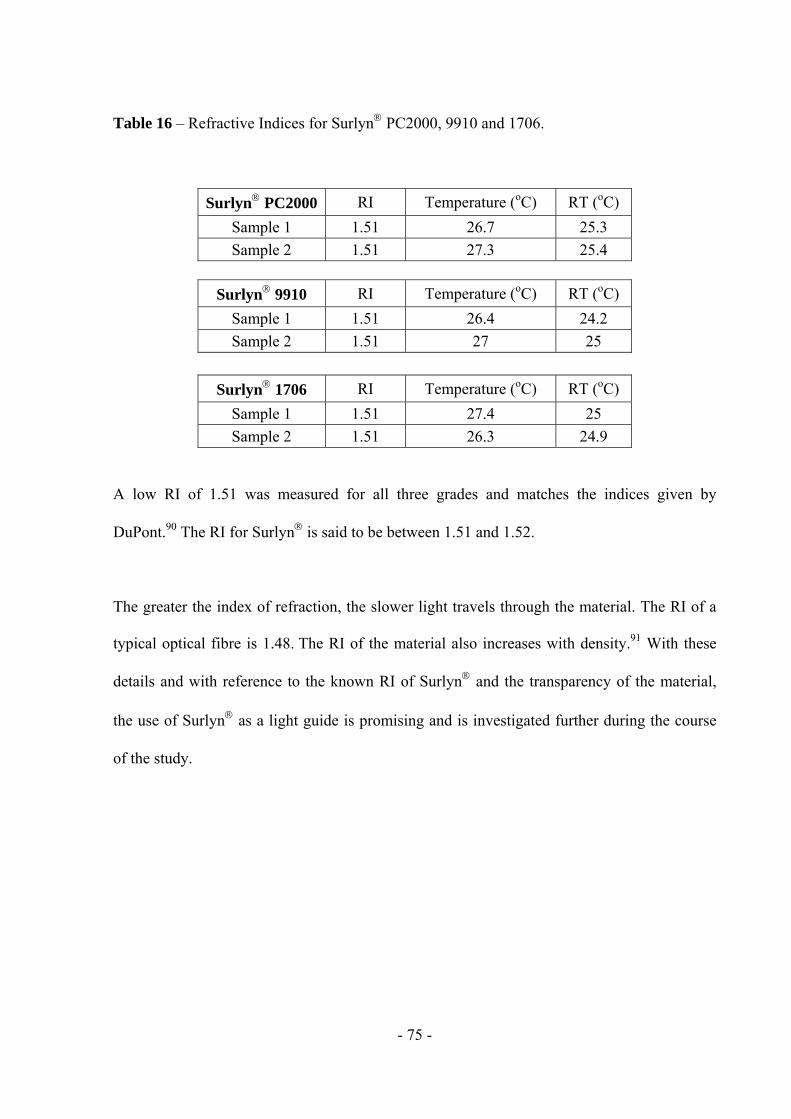
- 75 -
Table 16 – Refractive Indices for Surlyn PC2000, 9910 and 1706.
Surlyn PC2000 RI Temperature (oC) RT (oC)
Sample 1 1.51 26.7 25.3
Sample 2 1.51 27.3 25.4
Surlyn 9910 RI Temperature (oC) RT (oC)
Sample 1 1.51 26.4 24.2
Sample 2 1.51 27 25
Surlyn 1706 RI Temperature (oC) RT (oC)
Sample 1 1.51 27.4 25
Sample 2 1.51 26.3 24.9
A low RI of 1.51 was measured for all three grades and matches the indices given by
DuPont.90 The RI for Surlyn is said to be between 1.51 and 1.52.
The greater the index of refraction, the slower light travels through the material. The RI of a
typical optical fibre is 1.48. The RI of the material also increases with density.91 With these
details and with reference to the known RI of Surlyn and the transparency of the material,
the use of Surlyn as a light guide is promising and is investigated further during the course
of the study.
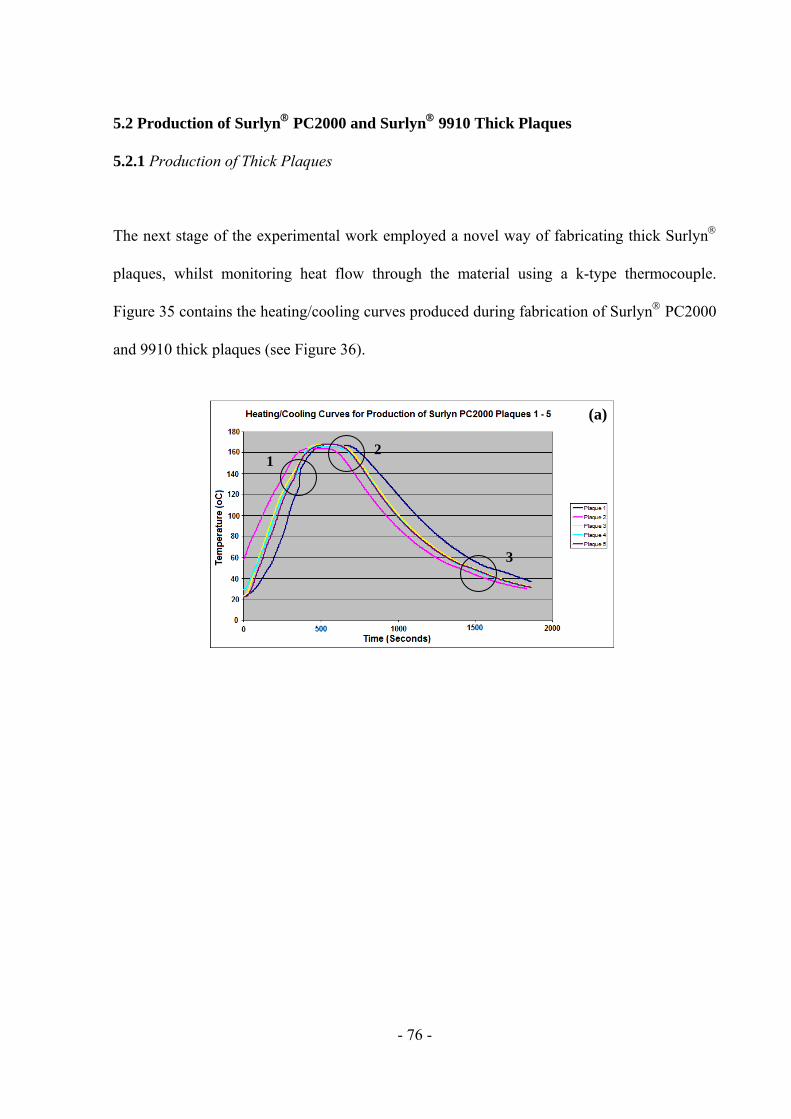
- 76 -
5.2 Production of Surlyn PC2000 and Surlyn 9910 Thick Plaques
5.2.1 Production of Thick Plaques
The next stage of the experimental work employed a novel way of fabricating thick Surlyn
plaques, whilst monitoring heat flow through the material using a k-type thermocouple.
Figure 35 contains the heating/cooling curves produced during fabrication of Surlyn PC2000
and 9910 thick plaques (see Figure 36).
1 2
3
(a)
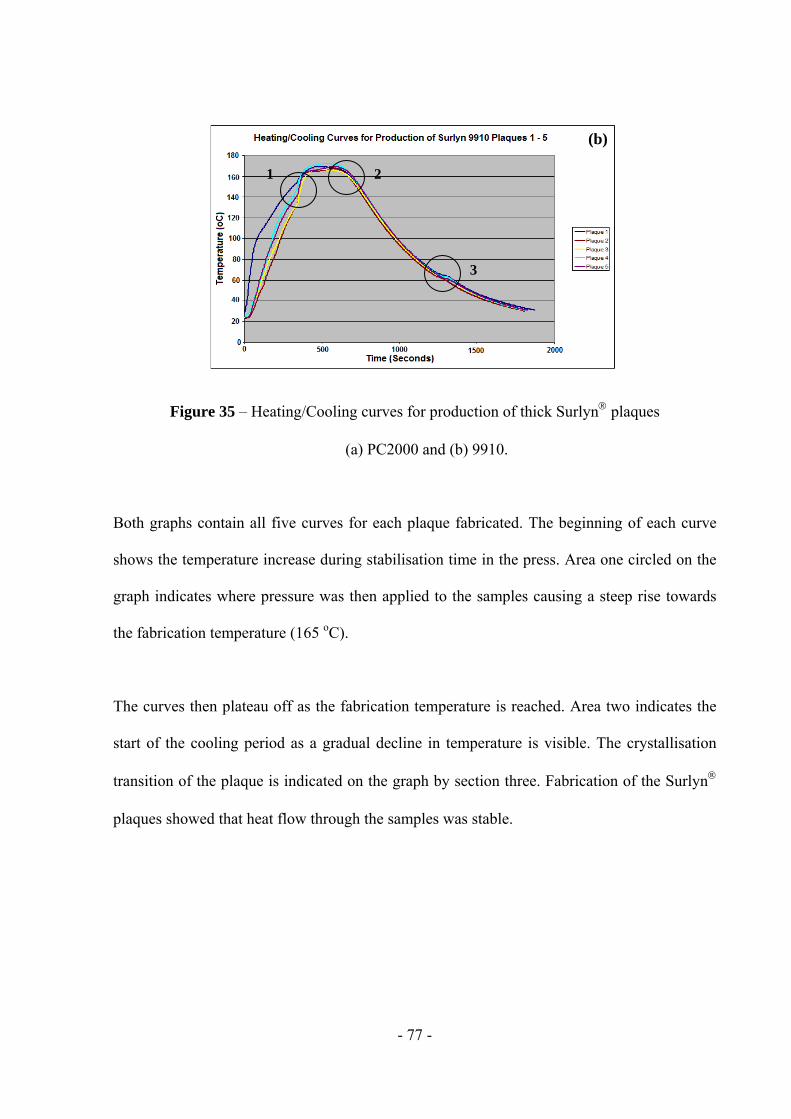
- 77 -
Figure 35 – Heating/Cooling curves for production of thick Surlyn plaques
(a) PC2000 and (b) 9910.
Both graphs contain all five curves for each plaque fabricated. The beginning of each curve
shows the temperature increase during stabilisation time in the press. Area one circled on the
graph indicates where pressure was then applied to the samples causing a steep rise towards
the fabrication temperature (165 oC).
The curves then plateau off as the fabrication temperature is reached. Area two indicates the
start of the cooling period as a gradual decline in temperature is visible. The crystallisation
transition of the plaque is indicated on the graph by section three. Fabrication of the Surlyn
plaques showed that heat flow through the samples was stable.
1 2
3
(b)
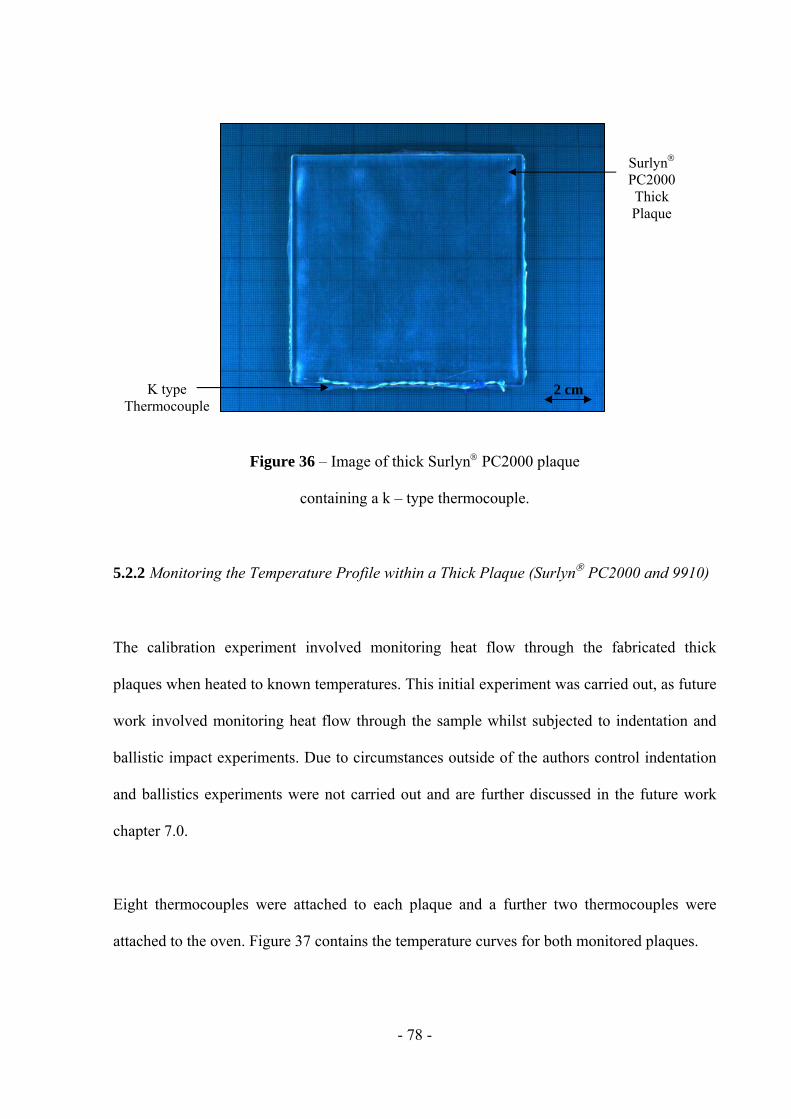
- 78 -
Figure 36 – Image of thick Surlyn PC2000 plaque
containing a k – type thermocouple.
5.2.2 Monitoring the Temperature Profile within a Thick Plaque (Surlyn PC2000 and 9910)
The calibration experiment involved monitoring heat flow through the fabricated thick
plaques when heated to known temperatures. This initial experiment was carried out, as future
work involved monitoring heat flow through the sample whilst subjected to indentation and
ballistic impact experiments. Due to circumstances outside of the authors control indentation
and ballistics experiments were not carried out and are further discussed in the future work
chapter 7.0.
Eight thermocouples were attached to each plaque and a further two thermocouples were
attached to the oven. Figure 37 contains the temperature curves for both monitored plaques.
2 cm K type Thermocouple
Surlyn PC2000 Thick Plaque
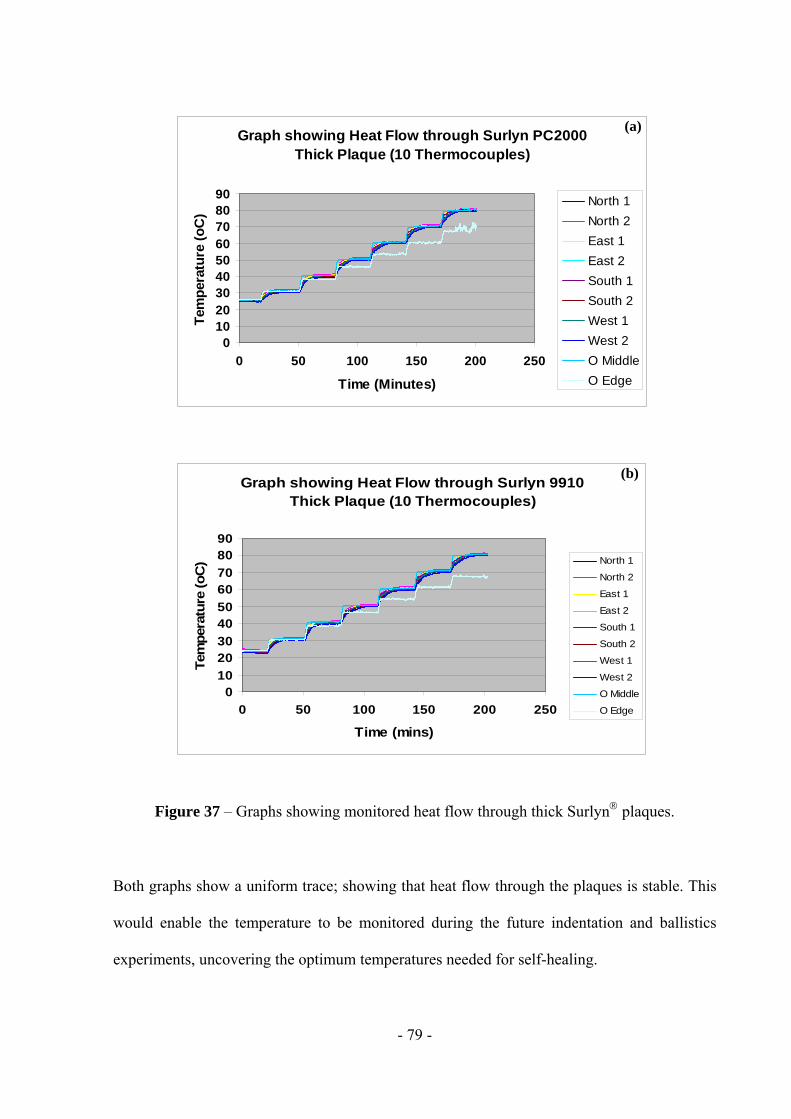
- 79 -
Figure 37 – Graphs showing monitored heat flow through thick Surlyn plaques.
Both graphs show a uniform trace; showing that heat flow through the plaques is stable. This
would enable the temperature to be monitored during the future indentation and ballistics
experiments, uncovering the optimum temperatures needed for self-healing.
Graph showing Heat Flow through Surlyn 9910 Thick Plaque (10 Thermocouples)
010
2030
4050
6070
8090
0 50 100 150 200 250
Time (mins)
Tem
per
ature
(oC
) North 1
North 2
East 1
East 2
South 1
South 2
West 1
West 2
O Middle
O Edge
Graph showing Heat Flow through Surlyn PC2000 Thick Plaque (10 Thermocouples)
0102030405060708090
0 50 100 150 200 250
Time (Minutes)
Tem
per
atu
re (
oC
)North 1
North 2
East 1
East 2
South 1
South 2
West 1
West 2
O Middle
O Edge
(a)
(b)
- 80 -
The non-uniform trace present on both graphs is caused by a slight temperature loss occurring
on the outer edges of the oven.
5.3 Production of Surlyn Composites
5.3.1 Production of Glass-Fibre Reinforced Composites
After developing a method to fabricate Surlyn plaques, the next step involved using these
plaques to develop the novel idea of a Surlyn, self-healing and self-sensing composite.
However during this section the initial research aimed to create a composite where the
Surlyn thin plaque would act as the self-healing matrix and small diameter optical fibres
would act as the self-sensing reinforcing fibres.
Figure 38 shows a photograph of the fabricated composite, with the small diameter optical
fibres guiding light. Causing damage to the composite causes bleeding light from the
composite and is shown in figure 39. The idea is then for the Surlyn to self-heal, mending
the composite material.
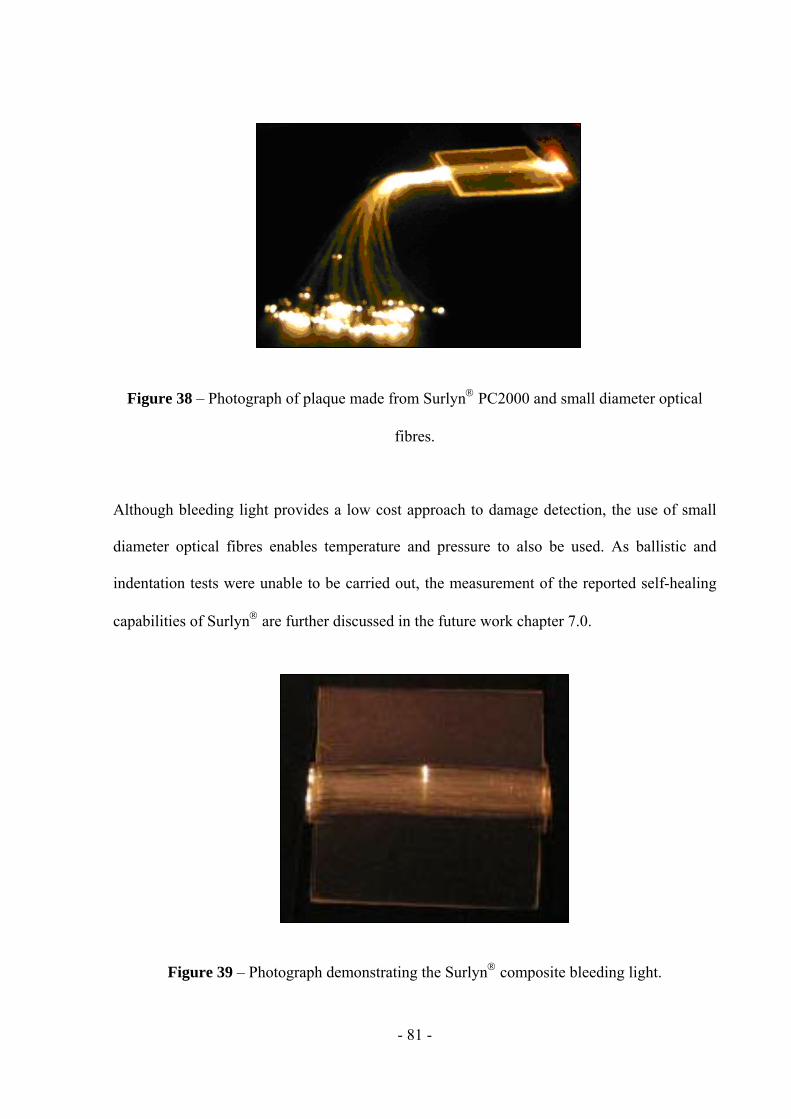
- 81 -
Figure 38 – Photograph of plaque made from Surlyn PC2000 and small diameter optical
fibres.
Although bleeding light provides a low cost approach to damage detection, the use of small
diameter optical fibres enables temperature and pressure to also be used. As ballistic and
indentation tests were unable to be carried out, the measurement of the reported self-healing
capabilities of Surlyn are further discussed in the future work chapter 7.0.
Figure 39 – Photograph demonstrating the Surlyn composite bleeding light.
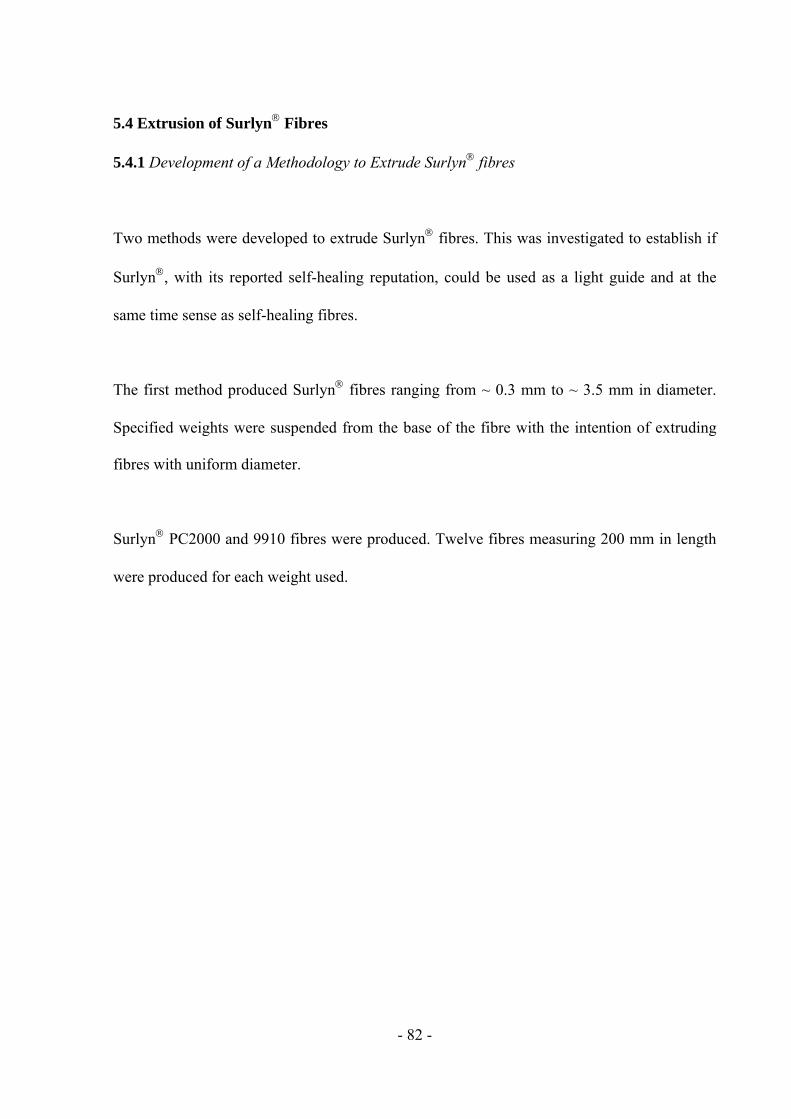
- 82 -
5.4 Extrusion of Surlyn Fibres
5.4.1 Development of a Methodology to Extrude Surlyn fibres
Two methods were developed to extrude Surlyn fibres. This was investigated to establish if
Surlyn, with its reported self-healing reputation, could be used as a light guide and at the
same time sense as self-healing fibres.
The first method produced Surlyn fibres ranging from ~ 0.3 mm to ~ 3.5 mm in diameter.
Specified weights were suspended from the base of the fibre with the intention of extruding
fibres with uniform diameter.
Surlyn PC2000 and 9910 fibres were produced. Twelve fibres measuring 200 mm in length
were produced for each weight used.
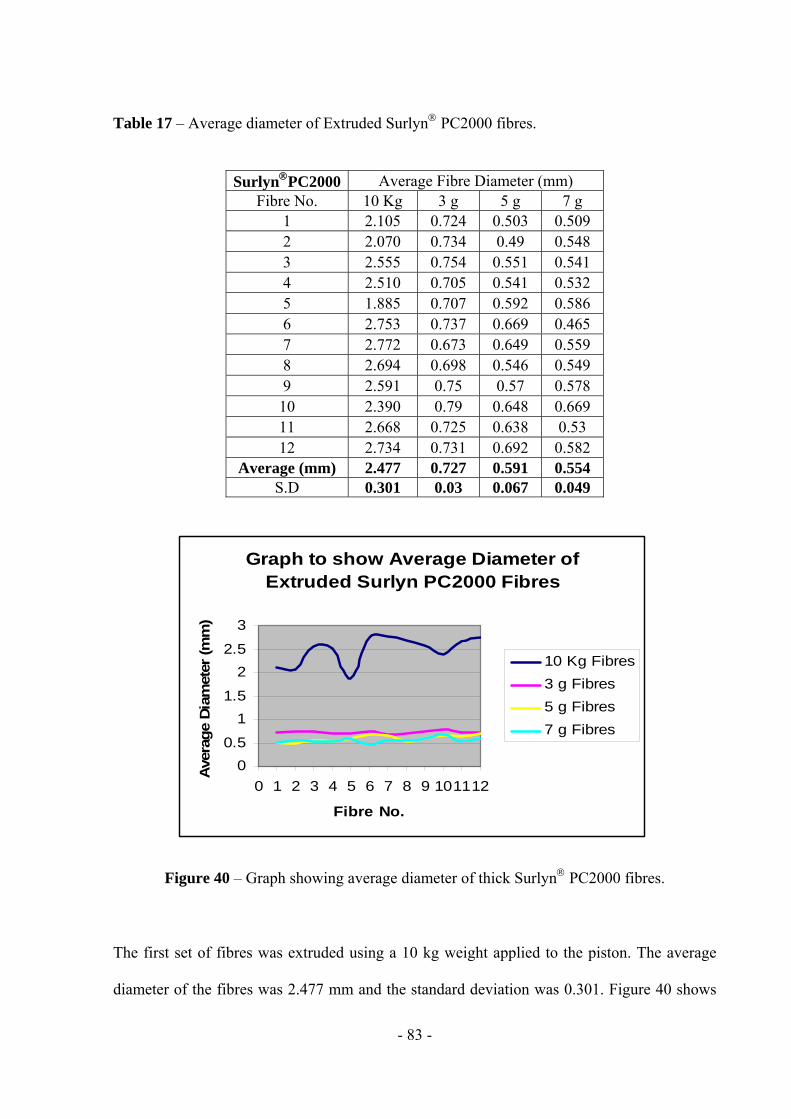
- 83 -
Table 17 – Average diameter of Extruded Surlyn PC2000 fibres.
Figure 40 – Graph showing average diameter of thick Surlyn PC2000 fibres.
The first set of fibres was extruded using a 10 kg weight applied to the piston. The average
diameter of the fibres was 2.477 mm and the standard deviation was 0.301. Figure 40 shows
SurlynPC2000 Average Fibre Diameter (mm) Fibre No. 10 Kg 3 g 5 g 7 g
1 2.105 0.724 0.503 0.509 2 2.070 0.734 0.49 0.548 3 2.555 0.754 0.551 0.541 4 2.510 0.705 0.541 0.532 5 1.885 0.707 0.592 0.586 6 2.753 0.737 0.669 0.465 7 2.772 0.673 0.649 0.559 8 2.694 0.698 0.546 0.549 9 2.591 0.75 0.57 0.578 10 2.390 0.79 0.648 0.669 11 2.668 0.725 0.638 0.53 12 2.734 0.731 0.692 0.582
Average (mm) 2.477 0.727 0.591 0.554 S.D 0.301 0.03 0.067 0.049
Graph to show Average Diameter of Extruded Surlyn PC2000 Fibres
0
0.5
1
1.5
2
2.5
3
0 1 2 3 4 5 6 7 8 9 101112
Fibre No.
Ave
rage
Dia
met
er (m
m)
10 Kg Fibres
3 g Fibres
5 g Fibres
7 g Fibres
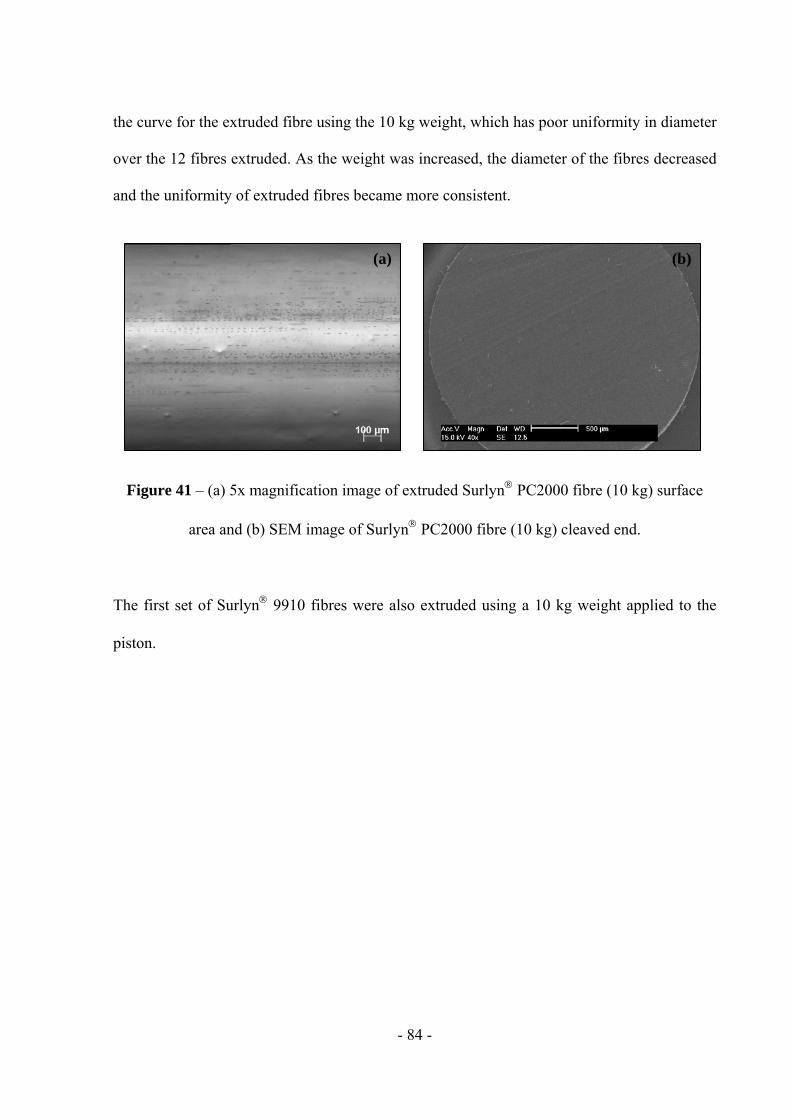
- 84 -
the curve for the extruded fibre using the 10 kg weight, which has poor uniformity in diameter
over the 12 fibres extruded. As the weight was increased, the diameter of the fibres decreased
and the uniformity of extruded fibres became more consistent.
Figure 41 – (a) 5x magnification image of extruded Surlyn PC2000 fibre (10 kg) surface
area and (b) SEM image of Surlyn PC2000 fibre (10 kg) cleaved end.
The first set of Surlyn 9910 fibres were also extruded using a 10 kg weight applied to the
piston.
(a) (b)
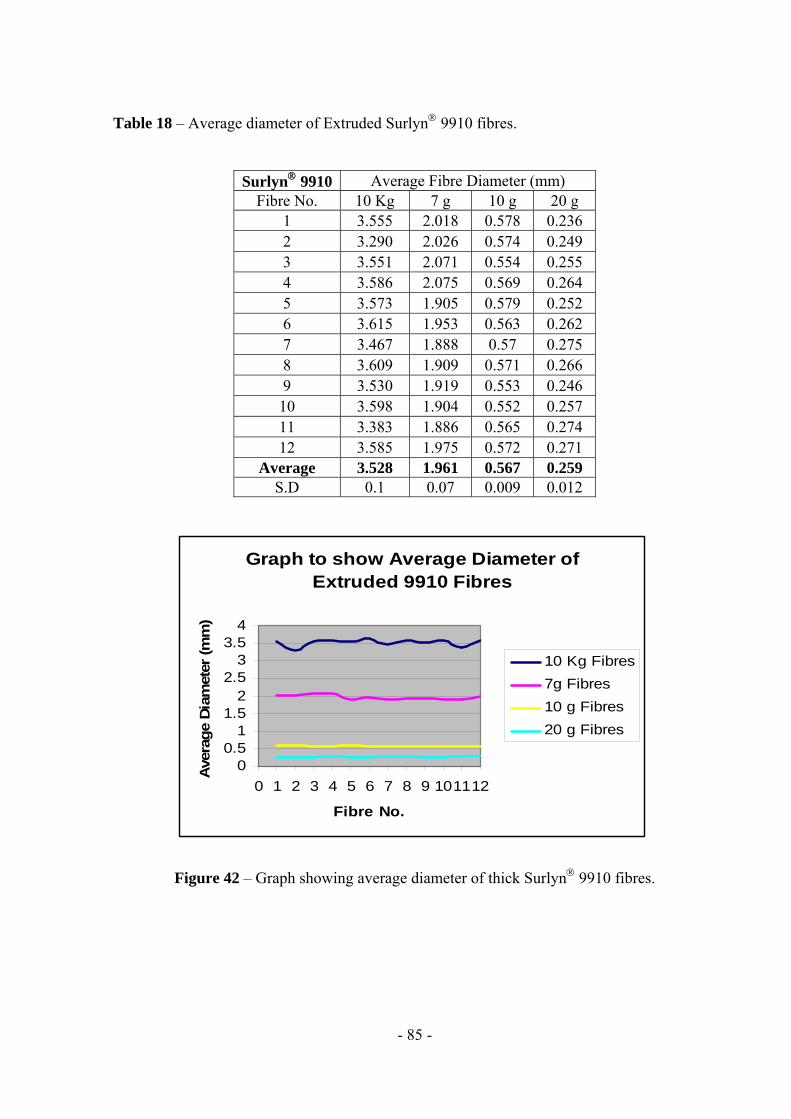
- 85 -
Table 18 – Average diameter of Extruded Surlyn 9910 fibres.
Figure 42 – Graph showing average diameter of thick Surlyn 9910 fibres.
Surlyn 9910 Average Fibre Diameter (mm) Fibre No. 10 Kg 7 g 10 g 20 g
1 3.555 2.018 0.578 0.236 2 3.290 2.026 0.574 0.249 3 3.551 2.071 0.554 0.255 4 3.586 2.075 0.569 0.264 5 3.573 1.905 0.579 0.252 6 3.615 1.953 0.563 0.262 7 3.467 1.888 0.57 0.275 8 3.609 1.909 0.571 0.266 9 3.530 1.919 0.553 0.246 10 3.598 1.904 0.552 0.257 11 3.383 1.886 0.565 0.274 12 3.585 1.975 0.572 0.271
Average 3.528 1.961 0.567 0.259 S.D 0.1 0.07 0.009 0.012
Graph to show Average Diameter of Extruded 9910 Fibres
00.5
11.5
22.5
33.5
4
0 1 2 3 4 5 6 7 8 9 101112
Fibre No.
Ave
rage
Dia
met
er (m
m)
10 Kg Fibres
7g Fibres
10 g Fibres
20 g Fibres
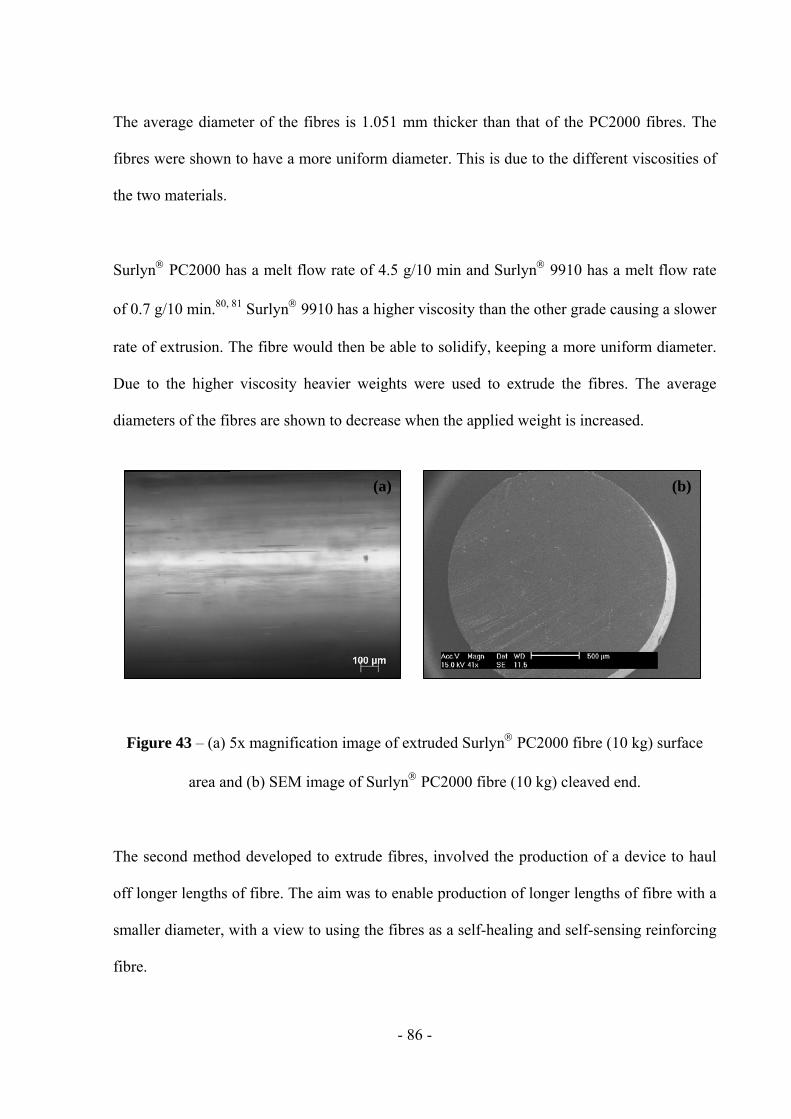
- 86 -
The average diameter of the fibres is 1.051 mm thicker than that of the PC2000 fibres. The
fibres were shown to have a more uniform diameter. This is due to the different viscosities of
the two materials.
Surlyn PC2000 has a melt flow rate of 4.5 g/10 min and Surlyn 9910 has a melt flow rate
of 0.7 g/10 min.80, 81 Surlyn 9910 has a higher viscosity than the other grade causing a slower
rate of extrusion. The fibre would then be able to solidify, keeping a more uniform diameter.
Due to the higher viscosity heavier weights were used to extrude the fibres. The average
diameters of the fibres are shown to decrease when the applied weight is increased.
Figure 43 – (a) 5x magnification image of extruded Surlyn PC2000 fibre (10 kg) surface
area and (b) SEM image of Surlyn PC2000 fibre (10 kg) cleaved end.
The second method developed to extrude fibres, involved the production of a device to haul
off longer lengths of fibre. The aim was to enable production of longer lengths of fibre with a
smaller diameter, with a view to using the fibres as a self-healing and self-sensing reinforcing
fibre.
(a) (b)
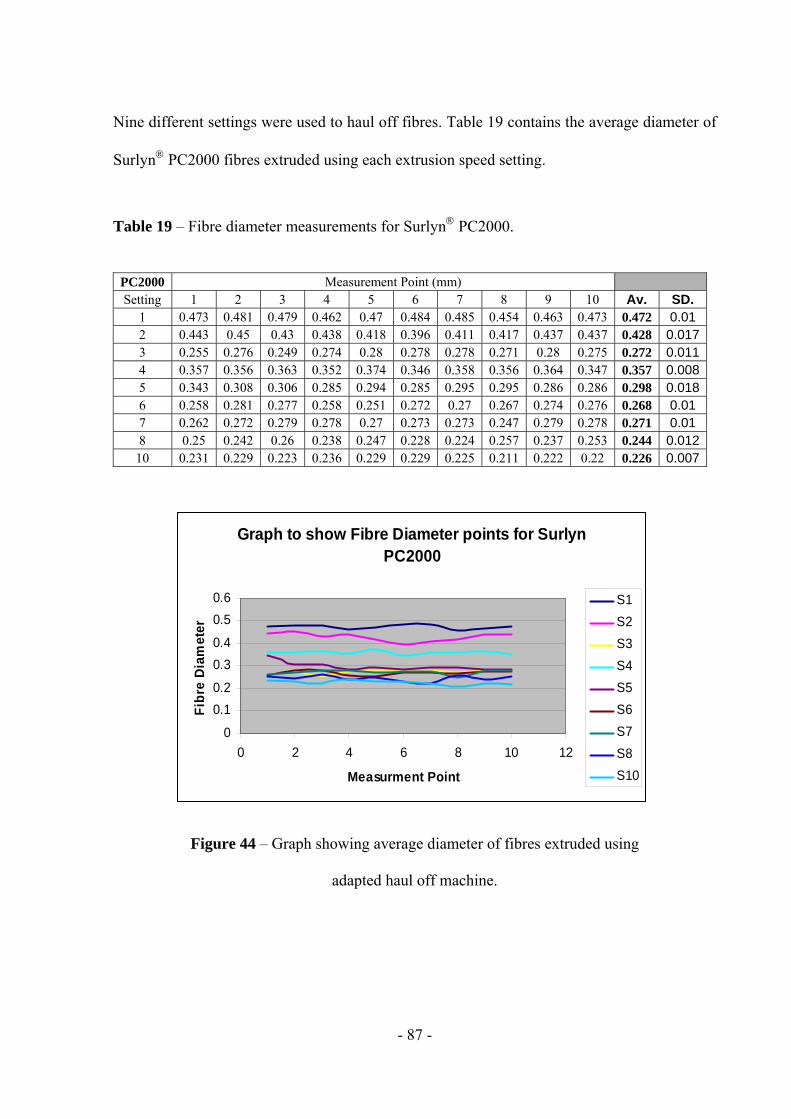
- 87 -
Nine different settings were used to haul off fibres. Table 19 contains the average diameter of
Surlyn PC2000 fibres extruded using each extrusion speed setting.
Table 19 – Fibre diameter measurements for Surlyn PC2000.
PC2000 Measurement Point (mm) Setting 1 2 3 4 5 6 7 8 9 10 Av. SD.
1 0.473 0.481 0.479 0.462 0.47 0.484 0.485 0.454 0.463 0.473 0.472 0.01 2 0.443 0.45 0.43 0.438 0.418 0.396 0.411 0.417 0.437 0.437 0.428 0.0173 0.255 0.276 0.249 0.274 0.28 0.278 0.278 0.271 0.28 0.275 0.272 0.0114 0.357 0.356 0.363 0.352 0.374 0.346 0.358 0.356 0.364 0.347 0.357 0.0085 0.343 0.308 0.306 0.285 0.294 0.285 0.295 0.295 0.286 0.286 0.298 0.0186 0.258 0.281 0.277 0.258 0.251 0.272 0.27 0.267 0.274 0.276 0.268 0.01 7 0.262 0.272 0.279 0.278 0.27 0.273 0.273 0.247 0.279 0.278 0.271 0.01 8 0.25 0.242 0.26 0.238 0.247 0.228 0.224 0.257 0.237 0.253 0.244 0.012
10 0.231 0.229 0.223 0.236 0.229 0.229 0.225 0.211 0.222 0.22 0.226 0.007
Figure 44 – Graph showing average diameter of fibres extruded using
adapted haul off machine.
Graph to show Fibre Diameter points for Surlyn PC2000
0
0.1
0.2
0.3
0.4
0.5
0.6
0 2 4 6 8 10 12
Measurment Point
Fib
re D
iam
eter
S1
S2
S3
S4
S5
S6
S7
S8
S10

- 88 -
The main trend shows that as the speed of the machine extruding fibres increases, the
diameter of the fibres decreases. The diameters of the fibres ranged from 0.472 mm to 0.226
mm.
The speed and amount of fibre that can be hauled off is very advantageous in enabling a quick
and efficient way of collecting fibres of required lengths and diameters. Method two enables
smaller diameter fibres to be extruded with a view to incorporating them into a composite
material. The standard deviation results and the curves present in figure 44, show that the
uniformity of the fibres is more consistent than those fibres that were extruded using weights.
Figure 45 – (a) 5x magnification image of extruded thin Surlyn PC2000 fibre (Setting six)
surface area and (b) SEM image of Surlyn PC2000 fibre (Setting six) cleaved end.
(a) (b)
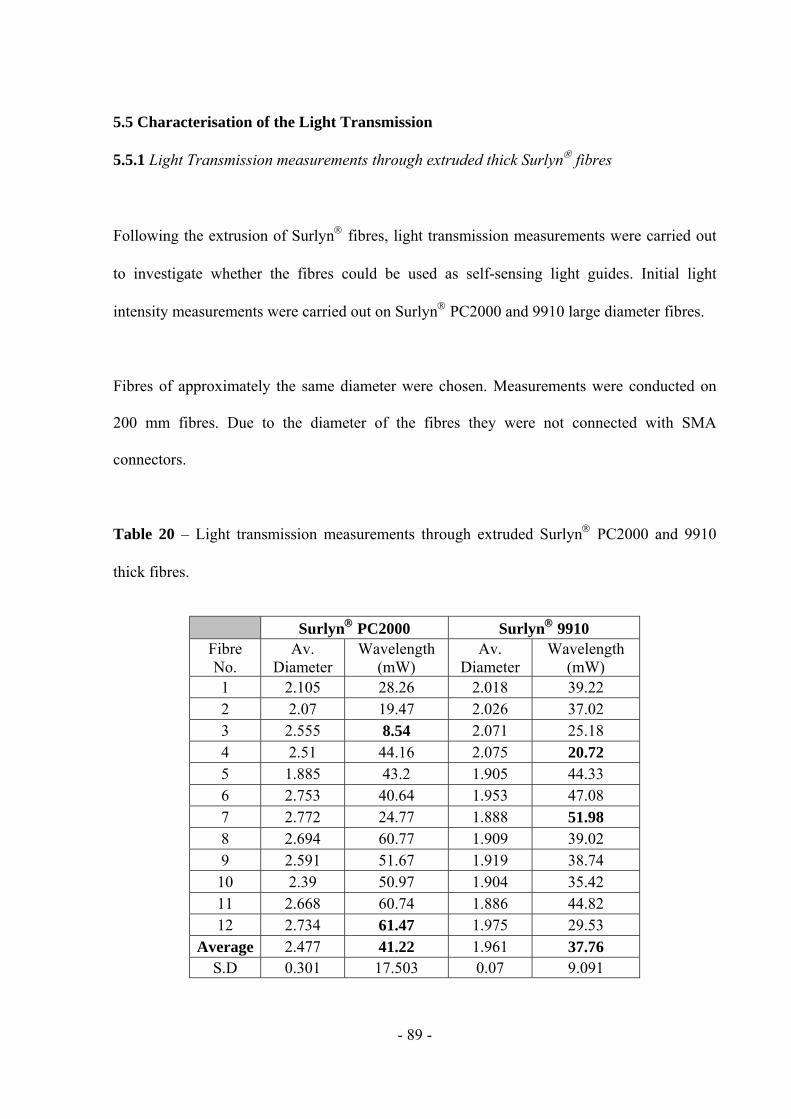
- 89 -
5.5 Characterisation of the Light Transmission
5.5.1 Light Transmission measurements through extruded thick Surlyn fibres
Following the extrusion of Surlyn fibres, light transmission measurements were carried out
to investigate whether the fibres could be used as self-sensing light guides. Initial light
intensity measurements were carried out on Surlyn PC2000 and 9910 large diameter fibres.
Fibres of approximately the same diameter were chosen. Measurements were conducted on
200 mm fibres. Due to the diameter of the fibres they were not connected with SMA
connectors.
Table 20 – Light transmission measurements through extruded Surlyn PC2000 and 9910
thick fibres.
Surlyn PC2000 Surlyn 9910 Fibre No.
Av. Diameter
Wavelength (mW)
Av. Diameter
Wavelength (mW)
1 2.105 28.26 2.018 39.22 2 2.07 19.47 2.026 37.02 3 2.555 8.54 2.071 25.18 4 2.51 44.16 2.075 20.72 5 1.885 43.2 1.905 44.33 6 2.753 40.64 1.953 47.08 7 2.772 24.77 1.888 51.98 8 2.694 60.77 1.909 39.02 9 2.591 51.67 1.919 38.74 10 2.39 50.97 1.904 35.42 11 2.668 60.74 1.886 44.82 12 2.734 61.47 1.975 29.53
Average 2.477 41.22 1.961 37.76 S.D 0.301 17.503 0.07 9.091
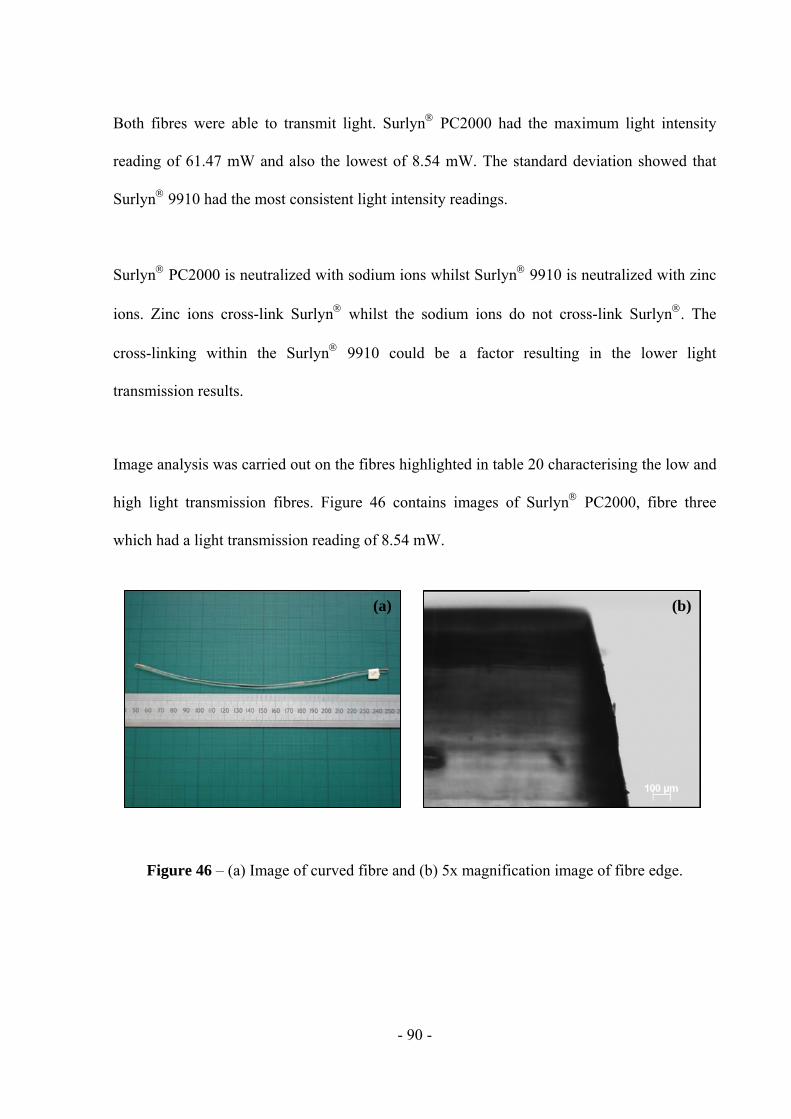
- 90 -
Both fibres were able to transmit light. Surlyn PC2000 had the maximum light intensity
reading of 61.47 mW and also the lowest of 8.54 mW. The standard deviation showed that
Surlyn 9910 had the most consistent light intensity readings.
Surlyn PC2000 is neutralized with sodium ions whilst Surlyn 9910 is neutralized with zinc
ions. Zinc ions cross-link Surlyn whilst the sodium ions do not cross-link Surlyn. The
cross-linking within the Surlyn 9910 could be a factor resulting in the lower light
transmission results.
Image analysis was carried out on the fibres highlighted in table 20 characterising the low and
high light transmission fibres. Figure 46 contains images of Surlyn PC2000, fibre three
which had a light transmission reading of 8.54 mW.
Figure 46 – (a) Image of curved fibre and (b) 5x magnification image of fibre edge.
(a) (b)
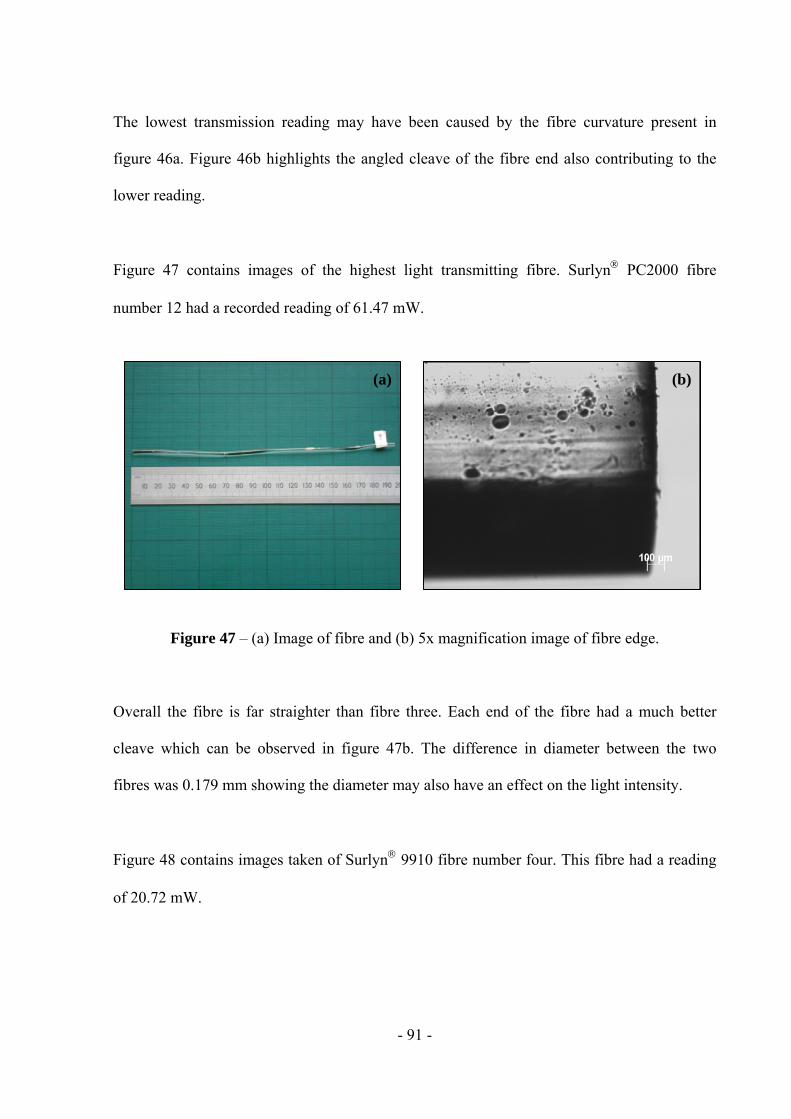
- 91 -
The lowest transmission reading may have been caused by the fibre curvature present in
figure 46a. Figure 46b highlights the angled cleave of the fibre end also contributing to the
lower reading.
Figure 47 contains images of the highest light transmitting fibre. Surlyn PC2000 fibre
number 12 had a recorded reading of 61.47 mW.
Figure 47 – (a) Image of fibre and (b) 5x magnification image of fibre edge.
Overall the fibre is far straighter than fibre three. Each end of the fibre had a much better
cleave which can be observed in figure 47b. The difference in diameter between the two
fibres was 0.179 mm showing the diameter may also have an effect on the light intensity.
Figure 48 contains images taken of Surlyn 9910 fibre number four. This fibre had a reading
of 20.72 mW.
(a) (b)
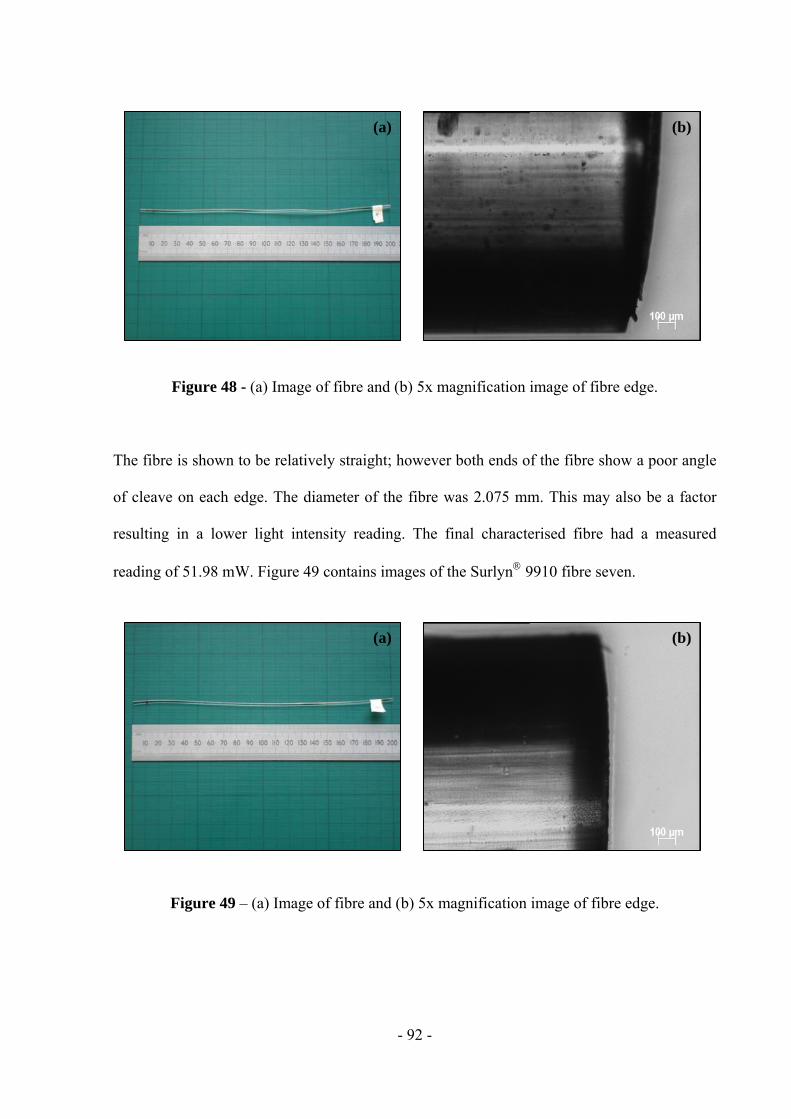
- 92 -
Figure 48 - (a) Image of fibre and (b) 5x magnification image of fibre edge.
The fibre is shown to be relatively straight; however both ends of the fibre show a poor angle
of cleave on each edge. The diameter of the fibre was 2.075 mm. This may also be a factor
resulting in a lower light intensity reading. The final characterised fibre had a measured
reading of 51.98 mW. Figure 49 contains images of the Surlyn 9910 fibre seven.
Figure 49 – (a) Image of fibre and (b) 5x magnification image of fibre edge.
(a) (b)
(a) (b)
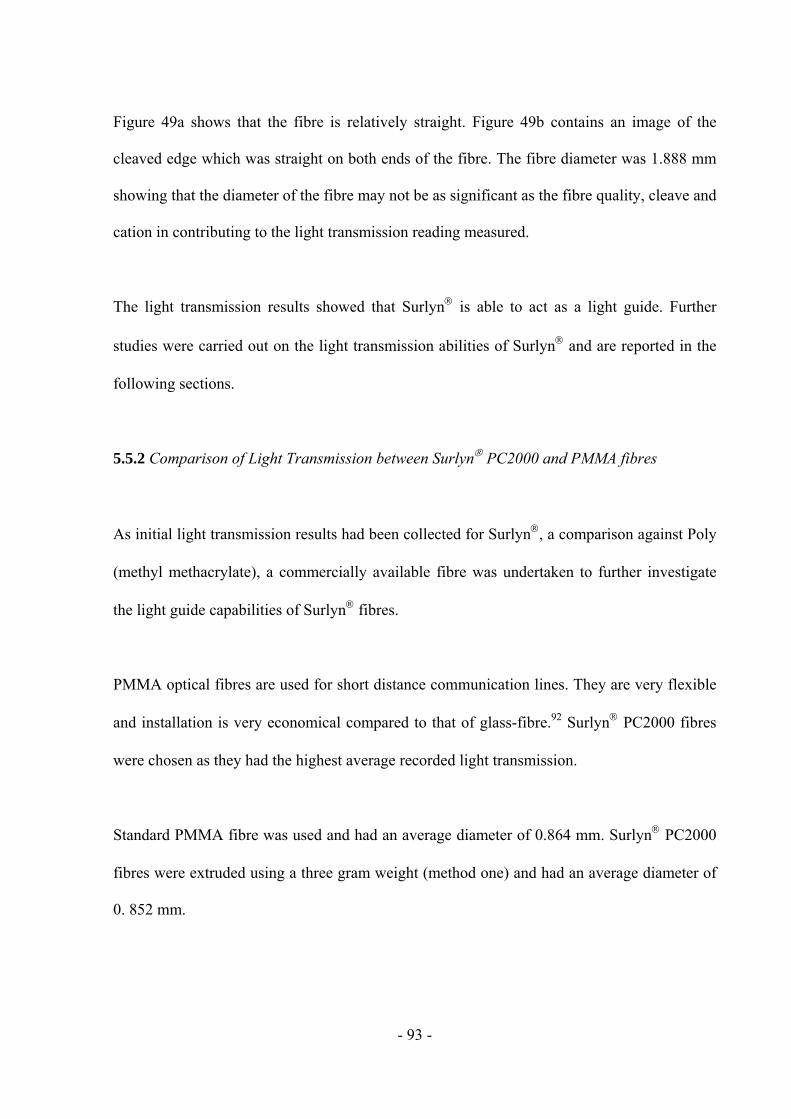
- 93 -
Figure 49a shows that the fibre is relatively straight. Figure 49b contains an image of the
cleaved edge which was straight on both ends of the fibre. The fibre diameter was 1.888 mm
showing that the diameter of the fibre may not be as significant as the fibre quality, cleave and
cation in contributing to the light transmission reading measured.
The light transmission results showed that Surlyn is able to act as a light guide. Further
studies were carried out on the light transmission abilities of Surlyn and are reported in the
following sections.
5.5.2 Comparison of Light Transmission between Surlyn PC2000 and PMMA fibres
As initial light transmission results had been collected for Surlyn, a comparison against Poly
(methyl methacrylate), a commercially available fibre was undertaken to further investigate
the light guide capabilities of Surlyn fibres.
PMMA optical fibres are used for short distance communication lines. They are very flexible
and installation is very economical compared to that of glass-fibre.92 Surlyn PC2000 fibres
were chosen as they had the highest average recorded light transmission.
Standard PMMA fibre was used and had an average diameter of 0.864 mm. Surlyn PC2000
fibres were extruded using a three gram weight (method one) and had an average diameter of
0. 852 mm.
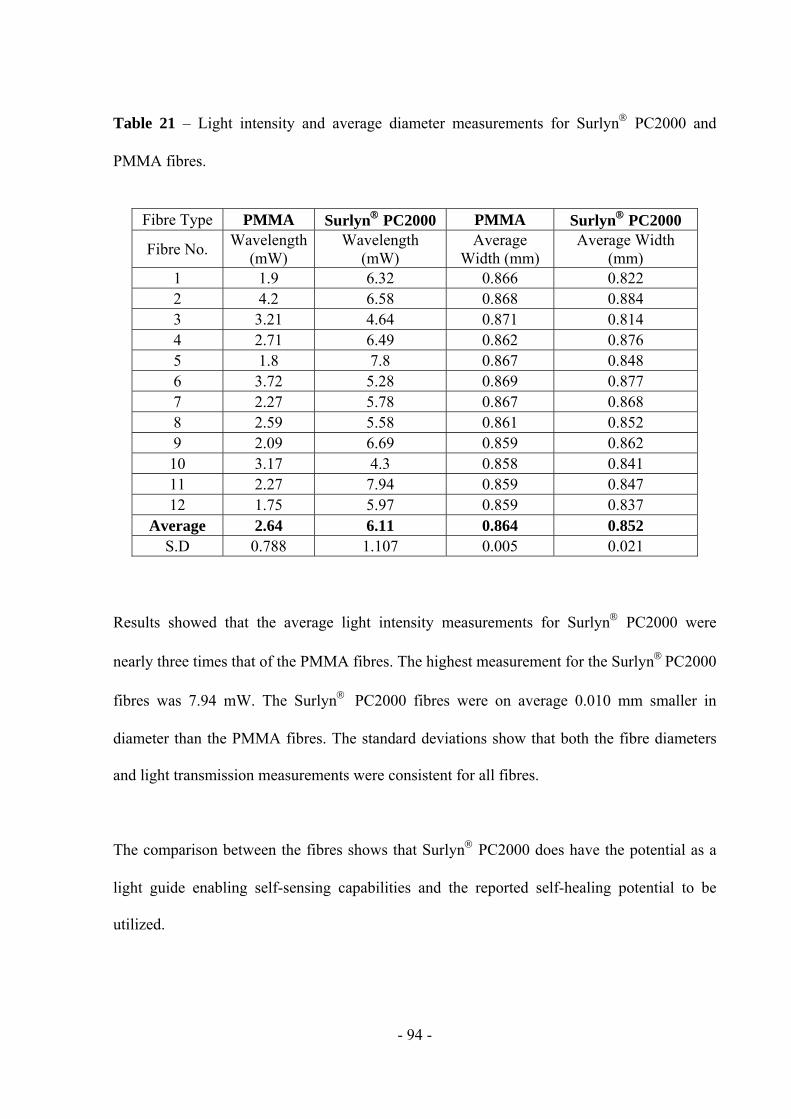
- 94 -
Table 21 – Light intensity and average diameter measurements for Surlyn PC2000 and
PMMA fibres.
Results showed that the average light intensity measurements for Surlyn PC2000 were
nearly three times that of the PMMA fibres. The highest measurement for the SurlynPC2000
fibres was 7.94 mW. The Surlyn PC2000 fibres were on average 0.010 mm smaller in
diameter than the PMMA fibres. The standard deviations show that both the fibre diameters
and light transmission measurements were consistent for all fibres.
The comparison between the fibres shows that Surlyn PC2000 does have the potential as a
light guide enabling self-sensing capabilities and the reported self-healing potential to be
utilized.
Fibre Type PMMA Surlyn PC2000 PMMA Surlyn PC2000
Fibre No. Wavelength
(mW) Wavelength
(mW) Average
Width (mm) Average Width
(mm) 1 1.9 6.32 0.866 0.822 2 4.2 6.58 0.868 0.884 3 3.21 4.64 0.871 0.814 4 2.71 6.49 0.862 0.876 5 1.8 7.8 0.867 0.848 6 3.72 5.28 0.869 0.877 7 2.27 5.78 0.867 0.868 8 2.59 5.58 0.861 0.852 9 2.09 6.69 0.859 0.862 10 3.17 4.3 0.858 0.841 11 2.27 7.94 0.859 0.847 12 1.75 5.97 0.859 0.837
Average 2.64 6.11 0.864 0.852 S.D 0.788 1.107 0.005 0.021
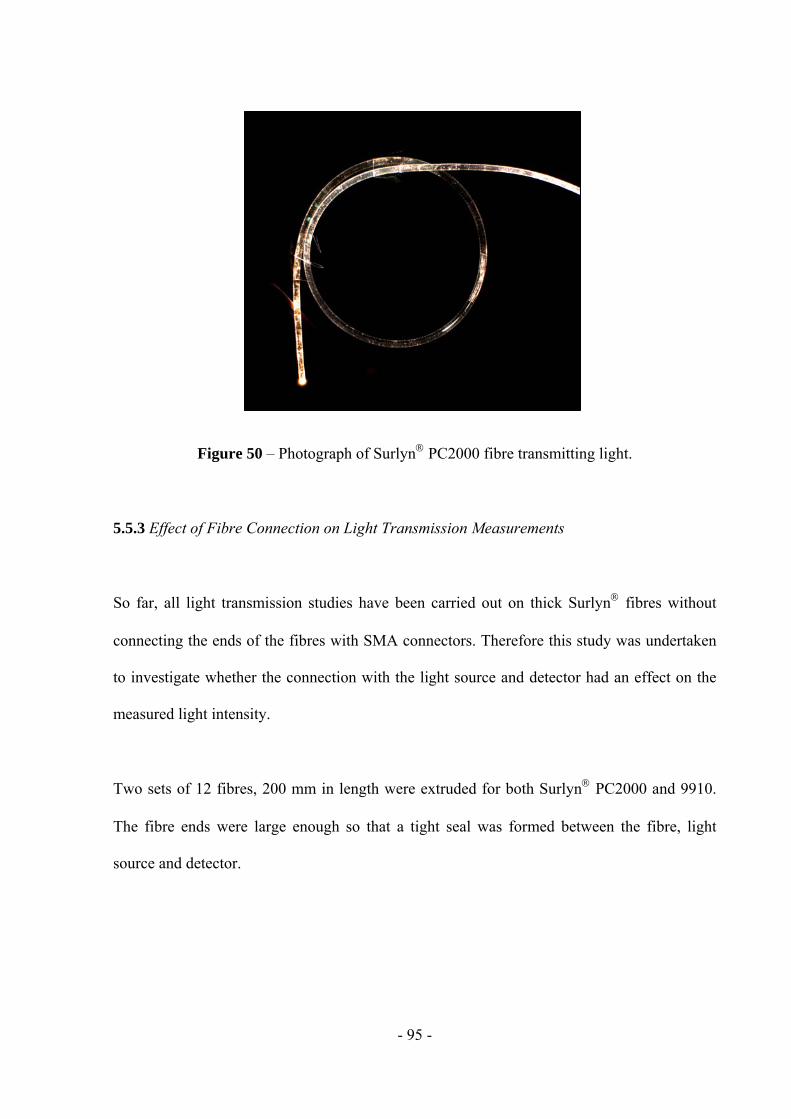
- 95 -
Figure 50 – Photograph of Surlyn PC2000 fibre transmitting light.
5.5.3 Effect of Fibre Connection on Light Transmission Measurements
So far, all light transmission studies have been carried out on thick Surlyn fibres without
connecting the ends of the fibres with SMA connectors. Therefore this study was undertaken
to investigate whether the connection with the light source and detector had an effect on the
measured light intensity.
Two sets of 12 fibres, 200 mm in length were extruded for both Surlyn PC2000 and 9910.
The fibre ends were large enough so that a tight seal was formed between the fibre, light
source and detector.
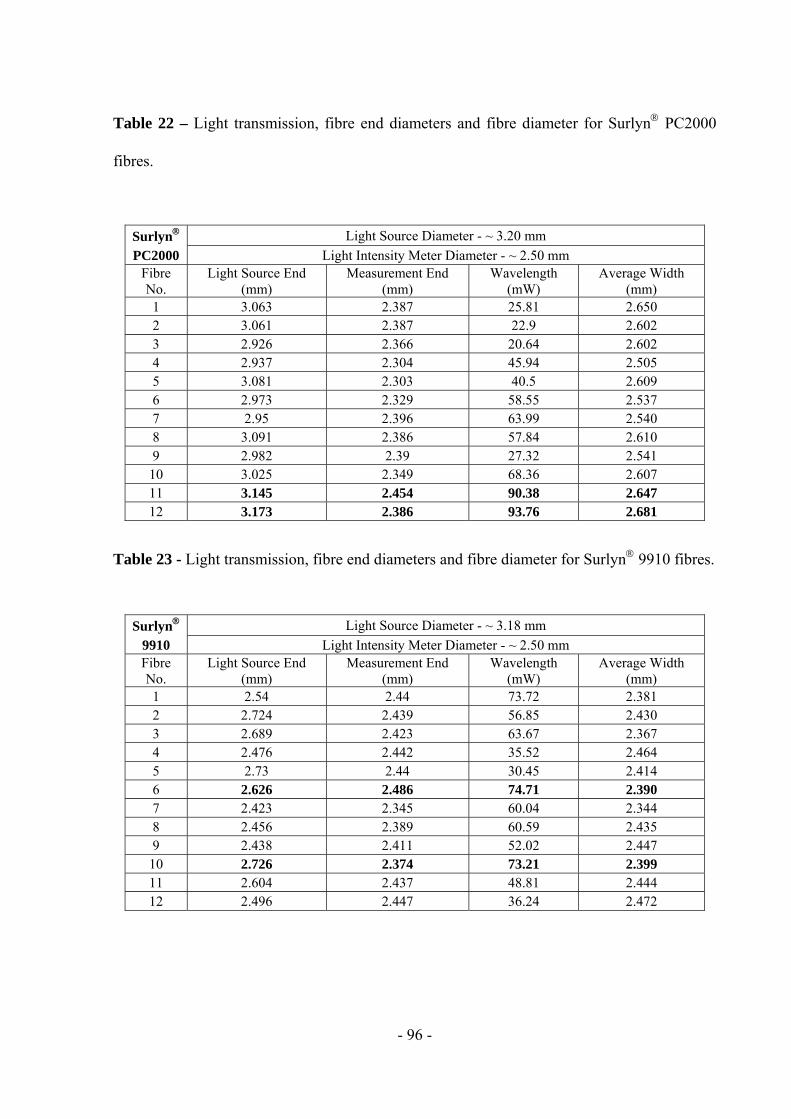
- 96 -
Table 22 – Light transmission, fibre end diameters and fibre diameter for Surlyn PC2000
fibres.
Surlyn Light Source Diameter - ~ 3.20 mm
PC2000 Light Intensity Meter Diameter - ~ 2.50 mm Fibre No.
Light Source End (mm)
Measurement End (mm)
Wavelength (mW)
Average Width (mm)
1 3.063 2.387 25.81 2.650 2 3.061 2.387 22.9 2.602 3 2.926 2.366 20.64 2.602 4 2.937 2.304 45.94 2.505 5 3.081 2.303 40.5 2.609 6 2.973 2.329 58.55 2.537 7 2.95 2.396 63.99 2.540 8 3.091 2.386 57.84 2.610 9 2.982 2.39 27.32 2.541
10 3.025 2.349 68.36 2.607 11 3.145 2.454 90.38 2.647 12 3.173 2.386 93.76 2.681
Table 23 - Light transmission, fibre end diameters and fibre diameter for Surlyn 9910 fibres.
Surlyn Light Source Diameter - ~ 3.18 mm
9910 Light Intensity Meter Diameter - ~ 2.50 mm Fibre No.
Light Source End (mm)
Measurement End (mm)
Wavelength (mW)
Average Width (mm)
1 2.54 2.44 73.72 2.381 2 2.724 2.439 56.85 2.430 3 2.689 2.423 63.67 2.367 4 2.476 2.442 35.52 2.464 5 2.73 2.44 30.45 2.414 6 2.626 2.486 74.71 2.390 7 2.423 2.345 60.04 2.344 8 2.456 2.389 60.59 2.435 9 2.438 2.411 52.02 2.447
10 2.726 2.374 73.21 2.399 11 2.604 2.437 48.81 2.444 12 2.496 2.447 36.24 2.472
- 97 -
The highlighted figures in table 22 show that fibres 11 and 12 have the largest diameters and
therefore the closest fit to the light source diameter. These two fibres also had the strongest
light intensity measurements recorded at 90.38 mW and 93.76 mW.
Surlyn 9910 fibres also followed the same trend. As shown in table 23, the two fibres
highlighted with the greatest diameter ends also had the greatest light intensities. These were
73.21 mW and 74.71 mW. From the results it is clear that the fibre connection with the light
source and detector does have an effect on light transmission.
Due to the recorded impact of the fibre connection; methods of connecting the fibres and
further light transmission studies on the thin Surlyn fibres were investigated and are reported
in the following sections.
5.5.4 Light Transmission Distance Measurements for Extruded Thin Surlyn fibres
The following studies investigate the light transmission capabilities of the thin fibres and
whether the thin fibres could be used as self-sensing light guides. This initial study on the
Surlyn fibres which were hauled off in longer lengths was to investigate the distance the
fibre could guide light. Both Surlyn PC2000 and 9910 fibres were studied. The initial set of
results collected were on fibres extruded using settings one - three. Fibres were 20 cm in
length.
- 98 -
Table 24 – Average diameter and light guide distance for settings one - three Surlyn PC2000
and 9910 fibres.
Visual analysis was used to detect the light guide distance. The Surlyn PC2000 fibres all
guided light efficiently over the 20 cm length and a strong orange glow was apparent at the
end of the fibre. This is due to the light reacting with sodium ions present in the material.
With reference to table 24, the greatest distance the Surlyn 9910 fibres guided light was ~ 5
cm. The lower light guide results recorded for Surlyn9910 may be due to the cross-linking
present in the Surlyn caused by the presence of the zinc ions. As Surlyn PC2000 fibres
showed the potential of transmitting light over distances greater than 20 cm only Surlyn
PC2000 fibres were studied further.
Surlyn PC2000 Av. Diameter (mm) S.D Light Guide Distance (cm) Setting 1 (33 RPM) 0.472 0.005 > 20 cm Setting 2 (48 RPM) 0.428 0.004 > 20 cm Setting 3 (62 RPM) 0.272 0.009 > 20 cm
Surlyn 9910 Setting 1 (33 RPM) 0.294 0.008 ~ 5 cm Setting 2 (48 RPM) 0.309 0.009 ~ 5 cm Setting 3 (62 RPM) 0.248 0.006 ~2 cm
Surlyn PC2000 Av. Diameter (mm) S.D Light Guide Distance (cm)
- 99 -
Table 25 - Average diameter and light guide distance for thin Surlyn PC2000 fibres.
Table 25 conveys the results collected and the setting six fibre guided light the longest
distance of 248.5 cm. The initial trend showed that as fibre diameter decreased the light
transmission distances increased. However fibre five only guided light ~ 75 cm and this was
due to the fibre bleeding light along its surface area. From setting seven – ten the fibre
diameter began to decrease causing the light guide distance to also decrease. The standard
deviation showed that the fibres had a uniform diameter.
Although the thin diameter fibres were not connected with SMA connectors, the results
clearly show that the thin Surlyn PC2000 fibres are able to transmit light. The following
sections report different methods of connecting the fibre ends and also further investigate the
light transmission characteristics of Surlyn PC2000 thin fibres.
5.5.5 Fibre Connection Methods using SMA Connectors
Setting 1 (33 RPM) 0.472 0.01 ~ 120 Setting 2 (48 RPM) 0.428 0.017 ~140 Setting 3 (62 RPM) 0.272 0.011 ~ 150 Setting 4 (77 RPM) 0.357 0.008 ~ 190 Setting 5 (92 RPM) 0.298 0.018 ~ 75 Setting 6 (116 RPM) 0.268 0.01 ~ 248.5 Setting 7 (122 RPM) 0.271 0.01 ~ 175 Setting 8 (137 RPM) 0.244 0.012 ~ 155 Setting 10 (168 RPM) 0.226 0.007 ~ 130
- 100 -
As previously reported in section 5.5.3 the fibre connection does have a significant effect on
the recorded light transmission through the Surlyn fibres. Therefore three methods were used
to connect the Surlyn PC2000 thin fibres with SMA connectors.
Once fibres were connected using the three methods previously described in section 4.6.5,
they were connected to a light source to ensure transmission of light through the fibre.
Following image analysis, methods two and three were unable to transmit light through the
fibre when Epotek 310m epoxy resin was used to secure the fibre. However method one was
successful when using the UV cure glue and this method was used for the remaining light
transmission studies on thin Surlyn PC2000 fibres.
Figure 51 – 10x magnification image of Surlyn PC2000 fibre transmitting light following
method one connection.
5.5.6 Light Transmission Measurements through Extruded Thin Surlyn fibres
Connected Fibre End Emitting
Light
- 101 -
As Surlyn PC2000 fibres were able to guide light and a method for connecting the fibre ends
was developed, three light transmission studies were carried out on the fibres to further
characterize the light transmission and self-sensing capabilities of the Surlyn PC2000 fibres.
Light transmission readings were taken once:
1) Both fibre ends were connected.
2) Both fibre ends were disconnected and reconnected.
3) Each connector was only connected halfway.
Four different lengths of fibre were subjected to each test and included 40 cm, 30 cm, 20 cm
and 10 cm fibres.
Table 26 – Light transmission readings for test one to three (N/R – no reading).
Surlyn PC2000 Fibre Extrusion Setting/Light Intensity Measurement (W)
Test 1 1 2 3 4 5 6 7 8 10
40 cm 6.24 1.26 253.6 nW 543.9 nW N/R 1.046 780.4 nW 230.9 nW N/R
30 cm 9.72 14.3 952.9 nW 5.73 N/R 5.501 2.819 1.422 N/R
20 cm 52.3 34.05 3.677 14.28 561.2 nW 6.625 6.442 7.154 129.8 nW
10 cm 95.3 88.2 19.26 21.41 2.431 17.74 25.06 25.61 2.249
Test 2
40 cm 6.26 1.25 237.3 nW 542.8 nW N/R 1.081 785.1 nW 234.9 nW N/R
30 cm 9.77 34.05 0.995 5.882 N/R 5.551 2.824 1.435 N/R
20 cm 52.7 33.97 3.622 14.22 586.9 nW 6.791 6.615 7.249 132.1 nW
10 cm 95.1 90.2 19.68 20.31 2.41 16.51 25.19 25.17 2.253
Test 3
40 cm 4.95 1.11 187.2 nW 450.9 nW N/R 0.945 696.4 nW 193.2 nW N/R
30 cm 7.26 88.2 700 nW 5.233 N/R 5.121 2.423 1.23 N/R
20 cm 42.7 28.22 2.9 11.29 462.4 nW 6.214 5.965 6.471 85.89 nW
10 cm 87.1 77.8 16.22 17.57 1.957 14.62 22.56 22.8 1.891
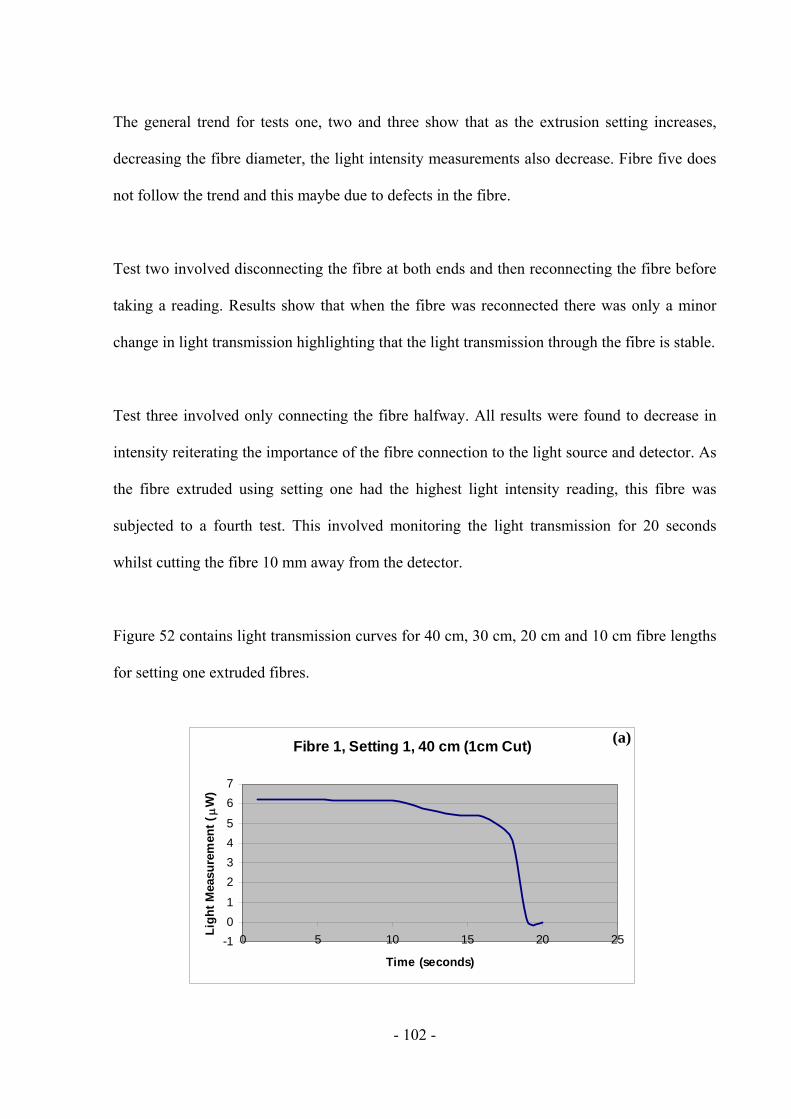
- 102 -
The general trend for tests one, two and three show that as the extrusion setting increases,
decreasing the fibre diameter, the light intensity measurements also decrease. Fibre five does
not follow the trend and this maybe due to defects in the fibre.
Test two involved disconnecting the fibre at both ends and then reconnecting the fibre before
taking a reading. Results show that when the fibre was reconnected there was only a minor
change in light transmission highlighting that the light transmission through the fibre is stable.
Test three involved only connecting the fibre halfway. All results were found to decrease in
intensity reiterating the importance of the fibre connection to the light source and detector. As
the fibre extruded using setting one had the highest light intensity reading, this fibre was
subjected to a fourth test. This involved monitoring the light transmission for 20 seconds
whilst cutting the fibre 10 mm away from the detector.
Figure 52 contains light transmission curves for 40 cm, 30 cm, 20 cm and 10 cm fibre lengths
for setting one extruded fibres.
Fibre 1, Setting 1, 40 cm (1cm Cut)
-1
0
1
2
3
4
5
6
7
0 5 10 15 20 25
Time (seconds)
Lig
ht
Mea
sure
men
t (
W)
(a)
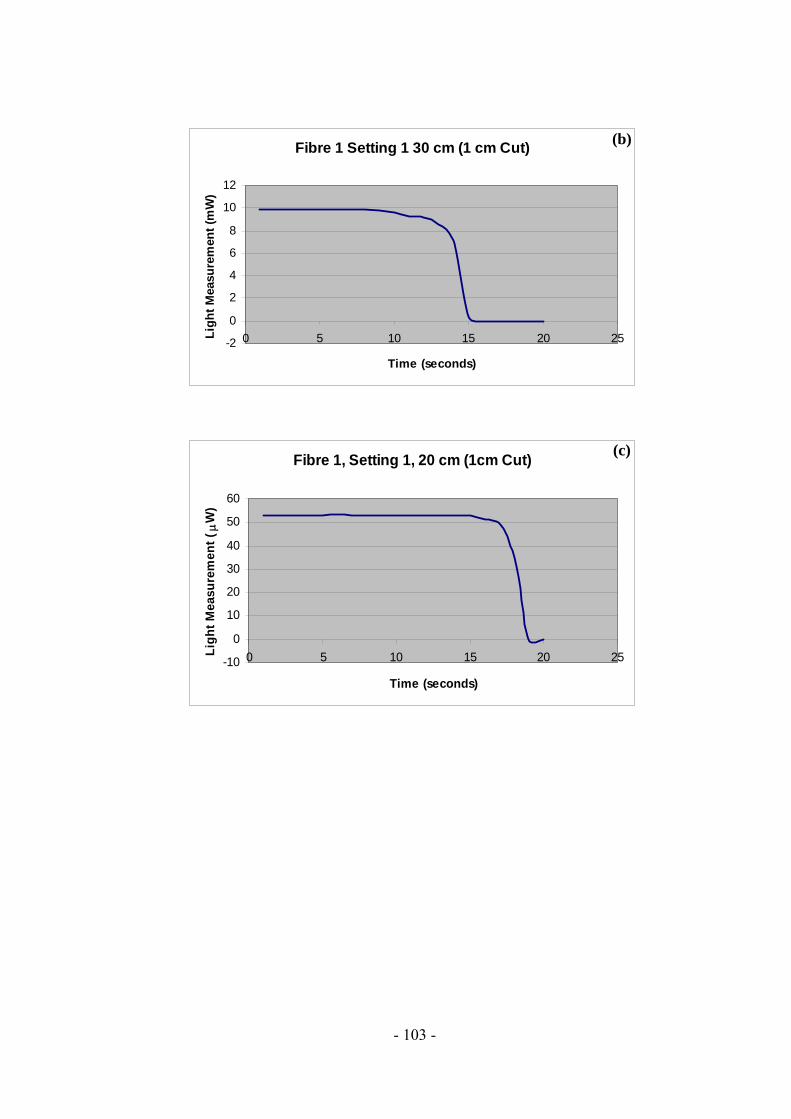
- 103 -
Fibre 1 Setting 1 30 cm (1 cm Cut)
-2
0
2
4
6
8
10
12
0 5 10 15 20 25
Time (seconds)
Lig
ht
Mea
sure
men
t (m
W)
Fibre 1, Setting 1, 20 cm (1cm Cut)
-10
0
10
20
30
40
50
60
0 5 10 15 20 25
Time (seconds)
Lig
ht
Mea
sure
men
t (
W)
(b)
(c)
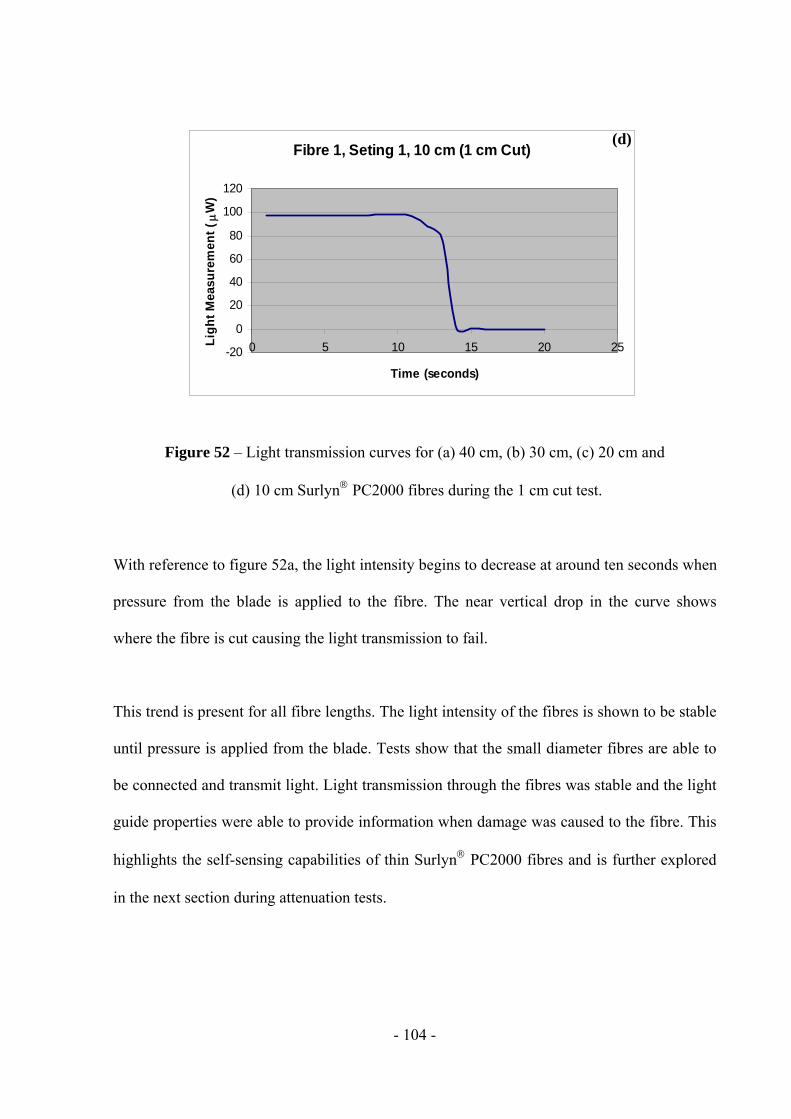
- 104 -
Figure 52 – Light transmission curves for (a) 40 cm, (b) 30 cm, (c) 20 cm and
(d) 10 cm Surlyn PC2000 fibres during the 1 cm cut test.
With reference to figure 52a, the light intensity begins to decrease at around ten seconds when
pressure from the blade is applied to the fibre. The near vertical drop in the curve shows
where the fibre is cut causing the light transmission to fail.
This trend is present for all fibre lengths. The light intensity of the fibres is shown to be stable
until pressure is applied from the blade. Tests show that the small diameter fibres are able to
be connected and transmit light. Light transmission through the fibres was stable and the light
guide properties were able to provide information when damage was caused to the fibre. This
highlights the self-sensing capabilities of thin Surlyn PC2000 fibres and is further explored
in the next section during attenuation tests.
Fibre 1, Seting 1, 10 cm (1 cm Cut)
-20
0
20
40
60
80
100
120
0 5 10 15 20 25
Time (seconds)
Lig
ht
Mea
sure
men
t (
W)
(d)
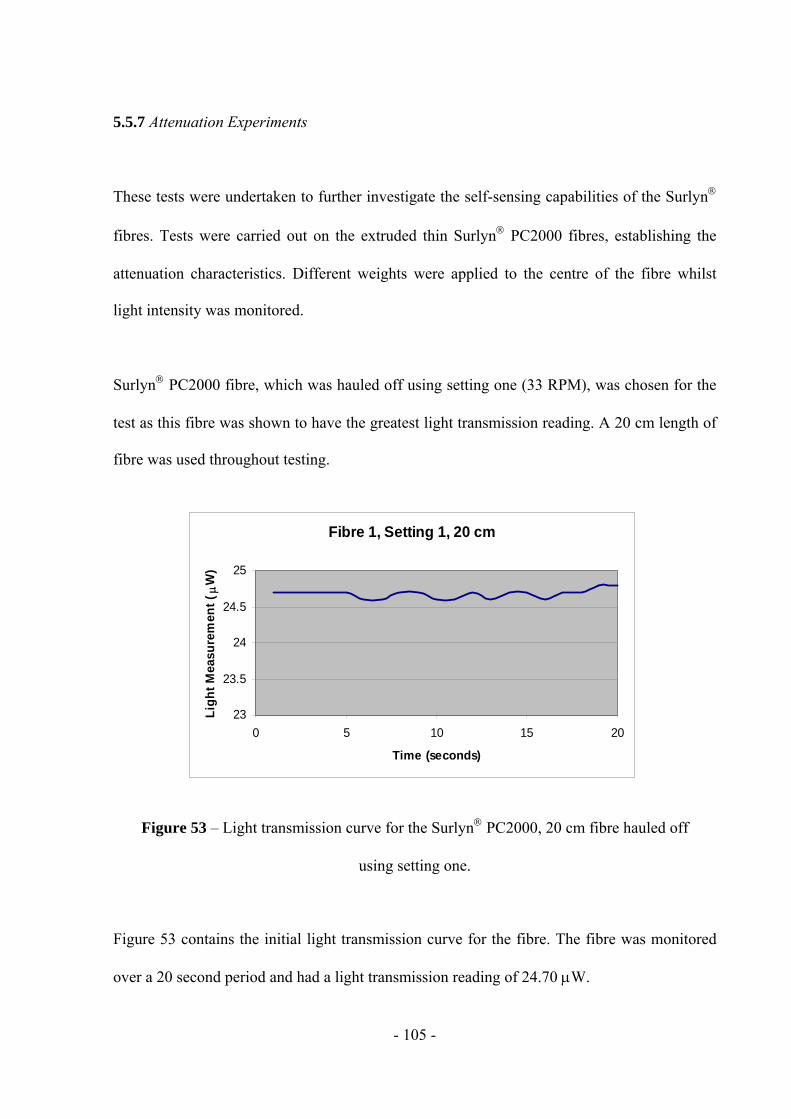
- 105 -
5.5.7 Attenuation Experiments
These tests were undertaken to further investigate the self-sensing capabilities of the Surlyn
fibres. Tests were carried out on the extruded thin Surlyn PC2000 fibres, establishing the
attenuation characteristics. Different weights were applied to the centre of the fibre whilst
light intensity was monitored.
Surlyn PC2000 fibre, which was hauled off using setting one (33 RPM), was chosen for the
test as this fibre was shown to have the greatest light transmission reading. A 20 cm length of
fibre was used throughout testing.
Figure 53 – Light transmission curve for the Surlyn PC2000, 20 cm fibre hauled off
using setting one.
Figure 53 contains the initial light transmission curve for the fibre. The fibre was monitored
over a 20 second period and had a light transmission reading of 24.70 W.
Fibre 1, Setting 1, 20 cm
23
23.5
24
24.5
25
0 5 10 15 20
Time (seconds)
Lig
ht
Mea
sure
men
t (
W)
- 106 -
Six different weights were applied to the fibre and the light transmission curves for each test
are presented below in figure 54.
Figure 54 – Light attenuation curves for Surlyn PC2000 fibre hauled off using setting 1; (a)
10 g, (b) 50 g , (c) 100 g, (d) 500 g, (e) 1000 g and (f) 2000 g.
Fibre 1, Setting 1, 20 cm (10g)
23.6523.7
23.7523.8
23.8523.9
23.9524
24.05
0 5 10 15 20 25 30
Time (seconds)
Lig
ht
Mea
sure
men
t (
W)
Fibre 1, Setting 1, 20 cm (50 g)
22.622.7
22.822.9
23
23.123.2
23.323.4
0 5 10 15 20 25 30
Time (seconds)
Lig
ht
Mea
sure
men
t (
W)
Fibre 1, Setting 1, 20 cm (100 g)
21.6
21.8
22
22.2
22.4
22.6
22.8
23
0 5 10 15 20 25 30
Time (seconds)
Lig
ht
Mea
sure
men
t (
W)
Fibre 1, Setting 1, 20 cm (500 g)
20
20.5
21
21.5
22
22.5
23
0 5 10 15 20 25 30
Time (seconds)
Lig
ht
Mea
sure
men
t (
W)
Fibre 1, Setting 1, 20 cm (1000 g)
15
17
19
21
23
0 5 10 15 20 25 30
Time (seconds)
Lig
ht
Mea
sure
men
t (
W)
Fibre 1, Setting 1, 20 cm (2000 g)
10
12
14
16
18
20
22
24
0 5 10 15 20 25 30
Time (seconds)
Lig
ht
Mea
sure
men
t (
W)
(a) (b)
(c) (d)
(e) (f)
- 107 -
Light transmission was monitored for 30 seconds and the weight was applied from 11 - 20
seconds. With reference to figure 54a, the light intensity is shown to drop 0.2W to 23.7 W
once the 10 gram weight was applied to the fibre. This was a 1 % drop in light transmission
for the fibre.
Results show that as the weight applied to the fibre is increased, the percentage loss in light
transmission is also shown to increase. The maximum weight that was applied to the fibre was
2000 grams causing a drop of 9.6 W. This is a 56 % loss in light transmission compared to
the 1 % loss when a 10 gram weight was applied.
The light attenuation curves also show that after each test the light transmission reading for
each fibre was shown to drop and was caused by the increased weight causing permanent
damage to the fibre.
The fibres have demonstrated the ability of sensing damage when used as fibre light guides.
Permanent damage to the fibre is caused when increasing weight is applied to the fibre
surface. The use of a coating maybe used to prolong the integrity of the fibres and future
studies would investigate whether the fibres also have reported self-healing capabilities and
are discussed further in the future work section.
- 108 -
5.6 Fibre Characterisation
Density and DSC experiments that were carried out on the thin Surlyn plaques in section 4.2
were used to investigate whether extruding the fibre has caused any changes in the density
and thermal characteristics of the material.
Surlyn PC2000 fibre (setting six) was the studied fibre as results showed this fibre had the
best light guide distance measurements and was involved in further testing during this project.
5.6.1 Density Measurements
Table 27 presents the five density measurements, average density and standard deviation for
Surlyn PC2000 fibre, setting six.
Table 27 – Density measurement results for Surlyn PC2000 fibre, setting six.
The average density of the fibre was measured at 0.98 g/cm3. The density has increased by
0.01 g/cm3 after being extruded. The standard deviation for the density measurements was
Surlyn PC2000 Setting 6
Sample Weight(g)
Sample Buoyancy(g)
Density of Liquid
Density(g/cm3)
1 0.00077 0.00054 0.68376 0.975 2 0.00077 0.00054 0.68376 0.975 3 0.00089 0.00059 0.68376 1.03 4 0.00078 0.00056 0.68376 1.03 5 0.00083 0.00064 0.68376 0.887
Average = 0.979 S.D = 0.06
- 109 -
0.06 showing that the results are not as consistent as those for the plaques. The size of the
fibre and difficulty of the measurement may be the cause of the higher standard deviation.
5.6.2 Differential Scanning Calorimetry (DSC)
Using the two temperature ramps previously described in section 4.2.3, the thermal
characteristics of the fibre were investigated. Figure 55 contains the results from the one cycle
temperature ramp.
Figure 55 –DSC of extruded Surlyn PC2000 fibre (setting six); one cycle.
Ti
Tc
Tm Ti
Tm
(a)
(b)
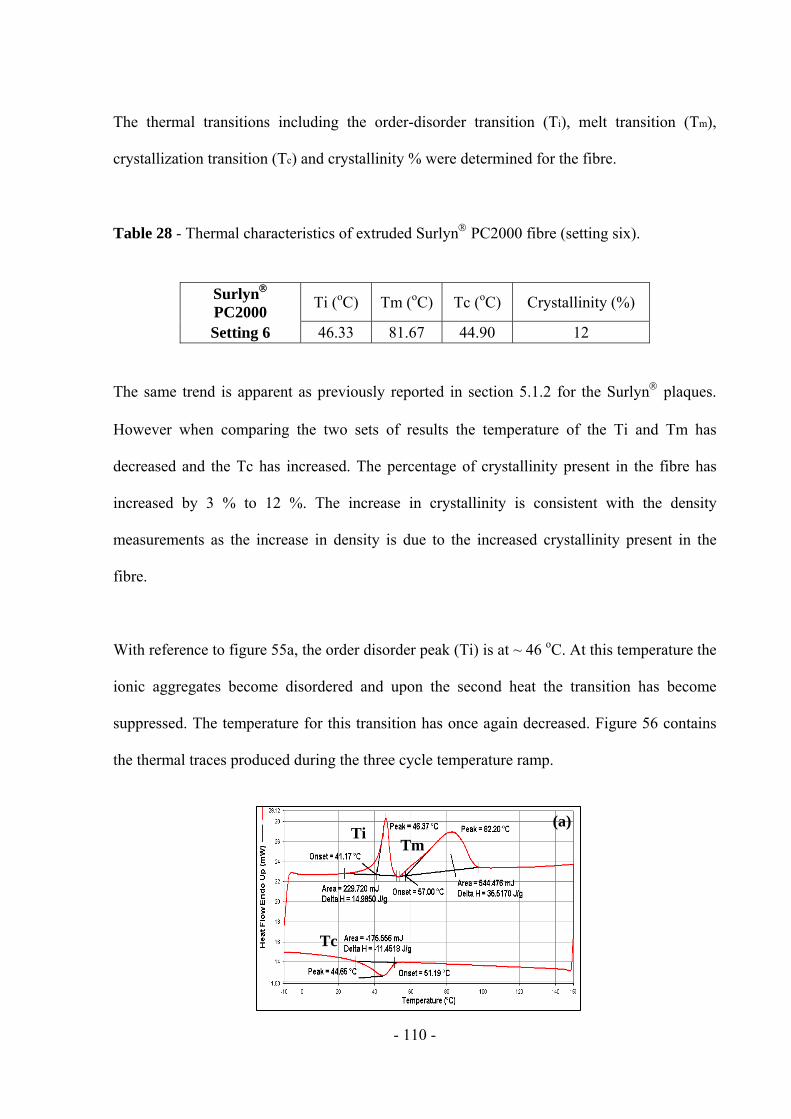
- 110 -
The thermal transitions including the order-disorder transition (Ti), melt transition (Tm),
crystallization transition (Tc) and crystallinity % were determined for the fibre.
Table 28 - Thermal characteristics of extruded Surlyn PC2000 fibre (setting six).
The same trend is apparent as previously reported in section 5.1.2 for the Surlyn plaques.
However when comparing the two sets of results the temperature of the Ti and Tm has
decreased and the Tc has increased. The percentage of crystallinity present in the fibre has
increased by 3 % to 12 %. The increase in crystallinity is consistent with the density
measurements as the increase in density is due to the increased crystallinity present in the
fibre.
With reference to figure 55a, the order disorder peak (Ti) is at ~ 46 oC. At this temperature the
ionic aggregates become disordered and upon the second heat the transition has become
suppressed. The temperature for this transition has once again decreased. Figure 56 contains
the thermal traces produced during the three cycle temperature ramp.
Surlyn PC2000
Ti (oC) Tm (oC) Tc (oC) Crystallinity (%)
Setting 6 46.33 81.67 44.90 12
Ti Tm
Tc
(a)
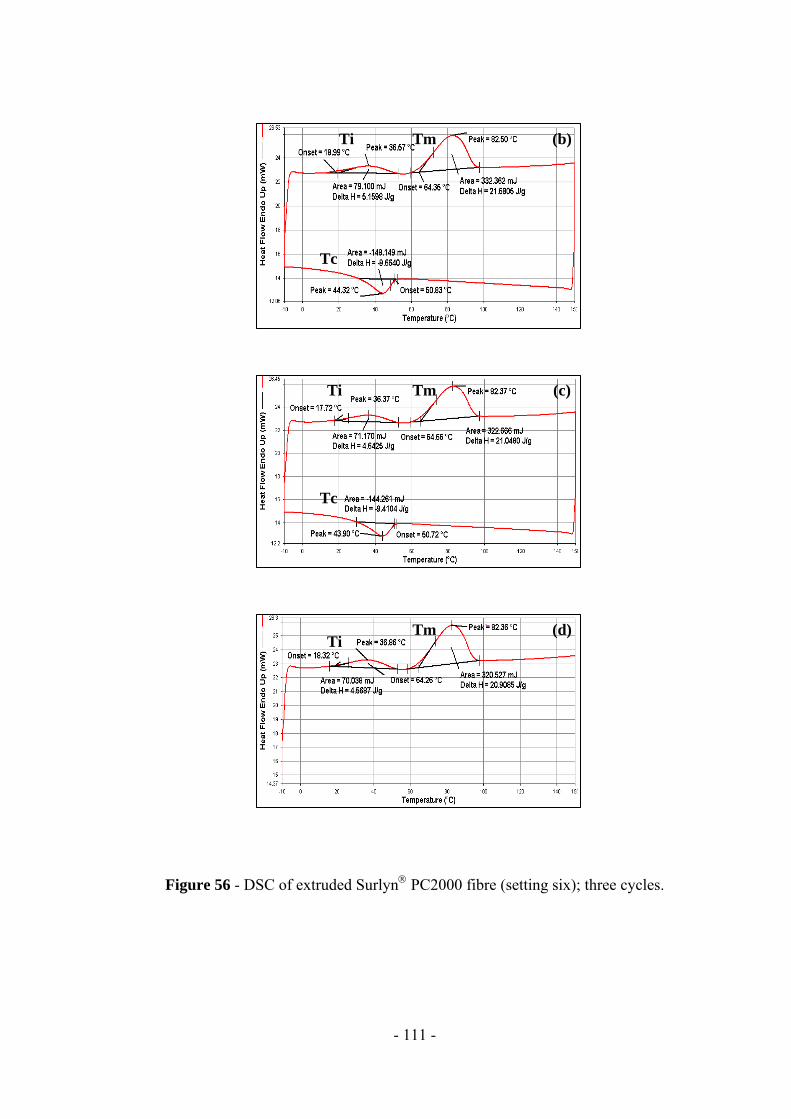
- 111 -
Figure 56 - DSC of extruded Surlyn PC2000 fibre (setting six); three cycles.
Ti Tm
Tc
Ti Tm
Tc
Ti Tm
(b)
(c)
(d)
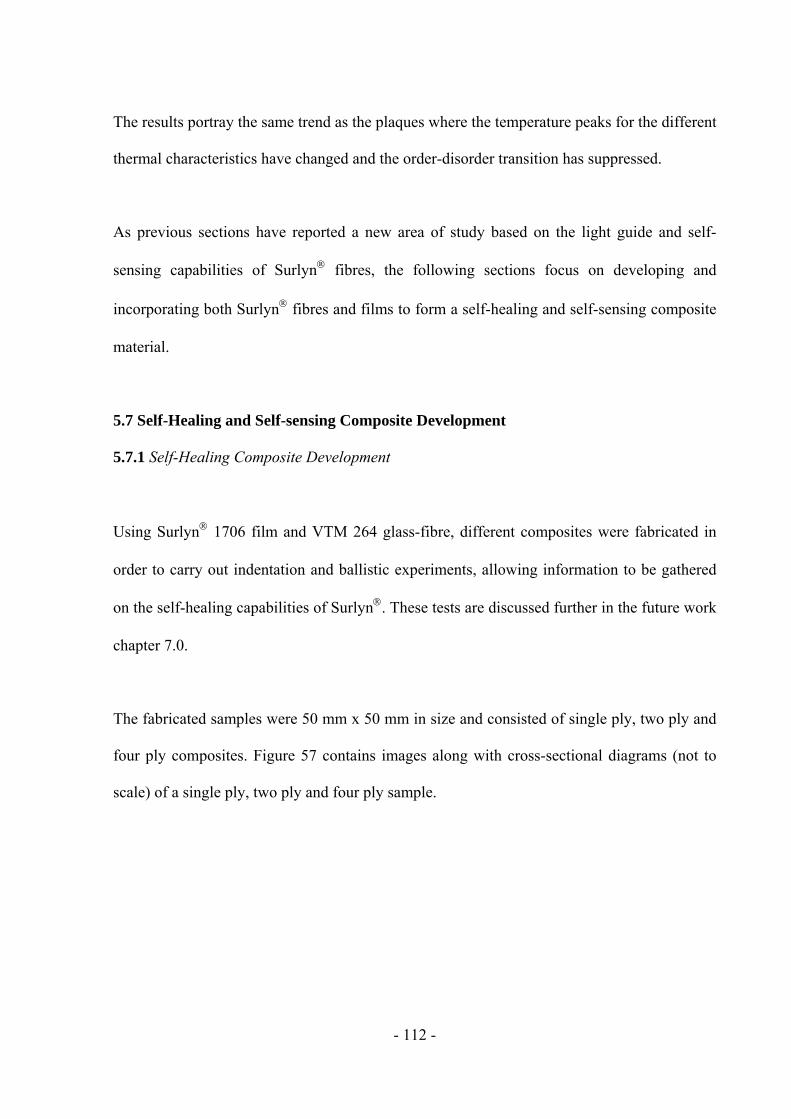
- 112 -
The results portray the same trend as the plaques where the temperature peaks for the different
thermal characteristics have changed and the order-disorder transition has suppressed.
As previous sections have reported a new area of study based on the light guide and self-
sensing capabilities of Surlyn fibres, the following sections focus on developing and
incorporating both Surlyn fibres and films to form a self-healing and self-sensing composite
material.
5.7 Self-Healing and Self-sensing Composite Development
5.7.1 Self-Healing Composite Development
Using Surlyn 1706 film and VTM 264 glass-fibre, different composites were fabricated in
order to carry out indentation and ballistic experiments, allowing information to be gathered
on the self-healing capabilities of Surlyn. These tests are discussed further in the future work
chapter 7.0.
The fabricated samples were 50 mm x 50 mm in size and consisted of single ply, two ply and
four ply composites. Figure 57 contains images along with cross-sectional diagrams (not to
scale) of a single ply, two ply and four ply sample.
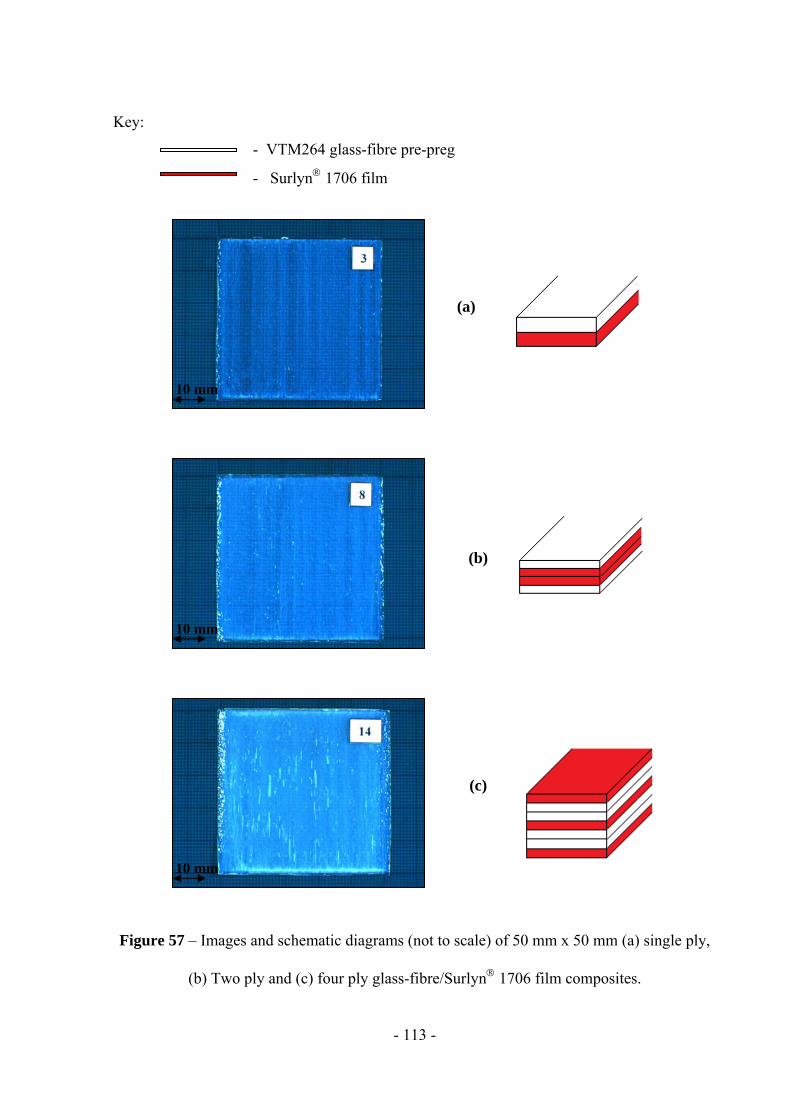
- 113 -
Key:
- VTM264 glass-fibre pre-preg
- Surlyn 1706 film
Figure 57 – Images and schematic diagrams (not to scale) of 50 mm x 50 mm (a) single ply,
(b) Two ply and (c) four ply glass-fibre/Surlyn 1706 film composites.
10 mm
10 mm
10 mm
(a)
(b)
(c)
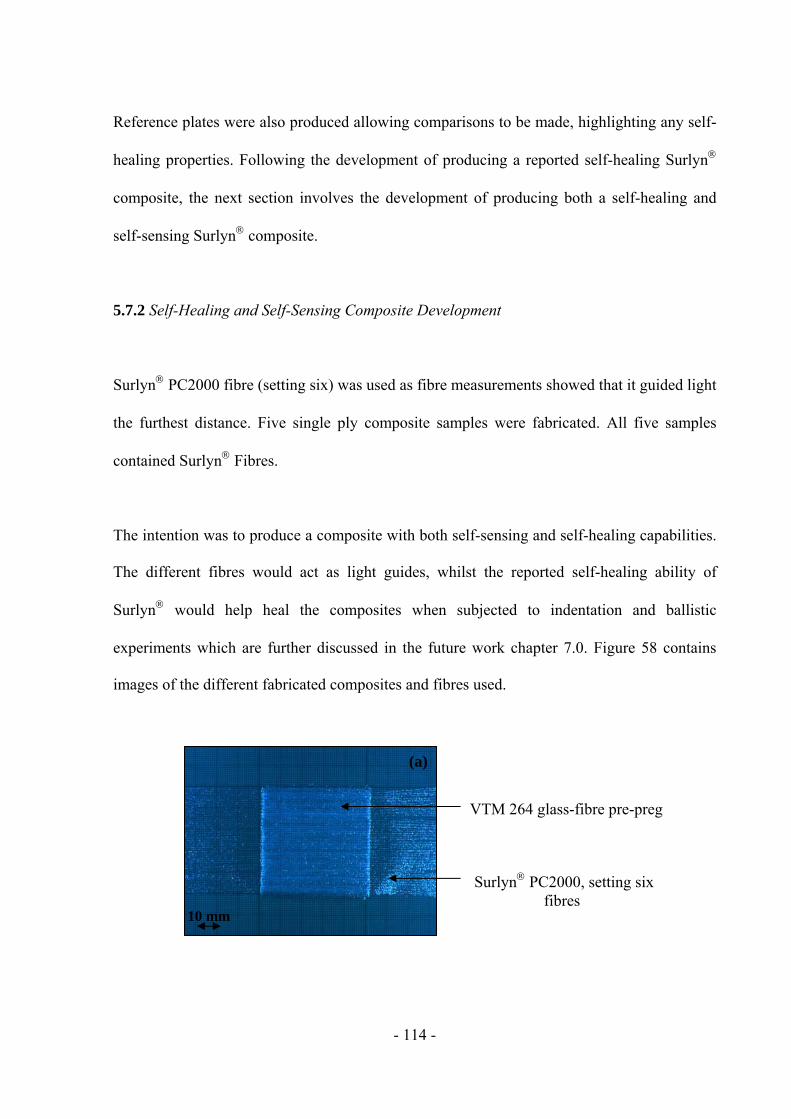
- 114 -
Reference plates were also produced allowing comparisons to be made, highlighting any self-
healing properties. Following the development of producing a reported self-healing Surlyn
composite, the next section involves the development of producing both a self-healing and
self-sensing Surlyn composite.
5.7.2 Self-Healing and Self-Sensing Composite Development
Surlyn PC2000 fibre (setting six) was used as fibre measurements showed that it guided light
the furthest distance. Five single ply composite samples were fabricated. All five samples
contained Surlyn Fibres.
The intention was to produce a composite with both self-sensing and self-healing capabilities.
The different fibres would act as light guides, whilst the reported self-healing ability of
Surlyn would help heal the composites when subjected to indentation and ballistic
experiments which are further discussed in the future work chapter 7.0. Figure 58 contains
images of the different fabricated composites and fibres used.
10 mm
VTM 264 glass-fibre pre-preg
Surlyn PC2000, setting six fibres
(a)
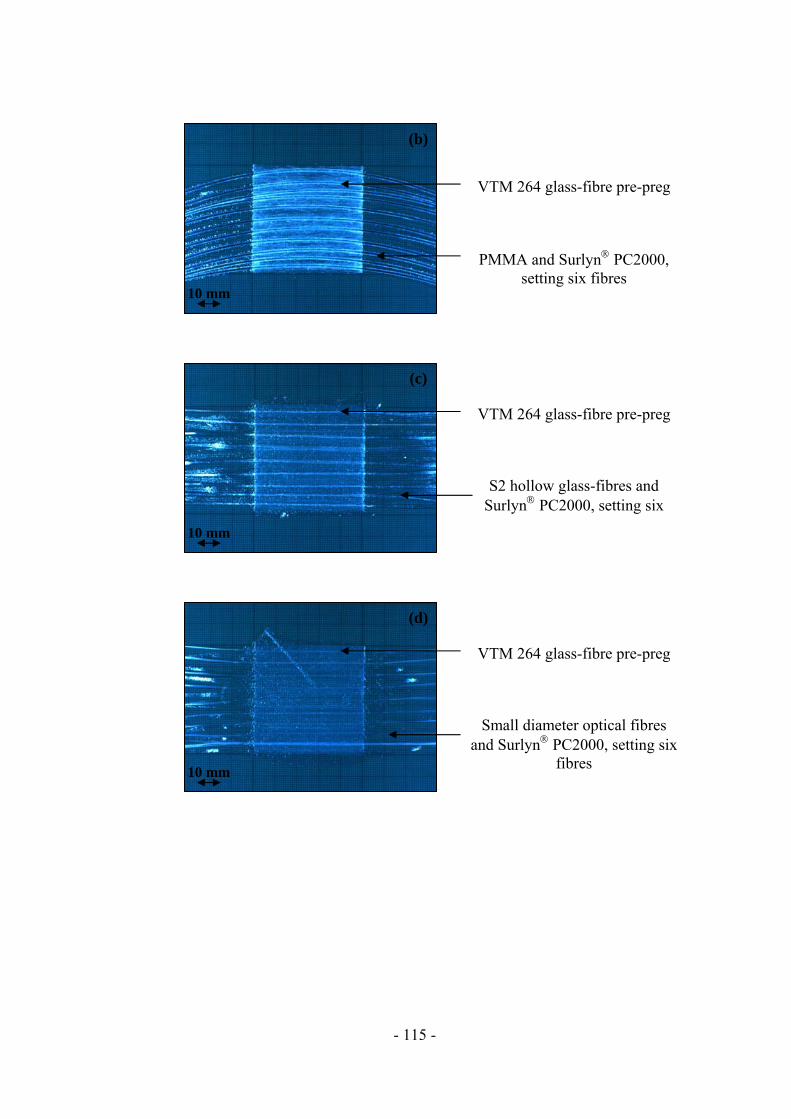
- 115 -
(c)
(c)
(d)
10 mm
10 mm
10 mm
VTM 264 glass-fibre pre-preg
PMMA and Surlyn PC2000, setting six fibres
VTM 264 glass-fibre pre-preg
VTM 264 glass-fibre pre-preg
S2 hollow glass-fibres and Surlyn PC2000, setting six
Small diameter optical fibres and Surlyn PC2000, setting six
fibres
(b)
(c)
(d)
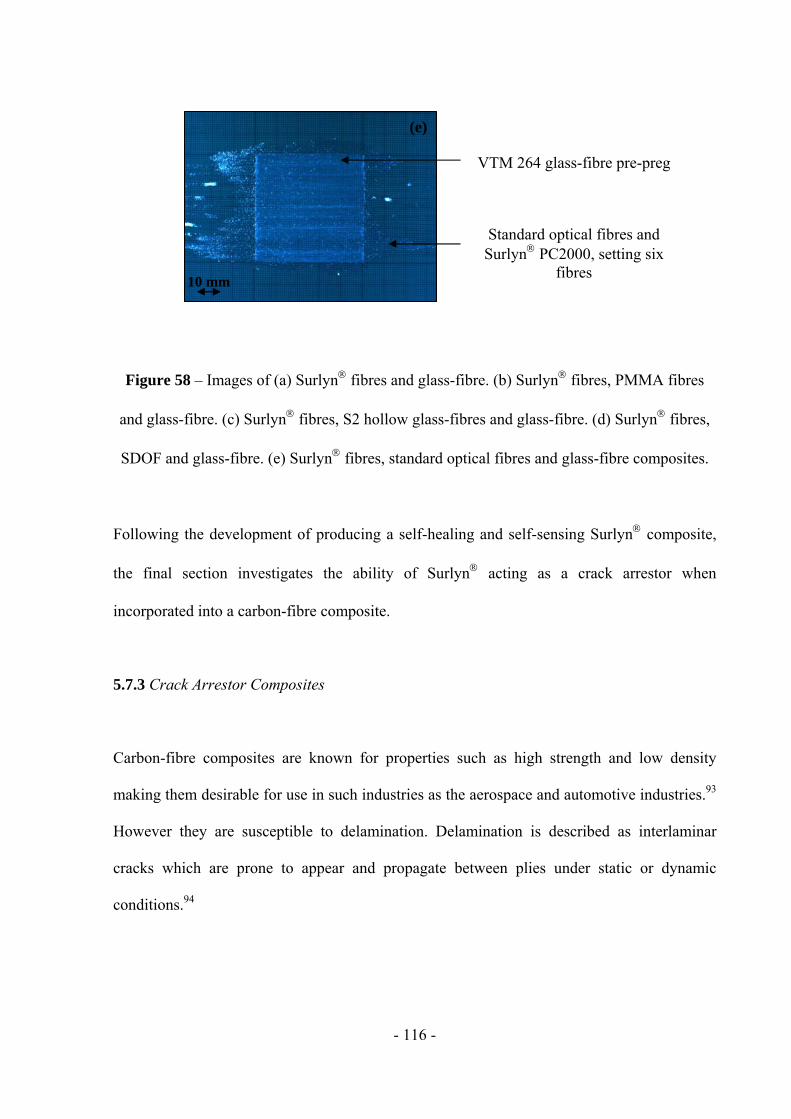
- 116 -
Figure 58 – Images of (a) Surlyn fibres and glass-fibre. (b) Surlyn fibres, PMMA fibres
and glass-fibre. (c) Surlyn fibres, S2 hollow glass-fibres and glass-fibre. (d) Surlyn fibres,
SDOF and glass-fibre. (e) Surlyn fibres, standard optical fibres and glass-fibre composites.
Following the development of producing a self-healing and self-sensing Surlyn composite,
the final section investigates the ability of Surlyn acting as a crack arrestor when
incorporated into a carbon-fibre composite.
5.7.3 Crack Arrestor Composites
Carbon-fibre composites are known for properties such as high strength and low density
making them desirable for use in such industries as the aerospace and automotive industries.93
However they are susceptible to delamination. Delamination is described as interlaminar
cracks which are prone to appear and propagate between plies under static or dynamic
conditions.94
10 mm
VTM 264 glass-fibre pre-preg
Standard optical fibres and Surlyn PC2000, setting six
fibres
(e)
- 117 -
The main aim of this part of the study was to investigate whether Surlyn film and fibres can
act as crack arrestors when placed between the centre plies of a 16 ply carbon-fibre
composite.
Mode I fracture toughness tests were carried out and are defined as the resistance to the
initiation and propagation of a delamination crack in unidirectional reinforced polymer matrix
composite laminates under mode I opening load. Fracture toughness is measured in Joules per
square metre.79
A mode I double cantilever beam specimen was used to determine G1c, the critical energy
release rate of the fibre reinforced plastic composites.79
Three different crack arrestors were examined: extruded Surlyn PC2000, setting six fibres,
Surlyn 1706 film and Surlyn 1706 punctured film. Five 16 ply carbon-fibre reference
samples were tested enabling a comparison to be made once testing had been carried out on
the Surlyn crack arrestors.
5.7.3.1 Reference Samples
Before testing, image analysis was carried out on a 20 mm x 20 mm section from the
reference plate. Figure 59 shows a cross-sectional image showing how all individual carbon-
fibres are on the same plane representing the unidirectional lay-up sequence of the reference
composite.
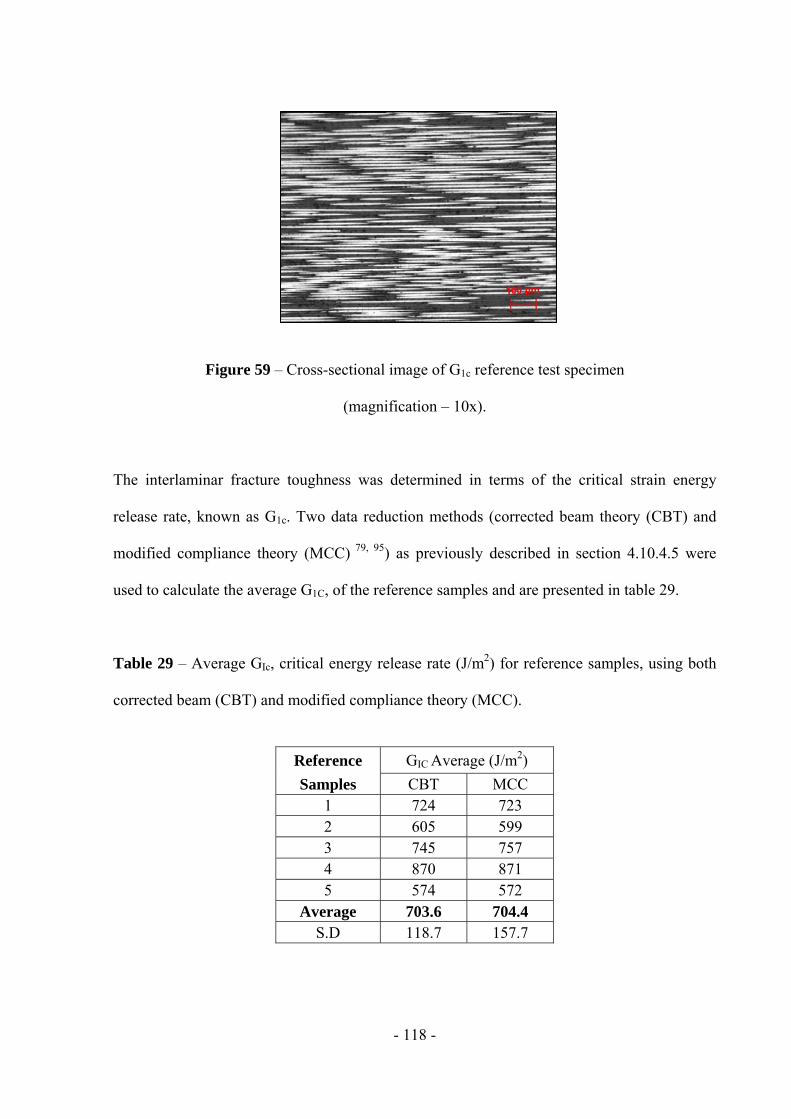
- 118 -
Figure 59 – Cross-sectional image of G1c reference test specimen
(magnification – 10x).
The interlaminar fracture toughness was determined in terms of the critical strain energy
release rate, known as G1c. Two data reduction methods (corrected beam theory (CBT) and
modified compliance theory (MCC) 79, 95) as previously described in section 4.10.4.5 were
used to calculate the average G1C, of the reference samples and are presented in table 29.
Table 29 – Average GIc, critical energy release rate (J/m2) for reference samples, using both
corrected beam (CBT) and modified compliance theory (MCC).
Reference GIC Average (J/m2)
Samples CBT MCC 1 724 723 2 605 599 3 745 757 4 870 871 5 574 572
Average 703.6 704.4 S.D 118.7 157.7
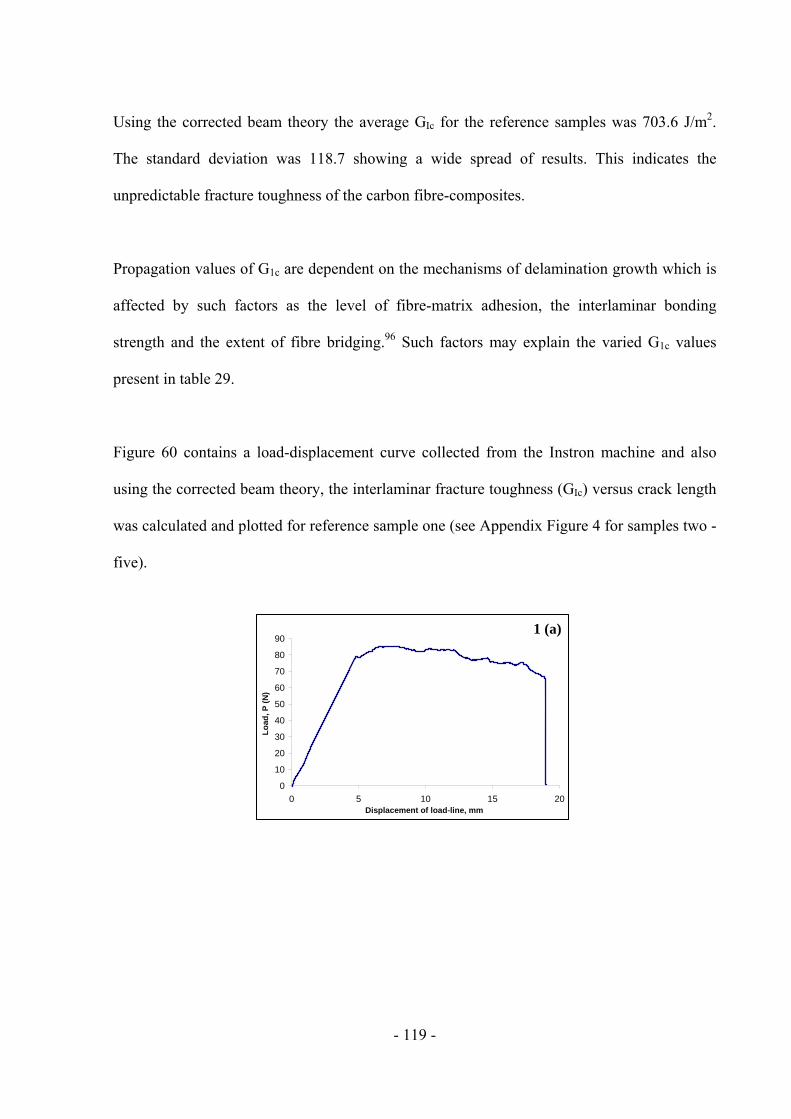
- 119 -
Using the corrected beam theory the average GIc for the reference samples was 703.6 J/m2.
The standard deviation was 118.7 showing a wide spread of results. This indicates the
unpredictable fracture toughness of the carbon fibre-composites.
Propagation values of G1c are dependent on the mechanisms of delamination growth which is
affected by such factors as the level of fibre-matrix adhesion, the interlaminar bonding
strength and the extent of fibre bridging.96 Such factors may explain the varied G1c values
present in table 29.
Figure 60 contains a load-displacement curve collected from the Instron machine and also
using the corrected beam theory, the interlaminar fracture toughness (GIc) versus crack length
was calculated and plotted for reference sample one (see Appendix Figure 4 for samples two -
five).
0
10
20
30
40
50
60
70
80
90
0 5 10 15 20Displacement of load-line, mm
Lo
ad,
P (
N)
1 (a)
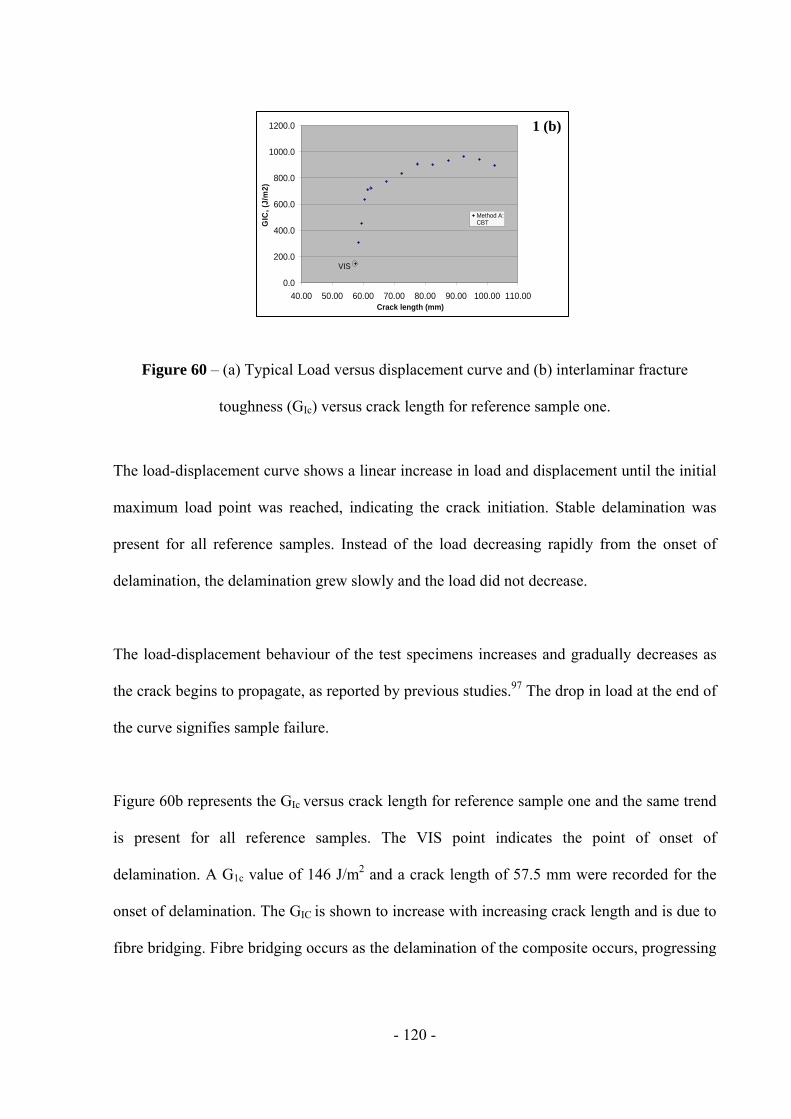
- 120 -
Figure 60 – (a) Typical Load versus displacement curve and (b) interlaminar fracture
toughness (GIc) versus crack length for reference sample one.
The load-displacement curve shows a linear increase in load and displacement until the initial
maximum load point was reached, indicating the crack initiation. Stable delamination was
present for all reference samples. Instead of the load decreasing rapidly from the onset of
delamination, the delamination grew slowly and the load did not decrease.
The load-displacement behaviour of the test specimens increases and gradually decreases as
the crack begins to propagate, as reported by previous studies.97 The drop in load at the end of
the curve signifies sample failure.
Figure 60b represents the GIc versus crack length for reference sample one and the same trend
is present for all reference samples. The VIS point indicates the point of onset of
delamination. A G1c value of 146 J/m2 and a crack length of 57.5 mm were recorded for the
onset of delamination. The GIC is shown to increase with increasing crack length and is due to
fibre bridging. Fibre bridging occurs as the delamination of the composite occurs, progressing
0.0
200.0
400.0
600.0
800.0
1000.0
1200.0
40.00 50.00 60.00 70.00 80.00 90.00 100.00 110.00Crack length (mm)
GIC
, (J
/m2)
Method A:CBT
VIS
1 (b)
- 121 -
along the length of the sample and therefore increasing the energy required to propagate the
delamination further.98, 99
Figure 61 contains S.E.M. images of the reference sample fracture surface following mode I
testing.
Figure 61 – S.E.M images of reference sample following Mode I fracture testing.
Figure 61 shows images of fibre bridging resulting in increases in G1c. Fibre bridging takes
place when delamination occurs, the crack switches from one fibre/matrix interface to another
and this leaves behind fibres to bridge the gap, preventing the crack from propagating further.
This is a positive attribute of fracture in composites as more energy is needed in order to
propagate the bridged gap increasing the G1c value of the material.100
5.7.3.2 Surlyn PC2000 Fibre Samples
Surlyn PC2000 fibres (setting six) were chosen as a crack arrestor as it recorded the greatest
distance for guiding light. Figure 62 contains an image of the cross-sectional area of a fibre
(a) (b)
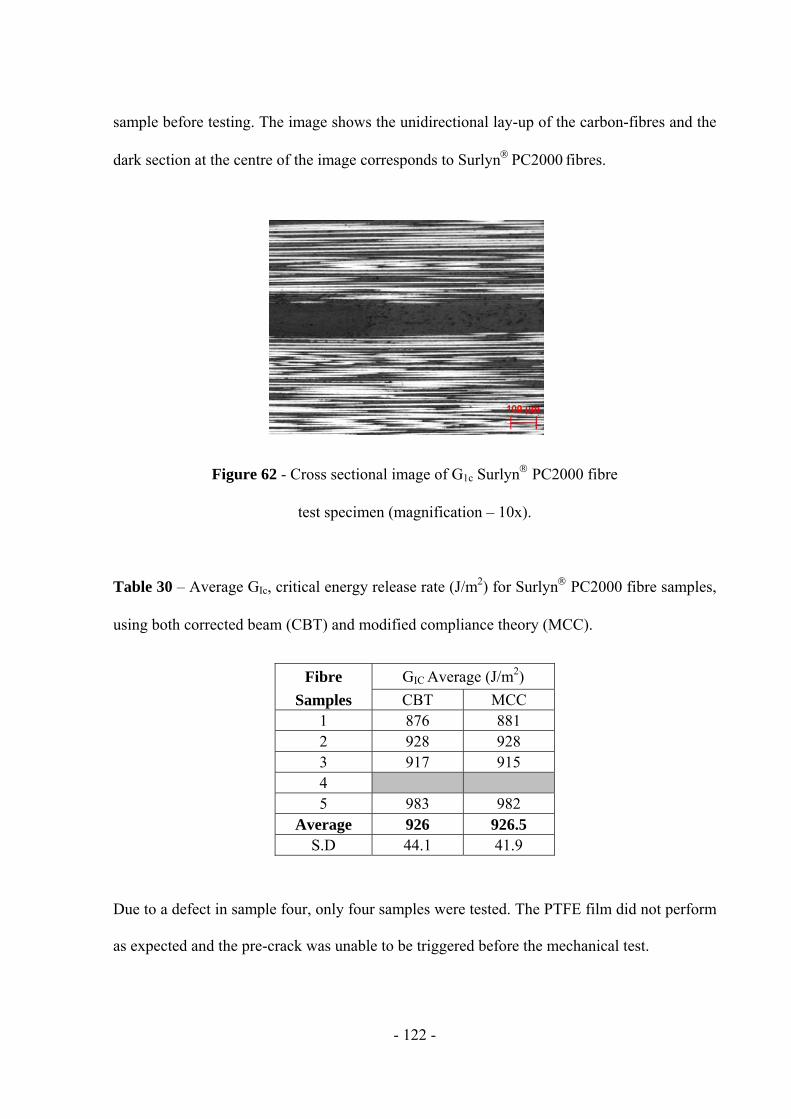
- 122 -
sample before testing. The image shows the unidirectional lay-up of the carbon-fibres and the
dark section at the centre of the image corresponds to SurlynPC2000fibres.
Figure 62 - Cross sectional image of G1c Surlyn PC2000 fibre
test specimen (magnification – 10x).
Table 30 – Average GIc, critical energy release rate (J/m2) for Surlyn PC2000 fibre samples,
using both corrected beam (CBT) and modified compliance theory (MCC).
Due to a defect in sample four, only four samples were tested. The PTFE film did not perform
as expected and the pre-crack was unable to be triggered before the mechanical test.
Fibre GIC Average (J/m2)
Samples CBT MCC 1 876 881 2 928 928 3 917 915 4 5 983 982
Average 926 926.5 S.D 44.1 41.9
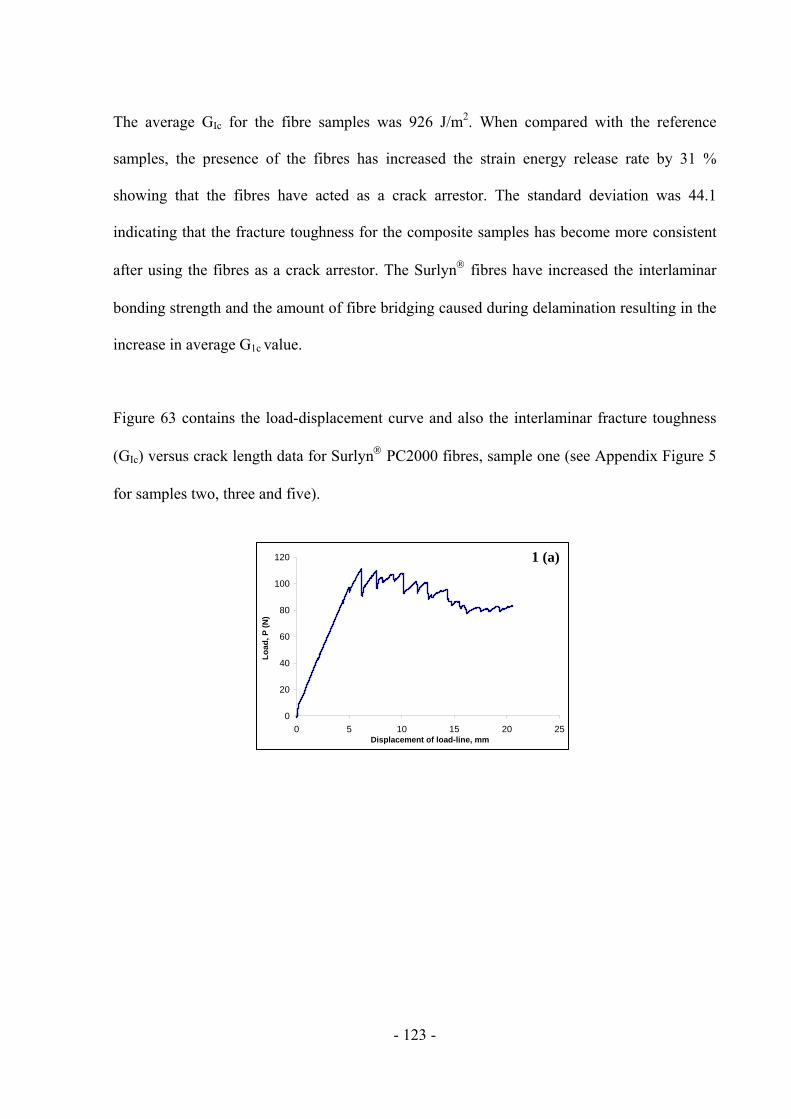
- 123 -
The average GIc for the fibre samples was 926 J/m2. When compared with the reference
samples, the presence of the fibres has increased the strain energy release rate by 31 %
showing that the fibres have acted as a crack arrestor. The standard deviation was 44.1
indicating that the fracture toughness for the composite samples has become more consistent
after using the fibres as a crack arrestor. The Surlyn fibres have increased the interlaminar
bonding strength and the amount of fibre bridging caused during delamination resulting in the
increase in average G1c value.
Figure 63 contains the load-displacement curve and also the interlaminar fracture toughness
(GIc) versus crack length data for Surlyn PC2000 fibres, sample one (see Appendix Figure 5
for samples two, three and five).
0
20
40
60
80
100
120
0 5 10 15 20 25Displacement of load-line, mm
Lo
ad,
P (
N)
1 (a)
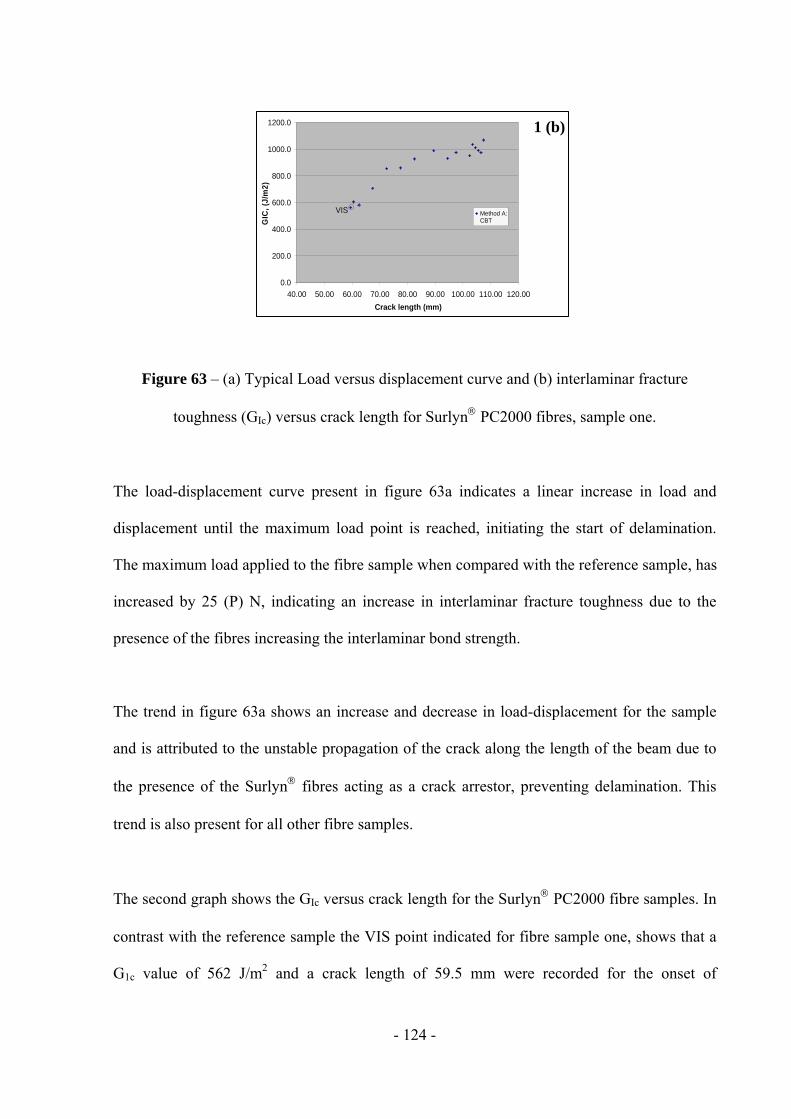
- 124 -
Figure 63 – (a) Typical Load versus displacement curve and (b) interlaminar fracture
toughness (GIc) versus crack length for Surlyn PC2000 fibres, sample one.
The load-displacement curve present in figure 63a indicates a linear increase in load and
displacement until the maximum load point is reached, initiating the start of delamination.
The maximum load applied to the fibre sample when compared with the reference sample, has
increased by 25 (P) N, indicating an increase in interlaminar fracture toughness due to the
presence of the fibres increasing the interlaminar bond strength.
The trend in figure 63a shows an increase and decrease in load-displacement for the sample
and is attributed to the unstable propagation of the crack along the length of the beam due to
the presence of the Surlyn fibres acting as a crack arrestor, preventing delamination. This
trend is also present for all other fibre samples.
The second graph shows the GIc versus crack length for the Surlyn PC2000 fibre samples. In
contrast with the reference sample the VIS point indicated for fibre sample one, shows that a
G1c value of 562 J/m2 and a crack length of 59.5 mm were recorded for the onset of
0.0
200.0
400.0
600.0
800.0
1000.0
1200.0
40.00 50.00 60.00 70.00 80.00 90.00 100.00 110.00 120.00
Crack length (mm)
GIC
, (J
/m2
)
Method A:CBT
VIS
1 (b)
- 125 -
delamination. This shows a significant increase in energy required to cause delamination due
to the presence of the fibres.
Figure 63b shows that the value of G1c is increasing, with increasing crack length and is due
to increased amounts of fibre bridging and bonding strength caused by the presence of the
Surlyn fibres.
Figures 64a and 64b show images of fibre bridging that has occurred during testing. Larger
sections of fibre bridging were apparent due to the use of fibres acting as crack arrestors,
preventing the propagation of the crack.
Figure 64 – S.E.M images of Surlyn PC2000 fibre sample following
Mode I fracture testing.
5.7.3.3 Surlyn 1706 Film Samples
The second material to be investigated as a crack arrestor was the as received Surlyn 1706
film. The average thickness of the film was 0.06 mm and one layer of the film was
incorporated into the centre of the carbon-fibre composite. Figure 65 shows a cross-sectional
(a) (b)
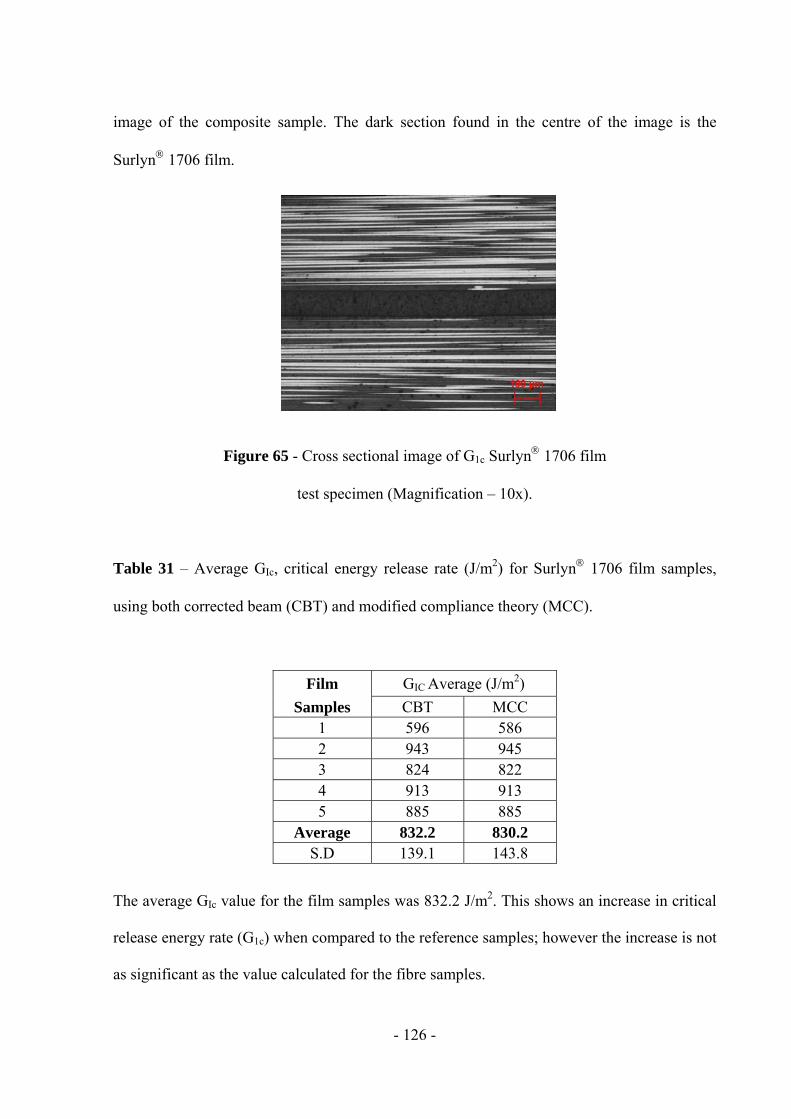
- 126 -
image of the composite sample. The dark section found in the centre of the image is the
Surlyn 1706 film.
Figure 65 - Cross sectional image of G1c Surlyn 1706 film
test specimen (Magnification – 10x).
Table 31 – Average GIc, critical energy release rate (J/m2) for Surlyn 1706 film samples,
using both corrected beam (CBT) and modified compliance theory (MCC).
Film GIC Average (J/m2)
Samples CBT MCC 1 596 586 2 943 945 3 824 822 4 913 913 5 885 885
Average 832.2 830.2 S.D 139.1 143.8
The average GIc value for the film samples was 832.2 J/m2. This shows an increase in critical
release energy rate (G1c) when compared to the reference samples; however the increase is not
as significant as the value calculated for the fibre samples.
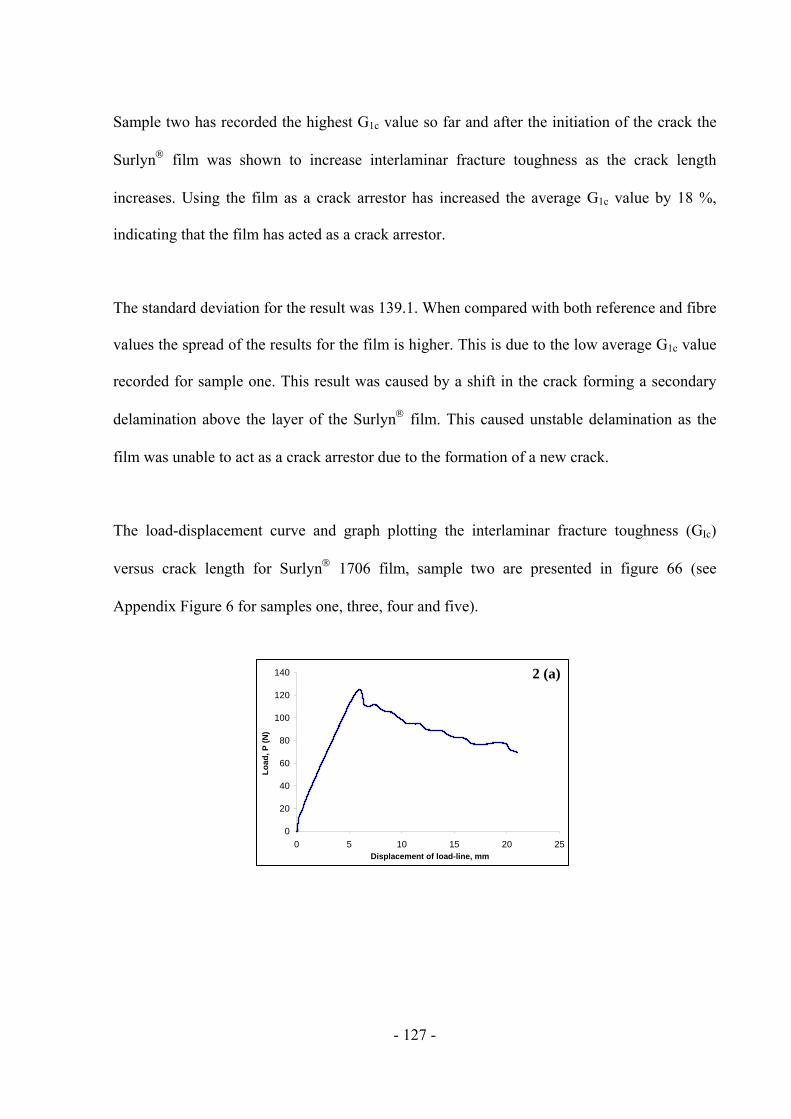
- 127 -
Sample two has recorded the highest G1c value so far and after the initiation of the crack the
Surlyn film was shown to increase interlaminar fracture toughness as the crack length
increases. Using the film as a crack arrestor has increased the average G1c value by 18 %,
indicating that the film has acted as a crack arrestor.
The standard deviation for the result was 139.1. When compared with both reference and fibre
values the spread of the results for the film is higher. This is due to the low average G1c value
recorded for sample one. This result was caused by a shift in the crack forming a secondary
delamination above the layer of the Surlyn film. This caused unstable delamination as the
film was unable to act as a crack arrestor due to the formation of a new crack.
The load-displacement curve and graph plotting the interlaminar fracture toughness (GIc)
versus crack length for Surlyn 1706 film, sample two are presented in figure 66 (see
Appendix Figure 6 for samples one, three, four and five).
0
20
40
60
80
100
120
140
0 5 10 15 20 25Displacement of load-line, mm
Lo
ad,
P (
N)
2 (a)
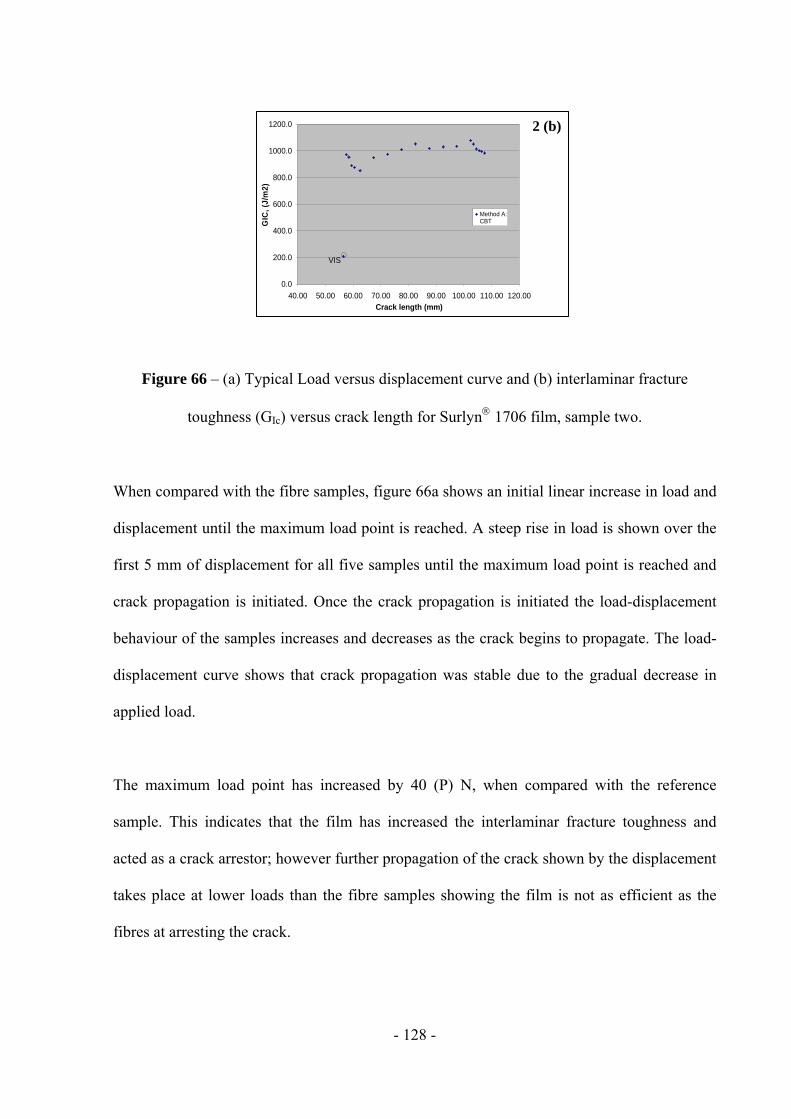
- 128 -
Figure 66 – (a) Typical Load versus displacement curve and (b) interlaminar fracture
toughness (GIc) versus crack length for Surlyn 1706 film, sample two.
When compared with the fibre samples, figure 66a shows an initial linear increase in load and
displacement until the maximum load point is reached. A steep rise in load is shown over the
first 5 mm of displacement for all five samples until the maximum load point is reached and
crack propagation is initiated. Once the crack propagation is initiated the load-displacement
behaviour of the samples increases and decreases as the crack begins to propagate. The load-
displacement curve shows that crack propagation was stable due to the gradual decrease in
applied load.
The maximum load point has increased by 40 (P) N, when compared with the reference
sample. This indicates that the film has increased the interlaminar fracture toughness and
acted as a crack arrestor; however further propagation of the crack shown by the displacement
takes place at lower loads than the fibre samples showing the film is not as efficient as the
fibres at arresting the crack.
0.0
200.0
400.0
600.0
800.0
1000.0
1200.0
40.00 50.00 60.00 70.00 80.00 90.00 100.00 110.00 120.00
Crack length (mm)
GIC
, (J
/m2
)
Method A:CBT
VIS
2 (b)
- 129 -
With reference to figure 66b the point of onset of delamination (VIS) for sample two is shown
to have a G1c value of 209 J/m2 and a crack length of 56.5 mm. When compared with both the
reference and fibre samples, the onset of delamination has taken place at lower values.
However the critical release energy rate (G1c) does increase significantly in all samples after
the initiation of delamination indicating a poor matrix and film adhesion at the edge of the
film.
The initial trend observed in figure 66b shows that the G1c value does increase with increasing
crack length for sample two, however this increase is not stable and drops in critical release
energy rate are shown as the crack length increases. This is shown for all film samples.
Spacing was present between the Surlyn fibres during fabrication of the composites. The
film however covered the entire surface of the pre-preg. This may have caused the amount of
fibre bridging across the length of the beam to decrease in parts and is shown by the drops in
the critical release energy rate along the length of the beam. The presence of ductile and
brittle fracture surfaces caused by the film may have also caused the decrease in G1c at certain
crack lengths.
Figure 67 contains S.E.M. images of the film sample fracture surface following testing. Figure
67a shows a small area of fibre bridging on top of the film caused during propagation of the
crack. Figure 67b shows the ductile and brittle fracture of the film, where the film was acting
as a crack arrestor.
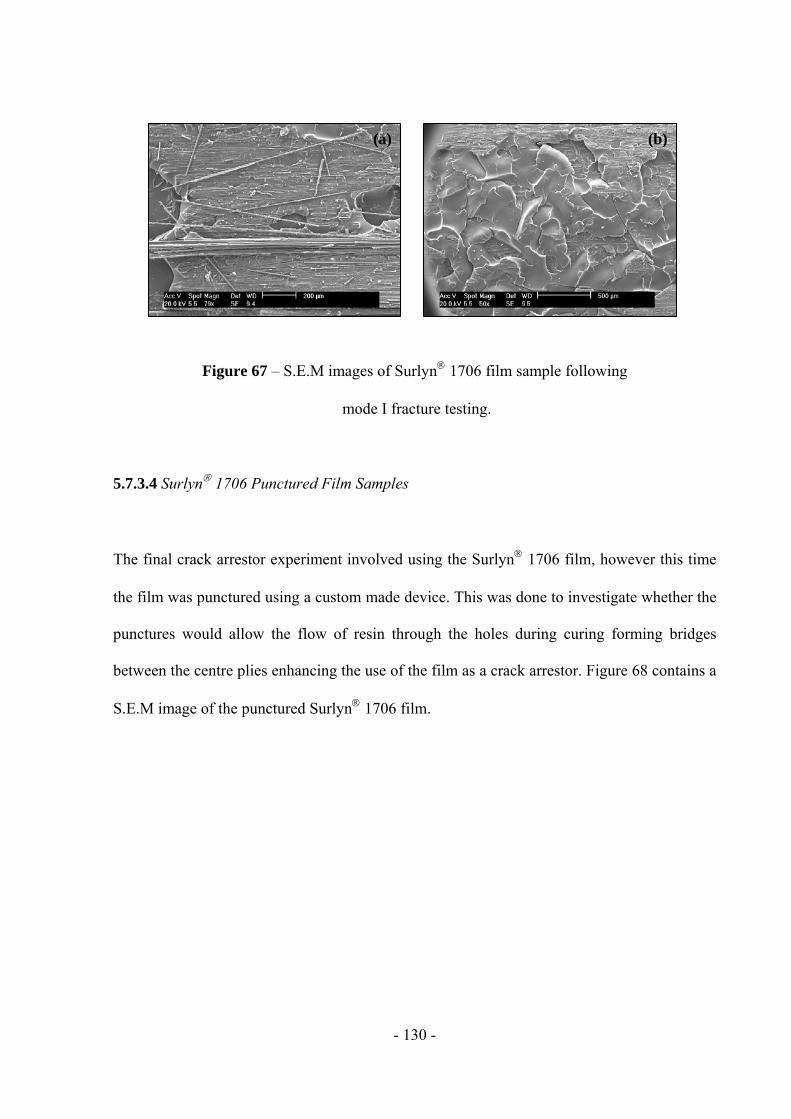
- 130 -
Figure 67 – S.E.M images of Surlyn 1706 film sample following
mode I fracture testing.
5.7.3.4 Surlyn 1706 Punctured Film Samples
The final crack arrestor experiment involved using the Surlyn 1706 film, however this time
the film was punctured using a custom made device. This was done to investigate whether the
punctures would allow the flow of resin through the holes during curing forming bridges
between the centre plies enhancing the use of the film as a crack arrestor. Figure 68 contains a
S.E.M image of the punctured Surlyn 1706 film.
(a) (b)
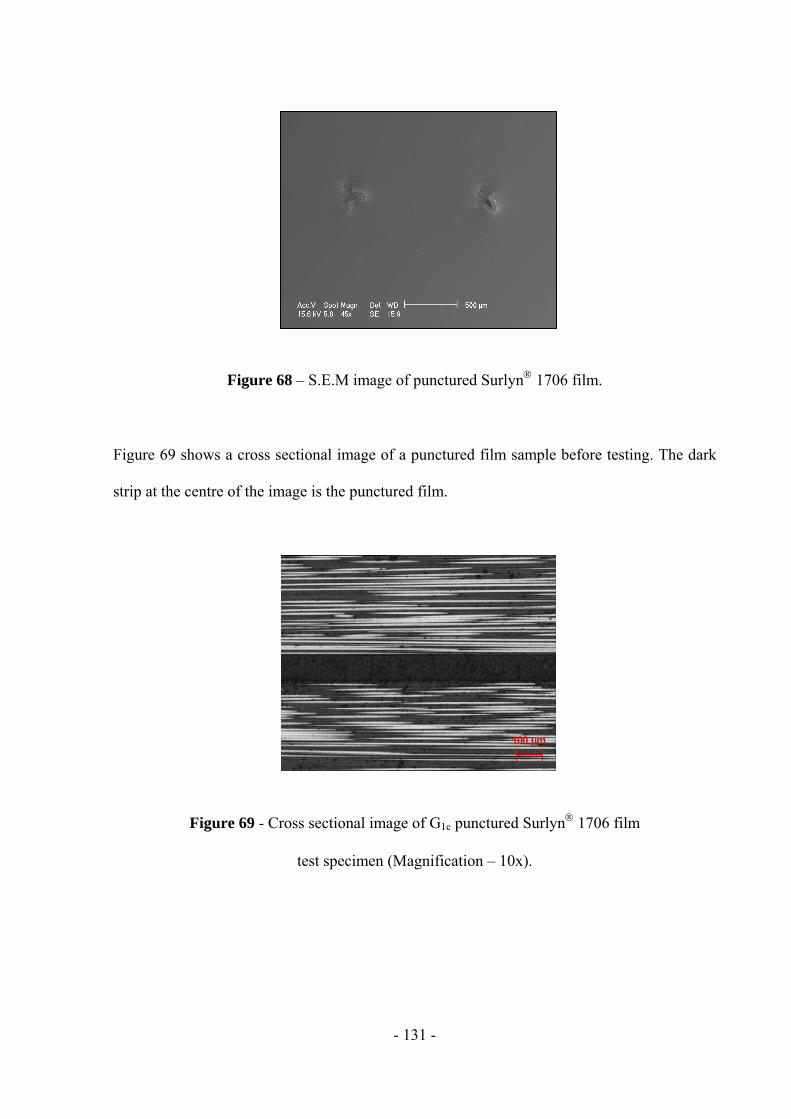
- 131 -
Figure 68 – S.E.M image of punctured Surlyn 1706 film.
Figure 69 shows a cross sectional image of a punctured film sample before testing. The dark
strip at the centre of the image is the punctured film.
Figure 69 - Cross sectional image of G1c punctured Surlyn 1706 film
test specimen (Magnification – 10x).
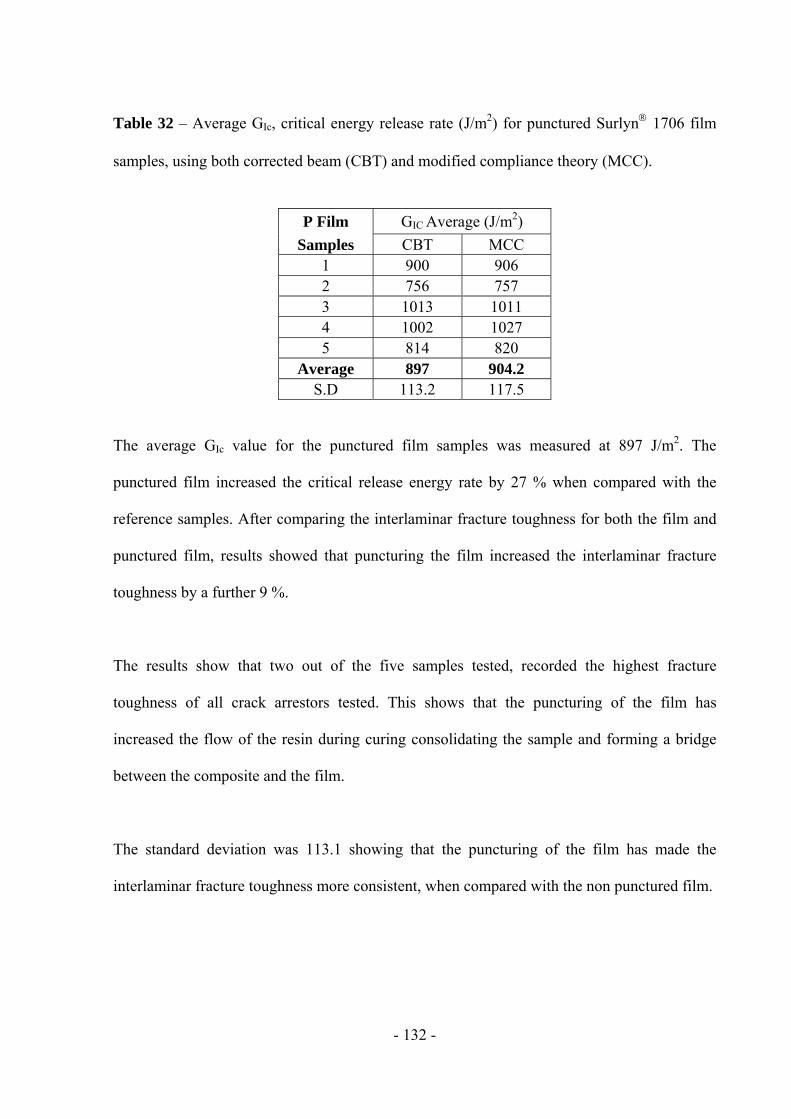
- 132 -
Table 32 – Average GIc, critical energy release rate (J/m2) for punctured Surlyn 1706 film
samples, using both corrected beam (CBT) and modified compliance theory (MCC).
The average GIc value for the punctured film samples was measured at 897 J/m2. The
punctured film increased the critical release energy rate by 27 % when compared with the
reference samples. After comparing the interlaminar fracture toughness for both the film and
punctured film, results showed that puncturing the film increased the interlaminar fracture
toughness by a further 9 %.
The results show that two out of the five samples tested, recorded the highest fracture
toughness of all crack arrestors tested. This shows that the puncturing of the film has
increased the flow of the resin during curing consolidating the sample and forming a bridge
between the composite and the film.
The standard deviation was 113.1 showing that the puncturing of the film has made the
interlaminar fracture toughness more consistent, when compared with the non punctured film.
P Film GIC Average (J/m2)
Samples CBT MCC 1 900 906 2 756 757 3 1013 1011 4 1002 1027 5 814 820
Average 897 904.2 S.D 113.2 117.5
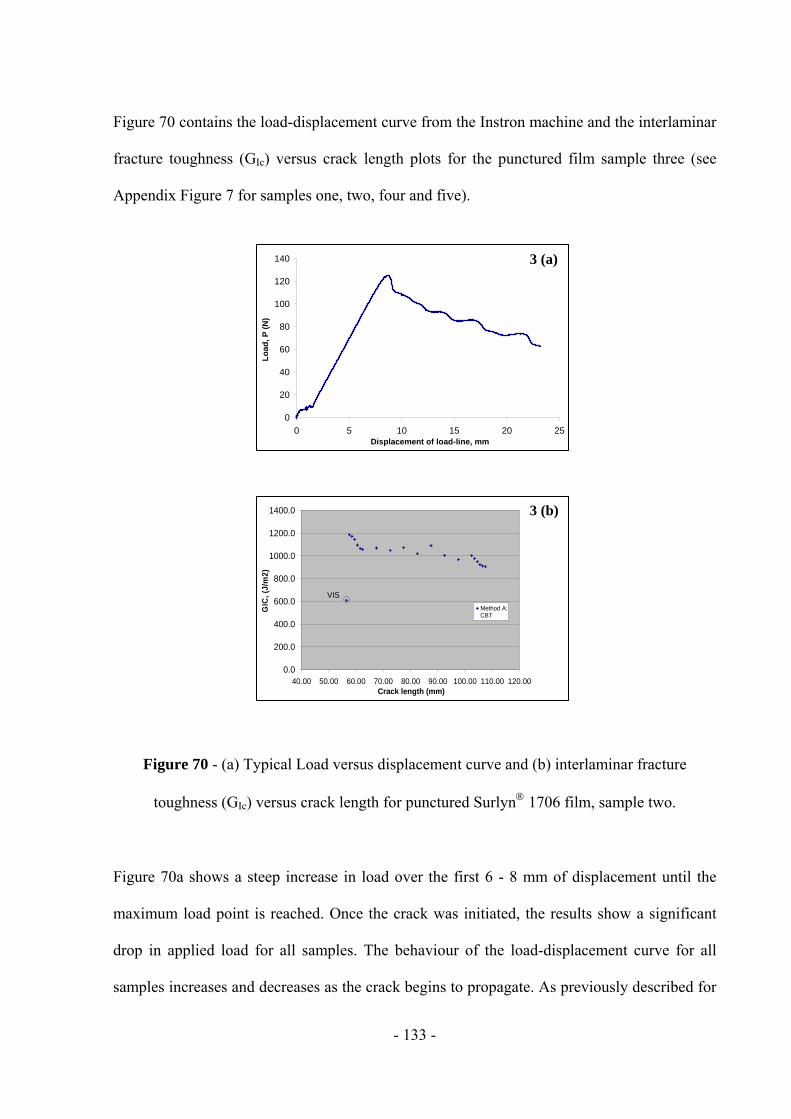
- 133 -
Figure 70 contains the load-displacement curve from the Instron machine and the interlaminar
fracture toughness (GIc) versus crack length plots for the punctured film sample three (see
Appendix Figure 7 for samples one, two, four and five).
Figure 70 - (a) Typical Load versus displacement curve and (b) interlaminar fracture
toughness (GIc) versus crack length for punctured Surlyn 1706 film, sample two.
Figure 70a shows a steep increase in load over the first 6 - 8 mm of displacement until the
maximum load point is reached. Once the crack was initiated, the results show a significant
drop in applied load for all samples. The behaviour of the load-displacement curve for all
samples increases and decreases as the crack begins to propagate. As previously described for
0
20
40
60
80
100
120
140
0 5 10 15 20 25Displacement of load-line, mm
Lo
ad,
P (
N)
0.0
200.0
400.0
600.0
800.0
1000.0
1200.0
1400.0
40.00 50.00 60.00 70.00 80.00 90.00 100.00 110.00 120.00Crack length (mm)
GIC
, (J
/m2
)
Method A:CBT
VIS
3 (a)
3 (b)
- 134 -
the as-received film, the punctured film has acted as a crack arrestor; however further
propagation of the crack takes place at lower loads than the fibre samples showing the
punctured film is not as efficient as the fibres.
The punctured film has also increased the maximum load point by ~ 40 (P) N and indicates an
increase in interlaminar fracture toughness as a higher load is required for onset of the crack
propagation. As the load is shown to steadily decrease the crack propagation is stable,
however displacement is shown to occur at lower loads indicating the punctured film does not
perform as well as the fibres arresting the crack.
Figure 70b shows the G1c values plotted against the crack length for punctured Surlyn film
sample three. The onset of delamination (VIS) is shown to have a G1c value of 610 J/m2 and a
crack length of 56.5 mm. This indicates that puncture holes present in the film have enabled
bridges to form between the film and centre plies increasing the interlaminar fracture
toughness.
An initial increase in G1c critical release energy rate and increasing crack length is shown for
sample three and the other samples. However as with the film samples the G1c is shown to
decrease with increasing crack length at certain crack lengths along the beam for the
punctured sample. This may also be attributed to the amount of bridging present during
delamination of the sample leading to a decrease in G1c. Ductile and brittle fracture was also
present along the fractured film areas of the sample again causing decreases in G1c.
- 135 -
Figure 71 contains S.E.M images of the surface area of the punctured film samples following
mode I fracture testing. No fibre bridging was present on the samples following testing
showing that the punctured film had bonded with both the carbon -fibre laminates. Figures
71a and 71b show the ductile (rough) and brittle (smooth) fracture surfaces of the punctured
film that was caused by the crack propagating through the sample.
Figure 71 – S.E.M images of punctured Surlyn 1706 film sample following
mode I fracture testing.
The aim of this section was to investigate whether Surlyn would act as a crack arrestor.
Overall the average G1c value was increased for all samples using Surlyn as a crack arrestor,
indicating an increase in interlaminar fracture toughness. The PC2000 fibres increased the
average G1c value by 31 %. This was the highest average increase in G1c. However for the
punctured film, two out of the five samples recorded the highest average G1c value and
puncturing the film increased the interlaminar fracture toughness by a further 9 %, when
compared with the as-received film.
(a) (b)
- 136 -
Fibre bridging and the added increase of the bonding between the Surlyn and the pre-preg
were attributed to the increase in G1c values. Fractography demonstrated the different types of
fracture and fibre bridging present following delamination.
The main focus of the study was to investigate the ionomer Surlyn as a self-healing and self-
sensing composite. The preliminary characterisation techniques showed that Surlyn is a low
density amorphous material. The material had a low refractive index of 1.52. Taking these
initial properties into account the ionomer is ideal as a composite due to it being light weight.
The initial light guide and self-sensing ability was also shown. The thermal characteristics of
the three grades of Surlyn also showed the same trends as Surlyn 8940, which was
previously reported as having self-healing abilities.
The study then focused on new areas involving the development of Surlyn plaques and
Surlyn fibres focusing on the self-healing and self-sensing abilities of Surlynseparately.
Although Surlynplaques were fabricated and shown to have stable thermal characteristics,
indentation and ballistics experiments were unable to be carried out.
A new and novel method was designed to extrude Surlyn fibres of varying diameter. Both
grades of Surlyn PC2000 and 9910 were shown to transmit light, however once smaller
diameter fibres were extruded Surlyn PC2000 showed the highest light transmission results.
This fibre then underwent several experiments which showed that Surlyn fibres have the
ability to act as a self-sensing light guides. During the attenuation studies on the Surlyn
PC2000 fibres, the fibres were shown to undergo permanent damage as the weight applied to
- 137 -
the fibre increased. This shows that a protective coating around the fibre will be needed for
further application of the fibres.
Although the self-healing ability of Surlyn was discussed in the literature review section, due
to circumstances outside of the authors control indentation and ballistics experiments were not
carried out. However the crack healing ability of Surlyn fibres and films was studied during
mode I fracture tests. All results showed that the Surlyn was able to act as a crack arrestor
increasing the fracture toughness of the carbon-fibre composite and also suggesting that
Surlyn is able to self-heal.
Overall Surlyn has shown the ability as both a self-sensing and self-healing material. Joining
the self-healing and self-sensing properties together, Surlyn composites were fabricated with
varying fibres.
The next step is to demonstrate both the properties together during both indentation and
ballistics experiments and also further mode I experiments. Further exploitation of the
Surlyn fibres is another key area and is discussed in the future work chapter 7.0.
- 138 -
6.0 Conclusion
Initial primary characterisation studies showed that all three grades of Surlyn were low
density amorphous materials. They also had a low refractive index of ~ 1.51 and were
lightweight and transparent in form. These properties initially suggested that Surlyn would
be ideal for incorporation into a composite and contain light guide capabilities. Following the
preliminary characterisation studies, the self-healing and self-sensing properties of Surlyn®
were studied. Novel techniques were developed to produce both thick Surlyn plaques and
Surlyn fibres. The thick Surlyn plaques were shown to have stable heat flow properties.
Two methods involving the use of weights and a custom haul off machine were developed to
produce Surlyn PC2000 and 9910 fibres of varying diameter. Initial tests showed that
Surlyn PC2000 recorded the highest light intensity measurements of up to ~ 93 mW and had
the longest light guide properties. Factors such as fibre quality, the cleave angle and metal
cation present in the material influenced the light intensity results. Further light transmission
experiments showed that Surlyn PC2000 fibres were able to guide light efficiently and
readings were stable over short periods of time. The fibres also showed the ability to provide
information when damaged proving their ability as a self-sensing material. However during
attenuation experiments permanent damage was caused to the fibre suggesting the need for a
fibre coating.
Using 16 ply carbon-fibre composite beam samples, Surlyn PC2000 fibres and Surlyn 1706
film were used as crack arrestors during mode I fracture toughness tests. Both grades of
Surlyn were shown to act as crack arrestors increasing the fracture toughness of the carbon-
- 139 -
fibre composites and also suggesting that Surlyn is able to self-heal. The Surlyn fibres
increased the fracture toughness by 32 % and the Surlyn® film and Surlyn® punctured film
increased the fracture toughness by 18 % and 27 %. The punctures in the Surlyn® film
enabled increased interlaminar bonding between the film and the fibres.
Following the reported self-healing and self-sensing properties, Surlyn composites were
developed and fabricated. VTM264 glass-fibre pre-preg was incorporated with both Surlyn
1706 film and Surlyn PC2000 fibres producing a self-healing and self-sensing Surlyn
composite.
- 140 -
7.0 Future Work
Future areas of study include light guide, light intensity, impact and puncture testing. Using
the thick Surlyn® plaques; heat flow through the samples could be monitored during puncture
and ballistics experiments. The optimum temperature for self-healing could then be
investigated. Heating the tool used to puncture the sample could be another variable. The use
of a high speed camera to monitor the self-healing phenomenon could also be used.
Further indentation tests using the fabricated Surlyn® and SDOF composite could also be
carried out. The fibres could be connectorised enabling light intensity measurements to be
carried out. During indentation tests the self-healing and self-sensing ability of the composite
could be studied. During my course of study, Surlyn® and glass-fibre composites were
produced. Further indentation and ballistic testing could be carried out to investigate the self-
healing capacity of the composites. Incorporating different types of fibres could also be
examined, further investigating the idea of a self-healing and self-sensing composite.
The fabrication of Surlyn® fibres is another important area. Smaller diameter fibres could be
produced, enabling further light guide and light intensity measurements. The fibres could then
be placed under tension or flexion further investigating the self-sensing capabilities of
Surlyn® fibres.
Further crack arrestor composites could be fabricated incorporating both Surlyn® and different
types of fibres. During mode I testing the fibres could be connectorised and light intensity

- 141 -
measurements could be recorded. The experiment could be monitored using a high speed
camera, further researching self-healing and self-sensing composites.
Other grades of Surlyn® could be added to the above experiments investigating whether the
different grades of Surlyn® react differently to the ones already studied.
- 142 -
8.0 Appendices
A1.1 Figure 1a – Raw data for Surlyn PC2000 density measurements.
Surlyn PC 2000
Sample Weight (g)
Sample Buoyancy (g)
Density of Liquid
Density (g/cm3
1 0.22071 0.15607 0.68376 0.967 2 0.18467 0.13044 0.68376 0.968 3 0.22125 0.15636 0.68376 0.967 4 0.22906 0.16165 0.68376 0.969 5 0.18232 0.12872 0.68376 0.968
Average = 0.968
A1.2 Figure 1b - Raw data for Surlyn 9910 density measurements.
A1.3 Figure 1c – Raw data for Surlyn 1706 density measurements.
Surlyn 1706 Sample Weight
(g) Sample Buoyancy
(g) Density of
Liquid Density (g/cm3
1 0.01239 0.00858 0.68376 0.987 2 0.01132 0.00786 0.68376 0.985 3 0.00963 0.00658 0.68376 0.977 4 0.00887 0.00621 0.68376 0.977 5 0.01013 0.00735 0.68376 0.942
Average = 0.974
Surlyn 9910 Sample Weight
(g) Sample Buoyancy
(g) Density of
Liquid Density (g/cm3
1 0.26872 0.18882 0.68376 0.973 2 0.28532 0.20032 0.68376 0.974 3 0.24625 0.17298 0.68376 0.973 4 0.27091 0.19025 0.68376 0.974 5 0.26605 0.18697 0.68376 0.973
Average = 0.973
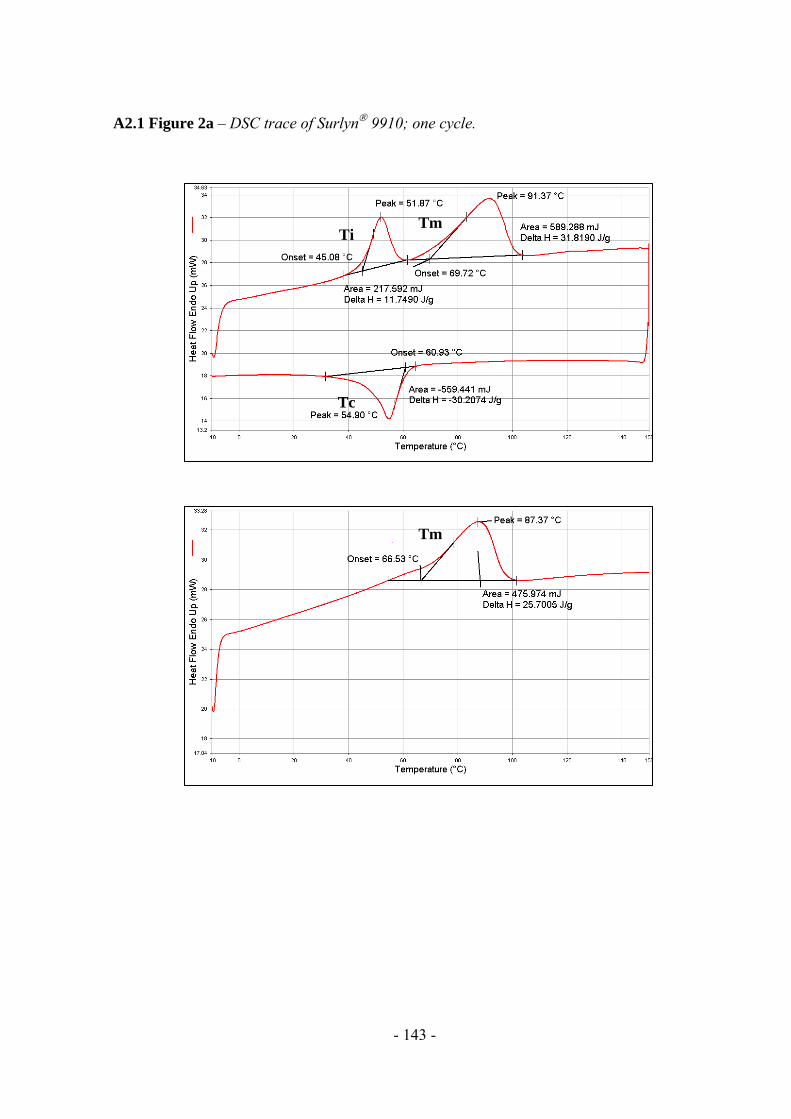
- 143 -
A2.1 Figure 2a – DSC trace of Surlyn 9910; one cycle.
Ti Tm
Tc
Tm
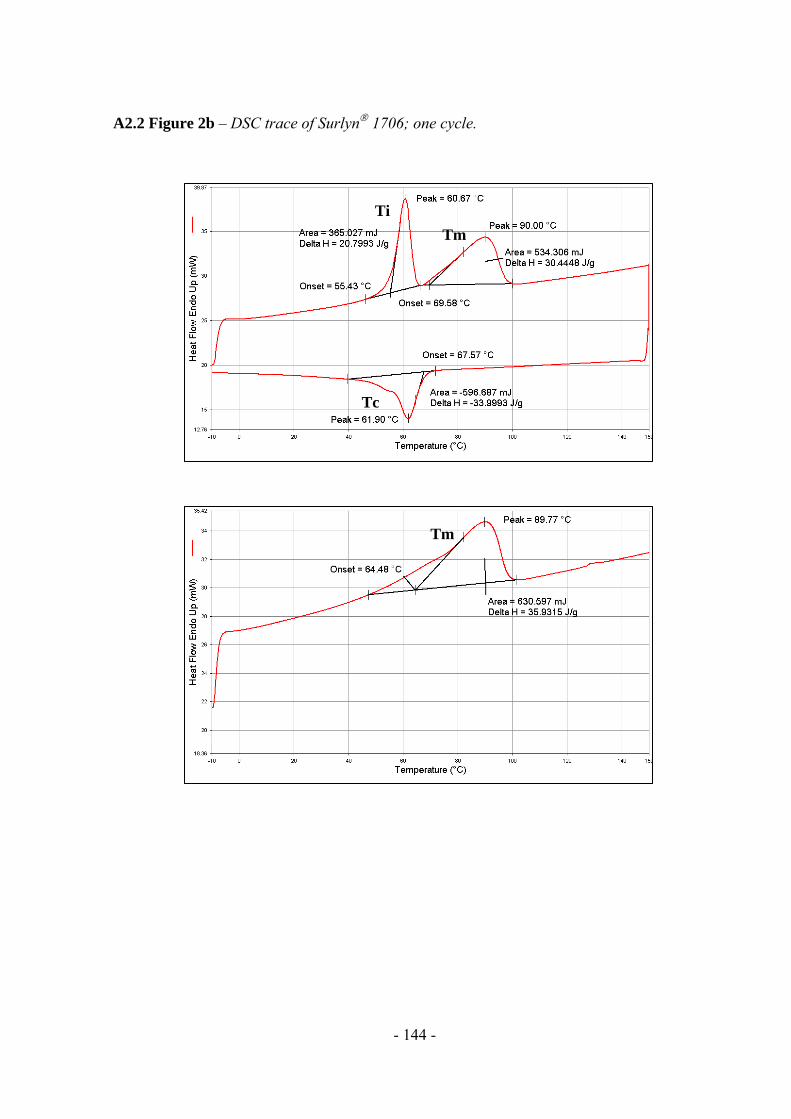
- 144 -
A2.2 Figure 2b – DSC trace of Surlyn 1706; one cycle.
Ti
Tm
Tm
Tc
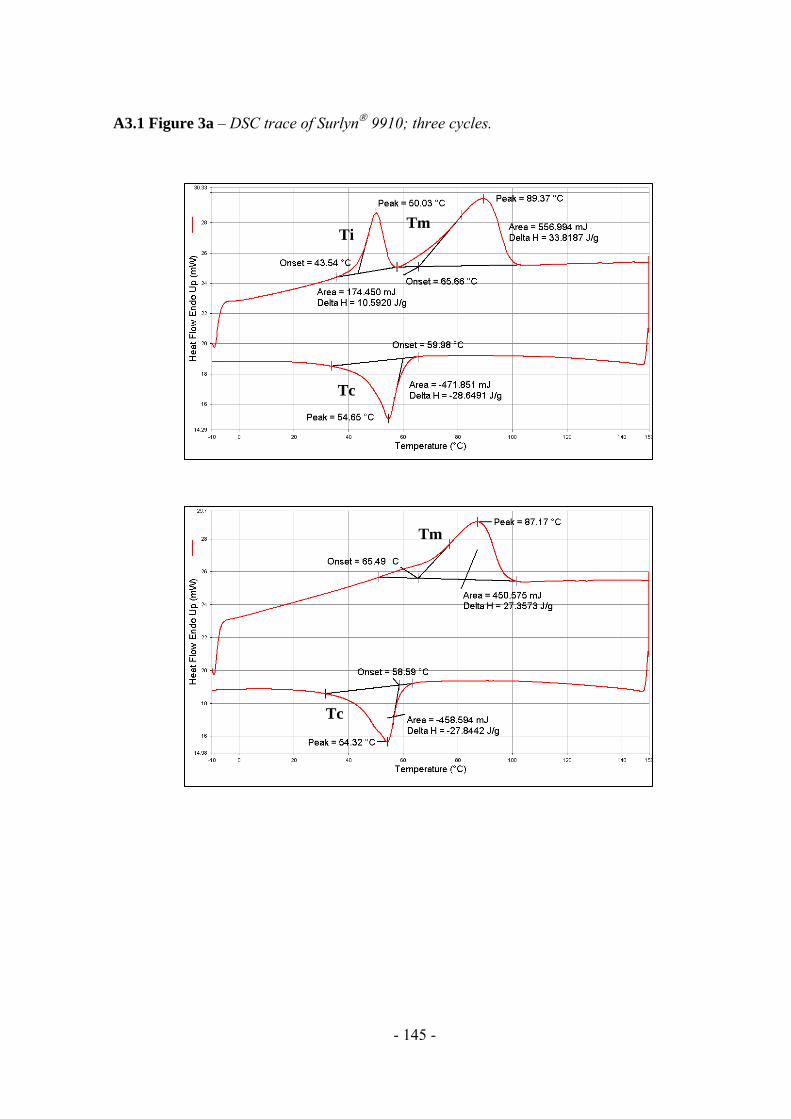
- 145 -
A3.1 Figure 3a – DSC trace of Surlyn 9910; three cycles.
Tc
Tm
Tm Ti
Tc
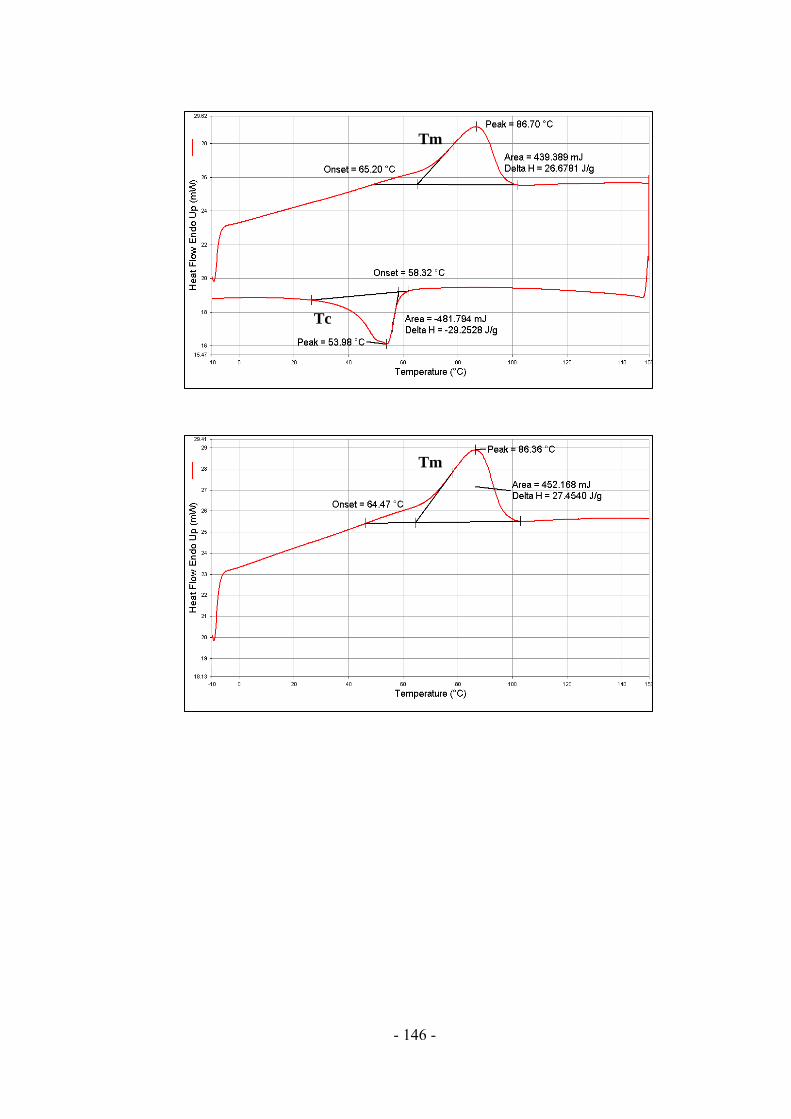
- 146 -
Tm
Tm
Tc
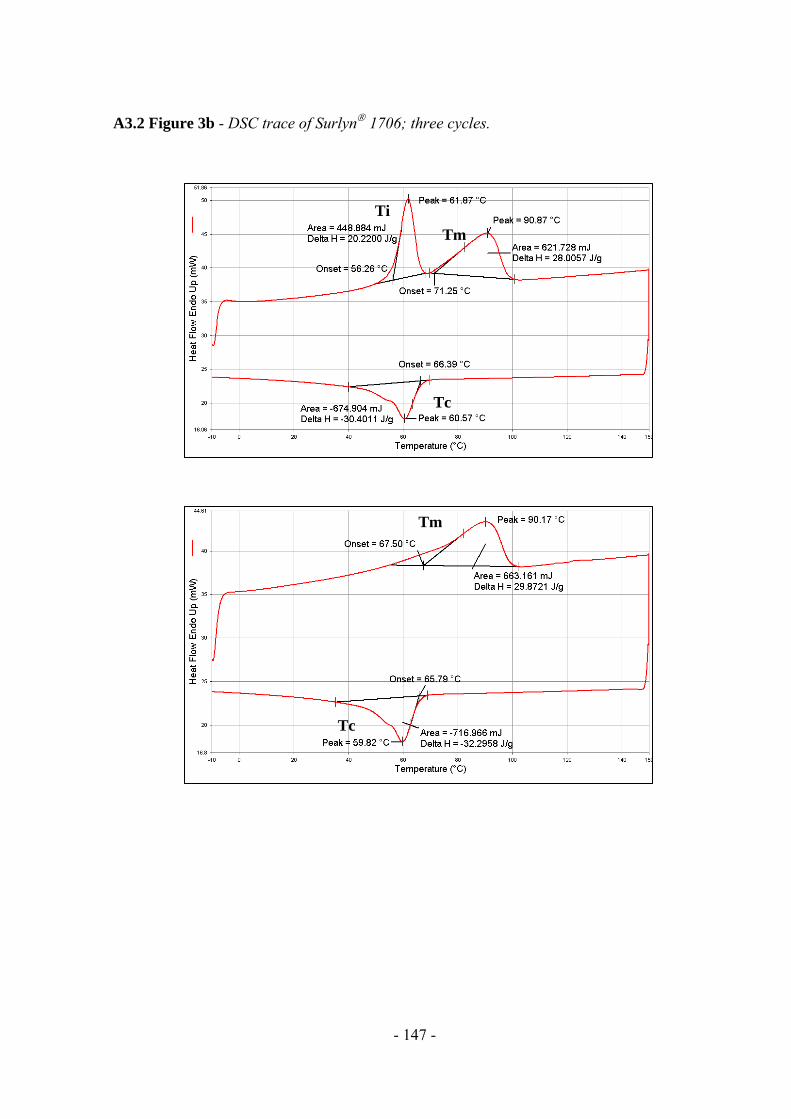
- 147 -
A3.2 Figure 3b - DSC trace of Surlyn 1706; three cycles.
Tm
Tm
Tc
Tc
Ti
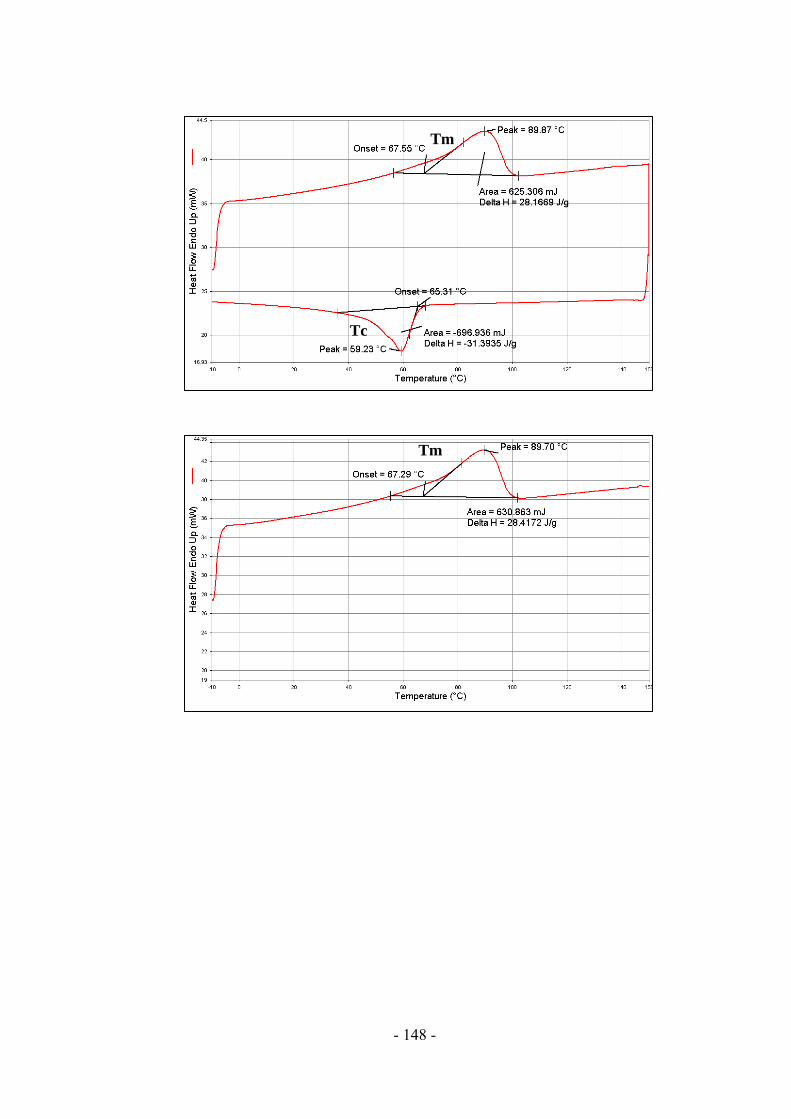
- 148 -
(c)
Tm
Tm
Tc
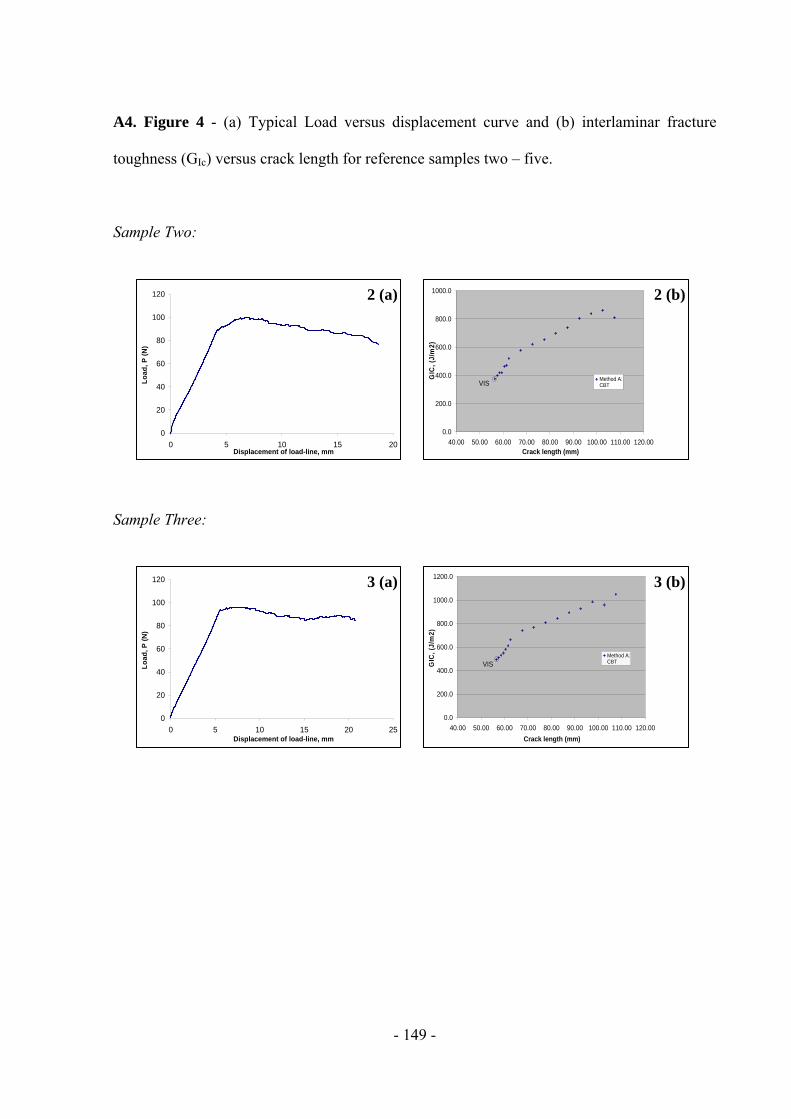
- 149 -
A4. Figure 4 - (a) Typical Load versus displacement curve and (b) interlaminar fracture
toughness (GIc) versus crack length for reference samples two – five.
Sample Two:
Sample Three:
0.0
200.0
400.0
600.0
800.0
1000.0
40.00 50.00 60.00 70.00 80.00 90.00 100.00 110.00 120.00Crack length (mm)
GIC
, (J/
m2)
Method A:CBTVIS
0
20
40
60
80
100
120
0 5 10 15 20Displacement of load-line, mm
Lo
ad
, P
(N
)
0
20
40
60
80
100
120
0 5 10 15 20 25Displacement of load-line, mm
Lo
ad
, P (
N)
0.0
200.0
400.0
600.0
800.0
1000.0
1200.0
40.00 50.00 60.00 70.00 80.00 90.00 100.00 110.00 120.00
Crack length (mm)
GIC
, (J/
m2)
Method A:CBTVIS
2 (a) 2 (b)
3 (a) 3 (b)
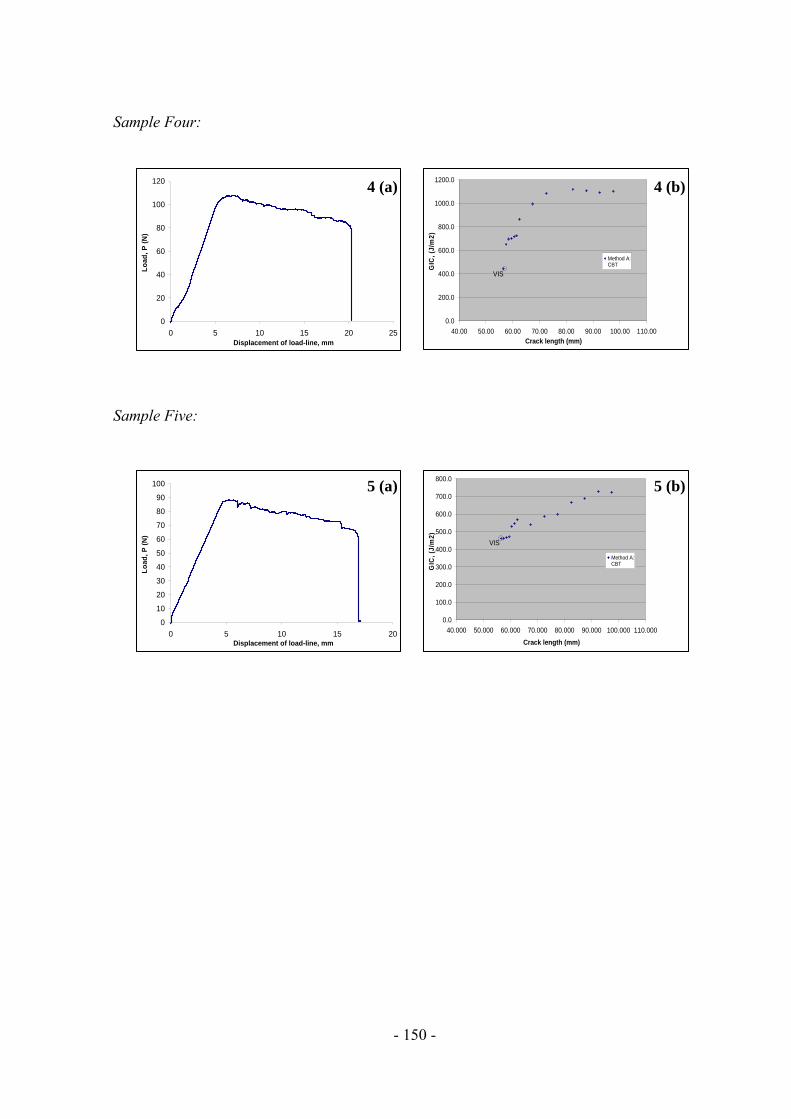
- 150 -
Sample Four:
Sample Five:
0
20
40
60
80
100
120
0 5 10 15 20 25Displacement of load-line, mm
Lo
ad,
P (
N)
0.0
200.0
400.0
600.0
800.0
1000.0
1200.0
40.00 50.00 60.00 70.00 80.00 90.00 100.00 110.00Crack length (mm)
GIC
, (J/
m2)
Method A:CBT
VIS
0
10
20
30
40
50
60
70
80
90
100
0 5 10 15 20Displacement of load-line, mm
Lo
ad, P
(N
)
0.0
100.0
200.0
300.0
400.0
500.0
600.0
700.0
800.0
40.000 50.000 60.000 70.000 80.000 90.000 100.000 110.000
Crack length (mm)
GIC
, (J
/m2)
Method A:CBT
VIS
4 (a) 4 (b)
5 (a) 5 (b)
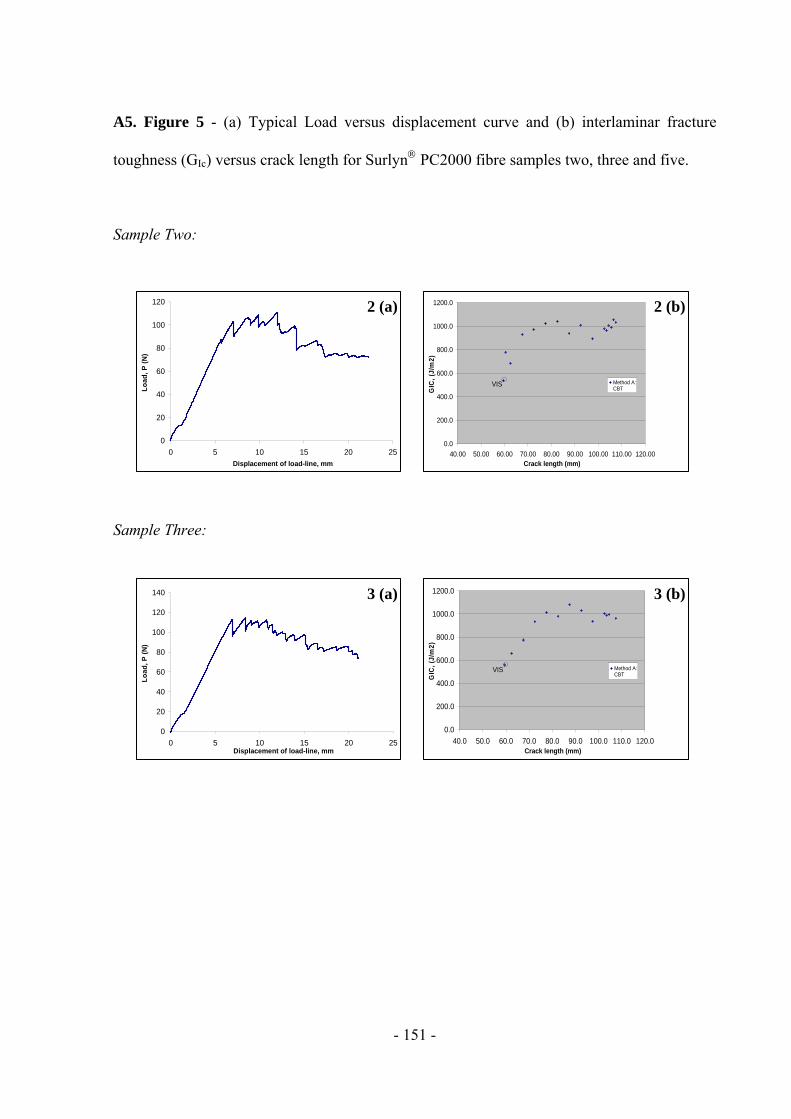
- 151 -
A5. Figure 5 - (a) Typical Load versus displacement curve and (b) interlaminar fracture
toughness (GIc) versus crack length for Surlyn PC2000 fibre samples two, three and five.
Sample Two:
Sample Three:
0
20
40
60
80
100
120
0 5 10 15 20 25
Displacement of load-line, mm
Lo
ad
, P (
N)
0.0
200.0
400.0
600.0
800.0
1000.0
1200.0
40.00 50.00 60.00 70.00 80.00 90.00 100.00 110.00 120.00Crack length (mm)
GIC
, (J/
m2)
Method A:CBT
VIS
0
20
40
60
80
100
120
140
0 5 10 15 20 25Displacement of load-line, mm
Lo
ad
, P (
N)
0.0
200.0
400.0
600.0
800.0
1000.0
1200.0
40.0 50.0 60.0 70.0 80.0 90.0 100.0 110.0 120.0Crack length (mm)
GIC
, (J/
m2)
Method A:CBT
VIS
2 (a) 2 (b)
3 (a) 3 (b)
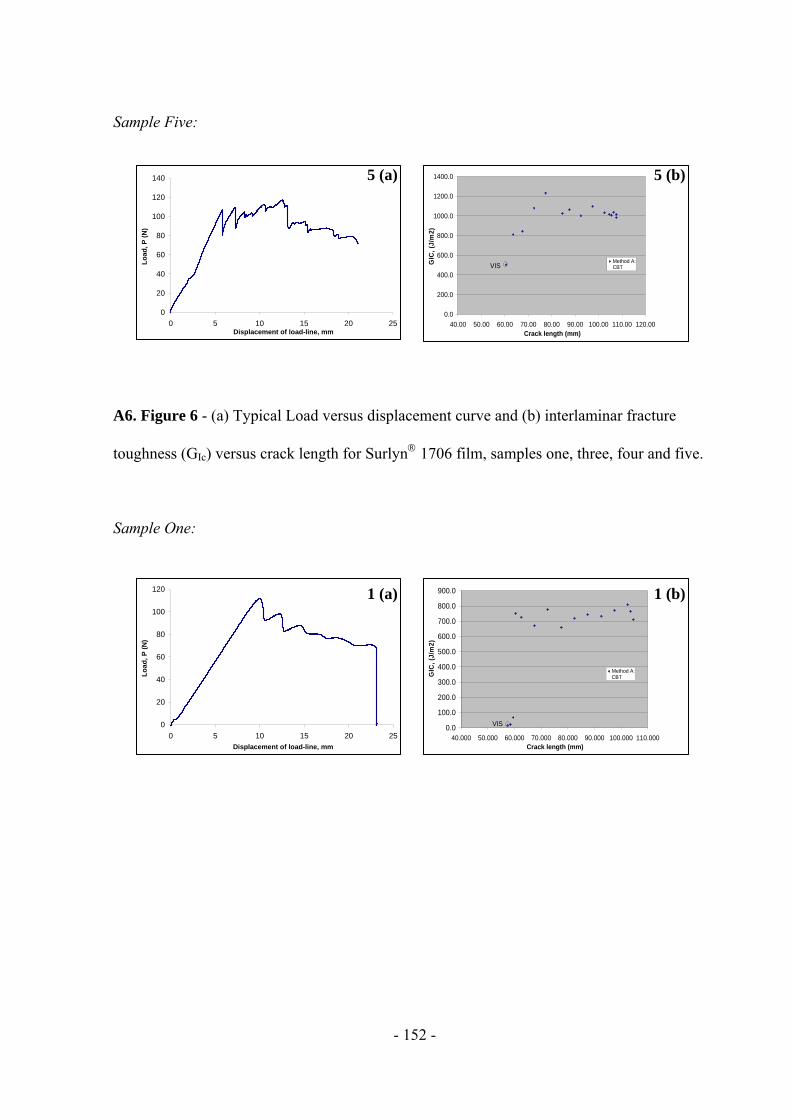
- 152 -
Sample Five:
A6. Figure 6 - (a) Typical Load versus displacement curve and (b) interlaminar fracture
toughness (GIc) versus crack length for Surlyn 1706 film, samples one, three, four and five.
Sample One:
0
20
40
60
80
100
120
140
0 5 10 15 20 25Displacement of load-line, mm
Lo
ad, P
(N
)
0.0
200.0
400.0
600.0
800.0
1000.0
1200.0
1400.0
40.00 50.00 60.00 70.00 80.00 90.00 100.00 110.00 120.00Crack length (mm)
GIC
, (J
/m2)
Method A:CBTVIS
0
20
40
60
80
100
120
0 5 10 15 20 25Displacement of load-line, mm
Lo
ad
, P
(N
)
0.0
100.0
200.0
300.0
400.0
500.0
600.0
700.0
800.0
900.0
40.000 50.000 60.000 70.000 80.000 90.000 100.000 110.000Crack length (mm)
GIC
, (J
/m2)
Method A:CBT
VIS
5 (a) 5 (b)
1 (a) 1 (b)
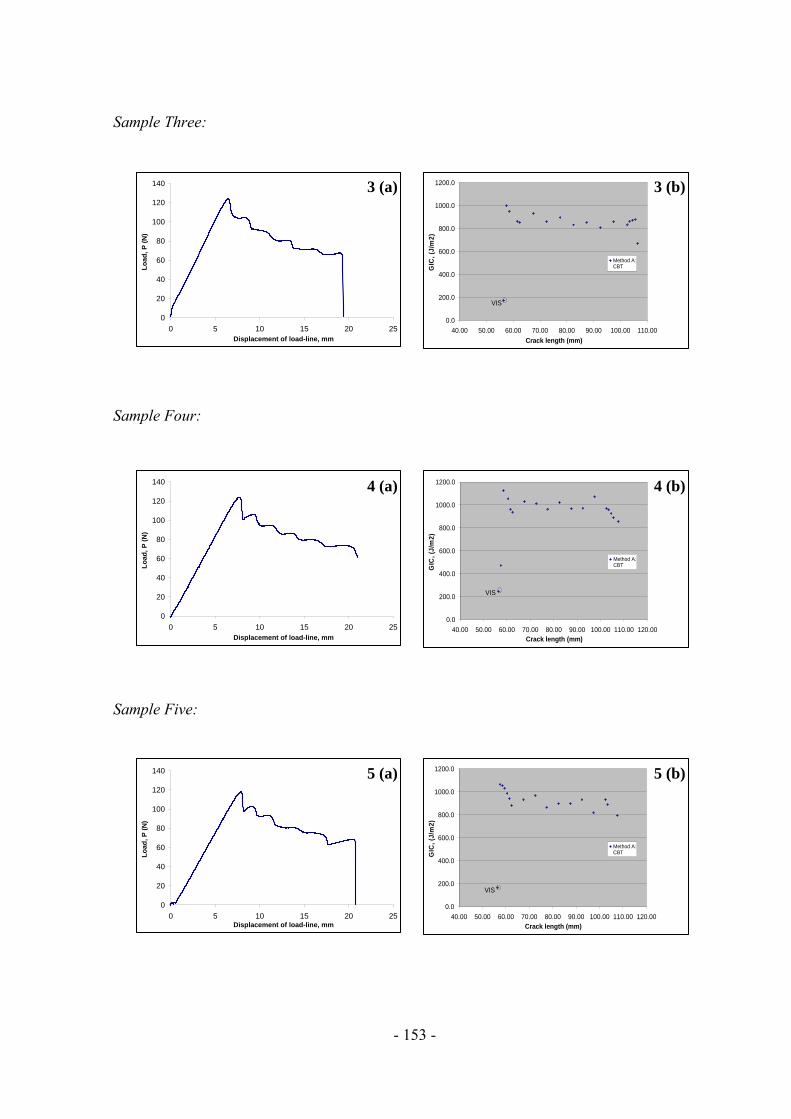
- 153 -
Sample Three:
Sample Four:
Sample Five:
0
20
40
60
80
100
120
140
0 5 10 15 20 25Displacement of load-line, mm
Lo
ad
, P
(N
)
0.0
200.0
400.0
600.0
800.0
1000.0
1200.0
40.00 50.00 60.00 70.00 80.00 90.00 100.00 110.00
Crack length (mm)
GIC
, (J
/m2)
Method A:CBT
VIS
0
20
40
60
80
100
120
140
0 5 10 15 20 25Displacement of load-line, mm
Lo
ad,
P (
N)
0
20
40
60
80
100
120
140
0 5 10 15 20 25Displacement of load-line, mm
Lo
ad, P
(N
)
0.0
200.0
400.0
600.0
800.0
1000.0
1200.0
40.00 50.00 60.00 70.00 80.00 90.00 100.00 110.00 120.00Crack length (mm)
GIC
, (J
/m2)
Method A:CBT
VIS
0.0
200.0
400.0
600.0
800.0
1000.0
1200.0
40.00 50.00 60.00 70.00 80.00 90.00 100.00 110.00 120.00Crack length (mm)
GIC
, (J
/m2
)
Method A:CBT
VIS
3 (a) 3 (b)
4 (a) 4 (b)
5 (a) 5 (b)
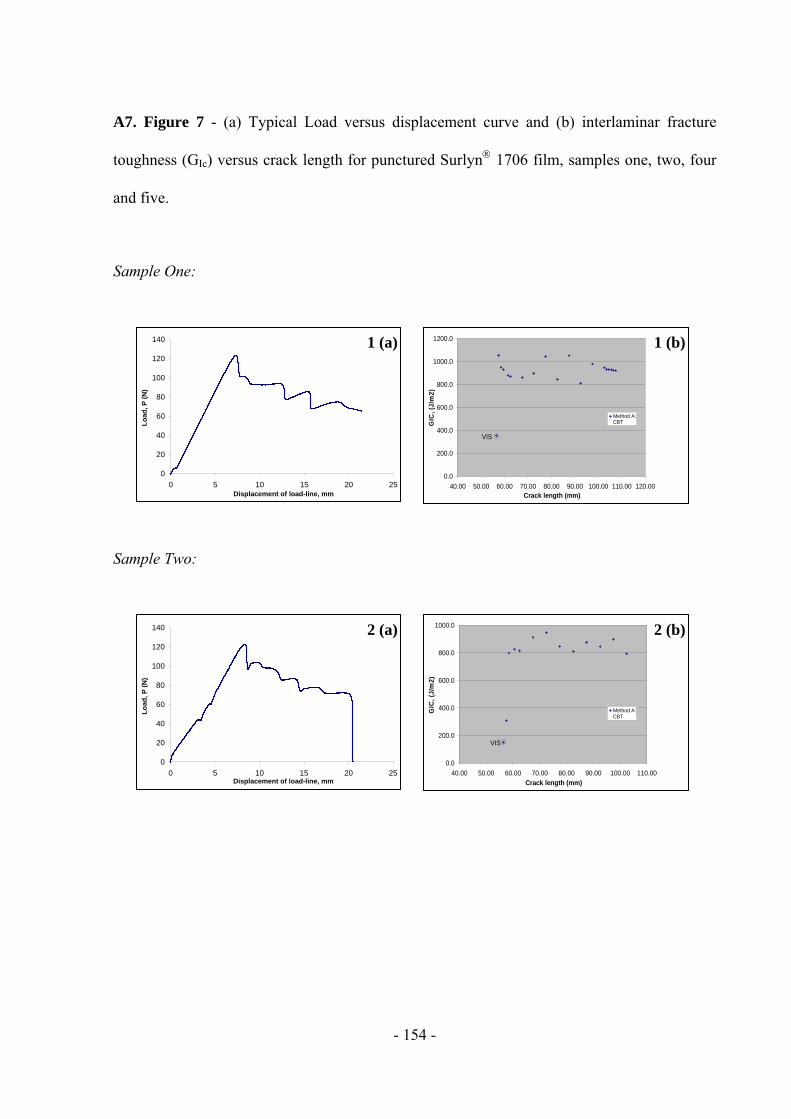
- 154 -
A7. Figure 7 - (a) Typical Load versus displacement curve and (b) interlaminar fracture
toughness (GIc) versus crack length for punctured Surlyn 1706 film, samples one, two, four
and five.
Sample One:
Sample Two:
0
20
40
60
80
100
120
140
0 5 10 15 20 25Displacement of load-line, mm
Lo
ad,
P (
N)
0.0
200.0
400.0
600.0
800.0
1000.0
1200.0
40.00 50.00 60.00 70.00 80.00 90.00 100.00 110.00 120.00Crack length (mm)
GIC
, (J
/m2
)
Method A:CBT
VIS
0
20
40
60
80
100
120
140
0 5 10 15 20 25Displacement of load-line, mm
Lo
ad,
P (
N)
0.0
200.0
400.0
600.0
800.0
1000.0
40.00 50.00 60.00 70.00 80.00 90.00 100.00 110.00Crack length (mm)
GIC
, (J
/m2)
Method A:CBT
VIS
1 (a) 1 (b)
2 (a) 2 (b)
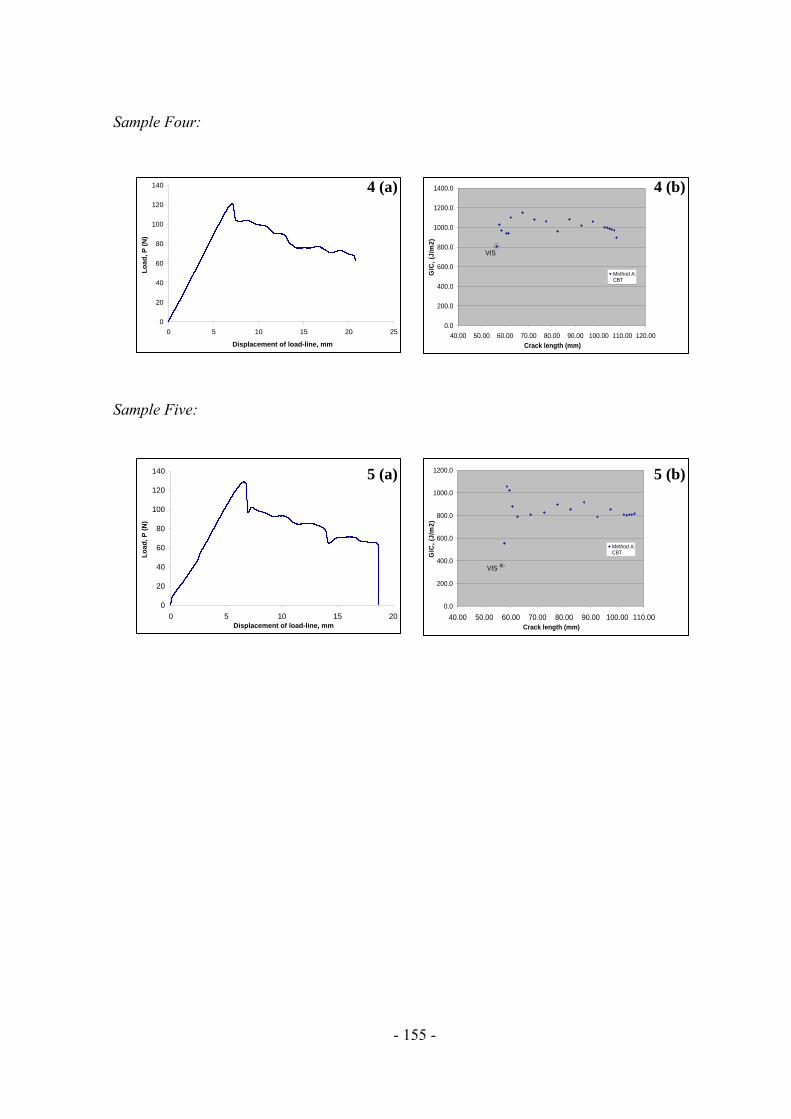
- 155 -
Sample Four:
Sample Five:
0
20
40
60
80
100
120
140
0 5 10 15 20 25
Displacement of load-line, mm
Lo
ad
, P
(N
)
0.0
200.0
400.0
600.0
800.0
1000.0
1200.0
1400.0
40.00 50.00 60.00 70.00 80.00 90.00 100.00 110.00 120.00
Crack length (mm)
GIC
, (J
/m2)
Method A:CBT
VIS
0
20
40
60
80
100
120
140
0 5 10 15 20Displacement of load-line, mm
Lo
ad,
P (
N)
0.0
200.0
400.0
600.0
800.0
1000.0
1200.0
40.00 50.00 60.00 70.00 80.00 90.00 100.00 110.00Crack length (mm)
GIC
, (J
/m2
)
Method A:CBT
VIS
4 (a) 4 (b)
5 (a) 5 (b)
- 156 -
9.0 References
1) DuPont miracles of science, product grades, by family.
http://www2.dupont.com/Surlyn/en_US/products/index.html.
2) Samadzadeh, H., Baura, S. H., Peikari, M., Kashiriha, S. M, and Ashrafi, A, A
review of self-healing coatings based on micro/nancapsules. Progress in organic
coatings, 2010, 68 (3) p: 159-164.
3) Hager, M. D., Greil, P., Leyans, C., van der Zwaag, S, and Schubert, U. S, Self-
healing materials. Advanced Materials, 2010, 22 (47) p: 5424-5430.
4) Kalista, Jr., S. J, Self-healing of Thermoplastic Poly(ethylene-co-methacrylic Acid)
Copolymers Following Projectile Puncture. Masters Thesis, Virginia Tech. 2003.
5) Coughlin, C. S., Martinelli, A. A, Boswell, R. F, Mechanism of Ballistic Self-healing
in EMAA Ionomers. Polymeric Materials science and Engineering, 2004, 91 (228):
p. 261 – PMSE.
6) Huber, A, and Hinkley, J. A, Impression Testing of Self-healing Polymers. NASA,
2005, p. 1-12.
7) Rees, R, and Vaughan, D. J, Polymer Preprints. American Chemical Society,
Division of Polymer Chemistry, 1965, (6): p. 287-295.
- 157 -
8) Ma, X., Sauer, J. A, and Hara, M, Dynamic Mechanical Properties and Morphology.
Macromolecules, 1995, 28 (11): p. 3953 – 3962.
9) Tant, M.R, and Wilkes, G. L, Viscoelastic Behaviour of Ionomers in Bulk and
Solution, in Structure and Properties of Ionomers. A. Eisenberg, Editor. 1987, D.
Reidel Publishing Co.: Dordrecht. p. 191-226.
10) Eisenberg, A, and Kim J – S, Introduction to Ionomers. John Wiley and Sons, Inc.
New York, 1998.
11) Eisenberg, A, and Rinaudo, M, Polyelectrolytes and Ionomers. Polymer Bulletin,
1990. 24 (6): p. 671-671.
12) Farrell, K. V, and Grady, B. P, Effects of Temperature on Aggregate Local Structure
in a Zinc Neutralized Carboxylate Ionomer. Macromolecules, 2000. 33 (19): p.
7122- 7126.
13) Grady, B. P., Floyd, J. A., Gennetti, W. B., Vanhoorne, P, and Register, R. A, X-ray
absorption spectroscopy studies of zinc neutralized ethylene-methacrylic acid
ionomers. Polymer, 1999. 40 (2): p. 283 – 288.
14) Kuwabara, K, and Horii F. J, Solid-state NMR analyses of the crystalline-
noncrystalline structure and its thermal changes for ethylene ionomers. Polymer
Physics, 2002. 40 (11): p. 1142 – 1153.
- 158 -
15) Grady, B. P, Effect of Co-neutralization on Internal Aggregate Structure in Ethylene
Based Ionomers. Macromolecules, 1999. 32 (9): p. 2893 – 2988.
16) Zhong, X. F, and Eisenberg, A, Aggregation and Critical Micellization Behaviour of
Carboxylate Terminated Monohelic Polystyrene. Macromolecules, 1994. 27 (7): p.
1751 – 1758.
17) Cowan, J. C. and Teeter, H. M, Ind. Eng. Chem. 1994, 36: p. 48-152.
18) Eisenberg, A., Hird, B, and More, R. B, A New Multiplet-Cluster Model for the
Morphology of Random Ionomers. Macromolecules, 1989. 23 (18): p. 4098 – 4107.
19) Lantman, C. W, and Macknight, W. J, Structural Properties of Ionomers. Annual
Review of Material Science, 1989. 19: p. 295 – 317.
20) Kim, J-S., Nah, Y. H., Jarng, S-S., Kim, W., Lee, Y, and Kim, Y-W, Clustering in
poly(methyl acrylate) ionomers. Polymer, 1999. 41 (8): p. 3099 – 3102.
21) Varley, R. J, and van der Zwaag, S, Towards an understanding of thermally
activated self-healing of an ionomer system during ballistic penetration. Acta
Materialia, 2008. 56 (19): p. 5737 – 5750.
22) Fall, R, Puncture Reversal of Ethylene Ionomers – Mechanistic Studies. Masters of
Science in Chemistry, Blacksburg, Virginia, 2001.
- 159 -
23) Holiday, L, Ionic Polymers. Applied Science, London, 1975.
24) Eisenberg, A, and King, M, Ion Containing Polymers: Polymer Physics. Academic:
New York, Volume 2, 1977.
25) Kutsumizu, S., Nagao, N., Tadano, K., Tachino, H., Hirasawa, E, and Yano S,
Effects of water sorption on the structure and properties of ethylene ionomers.
Macromolecules, 1992. 25 (25): p. 6829 – 6835.
26) Tadano, K., Hirasawa, E., Yamamoto, H, and Yano, S, Order-disorder transition of
ionic clusters in ionomers. Macromolecules, 1989. 22 (1): p. 226 – 233.
27) Bellinger, M.A., Sauer, J. A, and Hara, M, Tensile Fracture Properties of Rigid-
Rigid Blends made of Sulfonated Polystyrene Ionomer and Polystyrene.
Macromolecules, 1994. 27 (21): p. 6147 – 6155.
28) Statz, R, Ethylene Copolymer Ionomers, in History of Polyolefin’s; The World’s
Most Widely Used Polymers. R. B. Seymour, and T. Cheng, Editors. 1986, p. 177-
182.
29) Rees, R, Ionomeric thermoplastic elastomers early research-Elastomers: A
Comprehensive Review. N. R. Legge, G. Holden, and H. E. Schroeder, Editors.
1987, p. 231-243.
- 160 -
30) Varley, R, Ionomers as Self-healing Polymers. Self Healing Materials, S. van der
Zwaag, Editor. 2007, p. 95-114.
31) Surlyn Product Sheets, http://www.dupont.com/packaging/products/resins/E-48623-
2/E48623-2.html.
32) Jerome, R, and Mazurek, M, Ionomers: Synthesis, Structure, Properties and
Applications. M. R. Tant, K. A. Mauritz, and G. L. Wilkes, Editors. Blackie
Academic and Professional: London. 1997.
33) Kalista, Jr., S. J, and Ward, T. C, Thermal characteristics of the self-healing
response in poly (ethylene-co-methacrylic acid) copolymers. Journal of the Royal
Society, 2007, 4 (13): p. 405-411.
34) Van der Zwaag, S, Self-Healing Materials; An Alternative Approach to 20 Centuries
of Materials Science. R. Hull, R. M. Osgood, Jr. J. Parisi, and H. Warlimont,
Editors. 2007.
35) Kamphaus, J. M., Rule, J. D., Moore, J. S., Sottos, N. R, and White, S. R, A new
self-healing epoxy with tungsten (VI) chloride catalyst. Journal of the Royal Society,
2007, 5: p. 95-104.
- 161 -
36) Brown, E. N., White, S. R, and Sottos, N. R, Retardation and repair of fatigue
cracks in a microcapsule toughened epoxy composite-part II: In situ self-healing.
Composites Science and Technology, 2005, 65: p. 2474-2480.
37) Yuan, Y. C., Yin, T., Rong, M. Z, and Zhang, M. Q, Self-healing in polymers and
polymer composites. Concepts, realization and outlook: A review. Express Polymer
Letters, 2008, 2 (4): p. 238-250.
38) Bergman, S. D, and Wudl, F, Mendable Polymers. Journal of Materials Chemistry,
2007, 18: p. 41-62.
39) Kessler, M. R, Self-healing: a new paradigm in materials design. Proceedings of the
Institution of Mechanical Engineers, Part G: Journal of Aerospace Engineering,
2007, 221 (4): p. 479-495.
40) Ghosh, S. W, Self-healing Materials: Fundamentals, Design Strategies, and
Applications. WILEY-VCH Verlag GmbH & Co. 2009.
41) Bergman, S. D, and Wudl, F, Re-Mendable Polymers. Self Healing Materials, van
der Zwaag, Editor. 2007, p. 45-68.
42) Chujo, Y., Sada, K., Naka, A., Nomura, R, and Saegusa, T, Synthesis and redox
gelation of disulfide-modified polyoxazoline. Macromolecules, 1993, 26 (5): p. 883-
887.
- 162 -
43) Chung, C. M., Rob, Y. S., Cho, S. Y, and Kim, J. G, Crack healing in polymeric
materials via photochemical cyclo-addition. Chemistry of Materials, 2004, 16 (21):
p. 3982-3984.
44) Yin, T., Rong, M. Z., Zhang, M. Q, Yang, G. C, Self-healing epoxy composites –
Preparation and effect of the healent consisting of microencapsulated epoxy and
latent curing agent. Composites Science and Technology, 2007, 67 (2): p. 201-212.
45) Rule, J. D., Sottos, N. R., White, S. R, and Moore, J. S, The chemistry of self-healing
polymers. Education in Chemistry, 2005, 42 (5): p. 130-132.
46) Dry, C, Passive tuneable fibres and matrices. International Journal of Modern
Physics B, 1992, 6 (15-16): p. 2763-2771.
47) Dry, C, and McMillan, W, Three-part methyl metha-crylate adhesive system as an
internal delivery system for responsive concrete. Smart Materials Structures, 1996, 5
(3): p. 297-300.
48) Dry, C, Procedures developed for self repair of polymer matrix composite materials.
Composite Structures, 1996, 35 (3): p. 263-269.
49) Bleay, S. M., Loader, C. B., Hawyes, V. J, Humberstone, L, and Curtis, V, A smart
repair system for polymer matrix composites. Composites Part A: Applied Science
and Manufacturing, 2001, 32 (12): p. 1767-1776.
- 163 -
50) Pang, J. W. C, and Bond, I. P, A hollow fibre reinforced polymer composite
encompassing self-healing and enhanced damage visibility. Composite science
Technology, 2005, 65 (11-12): p. 1791-1799.
51) Pang, J. W. C, and Bond, I. P, Bleeding Composites – damage detection and self-
repair using a biomimetic approach. Composite science Technology, 2005, 36 (2):
p. 183-188.
52) Trask, R. S, and Bond, I. P, Biomimetic self-healing of advanced composite
structures using hollow glass fibres. Smart Materials Structures, 2006, 15 (3): p.
704-710.
53) Williams, G, A self-healing carbon fibre reinforced polymer for aerospace
applications. Composites Part A: Applied Science and Manufacturing, 2007, 38 (6):
p. 1525-1532.
54) Trask, R. S, and Bond, I. P, Self-healing of Composite Structures in a Space
Environment. 15th International Conference on Composite Materials (ICCM-15),
Durban, SA, 27th June-1st July 2005.
55) Dry, C. M, Self-repairing reinforced matrix materials. Pub. No.: US 2008/0107888
A1. Pub. Date: May 8, 2008.
- 164 -
56) White, S. R., Sottos, N. R., Geubelle, P. H., Moore, J. S., Kessler, M. R., Sriram, S.
R., Brown, E. N, and Viswanathan, S, Autonomic healing of polymer composites.
Nature, 2001, 409: p. 794-797.
57) Brown, E. N., Kessler, M. R., Sottos, N. R, and White, J, Microencapsul. 2003, (20),
719.
58) Brown, E. N., Sottos, N. R, White, S. R, Fracture Testing of a Self-healing Polymer
Composite. Experimental Mechanics, 2002, 42 (4): p. 372-379.
59) Kessler, M. R., Sottos, N. R, and White, S. R, Self-healing structural composite
materials. Composites Part A: Applied Science and Manufacturing, 2003, 34 (8): p.
743-753.
60) Brown, E. N., White, S. R, and Sottos, N. R, Microencapsule induced toughening in
a self-healing polymer composite. Journal of Materials Science, 2004, 39 (5): p.
1703-1710.
61) Rule, J. D, Sottos, N. R, and White, S. R, Effect of microcapsule size on the
performance of self-healing polymers. Polymer, 2007, 48 (12): p. 3520-3529.
62) Li, H., Wang, R., Hu, H, and Liu, W, Surface modification of self-healing poly
(urea-formaldehyde) microcapsule using silane-coupling agent. Applied surface
Science, 2008, 255 (5): p. 1894-1900.
- 165 -
63) Blaiszik, B. J., Sottos, N. R, White, S. R, Nanocapsule for self-healing materials.
Composite Science and Technology, 2008, 68 (3-4): p. 978-986.
64) Cho, S, H., Anderson, H, M., White, S. R., Sottos, N. R, and Braun, P. V,
Polydimethylsiloxane-Based Self-healing Materials. Advanced Materials, 2006, 18
(8): p. 997-1000.
65) Keller, M. W., White, S. R, and Sottos, N. R, A Self-healing poly (dimethyl
Siloxane) Elastomer. Advanced Functional Materials, 2007, 17 (): p. 2399-2404.
66) Yin, T., Rong, M. Z., Zhang, M. Q, and Yang, G. C, Self-healing epoxy composites
– Preparation and effect of the healent consisting of microencapsulated epoxy and
latent curing agent. Composite Science and Technology, 2007, 67 (2): p. 201-212.
67) Yin, T., Zhou, L., Rong, M. Z, and Zhang, M. Q, Self-healing woven glass
fabric/epoxy composites with healent consisting of micro-encapsulated epoxy and
latent curing agent. Smart Material Strcutres, 2008, 17 (1).
68) Yin, T., Rong, M. Z., Wu, J., Chen, H, and Zhang, M. Q, Healing of impact damage
in woven glass fabric reinforced epoxy composites. Composites Part A: Applied
Science and Manufacturing, 2008, 39 (9): p. 1479-1487.
69) Toohey, K. S., Sottos, N. R., Lewis, J. A., Moore, J. S, and White, S. R, Self-healing
materials with microvascular networks. Nature, 2007 6: p. 581-585.
- 166 -
70) Williams, H. R., Trask, R. S, and Bond, I. P, Self-healing composite sandwich
structures. Smart Material Structures, 2007, 16: p. 1198.
71) Williams, H. R., Trask, R. S, and Bond, I. P, Self-healing sandwich panels:
Restoration of compressive strength after impact. Composites Science and
Technology, 2008, 68 (15-16): p. 3171-3177.
72) Toohey, K. S., Hansen, C. J., Lewis, J. A., White, S. R, and Sottos, N. R, Delivery of
Two-Part Self-Healing Chemistry via Microvascular Networks. Advanced
Functional Materials, 2009, 19 (9): p. 1399-1405.
73) Hansen, C. J., Wu, W., Toohey, K. S., Sottos, N. R., White, S. R, and Lewis, J. A,
Self-Healing Materials with Interpenetrating Microvascular Networks. Advanced
Materials, 2009, 21 (41): p. 4143-4147.
74) Collins, D. J, Damage Detection in Composite Materials using Acoustic Emission
and Self-sensing Fibres. Masters Thesis, University of Birmingham. 2009.
75) Wang, S., Chung, D. D. L, and Chung, J. H, Self-sensing of damage in carbon fiber
polymer-matrix composite by measurement of the electrical resistance or potential
away from the damaged region. Journal of Materials Science, 2005. (40): p. 6463 –
6472.
- 167 -
76) Hayes, S., Liu, T., Brooks, D., Montheith, S., Ralph, B., Vickers, S, and Fernando,
G. F, In situ self-sensing fibre reinforced composites. Smart Material Structures,
1997. (6): p. 432 – 440.
77) Kister, G., Ralph, B, and Fernando, G. F, Damage detection in glass fibre-reinforced
plastic composites using self-sensing E-glass fibres. Smart Material Structures,
2004. (13): p. 1166 – 1175.
78) Wang, S., Kowalik, D. P, and Chung, D. D. L, Self-sensing attained in carbon-fiber-
polymer-matrix structural composites by using the interlaminar interface as a
sensor. Smart Material Structures, 2004. (13): p. 570 -592.
79) British Standard, Fibre-reinforced plastic composites — Determination of mode I
inter laminar fracture toughness, GIC, for unidirectional reinforced materials. BS
ISO 15024: 2001.
80) DuPont Packaging and Industrial Resins; Surlyn Resins. DuPonttm Surlyn PC2000
data sheet. Miracles of Science, March 2004.
81) DuPont Packaging and Industrial Resins; Surlyn Resins. DuPonttm Surlyn 9910
data sheet. Miracles of Science, March 2004.
82) DuPont Packaging and Industrial Resins; Surlyn Resins. DuPonttm Surlyn 1706
data sheet. Miracles of Science, March 2004.
- 168 -
83) Hirasawa, E., Yamamoto, Y., Tandano, K, and Yano, S, Formation of ionic
crystallites and its effect on the modulus of ethylene ionomers. Macromolecules,
1989, 22 (6): p. 2776 – 2780.
84) Painter, P. C., Brozoski, B. A, and Coleman, M. M, FTIR studies of calcium and
sodium ionomers derived from an ethylene-methacrylic acid and copolymer. Journal
of Polymer Science: Polymer Physics Edition, 1982, 20 (6): p. 1069 – 1080.
85) Kutsumizu, S., Hara, H., Tachino, H., Shimabayashi, K, and Yano, S, Infrared
Spectroscopic Study of the Binary Blends of Sodium and Zinc Salt Ionomers
Produced from Poly (ethylene-co-methacrylic acid). Macromolecules, 1999, 32
(19): p. 6340 – 6347.
86) Fukuda, K, Infrared spectroscopic study for decalcification in the dentine.
Histochemistry and Cell biology, 1986, 6 (2): p. 127 – 130.
87) Siuzdak, D. A., Start, P. R, and Mauritz, K. A, Surlyn/Silicate Hybrid Materials. I.
Polymer In Situ Sol–Gel Process and Structure Characterization. Journal of Applied
Polymer Science, 2000, 77 (13): p. 2882 – 2844.
88) Lawson, E. E., Edwards, H. G. M, and Johnson, A. F, FT Raman spectroscopic
study of the wavenumber region 2800 – 2630 cm−1 of selected organic compounds.
Spectrochimica Acta Part A: Molecular and Biomolecular Spectroscopy, 1995, 51
(12): p. 2057 – 2066.
- 169 -
89) Forsel, M., Fuson, N, and Josien, M, Infrared band assignments for 2900 cm-1
region methyl group vibrations in XC6H4OOCH3, XC6h4CH3 and Xc6H4COCH3.
JOSA, 1960, 50 (12): p. 1228 – 1231.
90) Private communication with DuPont, Surlyn® Refractive Indices.
91) Miller, S. E., Marcatilli, E. A. J, and Li, T, Research toward optical-fiber
transmission systems. I. The transmission medium; II. Devices and System
considerations, 1973, 61: p. 1703-1751.
92) McCarthy, D., O’Keefe, S., Leen, G, and Lewis, E, Optical fibre radiation for low
dose applications. Optical fibre research centre, University of Limerick, 2010.
93) Chung, D. D. L, Carbon Fiber Composites, Materials Science/composites,
Butterworth and Heinmann, 1994.
94) Salmoriaa, G. V., Ahrens, C. H., Fredel, M., Soldi, V, and Pires, A. T. N,
Stereolithography somos 7110 resin: mechanical behavior and Fractography of
parts post-cured by different methods. Polymer Testing, 2005, 24 (2): p. 157–162.
95) Bonhomme, J., Arguelles, A., Vina, J, and Vina, I, Fractography and failure
mechanisms in static mode I and mode II delamination testing of unidirectional
carbon fibre reinforced composites. Polymer Testing, 2009, 28: p. 612-617.
- 170 -
96) Zhang, J, and Brownwyn, Fox, Manufacturing process effects on the mode I
interlaminar fracture toughness and nanocreep properties of CFRP. Victorian
centre for advanced materials manufacturing, School of Engineering and
Technology, 2005.
97) Mathews, J. M, and Swanson, R. S, Characterisation of the interlaminar fracture
toughness of a laminated carbon/epoxy composite. Composites science and
technology, 2007, 67 (7-8): p. 1489-1498.
98) Baral, N., Davies, P., Baley, C, and Bigourdan, B, Delamination behaviour of very
high modulus carbon/epoxy marine composites. Composite Science and technology,
2008, 68: p. 995-1007.
99) Mathews, M. J, and Swanson, S. R, A numerical approach to separate the modes of
fracture in interface crack propagation. Journal of Composite Materials, 2007, 39
(3): p. 247-264.
100) Gregory, J. R, and Spearing, M. S, A fiber bridging model for fatigue
delamination in composite materials. Acta Materialia, 52 (19): p. 5492-5502.