characterization and modeling of the ionomer-conductor
TRANSCRIPT
Characterization and Modeling of the
Ionomer-Conductor Interface in Ionic Polymer
Transducers
by
Barbar J. Akle
Dissertation submitted to the Faculty of the
Virginia Polytechnic Institute and State University
in partial fulfillment of the requirements for the degree of
Doctor of Philosophy
in
Mechanical Engineering
Donald J. Leo, ChairDaniel Inman
James E. McGrathTimothy E. LongPavlos VlachosZoubeida Ounaies
July 2005
Blacksburg, Virginia
Keywords: Ionic Polymer, Transducer, Actuator, Sensor, Electric double layer,
Capacitor.
Copyright 2005
Characterization and Modeling of the
Ionomer-Conductor Interface in Ionic Polymer
Transducers
Barbar J. Akle, Ph.D.
Virginia Polytechnic Institute and State University, 2005
Advisor: Donald J. Leo
Abstract
Ionomeric polymer transducers consist of an ion-exchange membrane plated
with conductive metal layers on its outer surfaces. Such materials are known to
exhibit electromechanical coupling under the application of electric fields and imposed
deformation (Oguro et al., 1992; Shahinpoor et al., 1998). Compared to other types of
electromechanical transducers, such as piezoelectric materials, ionomeric transducers
have the advantage of high-strain output (> 9% is possible), low-voltage operation
(typically less than 5 V), and high sensitivity in the charge-sensing mode.
A series of experiments on actuators with various ionic polymers such as Nafion
and novel poly(Arylene ether disulphonate) systems (BPS and PATS) and electrode
composition demonstrated the existence of a linear correlation between the strain
response and the capacitance of the material. This correlation was shown to be in-
dependent of the polymer composition and the plating parameters. Due to the fact
that the low-frequency capacitance of an ionomer is strongly related to charge accu-
mulation at the electrodes, this correlation suggests a strong relationship between the
surface charge accumulation and the mechanical deformation in ionomeric actuators.
The strain response of water-hydrated transducers varies from 50 µstrain/V to 750
µstrain/V at 1Hz, while the strain-to-charge response is between 9 µstrainCm2
and 15
µstrainCm2
. This contribution suggests a strong correlation between cationic motion and
the strain in the polymer at the ionomer-conductor interface.
A novel fabrication technique for ionic polymer transducers was developed for
this dissertation for the purpose of quantifying the relationship between electrode
composition and transducer performance. It consists of mixing an ionic polymer
dispersion (or solution) with a fine conducting powder and attaching it to the mem-
brane as an electrode. The Direct Assembly Process (DAP) allows the use of any
type of ionomer, diluent, conducting powder, and counter ion in the transducer, and
permits the exploration of any novel polymeric design. Several conducting powders
have been incorporated in the electrode including single-walled carbon nanotubes
(SWNT), polyaniline (PANI) powders, high surface area RuO2, and carbon black
electrodes. The DAP provided the tool which enabled us to study the effect of elec-
trode architecture on performance of ionic polymer transducers. The DAP allows the
variation in the electrode architecture which enabled us to fabricate dry transducers
with 50x better performance compared to transducers made using the state of the art
impregnation-reduction technique. DAP fabricated transducers achieved a strain of
9.4% at a strain rate of 1%/s. Each electrode material had an optimal concentration
in the electrode. For RuO2, the optimal loading was approximately 45% by volume.
This study also demonstrated that carbon nanotubes electrodes have an optimal per-
formance at loadings around 30 vol%, while PANI electrodes are optimized at 95
vol%.
Extensional actuation in ionic polymer transducers was first reported and char-
acterized in this dissertation. An electromechanical coupling model presented by Leo
et al. (2005) defined the strain in the active areas as a function of the charge. This
model assumed a linear and a quadratic term that produces a nonlinear response
for a sine wave actuation input. The quadratic term in the strain generates a zero
net bending moment for ionic polymer transducers with symmetric electrodes, while
the linear term is canceled in extensional actuation for symmetric electrodes. Ex-
perimental results demonstrated strains on the order of 110 µstrain in the thickness
direction compared to 1700 µstrain peak to peak on the external fibers for the same
iii
transducer, could be achieved when it is allowed to bend under +/-2V potential at
0.5 Hz. Extensional and bending actuation in ionic polymer transducers were ex-
plained using a bimorph active area model. Several experiments were performed to
compare the bending actuation with the extensional actuation capability. The ac-
tive area in the model was assumed to be the high surface area electrode. Electric
double layer theory states that ions accumulate in a thin boundary layer close to
the metal-polymer interface. Since the metal powders are evenly dispersed in the
electrode area of the transducer, this area is expected to actuate evenly upon voltage
application. This active area model emphasizes the importance the boundary layer
on the conductor-ionomer interfacial area.
Computing model parameters based on experimental results demonstrated that
the active areas model collapses the bending data from a maximum variation of 200%
for the strain per charge, to less than 68% for the model linear term. Furthermore,
the model successfully predicted bending response from parameters computed using
thickness experimental results. The prediction was particularly precise in estimating
the trends of non-linearity as a function of the amount of asymmetry between the
two electrodes.
iv

To my parents,
Jawad and Nazira,
my brothers Etienne and Simon,
and my sister and brother in law Angele and Jose Antonio
Acknowledgments
First I would like to thank my advisor, Dr. Donald J. Leo, for his help and patience
throughout my graduate studies. His guidance and complete support made my work-
ing and learning experience, a very special one. Also, I want to extend my thanks to
Dr. Daniel Inman, Dr. James McGrath, Dr. Timothy Long, Dr. Pavlos Vlachos, and
Dr. Zoubeida Ounaies for their support and enthusiasm as members of my advisory
committee. In addition, I want to thank my colleagues in the Center for Intelligent
Material Systems and Structures. Also my great thanks to my research partners
Matt Bennett, Kevin Farinholt, Curt Cothera. Also special thanks for Dr. Kenton
Wiles, Dr. Michael Hickner, and Ali Etebary for the valuable collaborations. The
Direct Assembly Process presented in this work is developed in collaboration with Dr.
Kenton Wiles and the BPS and PATS were supplied by Dr. Michael Hickner. Both
are members of Dr. James McGrath Group. I appreciate the support of the U.S.
Army Research Laboratory and the U.S. Army Research Office under contract/grant
number DAAD19-02-1-0275 Macromolecular Architecture for Performance (MAP)
MURI.
Finally, I would like to express my deep gratitude to the support I received
from my friends and my greatest appreciation to the love and support provided by
my parents, my brothers, my sister and brother in law during my years at Virginia
Tech.
Barbar J. Akle
vi
Contents
Abstract ii
Acknowledgments vi
List of Tables xi
List of Figures xiii
Chapter 1 Introduction and Literature Review 1
1.1 Introduction . . . . . . . . . . . . . . . . . . . . . . . . . . . . . . . . 1
1.2 Smart Materials: The Big Picture . . . . . . . . . . . . . . . . . . . . 2
1.3 Ionic Polymer Transducers . . . . . . . . . . . . . . . . . . . . . . . . 7
1.3.1 Background . . . . . . . . . . . . . . . . . . . . . . . . . . . . 7
1.3.2 Actuation Mechanisms and Models . . . . . . . . . . . . . . . 8
1.4 Electroactive Polymers and the Need for Large Displacement Actuators 11
1.5 Potential Applications of Ionic Polymer Transducers . . . . . . . . . . 12
1.6 Motivation . . . . . . . . . . . . . . . . . . . . . . . . . . . . . . . . . 13
1.7 Percolation Process . . . . . . . . . . . . . . . . . . . . . . . . . . . . 14
1.8 Electric Double Layer . . . . . . . . . . . . . . . . . . . . . . . . . . . 15
1.8.1 The Helmholtz model . . . . . . . . . . . . . . . . . . . . . . . 16
1.8.2 The Gouy-Chapman model . . . . . . . . . . . . . . . . . . . 17
1.8.3 Stern and Grahame models . . . . . . . . . . . . . . . . . . . 18
1.8.4 Bockris, Devanathan, and Muller (BDM) models . . . . . . . . 19
1.9 Pseudocapacitance . . . . . . . . . . . . . . . . . . . . . . . . . . . . 19
vii
1.9.1 Adsorption . . . . . . . . . . . . . . . . . . . . . . . . . . . . 20
1.9.2 Redox pseudocapacitance . . . . . . . . . . . . . . . . . . . . 21
1.10 Electromechanical Coupling Models . . . . . . . . . . . . . . . . . . . 22
1.11 Objectives . . . . . . . . . . . . . . . . . . . . . . . . . . . . . . . . . 22
1.12 Contributions . . . . . . . . . . . . . . . . . . . . . . . . . . . . . . . 23
1.13 Document Organization . . . . . . . . . . . . . . . . . . . . . . . . . 24
Chapter 2 Experimental Methodologies 27
2.1 Electromechanical Characterization: Bending . . . . . . . . . . . . . 28
2.2 Electromechanical Characterization: Extensional . . . . . . . . . . . . 32
2.2.1 Extensional Test Fixture Calibration . . . . . . . . . . . . . . 33
2.3 Ionic and Electric Conductivity Measurements . . . . . . . . . . . . . 34
2.3.1 Complex Plane Frequency Response . . . . . . . . . . . . . . . 34
2.4 Ionomers . . . . . . . . . . . . . . . . . . . . . . . . . . . . . . . . . . 34
2.5 Traditional Fabrication Methods of Ionic Polymer Transducers . . . . 36
2.5.1 Impregnation-Reduction Process . . . . . . . . . . . . . . . . . 37
2.5.2 Variations to the Impregnation-Reduction Method . . . . . . . 39
2.6 Direct Assembly Process (DAP) . . . . . . . . . . . . . . . . . . . . 39
2.6.1 Direct Assembly Process with Dry Membranes . . . . . . . . . 40
2.6.2 Direct Assembly Process with Solvated Membranes . . . . . . 44
2.7 Electrode Materials . . . . . . . . . . . . . . . . . . . . . . . . . . . . 45
2.7.1 Carbon black . . . . . . . . . . . . . . . . . . . . . . . . . . . 46
2.7.2 Single-Walled Carbon Nanotubes . . . . . . . . . . . . . . . . 47
2.7.3 Conducting polymers . . . . . . . . . . . . . . . . . . . . . . . 48
2.7.4 Metal oxides . . . . . . . . . . . . . . . . . . . . . . . . . . . . 49
2.7.5 Platinum . . . . . . . . . . . . . . . . . . . . . . . . . . . . . 50
2.7.6 Gold Flakes . . . . . . . . . . . . . . . . . . . . . . . . . . . . 51
2.8 Electrode Morphology . . . . . . . . . . . . . . . . . . . . . . . . . . 51
2.9 Conclusion . . . . . . . . . . . . . . . . . . . . . . . . . . . . . . . . . 53
viii
Chapter 3 Correlation of Capacitance and Actuation in Ionic Polymer
Transducers 55
3.1 Surface Charge Accumulation in Ionomeric Materials . . . . . . . . . 56
3.1.1 Transducer Preparation . . . . . . . . . . . . . . . . . . . . . 59
3.2 Experimental Results . . . . . . . . . . . . . . . . . . . . . . . . . . . 61
3.3 Discussion of Results . . . . . . . . . . . . . . . . . . . . . . . . . . . 62
3.4 Conclusions . . . . . . . . . . . . . . . . . . . . . . . . . . . . . . . . 67
Chapter 4 Optimization of the Direct Assembly Process 69
4.1 Ionic liquids and Organic diluents . . . . . . . . . . . . . . . . . . . . 70
4.2 Effect of Electrode Thickness on Actuation Response . . . . . . . . . 72
4.3 Conducting Electrode Material . . . . . . . . . . . . . . . . . . . . . 74
4.4 Ruthenium dioxide - Gold hybrids . . . . . . . . . . . . . . . . . . . . 74
4.4.1 Variation of Metal Content by Weight . . . . . . . . . . . . . 75
4.4.2 Variation of Metal Content by Volume . . . . . . . . . . . . . 76
4.4.3 RuO2 - Gold Electrode Optimization . . . . . . . . . . . . . . 78
4.5 Optimization of Conductor Powder Concentration in the Electrode . 80
4.5.1 Hybrid Conductors/Ionic Polymer Actuators . . . . . . . . . . 84
4.6 Electrical and Mechanical Property Characterization . . . . . . . . . 86
4.6.1 Electrical Properties Characterization . . . . . . . . . . . . . . 86
4.6.2 Mechanical Damping . . . . . . . . . . . . . . . . . . . . . . . 87
4.7 Reliability of the DAP Method . . . . . . . . . . . . . . . . . . . . . 88
4.8 Conclusions . . . . . . . . . . . . . . . . . . . . . . . . . . . . . . . . 90
Chapter 5 Extensional and Bending Model 92
5.1 Modeling . . . . . . . . . . . . . . . . . . . . . . . . . . . . . . . . . . 93
5.1.1 Active Areas Model: Simplified Bending . . . . . . . . . . . . 94
5.1.2 Active Areas Model: Extensional model . . . . . . . . . . . . 97
5.1.3 Active Areas Model: Bending with Electrostatic Expansion Term 99
5.2 Model Simulations . . . . . . . . . . . . . . . . . . . . . . . . . . . . 100
5.3 Experimental Results . . . . . . . . . . . . . . . . . . . . . . . . . . . 102
ix

5.3.1 Simplified Bending Model: FRF Analysis . . . . . . . . . . . . 102
5.3.2 Extensional Actuation Results . . . . . . . . . . . . . . . . . 104
5.3.3 Bending with Electrostatic Expansion Term . . . . . . . . . . 106
5.4 Discussion and Model Verification . . . . . . . . . . . . . . . . . . . . 108
5.4.1 Dependency on the Potential . . . . . . . . . . . . . . . . . . 108
5.4.2 Model Discussion and Trends . . . . . . . . . . . . . . . . . . 109
5.5 Conclusions . . . . . . . . . . . . . . . . . . . . . . . . . . . . . . . . 111
Chapter 6 Summary and Conclusions 113
6.1 Dissertation Summary . . . . . . . . . . . . . . . . . . . . . . . . . . 113
6.2 Contributions . . . . . . . . . . . . . . . . . . . . . . . . . . . . . . . 116
6.3 Future Work . . . . . . . . . . . . . . . . . . . . . . . . . . . . . . . . 117
6.4 Conclusions . . . . . . . . . . . . . . . . . . . . . . . . . . . . . . . . 117
Bibliography 119
Vita 129
x
List of Tables
1.1 Summary of the advantages and disadvantages of each model with the cor-
responding capacitance. . . . . . . . . . . . . . . . . . . . . . . . . . . 20
2.1 Diluent uptake as a function of diluent composition, temperature, and du-
ration. The composition present the volume of N-methylformmaide to the
total volume of EmI-Tf and N-methylformamide. The last column presents
the formamide vol% of the mixture in the membrane before evaporating the
co-diluent. . . . . . . . . . . . . . . . . . . . . . . . . . . . . . . . . . 43
3.1 Properties of Nafion, BPS, and PATS Copolymers. . . . . . . . . . . . . 59
3.2 Fully hydrated transducer thickness, optimal reducing agent concentration,
and platinum layers surface conductivity before and after electroplating for
each ionomer. . . . . . . . . . . . . . . . . . . . . . . . . . . . . . . . . 60
3.3 Values for the stiffness and the Young Modulus estimated using equation 2.9. 62
3.4 Microstrain per normalized charge for various ionomer actuators. . . . . . 68
4.1 Strain rate of ionic polymer transducers with different diluents. Physical
properties of the diluents are provided. . . . . . . . . . . . . . . . . . . . 72
4.2 Physical and electrochemical properties of electrode conducting materials . 74
4.3 Weights of Au and RuO2 mixed with 0.5 g of 5% Nafion solution and 0.5g
Glycerol. It also presents the durations of sample hot-pressing. The den-
sities of Au and RuO2 are assumed to be 19300 Kg/m3 and 7050Kg/m3
respectively. . . . . . . . . . . . . . . . . . . . . . . . . . . . . . . . . 78
xi

4.4 Weights of Au and RuO2 mixed with 0.5g of 5% NafionTM solution and 0.5g
Glycerol for electrode optimization. . . . . . . . . . . . . . . . . . . . . 79
4.5 Conductor/ionomer surface area in th electrode, and the corresponding peak
strain. . . . . . . . . . . . . . . . . . . . . . . . . . . . . . . . . . . . 83
4.6 Peak strain and strain rate of five actuators built for the SWNT/RuO2
hybrid experiment. . . . . . . . . . . . . . . . . . . . . . . . . . . . . . 85
4.7 Mechanical properties of five actuators fabricated for the SWNT/RuO2 hy-
brid experiment. . . . . . . . . . . . . . . . . . . . . . . . . . . . . . . 89
5.1 Thickness measurements of the upper electrode, polymer substrate, and
lower electrode for samples S1 through S7. . . . . . . . . . . . . . . . . . 103
5.2 Stiffness of four samples computed from the natural frequencies and directly
from the fixed-sliding beam experiment. . . . . . . . . . . . . . . . . . . 104
5.3 Thickness measurements of the upper electrode, polymer substrate, and
lower electrode for samples L1 through L6. . . . . . . . . . . . . . . . . 107
xii

List of Figures
1.1 Schematic representation of the transduction mechanisms in ionic polymer
transducers, also shown is the cluster of anions (-) and the cations (+) free
to move. . . . . . . . . . . . . . . . . . . . . . . . . . . . . . . . . . . 2
1.2 Energy density plot of several electroactive polymers. . . . . . . . . . 3
1.3 Unimorph and bimorph induced strain actuation. . . . . . . . . . . . 4
1.4 Actuation of a dielectric elastomer under the application of large elec-
tric potential . . . . . . . . . . . . . . . . . . . . . . . . . . . . . . . 5
1.5 Ionomer-Conductor interface, (a) SEM of an ionic polymer transducer
electrode, (b)Diffusion of electrons through the conductive particles,
(c)Diffusion of cations through the ionomer electrolyte, and (d)Formation
of the electric double layer around the particles. . . . . . . . . . . . . 10
1.6 Electric double layer models (a)Helmholtz model, (b)Gouy-Chapman,
(c)Stern, and (d)Bockris, Devanathan, and Muller (BDM) model . . . 17
2.1 The experimental setup used to for the electromechanical measurements. . 28
2.2 Experimental setup used for the extensional electromechanical measurements. 32
2.3 (a) Stress amplitude generated by the piezoceramic transducer under 75kV/m
electric field. time response of the piezoceramic under 75kV/m sine wave of
0.5Hz frequency. . . . . . . . . . . . . . . . . . . . . . . . . . . . . . . 33
2.4 The complex plane representation of a simple electrostatic double layer, and
a double layer with leakage resistance. . . . . . . . . . . . . . . . . . . . 35
2.5 The complex plane representation of a simple electrostatic double layer, and
a double layer with leakage resistance. . . . . . . . . . . . . . . . . . . . 36
xiii

2.6 (a)Chemical Structure of Nafion, (b)Chemical Structure of BPS, (c)Chemical
Structure of PATS. . . . . . . . . . . . . . . . . . . . . . . . . . . . . . 37
2.7 Schematic showing the reduction of platinum on the surface forming
the electrode of the ionic polymer transducer . . . . . . . . . . . . . . 38
2.8 Schematic showing the four steps Direct Assembly Process (DAP) for
building dry transducers. . . . . . . . . . . . . . . . . . . . . . . . . . 41
2.9 Schematic showing the four steps Direct Assembly Process (DAP) for
building solvated transducers. . . . . . . . . . . . . . . . . . . . . . . 46
2.10 Charge and discharge redox mechanism of conducting polymers . . . 49
2.11 Scanning electron microscopy (SEM) showing (a) the top cross-section of a
Nafion 117 plated with platinum following 6 layers of impregnation-reduction,
and (b) the top cross-section of a Nafion 117 ionomer painted with 6 lay-
ers of RuO2 and Nafion mix . Also shown in (b) is the platinum interface
between the painted layer and the electroplated gold overlayer. . . . . . . 52
2.12 Scanning electron microscopy (SEM) showing (a) the top cross-section of a
Nafion 117 ionomer painted with a 9.5 µm RuO2 / Nafion electrode. (b)
shows the top cross-section of a Nafion 117 ionomer painted with a 38 µm
RuO2 / Nafion electrode. . . . . . . . . . . . . . . . . . . . . . . . . . . 53
2.13 Scanning electron microscopy (SEM) SEM images of the high surface area
RuO2 electrode with (a) 22, (b) 30, (c) 36, and (d) 66 Vol % metal. . . . . 54
3.1 Real and complex permitivities of a typical Nafion-based ionic polymer
transducer. . . . . . . . . . . . . . . . . . . . . . . . . . . . . . . . . . 57
3.2 Blocking electrode model using a resistor and two capacitors in series. 58
3.3 Stain per unit volt of the BPS and PATS transducers compared to Nafion. 61
3.4 Blocked force per unit volt of the BPS and PATS polymers compared to
Nafion. . . . . . . . . . . . . . . . . . . . . . . . . . . . . . . . . . . . 63
3.5 Impedance of the novel polymers compared to Nafion. . . . . . . . . . . . 64
3.6 Real and imaginary FRF of the capacitance per cm2 of the different BPS
and PATS actuators to Nafion. . . . . . . . . . . . . . . . . . . . . . . . 65
xiv

3.7 Normalized microstrain per unit charge and normalized microstrain per unit
volt for several ionomer transducers. . . . . . . . . . . . . . . . . . . . . 66
3.8 MicroStrain vs. capacitance/cm2 of each polymer a) at 1Hz, b) at 5Hz, c)
at 10 Hz, and d) at 15Hz. . . . . . . . . . . . . . . . . . . . . . . . . . 67
4.1 (a) Measured response due to a 2V step change in potential for actuators
with RuO2 electrodes and Formamide or EmI-Tf diluents. (b) Strain rate
as a function volume uptake ionic liquid. . . . . . . . . . . . . . . . . . . 71
4.2 Capacitance per area FRF of 3 transducers with 10, 20, and 30 layers of
2.5:1 RuO2 electrode. . . . . . . . . . . . . . . . . . . . . . . . . . . . . 73
4.3 (a) Strain response of four samples with different electrode thickness due to
a 2V step input. (b) Peak strain as a function of electrode thickness. . . . 73
4.4 (a) Strain response as a function of electrode composition by weight, (b)
Electrical impedance as a function of electrode composition by weight, (c)
Strain response as a function of electrode composition by volume, and (d)
Electrical impedance as a function of electrode composition by volume. . . 76
4.5 (a) Strain per unit charge/area for the samples produced by variation in the
metal content with consistent volume, (b) Strain output to the application
of square wave potentials of +/- 2 V. . . . . . . . . . . . . . . . . . . . 77
4.6 Strain per volt frequency response for three RuO2 samples. . . . . . . 79
4.7 Deflected shapes as a function of amplitude for a square wave potential input. 80
4.8 (a) Strain rate as a function of RuO2 volume % in the electrode. Conduc-
tivity of the electrode as a function of RuO2 volume % in the electrode. . 81
4.9 Strain rate as a function of carbon nanotube and polyaniline loading (volume
%) in the electrode. . . . . . . . . . . . . . . . . . . . . . . . . . . . . 82
4.10 (a) Strain response due to a 2V step change in potential for samples with
10% RuO2 and 10% SWNT. (b) Strain response due to a 2V step change in
potential for samples with 40% RuO2 and 40% SWNT. . . . . . . . . . . 83
4.11 Strain response due to a 2V step change in potential for samples with 45%
RuO2, 45% SWNT, and 85% PANI. . . . . . . . . . . . . . . . . . . . . 84
xv
4.12 (a) Strain response due to a 2V step change in potential for samples with
10% SWNT, 45% SWNT, 35% RuO2, 45% RuO2 and a mix of 10% SWNT
with 35% RuO2. (b) Strain response due to a 2V step change in potential
for samples with 85% PANI, 50% PANI with 35% RuO2, and 50% PANI
with 35% SWNT. . . . . . . . . . . . . . . . . . . . . . . . . . . . . . 85
4.13 (a) Response to a 2V step for transducers with 45vol % RuO2 and 45vol%
SWNT. (b) Corresponding current response. . . . . . . . . . . . . . . . . 86
4.14 (a) Capacitance frequency response functions of transducers with 45vol %
RuO2 and 45vol% SWNT. (b) Capacitance frequency response functions of
transducers with 85vol% PANI, 50%vol PANI + 35vol % RuO2, and 50vol%
PANI + 35vol% SWNT. . . . . . . . . . . . . . . . . . . . . . . . . . . 87
4.15 (a) Strain per volt frequency response functions of transducers with 45vol %
RuO2 and 45vol% SWNT. (b) Micro-Strain per charge per area frequency
response functions of transducers with 45vol % RuO2 and 45vol% SWNT.
(c) Micro-Strain per volt frequency response functions of transducers with
85vol% PANI, 50%vol PANI + 35vol % RuO2, and 50vol% PANI + 35vol%
SWNT. (d) Strain per charge per area frequency response functions of trans-
ducers with 85vol% PANI, 50%vol PANI + 35vol % RuO2, and 50vol% PANI
+ 35vol% SWNT. . . . . . . . . . . . . . . . . . . . . . . . . . . . . . 88
4.16 microstrain per volt frequency response for three pure RuO2 samples. . . 89
4.17 Reliability test on the three samples with +/-1V, +/-2V, +/-3V 1Hz sine
wave applied on samples 1, 2, and 3 respectively. . . . . . . . . . . . . . 90
5.1 Bending and extensional actuation in a bimorph model of ionic polymer
transducers. . . . . . . . . . . . . . . . . . . . . . . . . . . . . . . . . 93
5.2 Schematic of a typical electrode in an ionic polymer transducer showing the
particles surrounded by a charged sphere of ionomer. . . . . . . . . . . . 94
5.3 Schematic of an asymmetric transducer with an electrode on one side, where
yb represents the distance toward the neutral axis . . . . . . . . . . . . . 95
xvi

5.4 Schematic of the three-layered ionic polymer transducer in thickness config-
uration. . . . . . . . . . . . . . . . . . . . . . . . . . . . . . . . . . . . 98
5.5 (a) Model simulation of the microstrain time response of three samples with
different electrode configurations in bending mode. (b) Power spectrum of
the time response. . . . . . . . . . . . . . . . . . . . . . . . . . . . . . 100
5.6 (a) Model simulation of the forcing time response of three samples with
different electrode configurations in extensional mode. (b) Power spectrum
of the time response. . . . . . . . . . . . . . . . . . . . . . . . . . . . . 101
5.7 1st Harmonic/ Fundamental frequency response as a function of electrode
symmetry in bending and extensional modes. . . . . . . . . . . . . . . . 102
5.8 Modulus calibration of samples . . . . . . . . . . . . . . . . . . . . . . 103
5.9 (a) FRF of the strain per volt, (b) FRF of the strain per charge per area,
and (c) FRF of the α computed from the simplified bending moment model. 105
5.10 Values of the α and β for the model to fit the experimental data for seven
different ionic polymer transducers in the frequency range of 0.5 to 10Hz. . 106
5.11 (a) Typical blocked pressure response and model fit for a sample with 25µm
electrodes on each side on a 180 µm membrane, actuated with a 2V 0.5Hz
sine wave. (b) Measured and model prediction psd for the same sample. . 107
5.12 (a) Experimental ratio of the 1st harmonic to the fundamental frequency in
the strain response under 2V sine waves (b) The distortion ratio in exten-
sional actuation (c) Model prediction of this ratio . . . . . . . . . . . . . 108
5.13 Experimental and modeling of a two sided transducer time response due to
2V 0.5Hz sine wave in bending. . . . . . . . . . . . . . . . . . . . . . . 109
5.14 (a)Values for α under 1V (b) Values for β under 1V (c) Values for α under
2V (d) Values for β under 2V . . . . . . . . . . . . . . . . . . . . . . . 110
5.15 (a) Ratio of the 1st harmonic to the fundamental frequency in the strain
response under 1V sine wave, and (b) 2V sine wave . . . . . . . . . . . . 111
5.16 Charge density profile in a cross section of an ionic polymer transducer
at low frequency and high frequency. . . . . . . . . . . . . . . . . . . 111
xvii

Chapter 1
Introduction and Literature
Review
1.1 Introduction
Smart materials are a class of materials that exhibit coupling between two or more
physical domains. Electromechanical transducers are a subset of smart materials that
exhibit coupling between the electrical and mechanical domains as sensors or actu-
ators. Electromechanically coupled polymers also known as ElectroActive Polymers
(EAP) are a soft and flexible class of transducers. In this dissertation we have studied
a specific type of EAP, the ionic polymer transducer.
Also known as ionomeric polymer transducers, they consist of an ion-exchange
membrane plated with conductive metal layers on the outer surfaces. Such materi-
als are known to exhibit electromechanical coupling under the application of electric
fields and imposed deformation (Oguro et al., 1992; Shahinpoor et al., 1998). Com-
pared to other types of electromechanical transducers, such as piezoelectric materials,
ionomeric transducers have the advantage of high-strain output (> 9% is possible),
low-voltage operation (typically less than 5 V), and high sensitivity in the charge-
sensing mode. The electromechanical coupling in ionomeric polymer transducers is
thought to be due to the mobility of cations in the polymer network as shown in
Figure 1.1.
1

Figure 1.1: Schematic representation of the transduction mechanisms in ionicpolymer transducers, also shown is the cluster of anions (-) and the cations (+)free to move.
In this dissertation we studied and modeled the electrode area in ionic polymer
transducers and more specifically the conductor-ionomer interface. A new fabrication
process was developed which provided good control on the architecture of the elec-
trode. The new process was optimized to enhance the performance of ionic polymer
transducers by increasing the generated strain and strain rate. A model that assumes
the electrode as the active area is presented in this thesis. Finally, we report and char-
acterize extensional actuation, which is according to our knowledge the first account
reported for such transduction mechanism in ionomeric polymer transducers.
1.2 Smart Materials: The Big Picture
Smart materials are defined as materials that adapt to a change in the physical en-
vironment, such as electrical, thermal, magnetic, chemical, pH, or light environment.
They can be used in the form of sensors, actuators, active dampers, and energy gen-
erators (Leo, 2001). In the area of control engineering we are interested mostly in
electromechanical transducers. Materials known to demonstrate electromechanical
coupling properties include piezo-ceramics, piezo-polymers, electrostrictive polymers,
2

ionic polymers, conducting polymers, liquid crystal elastomers, carbon nanotubes,
and ionic gels. Other thermomechanically coupled smart materials which are ac-
tuated electrically using the resistive properties of the material are shape memory
polymers and shape memory alloys. AOne noted that those electroactive materials
exist in the liquid, gel, polymer, ceramic, or metal form. Observing Figure 1.2 one
Figure 1.2: Energy density plot of several electroactive polymers.
would conclude that shape memory alloys (SMA) or the dielectric elastomers are bet-
ter transducers. However, energy density plots do not present the full characteristics
of the actuators. Other figures of merit should be considered in assessing the usability
of a certain smart material in potential applications. Figures of merit includes gener-
ated strain and stress that are represented in the energy density plot in Figure 1.2. In
order to amplify the strain of some of the transducer materials, uniform and bimorph
configurations are used as shown in Figure 1.3 (Leo et al., 2003). These configuration
are widely used in piezoelectric polymer benders and piezoceramics thunder benders
(Zhang, 1998) such as bimorph and unimorph respectively. Strain is defined as the
deformation per unit length of the material, sometimes in literature strain is con-
fused by defining it as “the displacement normalized by the original material length
in the direction of actuation” (Madden et al., 2004). For a bimorph and unimorph
3
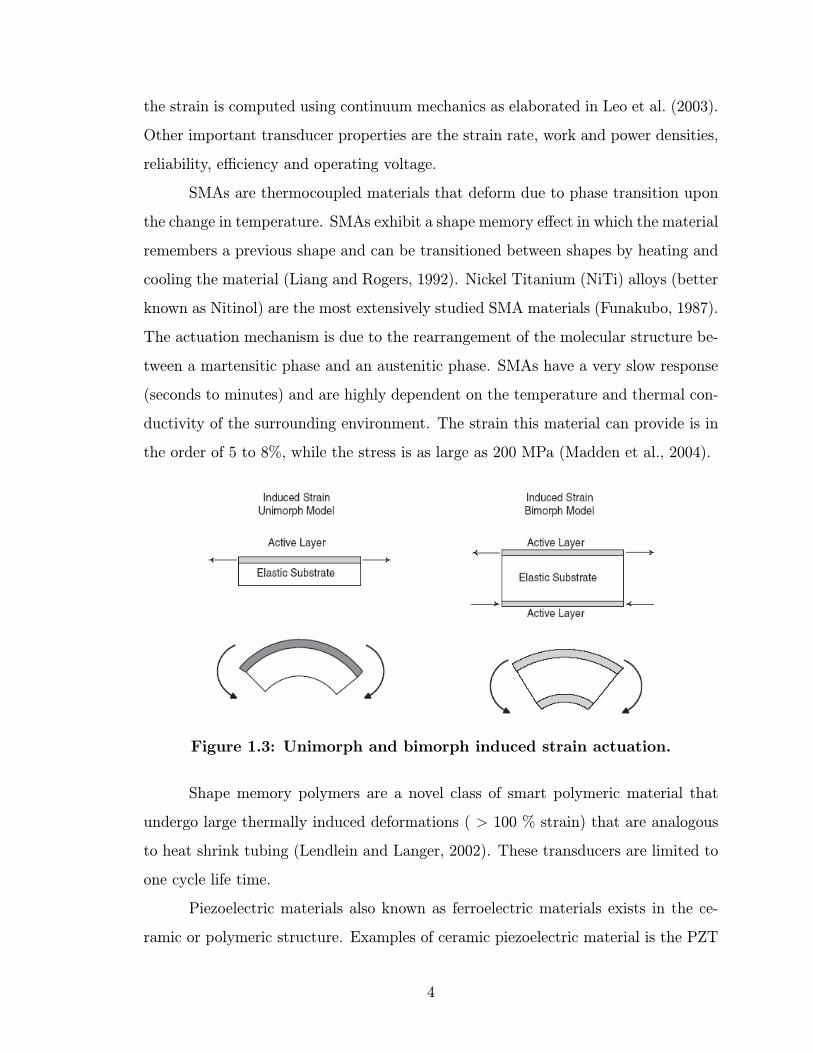
the strain is computed using continuum mechanics as elaborated in Leo et al. (2003).
Other important transducer properties are the strain rate, work and power densities,
reliability, efficiency and operating voltage.
SMAs are thermocoupled materials that deform due to phase transition upon
the change in temperature. SMAs exhibit a shape memory effect in which the material
remembers a previous shape and can be transitioned between shapes by heating and
cooling the material (Liang and Rogers, 1992). Nickel Titanium (NiTi) alloys (better
known as Nitinol) are the most extensively studied SMA materials (Funakubo, 1987).
The actuation mechanism is due to the rearrangement of the molecular structure be-
tween a martensitic phase and an austenitic phase. SMAs have a very slow response
(seconds to minutes) and are highly dependent on the temperature and thermal con-
ductivity of the surrounding environment. The strain this material can provide is in
the order of 5 to 8%, while the stress is as large as 200 MPa (Madden et al., 2004).
Figure 1.3: Unimorph and bimorph induced strain actuation.
Shape memory polymers are a novel class of smart polymeric material that
undergo large thermally induced deformations ( > 100 % strain) that are analogous
to heat shrink tubing (Lendlein and Langer, 2002). These transducers are limited to
one cycle life time.
Piezoelectric materials also known as ferroelectric materials exists in the ce-
ramic or polymeric structure. Examples of ceramic piezoelectric material is the PZT
4

(Lead Zirconate Titanate), while the commonly used copolymer is poly(vinylidene
fluoride trifluoroethylene), abbreviated as P(VDF-TrFE) (Madden et al., 2004). The
actuation mechanism occurs due to the rotation of the dipoles upon the application
of an electric field (Cross and Rossetti, 1991). Dipoles in PVDF are due the large
electronegativity of the fluorine in the polymer backbone (Bar-Cohen, 2001). In or-
der to prepare an actuator, PVDF is poled at temperatures larger than the Curie
point and quenched down while the electric field is still applied (Cheng et al., 2001).
Piezo-materials operates at high frequencies, and piezoceramics provide large forces.
The main disadvantage is the high operating voltage (in the order of 1kV) and small
displacement which is amplified using bimorph or unimorph configuration as shown
in Figure 1.3 (Madden et al., 2004).
Figure 1.4: Actuation of a dielectric elastomer under the application oflarge electric potential
Dielectric elastomer actuators are made of a compliant polymer membrane
sandwiched between two conductive electrodes(Bar-Cohen, 2001). The electrostatic
attraction between the electrodes due to the application of a potential (150 MV/m)
generates a pressure on the compliant polymer and cause the deformation as shown
in Figure 1.4 (Kornbluh et al., 1999). Electrostrictive transducers have large dis-
placement in the order of 380% for 3M VHB 4910 acrylic elastomer (Pelrine et al.,
2000). Other advantages of this actuator is the easy manufacturing process and the
large stresses depending on the stiffness of the elastomer used (Bar-Cohen, 2001).
The main disadvantage of these actuators are the large operating voltages, the low
5

reliability and the fact that they also bend in one direction in cantilever form.
Liquid crystalline elastomers actuate upon inducing phase changes in liquid
crystalline polymers that changes of order and alignment of liquid crystalline side
chains, leading to a generated stresses in the polymer backbone(de Gennes and
Seances, 1975). Those materials are still in their early stage of development, but
the main disadvantage would reside in relatively high operating voltage (1.5 MV/m)
and low stiffness.
Conducting polymers are electronically conducting organic materials having
conjugated structures in their molecular backbone. Applying an electric potential
will change the oxidation state leading to the addition or removal of charge from the
polymer backbone and a flux of ions to balance the charge. Insertion of ions between
polymer chains is the primary reason for actuation of the material (Madden et al.,
2004). Conducting polymers are attractive transducers due to the large deformations
under relatively small voltages. The main disadvantages of conducting polymers is
their slow response time, and low electro-mechanical efficiency, and they also require
an electrolyte to operate.
Ionic gels are very similar to ionic polymers previously introduced, except
they have a gel polymer backbone. They produce larger strains compared to ionic
polymers, but exhibit much slower response time. The disadvantages of this smart
material is that it suffers from low mechanical strength and consequent structural
failure under large deformations and therefore have a short lifetime (Osada et al.,
1992).
Carbon nanotubes (CNT) are hollow cylinders consisting solely of carbon.
These tubes are either conductive or semi-conductive. CNTs could be used as ac-
tuators when a voltage is applied to them against an electrode soaked in an elec-
trolyte. The actuation mechanism is due to the motion of ions that are attracted to
the nanotubes, leading to the accumulation of ionic charge at their surfaces, which
is balanced by an electronic charge within the tubes (Baughman et al., 1999). The
charging leads to a rearrangement of the electronic structure of the nanotubes, and
to Coulombic forces, both of which result in dimensional changes. This is considered
6

to be a quantum mechanic actuation process (Baughman et al., 1999).
Electro-rheological fluids change their viscous properties upon the application
of an electric field. This material is not as an actuator but rather as a fluid for active
damping. The actuation mechanism is due to alignment of some particles in the fluid
leading to a change in the shear rates (Lindler and Wereley, 1999).
Finally Polyethyleneoxide and Polyethyleneglycol (PEO-PEG) based ion con-
ducting polymers are also used as actuators (Shahinpoor and Kim, 2002c). Those solid
polymer electrolytes have been made of high molecular weight PEO mixed with some
low molecular weight PEG (Gray, 1987). PEO-PEG actuators are large displacement
(10% strain) low voltage (1 to 3V) diluent free actuators, with the disadvantage of
low operating frequencies ( 10Hz) (Shahinpoor and Kim, 2002c). Moreover Watanabe
et al. (2001) reported the use of Polyurethane-Polyethyleneglycol (PU-PEG) polymers
as actuators. PU-PEG transducers shows electrostriction properties under large volt-
age (2MV/m). The bending direction of these actuators could be controlled by the
species of the doped ions (Watanabe et al., 2001).
1.3 Ionic Polymer Transducers
In this section ionic polymer transducers will be thoroughly described, with a histor-
ical background, fabrication techniques, actuation mechanisms and models, current
characterization methods, and finally potential applications.
1.3.1 Background
Polymer-metal composites were developed as early as the 1930’s as precipitated
of colloidal silver on prepared substrates (Bar-Cohen, 2001). In the early 1990’s
Sadeghipour, et al., reported that they could act as vibration sensors. Ionic poly-
mers were developed as “solid polymer electrolyte fuel cell membranes” (Bar-Cohen,
2001). Later in 1992 while Sadeghipour and coworkers were getting close to discover-
ing their actuation capabilities, Oguro’s group in Japan described the bending of the
ionic polymers under the application of a potential across its thickness. Since that
7
time, several groups in the USA and across the world are working on improving the
manufacturing process, characterizing and modeling the performance, and searching
for applications for these new intelligent materials.
1.3.2 Actuation Mechanisms and Models
To date the physical mechanisms that produce actuation are still uncertain. Several
researchers are suggesting different actuation models. One of the salient features of
ion-exchange membranes is selective ion conduction. Ion-exchange membranes are
polyelectrolytes which contain charged sidegroups covalently bound to the polymer
chain. This property leads to charge aggregation within the material and phase
separation between hydrophilic regions containing the charged sidegroups and the
hydrophobic backbone. The charge aggregation also leads to an ionic selectivity
in which only certain charged groups, either cations or anions, can be transported
through the material.
Ion conduction is known to play an important role in the electromechanical
transduction of ionomeric polymers. The conduction of ions was identified by Shahin-
poor et al. (1998) as the reason for bending upon application of an electric field, and
de Gennes et al. (2000) proposed a model that related pressure and velocity within
the material to electric field and charge flux. This model is similar to form as one
developed and experimentally verified by Newbury and Leo (Newbury and Leo, 2002,
2003a,b), although Newbury and Leo used force, displacement, charge, and voltage
as the state variables for the model. The steady-state distribution of charge due to
ionic conduction was determined by Nemat-Nasser and Li (2000), where they showed
that application of an electric field produces an accumulation of positive charge at
one surface and a depletion of cations at the opposite surface. A similar model was
recently proposed by Farinholt and Leo (2002) to model charge sensing in ionomeric
materials. Recently, Nemat-Nasser (2002a) combined his model of charge redistri-
bution within the material with a model that coupled the charge state within the
polymer to the mechanical deformation.
There is increasing evidence in the literature for a link between charge accumu-
8

lation and mechanical deformation in ionomeric materials. The deflection response of
ionomeric transducers of various compositions and cation forms was recently studied
by Nemat-Nasser and Wu (2003a). Their results highlighted the relationship be-
tween the total charge flow in the polymer to the motion generated at the tip of the
transducer. For transducers that utilized the fluoropolymer Flemion (a commercial
polymer from Asahi Glass) instead of Nafion as the ionomer , Nemat-Nasser and Wu
(2003a) demonstrated a linear relationship between normalized deflection (tip deflec-
tion relative to length) versus normalized charge (charge transported versus total fixed
charge). Nafion-based transducers exhibited relaxation when subjected to a DC volt-
age, thus complicating the analysis of the deflection-to-charge analysis. A thorough
study of the electromechanical response of Nafion and Flemion in various cation forms
was also performed by Asaka et al. (2001a). They reported that the ‘charge-specific
displacement’, defined as the ratio of tip deformation to induced charge, varied as a
function of cation form for both ionomers. The charge-specific displacement was then
related to the conductivity and freezable water content of the polymer.
The common idea between all suggested actuation models is that anions in
the clusters are attached to the polymer backbone, while the free cations will move
within the diluent medium under the application of an electric field, causing them
to migrate towards the cathode in the hydrophilic polymer chancels (Bar-Cohen,
2001). This redistribution will cause some changes in the properties of the polymer
membrane at the anode and cathode sides.
Several parameters control the amount and speed of diffusion of ions into the
electrode. As mentioned earlier actuation mechanisms can be correlated with the
motion of cations in the transducer. Therefore maximum strain and strain rate are
correlated with the amount and speed of diffusion of the ions respectively. Two main
properties determine the speed of response, first is the electrode architecture and
second is the diluent content in the ionomer. Electrode architecture also determine
the amount of strain in an ionic polymer actuator. The viscosity and polarity of the
diluent has a major effect on the conductivity of the ionomer electrolyte. Using a
less viscous diluent allow ions to move faster while a more polar diluent may induce
9

Cations
electrons
SEM of an ionic polymer transducer electrode
Diffusion of electrons through the conductive particles
Diffusion of cations through the ionomer electrolyte
Formation of the electric double layer around the particles
Cations
electrons
SEM of an ionic polymer transducer electrode
Diffusion of electrons through the conductive particles
Diffusion of cations through the ionomer electrolyte
Formation of the electric double layer around the particles
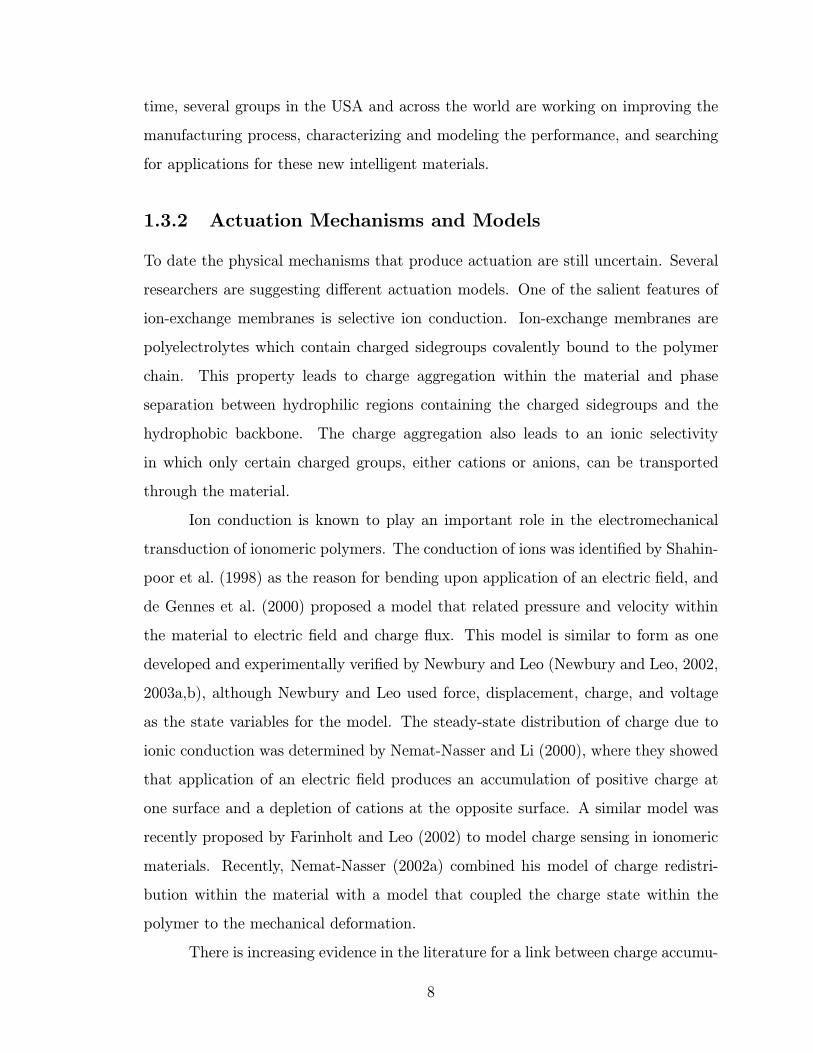
Figure 1.5: Ionomer-Conductor interface, (a) SEM of an ionic polymertransducer electrode, (b)Diffusion of electrons through the conductiveparticles, (c)Diffusion of cations through the ionomer electrolyte, and(d)Formation of the electric double layer around the particles.
charge seperation between the cation from the anion.
Electrode architecture had three main effects as shown in Figure 1.5. The
electrode consists of a well dispersed conducting particles in an ionomer matrix as
shown in the SEM picture in Figure 1.5 (a). According to Ohms law, the diffusion
rate of the electrons into the electrode is proportional to the conductivity through
thickness of the electrode:
dq
dt=V
R(1.1)
The resistivity of a conductive phase dispersed in an insulator matrix is studied
using the percolation theory (see Figure 1.5 (b)). Percolation theory will be discussed
later in the chapter. After the charging of the metal particles in the electrode, mobile
10

ions will move to form the electric double layer as shown in Figure 1.5 (c). These
cations are mobile only in an electrolyte medium, which is the ionomer in ionomeric
transducers. In brief the electrons require more conductor particles while ions require
more polymer for fast diffusion. Therefore an optimal concentration of conductor
to ionomer ratio is expected. Finally the cations forms an electric double layer and
accumulate around the conductive particles (see Figure 1.5 (d)). The electric double
layer theory which is detailed in a later section demonstrates that the amount of
charge accumulated per unit volt is proportional to the interfacial area between the
conductor and the electrolyte. In this dissertation, the electric double layer and per-
colation theory are analyzed qualitatively to interpret the behavior of ionic polymer
transducer due to variation in electrode architecture.
1.4 Electroactive Polymers and the Need for Large
Displacement Actuators
Electroactive polymer (EAP) transducers are usually large displacement low force
actuators. Compared to brittle ceramics EAPs are soft and compliant structures.
Piezoceramics provide micron scale displacements with a large forcing output. Sev-
eral applications requires large displacement, therefore piezoceramics are often man-
ufactured in stacks that amplify the motion. Moreover stacks might not provide suffi-
ciently large displacement, then mechanical amplification is used. Using the stacking
and mechanical amplification techniques defies one major advantage of smart ma-
terials that they are parts free with large energy density. Therefore the need for
large displacement actuators. Applications that would benefit from such transducers
includes flapping mechanisms for a Micro Air Vehicle(Akle and Leo, 2003), and arti-
ficial muscles especially for EAPs that operates under low voltage. Moreover several
polymers such as Nafion, the widely used ionomer for ionic polymer transducers, are
biocompatible making them potential muscle implants.
11
1.5 Potential Applications of Ionic Polymer Trans-
ducers
All the interesting properties mentioned in the previous section gives ionic polymers
a number of potential applications. Those applications can range from using them as
sensors or as actuators. They could be used in water submerged applications, or in
other environments either as packaged polymers or ionic liquid diluent based polymers
(Bennett and Leo, 2004). Ionic polymers are usually made in the form of thin plates
(50 to 200 micrometer) enabling them to be use in MEMS (Micro Electro-Mechanical
System) application. They might be used as sensors to create micro-accelerometers,
or as actuators to create micro swimming robots. Another interesting property of
ionic polymers is that they are not toxic for human cells since they are made of
NafionTM, noble metals (Platinum, and Gold for the coating), and Li or Na ions.
This makes it possible for them to be implemented inside the body. Application can
range from health monitoring as pressure and pulse sensors, or vein replacement as
actuators. A current application under research by our group, is using those trans-
ducers to detect acoustic signals generated by the turbulence induced by a stenosis.
Detecting and characterizing this turbulence enables us to measure the severity of the
closure. The end product of this research is a non-invasive ionic transducer device
capable of detecting early stenosis. Also in collaboration with our group Etebari et al.
(2004) showed that ionic polymers could be used as wall shear sensors in submerged
applications, and they managed to correlate the skin friction coefficient to the signal
from the sensor. As actuators our team is collaborating with other companies in
fabricating an adaptive mirror for outer space applications (Buechler and Leo, 2004).
The polymers will be plated with a reflective material, and the potential applied
across the transducers will deform the shape of the mirror increasing or decreasing
the convexity. Akle and Leo (2003) proved the feasibility of using those transducers
as flapping mechanisms for a Micro Air Vehicles. Furthermore, ionic polymer me-
chanical properties are quite similar to the human muscle, which raise there potential
of replacing Human muscle (Shahinpoor, 1994). Their high dexterity makes them
12

perfect for robotics applications, they can be used to build end-effectors as dexterous
as the human hand or as soft malleable end-effectors
1.6 Motivation
As mentioned earlier, transducers that operate at lower voltages are highly desired.
Such actuators will have better biological compatibility, higher safety standards, and
they will be easier to incorporate in systems especially for space applications. Figures
of merit of an actuator include the maximum achievable strain, strain rate and energy
density. Increasing these actuation characteristics broadens the applicability of ionic
polymer transducers. During the early stages of this dissertation a linear relationship
between capacitance and bending performance in ionic polymer actuators is estab-
lished. This relationship between normalized deflection versus capacitance indicates
that a fundamental relationship between charge motion and actuation mechanism
in ionic polymer transducers. Capacitance in ionomeric actuators is mainly due to
an electric double layer, which forms at the interface between the ionomer and the
conducting electrode (Sadeghipour et al., 1992). Moreover diluents have a limited
electrochemical stability window. For example water hydrated ionic polymer trans-
ducers are limited to an operating voltage of 1.23V . Above this voltage water mole-
cules starts to break down into hydrogen and oxygen gases, leading to the loss of the
diluent and degradation in performance (Bar-Cohen, 2001). This process is known
as the electrolysis of water. For most ionic liquids and organic liquids this voltage
is limited to approximately 3V. The linear relationship indicates that increasing the
capacitance of an actuator increases its displacement per unit volt. Thus increas-
ing the capacitance of the transducer will enhance the maximum achievable strain.
Apart from electrical and environmental stability the viscosity of the diluents critical
to speed of ions in the transducer. The diluent in ionic polymer transducer effects the
strain rate. As mentioned in the previous section, increasing the conductivity of the
electrode also enhances the strain rate. This is achieved by exploring the percolation
theory and its effects on the electrode. As mentioned in the introduction a novel
13

fabrication technique called the Direct Assembly Process is developed during this re-
search in collaboration with Dr. Kenton Wiles and Dr. James McGrath at Virginia
Tech. The Direct Assembly Process provides us the ability of varying the electrode
conducting powder and therefore control on the electric double layer and pseudoca-
pacitance properties of the transducer. Finally the extensional experimental results
made it possible to model the effect of varying the thickness of the electrode. This
work lead to the active area bimorph model. The next sections presents a literature
review of the percolation process and electric double layer theory.
1.7 Percolation Process
Percolation process describes the behavior of a flow in a random medium. These
flows include but not restricted to fluids, ions, electrons, magnetic flux, heat, or
even viruses (Zallen, 1983). The random medium is composed of a blocking phase
and a flow permitting phase (Domb, 1983). The study of percolation first arose by
Broadbent in 1954 (Broadbent, 1954), later introduced mathematically by Broadbent
and Hammersley in 1957 (Broadbent and Hammersley, 1957). Percolation theory is
applied to a diversity of phenomena that ranges from epidemic spread in a population
to the study of quarks in nuclear matter (Zallen, 1983). The percolation theory states
that there is a certain threshold level denoted pc at which the medium transitions from
a generally flow blocking medium to a flow permitting medium.
In the case of ionic polymer transducers the percolation theory is used to
study the transition of a conductor-insulator medium from an insulator to an electron
conducting material. There are two types of percolation processes on a lattice: the
bond percolation and site percolation (Zallen, 1983). The bond percolation considers
connected or disconnected paths, while the site percolation considers sites that are
clustering together. The conductor-insulator matrix is a site percolation problem.
A continuous conducting network is formed by the coalescence of the grains in the
insulator medium. Percolation theory predicts that there is a critical percolation
threshold at which a conductive path is formed causing the material to convert from
14

a insulator to a conductor (Park et al., 2002a). The mathematical development
of the percolation theory is a stochastic-geometry process (Zallen, 1983). Classical
percolation theory is typically modeled using a power law which is a function of the
volume percent of the conducting phase:
σ = kp(p− pc)βp (1.2)
where βp is an exponent with a theoretical value of 2, and kp is a scaling constant
depends on the conductivity of the materials involved (Stauffer and Aharony, 1992).
Equation 1.2 indicates that increasing the conductor phase decreases exponentially
the resistivity of the electrode. The shape and more importantly the aspect ratio of
the cites is critical on the value of pc (Park et al., 2002a).
1.8 Electric Double Layer
Capacitance in ionic polymer transducers is mainly due to an electric double layer,
which forms at the interface between Nafion and platinum (Sadeghipour et al., 1992).
Moreover, other slow Faradaic charges are mobilized due to processes that occur on
the metal-ionomer interface. Those reactions and processes are known as pseudoca-
pacitance.
During the search on methods to increase capacitance we came across highly
capacitive devices known as supercapacitors or electrochemical capacitors. Those
devices have large capacitance per unit weight or unit volume and used mainly as an
intermediate solution between a capacitor and a battery. Their design is similar to
ionic polymer transducers, they consist of two high surface area electrodes in a bath of
electrolyte with a separator in between. They take the advantage of high capacitance
of the electric double layer, and also the slow and large pseudocapacitance of some
electrode materials. The goals of this well-established field of supercapacitors are
similar to the ones for ionic polymer transducers. They need large capacitances, fast
response, and environmental stability. Several of the ideas and models that will be
discussed hereafter are obtained from supercapacitor literature.
15
The electric double layer (EDL) is defined as an electrically neutral system
that occurs at an interface or surface, in which a layer of positive charges opposes a
layer of negative charges, surrounded by oriented polar molecules (Sparnaay, 1972).
In electrolytic solutions the charge accumulates at the interface between the surface
of the conductor and an electrolytic solution and hence forms a double layer, the
separation of each layer being of the order of a few angstroms (Endo et al., 2001).
The models of the EDL will be presented in the historical progressive development of
its structure. The electric double layer was first defined by von Helmholtz (1853) as
the accumulation of charges on the interface of two dissimilar metals. Gouy (1910) and
Chapman (1913) developed a model independently which accounted for the thermal
motion of the ions and described the diffuse layer. Stern (1924) presented a new model
that combined the Helmholtz and Gouy-Chapman models. His model treated the
overestimation of the electric double layer capacitance. Conway (1999) and Grahame
(1947) added the specific adsorption of ions to the Stern model. Graham’s model
constituted by three regions of inner Helmholtz plane (IHP), outer Helmholtz plane
(OHP) and the diffuse region (Endo et al., 2001). Several other chemical concepts
and mechanisms were added to the modeling of the electric double layer. The Bockris,
Devanathan and Muller model (Bockris et al., 1963), which adds the predominance of
diluent molecules near the interface to the Graham model, is considered an acceptable
model for most current applications (Endo et al., 2001).
1.8.1 The Helmholtz model
Helmholtz suggested the double layer in 1853 for a metal-metal interface, but it was
not until 1879 that he developed it for the metal-electrolyte interface (Sparnaay,
1972). This model, is also known as the Helmholtz molecular condenser (Kitahara
and Watanabe, 1984), assumes an interface that consist of a layer of electrons at the
surface of the electrode, and an array of ions in the electrolyte (Conway, 1999) as
shown in Figure 1.6(a) . The specific capacitance of the Helmholtz double-layer is
16

++++++
++
+++
-----------
-----------
+
-
+
+++
++
+
+
++
++
+
+
++
+
+
+
+
+
+
+
+
++
+++
+
+
+
+++
+
+
-------------
-
-
-
-
-
-
--
-
- -
-
-
++++++
++
+++
----------- +
+
++
++
+
+
++
+
+
+
+
+
+
+ +
+
++
+++
+
+
+
+++
+
+
-
-
-
-
-
-
-
-
--
-
- -
-
-
-----------
+ +
+
+
+
+
-
-
-
Ψ0
ΨS
Ψ0
ΨS ΨS
Ψ δ
Stern plane DiffuseLayer IHP OHP
Solvent molecules
Adsorbed neutral molecules
Ions with hydration shell
DiffuseLayer
(A) (B) (C) (D)
Ψ0
Figure 1.6: Electric double layer models (a)Helmholtz model, (b)Gouy-Chapman, (c)Stern, and (d)Bockris, Devanathan, and Muller (BDM)model
given by the following equation (Endo et al., 2001),
C =εA
4πδ, (1.3)
where ε is the dielectric constant of the electrolyte, δ is the distance from the electrode
interface to the center of the ion, and A the effective surface area of the electrode
interface. This model failed to account for the electrolyte concentration and it neglects
interactions occurring further from the electrode than the first layer of adsorbed
species (Endo et al., 2001). Equation 1.3 indicates that the capacitance increases
linearly with the Area (A), and C/A is defined as the specific capacitance, which is a
constant for a conductor in a given electrolyte.
1.8.2 The Gouy-Chapman model
Gouy and Chapman independently developed a double layer model which is also
known as the diffuse double layer (Endo et al., 2001). This model considered the
thermal motion of the ions and accounted for the applied potential and considered
the electrolyte concentration, both influencing the value of the double layer capacity
(Kitahara and Watanabe, 1984). The double layer would not be as compact as in the
17

Helmholtz description, but of variable thickness and the ions being free to move as
shown in Figure1.6(b).
This model is analyzed in terms of the two basic equations, first the Poisson
equation,
d2ψ
dx2= −4πρ
ε, (1.4)
where ρ is the volume charge density at a point where the electric potential is ψ
and ε is the dielectric constant (Kitahara and Watanabe, 1984). The other is the
Boltzmann equation at the two electrodes:
n+ = n+0e− v+eψ
kT (1.5)
n− = n−0ev−eψkT (1.6)
where n+(−) is the number concentration of ions in the diffuse layer, n+(−)0 that of
the bulk solution, v+(−) the valence of the ions, e the elementary charge (1.602 176
53 10−19 C), k the Boltzmann constant (1.38 10−23 J/K), and T the absolute tem-
perature (Kitahara and Watanabe, 1984). As mentioned earlier the Gouy-Chapman
model typically predicts larger capacities compared to experimental results due to
the assumption that ions are point charges.
1.8.3 Stern and Grahame models
Stern (1924) considered that ions have a finite size and that the charge is located in
the center. He divided the double layer into two parts, a compact layer of ions next
to the electrode followed by a diffuse layer extending into bulk solution as shown in
Figure 1.6(c) (Endo et al., 2001).
Grahame divided the Stern layer into two regions. He denoted the closest
approach of the diffuse ions to the electrode surface as the outer Helmholtz plane.
The layer of specifically adsorbed ions at the electrode surface was designated as being
the inner Helmholtz plane (Endo et al., 2001).
18

The Stern and Graham models are analyzed using the Langmuir theory. The
capacitance is computed by combining the capacities of the different layers in series.
The capacitance of the Stern plane Cs which is computed according to Equation
1.3, and the capacitance of the Gouy-Chapman diffuse layer Cd. While the specific
adsorption capacitance is computed according to the following,
Ca = Cd∂σ
∂σA, (1.7)
where σ is charge density on the electrode, and σA is the surface charge of the specif-
ically adsorbed ions(Sparnaay, 1972).
1.8.4 Bockris, Devanathan, and Muller (BDM) models
In 1963 Bockris, Devanathan and Muller proposed a model that included the influence
of the diluent near the interface. They suggested that a layer of water was present
within the inner Helmholtz plane at the surface of the electrode (Bockris et al., 1963).
The dipoles of these molecules would have a fixed alignment because of the charge
in the electrode. Some of the water molecules would be displaced by specifically
adsorbed ions as shown in Figure 1.6(d). Other layers of water would follow the first,
but the dipoles in these layers would not be as fixed as those in the first layer. A
summary of the advantages and disadvantages of the each model with the formula
used to compute the capacitance is presented in Table 1.1.
1.9 Pseudocapacitance
In addition to the electrostatic capacitance that arises from the separation of charge
in the electric double layer, a contribution to capacitance can be made from reversible
Faradaic reactions that can occur on the surface of the electrode. The charge required
to facilitate these reactions is for thermodynamic reasons dependent on the poten-
tial, resulting in a Faradaic pseudocapacitance (Kotz and Carlen, 2000). Those type
of reactions are slow in nature, and are similar to store electrochemical energy in
19

Pros Cons CapacitanceHelmholtz Works in high Failed to account CH =
εA4πδ
concentration for electrolyteelectrolytes concentration and
potential dependenceof the capacitance
Gouy-Chapman Accounted for the Assumes ions as CG =
thermodynamic diffuse point charges v2e2nε2πkT
cosh veψ02kT
layer
Stern Combined Helmholtz NA CS =CHCGCH+CG
and Gouy-Chapmanand works well forpure electrostaticdouble layer
Graham Added adsorption NA CG =CaCSCa+CS
to the Stern modelBDM Accounted for the NA NA
dipoles of the diluentmolecules
Table 1.1: Summary of the advantages and disadvantages of each model withthe corresponding capacitance.
batteries. Pseudocapacitance could occur due to two types of processes, the first is
adsorption and the second the redox process.
1.9.1 Adsorption
It is also known as the underpotential deposition, and consist of two dimensional de-
positions of adatom arrays on the electrode surface (Conway et al., 1997). Adsorption
capacitance could be 10-100 times larger than that of the double layer (Conway et al.,
1997). Examples of adsorption includes the deposition of H or Cu on Pt, Pb or Bi
on Au, Bi on Ag, H on Rh or Pt (Conway et al., 1997). A typical underpotential
deposition reaction is as follows,
M +H3O+ + e M −H +H2O, (1.8)
20

Compared to the electrostatic double layer, pseudocapacitance is a slow process
(Grzeszczuk and Poks, 1995). The current of the underpotential deposition process
as a function of time(Equation 1.8) is written as (Conway, 1999),
i =FQ1RT
K1CH3O+ exp−F (V±st)RT
K1CH3O+ + exp−F (V±st)RT
2 s, (1.9)
where s is the sweep rate.
In some situations adsorption could be so large that the potential will flip
polarity in some regions of the double layer (Kitahara and Watanabe, 1984).
1.9.2 Redox pseudocapacitance
Redox pseudocapacitance is 10x larger than the adsorption and 100x the double layer
capacitances (Frackowiak and Beguin, 2001). Redox stands for Reduction-Oxidation,
and it is a chemical process involving electron transfer between an oxidized species
Ox and a reduced species Red according to the following (Conway, 1999),
Ox + ze Red, (1.10)
Other types of pseudocapacitance which include the 3-dimensional sorption
process (electrochemical intercalation) with charge transfer. This process occurs in
lithium ion batteries, where the Li+ ion is adsorbed into a layer-latice host materials
on the cathode, while the anode is a lithium metal (Conway, 1999). The last pseudo-
capacitive process is the phenomenon of partial charge transfer which usually occurs
on the anode with the anion. This occurs in the electrostatically adsorbed ions in the
electric double layer, when some specific electronic interaction between the ion’s va-
lence electrons the electrode’s surface orbitals occur. The chemical reaction involving
an ion is as follows,
M + A− M/A(1−δ)− + δe, (1.11)
where δ is a fraction of an electron charge Conway (1999).
21

1.10 Electromechanical Coupling Models
Physics-based modeling efforts by Nemat-Nasser (2002b) and Leo et al. (2005) high-
lighted the role charge distribution at the boundary layer that forms at the interface
of the electrode and the polymer. Although the understanding of fundamental actu-
ation mechanisms in ionic polymer transducers is still under debate, our results and
several other models relates such mechanisms to ion conduction across the membrane.
Leo et al. (2005) modeled the electromechanical coupling by the expansion form
σ(x, t) = αρ(x, t) + βρ2(x, t), (1.12)
where α and β are coefficients that define the linear and quadratic terms of the
transduction model, while σ represent the stress and ρ is the space-temporal charge
density. In this dissertation a similar approach is adopted and the electromechanical
coupling model is assumed to be in the form of:
= αQ+ βQ2 (1.13)
where represents the strain and Q is defined as the charge per unit area. The
quadratic term in this model produces a 1st harmonic response for a sine wave voltage
input. For ionic polymer transducers with symmetric electrodes this term generates a
zero net bending moment, due to the expansion of both active areas. If the actuation
response is measured in the thickness direction the total strain in the transducer is the
addition of strains in both electrodes. Hence, the positive βQ2 term is cumulative in
extensional actuation. Moreover, the linear term is canceled in extensional actuation
of transducers with symmetric electrodes. Non-linear behavior in the bending actua-
tion is reported in literature (Kothera and Leo, 2005). The quadratic term generates
small 1st harmonic response in slightly assymetric electrodes.
1.11 Objectives
The objectives of this dissertation are classified in three categories. The first is the
development of experimental and fabrication tools that enable the variation and char-
acterization of desired parameters. The DAP provided the fabrication tool which can
22

precisely vary most parameters in the transducer including the polymer, diluent, elec-
trode species and architecture. Bending and extensional characterization setups are
build to characterize the mechanical, electrical and electromechanical properties of
the transducer. The second category is transduction properties enhancement. The
properties that are targeted in this dissertation are the maximum strain and the
strain rate. The last category is the modeling and the understanding of actuation
mechanisms of the transducers. These models will serve as transducer design tools,
and toward the understanding of the basic physics of the electromechanical coupling.
1.12 Contributions
This dissertation has three major contributions to the field of ionic polymer trans-
ducers. These contributions enhance the performance of ionic polymer transducers,
provide tools to the fabrication and characterization of the actuators, and finally
highlights some physic based actuation concepts through models and correlations.
The following is a list of these contributions:
• The first major contribution is the determination of a correlation between ca-pacitance and mechanical strain. This correlation indicates that the actuation
response in ionic polymers is directly related to the charge displacement in the
material. This result has a major impact on the modeling and on the under-
standing of the actuation mechanisms.
• The second major contribution is the development of a fabrication process whichallows good control on the composition of ionic polymer transducers. This
process, called the Direct Assembly Process, facilitates the study of different
diluents in ionomeric actuators. This resulted in a dry actuator with EmI-
Tf ionic liquid diluents that can operate in air for over 250000 cycles. The
DAP allows the variation in the electrode architecture which enabled us to
fabricate dry transducers with 50x better performance compared to transducers
made using the impregnation-reduction technique. DAP fabricated transducers
23

achieved a strain of 9.38% at a strain rate of 1%/s. This DAP allows variation
of several other transducer parameters including the ionomer used leading to
more performance.
• Finally, an extensional actuation mechanism in ionomeric polymer transducers
is reported for the first time in this dissertation. This actuation mechanism
enables a new class of ionic polymer transducers with large force and small
displacement. Furthermore this actuation mechanism leads to the development
of an active areas model that emphasizes the importance of the boundary layer
on the conductor-ionomer interfacial area.
1.13 Document Organization
This document is organized in six chapters. In this chapter an introduction and liter-
ature survey are presented; the next chapter will cover the experimental methodology.
Chapter two begins with a description of the electromechanical characterization pro-
cedures and setups. A fixture is built to characterize the polymers in bending, while
another fixture provide the extensional electromechnical properties of a transducer.
The second part of the chapter presents a novel fabrication technique for ionic poly-
mer transducers which is developed in this dissertation. Typically, platinum and gold
electrodes are plated on an ionic polymer membrane using an electroless chemical de-
position process known as the impregnation-reduction. The impregnation reduction
method provides indirect and limited control on the morphology of the electrodes.
Moreover this impregnation-reduction method is a function of polymer morphology
and ionic content. In this work several process parameters need to be manipulated
and optimized for different ionomers. A novel method named as the Direct Assembly
Process (DAP) is developed, which enables more precise control on electrode morphol-
ogy. This process is developed in collaboration with Dr. Kenton Wiles and Dr. James
McGrath at Virginia Tech. The method consists of mixing an ionic polymer disper-
sion or solution with a fine conducting powder and attaching it to the membrane as
an electrode. Direct Assembly Process allows the use of any type of ionomer, diluent,
24
conducting powder, and counter ion in the transducer. The novel plating method
permits the exploration of any novel polymeric design. Several conducting powders
are incorporated in the electrode including single-walled carbon nanotubes (SWNT),
polyaniline (PANI) powders, high surface area RuO2, and carbon black electrodes.
The DAP provided the tool which enabled us to study the effect of electrode archi-
tecture on performance of ionic polymer transducers.
The third chapter covers the correlation between capacitance and actuation
performance of those transducers, while the fourth discuss the experimental results
that optimized the direct assembly process. Charge motion in ionomeric actuators
is mainly due to an electric double layer, which forms at the interface between the
ionomer and the conducting electrode (Sadeghipour et al., 1992). As mentioned
earlier the adsorbed positive ions are critical to the generation of electromechanical
strain. The electric double layer capacitance increases linearly with the interfacial area
Endo et al. (2001), and therefore increasing the interfacial area between the metal
and the ionomer mobilize more ions and increases the performance of the actuator.
Ohms law states that charge injection rate is proportional to the conductivity of the
electrode. Therefore the conductivity through the electrode is critical to the speed
of the actuation mechanism in ionic polymer transducers. In this chapter the effect
of manipulating the metal powder content in the electrode on the actuation of ionic
polymer transducers is explored. The trends in speed and maximum performance are
explained in terms of the electric double layer theory and percolation behavior of the
metal-polymer matrix in the electrode.
In order for ion conduction to occur in Nafion membranes, the cations within
the membrane must be dissociated by saturation with an appropriate diluent. Typ-
ically, the diluent used has been water. Water is a volatile diluent, leading to de-
hydration and the corresponding loss in performance of ionic polymer transducers
when operated in air. Bennett and Leo have shown that the hydration problem can
be overcome by using ionic liquids as the diluent in these transducers Bennett and
Leo (2004). Ionic liquids offer increased environmental stability and a larger electri-
cal operation window compared to water but suffer from high viscosity. Transducers
25
solvated with 1-ethyl-3-methylimidazolium trifluoromethanesulfonate (EmI-Tf) ionic
liquids have slower strain rates compared to water hydrated samples. Five organic
diluents are also considered in this study, PolyEthylene Glycols (PEG ) with four
molecular weights (MW) and Formamide. Viscosity and polarity of such diluents are
correlated with the strain rate response in actuators. These organic diluents operates
in air for 3 to 5 hours before dehydration. Chapter 4 will present a detailed study of
transducers with these diluents.
In Chapter 5 the active areas model is mathematically derived and experimen-
tally verified. Extensional actuation in ionic polymer transducers is first reported and
characterized in this dissertation. An electromechanical coupling model presented by
Leo et al. (2005) determined the strain in the active areas as a function of the charge.
This model is presented with a linear and a quadratic term that produces a 1st har-
monic response for a sine wave actuation input. The quadratic term in the strain
generates a zero net bending moment for ionic polymer transducers with symmetric
electrodes. The linear term is also canceled in extensional actuation for symmetric
electrodes. Moreover, in Chapter 5 the extensional and bending actuation in ionic
polymer transducers are explained using a bimorph active area model. Several experi-
ments are performed to compare the bending actuation with the extensional actuation
capability. The active area in the model is assumed to be high surface area electrode
in the transducer. The electric double layer theory states that ions accumulate in a
thin boundary layer close to the metal-polymer interface. Since the metal powders
are evenly dispersed in the electrode area of the transducer, this area is expected
to actuate evenly in the actuator. Finally the last chapter provides a summary and
conclusions of this work.
26

Chapter 2
Experimental Methodologies
In this chapter a description of the ionic polymer testing experiments with fixtures
and electrical circuits is presented. Electromechanical characterization of the sam-
ples is accomplished with two experimental test apparatus. One setup characterizes
the bending response of the transducers, while a second apparatus measures the ex-
tensional response. A novel fabrication technique for ionic polymer transducers is
developed for this dissertation. The impregnation reduction method commonly used
in plating the ionomer provides indirect and limited control on the morphology of the
electrodes. Moreover this impregnation-reduction method is a function of polymer
morphology and ionic content. In this work several process parameters need to be
manipulated and optimized for different ionomers. A novel method named as the
Direct Assembly Process (DAP) is developed, which enables more precise control on
electrode morphology. The method consists of mixing an ionic polymer dispersion
or solution with a fine conducting powder and attaching it to the membrane as an
electrode. Direct Assembly Process allows the use of any type of ionomer, diluent,
conducting powder, and counter ion in the transducer. Several fabrication schemes
could be followed for the DAP. Optimal fabrication parameters are usually determined
by a critically controlled parameter such as the diluent species in the transducer, the
morphology of the electrode, etc. This chapter starts with a detailed description of
the direct assembly process while highlighting all the parameters that can be explored.
Next, the conducting powders studied in this work are presented with their distinct
27

+--
loadcell
+
current
voltagevoltage
deflectionloadcell
appliedload
blockedforce
freedeflection /impedance
mechanicalstiffness / sensing
δ
T
Lf
charge/current
+--
loadcell
+
current
voltagevoltage
deflectionloadcell
appliedload
blockedforce
freedeflection /impedance
mechanicalstiffness / sensing
δ
T
Lf
charge/current
Figure 2.1: The experimental setup used to for the electromechanical measure-ments.
properties. Third we present the diluent used and finally the method is characterized
in term of reliability, repeatability and some performance matrix.
2.1 Electromechanical Characterization: Bending
The electromechanical characteristics of ionic polymer transducers in bending are
measured from three sets of experiments. These experiments measure five transducer
properties: the electrical impedance, mechanical impedance, sensor response, actua-
tion blocked force, and actuation free displacement. Each experiment is performed
using a step input or a random input. The five tests are first described and details
on the circuitry and equipment is provided.
The samples used for these tests are usually cut in 3 mm x 30 mm rectangles
and held in a cantilevered configuration in a clamp with fixed gold electrodes (see
Figure 2.1). The free length of the transducer, Lf , is 19 mm. The thickness of the
transducer, T, varies between approximately 0.08 mm and 0.26 mm depending on
the number of electrode layers and the thickness of the membrane. The first test is
a blocked force test which characterizes the maximum force the actuator generates
28

due to an applied voltage. In this experiment the tip of the polymer is blocked by a
load cell which measures the force generated due to a random voltage with a RMS
magnitude of 1 V is applied on the electrodes using a Fourier analyzer and amplifier.
In the second test the load cell is removed and a non-contact laser vibrometer measures
the maximum displacement δ(t) of the transducer in response to an applied voltage.
This is the free deflection test. During this test the current i(t) induced in the
polymer due to the applied voltage v(t) is also measured allowing the measurement
of the electrical impedance of the polymer. The frequency response function between
the excitation voltage and the output displacement and between the input voltage and
induced current are measured over the frequency range 0.2 Hz to 200 Hz. This setup
is also used to measure the time domain response of the transducer to a sine wave
or step voltage input. The final test performed on the ionic polymers determines
the mechanical impedance. In this test one end of the transducer is mechanically
displaced by an external shaker, while the other end is blocked with a load cell.
Referencing the measured force to the displacement results in a measurement of the
stiffness of the polymer.
The measured data is then post-processed to compute the material parameters
of the samples. The free deflection δ(t) (in the time domain) or the free deflection
frequency response ( δ(ω)/v(ω) ) are used with equations (2.1) and (2.2), respectively,
to compute the bending strain as a function of time or frequency. Equations (2.1)
and (2.2) assume that the transducer bends with a constant curvature; experimental
results demonstrate that this is an appropriate assumption for the experiments per-
formed in this dissertation (Akle et al., 2004a). Furthermore those equations are only
valid below the first reasonance frequency, where the mode shape of the beam has a
constant curvature.
(t) =δ(t)T
L2f(2.1)
(ω)
v(ω)=
δ(ω)v(ω)T
L2f(2.2)
where is strain in the outer fibers of the transducer.
29

The impedance Z(ω) of the samples is computed using equation (2.3), and the ca-
pacitance C is computed using equation (2.4) by assuming the polymer is a network
of capacitors and a resistor in series (Akle et al., 2005).
Z(ω) =v(ω)
i(ω)(2.3)
C =1
Im(Z(ω))ωA(2.4)
where A is the area of the transducer and Im(Z(ω)) is the imaginary component of
the impedance. In some cases the modulus of elasticity is computed from the natural
frequency of the system using equation (2.5) and the measured geometry. Assuming
that the ionomeric transducer is a cantilever beam, the modulus of elasticity E is
E =ω2nλ
k4nI, (2.5)
where ωn is the measured natural frequency determined from the reasonance peaks
in the displacement frequency response function. The variable λ is the linear mass
density of the beam, I is the moment of inertia around the axis of bending, and kn is
computed for the first frequency according to (Inman, 2000)
kn =1.875104
Lf. (2.6)
Damping properties of the transducer are also obtained from the experimental data.
Therefore strain per charge frequency response functions provide a better estimate of
the damping ratios. The half power method, also known as the 3dB method is used
to compute the damping ratio. The damping ratio is estimated according to
ξ =|ωa − ωb|2ωn
, (2.7)
where ωa and ωb are the frequencies corresponding to the intersection between the 3dB
line below the maximum of the peak with the frequency response function (Ewins,
2000). The damping properties are also approximated by assuming the beam to be a
single degree of freedom damped system and the frequency response function is fitted
to the transfer function
H(s) =ω2n
s2 + 2ξωnS + ω2n(2.8)
30

where s is the Laplace variable (Ewins, 2000).
A direct measurement of the stiffness is obtained from the third set of exper-
iments. Assuming that the polymer is a sliding-pinned beam, the Young’s modulus
of elasticity is approximated to the first mode using the following equation (Wesley,
2003),
E =kL3
π2
3 WT 3
12
, (2.9)
where k is the measured stiffness, L is the free length, W is the width, and T is the
thickness. Wesley (2003) showed that the experimental apparatus used in this study
is only valid at low frequencies (usually lower than 30Hz). Above this frequency
some fixture dynamic effects will deteriorate the accuracy of the frequency response
function.
A single sensing test is also performed on the ionic polymers. In this test
one end of the polymer is mechanically displaced by an external shaker while the
other end is blocked with the load cell (see Figure 2.1). The charge generated across
the thickness is sensed either by a charge sensor or a short circuit current sensor.
The sensor sensitivity is defined as the measured charge or current per unit induced
velocity.
Each of the tests could be run in two forms. The first is the step response.
A step input in applied to the system, and the corresponding response is measured.
This test is essential to determine the relaxation of the polymers. It is also used to
determine the static values of the electrical and mechanical impedances. The main
disadvantage of the step response analysis is repeatability. The back relaxation in
ionic polymer transducers varies in speed and magnitude from test to test. The
second is analyzed in the frequency domain. This analysis proved to be more robust
and repeatable for ionic polymer transducers. The input for this test is a random
white noise signal of a frequency range from 0Hz to 256Hz. An anti-aliasing filter
is used to filter the response above 200Hz. Data in the frequency range of 200Hz -
256Hz is considered distorted by the anti-aliasing filter and consequently it is removed
from the analysis. The response is then transformed to the frequency domain using
31

Force sensor
Laser vibrometerbeam
Ionic Polymer Actuator
Force sensor
Laser vibrometerbeam
Ionic Polymer Actuator
Force sensor
Actuator
Force sensor
Laser vibrometerbeam
Ionic Polymer Actuator
Force sensor
Laser vibrometerbeam
Ionic Polymer Actuator
Force sensor
Actuator
Force sensor
Actuator
Figure 2.2: Experimental setup used for the extensional electromechanicalmeasurements.
the Fourier transform to yield the frequency response function between the relevant
input-output pair.
2.2 Electromechanical Characterization: Extensional
The extensional electromechanical properties are computed from force measurements.
A force measuring setup is built and calibrated (see Figure 2.2). The load cell is a
10 lb piezoelectric Dytran 1051v1 force sensor. This load cell is pressed against the
actuator film via a stiff structure shown in Figure 2.2. A laser vibrometer measures
the displacement on the top of the support structure. The samples are prepared in
a square shape of 3mm x 3mm dimension. In some experiments the ionomeric actu-
ator is sandwiched between two metal plates and displacement is directly measured
with the laser vibrometer. Data from direct displacement measurement is generally
noisy. Transducers in the thickness direction are relatively stiff (around 10MN/m)
and thickness is in the order of 100 to 200 µm. For a 300µstrain that a typical ac-
tuator generates it is difficult to measure the 60 nm of deformation. This justifies
measuring the force compared to direct displacement measurements.
32
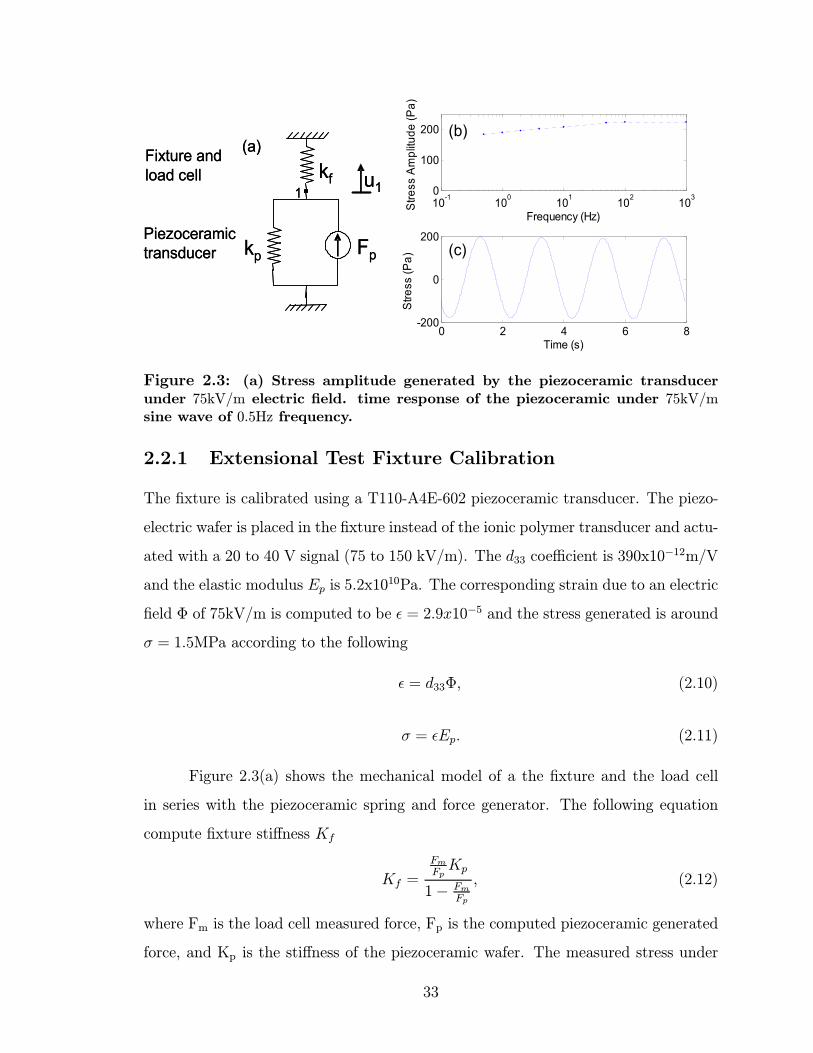
kf
kp Fp
Fixture and load cell
Piezoceramictransducer
1u1
10-1 100 101 102 1030
100
200
Frequency (Hz)
Stre
ss A
mpl
itude
(Pa)
0 2 4 6 8-200
0
200
Time (s)
Stre
ss (P
a)
(a)(b)
(c)
kf
kp Fp
Fixture and load cell
Piezoceramictransducer
1u1
10-1 100 101 102 1030
100
200
Frequency (Hz)
Stre
ss A
mpl
itude
(Pa)
0 2 4 6 8-200
0
200
Time (s)
Stre
ss (P
a)
(a)(b)
(c)
Figure 2.3: (a) Stress amplitude generated by the piezoceramic transducerunder 75kV/m electric field. time response of the piezoceramic under 75kV/msine wave of 0.5Hz frequency.
2.2.1 Extensional Test Fixture Calibration
The fixture is calibrated using a T110-A4E-602 piezoceramic transducer. The piezo-
electric wafer is placed in the fixture instead of the ionic polymer transducer and actu-
ated with a 20 to 40 V signal (75 to 150 kV/m). The d33 coefficient is 390x10−12m/V
and the elastic modulus Ep is 5.2x10¹⁰Pa. The corresponding strain due to an electric
field Φ of 75kV/m is computed to be = 2.9x10⁻⁵ and the stress generated is around
σ = 1.5MPa according to the following
= d33Φ, (2.10)
σ = Ep. (2.11)
Figure 2.3(a) shows the mechanical model of a the fixture and the load cell
in series with the piezoceramic spring and force generator. The following equation
compute fixture stiffness Kf
Kf =
FmFpKp
1− FmFp
, (2.12)
where Fm is the load cell measured force, Fp is the computed piezoceramic generated
force, and Kp is the stiffness of the piezoceramic wafer. The measured stress under
33
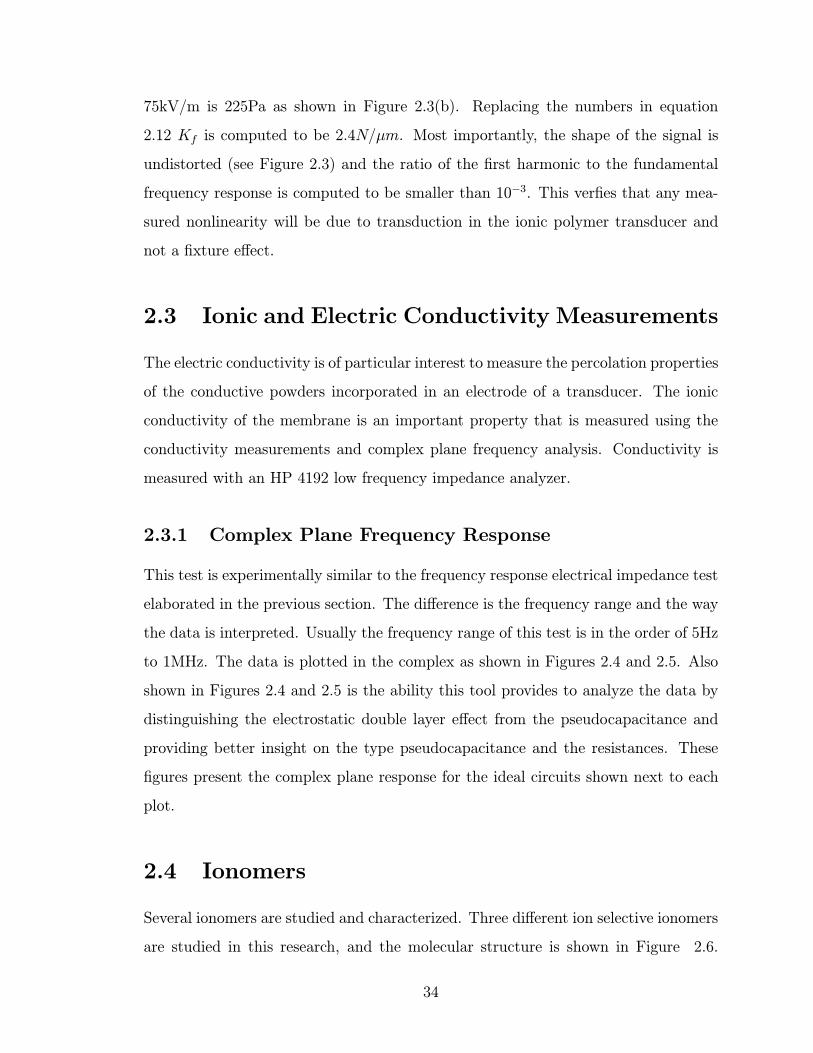
75kV/m is 225Pa as shown in Figure 2.3(b). Replacing the numbers in equation
2.12 Kf is computed to be 2.4N/µm. Most importantly, the shape of the signal is
undistorted (see Figure 2.3) and the ratio of the first harmonic to the fundamental
frequency response is computed to be smaller than 10−3. This verfies that any mea-
sured nonlinearity will be due to transduction in the ionic polymer transducer and
not a fixture effect.
2.3 Ionic and Electric Conductivity Measurements
The electric conductivity is of particular interest to measure the percolation properties
of the conductive powders incorporated in an electrode of a transducer. The ionic
conductivity of the membrane is an important property that is measured using the
conductivity measurements and complex plane frequency analysis. Conductivity is
measured with an HP 4192 low frequency impedance analyzer.
2.3.1 Complex Plane Frequency Response
This test is experimentally similar to the frequency response electrical impedance test
elaborated in the previous section. The difference is the frequency range and the way
the data is interpreted. Usually the frequency range of this test is in the order of 5Hz
to 1MHz. The data is plotted in the complex as shown in Figures 2.4 and 2.5. Also
shown in Figures 2.4 and 2.5 is the ability this tool provides to analyze the data by
distinguishing the electrostatic double layer effect from the pseudocapacitance and
providing better insight on the type pseudocapacitance and the resistances. These
figures present the complex plane response for the ideal circuits shown next to each
plot.
2.4 Ionomers
Several ionomers are studied and characterized. Three different ion selective ionomers
are studied in this research, and the molecular structure is shown in Figure 2.6.
34

CdlRs
Pure electrostatic double layer
Electric double layer with parallel Faradaic leakage resistance
Z′
Cdl
Rf
Rs
CdlRs
Pure electrostatic double layer
Electric double layer with parallel Faradaic leakage resistance
Z′
Z′′
Z′′
RfRfRsRs
Cdl
Rf
Rs
Z′′
Z′′
RsRs+
RsRs
CdlRs
Pure electrostatic double layer
Electric double layer with parallel Faradaic leakage resistance
Z′
Cdl
Rf
Rs
CdlRs
Pure electrostatic double layer
Electric double layer with parallel Faradaic leakage resistance
Z′
Z′′
Z′′
Z′′
Z′′
RfRfRfRfRsRsRsRs
Cdl
Rf
Rs
Z′′
Z′′
Z′′
Z′′
RsRsRsRs+
RsRsRsRs
Figure 2.4: The complex plane representation of a simple electrostatic doublelayer, and a double layer with leakage resistance.
The materials studied consist of Nafion, a product of DuPont and one of the most
widely studied materials associated with ionomeric transducers, and two alternative
ionomers, BPS (sulfonated poly(arylene ether sulfone)) (Wang et al., 2002) and PATS
(poly(arylene thioether sulfone))(Wiles et al., 2002), that are synthesized by the Mc-
Grath group using direct polymerization of sulfonated monomers. This synthetic
scheme affords precise control of the amount and the location of ionic groups along
the polymer backbone. These polymers differ from Nafion in two major aspects.
First, the concentration of ionic groups on a mass basis is almost double that of
standard Nafion, 1.70 meq/g for BPS-40 versus 0.91 meq/g for Nafion 1100. Also,
the backbone of the BPS and PATS copolymers are much stiffer than Nafion, which
produces a higher modulus material. Moreover Polyurethane-Polyurea with PEG seg-
35
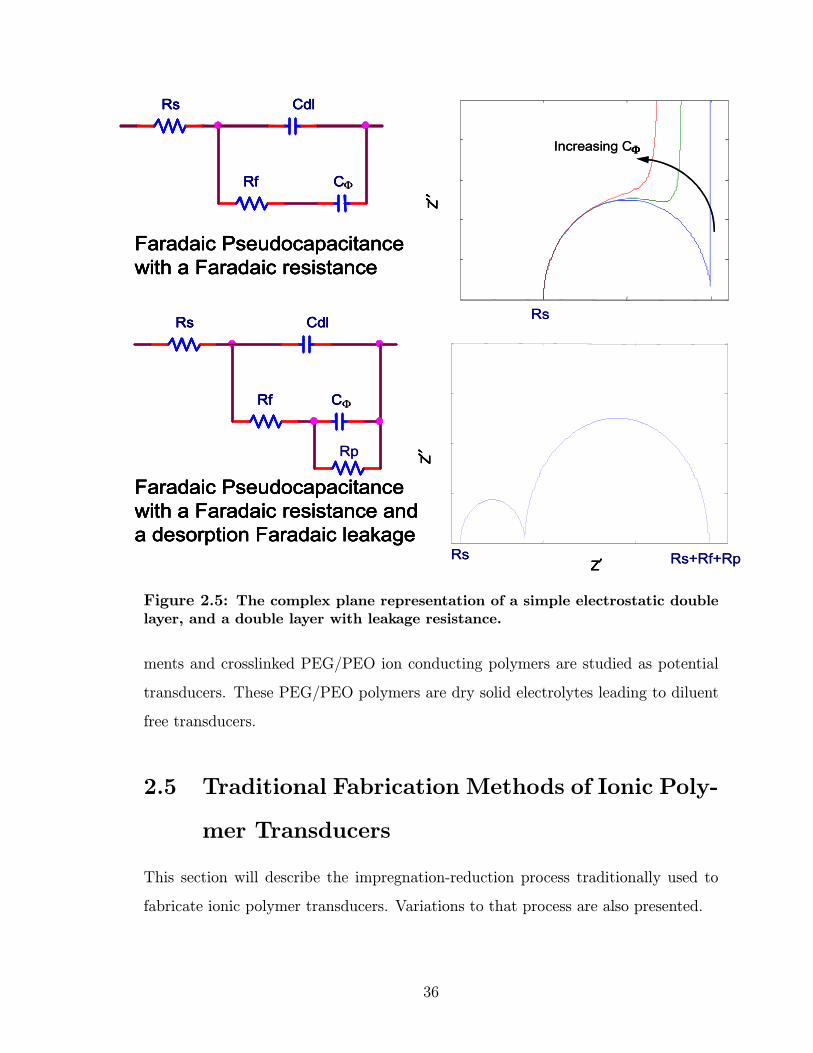
Rs
Rf
Cdl
C
Rf
Rs Cdl
C
Faradaic Pseudocapacitance with a Faradaic resistance
Faradaic Pseudocapacitance with a Faradaic resistance and a desorption Faradaic leakage
Z′
Z′′
Z′′
Φ
Rs
Rf
Cdl
C
Rp
Rf
Rs Cdl
C
Faradaic Pseudocapacitance with a Faradaic resistance
Faradaic Pseudocapacitance with a Faradaic resistance and a desorption Faradaic leakage
Z′
Z′′
Z′′
Increasing CΦ
Φ
Φ
Rs
Rs Rs+Rf+Rp
Rs
Rf
Cdl
C
Rf
Rs Cdl
C
Faradaic Pseudocapacitance with a Faradaic resistance
Faradaic Pseudocapacitance with a Faradaic resistance and a desorption Faradaic leakage
Z′
Z′′
Z′′
Φ
Rs
Rf
Cdl
C
Rp
Rf
Rs Cdl
C
Faradaic Pseudocapacitance with a Faradaic resistance
Faradaic Pseudocapacitance with a Faradaic resistance and a desorption Faradaic leakage
Z′
Z′′
Z′′
Increasing CΦ
Φ
Φ
Rs
Rs Rs+Rf+Rp
Figure 2.5: The complex plane representation of a simple electrostatic doublelayer, and a double layer with leakage resistance.
ments and crosslinked PEG/PEO ion conducting polymers are studied as potential
transducers. These PEG/PEO polymers are dry solid electrolytes leading to diluent
free transducers.
2.5 Traditional Fabrication Methods of Ionic Poly-
mer Transducers
This section will describe the impregnation-reduction process traditionally used to
fabricate ionic polymer transducers. Variations to that process are also presented.
36
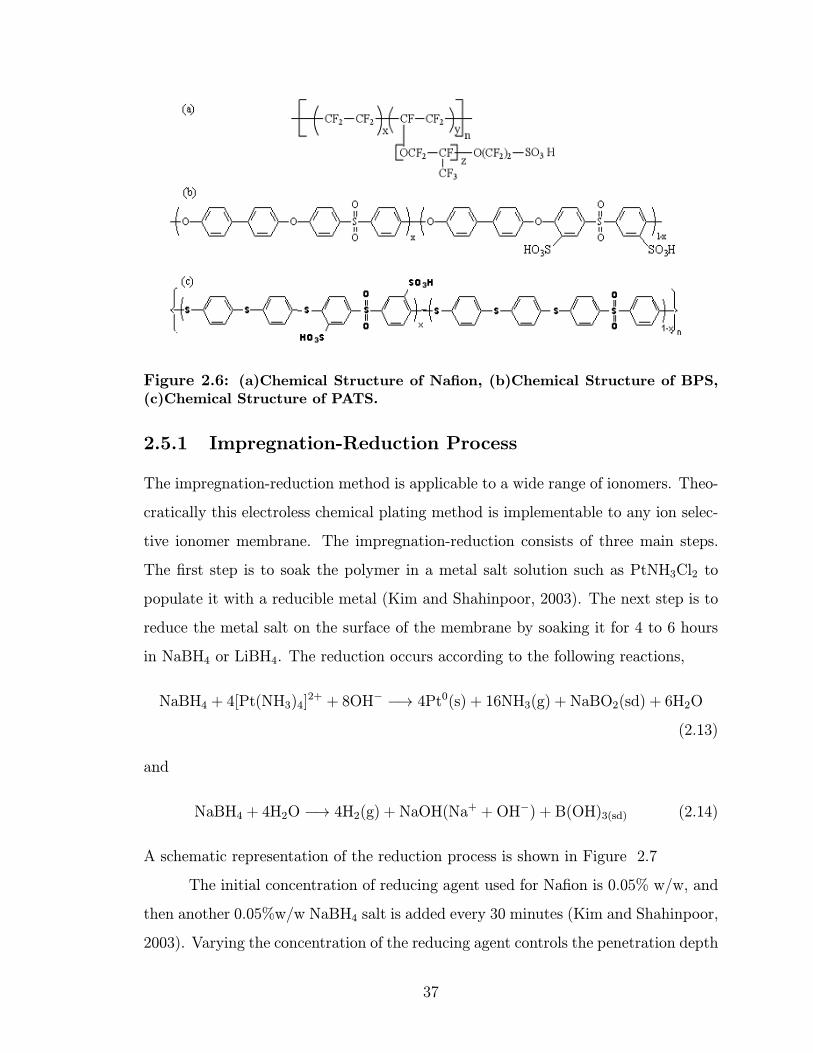
Figure 2.6: (a)Chemical Structure of Nafion, (b)Chemical Structure of BPS,(c)Chemical Structure of PATS.
2.5.1 Impregnation-Reduction Process
The impregnation-reduction method is applicable to a wide range of ionomers. Theo-
cratically this electroless chemical plating method is implementable to any ion selec-
tive ionomer membrane. The impregnation-reduction consists of three main steps.
The first step is to soak the polymer in a metal salt solution such as PtNH3Cl2 to
populate it with a reducible metal (Kim and Shahinpoor, 2003). The next step is to
reduce the metal salt on the surface of the membrane by soaking it for 4 to 6 hours
in NaBH4 or LiBH4. The reduction occurs according to the following reactions,
NaBH4 + 4[Pt(NH3)4]2+ + 8OH− −→ 4Pt0(s) + 16NH3(g) + NaBO2(sd) + 6H2O
(2.13)
and
NaBH4 + 4H2O −→ 4H2(g) + NaOH(Na+ +OH−) + B(OH)3(sd) (2.14)
A schematic representation of the reduction process is shown in Figure 2.7
The initial concentration of reducing agent used for Nafion is 0.05% w/w, and
then another 0.05%w/w NaBH4 salt is added every 30 minutes (Kim and Shahinpoor,
2003). Varying the concentration of the reducing agent controls the penetration depth
37

Figure 2.7: Schematic showing the reduction of platinum on the surfaceforming the electrode of the ionic polymer transducer
of the electrodes inside the polymer. The depth and the uniformity of the electrodes
has been shown to increase the performance of the transducer (Nemat-Nasser, 2002b).
The last parameter optimized for impregnation-reduction is the number of plating lay-
ers. As discussed in Oguro et al. (1999), increasing strain per unit voltage is observed
with increasing number of platinum layers until the mechanical stiffness of the elec-
trode reduces the deflection. This increasing trend suggests better performance with
increasing the number of plating layers. Although Oguro et al. (1999) indicated that
five layers provided the optimal bending performance, the optimal number of plating
layers need to be verified for different ionomers, metal cation, and reducing agent.
This attribute of the transducer fabrication will be investigated in this work.
The third step is to electroplate the polymer composite with a thin (50 nm
to 100 nm) of gold to increase the surface conductivity of the transducer. A fourth
optional step is to perform ion exchange, such as exchanging Na+ for the Li+ ion.
This is done by soaking the polymer in an NaOH or LiOH solution.
38

2.5.2 Variations to the Impregnation-Reduction Method
Impregnation reduction reactions requires several chemical compounds and diluents.
These methods are expensive and are not environmentally friendly. Shahinpoor
and Kim (2002a) incorporated silver, graphite and palladium particles in the mem-
brane using a physically loading method. The metal powder is hot-pressed on mem-
brane surfaces and impregnation-reduction is later performed. Physically loading
the membrane reduces the number of impregnation-layers from an average of 5 to
1. Less expensive powders such as graphite are possible to incorporate using this
method. Shahinpoor and Kim (2002b) also reported a fabrication path to make
three-dimensionally shaped transducers. Nafion solution is casted in molds with the
desired shape, and later an electrode is plated using any of the previously mentioned
methods. The 3D technique is implemented to create thick transducers. In this same
article Shahinpoor and Kim (2002b) suggests but does not implement, casting two
conductor-ionomer mixed electrodes around the main casted membrane. The sug-
gested path starts with casting a layer of the electrode mix, followed by a layer of
pure ionomer and finally a layer of the mix is casted on the top to form the second
electrode. Taegeun et al. (2001) developed a replication method to manufacture a
large surface-area ionic polymer actuator. High surface area etched aluminum foil
was used as a template for replication using liquid Nafion solution, and finally Pt was
plated on this high surface are surface to form an transducer with superior actuation
properties, such as large strains and strain rate.
2.6 Direct Assembly Process (DAP)
As mentioned in Chapter 1, a novel fabrication process of ionic polymer transducers is
developed in this dissertation. The Direct Assembly Process is inspired by fabrication
techniques used in preparing supercapacitors and hydrogen fuel cells. The DAP was
developed in collaboration with Dr. Kenton B. Wiles in Dr. James E. McGrath group.
Their expertise in fuel cell fabrication and polymer synthesis was instrumental for the
development of this process. The Direct Assembly Process can be implemented in
39

two main schemes. The first is to apply the electrode on a dry membrane and a
second method is to solvate the membrane and then apply the electrode. Moreover,
in both methods the electrode can be either painted directly on the membrane or
painted separately on a decal and later hot press it on the membrane.
2.6.1 Direct Assembly Process with Dry Membranes
The Direct Assembly Process consists of first dissolving the polymer into an alcohol
solution. In this study Nafion 1100 5% weight polymer solution is used. Solutions of
BPS and PATS ionomers are also attempted but the resulting electrodes are very stiff
and exhibit low ion conduction, therefore Nafion 1100 5% solution is used for all sam-
ples discussed in this work. The Nafion dispersion is obtained from fuelcellstore.com
and used without further modification. The next step in the process consists of mix-
ing a metal powder with the polymer solution. For some metal particulates such as
carbon nanotubes and large conductor loading, additional solvents are added to the
mixture enhancing dispersion. Isopropyl alcohol (IPA) is an inexpensive and easy to
evaporate solvent, while glycerol is added to increase viscosity. The mix is sonicated
and stirred for 1 to 4 hours to ensure homogeneity and dispersion of the metal grains.
The duration of mixing and sonication depends on the type of conducting powder and
concentration of polymer solution and metal volume percent. The conductor-polymer
is applied to the polymer in one of two ways. The first method consist of directly
painting several layers of the mix on each side of the membrane using a brush. The
sample is placed in an oven at 130 C for 15 min between each layer. The resulting
composite is then hot pressed at 210 C and a pressure of 20 MPa. This step adheres
the electrode to the membrane surface and decrease the interface resistance between
the electrode and the membrane.
The second DAP method is to paint several layers of the polymer-metal mix
on a Teflon reinforced glass fabric named Furon, and then hot press these decals
on the polymer using same pressure and temperature as in previous method. Once
cooled down the membranes are hydrated, and the Teflon mesh is detached from
the polymer. For dry actuators, the decal method controls better the loading and
40

uniformity of the electrode. Loading is controlled by weighing the decals before and
after painting the electrodes. Painting the electrode directly on the membrane causes
the polymer to swell due to solvents from the electrode mix leading to wrinkles in
the membrane. A vacuum plate is placed under the membrane during painting to
decrease wrinkling. The conductivity of the conductor-ionomer electrodes is usually
around 1 to 20 S/cm compared to 94000 S/cm for Pt. Therefore a conducive layer is
required to increase the surface conductivity of the transducer.
Ionomer solution
Conducting powder
Sonicate
Stir
Dried in the oven for 15 min under 130 C
Hot pressed under 3000 psi and 210 C
Platinum plated using Impregnation–Reduction method
Gold electroplated
Figure 2.8: Schematic showing the four steps Direct Assembly Process(DAP) for building dry transducers.
In this dissertation two methods are developed to increase surface conductiv-
ity of water hydrated ionic polymer transducers. The first method, an additional
platinum layer is applied to the surface using the impregnation-reduction method
41
previously described. A gold overlayer is then electroplated on the outer surface of
the platinum. The alternative method is composed of depositing of a Au layer by self
assembled monolayers. Supriya et al. (2005) demonstrated that solution-based as-
sembly of Au on Nafion suffered from poor adhesion of the electrodes to the substrate
and after a few cycles of actuation the electrode debonded from the surface. A thin
layer of a linear amine-terminated poly(urethane urea) (PUU) elastomer was used as
a linking or adhesive agent to enhance the adhesion properties of the electrode. A thin
layer of 1%(w/w) solution of PUU is painted on the outer surface of the membrane.
Au particles can attach to the amine and amide groups in the PUU. A monolayer of
Au thus formed can serve as the starting layer for the seeding process (Supriya et al.,
2005) to form electrodes. Transducers with Pt/Au electrodes deposited according
to the first method perform better compared to actuators with Au solution-based
assembly. Degradation in performance is due to the low conductivity of PUU, and
therefore the adhesive layer has to be very thin (< 1µm). The advantage of using the
second method is the patternability of the solution-based assembly of Au. A photo-
resist material is applied on the PUU and a light etching lithography technique is
applied pattern the surface. This method enables distributed actuation/sensing on
the submicron level. As in the impregnation-reduction an optional ion exchange step
could be made by boiling the membrane for 2 hours in a 1 M chloride solution such
as LiCL or NaCl. A schematic of this process is shown in Figure 2.8.
diluents other than water could also be incorporated into the resulting dry
membrane by following any of the previously discussed methods. In this study four
diluents are incorporated in the membrane: water, formamide, DiEthylene-Glycol
(DEG), and 1-ethyl-3-methyimidazolium trifluoromethanesulfonate (EmI-Tf) ionic
liquid. Several methods of adsorbing the diluent to the membranes are developed.
Some diluents such as formamide require approximately 24 hours to saturate the
membrane at room temperature. This duration is decreased to 3 hours if the mem-
brane is sonicated inside the solution. This duration is shortened to less than 1 hour
by heating the membrane inside the solution at 100 C. The diffusion of EmI-Tf ionic
liquid in Nafion is slower compared to formamide. To date, our group achieved a
42
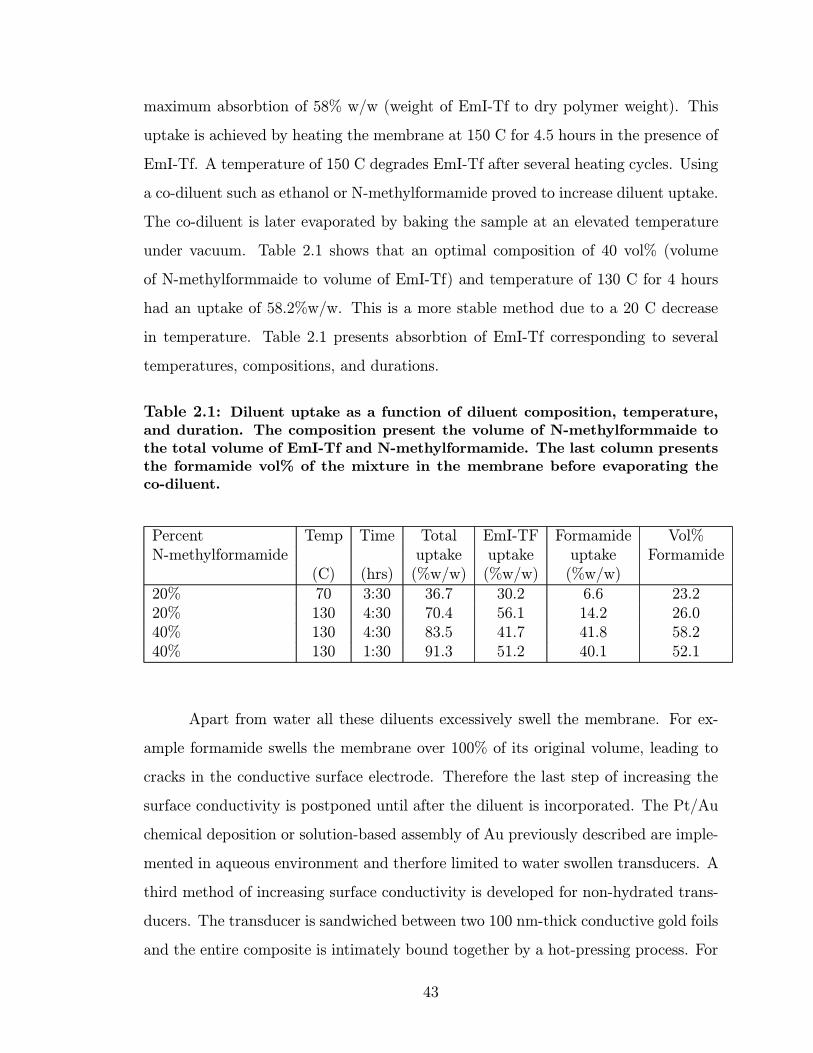
maximum absorbtion of 58% w/w (weight of EmI-Tf to dry polymer weight). This
uptake is achieved by heating the membrane at 150 C for 4.5 hours in the presence of
EmI-Tf. A temperature of 150 C degrades EmI-Tf after several heating cycles. Using
a co-diluent such as ethanol or N-methylformamide proved to increase diluent uptake.
The co-diluent is later evaporated by baking the sample at an elevated temperature
under vacuum. Table 2.1 shows that an optimal composition of 40 vol% (volume
of N-methylformmaide to volume of EmI-Tf) and temperature of 130 C for 4 hours
had an uptake of 58.2%w/w. This is a more stable method due to a 20 C decrease
in temperature. Table 2.1 presents absorbtion of EmI-Tf corresponding to several
temperatures, compositions, and durations.
Table 2.1: Diluent uptake as a function of diluent composition, temperature,and duration. The composition present the volume of N-methylformmaide tothe total volume of EmI-Tf and N-methylformamide. The last column presentsthe formamide vol% of the mixture in the membrane before evaporating theco-diluent.
Percent Temp Time Total EmI-TF Formamide Vol%N-methylformamide uptake uptake uptake Formamide
(C) (hrs) (%w/w) (%w/w) (%w/w)20% 70 3:30 36.7 30.2 6.6 23.220% 130 4:30 70.4 56.1 14.2 26.040% 130 4:30 83.5 41.7 41.8 58.240% 130 1:30 91.3 51.2 40.1 52.1
Apart from water all these diluents excessively swell the membrane. For ex-
ample formamide swells the membrane over 100% of its original volume, leading to
cracks in the conductive surface electrode. Therefore the last step of increasing the
surface conductivity is postponed until after the diluent is incorporated. The Pt/Au
chemical deposition or solution-based assembly of Au previously described are imple-
mented in aqueous environment and therfore limited to water swollen transducers. A
third method of increasing surface conductivity is developed for non-hydrated trans-
ducers. The transducer is sandwiched between two 100 nm-thick conductive gold foils
and the entire composite is intimately bound together by a hot-pressing process. For
43
dry membranes this hot-pressing is carried out at 20 MPa and 210 C for two minutes.
However, the non-aqueous solvated ionomers will flow under this high pressure and
long duration leading to the deformation of the transducer. In order to maintain
the dimensional stability of the membrane during the hot-pressing process while still
binding the three layers together, the pressure and pressing time are reduced. It is
found for EmI-Tf ionic liquid that good results are obtained for hot-pressing carried
out at 4 MPa and 160 C for around 10 to 20 seconds depending on the metal load-
ing and thickness of the electrode. As for volatile diluents such as formamide 140 C
and less than 5 to 10 seconds are sufficient and preserves the dimensional stability
of the transducer better. The gold foils used are Falcon-Brand 24 carats gold leafs;
they helped decreasing the surface resistance from greater than 100 kΩ/cm for the
painted metal layers to less than 1 Ω/cm. Transducers with high metal loading in the
electrode (> 25 vol%) a thin layer of diluted ionomer solution (50% w/w IPA/Nafion
5%) is painted over the high surface area electrodes. This step enhances the adhesion
of the gold foils to the electrode.
2.6.2 Direct Assembly Process with Solvated Membranes
The Direct Assembly Process is implemented in the solvated polymer state. Dry
assembly of the electrode might be inadequate for some diluents. As mentioned
earlier, some diluents excessively swell the membrane leading to delamination of not
only the gold overlayer but even the high surface area electrode. Moreover some
diluents might desolve the ionomer in the high surface area electrode. Nafion ionomer
solution requires a complicated processes to cast into the semicrystalline structure
of the membrane. In amorphous state Nafion in the high surface area electrode is
unstable under high temperature required for some diluents to be absorbed into the
transducer. In this DAP scheme, the membrane is solvated with the proper liquid after
being exchanged with the desired cation. A proportional amount of diluent is added
to the mix. Usually this amount corresponds to the weight of diluent absorbed in the
membrane. The electrode is painted on the both surfaces of the membranes, then
sandwiched between two gold leaves and melt pressed together under the appropriate
44
temperature, pressure, and duration. These parameters are usually similar to the
ones mentioned in the previous section, but the duration is shortened by 20% to 30%.
Challenges of this scheme are diluent loss and dimensional stability. Organic diluents
evaporate at the elevated melt-press temperature though it is below their boiling
point. A significant amount of diluent evaporates out of the membrane. This amount
is around 30% depending on the boiling point of the diluent, melt press temperature,
and diluent uptake. Some highly volatile diluents are impossible to incorporate using
this method. The diluents with boiling point less than 10 C smaller than the flow
temperature of the solvated ionomer (Tg) are hard to incorporate using this scheme
of DAP. The only possible path for such diluents is to build dry transducers and
then incorporate the diluent. The platinum and electroplated gold layers are plated
in solutions with the final diluent if possible. Otherwise, the impregnation-reduction
reaction and the electroplating are done in a diluent (or a mixture of diluents) that
have similar swelling properties to the low boiling point diluent to be incorporated. A
schematic of the direct assembly process with solvated membranes is shown in Figure
2.9.
2.7 Electrode Materials
Platinum and gold are traditionally used as electrode materials for ionic polymer
transducers (Kim and Shahinpoor, 2003), although Bennett and Leo (2003) have
used low cost non-precious metals such as copper as electrode material. Tamagawa
et al. (2003) plated Nafion with combinations of silver, copper and nickel metals using
impregnation-reduction. Shahinpoor and Kim (2002a) reported loading the polymer
membranes with metal particulates such as palladium. The metal powder is hot-
pressed on membrane surfaces and palladium or platinum impregnation-reduction is
later performed.
The ability to incorporate different electrode materials is enabled by our devel-
opment of the direct assembly process for fabricating the ionic polymer transducers.
Hybrid ionomeric transducers consisting of several conducting powders are also man-
45

Soak the membrane in solvent (Ionic Liquid,
Formamide, etc.) for the appropriate time and
temperature
Ionomer solution
Conductive powder
Sonicate
+Stir
Prepare a mixture of dissolved ionomer and
conductor particles
Direct painting under an infra-
red light
Sandwiched between two Gold
Leaves and hot pressed for 20 sec under 400 psi and
160 C
Soak the membrane in solvent (Ionic Liquid,
Formamide, etc.) for the appropriate time and
temperature
Soak the membrane in solvent (Ionic Liquid,
Formamide, etc.) for the appropriate time and
temperature
Ionomer solution
Conductive powder
Sonicate
+Stir
Prepare a mixture of dissolved ionomer and
conductor particles
Ionomer solution
Conductive powder
Sonicate
+Stir
Ionomer solution
Conductive powder
Sonicate
+Stir
Prepare a mixture of dissolved ionomer and
conductor particles
Direct painting under an infra-
red light
Direct painting under an infra-
red light
Direct painting under an infra-
red light
Direct painting under an infra-
red light
Sandwiched between two Gold
Leaves and hot pressed for 20 sec under 400 psi and
160 C
Sandwiched between two Gold
Leaves and hot pressed for 20 sec under 400 psi and
160 C
Sandwiched between two Gold
Leaves and hot pressed for 20 sec under 400 psi and
160 C
Figure 2.9: Schematic showing the four steps Direct Assembly Process(DAP) for building solvated transducers.
ufactured.
Several interesting materials will be explored in the following chapters with the
focus on their electrical and electrochemical properties. In this dissertation we will
consider high surface area platinum, gold flakes, hydrous and anhydrous RuO2, single
walled carbon nanotubes (SWNT), carbon black, and polyaniline (PANI) conducting
polymers. The following sections will discuss the properties and activities of each of
these materials. A summary of the properties will be presented in Table 4.2 in a later
chapter.
2.7.1 Carbon black
Carbon is widely used as a high surface area electrode material for several systems in-
cluding electrochemical capacitor devices(Frackowiak and Beguin, 2001). Advantages
of this material includes the low price and availability. Although less conductive than
graphite, carbon black is a good electrical conductor. It has a well established fabri-
cation processes resulting in large specific surface area materials (up to 2500 m2/g)in
46

the form of powders, woven cloths, felts, or fibers (Frackowiak and Beguin, 2001).
The specific capacitance of carbon black is around 10µF/cm2 and this value is mostly
due to the electric double layer (only around 1 to 5% pseudocapacitance)(Frackowiak
and Beguin, 2001). Carbon is one of the rare materials that could approximate a pure
electrostatic double layer (Also Hg between +0.23 to -1V RHE in acid solutions and
Au from -0.1 to +1.33V RHE in alkaline solutions show pure electrostatic double layer
capacitance)Conway et al. (1997). The small pseudocapacitance in this material is
due to the impurities on the surface of the carbon particles. This could be controlled
by special treatment for increasing the surface functionality using one of the following
methods:
• Chemical treatment (by hot nitric acid treatment).
• Electrochemical polarization (these changes are reversible and they disappearwith capacitor cycling).
• Cold plasma treatment (enhance the pore radius distribution and surface atomconcentration.
According to our knowledge carbon black was never reported as a electrode material
in ionic polymer transducers. Carbon black used in this dissertation is purchased
from Alfa Aesar with a surface area of around 80m2/g and used without further
purification.
2.7.2 Single-Walled Carbon Nanotubes
Carbon nanotubes (CNT) were discovered in 1991 by Iijima are formed by rolled
graphite sheets, with an inner diameter starting from 1 nm up to several nm and
a length of ten to one hundred µm. Tubes formed by only one graphite layer are
called single wall nanotubes (SWNT). Tubes consisting of multiple concentric graphite
layers are called multi-wall nanotubes (MWNT). Depending on the purification and
manufacturing process CNTs could be good conductors of electricity. SWNTs have
47

large effective surface area up to 1000m2/g. Like carbon black, capacitance in CNTs
is mostly electrostatic double layer.
CNT actuators are first reported by Baughman et al. (1999). The mechanics
of actuation is due to some quantum mechanical effects such as changes in orbital oc-
cupation and band structure and electrostatic double-layer charging for high-density
charge injection of either sign (Baughman et al., 1999). Due to their large elastic
modulus, CNT actuators generates large forces and small strains (0.1 to 1% strain)
(Barisci et al., 2003). As actuators they bend toward the anode(+), which is the same
direction as ionic polymers. Moreover, at high charge density the electrostatic effect
dominates and material expansion occurs regardless of the charge sign. Therefore,
such an actuating system, at high charge density, principally cannot work in the bi-
morph cantilever geometry when asymmetrical electromechanical properties of both
sides are required for cantilever bending (Levitsky et al., 2004). Due to the immobil-
ity of anions in Nafion, the quantum stretching in SWNT and electrostatic actuation
in ionomers are cumulative. Those reasons would make them a good candidate for
electrode materials in ionic polymer transducers.
Another attractive property of SWNT is the low percolation level they exhibit
in polymer matrix composite. Well dispersed SWNT/polymer matrix is proved to
percolate at 0.2 volume percent compared to around 30% for spherical particles (Park
et al., 2002b). The major disadvantage of SWNT is the high price, and the difficulty
in dispersing them in the polymer matrix (Park et al., 2002b).
The SWNTs used in this study are high purity single walled carbon nanotubes
obtained from Carbon Nanotechnologies Incorporated and is used without further
purification.
2.7.3 Conducting polymers
Polymeric materials, such as p- and n-dopable poly(3-arylthiopene), p-doped poly(pyrrole),
poly(3-methylthiophene), poly(1,5-diaminoanthraquinone), or polyaniline (PANI) have
been suggested as electrode materials in electrochemical devices such as supercapac-
itors (Prasad and Munichandraiah, 2002).
48

Figure 2.10: Charge and discharge redox mechanism of conducting poly-mers
The pseudocapacitance arises from slow charge and discharge redox reactions,
and the mechanism is shown in Figure 2.10 In terms of actuation they expand when
ions enter them, and contract in the reduced state (Madden et al., 2004). PANI
powder is purchased from Alfa Aesar doped with HCl and used without further re-
finement. The typical conductivity of doped conducting polymer is on the order of
100 S/cm compared to 1000 S/cm for carbon and larger for RuO2 and Pt metals. As
an active material conducting polymers provides strains on the order of 2 % (Madden
et al., 2002), and maximum strain rates on the order of 12 %/s have been reported
(Ding et al., 2003). Rates are limited by internal resistance of the polymers and
electrolytes, and by ionic diffusion rates of ions inside the polymer (Madden et al.,
2002).
2.7.4 Metal oxides
In electrochemical devices RuO2 and IrO2 are the preferred materials due to the
large surface area (50− 70m2/g) and good electrical conductivity while TiO2, Cr2O3,MnO2, and Co2O3 used with a carbon support (to increase conductivity)Kotz and
Carlen (2000). Metal oxides show significant pseudocapacitance in aqueous acids and
the following is an example for RuO2 (Conway, 1999)(Frackowiak and Beguin, 2001)
2RuO2 + 2H+ + 2e Ru2O3 +H2O, (2.15)
49

and in the case of hydrous ruthenium oxide,
2RuOx(OH)y + δH+ + δe 2RuOx−δ(OH)y+δ. (2.16)
RuO2 has a typical specific capacitance of 80µF/cm2, while hydrous RuOx(OH)y)
can go up to 1000µF/cm2 (Sugimoto et al., 2004). Moreover Sugimoto et al. (2004)
proved that the redox reactions for the ruthenium dioxide depends greatly on the
sweep rates. As for actuation our group is the first to report actuators with ruthenium
dioxide electrodes (Akle et al., 2004b).
Anhydrous RuO2 with a surface area (SA) of 45 to 65 m2/g are purchased from
Alfa Aesar and used without further refinement. RuO2 is a less expensive material
compared to noble metals such as platinum. The bulk density of RuO2 solids is
7.05 g/cc leading to a volumetric surface area of 388 m2/cc. Hydrous RuO2 are also
purchased from Alfa Aesar and used without further refinement.
2.7.5 Platinum
Platinum is the material of choice for ionic polymer actuators with Nafion mem-
branes due to its good electrochemical stability and availability in cationic form for
the impregnation-reduction fabrication process. As reported earlier platinum-Nafion
actuators show back-relaxation for several cation species including H+, Li+, Na+,
and K+. This same actuator doesn’t show any back relaxation when used with large
organic ions like TBA+ (Nemat-Nasser and Wu, 2003b). Platinum is known to have
a large adsorbtion pseudocapacitance especially in acidic medium. High surface area
platinum powder of 3 to 5 nm sized particles acts as a catalyst in several electro-
chemical devices especially hydrogen fuel cells. The surface area of such powders are
in the order of 24 to 29 m2/g and volumetric surface area of 506 to 611 50− 70m2/g.The main interest in this material is large electrical conductivity of 94000 S/cm with
relatively large volumetric surface area. The disadvantage is that it is very expensive.
50

2.7.6 Gold Flakes
Fujiwara et al. (2000) recently introduced gold as high surface area electrodes on
Flemion membranes. Transducers with gold electrodes don’t show any back-relaxation
in their response for several cation species including Li+ and TBA+Nemat-Nasser and
Wu (2003b). Gold powders are available either as spherical or in the shape of flakes.
Due to the large aspect of flakes, they tend to have a low percolation level. The
conductivity of gold is very large around 454500 S/cm. The major disadvantage of
gold particles is the low surface area in the order of 0.4 to 0.75 m2/g, and being a
very expensive material. As mentioned earlier the charging mechanism is mostly an
electrostatic double layer type. In this study the gold powder is purchased from Alfa
Aesar in the form of flakes of 3 microns in length and has a specific surface area lower
than 0.5 m2/g. It is used without further purification.
2.8 Electrode Morphology
Scanning electron microscopy was performed on selective polymer samples. The re-
sulting electrode morphology is studied for various plating methods. Samples with
Impregnation-reduction plated platinum electrodes are compared to samples built us-
ing the direct assembly process. SEM images for samples varying electrode thickness
and metal to polymer ratio in the electrode are also presented.
Impregnation-reduction fabricated electrodes demonstrates a gradient metallic
profile and dendritic morphology as shown in Figure 2.11(a). A transducer fabricated
using DAP is shown in Figure 2.11(b). This transducer is designed with water as the
diluent, and hence an impregnation-reduction platinum layer was plated with a gold
electroplated on top. The 10 µm layer is the large surface area electrode made of
RuO2 / Nafion mix.
Shown in Figure 2.12 are two SEM images of a DAP built transducer. The
SEM in Figure 2.12 (a) represents 9.5µm thick RuO2 / Nafion electrode painted on a
Nafion 117 membrane. Figure 2.12 (a) represents 38µm thick RuO2 / Nafion electrode
painted on a Nafion 117 membrane. Those transducers are solvated with EmI-Tf ionic
51
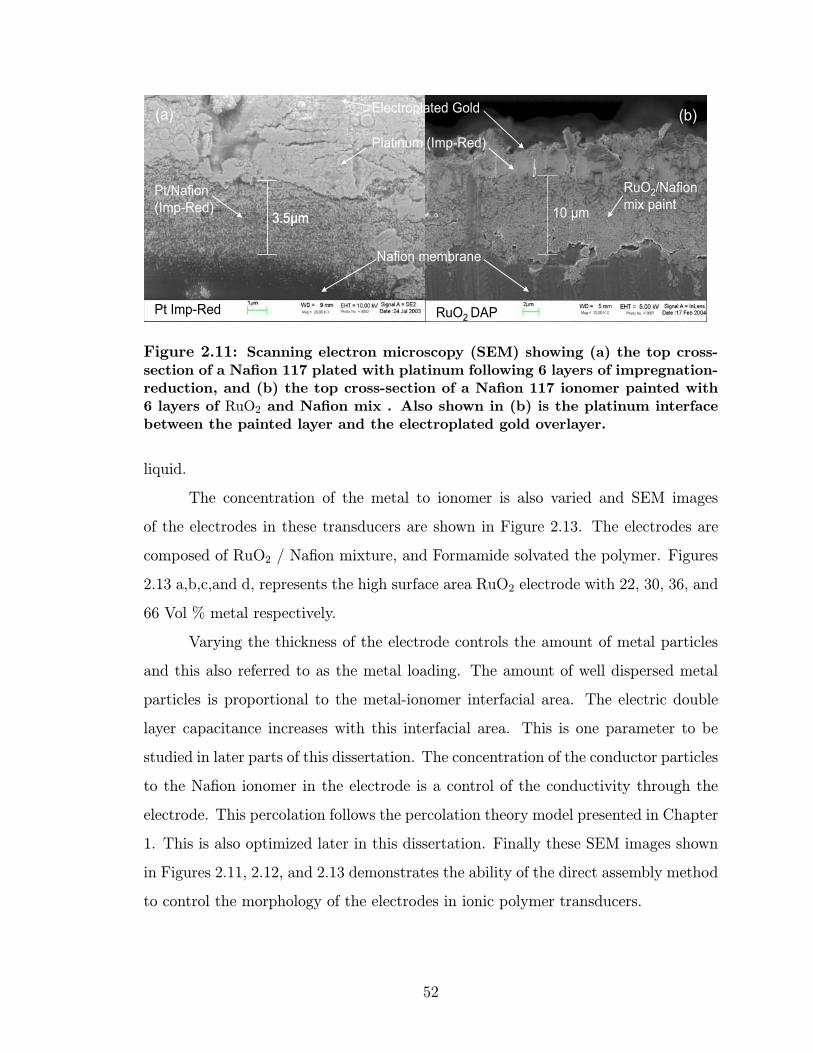
3.5µm 10 µm
RuO2/Nafion mix paint
Platinum (Imp-Red)
Electroplated Gold
Pt/Nafion (Imp-Red)
Nafion membrane
Pt Imp-Red RuO2 DAP
3.5µm 10 µm
RuO2/Nafion mix paint
Platinum (Imp-Red)
Electroplated Gold
Pt/Nafion (Imp-Red)
Nafion membrane
3.5µm3.5µm 10 µm
RuO2/Nafion mix paint
Platinum (Imp-Red)
Electroplated Gold
Pt/Nafion (Imp-Red)
Nafion membrane
Pt Imp-Red RuO2 DAP
(a) (b)
3.5µm 10 µm
RuO2/Nafion mix paint
Platinum (Imp-Red)
Electroplated Gold
Pt/Nafion (Imp-Red)
Nafion membrane
Pt Imp-Red RuO2 DAP
3.5µm 10 µm
RuO2/Nafion mix paint
Platinum (Imp-Red)
Electroplated Gold
Pt/Nafion (Imp-Red)
Nafion membrane
3.5µm3.5µm 10 µm
RuO2/Nafion mix paint
Platinum (Imp-Red)
Electroplated Gold
Pt/Nafion (Imp-Red)
Nafion membrane
Pt Imp-Red RuO2 DAP
(a) (b)
Figure 2.11: Scanning electron microscopy (SEM) showing (a) the top cross-section of a Nafion 117 plated with platinum following 6 layers of impregnation-reduction, and (b) the top cross-section of a Nafion 117 ionomer painted with6 layers of RuO2 and Nafion mix . Also shown in (b) is the platinum interfacebetween the painted layer and the electroplated gold overlayer.
liquid.
The concentration of the metal to ionomer is also varied and SEM images
of the electrodes in these transducers are shown in Figure 2.13. The electrodes are
composed of RuO2 / Nafion mixture, and Formamide solvated the polymer. Figures
2.13 a,b,c,and d, represents the high surface area RuO2 electrode with 22, 30, 36, and
66 Vol % metal respectively.
Varying the thickness of the electrode controls the amount of metal particles
and this also referred to as the metal loading. The amount of well dispersed metal
particles is proportional to the metal-ionomer interfacial area. The electric double
layer capacitance increases with this interfacial area. This is one parameter to be
studied in later parts of this dissertation. The concentration of the conductor particles
to the Nafion ionomer in the electrode is a control of the conductivity through the
electrode. This percolation follows the percolation theory model presented in Chapter
1. This is also optimized later in this dissertation. Finally these SEM images shown
in Figures 2.11, 2.12, and 2.13 demonstrates the ability of the direct assembly method
to control the morphology of the electrodes in ionic polymer transducers.
52

9.5µm
38 µm
(a) (b)
9.5µm
38 µm
(a) (b)
Figure 2.12: Scanning electron microscopy (SEM) showing (a) the top cross-section of a Nafion 117 ionomer painted with a 9.5 µm RuO2 / Nafion electrode.(b) shows the top cross-section of a Nafion 117 ionomer painted with a 38 µmRuO2 / Nafion electrode.
2.9 Conclusion
Testing procedures for the characterization of ionic polymer transducers in bending
and extensional directions are presented. Equations for computing mechanical, elec-
trical, and electromechanical properties from experimental results are provided. A
new fabrication method for ionic polymer transducers is developed and characterized.
The method named the direct assembly process allows greater control of the electrode
morphology through precise control of the fabrication parameters. Transduction and
electrochemical properties of several conducting powders including high surface area
platinum, gold flakes, hydrous and anhydrous RuO2, single walled carbon nanotubes
(SWNT), carbon black, and polyaniline (PANI) conducting polymers are introduced
in this chapter. These materials will be studied in later chapters of this dissertation
as electrode materials. This is made possible due to the introduction of this novel
fabrication method. The detailed presentation of the steps in the direct assembly
process is given for different types of diluents.
53

Figure 2.13: Scanning electron microscopy (SEM) SEM images of the highsurface area RuO2 electrode with (a) 22, (b) 30, (c) 36, and (d) 66 Vol % metal.
54

Chapter 3
Correlation of Capacitance and
Actuation in Ionic Polymer
Transducers
In this chapter, we discuss a series of experiments that characterize the electromechan-
ical actuation response of three families of ionomers: Nafion (a product of DuPont),
BPS (sulfonated poly(arylene ether sulfone)) and PATS (poly(arylene thioether sul-
fone)). The first polymer is commercially-available while the second and third poly-
mers are synthesized by the direct polymerization of sulfonated monomers in Dr.
McGrath’s Lab at Virginia Tech ((Wang et al., 2002) and Wiles et al. (2002)). The
mechanical properties and actuation response of Nafion-117, BPS, and PATS of vary-
ing ionic content are studied in the Lithium cation form. Transducers are built from
membranes of 100 to 180µm thick. Platinum layers are deposited using the impregna-
tion reduction method. The strain response of the materials varies from 50 µstrain/V
to 750 µstrain/V at 1Hz. A linear correlation was found between the strain response
and the capacitance of the material. This correlation is independent of the polymer
composition and the plating parameters. All of the ionomers analyzed in this work
exhibited a strain-to-charge response between 9 µstrainCm2
and 15 µstrainCm2
. Due to the
fact that the low-frequency capacitance of an ionomer is strongly related to charge
accumulation at the blocking electrodes, this correlation suggests a strong relation-
55

ship between surface charge accumulation and mechanical deformation in ionomeric
actuators. This correlation of capacitance and actuation performance motivated most
of the work in this dissertation.
3.1 Surface Charge Accumulation in Ionomeric Ma-
terials
Ion conduction is measured by applying a voltage to the polymer and measuring the
resulting current flow according to Equation 2.3. The experimental procedures for
measuring the impedance are detailed in Chapter 2.
The dielectric properties of the material can be studied by transforming the
impedance into a relationship between charge, Q, and voltage V ,
Q(jω)
V (jω)=
1
jωZ(jω)= C(jω), (3.1)
The variable C(jω) represents the measured complex capacitance of the polymer.
The complex capacitance can be separated into real and imaginary components
C(jω) = C (ω)− jC (ω), (3.2)
where the real part represents capacitive storage and the imaginary component repre-
sents loss. The measured complex capacitance is related to the complex permittivity
through the expression (Daniel, 1967)
ε(jω) =C(jω)T
εoA= ε (ω)− jε (ω), (3.3)
where T is the sample thickness, A is the surface area of the electrode, and εo is the
vacuum permittivity.
The dielectric properties are used to characterize the ionic conduction proper-
ties of the polymer. For pure insulators, the complex permittivity yields information
about the dielectric relaxations of the polymer (Daniel, 1967). Dielectric relaxation
measurements in ion-exchange membranes have been performed by a number of re-
searchers. Mauritz and co-workers presented a thorough study of dielectric relax-
ations in ion-exchange membranes (Mauritz and Yun, 1988; Mauritz and Fu, 1988).
56

They noted a power-law dependence of the complex permittivity as a function of
frequency (Mauritz, 1989) and related this characteristic to long range ion transport
within the material. Impedance measurements performed by Cahan and Wainwright
(1993) indicated that this power-law dependence was really an artifact of ‘blocking
electrode’, or, ‘space charge’ effects at the polymer-electrode interface. The rela-
tionship between electrode effects and dielectric measurements was also studied by
Fontanella et al. (1993) and their results independently confirmed the analysis of Ca-
han and Wainwright (1993). Further studies by Wintersgill and Fontanella (1997)
demonstrated that the ionic conduction mechanism was strongly affected by water
content and that the low-frequency (less than 100 Hz) power law dielectric behavior
was strongly affected by blocking electrode and space charge effects.
Figure 3.1: Real and complex permitivities of a typical Nafion-based ionicpolymer transducer.
Shown in Figure 3.1 is the real and complex permitivities of a typical Nafion-
based ionic polymer transducer fabricated by our research group. These measure-
ments are consistent with those published by Mauritz, et al., for hydrated Nafion in
various cation forms. The significant feature of the data is the large low-frequency
permittivity exhibited by the polymer; relative permittivity values on the order of
109 to 1010 are not uncommon for ionomeric polymers.
The large low-frequency permittivity is attributed to charge accumulation at
the electrodes due to ionic conduction. This was discussed clearly in Wintersgill
and Fontanella (1997) through examination of the dielectric response of ‘dry’ and
57

‘wet’ Nafion samples. Wintersgill and Fontanella (1997) performed several tests and
demonstrated that the apparent ionic conductivity changed dramatically depending
on sample size. They attributed this size-dependent variation to the existence of
charge accumulation and ‘blocking electrode’ effects at the interface between the
polymer and the electrode.
+
-
C/2
C/2
R
+
-
t
A
Figure 3.2: Blocking electrode model using a resistor and two capacitorsin series.
A common model of ion conduction that incorporates blocking electrode effects
is shown in Figure 3.2. The polymer is modeled as a pure resistance with capacitors
placed in series to account for charge accumulation at the surface. Assuming this
model for ion conduction results in the impedance function,
Z(jω) = R +1
jωC, (3.4)
where the imaginary part of the impedance is related to the capacitance of the block-
ing electrode. Assumptions in this model are similar to the assumptions made in
Chapter 2, Section 2.1. during the derivation of Equation 2.4. This conduction
model leads to the relationship
C(ω)
A=ε (ω)
T(3.5)
for the areal capacitance. The frequency-dependence of the capacitance has been
added to the function due to the measured variation in the dielectric behavior as a
function of frequency.
58
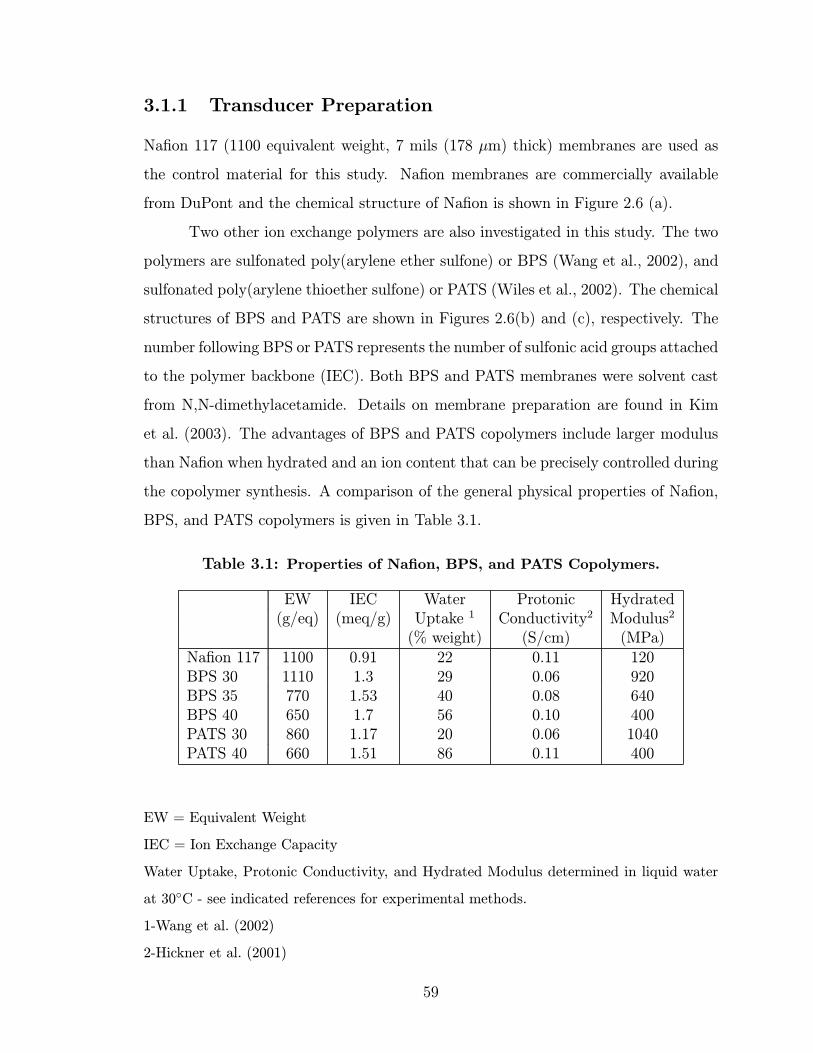
3.1.1 Transducer Preparation
Nafion 117 (1100 equivalent weight, 7 mils (178 µm) thick) membranes are used as
the control material for this study. Nafion membranes are commercially available
from DuPont and the chemical structure of Nafion is shown in Figure 2.6 (a).
Two other ion exchange polymers are also investigated in this study. The two
polymers are sulfonated poly(arylene ether sulfone) or BPS (Wang et al., 2002), and
sulfonated poly(arylene thioether sulfone) or PATS (Wiles et al., 2002). The chemical
structures of BPS and PATS are shown in Figures 2.6(b) and (c), respectively. The
number following BPS or PATS represents the number of sulfonic acid groups attached
to the polymer backbone (IEC). Both BPS and PATS membranes were solvent cast
from N,N-dimethylacetamide. Details on membrane preparation are found in Kim
et al. (2003). The advantages of BPS and PATS copolymers include larger modulus
than Nafion when hydrated and an ion content that can be precisely controlled during
the copolymer synthesis. A comparison of the general physical properties of Nafion,
BPS, and PATS copolymers is given in Table 3.1.
Table 3.1: Properties of Nafion, BPS, and PATS Copolymers.
EW IEC Water Protonic Hydrated(g/eq) (meq/g) Uptake 1 Conductivity2 Modulus2
(% weight) (S/cm) (MPa)Nafion 117 1100 0.91 22 0.11 120BPS 30 1110 1.3 29 0.06 920BPS 35 770 1.53 40 0.08 640BPS 40 650 1.7 56 0.10 400PATS 30 860 1.17 20 0.06 1040PATS 40 660 1.51 86 0.11 400
EW = Equivalent Weight
IEC = Ion Exchange Capacity
Water Uptake, Protonic Conductivity, and Hydrated Modulus determined in liquid water
at 30C - see indicated references for experimental methods.
1-Wang et al. (2002)
2-Hickner et al. (2001)
59

Table 3.2: Fully hydrated transducer thickness, optimal reducing agent concen-tration, and platinum layers surface conductivity before and after electroplatingfor each ionomer.
Transducer Optimal reducing Surface resistivity Surface resistivityIonomer thickness agent concentration before electroplating after electroplating
(µm) %(w/w) (Ω/sq) (Ω/sq)
Nafion 117 200 0.05 <1 < 0.5BPS 30 170 0.01 2.2 < 0.5BPS 35 190 0.01 0.6 < 0.5BPS 40 195 0.005 0.9 < 0.5PATS 30 180 0.003 0.9 < 0.5PATS 40 140 0.002 >8 < 0.5
The electrodes are fabricated on the polymers using an impregnation-reduction
method illustrated in Chapter 2, Section 2.6. The main parameters optimized in the
impregnation-reduction process for the novel ionomers, are the concentration of the re-
ducing agent, the time delay between the increase of reducing agent concentrations, and
the number of plating layers. The resulting optimal designs are illustrated in Table 3.2.
The number of Pt layers from impregnation-reduction is fixed to four, and is not optimized
for each polymer.
The surface resistivity results are reported in Table 3.2. Surface resistivity is mea-
sured using the Guardian Manufacturing four point probe surface resistivity meter (SRM-
232). Apart from the BPS 30 and PATS 40, all the surface conductivity measurements fall
bellow 1 Ω/sq after the addition of the platinum layers. A gold overlayer is than electro-
plated on the platinum surface. This gold layer reduces the surface conductivities of all the
ionomers below 0.5 Ω/sq.
The samples are cut into rectangles 30 mm in length and 5 mm in width. The
transducers are clamped between the fixture electrodes for all the tests, which results in a
free length is 20mm throughout the experiments. The thickness of the unplated polymer
films varied form 0.13 mm to 0.19 mm, and the thickness of the plated transducers varied
from 0.14 mm to 0.20mm. Controlling the thickness of the membranes is difficult to achieve
due to the nature of the solvent casting procedure.
60

3.2 Experimental Results
The experimental methods described in Chapter 2, Section 2.1 are used to characterize
in bending a series of ionomeric polymer transducers fabricated from Nafion, BPS, and
PATS. Figure 3.3 shows the amplitude of the free deflection frequency response function
(FRF) of five transducers fabricated from BPS and PATS and compared to a Nafion-based
ionic polymer transducer. This FRF represents the µstrain per unit volt as a function of
frequency in the range of 1 Hz to 200Hz. In the frequency range below 10 Hz, the strain
per unit volt is approximately constant and the values range from 80 microstrain/volt to
approximately 300 microstrain/volt for BPS 35. The free deflection FRF exhibits a strong
frequency dependence near the resonance of the transducer. Resonance frequencies for the
six transducers are in the range of 20 Hz to 60 Hz. All the polymers apart from PATS 40
had higher resonance frequencies compared to that of the Nafion transducer. The higher
resonance is due to the increased stiffness of the polymer and less water uptake (less mass).
Figure 3.3: Stain per unit volt of the BPS and PATS transducers compared toNafion.
The stiffness of the polymer is measured and the modulus is computed using equa-
tion 2.9. The results are summarized in Table 3.3 for each of the transducers. The results
demonstrate that the modulus of the BPS materials is approximately twice that of Nafion.
61

Polymer Stiffness (N/m) Modulus (MPa)
BPS 30 1.29 1580BPS 35 1.86 1276BPS 40 0.98 624PATS 30 1.40 1211PATS 40 0.11 115Nafion 0.74 511
Table 3.3: Values for the stiffness and the Young Modulus estimated usingequation 2.9.
The modulus values for the materials are consistent with previously published data (Nemat-
Nasser and Thomas, 2001). Note that the modulus results shown in Table 3.3 differ from
the ones shown in Table 3.1 since the polymers are in the lithium cation form and they have
a platinum electrode on the surface.
The increased modulus of the BPS materials is also reflected in the measured blocked
force. The frequency response functions of the blocked force per unit volt for the six
transducers are shown in Figure 3.4. The measured blocked force for the transducer sizes
studied are in the range of 0.1 mN/V to 1.0 mN/V except for the PATS 40 sample. The
BPS 35 transducer produced the largest blocked force of slightly greater than 1.0 mN/V
at frequencies below 10 Hz. The blocked force output of all of the transducers exhibited a
slight frequency dependence.
The measured impedance functions of the transducers are shown in Figure 3.5. All of
the transducers exhibit capacitive behavior at low frequencies and approximately resistive
behavior at higher frequencies. The impedance of the materials is between 5 Ω and 100 Ω
for frequencies between 1 Hz and 100 Hz.
3.3 Discussion of Results
Electromechanical measurements on the polymer transducers demonstrate that the BPS
materials produce the highest strain and blocked force per unit voltage of any of the ma-
terials studied. The BPS 35 material produces approximately 300 microstrain/volt of free
deflection and approximately 1 mN/V of blocked force for the sample sizes studied in this
work.
62

Figure 3.4: Blocked force per unit volt of the BPS and PATS polymers com-pared to Nafion.
One of the primary objectives of this work is to study the relationship between
polymer properties and transducer performance. Originally we had hypothesized that the
ion-exchange capacity of the polymer or its conductivity would be strongly correlated to
any variations we would see in the transducer performance. Unfortunately these trends did
not emerge from the results of our study. For example, BPS 35 is found to have the highest
free deflection and blocked force, yet it is a lower conductivity than Nafion 117, BPS 40, and
PATS 40, and its ion-exchange capacity is smaller than BPS 40. This is believed to be due
to the variations in the electrode deposition that occur using the impregnation reduction
method. Later results will demonstrate the importance of the electrode architecture on
performance.
Very clear trends do emerge when the transducer performance is correlated to the
measured capacitance of the material. The frequency-dependent capacitance of the material
is computed using equation 2.4 from the measured impedance of the sample and is displayed
in Figure 3.6. As discussed earlier in the paper, the capacitance of the material varies as
a function of frequency. At low frequencies the values are on the order of 1 to 10 mF/cm2
and become smaller at higher frequencies.
63

Figure 3.5: Impedance of the novel polymers compared to Nafion.
Figure 3.3 illustrates that the strain produced per unit voltage varies substantially
as a function of the base polymer below approximately 10 Hz. If we transform these mea-
surements into strain per unit charge using the expression
(jω)
Q(jω)= jω
(jω)
V (jω)Z(jω) (3.6)
where (jω)/V (jω) is the measured strain per unit volt and Z(jω) is the measured im-
pedance, we see that the variation in the strain response between the different polymers
tested is reduced substantially. Figure 3.7 is a plot of the strain per volt and strain per
charge response over the frequency range 1 to 12 Hz for all of the polymers tested except for
PATS 40, which suffered problems in the plating process. Each of the plots is normalized by
the maximum value of the response for any polymer at any frequency, thus, all of the values
lie between 0 and 1 over the frequency range. We see in the bottom plot in Figure 3.7
that at each frequency, there is between a five-fold (5X) and ten-fold (10X) variation in
the strain per volt between the different transducers tested. Normalizing the strain to the
charge induced in the polymer as shown in the top plot, we see that the variation at any
frequency is reduced to approximately 1.5X at any frequency.
This analysis demonstrates that the large variation in strain output as a function of
voltage is primarily due to the large variation in the voltage-to-current relationships for the
polymers tested. Once the results are normalized with respect to charge instead of voltage,
then the performance variation in the polymers decreases substantially at the low-frequency
range of the tests.
Clear trends also emerge when the strain per unit voltage is compared to the mea-
64

Figure 3.6: Real and imaginary FRF of the capacitance per cm2 of the differentBPS and PATS actuators to Nafion.
sured capacitance of the material. Figure 3.8 is a plot of the measured strain per unit
voltage as a function of the measured capacitance for four different frequencies. Each data
point represents a particular polymer sample tested during the optimization of the plating
process as discussed earlier in the paper. The figure demonstrates that, at each frequency,
there is a linear relationship between the capacitance and the strain output.
The slope of the linear fit to the data shown in Figure 3.8 has important physical
significance. The units of the slope are microstrain/charge/area, which is equivalent to the
average strain produced in the polymer normalized with respect to the electrical displace-
ment induced by the voltage. This parameter can also be computed from the measured
data for the polymers tested in this work. Table 3.4 summarizes these results and shows
that the strain per unit electric displacement is between 9 µstrainCm2
and 15 µstrainCm2
for all of
the polymers tested. Once again, we see that normalizing the strain response as a function
of charge tends to demonstrate consistent performance between the polymers tested.
65
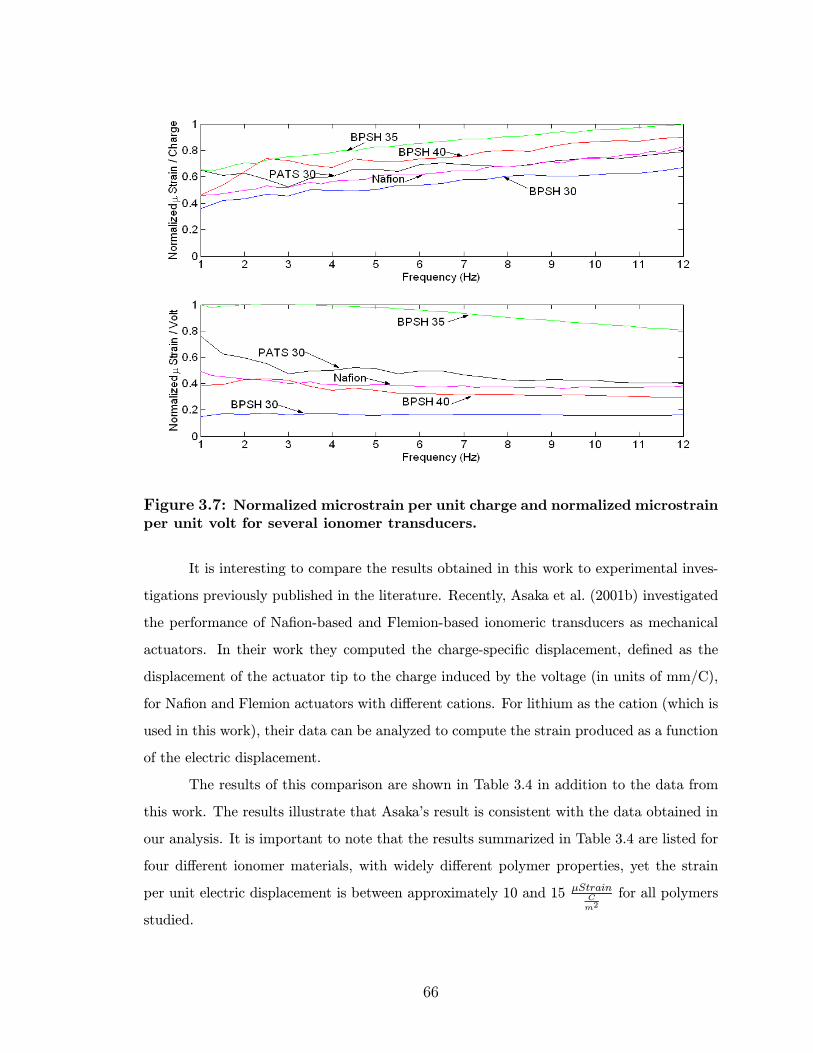
Figure 3.7: Normalized microstrain per unit charge and normalized microstrainper unit volt for several ionomer transducers.
It is interesting to compare the results obtained in this work to experimental inves-
tigations previously published in the literature. Recently, Asaka et al. (2001b) investigated
the performance of Nafion-based and Flemion-based ionomeric transducers as mechanical
actuators. In their work they computed the charge-specific displacement, defined as the
displacement of the actuator tip to the charge induced by the voltage (in units of mm/C),
for Nafion and Flemion actuators with different cations. For lithium as the cation (which is
used in this work), their data can be analyzed to compute the strain produced as a function
of the electric displacement.
The results of this comparison are shown in Table 3.4 in addition to the data from
this work. The results illustrate that Asaka’s result is consistent with the data obtained in
our analysis. It is important to note that the results summarized in Table 3.4 are listed for
four different ionomer materials, with widely different polymer properties, yet the strain
per unit electric displacement is between approximately 10 and 15 µStrainCm2
for all polymers
studied.
66
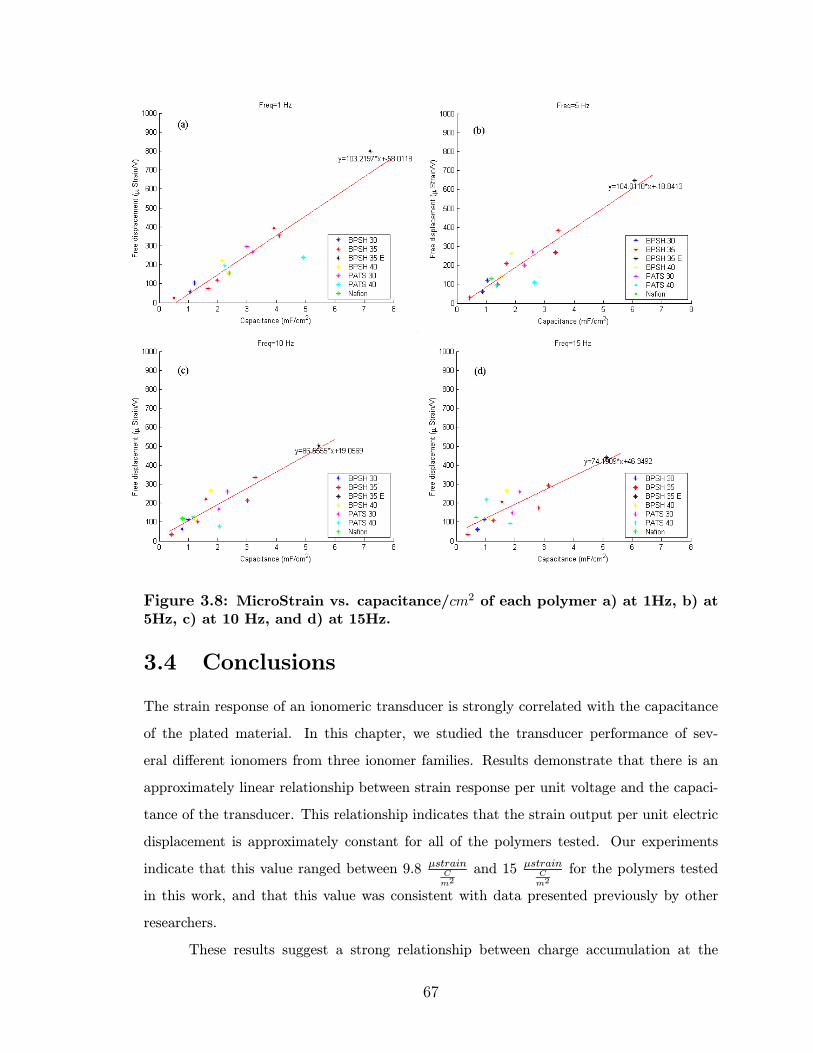
Figure 3.8: MicroStrain vs. capacitance/cm2 of each polymer a) at 1Hz, b) at5Hz, c) at 10 Hz, and d) at 15Hz.
3.4 Conclusions
The strain response of an ionomeric transducer is strongly correlated with the capacitance
of the plated material. In this chapter, we studied the transducer performance of sev-
eral different ionomers from three ionomer families. Results demonstrate that there is an
approximately linear relationship between strain response per unit voltage and the capaci-
tance of the transducer. This relationship indicates that the strain output per unit electric
displacement is approximately constant for all of the polymers tested. Our experiments
indicate that this value ranged between 9.8 µstrainCm2
and 15 µstrainCm2
for the polymers tested
in this work, and that this value was consistent with data presented previously by other
researchers.
These results suggest a strong relationship between charge accumulation at the
67

Table 3.4: Microstrain per normalized charge for various ionomer actuators.
Polymer µstrain / electric displacementµStrain
Cm2
BPS 35 15.21BPS 30 9.83BPS 40 13.76PATS 30 11.90Nafion 11.83Nafion (Asaka) 14.58Flemion (Asaka) 15.48
polymer-metal interface and transducer performance. It is known that the low-frequency
capacitance of an ionomeric material is due to blocking electrode effects, therefore a strong
correlation between capacitance and strain indicates that charge accumulation at the in-
terface between the electrode and the polymer is responsible for mechanical deformation.
Although this has been suggested in the literature before, our results demonstrate that the
amount of strain produced by this charge accumulation is approximately the same for a
wide range of ionomer materials that have substantially different properties. This result
motivates the optimization of the electrode properties for the purpose of improving the
performance of ionic polymer transducers.
68
Chapter 4
Optimization of the Direct
Assembly Process
The Direct Assembly Process (DAP) of ionic polymer transducers was developed in this
dissertation. As mentioned in Chapter 2 the DAP provided control on several variables in
the transducer fabrication process. Some of these variables are explored and optimized in
this chapter. The variables studied are the diluent content of the transducer membrane,
electrode thickness, electrode composition and conducting powder species. Lithium cation
is used in the ionomer membranes studied in this dissertation. Results are obtained for
five sets of experiments. In the experiments the diluent or the electrode architecture are
varied and the time response and frequency response of the transducer is measured. The
goal of the experiments is to correlate the electrode architecture and diluent content with
the maximum strain output and speed of response of the transducer. In the first experi-
ment the type of diluent in the polymer is varied. Thickness of the electrode is varied in
the second experiment. Conductivity of the electrode is increased in this experiment by
adding conductive gold flakes. Conducting powder in the electrode is varied for the fourth
experiment. Transducers made with each material type are optimized and characterized for
electromechanical transduction. The fifth experiment combines the three conducting mate-
rials in hybrid electrodes and explores the potential of increasing transducer performance
through electrode optimization. Finally the repeatability and reliability of the DAP are
characterized in the last section.
69

4.1 Ionic liquids and Organic diluents
In this study, the ionic liquid EmI-Tf and organic diluents are used to solvate the trans-
ducers. EmI-Tf is a nonvolatile molten salt which allows the transducer to operate in air
without any significant loss of performance (Bonhote et al. (1996)). Earlier work by the
authors (Akle et al., 2004a) indicated that 250,000 cycles are attained at +/-2V and 1Hz
without any degradation. The viscosity of EmI-Tf is 45 cP, and the electric stability window
is 4.1V (Bonhote et al. (1996)). Five organic diluents are considered, PolyEthylene Glycols
(PEG ) with four different molecular weights (MW) and Formamide. PEGs are polar alco-
hols with relatively high boiling point. Ethylene Glycol (EG) is the basic unit, diethylene
glycol (DEG) is a two repeating units, triethylene glycol (TEG) is three , and PEG 200 is an
average of 4.2 repeating units. These diluents are linear polymers, and therefore increasing
the molecular weight increases the boiling point and viscosity of the diluent.
In this experiment six samples are built using the direct assembly process and char-
acterized in bending according to procedures described in Chapter 2. Each of the samples
utilizes a Nafion 117 membrane exchanged with Li+ cation and solvated with one of the
diluents. The diluent uptake is the maximum that can be achieved with current methods
and are close to 100% of dry polymer weight for organic diluents and approximately 58%
for Emi-Tf. Electrodes are composed of 45 vol% high surface area RuO2 metal powder.
The transducers are characterized using time domain 2V step response shown in
Figure 4.1. The high viscosity of the diluent compared to water leads to a slow response in
the actuators (see Figure 4.1 and Table 4.1). EG and DEG are relatively faster than the
higher molecular weights. EG with a boiling point around 195 C offers limited environmental
stability, while DEG provided sufficient stability to run long time experiments. Moreover
DEG transducers produced much larger strains in the order of 2% for a +2V step input,
therefore more than 4% strain could be achieved in the -2V, +2V window. Formamide is
also a relatively stable diluent that has a boiling point of approximately 211 C and a low
viscosity of 3.3 cP. Transducers solvated with organic diluents can operate in air only for
few hours without a degradation in performance due to diluent evaporation.
Transducers with Emi-Tf diluents are bending slower than actuators with formamide
as shown in Figure 4.1. The average strain rate during the first 2 seconds of the step is
430 µstrain/s and 2310 µstrain/s for EmI-Tf and formamide respectively. Diluent uptake
70

0 50 100 150 200 250 3000
0.5
1
1.5
2
Time (sec)
% s
train
FormamideEthylene Glycol
TriEthelyne Glycol
EmI-Tf PEG 200
DiEthelyne Glycol
Figure 4.1: (a) Measured response due to a 2V step change in potential foractuators with RuO2 electrodes and Formamide or EmI-Tf diluents. (b) Strainrate as a function volume uptake ionic liquid.
varied from 58% (weight percent of dry polymer) for EmI-Tf to 100% for the formamide.
Diluent uptake of organic diluents could not be accurately controlled due to evaporation
during the fabrication process which is done under an infra-red light.
The strain rate response of the transducer with organic diluent is a function of the
viscosity and dielectric constant of the fluid. Diluents with a large dielectric constant are
more polar and dissociate better the ions in the actuator. Mobility of the ions increases by
decreasing viscosity. Table 4.1 shows that formamide solvated transducers are the fastest,
while the viscosity of formamide is lowest and has the highest dielectric constant. Comparing
the performance of TEG to PEG 200 solvated transducers, it could be noticed that the
former is 38% faster than the latter. The viscosity of PEG 200 is approximately 10% larger
than that of TEG, while the dielectric constant of TEG is much larger by 51%. Ethylene
Glycol is an outlier to the trend, and this is believed to be due to the low boiling point
which leads to larger diluent evaporation during transducer fabrication. In this dissertation
we studied a single ionic liquid (EmI-Tf) with an uptake of 58% by weight of dry ionomer.
It has been also found that the content of ionic liquid within the membrane has an influence
on the speed of response (Bennett and Leo, 2005). Finally, ionic liquids offer a superior
environmental stability, but due to their fast response formamide is used in the some parts
of this study.
71
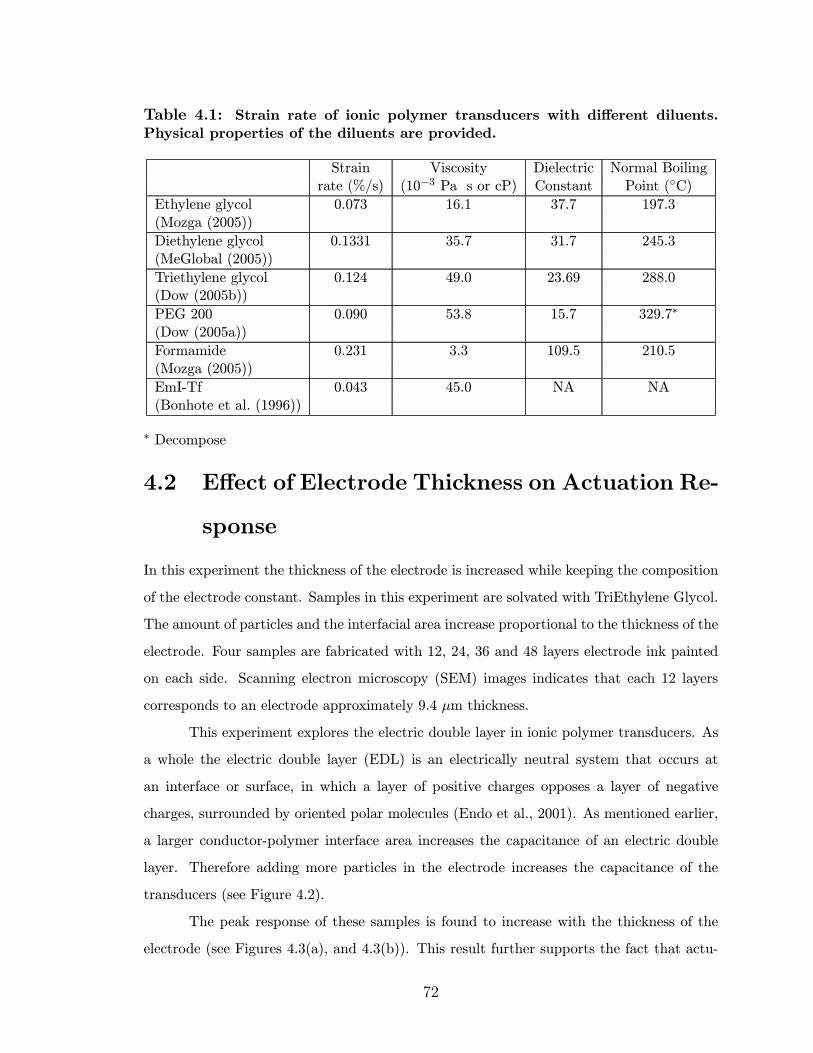
Table 4.1: Strain rate of ionic polymer transducers with different diluents.Physical properties of the diluents are provided.
Strain Viscosity Dielectric Normal Boilingrate (%/s) (10−3 Pa s or cP) Constant Point (C)
Ethylene glycol 0.073 16.1 37.7 197.3(Mozga (2005))
Diethylene glycol 0.1331 35.7 31.7 245.3(MeGlobal (2005))
Triethylene glycol 0.124 49.0 23.69 288.0(Dow (2005b))
PEG 200 0.090 53.8 15.7 329.7∗
(Dow (2005a))
Formamide 0.231 3.3 109.5 210.5(Mozga (2005))
EmI-Tf 0.043 45.0 NA NA(Bonhote et al. (1996))
∗ Decompose
4.2 Effect of Electrode Thickness on Actuation Re-
sponse
In this experiment the thickness of the electrode is increased while keeping the composition
of the electrode constant. Samples in this experiment are solvated with TriEthylene Glycol.
The amount of particles and the interfacial area increase proportional to the thickness of the
electrode. Four samples are fabricated with 12, 24, 36 and 48 layers electrode ink painted
on each side. Scanning electron microscopy (SEM) images indicates that each 12 layers
corresponds to an electrode approximately 9.4 µm thickness.
This experiment explores the electric double layer in ionic polymer transducers. As
a whole the electric double layer (EDL) is an electrically neutral system that occurs at
an interface or surface, in which a layer of positive charges opposes a layer of negative
charges, surrounded by oriented polar molecules (Endo et al., 2001). As mentioned earlier,
a larger conductor-polymer interface area increases the capacitance of an electric double
layer. Therefore adding more particles in the electrode increases the capacitance of the
transducers (see Figure 4.2).
The peak response of these samples is found to increase with the thickness of the
electrode (see Figures 4.3(a), and 4.3(b)). This result further supports the fact that actu-
72
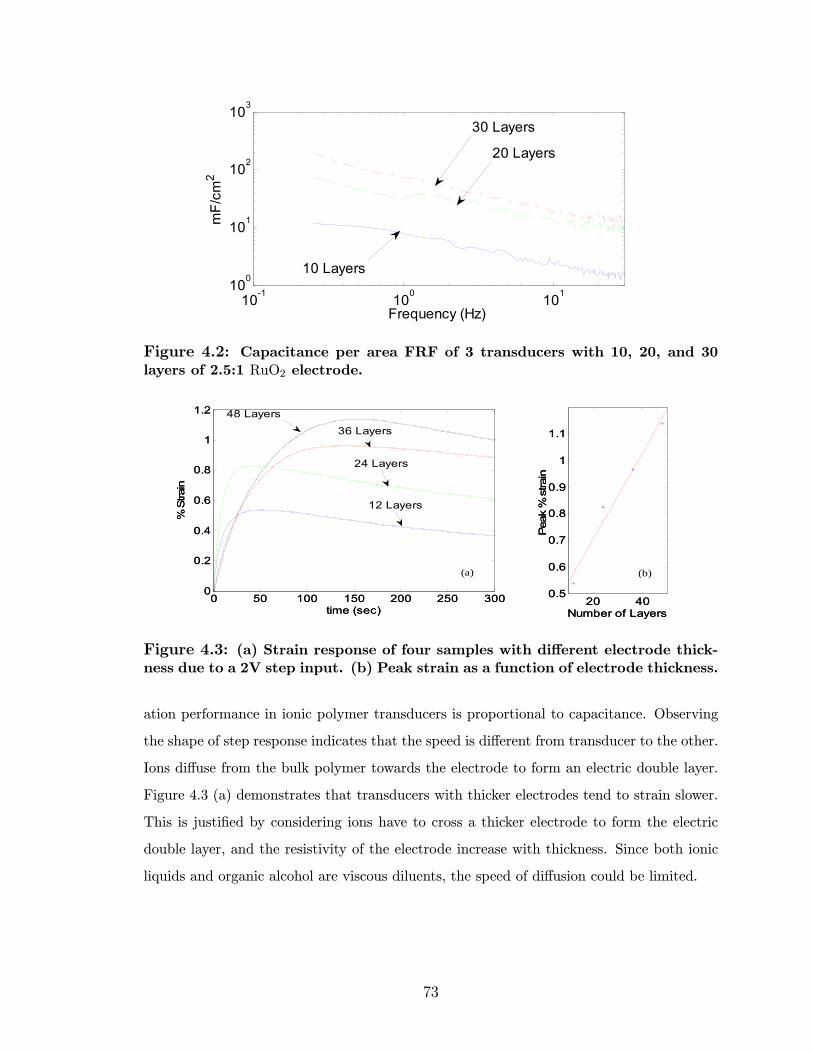
10-1 100 101100
101
102
103
mF/
cm2
Frequency (Hz)
20 Layers
30 Layers
10 Layers
Figure 4.2: Capacitance per area FRF of 3 transducers with 10, 20, and 30layers of 2.5:1 RuO2 electrode.
0 50 100 150 200 250 3000
0.2
0.4
0.6
0.8
1
1.2
time (sec)
% S
train
48 Layers
36 Layers
24 Layers
12 Layers
(a)
20 400.5
0.6
0.7
0.8
0.9
1
1.1
Number of Layers
Pea
k %
stra
in
(b)
0 50 100 150 200 250 3000
0.2
0.4
0.6
0.8
1
1.2
time (sec)
% S
train
48 Layers
36 Layers
24 Layers
12 Layers
(a)
20 400.5
0.6
0.7
0.8
0.9
1
1.1
Number of Layers
Pea
k %
stra
in
(b)
Figure 4.3: (a) Strain response of four samples with different electrode thick-ness due to a 2V step input. (b) Peak strain as a function of electrode thickness.
ation performance in ionic polymer transducers is proportional to capacitance. Observing
the shape of step response indicates that the speed is different from transducer to the other.
Ions diffuse from the bulk polymer towards the electrode to form an electric double layer.
Figure 4.3 (a) demonstrates that transducers with thicker electrodes tend to strain slower.
This is justified by considering ions have to cross a thicker electrode to form the electric
double layer, and the resistivity of the electrode increase with thickness. Since both ionic
liquids and organic alcohol are viscous diluents, the speed of diffusion could be limited.
73
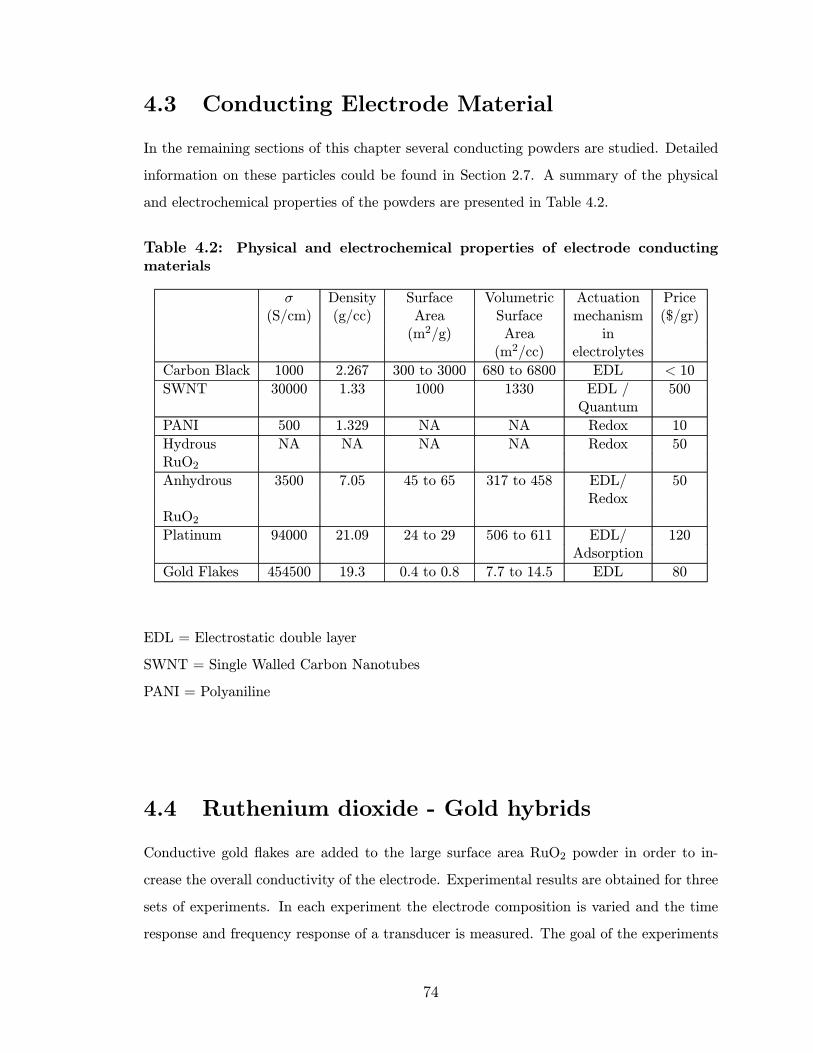
4.3 Conducting Electrode Material
In the remaining sections of this chapter several conducting powders are studied. Detailed
information on these particles could be found in Section 2.7. A summary of the physical
and electrochemical properties of the powders are presented in Table 4.2.
Table 4.2: Physical and electrochemical properties of electrode conductingmaterials
σ Density Surface Volumetric Actuation Price(S/cm) (g/cc) Area Surface mechanism ($/gr)
(m2/g) Area in(m2/cc) electrolytes
Carbon Black 1000 2.267 300 to 3000 680 to 6800 EDL < 10
SWNT 30000 1.33 1000 1330 EDL / 500Quantum
PANI 500 1.329 NA NA Redox 10
Hydrous NA NA NA NA Redox 50RuO2Anhydrous 3500 7.05 45 to 65 317 to 458 EDL/ 50
RedoxRuO2Platinum 94000 21.09 24 to 29 506 to 611 EDL/ 120
Adsorption
Gold Flakes 454500 19.3 0.4 to 0.8 7.7 to 14.5 EDL 80
EDL = Electrostatic double layer
SWNT = Single Walled Carbon Nanotubes
PANI = Polyaniline
4.4 Ruthenium dioxide - Gold hybrids
Conductive gold flakes are added to the large surface area RuO2 powder in order to in-
crease the overall conductivity of the electrode. Experimental results are obtained for three
sets of experiments. In each experiment the electrode composition is varied and the time
response and frequency response of a transducer is measured. The goal of the experiments
74
is to correlate the conductivity and capacitance of the electrode with the electromechanical
performance of the transducer.
4.4.1 Variation of Metal Content by Weight
In the first experiment the electrode composition is varied according to the weight of RuO2
or Au contained within the electrode. The samples are solvated with approximately 58%
EmI-Tf ionic liquids. The weight percentage of metal in the electrode is varied from 0%
Au to 100% Au, with the remaining percentage of the electrode metal being RuO2. Figure
4.4 (a) is a plot of the frequency response magnitude for the 5 cases studied. The results
clearly demonstrate that the RuO2 electrode is superior to Au in producing strain for an
equivalent applied voltage. The strain-per-voltage response of the polymer at frequencies
less than 10 Hz is maximized by the pure RuO2 electrode and is minimized for the pure Au
electrode. Using 1 Hz as a reference point, we see that the strain response drops from 273
µε/V to 6 µε/V when the electrode composition is changed from 100% RuO2 to 100% Au.
At intermediate values there is a clear trend of decreasing strain response for increasing Au
loading.
The trends in the electrical impedance clearly indicate the tradeoff in capacitance and
resistance associated with the addition of gold or ruthenium oxide. A pure RuO2 electrode
produces a higher capacitance electrode due to its larger specific surface area. This results
in a lower impedance at low frequencies (electrical impedance is inversely proportional to
capacitance). However, the transducer with the pure RuO2 electrode has a larger impedance
at frequencies above approximately 10 Hz because of the higher resistivity of RuO2 as
compared to Au (see Figure 4.4(b)). The addition of small amounts of Au to the electrode
decreases the high frequency resistance but also decreases the low frequency capacitance
because of the lower specific area of the gold powder as compared to the RuO2 powder.
Capacitance at 0.5Hz for samples with 0%, 25%, 50%, 75%, and 100% gold is 3.9, 3.7,
3.5, 1.6, and 1.0 mF/cm2 respectively. Therefore, the pure Au electrode has the lowest
capacitance but also has lower high-frequency resistance.
75

100
101
102
10-2
100
102
µε /
V
frequency (Hz)
0% Au
25% Au50% Au75% Au
100% Au
10-1
100
101
102
101
102
103
V/A
frequency (Hz)
25% Au50% Au75% Au
100% Au
0% Au
100
101
102
100
102
frequency (Hz)
µε /
V
0% Au
100% Au75% Au50% Au25% Au
10-1
100
101
102
101
102
103
V/A
25% Au50% Au75% Au
100% Au
0% Au
frequency (Hz)
(a) (b)
(c) (d)
100
101
102
10-2
100
102
µε /
V
frequency (Hz)
0% Au
25% Au50% Au75% Au
100% Au
10-1
100
101
102
101
102
103
V/A
frequency (Hz)
25% Au50% Au75% Au
100% Au
0% Au
100
101
102
100
102
frequency (Hz)
µε /
V
0% Au
100% Au75% Au50% Au25% Au
10-1
100
101
102
101
102
103
V/A
25% Au50% Au75% Au
100% Au
0% Au
frequency (Hz)
(a) (b)
(c) (d)
Figure 4.4: (a) Strain response as a function of electrode composition byweight, (b) Electrical impedance as a function of electrode composition byweight, (c) Strain response as a function of electrode composition by volume,and (d) Electrical impedance as a function of electrode composition by volume.
4.4.2 Variation of Metal Content by Volume
The second experiment consists of varying the electrode composition while maintaining a
consistent volume of metal in the electrode. In this set of experiments the relative percentage
of RuO2 and Au is varied while the total volume of metal in the electrode layers is held
constant at approximately 40%. Table 4.2 summarizes the compositions studied for this set
of experiments.
The strain response of the transducers as a function of volume percent of metal
exhibited the same trend as the trend obtained when varying the weight percentage (see
Figure 4.4 (c)). The electrode fabricated with pure RuO2 exhibits the largest strain per unit
voltage at frequencies below approximately 8 Hz. Increasing the percentage of Au in the
electrode reduces the strain output. At 1 Hz the strain output is 272 µε/V for an electrode
with 100% RuO2 while it is 24 µε/V for an electrode with 100% Au.
A clear relationship between the slope of the strain-to-voltage frequency response at
frequencies below the first mechanical resonance and electrode composition also emerges in
this study. The negative slope of the strain-to-voltage frequency response indicates limited
76
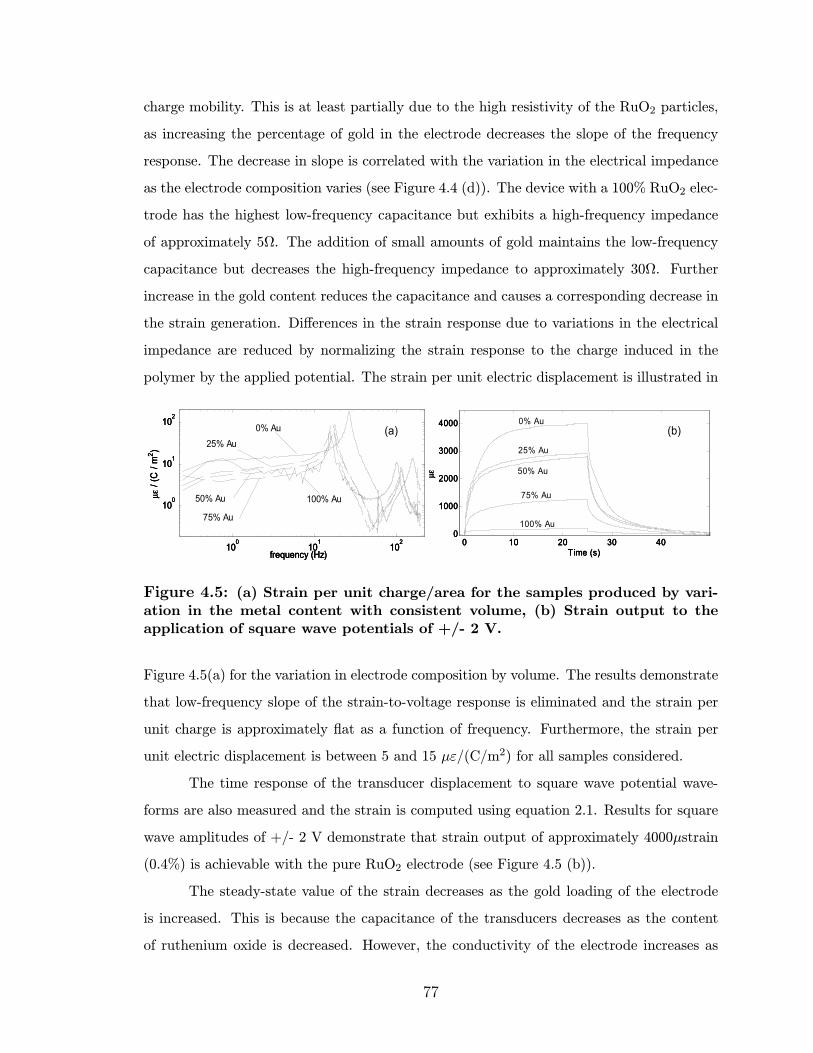
charge mobility. This is at least partially due to the high resistivity of the RuO2 particles,
as increasing the percentage of gold in the electrode decreases the slope of the frequency
response. The decrease in slope is correlated with the variation in the electrical impedance
as the electrode composition varies (see Figure 4.4 (d)). The device with a 100% RuO2 elec-
trode has the highest low-frequency capacitance but exhibits a high-frequency impedance
of approximately 5Ω. The addition of small amounts of gold maintains the low-frequency
capacitance but decreases the high-frequency impedance to approximately 30Ω. Further
increase in the gold content reduces the capacitance and causes a corresponding decrease in
the strain generation. Differences in the strain response due to variations in the electrical
impedance are reduced by normalizing the strain response to the charge induced in the
polymer by the applied potential. The strain per unit electric displacement is illustrated in
0 10 20 30 400
1000
2000
3000
4000µε
Time (s)
0% Au
25% Au
100% Au
75% Au
50% Au
100
101
102
100
101
102
frequency (Hz)
µε /
(C /
m2 )
0% Au25% Au
100% Au50% Au
75% Au
(a) (b)
0 10 20 30 400
1000
2000
3000
4000µε
Time (s)
0% Au
25% Au
100% Au
75% Au
50% Au
100
101
102
100
101
102
frequency (Hz)
µε /
(C /
m2 )
0% Au25% Au
100% Au50% Au
75% Au
0 10 20 30 400
1000
2000
3000
4000µε
Time (s)
0% Au
25% Au
100% Au
75% Au
50% Au
100
101
102
100
101
102
frequency (Hz)
µε /
(C /
m2 )
0% Au25% Au
100% Au50% Au
75% Au
(a) (b)
Figure 4.5: (a) Strain per unit charge/area for the samples produced by vari-ation in the metal content with consistent volume, (b) Strain output to theapplication of square wave potentials of +/- 2 V.
Figure 4.5(a) for the variation in electrode composition by volume. The results demonstrate
that low-frequency slope of the strain-to-voltage response is eliminated and the strain per
unit charge is approximately flat as a function of frequency. Furthermore, the strain per
unit electric displacement is between 5 and 15 µε/(C/m2) for all samples considered.
The time response of the transducer displacement to square wave potential wave-
forms are also measured and the strain is computed using equation 2.1. Results for square
wave amplitudes of +/- 2 V demonstrate that strain output of approximately 4000µstrain
(0.4%) is achievable with the pure RuO2 electrode (see Figure 4.5 (b)).
The steady-state value of the strain decreases as the gold loading of the electrode
is increased. This is because the capacitance of the transducers decreases as the content
of ruthenium oxide is decreased. However, the conductivity of the electrode increases as
77
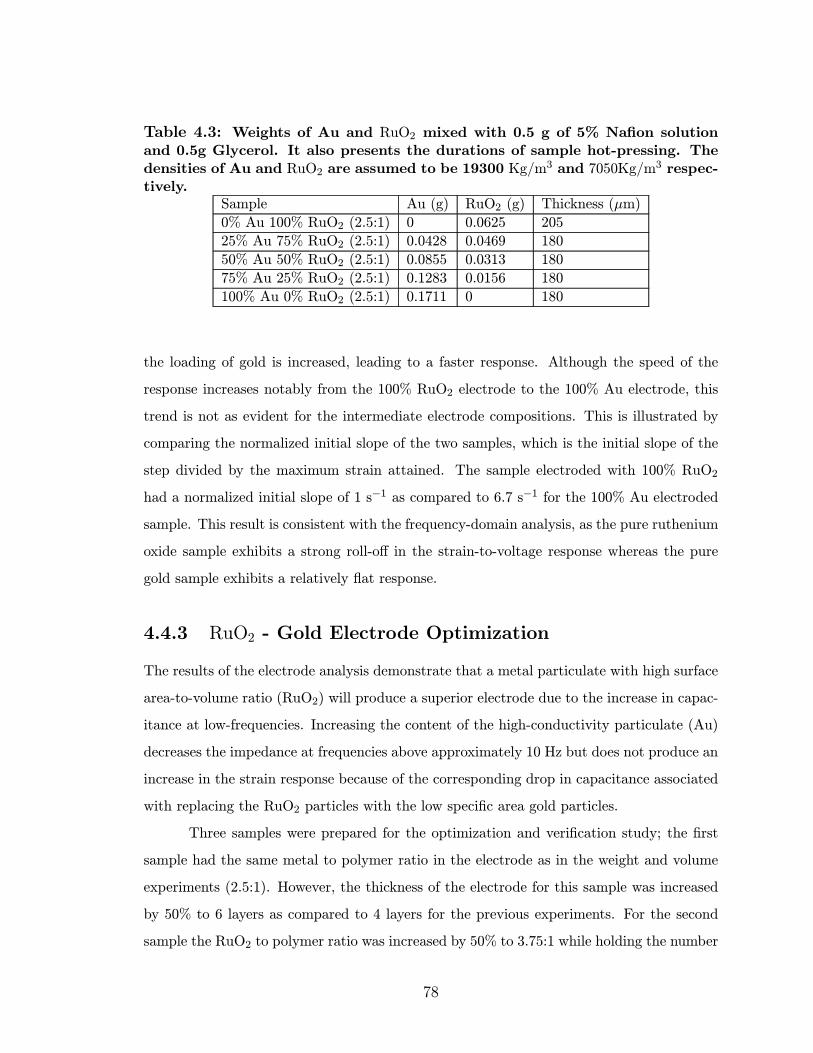
Table 4.3: Weights of Au and RuO2 mixed with 0.5 g of 5% Nafion solutionand 0.5g Glycerol. It also presents the durations of sample hot-pressing. Thedensities of Au and RuO2 are assumed to be 19300 Kg/m
3 and 7050Kg/m3 respec-tively.
Sample Au (g) RuO2 (g) Thickness (µm)
0% Au 100% RuO2 (2.5:1) 0 0.0625 205
25% Au 75% RuO2 (2.5:1) 0.0428 0.0469 180
50% Au 50% RuO2 (2.5:1) 0.0855 0.0313 180
75% Au 25% RuO2 (2.5:1) 0.1283 0.0156 180
100% Au 0% RuO2 (2.5:1) 0.1711 0 180
the loading of gold is increased, leading to a faster response. Although the speed of the
response increases notably from the 100% RuO2 electrode to the 100% Au electrode, this
trend is not as evident for the intermediate electrode compositions. This is illustrated by
comparing the normalized initial slope of the two samples, which is the initial slope of the
step divided by the maximum strain attained. The sample electroded with 100% RuO2
had a normalized initial slope of 1 s−1 as compared to 6.7 s−1 for the 100% Au electroded
sample. This result is consistent with the frequency-domain analysis, as the pure ruthenium
oxide sample exhibits a strong roll-off in the strain-to-voltage response whereas the pure
gold sample exhibits a relatively flat response.
4.4.3 RuO2 - Gold Electrode Optimization
The results of the electrode analysis demonstrate that a metal particulate with high surface
area-to-volume ratio (RuO2) will produce a superior electrode due to the increase in capac-
itance at low-frequencies. Increasing the content of the high-conductivity particulate (Au)
decreases the impedance at frequencies above approximately 10 Hz but does not produce an
increase in the strain response because of the corresponding drop in capacitance associated
with replacing the RuO2 particles with the low specific area gold particles.
Three samples were prepared for the optimization and verification study; the first
sample had the same metal to polymer ratio in the electrode as in the weight and volume
experiments (2.5:1). However, the thickness of the electrode for this sample was increased
by 50% to 6 layers as compared to 4 layers for the previous experiments. For the second
sample the RuO2 to polymer ratio was increased by 50% to 3.75:1 while holding the number
78

Table 4.4: Weights of Au and RuO2 mixed with 0.5g of 5% NafionTM solutionand 0.5g Glycerol for electrode optimization.
Sample Au (g) RuO2 (g) Thickness (µm)
0% Au 100% RuO2 (2.5:1) 0 0.0625 210
0% Au 100% RuO2 (3.75:1) 0 0.0938 180
33% Au 66% RuO2 (3.75:1) 0.0855 0.0625 190
of layers constant at 4. The third sample was prepared by replacing the 50% increase in
RuO2 by the equivalent volume of Au. Table 4.3 summarizes the electrode compositions
studied for this set of experiments. Therefore, the three samples maintained the same
total metal volume loading. The metal in sample 1 is dispersed compared to the other
two samples, while gold accounted for the increase of metal in sample 3. In samples 1
and 2 the surface area of the electrode is theoretically maintained, while sample 3 should
have a better conductivity through the electrode. Figure 4.6 shows the frequency response
functions of the strain per unit volt for the three samples. The frequency response functions
of samples 1 and 2 are nearly parallel with sample 1 providing better performance. This is
believed to be due to the lack of control on the amount of electrode ink deposited using the
brush painting technique. Theoretically the two samples should provide similar capacitance
and therefore similar performance. As for sample 3 it is shown to have the smallest low
frequency response while it crossed sample 2 almost at 3 Hz and provided better high
frequency response. This is consistent with the expectation of a better high frequency
response from a more conductive, gold-containing electrode.
100
101
101
102
103
frequency (Hz)
µε /
V
6 Layers 2.5:1 RuO2
4 Layers 3.75:1 RuO2
4 Layers (2.5 RuO2+1.25 Au):1
Figure 4.6: Strain per volt frequency response for three RuO2 samples.
The motion of the transducer to an applied potential is also measured in the time
79

1 cm 1 cm 1 cm
+/- 2V +/- 3V +/- 4V
Spp =8195 µstrain
Spp =21420 µstrain
Spp =24380 µstrain
ε ε ε1 cm 1 cm 1 cm
+/- 2V +/- 3V +/- 4V
Spp =8195 µstrain
Spp =21420 µstrain
Spp =24380 µstrain
ε ε ε
Figure 4.7: Deflected shapes as a function of amplitude for a square wavepotential input.
domain. Square wave potentials are applied to the polymer and the resulting displacement
is measured using a digital camera due to the fact that the displacements are too large
to be measured with the laser vibrometer. The measured deflected shapes are shown in
Figure 4.7. The pictures illustrate that the assumption of constant curvature is valid over
the range of conditions tested.
The range of motion increases as the amplitude of the square wave input is increased.
The peak-to-peak strain in the sample is measured by determining the radius of curvature
of the sample at maximum deflection, Rmax. The strain at maximum deflection is equal to
εmax =t
2Rmax(4.1)
The radius of curvature was determined on both sides of the neutral position and
the peak-to-peak strain is the addition of the two values. The measured strain increases
from 8195 (0.82%) at +/- 2V to 24,380 (2.44%) at +/- 4 V. It is interesting to note that the
increase in peak-to-peak strain is not linear as a function of input amplitude. We attribute
this to nonlinearity in the charge conduction as a function of voltage.
4.5 Optimization of Conductor Powder Concen-
tration in the Electrode
An alternative way of increasing the conductivity of the electrode is by increasing the metal
content. The metal composition is modeled and optimized using the percolation theory
presented in Chapter 1. Three conducting powders are used separately in this experiment as
80
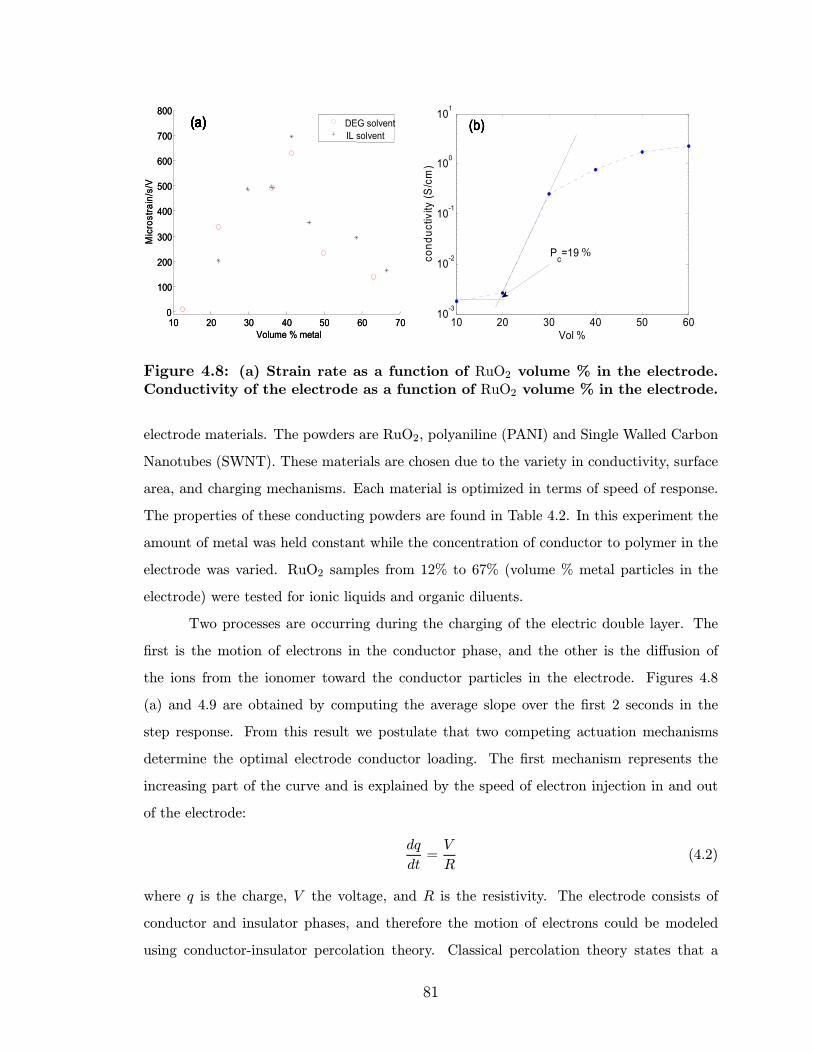
10 20 30 40 50 6010-3
10-2
10-1
100
101
Vol %
cond
uctiv
ity (S
/cm
)
Pc=19
(a) (b)
10 20 30 40 50 60 700
100
200
300
400
500
600
700
800
Volume % metal
Mic
rost
rain
/s/V
DEG solventIL solvent
(a) (b)
%
(a) (b)(a) (b)
10 20 30 40 50 6010-3
10-2
10-1
100
101
Vol %
cond
uctiv
ity (S
/cm
)
Pc=19
(a) (b)
10 20 30 40 50 60 700
100
200
300
400
500
600
700
800
Volume % metal
Mic
rost
rain
/s/V
DEG solventIL solvent
(a) (b)
%
(a) (b)(a) (b)
Figure 4.8: (a) Strain rate as a function of RuO2 volume % in the electrode.Conductivity of the electrode as a function of RuO2 volume % in the electrode.
electrode materials. The powders are RuO2, polyaniline (PANI) and Single Walled Carbon
Nanotubes (SWNT). These materials are chosen due to the variety in conductivity, surface
area, and charging mechanisms. Each material is optimized in terms of speed of response.
The properties of these conducting powders are found in Table 4.2. In this experiment the
amount of metal was held constant while the concentration of conductor to polymer in the
electrode was varied. RuO2 samples from 12% to 67% (volume % metal particles in the
electrode) were tested for ionic liquids and organic diluents.
Two processes are occurring during the charging of the electric double layer. The
first is the motion of electrons in the conductor phase, and the other is the diffusion of
the ions from the ionomer toward the conductor particles in the electrode. Figures 4.8
(a) and 4.9 are obtained by computing the average slope over the first 2 seconds in the
step response. From this result we postulate that two competing actuation mechanisms
determine the optimal electrode conductor loading. The first mechanism represents the
increasing part of the curve and is explained by the speed of electron injection in and out
of the electrode:
dq
dt=V
R(4.2)
where q is the charge, V the voltage, and R is the resistivity. The electrode consists of
conductor and insulator phases, and therefore the motion of electrons could be modeled
using conductor-insulator percolation theory. Classical percolation theory states that a
81

0 10 20 30 40 50 60 70 80 90 1000
0.05
0.1
0.15
0.2
Volume % Conductor
%ε/
sec
SWNT
PANI
Figure 4.9: Strain rate as a function of carbon nanotube and polyaniline loading(volume %) in the electrode.
continuous conducting network is formed by the coalescence of the grains. The percolation
theory is typically modeled using a power law which is a function of the volume percent of
the conducting phase
σ = kp(p− pc)βp , (4.3)
where pc is the threshold volume percent, βp is an exponent with a theoretical value of
2, and kp is a scaling constant depends on the conductivity of the materials involved.
Equation 4.3 indicates that increasing the conductor phase decreases the resistivity of the
electrode (Stauffer and Aharony, 1992). The decreasing part of the curve is explained by
the decreasing presence of ionomer leading to slow ionic diffusion in/out of the electrode.
This fact is reflected in the decrease in the speed of response as shown in Figure 4.8(a). The
decrease in the speed of response is postulated to depend on the volume % of the polymer
(1 − p). Figure 4.8(b) shows the percolation threshold which was measured to be around19% for RuO2 electrodes. Figure 2.13 shows SEM images of a cross-section of electrode
with 22, 30, 36 and 66 volume %. It is clear from the micrographs that more connections
in the particles are noticed with the increase of metal content. The 22% shows little inter-
particle connection while at 36% particles start to develop a conductive network. At 66%,
less polymer surround the particle, supporting the conclusion that ion diffusion is limited
in such high levels of metal loadings.
SWNT electrode shows optimal performance around 30 vol% as shown in Figure 4.9
(a). PANI actuator have an optimal loading around 95 vol%, but due to the delaminating of
the electrode 85 vol% loading was estimated to be the best operating point. As mentioned
82

0 50 100 150 200 250 3000
0.5
1
1.5
2
2.5
Time (sec)
%ε 10% SWNT
10% RuO2
0 50 100 150 200 250 3000
0.5
1
1.5
2
2.5
Time (sec)
%ε
40% RuO2
40% SWNT
0 50 100 150 200 250 3000
0.5
1
1.5
2
2.5
Time (sec)
%ε 10% SWNT
10% RuO2
0 50 100 150 200 250 3000
0.5
1
1.5
2
2.5
Time (sec)
%ε
40% RuO2
40% SWNT
Figure 4.10: (a) Strain response due to a 2V step change in potential forsamples with 10% RuO2 and 10% SWNT. (b) Strain response due to a 2V stepchange in potential for samples with 40% RuO2 and 40% SWNT.
Table 4.5: Conductor/ionomer surface area in th electrode, and the corre-sponding peak strain.
Surface Area (m2) Peak Strain (%)
RuO2 0.5 2.22SWNT 1.7 1.64PANI NA 0.305
earlier SWNT matrices show low percolation threshold and hence a decrease in the optimal
volume %. PANI has a low electric conductivity and it is itself an ionic conducting polymer.
This explains the large optimal conductor loading.
Figure 4.10 (a) shows the step responses of a 10 vol% RuO2 and 10 vol% SWNT
samples, while Figure 4.10 (b) shows the step responses of a 40 vol% RuO2 and 40vol%
SWNT samples. The loading of all the SWNT samples in Figures 4.10 (a) and (b) were
close to 1 mg/cm2 and 10 mg/cm2 for RuO2 samples. One can notice that the maximum
strain for RuO2 increased from approximately 0.18 % to 2.2 % when increasing the loading
from 10 vol% to 40 vol%. As for the SWNT both 10 vol% and 40 vol% samples had almost
a constant maximum 0.65 %strain. This could be explained by the fact that 10 vol%
loading in a RuO2 electrode is below the percolation threshold and therefore the electrode
is not be fully charged. Three samples with constant electrode thickness of 25 µm (on each
side) were fabricated with 45 vol% RuO2 45 vol% SWNT and 85 vol% PANI. Computed
from Figure 4.11, the maximum strains are 2.22 %, 1.64 %, and 0.305 % respectively.
The conductor/ionomer interfacial surface area in the active electrode for the RuO2 and
83
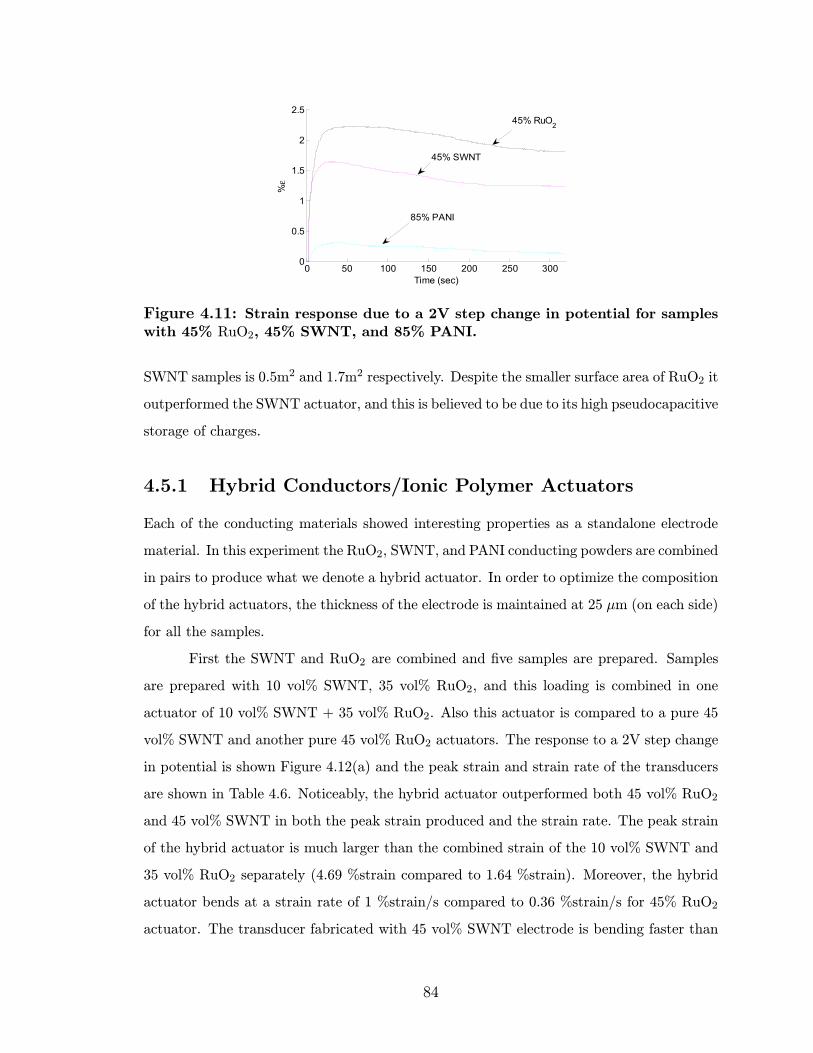
0 50 100 150 200 250 3000
0.5
1
1.5
2
2.5
Time (sec)%
ε
45% SWNT
45% RuO2
85% PANI
Figure 4.11: Strain response due to a 2V step change in potential for sampleswith 45% RuO2, 45% SWNT, and 85% PANI.
SWNT samples is 0.5m2 and 1.7m2 respectively. Despite the smaller surface area of RuO2 it
outperformed the SWNT actuator, and this is believed to be due to its high pseudocapacitive
storage of charges.
4.5.1 Hybrid Conductors/Ionic Polymer Actuators
Each of the conducting materials showed interesting properties as a standalone electrode
material. In this experiment the RuO2, SWNT, and PANI conducting powders are combined
in pairs to produce what we denote a hybrid actuator. In order to optimize the composition
of the hybrid actuators, the thickness of the electrode is maintained at 25 µm (on each side)
for all the samples.
First the SWNT and RuO2 are combined and five samples are prepared. Samples
are prepared with 10 vol% SWNT, 35 vol% RuO2, and this loading is combined in one
actuator of 10 vol% SWNT + 35 vol% RuO2. Also this actuator is compared to a pure 45
vol% SWNT and another pure 45 vol% RuO2 actuators. The response to a 2V step change
in potential is shown Figure 4.12(a) and the peak strain and strain rate of the transducers
are shown in Table 4.6. Noticeably, the hybrid actuator outperformed both 45 vol% RuO2
and 45 vol% SWNT in both the peak strain produced and the strain rate. The peak strain
of the hybrid actuator is much larger than the combined strain of the 10 vol% SWNT and
35 vol% RuO2 separately (4.69 %strain compared to 1.64 %strain). Moreover, the hybrid
actuator bends at a strain rate of 1 %strain/s compared to 0.36 %strain/s for 45% RuO2
actuator. The transducer fabricated with 45 vol% SWNT electrode is bending faster than
84
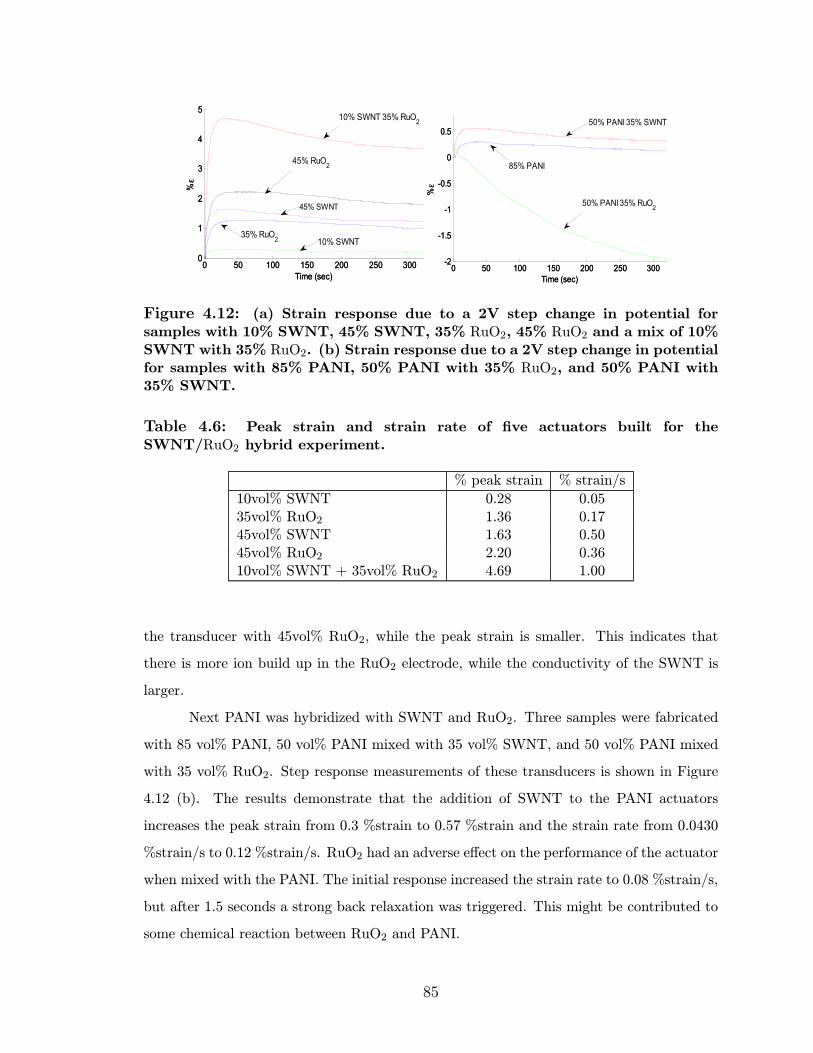
0 50 100 150 200 250 3000
1
2
3
4
5
Time (sec)
%ε
10% SWNT
45% SWNT
35% RuO2
10% SWNT 35% RuO2
45% RuO2
0 50 100 150 200 250 300-2
-1.5
-1
-0.5
0
0.5
Time (sec)
%ε
50% PANI 35% RuO2
85% PANI
50% PANI 35% SWNT
0 50 100 150 200 250 3000
1
2
3
4
5
Time (sec)
%ε
10% SWNT
45% SWNT
35% RuO2
10% SWNT 35% RuO2
45% RuO2
0 50 100 150 200 250 300-2
-1.5
-1
-0.5
0
0.5
Time (sec)
%ε
50% PANI 35% RuO2
85% PANI
50% PANI 35% SWNT
Figure 4.12: (a) Strain response due to a 2V step change in potential forsamples with 10% SWNT, 45% SWNT, 35% RuO2, 45% RuO2 and a mix of 10%SWNT with 35% RuO2. (b) Strain response due to a 2V step change in potentialfor samples with 85% PANI, 50% PANI with 35% RuO2, and 50% PANI with35% SWNT.
Table 4.6: Peak strain and strain rate of five actuators built for theSWNT/RuO2 hybrid experiment.
% peak strain % strain/s
10vol% SWNT 0.28 0.0535vol% RuO2 1.36 0.1745vol% SWNT 1.63 0.5045vol% RuO2 2.20 0.3610vol% SWNT + 35vol% RuO2 4.69 1.00
the transducer with 45vol% RuO2, while the peak strain is smaller. This indicates that
there is more ion build up in the RuO2 electrode, while the conductivity of the SWNT is
larger.
Next PANI was hybridized with SWNT and RuO2. Three samples were fabricated
with 85 vol% PANI, 50 vol% PANI mixed with 35 vol% SWNT, and 50 vol% PANI mixed
with 35 vol% RuO2. Step response measurements of these transducers is shown in Figure
4.12 (b). The results demonstrate that the addition of SWNT to the PANI actuators
increases the peak strain from 0.3 %strain to 0.57 %strain and the strain rate from 0.0430
%strain/s to 0.12 %strain/s. RuO2 had an adverse effect on the performance of the actuator
when mixed with the PANI. The initial response increased the strain rate to 0.08 %strain/s,
but after 1.5 seconds a strong back relaxation was triggered. This might be contributed to
some chemical reaction between RuO2 and PANI.
85

0 50 100 150 200 250 3000
0.5
1
1.5
2
2.5
Time (sec)
%ε
0 50 100 150 200 250 30010
-3
10-2
10-1
Time (sec)
Cur
rent
(A)
45% SWNT
45% RuO2
45% RuO245% SWNT
Figure 4.13: (a) Response to a 2V step for transducers with 45vol % RuO2 and45vol% SWNT. (b) Corresponding current response.
4.6 Electrical and Mechanical Property Charac-
terization
In this section the electrical and mechanical impedances are analyzed for different trans-
ducers. The capacitance, modulus of elasticity and damping ratios are computed from the
frequency response functions.
4.6.1 Electrical Properties Characterization
SWNT samples shows faster back-relaxation in the step response strain curve (Figure
4.13(a)) compared to that in the RuO2 actuators. The shape of the curve between 100
and 200 sec after the step is steeper in the SWNT compared to the RuO2. This could be
also observed in all SWNT and RuO2 samples (see Figure 4.12(a)). The shape of the current
response is also different, and corresponds to the strain curves. This could be interpreted as
a slower electrochemical process is occurring in the RuO2 samples, and it is slowing down
the back-relaxation. As mentioned earlier, RuO2 demonstrates extra redox or pseudoca-
pacitive activities compared to the pure electrostatic behavior for SWNT. The capacitance
of the RuO2 and SWNT samples followed the trend in step response (see figure 4.12(a)
and Table 4.6). The hybrid actuator had a capacitance of 50mF/cm2 at 0.25Hz (see Figure
4.14(a)). As for the PANI hybrids, addition of the SWNT improved the high frequency
capacitance (above 15 Hz) as shown in Figure 4.14(b). SWNT improves the conductivity in
the electrode and therefore it is easier to mobilize the electrons at higher frequencies. This
86

100
101
1
10
100
mF/
cm2
Frequency (Hz)
10% SWNT + 35% RuO2
45% SWNT
45% RuO2
100
101
1
10
100
mF/
cm2
Frequency (Hz)
85% PANI
50% PANI 35% SWNT
50% PANI 35% RuO2
100
101
1
10
100
mF/
cm2
Frequency (Hz)
10% SWNT + 35% RuO2
45% SWNT
45% RuO2
100
101
1
10
100
mF/
cm2
Frequency (Hz)
85% PANI
50% PANI 35% SWNT
50% PANI 35% RuO2
Figure 4.14: (a) Capacitance frequency response functions of transducers with45vol % RuO2 and 45vol% SWNT. (b) Capacitance frequency response functionsof transducers with 85vol% PANI, 50%vol PANI + 35vol % RuO2, and 50vol%PANI + 35vol% SWNT.
trend didn’t hold in the RuO2/Nafion composite electrode shown in Figure 4.14(a).
4.6.2 Mechanical Damping
The strain per unit volt and strain per unit charge frequency response functions are used to
evaluate the mechanical properties of the transducers. Strain per volt frequency response
functions are presented in Figures 4.14(a) and (c). They follow trends observed earlier in
Section 4.3 (Figures 4.13(a) and (b) and Table 4.6). The hybrid SWNT/RuO2 actuator
produces large strains of 0.45 % strain/volt at 0.25 Hz compared to 0.27 % strain/volt
for RuO2 and 0.19 % strain/volt for SWNT transducers. All transducers other than the
PANI/SWNT exhibit a roll off in the frequency response between 0.1 Hz and 10 Hz. Addi-
tion of SWNT to RuO2 electrodes did not decrease the roll-off and that could be attributed
to the increase in damping in SWNT samples compared to RuO2 (see table 4.7). Decreasing
damping widens the effect of the resonance as it could be observed in Figure 4.15(b). As
for the PANI a 35vol% addition of SWNT drastically decreased the roll-off. Normalizing
the strain per volt frequency response function by charge eliminates the roll-off in the fre-
quency response of the transducer. The difference in the magnitude for strain per volt at
0.25Hz was a factor of 2.4, while in strain per charge the maximum difference varied from
11.9 to 8.4 µstrain/(C/m2) which is a factor of 1.4 (see Figure 4.15(b)). As for the PANI
experiment, this factor has decreased from 6.2 for strain per volt to 2.0 for strain per charge
at 0.25Hz. This is a significant results considering the wide range of materials used.
87
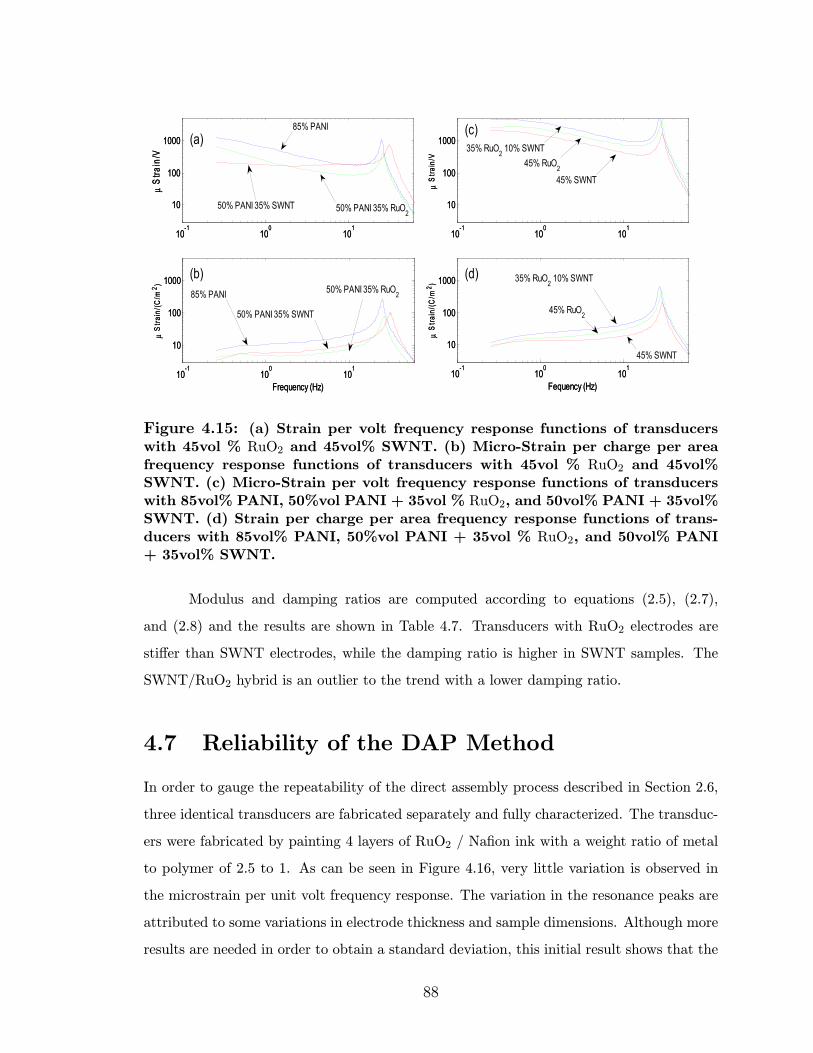
10-1
100
101
10
100
1000µ
Stra
in/V
10-1
100
101
10
100
1000
µ S
train
/(C/m
2 )
Frequency (Hz)
85% PANI
85% PANI
50% PANI 35% RuO250% PANI 35% SWNT
50% PANI 35% RuO2
50% PANI 35% SWNT
10-1
100
101
10
100
1000
µ S
train
/V
10-1
100
101
10
100
1000
µ S
train
/(C/m
2 )
Fequency (Hz)
35% RuO2 10% SWNT
45% SWNT
45% RuO2
35% RuO2 10% SWNT
45% RuO2
45% SWNT
(a)
(b)
(c)
(d)
10-1
100
101
10
100
1000µ
Stra
in/V
10-1
100
101
10
100
1000
µ S
train
/(C/m
2 )
Frequency (Hz)
85% PANI
85% PANI
50% PANI 35% RuO250% PANI 35% SWNT
50% PANI 35% RuO2
50% PANI 35% SWNT
10-1
100
101
10
100
1000
µ S
train
/V
10-1
100
101
10
100
1000
µ S
train
/(C/m
2 )
Fequency (Hz)
35% RuO2 10% SWNT
45% SWNT
45% RuO2
35% RuO2 10% SWNT
45% RuO2
45% SWNT
(a)
(b)
(c)
(d)
Figure 4.15: (a) Strain per volt frequency response functions of transducerswith 45vol % RuO2 and 45vol% SWNT. (b) Micro-Strain per charge per areafrequency response functions of transducers with 45vol % RuO2 and 45vol%SWNT. (c) Micro-Strain per volt frequency response functions of transducerswith 85vol% PANI, 50%vol PANI + 35vol % RuO2, and 50vol% PANI + 35vol%SWNT. (d) Strain per charge per area frequency response functions of trans-ducers with 85vol% PANI, 50%vol PANI + 35vol % RuO2, and 50vol% PANI+ 35vol% SWNT.
Modulus and damping ratios are computed according to equations (2.5), (2.7),
and (2.8) and the results are shown in Table 4.7. Transducers with RuO2 electrodes are
stiffer than SWNT electrodes, while the damping ratio is higher in SWNT samples. The
SWNT/RuO2 hybrid is an outlier to the trend with a lower damping ratio.
4.7 Reliability of the DAP Method
In order to gauge the repeatability of the direct assembly process described in Section 2.6,
three identical transducers are fabricated separately and fully characterized. The transduc-
ers were fabricated by painting 4 layers of RuO2 / Nafion ink with a weight ratio of metal
to polymer of 2.5 to 1. As can be seen in Figure 4.16, very little variation is observed in
the microstrain per unit volt frequency response. The variation in the resonance peaks are
attributed to some variations in electrode thickness and sample dimensions. Although more
results are needed in order to obtain a standard deviation, this initial result shows that the
88
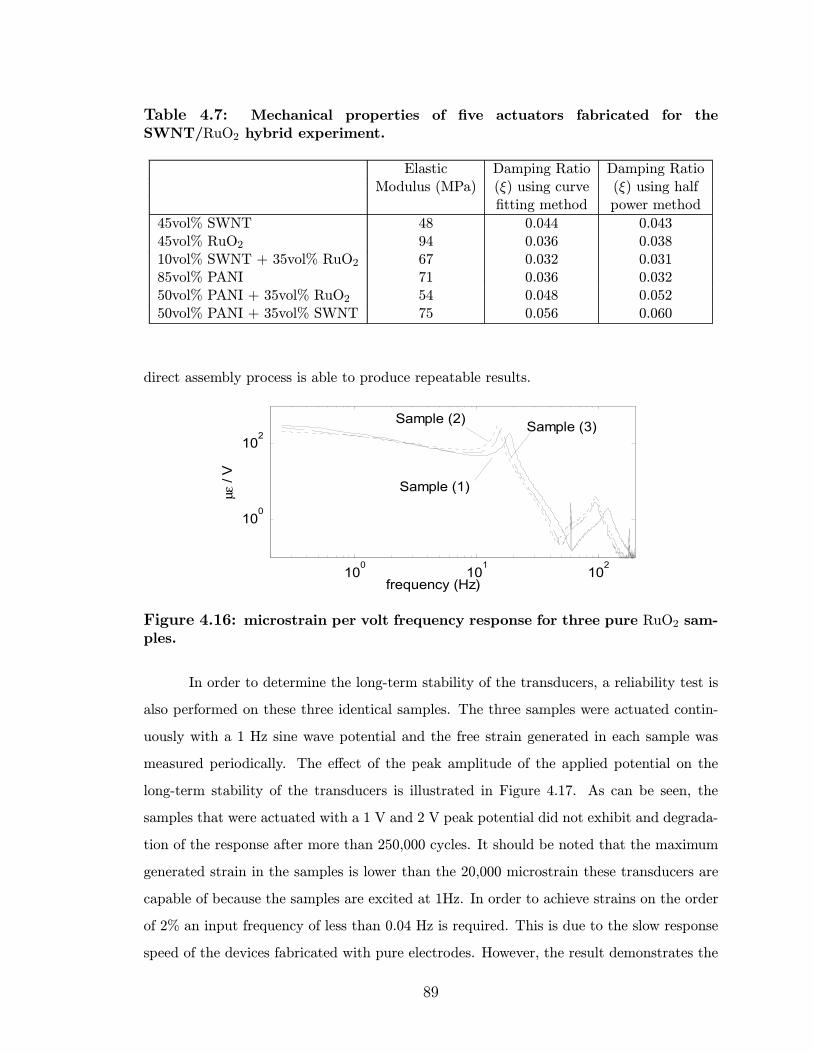
Table 4.7: Mechanical properties of five actuators fabricated for theSWNT/RuO2 hybrid experiment.
Elastic Damping Ratio Damping RatioModulus (MPa) (ξ) using curve (ξ) using half
fitting method power method
45vol% SWNT 48 0.044 0.04345vol% RuO2 94 0.036 0.03810vol% SWNT + 35vol% RuO2 67 0.032 0.03185vol% PANI 71 0.036 0.03250vol% PANI + 35vol% RuO2 54 0.048 0.05250vol% PANI + 35vol% SWNT 75 0.056 0.060
direct assembly process is able to produce repeatable results.
100
101
102
100
102
µε /
V
frequency (Hz)
Sample (2) Sample (3)
Sample (1)
Figure 4.16: microstrain per volt frequency response for three pure RuO2 sam-ples.
In order to determine the long-term stability of the transducers, a reliability test is
also performed on these three identical samples. The three samples were actuated contin-
uously with a 1 Hz sine wave potential and the free strain generated in each sample was
measured periodically. The effect of the peak amplitude of the applied potential on the
long-term stability of the transducers is illustrated in Figure 4.17. As can be seen, the
samples that were actuated with a 1 V and 2 V peak potential did not exhibit and degrada-
tion of the response after more than 250,000 cycles. It should be noted that the maximum
generated strain in the samples is lower than the 20,000 microstrain these transducers are
capable of because the samples are excited at 1Hz. In order to achieve strains on the order
of 2% an input frequency of less than 0.04 Hz is required. This is due to the slow response
speed of the devices fabricated with pure electrodes. However, the result demonstrates the
89
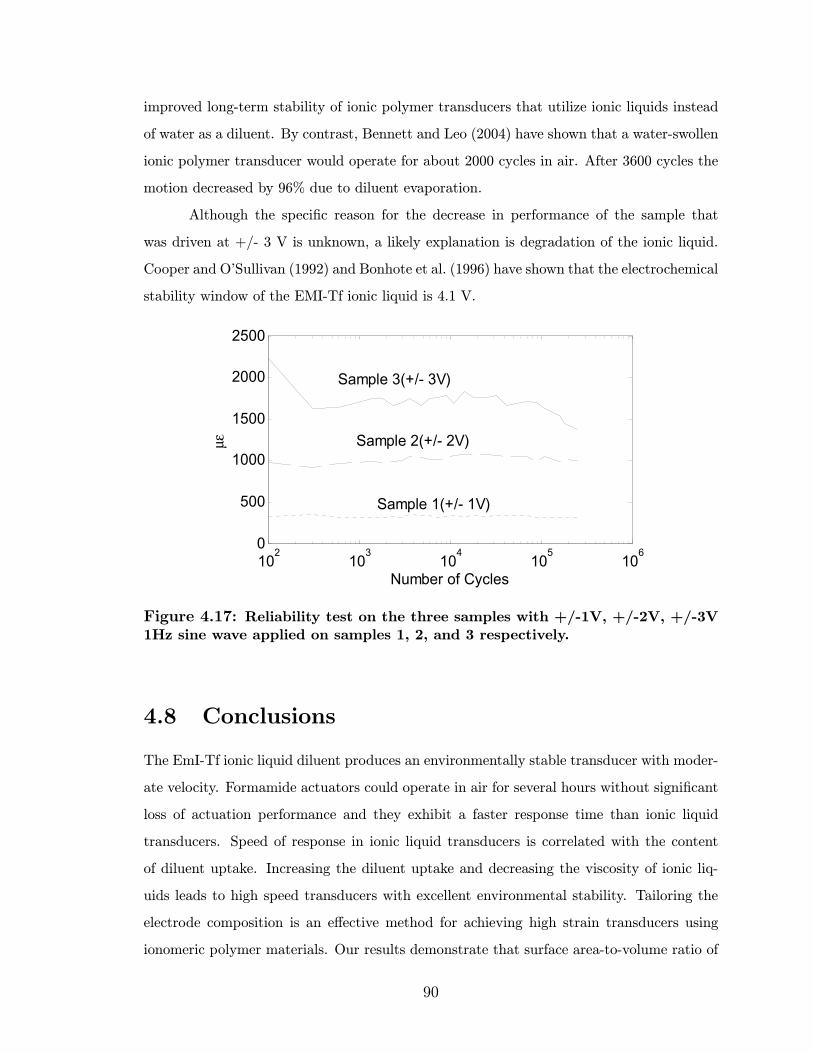
improved long-term stability of ionic polymer transducers that utilize ionic liquids instead
of water as a diluent. By contrast, Bennett and Leo (2004) have shown that a water-swollen
ionic polymer transducer would operate for about 2000 cycles in air. After 3600 cycles the
motion decreased by 96% due to diluent evaporation.
Although the specific reason for the decrease in performance of the sample that
was driven at +/- 3 V is unknown, a likely explanation is degradation of the ionic liquid.
Cooper and O’Sullivan (1992) and Bonhote et al. (1996) have shown that the electrochemical
stability window of the EMI-Tf ionic liquid is 4.1 V.
102
103
104
105
106
0
500
1000
1500
2000
2500
Number of Cycles
µε
Sample 3(+/- 3V)
Sample 1(+/- 1V)
Sample 2(+/- 2V)
Figure 4.17: Reliability test on the three samples with +/-1V, +/-2V, +/-3V1Hz sine wave applied on samples 1, 2, and 3 respectively.
4.8 Conclusions
The EmI-Tf ionic liquid diluent produces an environmentally stable transducer with moder-
ate velocity. Formamide actuators could operate in air for several hours without significant
loss of actuation performance and they exhibit a faster response time than ionic liquid
transducers. Speed of response in ionic liquid transducers is correlated with the content
of diluent uptake. Increasing the diluent uptake and decreasing the viscosity of ionic liq-
uids leads to high speed transducers with excellent environmental stability. Tailoring the
electrode composition is an effective method for achieving high strain transducers using
ionomeric polymer materials. Our results demonstrate that surface area-to-volume ratio of
90

the metal particulate is a critical property in achieving large capacitance at low frequencies.
Increasing the low-frequency capacitance increases the strain output of the transducer. The
electrical conductivity through the electrode is also proved to be critical to the speed of
response of the transducers. A trade off between high speed for gold particles and large
strains for ruthenium dioxide particles is observed. Hybrid ionic transducers are fabricated
and the electromechanical properties are characterized in terms of their peak strain output
and strain rate due to an applied voltage. A study of electrode properties demonstrated
that varying the particulate composition has a substantial impact on the strain output of
the transducer. Electrodes fabricated with single-walled carbon nanotubes (SWNT) have
an optimal performance at loadings around 30%, while polyaniline (PANI) electrodes are
optimized at 95% loading. Due to low percolation threshold, SWNT actuators perform
better at lower loading than other conducting powders. Adding SWNT tends to increase
both the strain rate and the maximum strain. A SWNT/RuO2 hybrid transducer was fab-
ricated and achieved a strain rate of 1%/sec and a maximum attainable peak-to-peak strain
of 9.38% when operated at +/- 2V. SWNT/PANI hybrid also increased both strain and
strain rate but not as significant as with RuO2.
In brief, this chapter shows the importance of the electrode architecture and compo-
sition on the performance of ionic polymer transducers. The conductivity and percolation
threshold of the metal powders are proved to be crucial to the speed of response, while the
amount of ionomer-conductor interfacial area and pseudocapacitance properties of the metal
powder are correlated with the peak strain response of the transducer. Finally, conducting
powders with large aspect ratio (low percolation threshold), high electrical conductivity,
large surface area, and good pseudocapacitive properties are good candidates for electrode
materials in ionic polymer transducers.
91

Chapter 5
Extensional and Bending Model
Experimental results from the previous chapter indicate that the electrode layer is a crit-
ical component that strongly influences transducer performance. Moreover, the results of
Chapter 3 correlated the actuation properties of the transducer with the capacitance of the
transducer. This result was consistent for ionomers with substantial difference in composi-
tion; therefore this result strongly suggests that charge accumulation at the polymer-metal
interface is a determining factor in the strain and strain rate generated during actuation.
This experimental result is supported by physics-based modeling efforts (Nemat-Nasser,
2002b; Leo et al., 2005) that highlight the role played by the boundary layer that forms at
the interface of the electrode and the polymer. Although the understanding of fundamental
actuation mechanisms in ionic polymer transducers is still under debate, our previous results
and several other models relates such mechanisms to ion conduction across the membrane.
Leo et al. (2005) modeled the electromechanical coupling by the expansion
σ(x, t) = αρ(x, t) + βρ2(x, t), (5.1)
where α and β are coefficients that define the linear and quadratic terms of the transduction
model, while σ represent the stress and ρ is the space-temporal charge density. In this thesis
a similar approach is adopted and the electromechanical coupling model is assumed to be
in the form
= αQ+ βQ2, (5.2)
where represents the strain and Q is defined as the charge per unit area. This electro-
mechanical model represents a coupling correlation between strain and charge suggested by
92

Extensional actuation
Bending actuation
Figure 5.1: Bending and extensional actuation in a bimorph model of ionicpolymer transducers.
previous experimental data represented in Chapters 3 and 4. The quadratic term in this
model produces a 1st harmonic response for a sine wave voltage input. For ionic polymer
transducers with symmetric electrodes this term generates a zero net bending moment due
to the expansion of both active areas. If the actuation response is measured in the thickness
direction, then the total strain in the transducer is the addition of strains in both electrodes.
Hence, the positive βQ2 term is cumulative in extensional actuation, and the expansion of
both electrodes add to the total expansion of the transducer. Moreover, the linear term
is canceled in extensional actuation of transducers with symmetric electrodes. Non-linear
behavior in the bending actuation is reported in literature (Kothera and Leo, 2005). The
quadratic term generates small 1st harmonic response in slightly assymetric electrodes. The
bending and extensional actuation are elaborated in Figure 5.1
In this chapter transducers are characterized in bending and extensional actuation,
and the results are explained using a bimorph model assuming the electrode as the active
area, with Equation 5.2 for electromechanical coupling.
5.1 Modeling
The transducer is decomposed into three layers in this model, two active layers and one
passive layer. The active layers are assumed to be the electrodes while the membrane
is assumed to be a passive substrate. To justify this concept, we will demonstrate that
most of the charges accumulate or deplete the assumed active areas. The electrode is a
93

Metal Particles
Charged Polymer / EDL
Gold electrode
Uncharged Polymer
Metal Particles
Charged Polymer / EDL
Gold electrode
Uncharged Polymer
Figure 5.2: Schematic of a typical electrode in an ionic polymer transducershowing the particles surrounded by a charged sphere of ionomer.
metal-ionomer composite that is populated or depleted with the mobile cations upon the
application of a potential across the transducer. The average thickness of the electrodes
applied in this study is on the order of 10 to 100µm. Typical RuO2 particles are 3 to 5 nm
in diameter. The magnitude of the depleted or charged polymer is a couple of orders smaller
than the electrode thickness. The Helmholtz electric double layer model demonstrates that
ions approach the electrode to the distance of minimal approach known as the Stern layer,
which is on the order of several Angstroms. While Gouy-Chapman model predict a larger
length by including the diffuse layer, this length is typically smaller than 1 micron. This
Nernst-Plank model is computed in Leo et al. (2005) for ionic polymer transducers and show
that this distance is on the order of 0.1 to 1 µm. Figure 5.2 shows a schematic of a charged
electrode and demonstrates that the charged volume is mostly bound to the electrode.
5.1.1 Active Areas Model: Simplified Bending
The transducer is modeled as two active electrodes and a passive substrate. A cross sec-
tion of the model of an ionic polymer transducer is presented in Figure 5.3. This model is
simplified by neglecting the nonlinear term in the electromechanical coupling model. The
nonlinearities are neglected since they are not captured by the FRF analysis elaborated in
chapter 2. This simplified bending model is used in the analysis of FRF bending experi-
mental results, and specifically to extract and compare the values of α.
The equation of a beam in bending
EId2w
dx2=Mis (5.3)
where w is the displacement in the y direction, Mis is the internal moment generated by
94

ts
tu
ybtl
ts
tu
ybtl
x
y
Figure 5.3: Schematic of an asymmetric transducer with an electrode on oneside, where yb represents the distance toward the neutral axis
the actuation of the active areas, and the equivalent EI is defined as
EI =T−yb
T−yb−tubEaz
2 dz +T−yb−tu
−(yb−tl)bEsz
2 dz +−(yb−tl)
−ybbEaz
2 dz (5.4)
= bEa(y2b (tl + tu) + yb(−2tltu − 2tstu − t2u − t2l ) +
1
3t3u + t
2utl + tut
2l
+2tutlts + t2uts + tut
2s +
1
3t3l ) + bEs(
1
3t3s + tsy
2b − t2syb − 2tltsyb + t2l ts + tlt2s), (5.5)
where T is the total thickness of the transducer:
T = tu + ts + tl, (5.6)
For a transducer with symmetrical electrodes where tu = tl = ta EI is expressed as
EI =1
12(6bEat
2sta + 12bEatst
2a + 8bEaT
3a + bEst
3s), (5.7)
and for a transducer with uni-sided electrode, that is one high surface area electrode on one
side and a thin sheet of gold on the other side with negligible thickness and stiffness, EI is
of the form:
EI =ts−yb
−ybbEsz
2 dz +ts+ta−yb
ts−yb−bEaz2 dz (5.8)
=bEs3(t3s − 3t2syb + 3tsy2b ) +
bEa3(t3a + 3t
2sta + 3tst
2a − 3(t2a + 2tats)yb + 3tay2b ) (5.9)
Therefore the average modulus of the composite transducer, which is the modulus
computed from experimental results, is in the form:
95
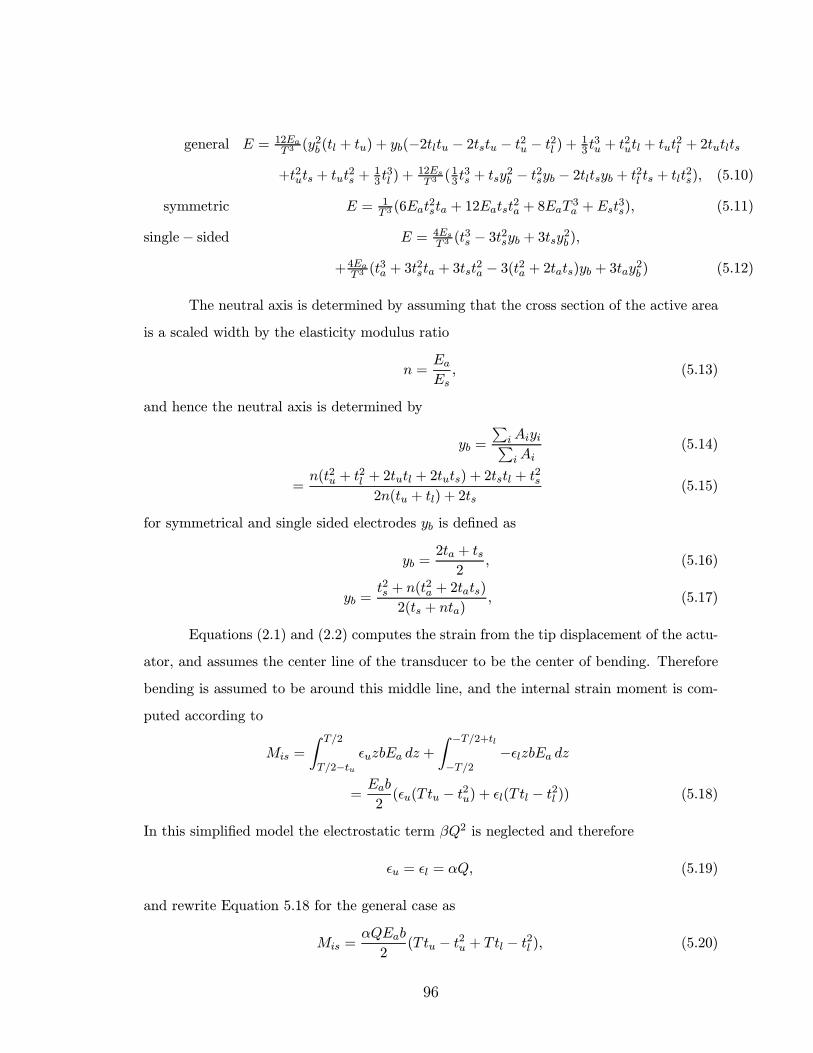
general E = 12EaT 3(y2b (tl + tu) + yb(−2tltu − 2tstu − t2u − t2l ) + 1
3 t3u + t
2utl + tut
2l + 2tutlts
+t2uts + tut2s +
13 t3l ) +
12EsT 3(13t
3s + tsy
2b − t2syb − 2tltsyb + t2l ts + tlt2s), (5.10)
symmetric E = 1T 3(6Eat
2sta + 12Eatst
2a + 8EaT
3a +Est
3s), (5.11)
single− sided E = 4EsT 3(t3s − 3t2syb + 3tsy2b ),
+4EaT 3(t3a + 3t
2sta + 3tst
2a − 3(t2a + 2tats)yb + 3tay2b ) (5.12)
The neutral axis is determined by assuming that the cross section of the active area
is a scaled width by the elasticity modulus ratio
n =EaEs, (5.13)
and hence the neutral axis is determined by
yb =iAiyi
iAi(5.14)
=n(t2u + t
2l + 2tutl + 2tuts) + 2tstl + t
2s
2n(tu + tl) + 2ts(5.15)
for symmetrical and single sided electrodes yb is defined as
yb =2ta + ts2
, (5.16)
yb =t2s + n(t
2a + 2tats)
2(ts + nta), (5.17)
Equations (2.1) and (2.2) computes the strain from the tip displacement of the actu-
ator, and assumes the center line of the transducer to be the center of bending. Therefore
bending is assumed to be around this middle line, and the internal strain moment is com-
puted according to
Mis =T/2
T/2−tuuzbEa dz +
−T/2+tl
−T/2− lzbEa dz
=Eab
2( u(Ttu − t2u) + l(Ttl − t2l )) (5.18)
In this simplified model the electrostatic term βQ2 is neglected and therefore
u = l = αQ, (5.19)
and rewrite Equation 5.18 for the general case as
Mis =αQEab
2(Ttu − t2u + Ttl − t2l ), (5.20)
96
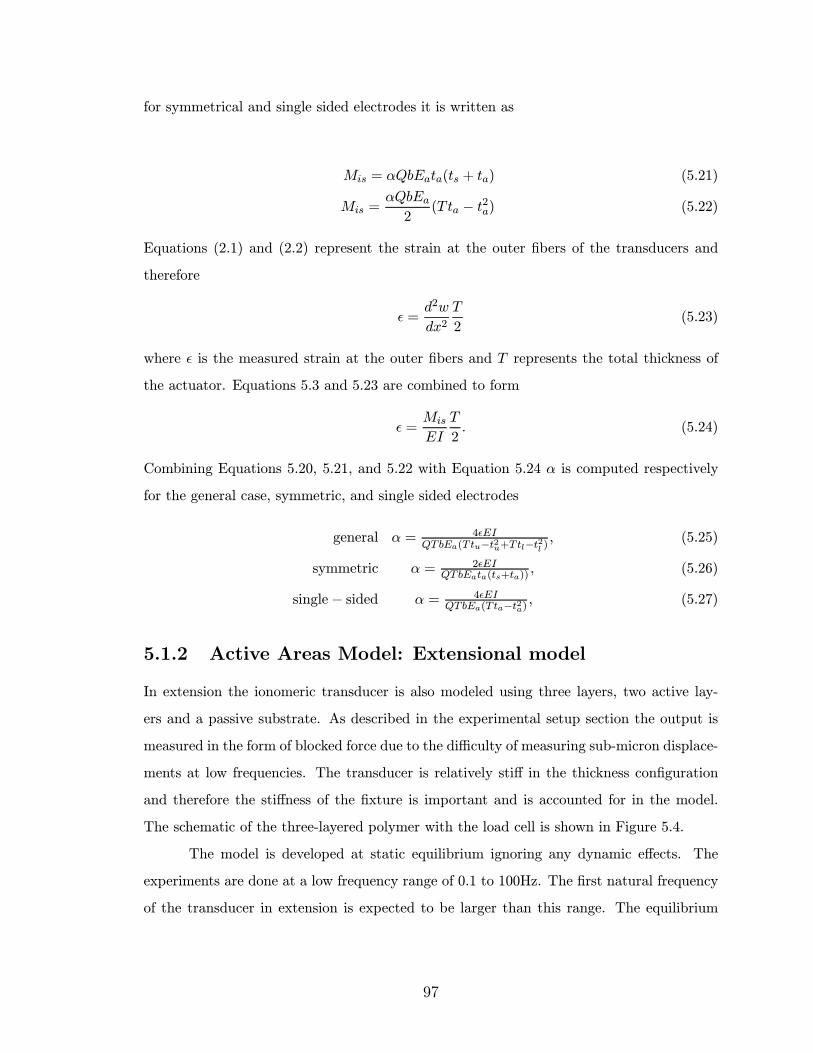
for symmetrical and single sided electrodes it is written as
Mis = αQbEata(ts + ta) (5.21)
Mis =αQbEa2
(Tta − t2a) (5.22)
Equations (2.1) and (2.2) represent the strain at the outer fibers of the transducers and
therefore
=d2w
dx2T
2(5.23)
where is the measured strain at the outer fibers and T represents the total thickness of
the actuator. Equations 5.3 and 5.23 are combined to form
=Mis
EI
T
2. (5.24)
Combining Equations 5.20, 5.21, and 5.22 with Equation 5.24 α is computed respectively
for the general case, symmetric, and single sided electrodes
general α = 4 EIQTbEa(Ttu−t2u+Ttl−t2l )
, (5.25)
symmetric α = 2 EIQTbEata(ts+ta))
, (5.26)
single− sided α = 4 EIQTbEa(Tta−t2a) , (5.27)
5.1.2 Active Areas Model: Extensional model
In extension the ionomeric transducer is also modeled using three layers, two active lay-
ers and a passive substrate. As described in the experimental setup section the output is
measured in the form of blocked force due to the difficulty of measuring sub-micron displace-
ments at low frequencies. The transducer is relatively stiff in the thickness configuration
and therefore the stiffness of the fixture is important and is accounted for in the model.
The schematic of the three-layered polymer with the load cell is shown in Figure 5.4.
The model is developed at static equilibrium ignoring any dynamic effects. The
experiments are done at a low frequency range of 0.1 to 100Hz. The first natural frequency
of the transducer in extension is expected to be larger than this range. The equilibrium
97

kf
ka1
ks
Fa1
Fa2ka2
Fixture and Load cell
Upper active layer
Lower active layer
Inactive Substrate
1
2
3
u1
u2
u3
kf
ka1
ks
Fa1
Fa2ka2
Fixture and Load cell
Upper active layer
Lower active layer
Inactive Substrate
1
2
3
u1
u2
u3
Figure 5.4: Schematic of the three-layered ionic polymer transducer in thick-ness configuration.
equations at the points 1, 2, and 3 respectively are
−kfu1 + Fa1 − ka1(u1 − u2) = 0 (5.28)
−Fa1 + ka1(u1 − u2)− ks(u2 − u3) = 0 (5.29)
ks(u2 − u3)− Fa2 − ka2u3 = 0 (5.30)
and the displacement at each point is
u1 = ksFa1ka2 − ka1Fa2
ka1kskf + ka1ka2kf + kska2ka1 + kska2kf(5.31)
u2 = −ksFa1kf + ksFa2ka1 + ksFa2kf + Fa1ka2kfka1kskf + ka1ka2kf + kska2ka1 + kska2kf
(5.32)
u3 = −ksFa1kf + ksFa2ka1 + ka1Fa2kf + ksFa2kfka1kskf + ka1ka2kf + kska2ka1 + kska2kf
(5.33)
The stiffness of the active areas are defined as
ka1 =EaA
tu(5.34)
ka2 =EaA
tl(5.35)
where A is the area of the transducer. The passive substrate stiffness is defined as:
ks =EsA
ts(5.36)
98

The stiffness of the fixture and the load cell (kf ) was calibrated as demonstrated in
Chapter 2 to be around 2.4N/µm. Matching the theoretical model to the experimental data
the active and substrate modulus are calibrated to be Ea = 180MPa and Es = 30MPa.
The free strain is computed from the electromechanical transduction model devel-
oped by Leo et al. (2005)
a1 = αQ+ βQ2 (5.37)
a2 = αQ− βQ2 (5.38)
where Q is defined as the charge per unit area. The forcing functions in the active layers
are defined as the free strain multiplied by the stiffness.
Fa1 = EaA a1 (5.39)
Fa2 = EaA a2 (5.40)
5.1.3 Active Areas Model: Bending with Electrostatic Ex-
pansion Term
The electrostatic attraction term βQ2 is added to the simplified bending model. The elec-
trostatic term always lead to positive strain or expansion in the active area. Therefore
its net moment on perfectly symmetrical electrodes is expected to be zero, and largest on
single sided electrodes. The average modulus and moment of inertia terms are computed
similarly to the simplified model. The electrodes are also assumed to be the active areas
and the bending is assumed to be around the center line of the transducer. Equation 5.18
is the same while the strain are modified as follows:
u = αQ+ βQ2 (5.41)
l = αQ− βQ2 (5.42)
and the resulting moment is:
Mis =Eab
2αQ(T (tu + tl)− (t2u + t2l )) +
Eab
2βQ2(T (tu − tl)− (t2u − t2l )) (5.43)
Equations 5.3, 5.23, and 5.43 are combined and the resulting strain equation:
=TEab
4EIαQ(T (tu + tl)− (t2u + t2l )) + βQ2(T (tu − tl)− (t2u − t2l )) (5.44)
99

0 2 4 6 8 10-1000
-500
0
500
1000
1500
2000
2500
Time (sec)
µ st
rain
0 0.5 1 1.5 2 2.5
100
102
104
106
108
Frequency (Hz)
PS
D B
endi
ng
ts=200 tu=25 tl=25
ts=200 tu=35 tl=15
ts=200 tu=50 tl=0
0 2 4 6 8 10-1000
-500
0
500
1000
1500
2000
2500
Time (sec)
µ st
rain
0 0.5 1 1.5 2 2.5
100
102
104
106
108
Frequency (Hz)
PS
D B
endi
ng
ts=200 tu=25 tl=25
ts=200 tu=35 tl=15
ts=200 tu=50 tl=0
Figure 5.5: (a) Model simulation of the microstrain time response of threesamples with different electrode configurations in bending mode. (b) Powerspectrum of the time response.
α and β are computed by fitting equation 5.44 to time domain data of the transducer
bending.
5.2 Model Simulations
Models of three transducers are built and simulated under typical actuation conditions. The
three samples are made of ts = 200µm substrate and has an upper electrode thickness tu =
25µm, 35µm, and 50µm, and a lower electrode thickness of tl = 25µm, 15µm, and 0µm
respectively. These simulated transducers are named M1, M2, and M3 respectively. The
geometries of these simulated transducers are similar to the experimentally tested transduc-
ers. The area for the extensional simulations is 3x3 mm2 and 3x30 mm2 in bending. Values
for α and β are 2x10⁻⁶, 4x10⁻⁹ respectively. In this simulation we assume a sinusoidal
charge density with amplitude of 450C/m2 is actuating the transducers at a frequency at
0.5Hz. Simulations of the time and frequency domain response of the transducers in bend-
ing are computed using Equation 5.44 and are shown in Figure 5.5(a) and (b) respectively.
Time and frequency domain simulations in the extensional mode are computed according
to Equation 5.31 and are shown in Figure 5.6(a) and (b) respectively. Model simulations
demonstrate that distortion in the bending increases in the samples with greater assymetry.
The first harmonic peak response increases from 1.5, 16, to 66 µstrain as the electrode
100

0 2 4 6 8 10-0.02
0
0.02
0.04
0.06
0.08
0.1
0.12
Time (sec)
Forc
e (N
)
0 0.5 1 1.5 2 2.510-8
10-6
10-4
10-2
Frequency (Hz)
PS
D E
xten
sion
al
ts=200 tu=25 tl=25
ts=200 tu=35 tl=15
ts=200 tu=50 tl=0
0 2 4 6 8 10-0.02
0
0.02
0.04
0.06
0.08
0.1
0.12
Time (sec)
Forc
e (N
)
0 0.5 1 1.5 2 2.510-8
10-6
10-4
10-2
Frequency (Hz)
PS
D E
xten
sion
al
ts=200 tu=25 tl=25
ts=200 tu=35 tl=15
ts=200 tu=50 tl=0
Figure 5.6: (a) Model simulation of the forcing time response of three sampleswith different electrode configurations in extensional mode. (b) Power spectrumof the time response.
symmetry decreases. The values of the fundamental frequency varies less and are 740, 770,
and 1100 µstrain for models M1, M2, and M3 respectively.
The extensional mode simulations shows an opposite trend. Distortion or first har-
monic response remains constant with electrode symmetry, while the fundamental frequency
response decrease to the noise flour for symmetric electrodes. The response of models M1,
M2, and M3 on the fundamental frequency are 0.2, 20, and 51 mN respectively. The first
harmoninc response is constant at 30mN for all the models.
Simulations demonstrate that the ratio of the first harmonic to the fundamental
frequency response is a representation of distortion in the actuator. This ratio is presented
in Figure 5.7 for the simulations of bending and extensional mode actuation response. The
model predicts larger values of distortion in the extensional mode compared to that of the
bending reponse. The maximum distortion in the symmeteric transducer extentional mode
actuation is around 16 compared 0.06 maximum distortion in the assymetric transducer
for the extentional mode. This simulation result justify the reason that distortion is not
reported frequently in bending, while it is very prominent in extensional mode as our results
will show later. Furthermore, this graph asserts the previous result that distortion increases
in bending with increasing assymetry, and decreases in the extensional mode.
101

0
0.05
0.1
1st H
arm
/Fun
d B
endi
ng
0
10
20
1st H
arm
/Fun
d E
xten
sion
al
Symmetric Single Sided
ExtensionalBending
M1 M2 M30
0.05
0.1
1st H
arm
/Fun
d B
endi
ng
0
10
20
1st H
arm
/Fun
d E
xten
sion
al
Symmetric Single Sided
ExtensionalBending
M1 M2 M3
Figure 5.7: 1st Harmonic/ Fundamental frequency response as a function ofelectrode symmetry in bending and extensional modes.
5.3 Experimental Results
Several transducers are prepared and their electromechanical properties are measured in
bending and thickness. The ionic polymer transducers varied in membrane thickness and
electrode thickness on each side. Four single sided electrode transducers are also prepared
and characterized.
5.3.1 Simplified Bending Model: FRF Analysis
Seven samples are prepared, three samples had a targeted electrode thickness of 25 µm thick
electrode on each side and membranes of 50, 90, and 125µm (S2, S3, and S4). Three other
samples had different electrode thicknesses on an 180 µm membrane. Two other samples
had 10 µm and 50 µm electrodes on each side of a 180 µm membrane (S5, S6, and S7).
The seventh transducer had 25 µm electrode on a single side of a 180 µm membrane and is
labeled S1. The effective thickness measured under the microscope at three different points
across the actuator are shown in Table 5.1.
Prior to measuring α the modulus of the active electrode and the substrate are cal-
ibrated. In Chapter 2, Section 2.1 we presented two methods of measuring the modulus
of the transducer according to Equations 2.5 and 2.9. Table 5.3.1 is a comparison of stiff-
102

1 2 3 4 5 6 70
50
100
150
200
sample #
Mod
ulus
MP
a
TheoreticalExperimental
Figure 5.8: Modulus calibration of samples
Table 5.1: Thickness measurements of the upper electrode, polymer substrate,and lower electrode for samples S1 through S7.
S1 S2 S3 S4 S5 S6 S7
tu 22 55 30 47 55 45 30tl 0 32 20 37 37 37 22ts 242 65 105 120 220 207 230
nesses of samples S1 through S4 computed using the natural frequency and direct stiffness
measurement methods. The maximum variation is around 26%.
Modulus of elasticity of samples S1 through S7 are computed from the resonance
peaks of the FRFs in Figure 5.9(b) according to equation 2.5. Equations 5.10, 5.11, and
5.12 are fitted to the experimental data and the modulus of the electrode and the membrane
are calibrated to be 180MPa and 30MPa respectively. Figure 5.8 shows the experimentally
measured effective modulus compared to the model prediction of the seven samples.
The strain per unit volt FRF results demonstrates large variation between the per-
formance of the samples. The single sided electrode actuator performed worst at 140 µm
at 0.25Hz compared to 1560 µm for 90 µm membrane transducer (see Figure 5.9 (a)). The
strain per volt was normalized with respect to charge per area. The resulting FRF shows
less variations of 2 to 6 µstrain/(C/m2), moreover the frequency roll-off is eliminated and
103
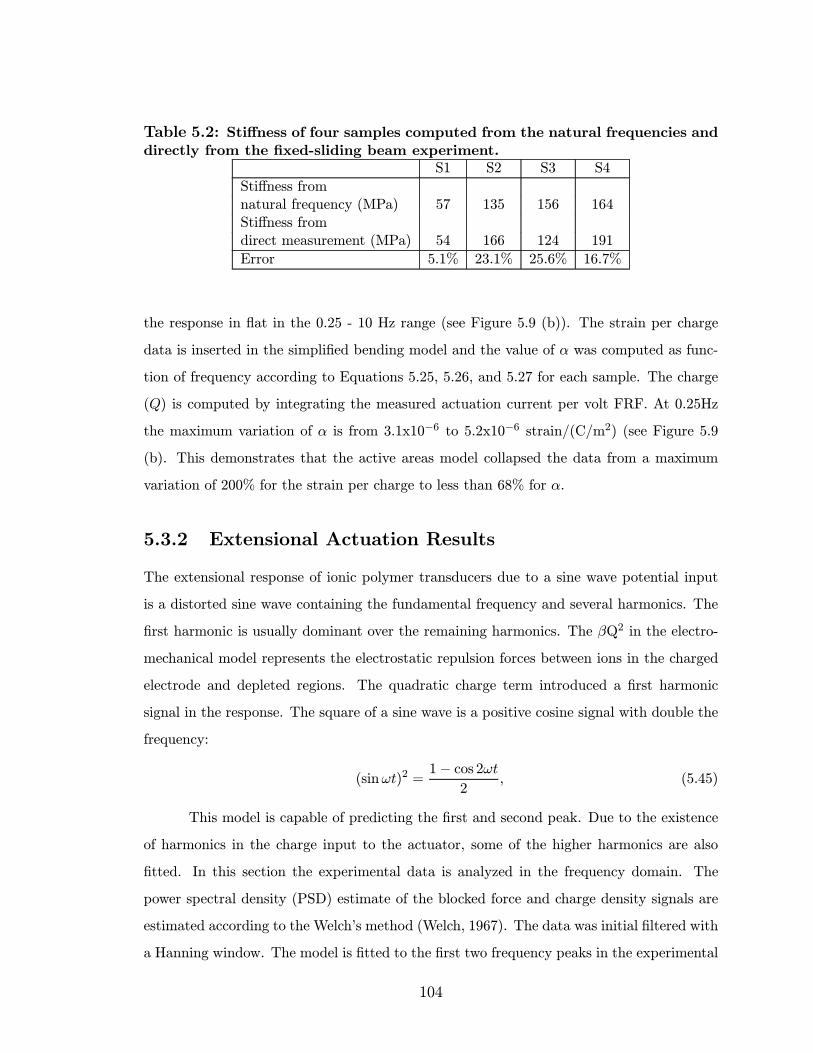
Table 5.2: Stiffness of four samples computed from the natural frequencies anddirectly from the fixed-sliding beam experiment.
S1 S2 S3 S4
Stiffness fromnatural frequency (MPa) 57 135 156 164Stiffness fromdirect measurement (MPa) 54 166 124 191
Error 5.1% 23.1% 25.6% 16.7%
the response in flat in the 0.25 - 10 Hz range (see Figure 5.9 (b)). The strain per charge
data is inserted in the simplified bending model and the value of α was computed as func-
tion of frequency according to Equations 5.25, 5.26, and 5.27 for each sample. The charge
(Q) is computed by integrating the measured actuation current per volt FRF. At 0.25Hz
the maximum variation of α is from 3.1x10⁻⁶ to 5.2x10⁻⁶ strain/(C/m2) (see Figure 5.9
(b). This demonstrates that the active areas model collapsed the data from a maximum
variation of 200% for the strain per charge to less than 68% for α.
5.3.2 Extensional Actuation Results
The extensional response of ionic polymer transducers due to a sine wave potential input
is a distorted sine wave containing the fundamental frequency and several harmonics. The
first harmonic is usually dominant over the remaining harmonics. The βQ2 in the electro-
mechanical model represents the electrostatic repulsion forces between ions in the charged
electrode and depleted regions. The quadratic charge term introduced a first harmonic
signal in the response. The square of a sine wave is a positive cosine signal with double the
frequency:
(sinωt)2 =1− cos 2ωt
2, (5.45)
This model is capable of predicting the first and second peak. Due to the existence
of harmonics in the charge input to the actuator, some of the higher harmonics are also
fitted. In this section the experimental data is analyzed in the frequency domain. The
power spectral density (PSD) estimate of the blocked force and charge density signals are
estimated according to the Welch’s method (Welch, 1967). The data was initial filtered with
a Hanning window. The model is fitted to the first two frequency peaks in the experimental
104
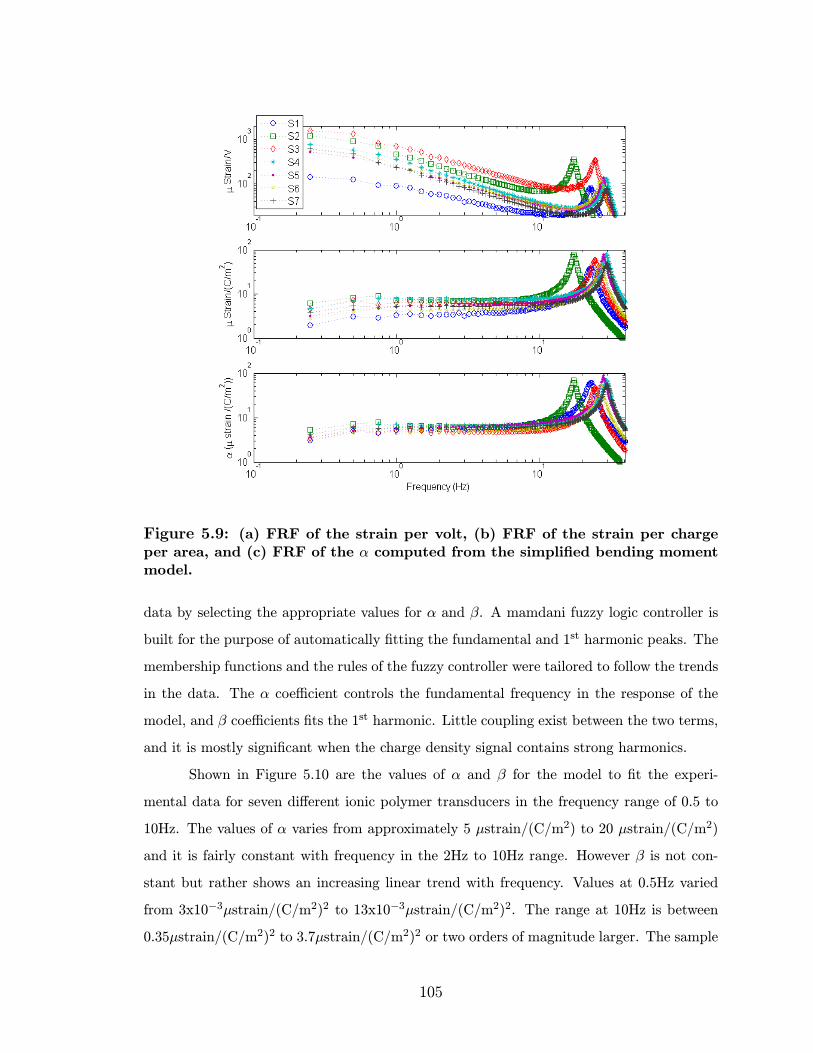
Figure 5.9: (a) FRF of the strain per volt, (b) FRF of the strain per chargeper area, and (c) FRF of the α computed from the simplified bending momentmodel.
data by selecting the appropriate values for α and β. A mamdani fuzzy logic controller is
built for the purpose of automatically fitting the fundamental and 1st harmonic peaks. The
membership functions and the rules of the fuzzy controller were tailored to follow the trends
in the data. The α coefficient controls the fundamental frequency in the response of the
model, and β coefficients fits the 1st harmonic. Little coupling exist between the two terms,
and it is mostly significant when the charge density signal contains strong harmonics.
Shown in Figure 5.10 are the values of α and β for the model to fit the experi-
mental data for seven different ionic polymer transducers in the frequency range of 0.5 to
10Hz. The values of α varies from approximately 5 µstrain/(C/m2) to 20 µstrain/(C/m2)
and it is fairly constant with frequency in the 2Hz to 10Hz range. However β is not con-
stant but rather shows an increasing linear trend with frequency. Values at 0.5Hz varied
from 3x10⁻³µstrain/(C/m2)2 to 13x10−3µstrain/(C/m2)2. The range at 10Hz is between
0.35µstrain/(C/m2)2 to 3.7µstrain/(C/m2)2 or two orders of magnitude larger. The sample
105

0 5 100
5
10
15
20
25
30
α ( µ
stra
in /(
C/m
2 ))
Frequency (Hz)0 5 10
0
1
2
3
4
Frequency (Hz)
β ( µ
stra
in /(
C/m
2 )2 )
S1S2S3S4S5S6S7
Figure 5.10: Values of the α and β for the model to fit the experimental datafor seven different ionic polymer transducers in the frequency range of 0.5 to10Hz.
to sample variation of the α and β values are believed to be due to non-uniformity in the
electrodes and the large tolerances in the measurements that are reported in Table 5.1.
Figure 5.11 (a) and (b) shows respectively the typical response of the time and
frequency domain blocked pressure and model fit for a sample with 25µm electrodes on
each side on a 180 µm membrane, actuated with a 2V 0.5Hz sine wave. Notice the dou-
bling in frequency that is more dominant than the fundamental frequency response. The
stiffness of this sample is estimated experimentally to be around 90MPa and therefore the
corresponding strain to 10kPa is estimated to be 110 µstrain.
5.3.3 Bending with Electrostatic Expansion Term
In this section the values of α and β computed from the through-thickness actuation data
are incorporated in the fully developed bending model to predict the response in bending
of the corresponding transducer.
Shown in Figure 5.12 (a) is the ratio of the 1st harmonic to the fundamental fre-
quency in the strain response computed from experimental results. Figure 5.12 (c) shows
the model’s prediction of these ratios which match within 70% error on the 0.5 Hz while
the error increase drastically at higher frequency. In the time domain the model predicts
106
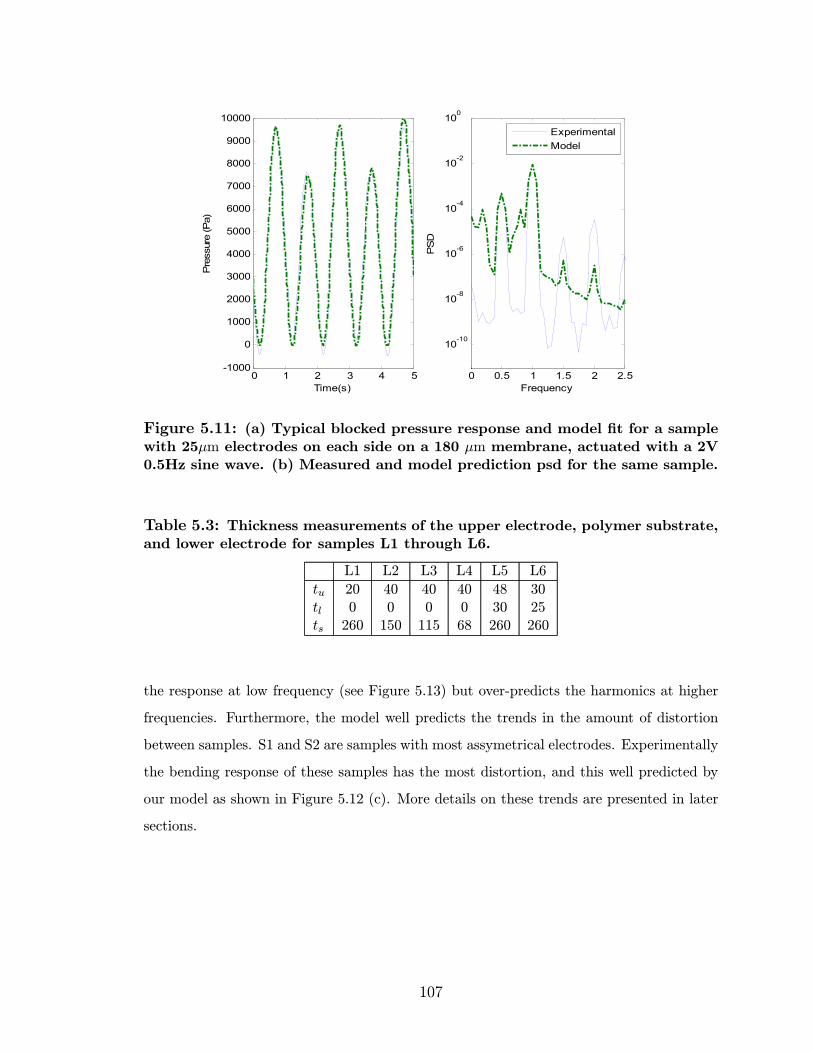
0 1 2 3 4 5-1000
0
1000
2000
3000
4000
5000
6000
7000
8000
9000
10000
Time(s)
Pre
ssur
e (P
a)
0 0.5 1 1.5 2 2.5
10-10
10-8
10-6
10-4
10-2
100
Frequency
PS
D
ExperimentalModel
Figure 5.11: (a) Typical blocked pressure response and model fit for a samplewith 25µm electrodes on each side on a 180 µm membrane, actuated with a 2V0.5Hz sine wave. (b) Measured and model prediction psd for the same sample.
Table 5.3: Thickness measurements of the upper electrode, polymer substrate,and lower electrode for samples L1 through L6.
L1 L2 L3 L4 L5 L6
tu 20 40 40 40 48 30tl 0 0 0 0 30 25ts 260 150 115 68 260 260
the response at low frequency (see Figure 5.13) but over-predicts the harmonics at higher
frequencies. Furthermore, the model well predicts the trends in the amount of distortion
between samples. S1 and S2 are samples with most assymetrical electrodes. Experimentally
the bending response of these samples has the most distortion, and this well predicted by
our model as shown in Figure 5.12 (c). More details on these trends are presented in later
sections.
107

100 1010
0.1
0.2
0.3
0.4
0.5
0.6
0.7
Frequency (Hz)
µ s
train
1st
Har
m/ F
und
Model Bending Prediction
100 1010
0.01
0.02
0.03
0.04
0.05Bending
Frequency (Hz)
µ st
rain
1st
Har
m/ F
und
S1S2S3S4S5S6S7
100 1010
0.5
1
1.5
2
2.5
Frequency (Hz)
Forc
e 1s
t/Fun
d
Extensional
100 1010
0.1
0.2
0.3
0.4
0.5
0.6
0.7
Frequency (Hz)
µ s
train
1st
Har
m/ F
und
Model Bending Prediction
100 1010
0.01
0.02
0.03
0.04
0.05Bending
Frequency (Hz)
µ st
rain
1st
Har
m/ F
und
S1S2S3S4S5S6S7
100 1010
0.5
1
1.5
2
2.5
Frequency (Hz)
Forc
e 1s
t/Fun
d
Extensional
Figure 5.12: (a) Experimental ratio of the 1st harmonic to the fundamentalfrequency in the strain response under 2V sine waves (b) The distortion ratioin extensional actuation (c) Model prediction of this ratio
5.4 Discussion and Model Verification
A series of six transducers is built and characterized for the purpose of verifying the model
and confirming previous analysis. Four of the samples are painted with single sided elec-
trodes of approximately 25 µm on membranes of 50, 90, 125, and 180µm thick and are
labeled L1, L2, L3, and L4 respectively. The other two transducers have two symmetric
electrodes of different thicknesses and are labeled L5 and L6. Measurement of the actual
thicknesses under the microscope are presented in Table 5.4. The six samples are built and
characterized similar to the process presented in the previous sections. The values of α and
β from either thickness or bending experiments are within the range of the previous set of
transducers (see Figure 5.14).
5.4.1 Dependency on the Potential
Charge injection into the ionic polymer transducer increases with the applied voltage across
the membrane. As mentioned earlier the fundamental frequency in the response is due to
the αQ term while the first harmonic response is mainly due to the βQ2 term. Therefore
the harmonic is expected to increase as a function of charge, which in turn is a function of
the applied voltage. This could be verified in Figure 5.15.
108

0 1 2 3 4 5 6 7 8
-1000
-500
0
500
1000
Time (s)
µ Stra
in
ExperimentalModel
Figure 5.13: Experimental and modeling of a two sided transducer time re-sponse due to 2V 0.5Hz sine wave in bending.
Furthermore, Figure 5.14 (b) and (d) demonstrates that the model was able to
account for the dependency on Q2 and the computed value of β didn’t vary significantly
from 1V to 2V.
5.4.2 Model Discussion and Trends
The nonlinear quadratic term in the electromechanical model produces a 1st harmonic re-
sponse for a sine wave actuation input. For transducers with symmetric electrodes this term
generates a zero net bending moment as predicted in the model simulation section. Figure
5.12 (a) represents the ratio of the 1st harmonic to the fundamental frequency bending
response for the seven transducers presented in the results section. The value of this ratio
is largest for the single sided electrode and S2 which has the most assymetric electrode (see
Table 5.3.1). Figure 5.12 (b) represents this ratio for the extensional actuation response.
The magnitude of the 1st harmonic to the fundamental response is almost 50x larger. The
samples with highest bending distortion (S1 and S2) had the lowest extensional distortion
(Figure 5.12 (b)). Figure 5.12 (c) demonstrates that our model is predicting these trends.
Numerical (Leo et al., 2005) and analytical (Farinholt et al., 2005) solutions of the
Nernst-Plank equation on ion selective membrane with mobile cations and bonded anions
indicates the development of an assymetrical charge profile at low frequency and large
voltage (in the order 1Hz and 1V). Leo et al. (2005) observed that this charge profile becomes
symmetrical at high frequencies and low voltages. Figure 5.16 represents the schematic of
the space charge density across the transducer at low and large frequencies. The square of
109

0 5 100
5
10
15
20
25
α ( µ
stra
in /(
C/m
2 ))
1V
0 5 100
1
2
3
β ( µ
stra
in /(
C/m
2 )2 )
1V
0 5 100
5
10
15
20
25
α ( µ
stra
in /(
C/m
2 ))
2V
Frequency0 5 10
0
1
2
3
β ( µ
stra
in /(
C/m
2 )2 )
Frequency
2V
1s \180µ m1s \125µ m1s \90µ m1s \50µ m50µ m \180µ m25µ m \180µ m
(a) (b)
(c) (d)
0 5 100
5
10
15
20
25
α ( µ
stra
in /(
C/m
2 ))
1V
0 5 100
1
2
3
β ( µ
stra
in /(
C/m
2 )2 )
1V
0 5 100
5
10
15
20
25
α ( µ
stra
in /(
C/m
2 ))
2V
Frequency0 5 10
0
1
2
3
β ( µ
stra
in /(
C/m
2 )2 )
Frequency
2V
1s \180µ m1s \125µ m1s \90µ m1s \50µ m50µ m \180µ m25µ m \180µ m
(a) (b)
(c) (d)
Figure 5.14: (a)Values for α under 1V (b) Values for β under 1V (c) Valuesfor α under 2V (d) Values for β under 2V
the charge distribution are also estimated in the schematics.
At high frequency a symmetrical profile is developed. The Q2 term result in a zero
bending moment for symmetrical electrodes. However at low frequency Q2 the assymetric
profile is expected to produce a larger bending moment due to the difference in thickness
and magnitude. In our model Q2 is detected from the 1st harmonic and therefore a decrease
in the distortion is expected with the increase in frequency. This is verified in Figure 5.12(a)
which represents the ratio of the first harmonic peak to the fundamental peak. Moreover
Figure 5.12(b) demonstrates that the distortion increases as a function of frequency in
extention. This behavior is also expected because the magnitude of the charge density
Q is less distributed and have higher magnitude at smaller area. Therefore the Q2 term
110
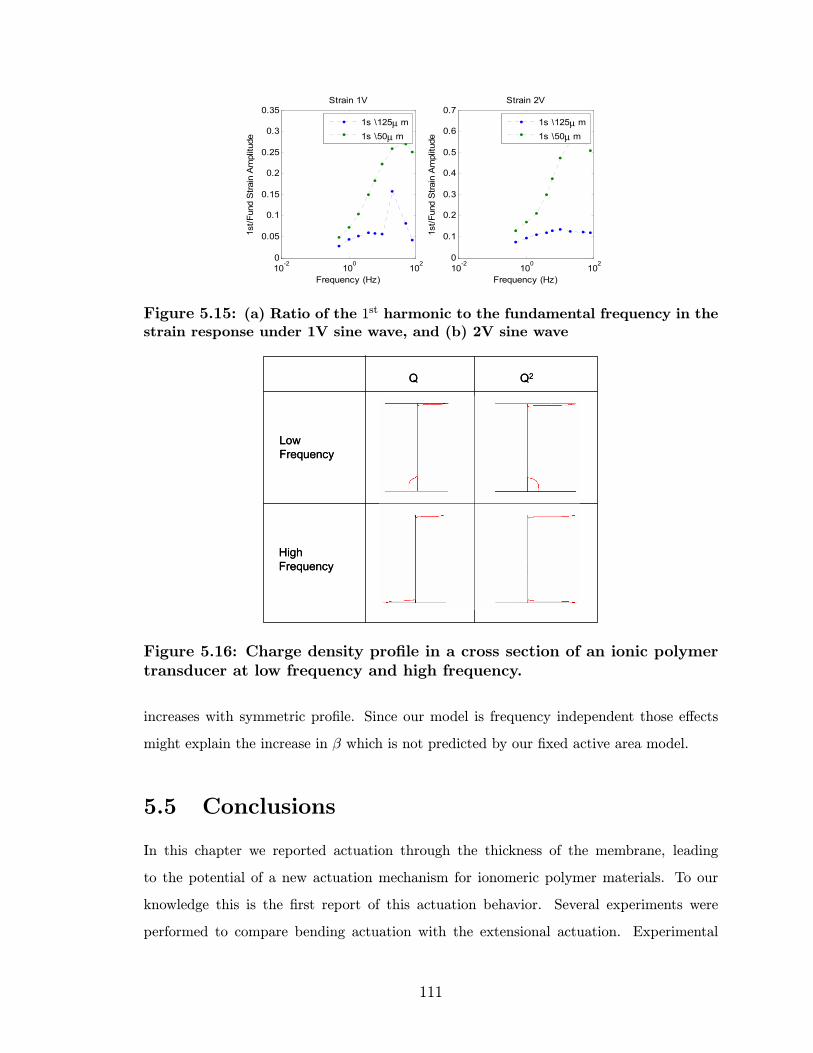
10-2
100
102
0
0.05
0.1
0.15
0.2
0.25
0.3
0.35
Frequency (Hz)
1st/F
und
Stra
in A
mpl
itude
Strain 1V
1s \125µ m1s \50µ m
10-2
100
102
0
0.1
0.2
0.3
0.4
0.5
0.6
0.7
Frequency (Hz)
1st/F
und
Stra
in A
mpl
itude
Strain 2V
1s \125µ m1s \50µ m
Figure 5.15: (a) Ratio of the 1st harmonic to the fundamental frequency in thestrain response under 1V sine wave, and (b) 2V sine wave
High Frequency
Low Frequency
Q Q2
High Frequency
Low Frequency
Q Q2
Figure 5.16: Charge density profile in a cross section of an ionic polymertransducer at low frequency and high frequency.
increases with symmetric profile. Since our model is frequency independent those effects
might explain the increase in β which is not predicted by our fixed active area model.
5.5 Conclusions
In this chapter we reported actuation through the thickness of the membrane, leading
to the potential of a new actuation mechanism for ionomeric polymer materials. To our
knowledge this is the first report of this actuation behavior. Several experiments were
performed to compare bending actuation with the extensional actuation. Experimental
111

results demonstrates strain on the order of 110 µstrain in the thickness direction compared
to 1700 µstrain peak to peak on the external fibers for the same transducer when it is
allowed to bend under +/-2V potential at 0.5 Hz. A bimorph model is presented and used
to assess the effect of electrode thickness on the strain. An electromechanical coupling model
with a linear and a quadratic term determined the strain in the active areas as a function
of the charge. The linear term computed from the simplified demonstrated a decrease in
variation between the samples. The values of α and β from the thickness were incorporated
in the model to predict the bending response. The prediction was relatively good at low
frequency while it was very poor at higher frequencies due to the linear increase in the
values of β. This study demonstrated that β is independent of the electric potential while
the 1st harmonic response increase with it. This lends further support to existence of a
quadratic term in actuation. Experimental results support the prediction of the model that
assymetric electrodes has most distortion in bending while least in extensional direction.
112

Chapter 6
Summary and Conclusions
In this chapter a brief summary of the dissertation is provided. The contributions to the
field are presented and major conclusions are drawn. Finally recommendations for future
work will be presented.
6.1 Dissertation Summary
In this dissertation we have developed, optimized, and characterized a novel ionic polymer
transducer fabrication technique named the direct assembly process (DAP). This process
provided good control on the electrode morphology and architecture of the transducer,
which enabled us to study the effect of the electric double layer on actuation in ionic
polymer transducers. The direct assembly process was inspired from large capacitance
devices known as supercapacitors. An initial motivation study indicated that the strain
response of an ionomeric transducer is strongly correlated with the capacitance of the plated
material. The Direct Assembly Process was developed in collaboration with Dr. Kenton
Wiles and Dr. James E. McGrath at Virginia Tech. In this study we reported for the first
time actuation through the thickness of the membrane, leading to the potential of a new
actuation mechanism for ionomeric polymer materials. Electromechanical characterization
setup are built to measure the bending actuation with the extensional actuation response.
In this dissertation, we studied the transducer performance of several different ionomers
from three ionomer families. Results demonstrate that there is an approximately linear re-
lationship between strain response per unit voltage and the capacitance of the transducer.
113
This relationship indicates that the strain output per unit electric displacement is approx-
imately constant for all of the polymers tested. Our experiments indicate that this value
ranged between 9.8 µstrainCm2
and 15 µstrainCm2
for the polymers tested in this work, and that
this value was consistent with data presented previously by other researchers.
These results suggest a strong relationship between charge accumulation at the
polymer-metal interface and transducer performance. It is known that the low-frequency
capacitance of an ionomeric material is due to blocking electrode effects, therefore a strong
correlation between capacitance and strain indicates that charge accumulation at the in-
terface between the electrode and the polymer is responsible for mechanical deformation.
Although this has been suggested in the literature before, our results demonstrate that the
amount of strain produced by this charge accumulation is approximately the same for a
wide range of ionomer materials that have substantially different properties.
The EmI-Tf ionic liquid diluent produces an environmentally stable transducer with
moderate velocity. Five organic diluents are studied in this dissertation. PolyEthylene
Glycols (PEG ) are polar alcohols with relatively high boiling point. PEG with four molec-
ular weights (MW) are explored. Ethylene Glycol (EG) is the basic unit, diethylene glycol
(DEG) is a two repeating units, triethylene glycol (TEG) is three , PEG 200 is an average
of 4.2 repeating units, and finally Formamide a highly polar and low viscosity diluent are in-
corporated in transducers. These organic diluents actuators could operate in air for several
hours without significant loss of actuation performance and they exhibit a faster response
time than ionic liquid transducers. The speed of response is correlated to the viscosity
and polarity of the organic diluent. Formamide attained the highest speed of 1%strain/sec
averaged on the first 2 seconds of a 2V step response. Speed of response in ionic liquid
transducers is correlated with the content of diluent uptake. Increasing the diluent uptake
and decreasing the viscosity of ionic liquids could lead into high speed transducers with
excellent environmental stability.
Tailoring the electrode composition is an effective method for achieving high strain
transducers using ionomeric polymer materials. Our results demonstrate that surface area-
to-volume ratio of the metal particulate is a critical property in achieving large capacitance
at low frequencies. Increasing the low-frequency capacitance increases the strain output of
the transducer. The electrical conductivity through the electrode is also proved to be critical
to the speed of response of the transducers. A trade off between high speed for gold particles
114
and large strains for ruthenium dioxide particles is observed. The electrode composition and
morphology of ionic polymer transducers is manipulated, and evidence of electric double
layer formation at the electrode-polymer interface is proposed. The actuation mechanism
is charge driven, and the slow diffusion of ions toward the electrode is critical to speed of
response.
Electrodes fabricated with RuO2 high surface area metal particles have an optimal
performance at 42% metal loading. The increasing part of the curve is determined by the
percolation theory in a conductor-insulator matrix. The percolation threshold of RuO2 in
Nafion was measured to be around 19%. The decreasing part of the curve is attributed to
the absence of ionomer and the slow diffusion of ions into the electrode.
Hybrid ionic transducers are also fabricated and the electromechanical properties are
characterized in terms of their peak strain output and strain rate due to an applied voltage.
A study of electrode properties demonstrated that varying the particulate composition has
a substantial impact on the strain output of the transducer. Electrodes fabricated with
single-walled carbon nanotubes (SWNT) have an optimal performance at loadings around
30%, while polyaniline (PANI) electrodes are optimized at 95% loading. Due to low perco-
lation threshold, SWNT actuators perform better at lower loading than other conducting
powders. Adding SWNT tends to increase both the strain rate and the maximum strain.
A SWNT/RuO2 hybrid transducer has a strain rate of 1%/sec and a maximum attain-
able peak-to-peak strain of 9.38% when operated at +/- 2V. This is over 50x enhancement
from strains achieved in transducers using traditional fabrication techniques. SWNT/PANI
hybrid also increased both strain and strain rate but not as significant as with RuO2.
PANI/RuO2 actuator had an overwhelming back relaxation under the application of a DC
electric field.
Experimental results demonstrates strain on the order of 110 µstrain in the thick-
ness direction compared to 1700 µstrain peak to peak on the external fibers for the same
transducer when it is allowed to bend under +/-2V potential at 0.5 Hz. A bimorph model
is presented and used to assess the effect of electrode thickness on the strain. An electro-
mechanical coupling model with a linear and a quadratic term determined the strain in
the active areas as a function of the charge. The alpha term computed from the simplified
demonstrated a decrease in variation between the samples. The values of α and β from the
thickness were incorporated in the model to predict the bending response. The prediction
115
was relatively good at low frequency while it was very poor at higher frequencies due to
the linear increase in the values of β. This study demonstrated that β is independent of
the electric potential while the 1st harmonic response increase with it. This lends further
support to existance of a quadratic term in actuation. Experimental results supports the
prediction of the model that assymetric electrodes has most distortion in bending while
least in extensional direction.
6.2 Contributions
This dissertation has three major contributions to the field of ionic polymer transducers.
These contributions enhances the performance of ionic polymer transducers, provide tools
to the fabrication and characterization of the actuators, and finally highlights some physic
based actuation concepts through models and correlations. The following is a list of these
contributions:
• The first major contribution is the determination of a correlation between capacitanceand mechanical strain. This correlation indicates that the actuation response in ionic
polymers is directly related to the charge displacement in the material. This result
has a major impact on the modeling and on the understanding of the actuation
mechanisms.
• The second major contribution is the development of a fabrication process which al-lows good control on the composition of ionic polymer transducers. This process,
called the Direct Assembly Process, facilitates the study of different diluents in
ionomeric actuators. This resulted in a dry actuator with EmI-Tf ionic liquid dilu-
ents that can operate in air for over 250000 cycles. The DAP allows the variation
in the electrode architecture which enabled us to fabricate dry transducers with 50x
better performance compared to transducers made using the impregnation-reduction
technique. DAP fabricated transducers achieved a strain of 9.38% at a strain rate of
1%/s. This DAP allows variation of several other transducer parameters including
the ionomer used leading to more performance.
• Finally, an extensional actuation mechanism in ionomeric polymer transducers is re-
ported for the first time in this dissertation. This actuation mechanism enables a new
116
class of ionic polymer transducers with large force and small displacement. Further-
more this actuation mechanism leads to the development of an active areas model
that emphasizes the importance of the boundary layer on the conductor-ionomer
interfacial area.
6.3 Future Work
Three main recommendations for future works will be presented in this section.
• The first recommendation is to further optimize the DAP process by studying differentionic liquids as diluents with less viscosity. We can further increase the conductivity
of the electrode by adding other materials and enhance their dispersion especially in
the case of the SWNT.
• A second idea is to apply a similar study to the sensing properties in ionic polymertransducers. In this dissertation we focused solely on the actuation side of the trans-
ducers; while mechanical deformation sensing is a very important application area for
such transducers.
• The last future work recommendation is to further understand the physical actuationmechanism by exploring the active area model especially in the extensional mode.
Several electrode material could be incorporated using the DAP process and study
their effect on the charge strain correlation. Also further optimizing this model we
should be able to produce bending and extensional ionic polymer transducers with
increased energy densities.
6.4 Conclusions
Actuation in ionic polymer transducers is charge driven. Increasing the capacitance of the
actuator increases the bending response of the transducer. Capacitance in such polymers is
electric double layer and therefore increased by increasing the conductor-ionomer interfacial
surface area. Strain rate in ionic polymer actuators correlates to the speed of injection of
cations in and out of the electrode area. This is controlled by the conductivity of the
electrode that is modeled using percolation theory. Viscosity and polarity of the diluent
117

in the transducer is critical to the speed of response. An electromechanical model with
a quadratic term is proved to model the actuation response in ionic polymer transducers.
This model is associated with a bimorph model that assumes the electrodes to be the active
areas. Such model emphasized the importance of the boundary layer area. First harmonic
distortion in the bending response increases for assymetric electrode and eliminated for
perfectly symmetric electrode.
118

Bibliography
Akle, B. J., Bennett, M. D., and Leo, D. J., 2004a, “High-strain ionomeric - ionic liq-
uid composites via electrode tailoring,” in: Proceedings of the 2004 ASME International
Mechanical Engineering Congress (Submitted to sensors and actuators A: physical), Vol.
2004-61246.
Akle, B. J., Hickner, M. A., Leo, D. J., and McGrath, J. E., 2005, “Correlation of Capac-
itance and Actuation in Ionomeric Polymer Transducers,” Journal of Material Science,
Vol. 40, pp. 3715—3724.
Akle, B. J. and Leo, D. J., 2003, “Consideration of Ionic Polymer Materi-
als as Flapping Mechanisms for Micro-Air Vehicles,” in: Proceedings of the 44th
AIAA/ASME/ASCE/AHS/ASC Structures, Structural Dynamics, and Materials Confer-
ence, Vol. 2003-1438.
Akle, B. J., Wiles, K., Leo, D. J., and McGrath, J. E., 2004b, “Effects of Electrode
Morphology on The Performance of BPSH and PATS Ionic Polymer Transducers,” in:
Proceeding of the EAP Actuators And Devices. SPIE, Vol. 5385-73.
Asaka, K., Fujiwara, N., Oguro, K., Onishi, K., and Sewa, S., 2001a, “State of water and
ionic conductivity of solid polymer electrolyte membranes in relation to polymer actua-
tors,” Journal of Electroanalytical Chemistry, Vol. 505, pp. 24—32.
Asaka, K., Fujiwara, N., Oguro, K., Onishi, K., and Sewa, S., 2001b, “State of water and
ionic conductivity of solid polymer electrolyte membranes in relation to polymer actua-
tors,” Journal of Electromechanical Chemistry, Vol. 505, pp. 24—32.
Bar-Cohen, Y., ed., 2001, Electroactive Polymer Actuators as Artificial Muscles, SPIE
Press, Bellingham, WA.
119

Barisci, J. N., Spinks, G. M., Wallace, G. G., Madden, J. D., and Baughman, B. H.,
2003, “Increased actuation rate of electromechanical carbon nanotube actuators using
potential pulses with resistance compensation,” Smart Materials and Structures, Vol. 12
(4), pp. 549—555.
Baughman, R. H., Chanxing, C., Zakhidov, A. A., Iqbal, Z., Barisci, J. N., Spinks, G. M.,
Wallace, G. G., Mazzoldi, A., Rossi, D. D., Rinzler, A. G., Jaschinski, O., Roth, S., , and
Kertesz, M., 1999, “Carbon nanotube actuators,” Science, Vol. 284, pp. 1340—1344.
Bennett, M. and Leo, D. J., 2003, “Manufacture and characterization of ionic polymer
transducers employing non-precious metal electrodes,” Smart Materials and Structures,
Vol. 12, pp. 424 436.
Bennett, M. and Leo, D. J., 2005, “Morphological and electromechanical characterization
of ionic liquid/Nafion polymer composites,” in: Proceeding of the EAP Actuators And
Devices. SPIE, Vol. 5759, pp. 506—517.
Bennett, M. D. and Leo, D. J., 2004, “Ionic Liquids as Solvents for Ionic Polymer Trans-
ducers,” Sensors and Actuators A: Physical, Vol. 115, pp. 79—90.
Bockris, J., Devanathan, M., and Muller, K., 1963, “On the structure of charged inter-
faces,” Proc. R. Soc. London A, Vol. 274, pp. 55 79.
Bonhote, P., Dias, A. P., Papageorgiou, N., Kalyanasundaram, K., and Gr tzel, M., 1996,
“Hydrophobic, highly conductive ambient-temperature molten salts,” Inorganic Chem-
istry, Vol. 35, pp. 1168—1178.
Broadbent, S., 1954, “Discussion on symposium on Monte Carloo methods,” Journal of
Royal Statistics Society B, Vol. 68.
Broadbent, S. R. and Hammersley, J. M., 1957, “Percolation processes. Crystals and
mazes,” Proceedings Cambridge Philosophy Society, Vol. 53, pp. 629—641.
Buechler, M. A. and Leo, D. J., 2004, “Electromechanical Model of an Active Polymer
Thin Circular Disk,” in: Proceeding of the ASME Dynamic Systems and Controls Division:
2004 IMECE, Vol. IMECE 2004-61477.
120
Cahan, B. and Wainwright, J., 1993, “AC Impedance Investigations of Proton Conduction
in Nafion,” Journal of the Electrochemical Society, Vol. 140, No. 12, pp. L185—L186.
Chapman, D., 1913, “A contribution to the theory of electrocapillarity,” Philos. Mag.,
Vol. 25, pp. 475 481.
Cheng, Z., Bharti, V., Xu, T., Xu, H., Mai, T., and Zhang, Q. M., 2001, “Electrostrictive
P(VDF-TrFE) Copolymers,” Sensors and Actuators A-Phys., Vol. 90, pp. 138—147.
Conway, B. E., 1999, Electrochemical Supercapacitors: Scientific Fundamentals and Tech-
nological Applications, Kluwer Academic/ Plenum Publishers.
Conway, B. E., Birss, V., and Wojtowicz, J., 1997, “The role and utilization of pseudo-
capacitance for energy storage by supercapacitors,” Journal of Power Sources, Vol. 66,
pp. 1—14.
Cooper, E. I. and O’Sullivan, E. J., 1992, “New,Stable, Ambient- Temperature Molten
Salts,” In Proceedings of the Eighth Interational Symposium on Molten Salts, The Elec-
trochemical Society, pp. 386—396.
Cross, L. E. and Rossetti, G. A., 1991, “Origin of the first-order phase change at the Curie
temperature in KNbO[sub 3],” Journal of Applied Physics, Vol. 69, No. 2, pp. 896—898.
Daniel, V. V., 1967, Dielectric Relaxation, Academic Press.
de Gennes, P., Okumura, K., Shahinpoor, M., and Kim, K. J., 2000, “Mechanoelectric
Effects in Ionic Gels,” Europhysics Letters, Vol. 50, No. 4, pp. 513—518.
de Gennes, P. and Seances, C., 1975, Acad. Sci., Vol. Ser. B 281, No. 101, pp. L185—L186.
Ding, J., Liu, L., Spinks, G. M., Zhou, D., Wallace, G. G., and Gillespie, J., 2003, “High
performance conducting polymer actuators utilizing a tubular geometry and helical wire
interconnects,” Synthetic Metals, Vol. 138(3), pp. 391—398.
Domb, C., 1983, The Percolation Transition, Chap. 2, Annals of the Israel Physical Society.
Dow, 2005a, “Tetraethylene Glycol Product Guide,” The Dow Chemical Company,
Vol. http://www.dow.com/ethyleneglycol/resources/index.htm, pp. 612—00005—0704X.
121

Dow, 2005b, “Triethylene Glycol Product Guide,” The Dow Chemical Company,
http://www.dow.com/ethyleneglycol/resources/index.htm, Vol. www.dow.com, pp. 612—
00004—0704X8.
Endo, M., Takeda, T., Kim, Y. J., Koshiba, K., and Ishii, K., 2001, “High power electric
double layer capacitor (EDLC’s); from operating principle to pore size control in advanced
activated carbons,” Carbon science, Vol. 1, pp. 117—128.
Etebari, A., Akle, B. J., Farinholt, K., Bennett, M., Leo, D. J., and Vlachos, P. P., 2004,
“The use of active ionic polymers in Dynamic skin friction measurements,” in: Proceedings
of the 2004 Heat Transfer/Fluids Engineering Conference, Vol. HT-FED2004-56837.
Ewins, D., 2000, Model Testing theory, practice and application, Research Studies Press
LTD, 2nd Edition, England.
Farinholt, K. and Leo, D., 2002, “Modeling of Electromechanical Charge Sensing in Ionic
Polymer Transducers,” to appear in Mechanics of Materials.
Farinholt, K. M., Leo, D. J., and Vlachos, P. P., 2005, “Electrical impedance modeling of
ionic polymer transducers,” in: Proceedings of the 2005 Heat EAP SPIE Conference, Vol.
5761-10.
Fontanella, J., McLin, M., Wintersgill, M., Calame, J., and Greenbaum, S., 1993, “Elec-
trical impedance studies of acid form Nafion membranes,” Solid State Ionics, Vol. 66,
pp. 1—4.
Frackowiak, E. and Beguin, F., 2001, “Review: Carbon materials for the electrochemical
storage of energy in capacitors,” Carbon ., Vol. 39, pp. 937 950.
Fujiwara, N., Asaka, K., Nishimura, Y., Oguro, K., and Torikai, E., 2000, “Preparation
of Gold-Solid Polymer Electrolyte Composites As Electric Stimuli-Responsive Materials,”
Chem. Mater., Vol. 12, pp. 1750—1754.
Funakubo, H., 1987, Shape Memory Alloys, Gordon and Breach, New York.
Gouy, G., 1910, “Constitution of the electric charge at the surface of an electrolyte,” J
Physique, Vol. 9, pp. 457 467.
122
Grahame, D., 1947, “The electrical double layer and the theory of electrocapillarity,”
Chem, Vol. Rev 41, pp. 79—85.
Gray, M., 1987, Polymer Electrolyte Reviews-1, edited by J. R. MacCallum and C. A.
Vincent Kluwer Academic, Dordrecht, p. 139.
Grzeszczuk, M. and Poks, P., 1995, “Analysis of charge transport impedance in the re-
duction of thin films of conducting polyaniline in aqueous trichloroacetic acid solutions,”
Journal of Electroanalytical Chemistry, Vol. 387, pp. 441 501.
Hickner, M., Kim, Y., Wang, F., Zawodzinski, T., and McGrath, J., 2001, in: Proceedings
of the American Society for Composites, Sixteenth Technical Conference, pp. 323—336.
Inman, D. J., 2000, Engineering Vibration, Prentice-Hall, New Jersey.
Kim, K. J. and Shahinpoor, M., 2003, “Ionic polymer-metal composites: II. Manufacturing
techniques,” Smart Materials and Structures, Vol. 12, pp. 65—79.
Kim, Y., Dong, L., Hickner, M., Glass, T., Webb, V., and McGrath, J., 2003, “State
of Water in Disulfonated Poly(arylene ether sulfone) Copolymers and a Perfluorosulfonic
Acid Copolymer (Nafion) and Its Effect on Physical and Electrochemical Properties,”
Macromolecules, Vol. 36, No. 17.
Kitahara, A. and Watanabe, A., 1984, Electrical phenomena at interfaces : fundamentals,
measurements, and applications, Vol. 15, M. Dekker, New York.
Kornbluh, R., Perline, R., Joseph, J., Heydt, R., Pei, Q., and Chiba, S., 1999, “High-field
electrostriction of elastomeric polymer dielectrics for actuation,,” International Symposium
on Smart Structures and Materials: Electroactive polymer actuator and devices, (EAPAD)
in SPIE proceeding, Vol. 3669, pp. 149—161.
Kothera, C. S. and Leo, D. J., 2005, “Identification of the Nonlinear Response of Ionic
Polymer Actuators using the Volterra Series,” Journal of Vibration and Control, Vol. 11(4),
pp. 519—541.
Kotz, R. and Carlen, M., 2000, “Principles and applications of electrochemical capacitors,”
Electrochim. Acta, Vol. 45, pp. 2483 2498.
123

Lendlein, A. and Langer, R., 2002, “Biodegradable, Elastic Shape-Memory Polymers for
Potential Biomedical Applications,” Science, Vol. 296(5573), pp. 1673—1676.
Leo, D. J., 2001, “ME5984: Smart Structures/ Active Material Systems,” Virginia Tech
courses, Vol. 1, No. 1.
Leo, D. J., Farinholt, K., and Wallmersperger, T., 2005, “Computational models of ionic
transport and electromechanical transduction in ionomeric polymer transducers,” in: Pro-
ceeding of the SPIE Smart Structures and Materials 2005: Electroactive Polymer Actuators
and Devices (EAPAD), Vol. 5759, pp. 170—181.
Leo, D. J., Kothera, C., and Farinholt, K., 2003, “Constitutive Equations for an Induced-
strain Bending Actuator with a Variable Substrate,” Journal of Intelligent Material Sys-
tems and Structurs, Vol. 14, pp. 707—718.
Levitsky, I. A., Kanelos, P. T., and Euler, W. B., 2004, “Novel Actuating System Based on
a Composite of Single-Walled Carbon Nanotubes and an Ionomeric Polymer,” in: Materials
Research Society Symposium Proceedings, Vol. 785.
Liang, C. and Rogers, C., 1992, “Multi-dimensional constitutive model for shape memory
alloys,” Journal of Engineering Mathematics, Vol. 26 (3), pp. 429—443.
Lindler, J. andWereley, N., 1999, “Double adjustable shock absorbers using electrorheolog-
ical fluid,” Journal of Intelligent Material Systems and Structures, Vol. 10 (8), pp. 652—657.
Madden, J. D., Madden, P. G., and Hunter, I. W., 2002, “Conducting polymer actuators
as engineering materials,” in: Proceeding of SPIE Smart Structures and Materials, no.
4695, pp. 176—190.
Madden, J. D., Vandesteeg, N., Anquetil, P. A., Madden, P. G., Takshi, A., Pytel, R. R.,
Lafontaine, S. R., Wieringa, P. A., and Hunter, I. W., 2004, “Artificial Muscle Technology:
Physical Principles and Naval Prospects,” .
Mauritz, K., 1989, “Dielectric Relaxation Studies of Ion Motions in Electrolyte-Containing
Perfluorosulfonate Ionomers. 4.Long-Range Ion Transport,” Macromolecules, Vol. 22,
pp. 4483—4488.
124

Mauritz, K. and Fu, R., 1988, “Dielectric Relaxation Studies of Ion Motions in Electrolyte-
Containing Perfluorosulfonate Ionomers. 1. NaOH and NaCl Systems,” Macromolecules,
Vol. 21, pp. 1324—1333.
Mauritz, K. and Yun, H., 1988, “Dielectric Relaxation Studies of Ion Motions in
Electrolyte-Containing Perfluorosulfonate Ionomers. 2. CH3COONa, KC1, and KI Sys-
tems,” Macromolecules, Vol. 21, pp. 2738—2743.
MeGlobal, 2005, “Diethylene GlycolProduct Guide,” http :
//www.meglobal.biz/literature/product guides/MEGlobal DEG.pdf.
Mozga, W., 2005, “Physiochemical Properties of Popular Liquids,” http :
//www.trimen.pl/witek/ciecze/oldliquids.html.
Nemat-Nasser, S., 2002a, “Micro-mechanics of Actuation of Ionic Polymer-metal Compos-
ites,” Journal of Applied Physics, Vol. 92, No. 5, pp. 2899—2915.
Nemat-Nasser, S., 2002b, “Micromechanics of Actuation of Ionic Polymer-metal Compos-
ites,” Journal of Applied Physics, Vol. 92, No. 5.
Nemat-Nasser, S. and Li, J., 2000, “Electromechanical Response of Ionic Polymer Metal
Composites,” in: Proceedings of the SPIE, Vol. 3987, pp. 82—91.
Nemat-Nasser, S. and Thomas, C. W., 2001, “Ionomeric Polymer-Metal Composites,” in:
Electroactive Polymer Actuators as Artificial Muscles, Chap. 6, SPIE Press, Bellingham,
WA, pp. 139—191.
Nemat-Nasser, S. and Wu, Y., 2003a, “Comparative experimental study of ionic polymer
metal composites with different backbone ionomers and in various cation forms,” Journal
of Applied Physics, Vol. 93, No. 9, pp. 5255—5267.
Nemat-Nasser, S. and Wu, Y., 2003b, “Comparative experimental study of ionic polymer
metal composites with different backbone ionomers and in various cation forms,” Journal
of Applied Physics, Vol. 93 (9), pp. 5255—5267.
Newbury, K. M. and Leo, D. J., 2002, “Electromechanical Modeling and Characterization
of Ionic Polymer Benders,” Journal of Intelligent Material Systems and Structures, Vol. 13,
No. 1, pp. 51—60.
125

Newbury, K. M. and Leo, D. J., 2003a, “Linear Electromechanical Model of Ionic Polymer
Transducers Part I: Model Development,” Journal of Intelligent Material Systems and
Structures, Vol. 14, No. 6, pp. 333—342.
Newbury, K. M. and Leo, D. J., 2003b, “Linear Electromechanical Model of Ionic Polymer
Transducers Part II: Experimental Validation,” Journal of Intelligent Material Systems
and Structures, Vol. 14, No. 6, pp. 343—358.
Oguro, K., Fujiwara, N., Asaka, K., Onishi, K., and Sewa, S., 1999, “Polymer electrolyte
actuator with gold electrodes,” in: Proceedings of the SPIE, Vol. 3669, pp. 63—71.
Oguro, K., Kawami, Y., and Takenaka, H., 1992, “Bending of an Ion-Conducting Polymer
Film-Electrode Composite by an Electric Stimulus at Low Voltage,” Journal of Microma-
chine Society, Vol. 5, pp. 27—30.
Osada, Y., Okuzaki, H., and Hori, H., 1992, “A polymer gel with electrically driven
motility,” Nature, Vol. 355, pp. 242—244.
Park, C., Ounaies, Z., Watson, K. A., Pawlowski, K., Lowther, S., Connell, J., Siochi, E.,
Harrison, J. S., and Clair, T. L. S., 2002a, “Polymer-Single Wall Carbon Nanotube Com-
posites for Potential Spacecraft Applications,” in: Materials Research Society Symposium
Proceedings, Vol. 706.
Park, C., Ounaies, Z., Watson, K. A., Pawlowski, K., Lowther, S. E., Connell, J. W.,
Siochi, E. J., Harrison, J. S., and Clair, T. L. S., 2002b, “Polymer-Single Wall Carbon
Nanotube Composites for Potential Spacecraft Applications,” in: Proceedings of Materials
Research Society Symposium, Vol. 706.
Pelrine, R., Kornbluh, R., Pei, Q., and Joseph, J., 2000, “High-Speed Electrically Actuated
Elastomers with Strain Greater Than 100%,” Science, Vol. 287, No. 5454, pp. 836—839.
Prasad, K. R. and Munichandraiah, N., 2002, “Fabrication and evaluation of 450 F elec-
trochemical redox supercapacitors using inexpensive and high-performance, polyaniline
coated, stainless-steel electrodes,” Journal of Power Sources, Vol. 112, pp. 443 451.
Sadeghipour, K., Salomon, R., and Neogi, S., 1992, “Development of a Novel Electrochem-
ically Active Membrane and Smart Material based Vibration Damper,” Smart Materials
and Structures, Vol. 1, pp. 3445—3447.
126
Shahinpoor, M., 1994, “Continuum Electromechanics of Ionic Polymeric Gels as Artificial
Muscles for Robotic Applications,” Smart Structures and Materials, Vol. 3, pp. 367—372.
Shahinpoor, M., Bar-Cohen, Y., Simpson, J., and Smith, J., 1998, “Ionic Polymer-Metal
Composites (IPMCs) as Biomimetic Sensors, Actuators and Artificial Muscles - a Review,”
Smart Materials and Structures, Vol. 7, No. 6, pp. R15—R30.
Shahinpoor, M. and Kim, K. J., 2002a, “Novel Ionic Polymer-metal composites equipped
with physically loaded particulate electrodes as biomimetic sensors, actuators and artificial
muscles,” Sensors and Actuators A, Vol. 96, pp. 125—132.
Shahinpoor, M. and Kim, K. J., 2002b, “A novel method of manufacturing three-
dimensional ionic polymer-metal composites (IPMCs) biomimetic sensors, actuators and
artificial muscles,” Polymer, Vol. 43, pp. 797—802.
Shahinpoor, M. and Kim, K. J., 2002c, “Solid-state soft actuator exhibiting large electro-
mechanical effect,” Applied Physics Letters, Vol. 80, No. 18, pp. 91—94.
Sparnaay, M., 1972, Vol. 4 of first edition, Pergamon Press(Australia) Pty. Ltd., Sydney.
Stauffer, D. and Aharony, A., 1992, Vol. 4, Taylor and Francis, London.
Stern, O., 1924, “Zur theorie der elektrolytischen doppelschicht,” Z Elektrochem, Vol. 30,
pp. 508 516.
Sugimoto, W., Kizaki, T., Yokoshima, K., Murakami, Y., and Takasu, Y., 2004, “Evalua-
tion of the pseudocapacitance in RuO2 with a RuO2/GC thin film electrode,” Electrochim-
ica Acta, Vol. 49, pp. 313 320.
Supriya, L., Akle, B. J., Leo, D. J., and O.Claus, R., 2005, “Assembly of Au Electrodes on
Polymeric Sensors and Actuators using a Poly(urethane urea) Linking Agent,” submitted
to the IEEE Sensors Journal.
Taegeun, N., Suk, T. Y., Jae-Do, N., Wook, J. J., Mo, K. H., Hyoukryeol, C., and Sik,
B. S., 2001, “Development of large-surface Nafion-metal composite actuator and its elec-
trochemical characterization,” in: Proceedings of the SPIE, Vol. 4329, pp. 458—465.
127

Tamagawa, H., Nogata, F., Watanabe, T., Abe, A., Yagasaki, K., and Jin, J. Y., 2003, “In-
fluence of metal plating treatment on the electric response of Nafion,” Journal of Materials
Science, Vol. 38, pp. 1039 1044.
von Helmholtz, H. L. F., 1853, “Ueber einige gesetze der vertheilung elektrischer strome
in korperlichen leitern mit anwendung auf die thierisch-elektrischen versuche,” Ann. Phys.
Chem., Vol. (Ser.1) 89, No. 4, pp. 211 233.
Wang, F., Hikner, M., Kim, Y., Zawodzinski, T., and McGrath, J., 2002, “Direct poly-
merization of sulfonated poly(arylene ether sulfone) random (statistical) copolymers: can-
didates for new proton exchange membranes,” J. Membr. Sci, Vol. 197, pp. 231—242.
Watanabe, M., Suzuki, M., Hirako, Y., Shirai, H., and Hirai, T., 2001, “Hysteresis in
Bending Electrostriction of Polyurethane Films,” Journal of Applied Polymer Science,
Vol. 79, pp. 1121— 1126.
Welch, P. D., 1967, “The Use of Fast Fourier Transform for the Estimation of Power
Spectra: A Method Based on Time Averaging Over Short, Modified Periodograms,” IEEE
Trans. Audio Electroacoustics, Vol. AU-15, pp. 70—73.
Wesley, F. J., 2003, “Electromechanical Modeling of Encapsulated Ionic Polymer Trans-
ducers,” Masters Thesis Virginia Tech.
Wiles, K., Bhanu, V., Wang, F., and J.E.McGrath, 2002, “Synthesis and Characteri-
zation of Poly(arylene sulfide sulfone) Copolymers as Candidates for Proton Exchange
Membranes,” Polymer Preprints, Vol. 43(2), pp. 993—994.
Wintersgill, M. C. and Fontanella, J. J., 1997, “Complex Impedance Measurements on
Nafion,” Electrochimica Acta, Vol. 43, pp. 1533—1538.
Zallen, R., 1983, Introduction To Percolation: A Model For All Seasons, Chap. 1, Annals
of the Israel Physical Society.
Zhang, Q. M., 1998, “Displacement properties of RAINBOW and THUNDER piezoelectric
actuators,” Sensors and Actuators A, Vol. 69, pp. 33—38.
128
Vita
Barbar J. Akle was born in Zgharta, Lebanon, on July 31, 1978. He received a BE
in Mechanical Engineering with distinction from the American University of Beirut
in 2001. After graduation he moved to Virginia Tech where he received a Master of
Science in June of 2003 and Doctoral degree in July 2005 both in Mechanical Engi-
neering under the supervision of Dr. Donald Leo in the Center for Intelligent Material
Systems and Structures. Recent research accomplishments include the development
of the Direct Assembly Process, characterization of extensional actuation in ionic
polymer transducers and enhancing their bending actuation response. Furthermore,
Barbar has studied their possible employment in applications such as flapping mecha-
nisms for micro air vehicles or as fluid shear sensors. Barbar has authored five journal
papers and more than fifteen conference proceedings presented at highly respected
conferences in the area of active materials. He is the receiver of the creative achieve-
ment award from the American University of Beirut in 2001. Barbar is currently
pursuing his work as a research scientist in the Center for Intelligent Material Sys-
tems and Structures. Other than the topics presented in this dissertation, his research
interests include biologicaly inspired systems and self healing structures.
Permanent Address: 300 Durham Hall
Blacksburg, VA 24061, USA
129

This dissertation was typeset with LATEX2ε1 by the author.
1LATEX2ε is an extension of LATEX. LATEX is a collection of macros for TEX. TEX is a trademarkof the American Mathematical Society. The macros used in formatting this dissertation were writtenby Greg Walker, Department of Mechanical Engineering, Virginia Tech.
130