a sub-pixel-based calculation of fire radiative power from modis observations: 1: algorithm...
TRANSCRIPT

Remote Sensing of Environment 129 (2013) 262–279
Contents lists available at SciVerse ScienceDirect
Remote Sensing of Environment
j ourna l homepage: www.e lsev ie r .com/ locate / rse
A sub-pixel-based calculation of fire radiative power from MODIS observations:1 Algorithm development and initial assessment
David Peterson a,⁎, Jun Wang a, Charles Ichoku b, Edward Hyer c, Vincent Ambrosia d
a University of Nebraska, Lincoln, Lincoln, NE 68588, USAb NASA Goddard Space Flight Center, 8800 Greenbelt Road, Greenbelt, MD 20771, USAc Naval Research Laboratory, 7 Grace Hopper Avenue, Monterey, CA 93940, USAd NASA-Ames Research Center, Mail Stop 245-4; Room 128, Moffett Field, CA 94035-0001, USA
⁎ Corresponding author at: University of Nebraska, LinAtmospheric Sciences, 130 Bessey Hall, Lincoln, NE 6858
E-mail addresses: [email protected] ((J. Wang), [email protected] (C. Ichoku), edwa(E. Hyer), [email protected] (V. Ambrosia).
0034-4257/$ – see front matter © 2012 Elsevier Inc. Allhttp://dx.doi.org/10.1016/j.rse.2012.10.036
a b s t r a c t
a r t i c l e i n f oArticle history:Received 4 December 2011Received in revised form 8 September 2012Accepted 26 October 2012Available online 11 December 2012
Keywords:FireWildfireBiomass burningFire radiative power (FRP)MODISFire areaFire temperatureSub-pixelFire detectionAirborne
Developed as a quantitative measurement of fire intensity, fire radiative power (FRP) and the potential applica-tions to smoke plume injection heights, are currently limited by the pixel resolution of a satellite sensor. As a re-sult, this study, the first in a two-part series, develops a new sub-pixel-based calculation of fire radiative power(FRPf) for fire pixels detected at 1 km2 nominal spatial resolution by the MODerate Resolution ImagingSpectroradiometer (MODIS) fire detection algorithm (collection 5), which is subsequently applied to severallarge wildfire events in California. The methodology stems from the heritage of earlier bi-spectral retrievals ofsub-pixel fire area and temperature. However, in the current investigation, a radiative transfermodel is incorpo-rated to remove solar effects and account for atmospheric effects as a function of Earth-satellite geometry at 3.96and 11 μm (MODIS fire detection channels). The retrieved sub-pixel fire (flaming) area is assessed via the mul-tispectral, high-resolution data (3–50 m) obtained from the Autonomous Modular Sensor (AMS), flown aboardtheNASA Ikhana unmanned aircraft.Withfire sizes ranging from0.001 to 0.02 km2, pixel-level fire area compar-isons between MODIS and AMS are highly variable, regardless of the viewing zenith angle, and show a low biaswith amodest correlation (R=0.59). However, when lower confidence fire pixels and point-spread-function ef-fects (fire hot spots on the pixel edge) are removed, the correlation becomes much stronger (R=0.84) and thevariability betweenMODIS and AMS is reduced. To account for these random errors via averaging, two clusteringtechniques are employed and the resulting AMS and MODIS comparisons of fire area, after correcting foroverlappingMODIS pixels, are evenmore encouraging (R=0.91). Drawing from the retrieved fire area and tem-perature, the FRPf is calculated and compared to the currentMODIS pixel area-based FRP.While the twomethodsare strongly correlated (R=0.93), the FRPf, in combination with retrieved fire cluster area, allows a large fireburning at a low intensity to be separated from a small fire burning at a high intensity. Similarly, the flux ofFRPf over the retrieved fire area can be calculated, allowing for improved estimates of smoke plume injectionheights in modeling studies and creating potential applications for the future VIIRS and GOES-R fire detectionalgorithms.
© 2012 Elsevier Inc. All rights reserved.
1. Introduction
Observed in many regions of the globe, biomass burning is a keycomponent to the Earth-atmosphere system, climate change, and oper-ational forecasts of meteorology and air quality. Individual fires are ig-nited by natural causes, such as lightning strikes (e.g. Peterson et al.,2010) and anthropogenic causes, such as agriculture and forest clearing(e.g. Koren et al., 2007; van der Werf et al., 2008). Regardless of cause,these fires subsequently burn large tracts of land across the globe
coln, Department of Earth and8, USA. Tel.: +1 219 742 2613.D. Peterson), [email protected]@nrlmry.navy.mil
rights reserved.
every year. For example, Roy et al. (2008) estimated that nearly 3.7mil-lion square kilometers burned globally from July 2001 to June 2002.Wildfires also create concerns for air quality by releasing enormousamounts of aerosols and trace gases into the atmosphere (e.g. Jordanet al., 2008; Spracklen et al., 2007). Above the boundary layer, smokeparticles can be transported thousands of miles (e.g. Duck et al., 2007;Sapkota et al., 2005) creating health concerns and interacting with me-teorological processes a great distance from a fire (e.g. Wang et al.,2006). In some cases, wildfires can even generate pyroconvection,which has been shown to inject smoke aerosols and trace gasses intothe upper troposphere and even into the stratosphere (Fromm et al.,2010). In addition, deposition of fire-generated black carbon particleson ice sheets has been shown to reduce the surface albedo causing at-mospheric warming and increased melting (Kopacz et al., 2011;Randerson et al., 2006).

263D. Peterson et al. / Remote Sensing of Environment 129 (2013) 262–279
Over the past three decades, several satellite sensors have beenable to provide observations of fire locations at different spatialscales and temporal frequencies. These include the NOAA AdvancedVery High Radiometer (AVHRR), Geostationary Orbiting Environ-mental Satellite (GOES), Advanced Spaceborne Thermal Emissionand Reflection Radiometer (ASTER), and the MODerate ResolutionImaging Spectroradiometer (MODIS). Some of these sensors alsomap burned areas. Among these sensors, MODIS is especially importantbecause (1)MODIS has the highest saturation temperature of ~500 K atits 4 μm fire detection channel (Gao et al., 2007; Justice et al., 2002;Kelha et al., 2003), which allows a high percentage of detected fires tobe characterized through fire radiative power (FRP) — a quantitativemeasure of fire intensity (Kaufman et al., 1998a), and (2) the twinMODIS sensors aboard the Terra (launched in 1999) and Aqua(launched in 2002) satellites allow wildfires to be observed globallyup to four times each day; twice in the daytime and twice at night.
Even though a large region may be burned by a fire over its lifetime,only a portion of the burn area is actually in flames (fire front) at anygiven observation time (Kaufman et al., 1998a; Lee & Tag, 1990). De-spite much advancement in fire remote sensing during the last coupleof decades, all satellite sensors, including MODIS, provide fire locationsas pixels that are flagged as containing fires. Unfortunately, the pixelresolution is usually too coarse to resolve the size of small fire hotspots that may be very intense relative to large but low-intensity fires.In fact, recent research indicates that FRP can be used as a quantitativeindicator for fire intensity and is proportional to both the fire's fuel con-sumption and smoke emission rates (e.g. Ichoku et al., 2008a, 2008b;Ichoku & Kaufman, 2005; Jordan et al., 2008; Roberts et al., 2009,2005; Wooster, 2002, Wooster et al., 2003, 2005). Direct derivation ofsmoke emission from satellite-based FRP can overcome the spatial er-rors in the traditional estimate of fire emission in which the variationof land surface types within the sensor pixel plays an important role(Hyer & Reid, 2009). Val Martin et al. (2010) further show that regionsof intense burning (high FRP) commonly result in higher altitude smokeplumes and a greater chance of smoke transport into the free tropo-sphere. However, similar to fire detections, the primary drawback forcurrent MODIS FRP data is that they are estimates of fire radiativepower released over a pixel area. In reality, it is the rate of energy re-lease over the fire area (the fire intensity (Byram, 1959)) that is directlyrelated to the thermal buoyancy (Kahn et al., 2007; Lavoue et al., 2000),which influences the smoke injection height and the transport of smokeplumes into the free troposphere. Therefore, an accurate retrieval of fireintensity would be a valuable addition to the current suite of satellitefire products.
Many early studies could not validate the results of sub-pixel re-trievals due to the dearth of suitable data sources (e.g. Dozier, 1981).However, multispectral, high-resolution data (3–50 m), obtained fromthe airborne Autonomous Modular Sensor (AMS) are now availablefor numerous fire events in the western United States (e.g. Ambrosia&Wegener, 2009). Inmany cases, the AMS flight scan can be spatiotem-porally collocated with MODIS scenes (Fig. 1), allowing for an unprece-dented representation of the flaming, smoldering, and backgroundregions within a given MODIS fire pixel. By using the collocateddata, a quantitative assessment of a MODIS sub-pixel retrieval offire information can be conducted for multiple fire events in variousbiomes. The AMS data can also be used to validate background tem-peratures and to isolate the various sources of error known to affectsub-pixel retrievals.
As shown in several studies (e.g. Giglio & Kendall, 2001), many vari-ables must be considered when developing and assessing the accuracyof a sub-pixel fire retrieval. Therefore, this study is the first in atwo-part series, and focuses primarily on: (1) developing an algorithmto retrieve sub-pixel fire information for MODIS with atmospheric anddaytime solar effects taken into consideration, (2) demonstrating theusefulness of an AMS-derived fire (hot spot) detection algorithm to as-sess the results of the sub-pixelfire area fromMODIS and (3) calculating
the sub-pixel-based FRP. Subsequent sections of this paper describethe current MODIS FRP, the need for a sub-pixel retrieval in the con-text of FRP calculations, the history of sub-pixel retrieval methodol-ogies, and the specifics of a modified MODIS sub-pixel retrievalmethodology. Results are shown from the comparison of MODIS re-trieval fire area with AMS observations and comparisons betweenthe MODIS and sub-pixel-based FRP for several fire events occurringbetween August and October 2007. A detailed theoretical sensitivityanalysis of the sub-pixel retrieval algorithm's uncertainty, includinga case study application, will be presented in part 2 of this series.
2. The need and method for a sub-pixel-based calculation of FRP
In contrast to earlier sensors, MODIS is currently the only opera-tional satellite sensor designed to specifically measure FRP globally(e.g. Ichoku et al., 2008a; Kaufman et al., 1998a, 1998b). Prior toMODIS collection 5 data, the MODIS fire detection algorithm retrievedFRP with respect to the individual pixel areas, or in units of Watts perpixel area (Kaufman et al., 1998a). In collection 5, FRP is multiplied bythe pixel area (FRPp), and is provided in units ofMegawatts. Specifically,the FRPp calculation employs a best-fit equation for awide variety offiresimulations and is calculated for all fire pixels (top-of-atmosphere)using only the 4 μm channels:
FRPp ¼ 4:34� 10−19 T84−T84b� �
Ap ð1Þ
where T4b is the background brightness temperature (in K), T4 is thebrightness temperature of the fire pixel, and Ap is the area of the pixel(Giglio, 2010; Kaufman et al., 1998a, 1998b, 2003). Therefore, FRPp incollection 5 is a function of satellite viewing zenith angle. Regardlessof the version of data collections, FRPp can be used for estimating thetotal radiation from the fire, and consequently, can be related to thetotal amount of trace gases and particles emitted by the fire, which isuseful for mesoscale modeling with a large model grid (e.g. Wang etal., 2006). In addition, FRPp is being used for near real-time emissionmaps at a global scale (Kaiser et al., 2009).
While the use of FRPp for estimating the fire emissions is well recog-nized (Vermote et al., 2009), its potential use for other applications,such as estimating smoke injection heights and fire intensity, is limitedby the lack of sub-pixel information for fires (Eckmann et al., 2010). Thiscan beunderstood via a simple example inwhich the FRPp value is equalfor two pixels covering the same area, but containing different burningscenarios: (1) a large fire with burning at a low intensity or (2) a smallfire burning at a high intensity. Not surprisingly, a large difference in firebehavior and the thermal buoyancy to drive the rise of smoke plumescan be expected between (1) and (2). However, it will not be discern-able in the current MODIS FRPp product unless sub-pixel informationof fire area and temperature is retrieved.
In contrast to the current MODIS FRPp calculation (Eq. 1), retrievedsub-pixel data would allow for a direct fire area and temperature-basedcalculation of FRP for each sub-pixel fire (FRPf). Similar to Zhukov et al.(2006), the FRPf equation (units of Megawatts, above the mean back-ground) uses the Stefan–Boltzmann relationship in the 4 μm channel
FRPf ¼ σ T4f −T
44b
� �Af ð2Þ
whereσ is the Stefan–Boltzmann constant (5.6704×10⁻⁸ W m−2 K−4),Tf is the retrieved kinetic fire temperature at the surface (not thepixel temperature), T4b is the background brightness temperature,and Af is the retrieved fire area. At cool 4 μm temperatures, atmo-spheric effects, especially from water vapor content, are minor,which allows T4b to be used as an approximation of surface kineticbackground temperature (Kaufman et al., 1998a, also explored inpart 2 of this series). While each FRP method is different for thesame fire, the FRPf (fire area and temperature-based FRP), in theory,
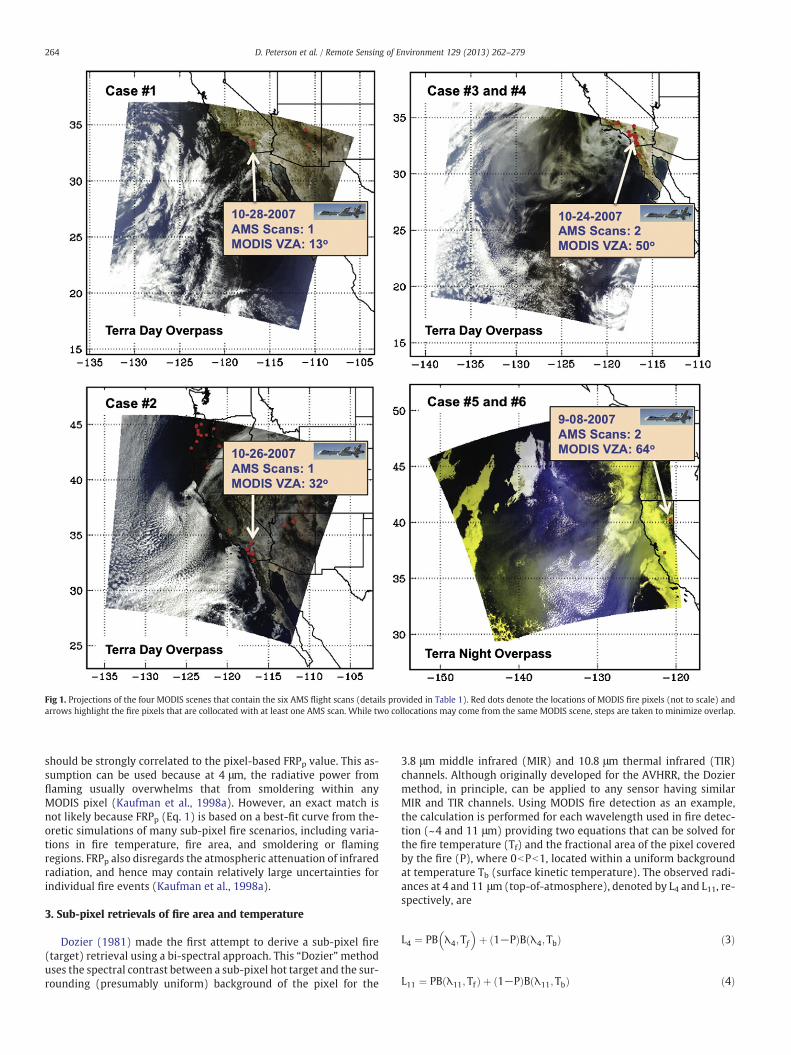
Fig 1. Projections of the four MODIS scenes that contain the six AMS flight scans (details provided in Table 1). Red dots denote the locations of MODIS fire pixels (not to scale) andarrows highlight the fire pixels that are collocated with at least one AMS scan. While two collocations may come from the same MODIS scene, steps are taken to minimize overlap.
264 D. Peterson et al. / Remote Sensing of Environment 129 (2013) 262–279
should be strongly correlated to the pixel-based FRPp value. This as-sumption can be used because at 4 μm, the radiative power fromflaming usually overwhelms that from smoldering within anyMODIS pixel (Kaufman et al., 1998a). However, an exact match isnot likely because FRPp (Eq. 1) is based on a best-fit curve from the-oretic simulations of many sub-pixel fire scenarios, including varia-tions in fire temperature, fire area, and smoldering or flamingregions. FRPp also disregards the atmospheric attenuation of infraredradiation, and hence may contain relatively large uncertainties forindividual fire events (Kaufman et al., 1998a).
3. Sub-pixel retrievals of fire area and temperature
Dozier (1981) made the first attempt to derive a sub-pixel fire(target) retrieval using a bi-spectral approach. This “Dozier”methoduses the spectral contrast between a sub-pixel hot target and the sur-rounding (presumably uniform) background of the pixel for the
3.8 μm middle infrared (MIR) and 10.8 μm thermal infrared (TIR)channels. Although originally developed for the AVHRR, the Doziermethod, in principle, can be applied to any sensor having similarMIR and TIR channels. Using MODIS fire detection as an example,the calculation is performed for each wavelength used in fire detec-tion (~4 and 11 μm) providing two equations that can be solved forthe fire temperature (Tf) and the fractional area of the pixel coveredby the fire (P), where 0bPb1, located within a uniform backgroundat temperature Tb (surface kinetic temperature). The observed radi-ances at 4 and 11 μm (top-of-atmosphere), denoted by L4 and L11, re-spectively, are
L4 ¼ PB λ4;Tf� �
þ 1−Pð ÞB λ4;Tbð Þ ð3Þ
L11 ¼ PB λ11; Tfð Þ þ 1−Pð ÞB λ11;Tbð Þ ð4Þ

265D. Peterson et al. / Remote Sensing of Environment 129 (2013) 262–279
where B(λ,T) is the Planck function and Tb is estimated from a temper-ature dataset. The fire (hot target) and background are assumed to beblackbodies with unit emissivity in both channels (Giglio & Kendall,2001). In addition, all atmospheric effects are neglected, allowing thecomputation of B(λ,T) to be considered a top-of-atmosphere value.With these assumptions, the surface kinetic temperatures, Tf and Tb,can be considered as brightness temperatures and can be used forboth channels; otherwise Eqs. (3) and (4) are not valid.
Due to the small size of sub-pixel fires and the lack of high spatialand high thermal resolution data, the original Dozier retrieval is hardto validate. Nevertheless, it was applied to several satellite sensors be-tween 1981 and 2000 (e.g. Flannigan & Vonder Haar, 1986; Green,1996; Langaas, 1993; Matson & Dozier, 1981; Prins & Menzel, 1992;Riggan et al., 1993), and an extensive historical review from this periodcan be found in Giglio and Kendall (2001). The following sections high-light themodifications to the Doziermethod over the last decadewith afocus on the uncertainty analysis and challenges for validation. This issubsequently followed by the description of the sub-pixel implementa-tion and initial assessment specific to this study.
3.1. Previous modifications and analysis of sub-pixel retrievals
Not surprisingly, the assumptions used in the original Dozier re-trieval can be unrealistic. For example, atmospheric effects, such aswater vapor content, undoubtedly have a major impact on the re-trieval, and the fire and background are not blackbodies. Therefore,to create a more realistic retrieval, several studies modified the re-trieval by adding relevant terms to the equations (e.g. (Giglio &Kendall, 2001; Prins & Menzel, 1992). With these modifications,the observed radiances at 4 and 11 μm, respectively, are
L4 ¼ τ4 PB λ4; Tfð Þ þ e4b 1−Pð ÞB λ4;Tbð Þ þ 1−Pð Þ 1−e4bð ÞI4ref½ � ð5Þ
L11 ¼ τ11 PB λ11;Tfð Þ þ e11b 1−Pð ÞB λ11; Tbð Þ½ � ð6Þ
where e4b and e11b respectively denote the background emissivity at4 and 11 μm, I4ref is the reflected solar radiance in the 4 μm channelat the surface (equal to zero at night), and τ4 and τ11 are the upwardMIR atmospheric transmittance and the upward TIR atmospherictransmittance, respectively. The relationships in Eqs. (5) and (6)contain several unknowns, and therefore require the aid of a radia-tive transfer model. The emissivity of the fire is commonly assumedto be equal to one (e.g. Giglio & Kendall, 2001), which has beenshown to be a reasonable assumption for most fire events withthick fire fronts. As a result, Eqs. (5) and (6) do not include emissivityin the fire term.
By assuming identical surface and atmospheric conditions, theMODIS fire product estimates background brightness temperatures(or radiances at the top-of-atmosphere) for the 4 and 11 μm chan-nels by averaging several neighboring, fire-free pixels (Giglio et al.,2003; Justice et al., 2002). These background radiances, denoted byL4b and L11b, can be expressed respectively, as
L4b ¼ τ4 e4bB λ4; Tbð Þ þ 1−e4bð ÞI4ref½ � ð7Þ
L11b ¼ τ11e11bB λ11;Tbð Þ: ð8Þ
Substituting Eqs. (7) and (8) into Eqs. (5) and (6) will create a sim-plified version of Eqs. (5) and (6), where P and Tf are the only unknownvariables. Therefore, fire fraction and fire temperature can be retrievedsimultaneously from a combined use of the MODIS-observed back-ground and fire pixel radiances.
Even with improved calculations, two distinct hindrances to theDozier retrieval have become obvious: (1) the validation difficulty and(2) the potential sources for error in the retrieval. For proper validation,the sensor providing the ‘ground truth’ must do so at a relatively finespatial resolution and the observation time must be very close to that
of the satellite sensor under scrutiny. Unfortunately, such measure-ments are typically not available in sufficient quantities to accomplisha significantly representative validation. While the validation issuesare relatively straight forward, understanding the potential for error ismuch more complex. Sources of error may include band-to-bandcoregistration issues, improper selection of background temperatureand atmospheric transmittance, instrument noise, varying sub-pixelproportions of flaming, smoldering, and unburned areas, the solar con-tribution to the MIR, and the variation of surface emissivity betweenMIR and thermal IR, etc. (e.g. Giglio & Kendall, 2001; Giglio et al.,1999; Giglio & Justice, 2003; Shephard & Kennelly, 2003).
Due to the small size of thefire in comparison to the pixel, the poten-tial impact from the 4 and 11 μmpoint-spread-functions (PSFs), includ-ing their coregistration, becomes a critical (and potentially the mostimportant) source of error for a bi-spectral retrieval, regardless of satel-lite sensor. For example, Calle et al. (2009) showed that the fire pixelbrightness temperature, for a given sub-pixel fire size and temperature,will greatly decrease when the sub-pixel fire is located near the edge ofthe pixel, and increase for fires near the pixel center. Additionally, the 4and 11 μm PSFs may deviate near the pixel edge (misregistration),thereby increasing the potential error in retrieved fire area and temper-ature in these cases. Daytime solar reflection in the MIR channel canalso have an impact on sub-pixel retrievals. Specifically, Li et al.(2001) showed that the contribution of reflected solar radiation in theAVHRR MIR channel increases as the surface temperature decreases.The solar contribution was also found to be highly dependent on thesolar geometry and surface albedo. When considering the potentialerror sources (aside from coregistration), Giglio and Kendall (2001)found that the Dozier retrieval is possible when the fraction of thepixel encompassed by fire is greater than ~0.005 (0.003 for MODIS).Above this threshold, random retrieval errors will be within 50% and100 K, at one standard deviation, for fire fractional area and tempera-ture, respectively. However, uncertainties increase rapidly below thethreshold.
Despite the potential for error, several advances have been made tosub-pixel retrievals over the past decade. One example is the Bi-SpectralInfrared Detection (BIRD) small satellite mission (operational from2001–2004). The BIRD satellite had a pixel size of 185 m, saturationtemperature of ~600 K, andMIR and TIR channels of 3.8 and 8.8 μm, re-spectively (Zhukov et al., 2006). In contrast to MODIS, the BIRD fire de-tection algorithm specifically included a component for a modifiedDozier retrieval. To avoid the potential error sources, especiallycoregistration errors, the BIRD algorithm created pixel clusters usingany adjacent hotspot pixels (Wooster et al., 2003; Zhukov et al., 2005,2006). Themodified Dozier retrieval was then performed on these clus-ters rather than individual pixels. Ground validation tests for controlledfires were performed (e.g. Oertel et al., 2004; Zhukov et al., 2005), butdetailed assessments of wildfires, using higher resolution sensors,were not undertaken.
In recent years, a modified approach, using multiple endmemberspectral mixture analysis (MESMA) to retrieve sub-pixel fire proper-ties, has been developed (Dennison et al., 2006; Eckmann et al., 2008,2009, 2010). MESMA assumes that the radiative signature of eachpixel is a result of a linear combination of sub-pixel features (orendmembers), and thus the radiances at multiple channels can beused to disentangle the area fraction of each end-member (such asfire and non-fire) provided that the number of channels is largerthan the number of sub-pixel features to be retrieved. The originalmethod was used for classification of land surface type. In thatcase, a finite number of endmembers, each having unique land sur-face characteristics, was incorporated into the analysis. However,the application to wildfires is not straightforward because the num-ber of fire classes can be infinite. Nevertheless, Eckmann et al. (2008,2009, 2010) produced fire endmembers for a variety of temperaturesover a variety of wavelengths. Therefore, the MESMA retrieval is es-sentially a Dozier retrieval over a variety of wavelengths instead of

266 D. Peterson et al. / Remote Sensing of Environment 129 (2013) 262–279
two channels. Results from the MESMA and Dozier-type retrievalshave been compared, but neither retrieval method could be shownto be superior with available validation data (Eckmann et al., 2009).
3.2. Developing a sub-pixel retrieval for MODIS
Since MODIS data became available from Terra in February of2000, few attempts have been made to implement a MODISsub-pixel retrieval, which is likely a result of the potential for error,especially from atmospheric effects (Giglio & Kendall, 2001). In thisstudy, output from the Santa Barbara DISORT Atmospheric RadiativeTransfer (SBDART) model is used to provide a representation of at-mospheric effects prior to the calculation step, which avoids creatingadditional terms for atmospheric transmittance (as in Eqs. 5 and 6).SBDART considers many processes known to affect the ultravioletthrough the infrared wavelengths allowing for detailed computationsof plane-parallel radiative transfer within the Earth's atmosphere andat the surface (Ricchiazzi et al., 1998). Therefore, SBDART also includesthe solar reflectivity term (I4ref) in Eqs. (5) and (6). Based on previousstudies, e4b and e11b are assumed to be respectively equal to 0.95 and0.97 (e.g. (Giglio et al., 1999; Petitcolin & Vermote, 2002; Tang et al.,2009), which is true for relatively dense, green vegetation, such as thetemperate evergreen forests used in this study. With this configurationand by including the MODIS spectral response function, SBDART isready to incorporate all terms in Eqs. (5) and (6) to simulate theMODIS observation at its two fire detection channels (3.96 and11.0 μm).
As a preliminary step, SBDART is run repeatedly for differentcombinations of the possible geometry values, background tempera-tures, and sub-pixel fire temperatures, and the output results aresaved together with the input parameters as a lookup table at 4and 11 μm. The input temperature values are the kinetic tempera-tures (not brightness temperatures) at the bottom of the atmosphereand range from the lower limits for a background temperature(277 K) to the upper limit for a sub-pixel fire (1500 K). Due to the loca-tion and time of the events used in this study (Fig. 1), the atmosphericprofile is assumed to be a representative mid-latitude summer profile,which includes 2.9 g/cm2 of water vapor in the atmospheric column.However, the sensitivity to variations in the atmospheric profile is ex-amined in the second part of this study. The final SBDART output allowsa lookup table, containing input surface temperature, solar zenith, view-ing zenith, and relative azimuth angles, to be created as a function oftop-of-atmosphere radiance. Once complete, these lookup tables arereferenced repeatedly in the main retrieval process.
The actual retrieval, which is summarized in Fig. 2, implements thelookup tables to aid in solving Eqs. (5) and (6) for each MODIS firepixel in any given MODIS scene (granule). However, the non-linearequations require the use of a multistep, iterative process to obtainfire area fraction and temperature. To begin, the observedMODIS geom-etries and the first input temperature arematched to the lookup table toobtain the top-of-atmosphere radiance of the pixel containing the fire.The algorithm then continues to cycle through all input temperatures(e.g. potential fire temperatures) and calculates the fire fraction usinga variation of the method developed by Shephard and Kennelly(2003). A residual calculation is used to keep track of the fire tempera-ture and area fraction corresponding to the best fit in the observed radi-ances for the 4 and 11 μm channels, and the final fire temperature andarea fraction are selected based on the lowest residual.
Drawing from the BIRD satellite methodology, two clusteringmethods are implemented to alleviate random errors within thepixel-level retrievals. The first is a general summation method, whereeach individual pixel-level retrieved fire area is summed to obtain thearea of an entire fire event. The second clusteringmethod is a single re-trieval (via averaging), which performs a single retrieval for all MODISfire pixels corresponding to a given fire cluster. In this case, thesub-pixel calculations use the mean geometry values, mean pixel
temperatures, and mean background temperatures of the fire pixelcluster. Following these pixel and cluster-level calculations, FRPf is cal-culated via Eq. (2). Therefore, there are threemajor outputs from the re-trieval at both the pixel and cluster-levels: fire area, fire temperature,and FRPf. As mentioned in Section 3.1, specific sources of error canstem from indirect effects (e.g. PSF coregistration) to direct effects ofbackground temperature, surface emissivity, and water vapor, etc.Section 6 of this paper examines the uncertainties from indirect errorsources, while a detailed examination of sensitivity to direct errorsources is left for the second part of this study.
4. MODIS and AMS data, their collocation, and pixeloverlap corrections
MODIS sub-pixel fire information is retrieved from an integrated useof the following three data products, either from MODIS/Terra orMODIS/Aqua, at a spatial resolution of 1 km2 at nadir: (1) level 1B radi-ance data (MOD021KM/MYD021KM), (2) geolocation data (MOD03/MYD03), and (3) level 2, collection 5 fire product data (MOD14/MYD14). Data sources (1) and (2) are used to provide the radiance ofthe entire pixel and all relevant geometry information, such as solar ze-nith (SZA), relative azimuth (RAZ) and viewing zenith (VZA) angles(e.g. Wolfe et al., 2002), while the fire product (3) provides informationon fire locations, background temperature, and FRPp. The sub-pixel re-trieval is only applied to the pixels that are flagged as fire pixels bythe standard MODIS fire product (3).
4.1. MODIS fire products: fire detection and FRPp
MODIS is unparalleled in fire detection because of its ability to differ-entiate a wide range of fire intensities, as a result of the synergy be-tween its two 4 μm (more precisely 3.96 μm) channels whosedynamic ranges are complementary (Justice et al., 2002). Fire pixelsare retrieved using a hybrid, contextual process, which includes abso-lute and relative detection pathways. For absolute detection, a set ofthresholds for reflectance at 0.86 μm and brightness temperature atthe 4 μm and 11 μm infrared channels are used. The reflectance valuesof the 0.86 um channel are employed to reduce the “false-positive” ef-fects of bright reflective surfaces and sun glint characteristics in agiven scene that contains a mix of fire and those non-fire, highly reflec-tive surface features. The brightness temperature thresholds at the4 μm and 11 μm infrared channels are used to identify potential firepixels (Giglio et al., 2003; Justice et al., 2002). The relative detectioncheck is then incorporated to compare a pixel's spectral signature tosurrounding background pixels. Finally, both checks are combined (asa Boolean union) to classify a potential pixel as a real fire pixel. TheMODIS FRPp (collection 5) is subsequently calculated for all fire pixelsvia Eq. (1). The higher saturation temperatures of MODIS allow for thederivation of FRPp for nearly every fire it detects, because 1 km2 pixelswith T4>500 K seldom occur in nature (Ichoku et al., 2008a).
The major caveats of the MODIS fire products are sun glint, coastalfalse alarms (water reflectance), and clouds that may hamper the firedetection. These non-idealities are accounted for by applying watermasks and cloud masks in the fire detection algorithm (Giglio et al.,2003; Kaufman et al., 1998a). Using 30 m validation data (from ASTERand ETM+), Schroeder et al. (2008) show that the probability of detec-tion approaches 80% when the number of 30 m fire pixels (containedwithin a MODIS fire pixel) approaches 75. The smallest detectable firesize in any given MODIS fire pixel was found to be ~100 m2 (Giglio etal., 2003). Though hard to validate directly and globally, MODIS FRPpwas found to be in fair agreement with FRPp measurements by othersensors in several sub-global spatial domains (Ichoku et al., 2008a;Roberts et al., 2005; Wooster et al., 2003). The FRPp detection limitsare about 9 and 11 MW for Terra and Aqua, respectively (Schroeder etal., 2010).

Fig. 2. Flowchart illustrating the MODIS sub-pixel retrieval and the subsequent calculation of FRPf.
267D. Peterson et al. / Remote Sensing of Environment 129 (2013) 262–279
4.2. Autonomous Modular Sensor (AMS) observations
The AMS, flown aboard the NASA Ikhana Unmanned AirborneSystem (UAS) and additional piloted aircraft, provides the high-resolution data for the initial assessment of the MODIS sub-pixel re-trieval. The AMS was put into operations in 2005 and offers pertinentspectral measurement capabilities, such as derivation of fire size, tem-perature, and serves as a potential airborne, higher spatial resolutionFRP validation sensor. Both NASA and the United States Forest Service(USFS) have collaborated on the use of the AMS for supporting wildfireobservations. The Ikhana UAS performance characteristics allow mis-sion profiles that can extend from the Mexican border in the south tothe Canadian border in the north and from the Pacific Ocean in thewest to the Rocky Mountains in the east when operating out of itshome base at NASA-Dryden Flight Research Center, Edwards, California(Ambrosia et al., 2011b; Ambrosia & Wegener, 2009). In addition, theIkhana is capable of supporting day and night operations with a~24 hour endurance, 150–200 knots airspeed, ~13,720 m (45,000 ft)altitude, and flight legs of over 7408 km (4000 nautical miles). A pilotlocated at a ground control station remotely controls the Ikhana. Pilotedoperations on various aircraft (Beechcraft B200 King-Air, etc.) have alsobeen accomplished, though with shorter flight profile capabilities.
The AMS spatial resolution is controlled by the platform altitudeand commonly falls in a range from 3 to 50 m. The total field ofview (FOV) can be set at 43° or 86°, and the instantaneous field ofview (IFOV) can be set at 1.25 mrad or 2.5 mrad (Ambrosia &Wegener, 2009). Both the FOV and IFOV are user selectable basedon the mission requirements. For example, an altitude of 7011 m(23,000 ft) Above Ground Level (AGL), with a 2.5 mrad IFOV wouldprovide a spatial resolution of 15 m (Ambrosia & Wegener, 2009).
The AMS is a multispectral instrument with 12 spectral channels inthe visible through thermal-infrared (Ambrosia et al., 2011a, 2011b).Fire hot spots are detected near 4 and 11 μm using AMS channel 11(3.75 μm) and channel 12 (10.76 μm) (Ambrosia et al., 2011b;Ambrosia & Wegener, 2009). Originally applied to AVHRR imagery (Liet al., 2000b), the AMS fire detection algorithm is based on that devel-oped by the Canadian Center for Remote Sensing (CCRS) and providesgeneral hot spot information for each AMS scan (Cahoon et al., 1992;Flasse & Ceccato, 1996; Li et al., 2000a, 2000b, 2001).
In this study, a separate AMS fire detection algorithm, developedspecifically for an initial assessment, is used to identify the individualflaming regions within a given MODIS fire pixel (see Section 5). Thisnewalgorithm is based on the unique challenges encounteredwhen ap-plying the AMS to obtain the precise area of a sub-pixel fire. For exam-ple, changes in flight altitude and surface topography can affect theAMSbackground temperature and fire detection thresholds within a scan orfrom scan-to-scan. Therefore, in the initial assessment algorithm, eachthreshold is image-based and allowed to vary within the boundariesof each MODIS fire pixel. The AMS data collected in 2007 are saturatedin the 4 μm channel, with saturation temperatures varying from 510to 530 K, depending on the flight characteristics. At spatial resolutionsof 50 m or better, this saturation level means that many fire pixels aresaturated, which precludes fire temperature or FRP investigationsusing these data. Approximations of fire temperature can also beachieved using the unsaturated 11 μm channel, but limitations are in-troduced due to the lower sensitivity at higher temperatures. TheAMS engineering team is currently exploringmodifications to the scan-ner, which would allow a large increase in the measured pixel temper-atures of the ~4 μm channel, thereby facilitating an increasedprobability of accurately determining fire pixel FRP estimates.
268 D. Peterson et al. / Remote Sensing of Environment 129 (2013) 262–279
4.3. AMS and MODIS collocation
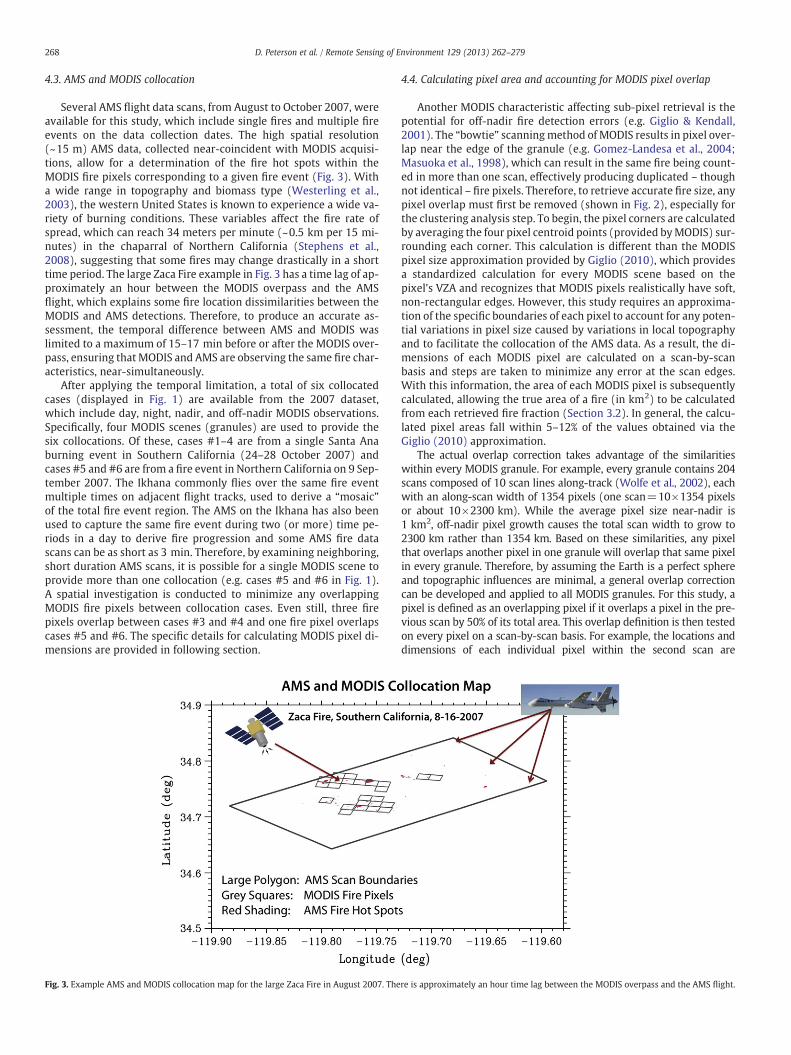
Several AMS flight data scans, from August to October 2007, wereavailable for this study, which include single fires and multiple fireevents on the data collection dates. The high spatial resolution(~15 m) AMS data, collected near-coincident with MODIS acquisi-tions, allow for a determination of the fire hot spots within theMODIS fire pixels corresponding to a given fire event (Fig. 3). Witha wide range in topography and biomass type (Westerling et al.,2003), the western United States is known to experience a wide va-riety of burning conditions. These variables affect the fire rate ofspread, which can reach 34 meters per minute (~0.5 km per 15 mi-nutes) in the chaparral of Northern California (Stephens et al.,2008), suggesting that some fires may change drastically in a shorttime period. The large Zaca Fire example in Fig. 3 has a time lag of ap-proximately an hour between the MODIS overpass and the AMSflight, which explains some fire location dissimilarities between theMODIS and AMS detections. Therefore, to produce an accurate as-sessment, the temporal difference between AMS and MODIS waslimited to a maximum of 15–17 min before or after the MODIS over-pass, ensuring that MODIS and AMS are observing the same fire char-acteristics, near-simultaneously.
After applying the temporal limitation, a total of six collocatedcases (displayed in Fig. 1) are available from the 2007 dataset,which include day, night, nadir, and off-nadir MODIS observations.Specifically, four MODIS scenes (granules) are used to provide thesix collocations. Of these, cases #1–4 are from a single Santa Anaburning event in Southern California (24–28 October 2007) andcases #5 and #6 are from a fire event in Northern California on 9 Sep-tember 2007. The Ikhana commonly flies over the same fire eventmultiple times on adjacent flight tracks, used to derive a “mosaic”of the total fire event region. The AMS on the Ikhana has also beenused to capture the same fire event during two (or more) time pe-riods in a day to derive fire progression and some AMS fire datascans can be as short as 3 min. Therefore, by examining neighboring,short duration AMS scans, it is possible for a single MODIS scene toprovide more than one collocation (e.g. cases #5 and #6 in Fig. 1).A spatial investigation is conducted to minimize any overlappingMODIS fire pixels between collocation cases. Even still, three firepixels overlap between cases #3 and #4 and one fire pixel overlapscases #5 and #6. The specific details for calculating MODIS pixel di-mensions are provided in following section.
Fig. 3. Example AMS and MODIS collocation map for the large Zaca Fire in August 2007. The
4.4. Calculating pixel area and accounting for MODIS pixel overlap
Another MODIS characteristic affecting sub-pixel retrieval is thepotential for off-nadir fire detection errors (e.g. Giglio & Kendall,2001). The “bowtie” scanningmethod of MODIS results in pixel over-lap near the edge of the granule (e.g. Gomez-Landesa et al., 2004;Masuoka et al., 1998), which can result in the same fire being count-ed in more than one scan, effectively producing duplicated – thoughnot identical – fire pixels. Therefore, to retrieve accurate fire size, anypixel overlap must first be removed (shown in Fig. 2), especially forthe clustering analysis step. To begin, the pixel corners are calculatedby averaging the four pixel centroid points (provided byMODIS) sur-rounding each corner. This calculation is different than the MODISpixel size approximation provided by Giglio (2010), which providesa standardized calculation for every MODIS scene based on thepixel's VZA and recognizes that MODIS pixels realistically have soft,non-rectangular edges. However, this study requires an approxima-tion of the specific boundaries of each pixel to account for any poten-tial variations in pixel size caused by variations in local topographyand to facilitate the collocation of the AMS data. As a result, the di-mensions of each MODIS pixel are calculated on a scan-by-scanbasis and steps are taken to minimize any error at the scan edges.With this information, the area of each MODIS pixel is subsequentlycalculated, allowing the true area of a fire (in km2) to be calculatedfrom each retrieved fire fraction (Section 3.2). In general, the calcu-lated pixel areas fall within 5–12% of the values obtained via theGiglio (2010) approximation.
The actual overlap correction takes advantage of the similaritieswithin every MODIS granule. For example, every granule contains 204scans composed of 10 scan lines along-track (Wolfe et al., 2002), eachwith an along-scan width of 1354 pixels (one scan=10×1354 pixelsor about 10×2300 km). While the average pixel size near-nadir is1 km2, off-nadir pixel growth causes the total scan width to grow to2300 km rather than 1354 km. Based on these similarities, any pixelthat overlaps another pixel in one granule will overlap that same pixelin every granule. Therefore, by assuming the Earth is a perfect sphereand topographic influences are minimal, a general overlap correctioncan be developed and applied to all MODIS granules. For this study, apixel is defined as an overlapping pixel if it overlaps a pixel in the pre-vious scan by 50% of its total area. This overlap definition is then testedon every pixel on a scan-by-scan basis. For example, the locations anddimensions of each individual pixel within the second scan are
re is approximately an hour time lag between the MODIS overpass and the AMS flight.

Fig. 4. An example MODIS and AMS collocation case (case #4) at a MODIS viewing ze-nith angle of 50.3°. (Top) Without a pixel overlap correction and (Bottom) with a pixeloverlap correction. Black polygons denote the boundaries of the AMS scan and thepixels shaded in red are the MODIS fire pixels contained within the AMS scan.
Table 1Specifics of the case studies and results of the pixel overlap correction.
CollocationCase #
Date OverpassDay/Night
MeanViewingZenithAngle
# Fire PixelsUncorrected
# Fire PixelsCorrected
1 10–28–2007 Day 13 7 72 10–26–2007 Day 32 5 53 10–24–2007 Day 50 10 94 10–24–2007 Day 50 17 115 09–08–2007 Night 64 7 36 09–08–2007 Night 64 4 2
269D. Peterson et al. / Remote Sensing of Environment 129 (2013) 262–279
compared to the first scan's pixel locations and dimensions. The algo-rithm keeps track of the locations (index) of any pixels that overlapthe first scan and the process repeats for each subsequent scan in thegranule. The end result is an index of pixel locations that must be re-moved from each scan in any MODIS granule.
While pixel overlap may allow for multiple vantage points of thesame fire at the individual pixel level, future applications will nothave high resolution data available to discern which of these vantagepoints is the best, and any overlap will also influence the cluster-levelresults. Therefore, an overlap correction is used in each collocationcase to reduce the chance of artificially large fire clusters, which is espe-cially critical for the general summation clustering method (describedin Section 3.2). Even with the overlap correction, small instances ofoverlap and small gaps may still exist, but the pixel grid will becomemuch more realistic, especially at larger VZAs. As an example, theoverlap correction was tested on one of the six collocation cases(case #4) with a mean VZA of 50° (Fig. 4). Without a correction,this case had a total of 17 MODIS fire pixels and displayed consider-able pixel overlap. However, when applying the correction to selectonly the non-overlapping pixels, the pixel grid clears up and thetotal number of fire pixels is reduced to 11. The specific details foreach collocation case are presented in Table 1 and show that theoverlap correction does little to alter the pixel grid when the VZA isless than ~35° (near-nadir), but the number of fire pixels can de-crease by more than 50% at large VZAs after the correction is applied.
5. AMS fire detection algorithm and background temperature
Similar to MODIS, AMS fire detection requires the use of thresholds,which can be somewhat subjective (Giglio et al., 2003; Justice et al.,2002; Kaufman et al., 1998a). Due to the shift in the peak of the PlanckFunction toward shorter wavelengths at high temperatures, fire
detection thresholds are typically based on the 4 μm channel. However,detection algorithms for different sensors, such as MODIS and GOES,consider the 11 μm channel to varying degrees (Giglio et al., 2003;Prins & Menzel, 1994). For example, MODIS incorporates the tempera-ture difference between 4 and 11 μm and the early GOES algorithmset a specific fire detection threshold for the 11 μm channel. In thecase of AMS, an 11 μm fire threshold is used as a secondary checkwhen saturation is reached at 4 μm. Through an automated process,the AMS fire detection thresholds are allowed to vary for each MODISpixel and adapt to the unique characteristics of the AMS instrument.The AMS algorithm is not meant for operational purposes and is specif-ically designed to process the AMSdata points containedwithin a singleMODIS pixel.
Within any MODIS pixel, there are between 4000 and 9000 AMSdata points depending on the location relative to the AMS nadir andthe flight altitude (Fig. 5). These data points allow for a detailed investi-gation of the ‘mixed’ MODIS fire pixels, which commonly contain abackground, smoldering, and actively burning region (e.g. Eckmann etal., 2008; Kaufman et al., 1998a). However, it is assumed that the tem-perature difference between actively burning and smoldering regionsis larger than the difference between background and smoldering.Hence, AMS fire detection is currently aimed at obtaining the meanstate of temperature and fire size of two groups: (1) the data points ofactively burning fires, and (2) the data points of the remaining region(including smoldering and cooling). The smoldering region is largelyneglected because the collocated cases (#1–6) are very intense fireevents and the sub-pixel calculation is likely weighted toward retriev-ing the flaming region (largest contribution to pixel MIR radiance).Fire modeling studies have shown that the depth of a fire front com-monly ranges from a few meters to ~30 m for grassland fires (Mell etal., 2007) and can reach 400 m in dense vegetation (Filippi et al.,2009). Based on the potential fire front size, it is expected that theAMS fire area fractions, within a MODIS pixel, will typically fall below~0.2.
5.1. Background temperature and minimum thresholds
The AMS fire detection process is based on the histogram at 4 and11 μm and begins with background temperature selection. In contrastto the neighboring pixel method for MODIS background temperature(Kaufman et al., 1998a), the histogrammethod for background temper-ature considers the temperature of the unburnedAMSdata pointswith-in the MODIS fire pixel (in-pixel background temperature). Thismethod is necessary because the AMS flying altitudes vary case bycase, and hence any thresholds on temperature should be imagebased. Due to the scanningmethod of AMS, topographic effects, and as-pect, the cool region of the pixel can vary 5–10 K (Fig. 6). However, thisvariation is not likely over a 1 kmdistance unless there is a rapid changein elevation. Therefore, to account for any of these observational differ-ences, the AMS background temperature calculation at 4 and 11 μm(dash-dotted blue lines in Fig. 6c,d) is a weighted average of all

Fig. 5. Visualization of the variation in AMS pixel size (resolution in m2) based on the location within the scan and elevation. Cool colors indicate regions of higher resolution andwarm colors indicate the coarsest resolution.
270 D. Peterson et al. / Remote Sensing of Environment 129 (2013) 262–279
temperature bins (in the histogram) less than the median. A visual in-spection of each histogram is also undertaken to be certain that the cal-culated AMS background temperatures are representative of only the
Fig. 6. Example of AMS daytime fire detection within a MODIS pixel. (a) Map containing thbrightness temperatures. Blue dots indicate AMS data points disregarded as fires, green trthe final AMS fire detection. Fire detection thresholds are displayed as solid orange lines anto the center of an ICT test bin. (c) and (d) Histograms used in AMS fire detection at 4 μm anthe MODIS and AMS background temperatures are respectively displayed as dashed green
non-burning portion of the pixel. The AMS background temperaturecan then be compared to the MODIS background temperature (greendashed lines in Fig. 6c,d).
e AMS hot spot detections within a MODIS pixel. (b) Scatterplot of AMS 4 and 11 μmiangles indicate the region to be examined as potential fires, and red squares indicated the minimum threshold is displayed as a solid pink line, with each dot correspondingd 11 μm, respectively. Fire detection thresholds are displayed as solid orange lines, andand dash-dotted blue lines.
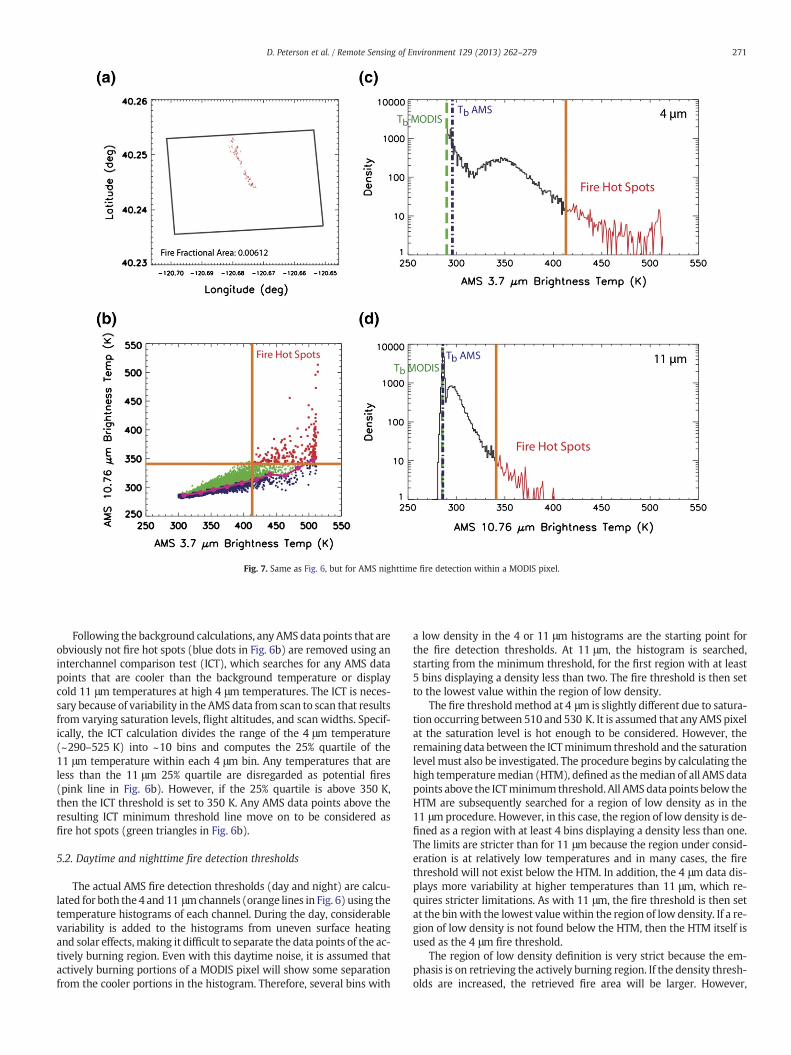
Fig. 7. Same as Fig. 6, but for AMS nighttime fire detection within a MODIS pixel.
271D. Peterson et al. / Remote Sensing of Environment 129 (2013) 262–279
Following the background calculations, any AMS data points that areobviously not fire hot spots (blue dots in Fig. 6b) are removed using aninterchannel comparison test (ICT), which searches for any AMS datapoints that are cooler than the background temperature or displaycold 11 μm temperatures at high 4 μm temperatures. The ICT is neces-sary because of variability in the AMS data from scan to scan that resultsfrom varying saturation levels, flight altitudes, and scan widths. Specif-ically, the ICT calculation divides the range of the 4 μm temperature(~290–525 K) into ~10 bins and computes the 25% quartile of the11 μm temperature within each 4 μm bin. Any temperatures that areless than the 11 μm 25% quartile are disregarded as potential fires(pink line in Fig. 6b). However, if the 25% quartile is above 350 K,then the ICT threshold is set to 350 K. Any AMS data points above theresulting ICT minimum threshold line move on to be considered asfire hot spots (green triangles in Fig. 6b).
5.2. Daytime and nighttime fire detection thresholds
The actual AMS fire detection thresholds (day and night) are calcu-lated for both the 4 and 11 μmchannels (orange lines in Fig. 6) using thetemperature histograms of each channel. During the day, considerablevariability is added to the histograms from uneven surface heatingand solar effects, making it difficult to separate the data points of the ac-tively burning region. Even with this daytime noise, it is assumed thatactively burning portions of a MODIS pixel will show some separationfrom the cooler portions in the histogram. Therefore, several bins with
a low density in the 4 or 11 μm histograms are the starting point forthe fire detection thresholds. At 11 μm, the histogram is searched,starting from the minimum threshold, for the first region with at least5 bins displaying a density less than two. The fire threshold is then setto the lowest value within the region of low density.
The fire thresholdmethod at 4 μm is slightly different due to satura-tion occurring between 510 and 530 K. It is assumed that any AMSpixelat the saturation level is hot enough to be considered. However, theremaining data between the ICTminimum threshold and the saturationlevel must also be investigated. The procedure begins by calculating thehigh temperaturemedian (HTM), defined as themedian of all AMS datapoints above the ICTminimum threshold. All AMS data points below theHTM are subsequently searched for a region of low density as in the11 μmprocedure. However, in this case, the region of low density is de-fined as a region with at least 4 bins displaying a density less than one.The limits are stricter than for 11 μm because the region under consid-eration is at relatively low temperatures and in many cases, the firethreshold will not exist below the HTM. In addition, the 4 μm data dis-plays more variability at higher temperatures than 11 μm, which re-quires stricter limitations. As with 11 μm, the fire threshold is then setat the bin with the lowest valuewithin the region of low density. If a re-gion of low density is not found below the HTM, then the HTM itself isused as the 4 μm fire threshold.
The region of low density definition is very strict because the em-phasis is on retrieving the actively burning region. If the density thresh-olds are increased, the retrieved fire area will be larger. However,

272 D. Peterson et al. / Remote Sensing of Environment 129 (2013) 262–279
increasing the density threshold by one at 4 and 11 μm will only pro-duce a relative increase infire area of approximately 10%. In contrast, in-creasing the density thresholds by three will increase the retrieved firearea by 40%. In this case, the 11 μm (4 μm) region of low density wouldbedefined as thefirst regionwith at least 5 bins displaying a density lessthanfive (four). Obviously, amuch larger region of the histogramwouldthen be considered as fire. Therefore, the region of low density is basedon the area of minimum sensitivity.
The nighttime fire thresholds are more straightforward than thedaytime thresholds. Reduced background noise allows for a detectionapproach similar to MODIS, where separation is obtained by selectingpixels with temperatures that are a few standard deviations from the
Fig. 8. Spatial representation of all six case studies in California. The large black polygons dpixel mesh (corrected for overlap). The MODIS fire pixels are shaded in color based on thethree pixels shaded in black and corresponding to a brown “E” indicate where the MODISThe viewing zenith angle increases from case #1 (13°) to case #5 and #6 (64°).
mean (Giglio et al., 2003; Justice et al., 2002). Specifically for AMS, thefire thresholds at 4 and 11 μm are set at two standard deviations fromthe mean (Fig. 7). Regardless of daytime or nighttime, the 4 and11 μm fire thresholds are not allowed to fall below 380 K and 340 K, re-spectively. Theseminimum values are rarely reached, but are necessaryforMODIS pixels containing only a few hot AMS data points (very smallfire fractions). Any AMSdata pointswith a temperature greater than the4 and 11 μm fire thresholds are flagged as fire hot spots (red squares inFigs. 6b and 7b). The area of these AMS pixels is then summed to calcu-late the fire hot spot area within the MODIS pixel under consideration(assessment data, displayed in Figs. 6a and 7a). In some cases, negativeradiance values will occur adjacent to a region of hot, saturated AMS
enote the boundaries of the AMS scan and smaller gray polygons represent the MODISpercent difference between the AMS observed and the MODIS retrieved fire area. Thebackground temperature was higher than the fire pixel temperature (retrieval error).

Fig. 9. Pixel-level comparisons between retrieved MODIS fire area and AMS observed fire area from all six collocated cases. (a) Color scheme indicates the fire detection confidencelevel provided by the MODIS fire product. (b) Color scheme indicates the viewing zenith angle (distance from nadir). (c) Color scheme indicates the variation in AMS pixel size(based on Fig. 5). (d) Color scheme separates the pixels with distinct sub-pixel hot spots located on the pixel edge from the remaining pixels. The statistics corresponding tothe color schemes in (a–d) are presented in Table 2. The idealized cases, which contain only the high confidence and the combination high confidence/center hot spot fire pixels,are displayed in (e) and (f), respectively. For display purposes, (a–f) use a log vs. log scale. However, the statistics reflect the linear regression.
273D. Peterson et al. / Remote Sensing of Environment 129 (2013) 262–279

Table 2Statistics corresponding to the color scheme used in Fig. 9a–d.a
Variable(Indirect Effect)
# PixelsOut of 33
Mean AMSFire Areakm2
Mean MODISFire Areakm2
Bias
km2 %
MODIS confidence level (Fig. 9a)Low 2 0.034 0.070 0.036 105.88Medium 6 0.015 0.011 −0.004 −26.67High 25 0.043 0.038 −0.005 −11.62
Viewing Zenith angle (Fig. 9b)VZAb40° 9 0.013 0.009 −0.004 −30.77VZA=50° 19 0.035 0.029 −0.007 −20.00VZA=64° 5 0.085 0.102 0.017 20.00
AMS pixel size (Fig. 9c)>200 m2 3 0.028 0.046 0.018 64.29150–200 m2 10 0.046 0.047 0.001 2.17100–149 m2 16 0.032 0.025 −0.007 −21.88b100 m2 4 0.043 0.035 −0.009 −20.93
Location of sub-pixel hot spots (Fig. 9d)Center 25 0.037 0.034 −0.003 −8.11Edge 8 0.037 0.036 −0.001 −2.70
a Negative bias indicates that the mean AMS fire area is greater than the meanMODIS retrieved fire area.
274 D. Peterson et al. / Remote Sensing of Environment 129 (2013) 262–279
pixels. However, negative AMS radiance values usually comprise a verysmall faction of the total number of AMS pixels within a MODIS firepixel footprint, and are currently disregarded.
6. Comparing the MODIS retrieved fire area with AMS observations
The ~15 meter resolution AMS fire data provide a direct ground as-sessment (in km2) for the retrieved fire areas within each MODIS firepixel. From a spatial perspective, Fig. 8 shows that 12 of the 37 MODISfire pixels have retrieved fire areas within 50% of the AMS value,while the fire area for 3 of the MODIS pixels cannot be retrieved dueto background temperature mischaracterization. These 3 pixels havean 11 μm background temperature that is warmer than the fire pixeltemperature, which stems from the current MODIS fire detection algo-rithm and may be caused by heterogeneities (noise) in the region ofbackground pixels (e.g. Kaufman et al., 1998a; Zhukov et al., 2006). In-terestingly, there is a MODIS fire pixel in case #1 that does not containany AMS fire hot spot detections, and is therefore the largest errordisplayed in Fig. 8. This pixel was not flagged as high confidence bytheMODIS fire detection algorithm andmay be aMODIS false detection(described in the following section). The remaining 21 valid fire pixelsdisplay significant deviations in retrieved fire areas from the counter-parts of the AMS observations, which is expected based on the large po-tential for pixel-level errors highlighted in earlier studies (e.g. Giglio &Kendall, 2001). Therefore, the following sections focus on the analysisof several indirect, random processes than can partially explain thelarge differences between the MODIS and AMS pixel-level fire areas.
6.1. Specifics of pixel-level comparisons
For all MODIS fire pixels, AMS and MODIS fire area comparisons(Fig. 9a-d) have shown promise for a fire area greater than~0.001 km2 (1000 m2), which corresponds to a fire area fraction of0.001 in a 1 km2 MODIS pixel. While the overall bias is low,pixel-by-pixel differences in AMS-MODIS fire areas are significant,producing a modest correlation (R=0.59). It is also interesting thatall 33 fire pixels displayed in Fig. 9a-d have an AMS observed firearea greater than 0.001 km2 (1000 m2), which is above the lowerlimit of MODIS fire detection for a reasonable retrieval accuracy(Giglio et al., 2003). Even though few fire pixels have an AMS firearea between 0.0001 km2 and 0.003 km2, a range that is expectedto have the greatest potential for error in the retrieval, it is still gen-erally observed that the relative variation in retrieved fire area issmaller for larger fires (>0.015 km2) and larger for AMS fire areasbelow 0.01 km2.
The MODIS fire product provides detection confidence levels foreach fire pixel (Giglio, 2010), which can be investigated in the contextof the sub-pixel results (Fig. 9a, Table 2). For example, the majority offire pixels in the six case studies are flagged as high confidence withonly eight pixels flagged as medium or low confidence. AMS observa-tions show that the high confidence pixels contain the largest meanfire area (0.043 km2). In contrast, the medium confidence pixels havea much smaller mean fire area (0.015 km2), which is expected becausethe smaller sub-pixel fire area likely produces a fairly small increase inmean pixel brightness temperature. Therefore, the currentMODIS algo-rithm may reduce the confidence level for these pixels. The two lowconfidence pixels actually have a larger mean fire area, but the bias isvery large (105.88%). In contrast, the bias is greatly reduced with thehigh confidence pixels (−11.62%), suggesting that the results fromhigher confidence pixels show stronger agreementwith the AMS obser-vations (Table 2). This observation suggests that the MODIS low andmediumconfidence levels generally represent the small fires or the out-liers in the retrieved sub-pixel areas, at least for the pixels used in thisstudy.
Surprisingly, the location relative to nadir has a minimal effect onthe retrieved fire area bias (Table 2), but pixels with larger VZAs have
a large mean retrieved fire area of 0.102 km2, while the pixels withsmall VZAs have a lower mean retrieved fire area of 0.009 km2.This observation is expected because the MODIS pixel size increasesdramatically with large VZAs, resulting in an increase in the smallestdetectable (and retrievable) fire area (Giglio, 2010). However, allcases, regardless of pixel location, display considerable variabilityat the pixel-level with some retrieved fire areas matching the AMSobservations and other pixels deviating from AMS by an order ofmagnitude or more (Fig. 9b). Therefore, it is likely, and will beshown below, that other indirect factors, such as the size and loca-tion of the fire within the pixel, have the greatest impact on the re-trieval results. The potential impacts from variations in AMS pixelgeometry (as displayed in Fig. 5) are considered in Fig. 9c, but thisdoes not seem to have a major impact on the assessment results.
Drawing from earlier studies (e.g. Calle et al., 2009), the impactsfrom the 4 and 11 μm PSFs must be investigated examining thesub-pixel physical disposition of fire. For example, sub-pixel fire hotspots near the edge of a pixel will likely result in an underestimatedfire pixel brightness temperature, while fires near center of a pixelmay overestimate the pixel's brightness temperature. Similarly, a firelocated on the boundary between pixels, will likely increase the bright-ness temperature of both pixels. This may help to explain the probableMODIS false detection in case #1 because the pixel boundaries (on twosides) are located near the sub-pixel fire hot spots contained within theadjacent pixels. A closer examination of the AMS fire data, displayed inFig. 10, indicates that there are threemajor distributions offire hot spotswithin the MODIS fire pixels used in this study: (1) center hot spotpixels, (2) edge hot spot pixels, and (3) a long fire front, which bisectsthe pixel. By using similar visualization methods, it was discoveredthat 8 of the 33 MODIS fire pixels contain pixel-edge fire hot spots(Fig. 9d). The center and edge hot spot pixel samples have nearly iden-tical mean observed and retrieved fire areas with a very low bias(Table 2), but 6 of the 8 edge cases show significant deviations in re-trieved fire area from the AMS observations and the pixel with the larg-est error in retrieved fire area is an edge case. The low bias in Table 2results from similar magnitudes of overestimated and underestimatedretrieved fire areas for the 8 pixels containing edge hot spots. In thenon-edge hot spot cases, especially those with distinct center hotspots (e.g. Fig. 10a), it is possible that error may be introduced from apixel brightness temperature that is overestimated (a potential bias).However, the edge cases are more likely to suffer from inter-channel,

Fig. 10. Spatial display of the sub-pixel fire region within four MODIS fire pixels showing (a) center hot spots, (b) edge hot spots, and (c), (d) long fire front situations. Black poly-gons indicate the boundaries of the MODIS fire pixels and red shading indicates the locations of fire hot spots as observed by the AMS.
275D. Peterson et al. / Remote Sensing of Environment 129 (2013) 262–279
PSF coregistration errors (Calle et al., 2009; Shephard&Kennelly, 2003),and are therefore more likely to increase the potential for error in thesub-pixel retrieval output.
Along with PSF effects, the combination of sub-pixel fire size, tem-perature, and the overall distribution of sub-pixel hot spots can affectthe retrieved fire area. For example, Fig. 10a,b shows a somewhat coun-terintuitive resultwhere the center hot spot case has a larger error in re-trieved fire area (70.71%) than the edge hot spot case (42.52%). The11 μmAMS channel, though limited by reduced sensitivity at high tem-peratures, shows that the edge case has a much higher mean fire tem-perature (443.94 K) than the center case (410.88 K) and both casesare very heterogeneous (large standard deviation). Hot spots occupyabout the same fractional area of each pixel (~0.01 for the 1 and3 km2 pixels), but the edge hot spot case contains an organized, largecluster of hot spots and the center hot spot case contains a more diffusehot spot cluster spread over a large portion of the pixel. Therefore, it ispossible that the pixel brightness temperature of the edge hot spotcase is more representative of the observed sub-pixel fire propertiesthan the center hot spot case, even when considering PSF effects.
Similarly, the fire front case in Fig. 10c has a larger error in retrievedfire area (72.66%) than Fig. 10d (50.00%), but, unlike Fig. 10a,b, thefire fronts in Fig. 10c,d do not occupy the same area fraction of the~3 km2 pixels. Fig. 10c contains a small and very narrow fire frontwith a low 11 μm mean fire temperature (407.28 K), while the firefront in Fig. 10d is much larger and highly concentrated, with a higher11 μm mean fire temperature (469.64 K). Therefore, this analysis con-firms that fire pixels containing high temperature, large, and highlyconcentrated regions of sub-pixel fire hot spots are likely to producethe most accurate retrieved fire areas, especially when located nearthe center of the pixel.
The comparisons in Figs. 9a–d and 10a–d show the individual in-direct effects (not originating from input variables) on the sub-pixelretrieval. These results suggest that multiple factors, such as a lowerconfidence fire pixel with pixel-edge hot spots, contribute to thelarge variability observed in the retrieved pixel-level fire area. There-fore, to visualize an ideal situation for the sub-pixel retrieval, the lowand medium confidence fire pixels are removed (Fig. 9e) and theresulting correlation between MODIS and AMS shows a slight

Fig. 11. Cluster-level comparisons between retrieved MODIS fire area and AMS ob-served fire area for all six collocated cases. (Top) Clustering using the sum ofpixel-level retrievals method. (Bottom) Clustering using the single retrieval from aver-ages method. Solid line corresponds to the linear fit equation and collocation case la-bels correspond to the first column of Table. 1. The color scheme is based on theviewing zenith angle (distance from nadir).
276 D. Peterson et al. / Remote Sensing of Environment 129 (2013) 262–279
increase (R=0.67). When the fire pixels with pixel-edge hot spotsare also removed (Fig. 9f), the correlation becomes much stronger(R=0.84) and the variability between MODIS and AMS is reduced.This suggests that the combination of lower confidence fire pixels,typically from small sub-pixel fires (Fig. 9a) and PSF effects(Fig. 9d), including the distribution of sub-pixel hot spots(Fig. 10a-d), have the largest indirect impact on the accuracy of theretrieval. Similar to Fig. 9a–d, the results in Fig. 9f show a relativelylow bias, but this accuracy is obtained by excluding 45% of the avail-able fire pixels. When considering global fire observations, manycases of low confidence pixels are likely to exist, especially in regionswith agricultural burning, and real-world applications would not beable to separate pixel-center from pixel-edge sub-pixel fires.
6.2. Clustering-level comparisons
While the AMS initial assessment algorithm enables the identifica-tion of fire pixels that have the greatest uncertainty in the retrieval,the majority of the future applications of the sub-pixel algorithm willnot have these data available. Therefore, the sub-pixel retrieval willhave to rely on a clustering methodology to increase the accuracy ofthe retrieved fire area. The results from the two clustering methods(Fig. 11) show stronger agreement than the pixel-level results. The clus-tering summethod of pixel-level retrievals produces the highest corre-lation (R=0.91) suggesting that the random variation can be reducedby averaging, when looking at a fire event as awhole. The single retriev-al method from averages also produces a high correlation (R=0.84),but may be limited by the larger surface area used in the retrieval,where the contrast between fire and background may be reduced. Re-gardless, comparisons between the clustering and pixel-level resultshighlight the importance of averaging to reduce errors that are difficultto characterize on a per-pixel basis, such as the distribution of sub-pixelfires (Fig. 10a–d), general PSF effects (Fig. 9d), and PSF coregistrationerrors.
The fire clusters in Fig. 11 are currently defined as all MODIS pixelswithin an AMS scan, allowing for only six fire clusters and creating dif-ficulty when discerning any impact from VZA and day/night cases.However, as with the pixel-level results, the larger VZA clusters gener-ally display larger retrieved fire areas than the small VZA cases with asmall bias toward larger AMS fire areas. Both clustering methodologieswill likely improve estimates of retrieved fire area for large fire events,but future implementation of the single retrieval from averagesmethodwill require a strict definition of what constitutes a cluster in any givenMODIS granule. Therefore, the sumof pixel-level retrievalsmethodmaybe more advantageous because the definition of a cluster can bechanged as needed. Unfortunately, isolated, smallfiresmay only includeone or two fire pixels and will not benefit from either clusteringmethodology.
7. Comparing the sub-pixel-based FRPf with the currentMODIS FRPp
With saturation occurring at higher temperatures in the AMS 4 μmchannel, and thus providing very little data to validate retrieved firetemperatures, the comparison between the current MODIS FRPp andFRPf is the only available method to assess the overall consistency ofMODIS sub-pixel fire retrievals. The pixel-level comparisons from all 6collocation cases (Fig. 12a) produce a strong correlation (R=0.93),which suggests that the sub-pixel retrieval can generate acceptablefire temperatures, even at the pixel level. However, the sensitivity anal-ysis for the BIRD satellite (e.g. Zhukov et al., 2006) showed that the er-rors in retrievedfire area and temperaturemay counteract each other ina sub-pixel-based FRP calculation (Eq. 2). As a result, fire temperatureerrors may be present regardless of the accuracy in the retrieved firearea. When considering this dilemma and the lack of temperature
validation data, the retrieved fire temperature should be usedwith cau-tion, and only when FRPf is not sufficient to examine the problem ofinterest.
In contrast to the fire area results in the previous sections, Fig. 12bshows that the off-nadir pixels (large VZAs) commonly have a muchlarger difference between FRPp and FRPf than cases close to nadir(small VZAs). The reason stems from the best-fit methodology of theMODIS FRPp in combination with off-nadir pixel growth. For example,the size of the MODIS pixels displayed in Fig. 8 can grow to over8 km2 near the edge of the satellite ground swath (cases #5 and #6).In these cases, the background region of the pixel becomes very large,suggesting that the flaming region will contribute less to the observedpixel radiance. The FRPp is also based on a top-of-atmosphere observa-tion and the longer path lengths at large VZAs may mask the signal offires. As a result, FRPp will likely be much lower than FRPf, which is in-deed observed in most off-nadir pixels in Fig. 12a,b. Similarly, whenFRPp is divided by the pixel area, lower values (large-area pixels) willresult in a greater potential for error in theMODIS FRPp estimate. There-fore, with atmospheric effects taken into consideration, FRPf is likely an

Fig. 12. (a) Pixel-level comparison between FRPp (Current MODIS pixel-based FRP) and FRPf (sub-pixel-based FRP) for all six cases. Solid line corresponds to the linear fit equation.(b) FRPf — FRPp as a function of viewing zenith angle. (c) Cluster-level comparison between FRPp per cluster area (FRPp flux) and FRPf per fire area (FRPf flux) for all six cases usingthe sum of pixel-level retrievals method. (d) Same as (c) but for the single retrieval from averages method. Solid line corresponds to the linear fit equation and collocation caselabels correspond to the first column of Table. 1. The color scheme is based on the viewing zenith angle (distance from nadir).
277D. Peterson et al. / Remote Sensing of Environment 129 (2013) 262–279
improved methodology for off-nadir fire pixels, but produces resultssimilar to FRPp for the remaining pixels.
The real motivation for choosing FRPf over FRPp becomes obviouswhen FRPf is used in combination with the retrieved fire cluster area.This can be illustrated by comparing the cluster-level FRPp flux to theFRPf flux, given by
FRPpFlux ¼
Xni¼1
FRPpi
Xni¼1
Api
ð9Þ
FRPf Flux ¼
Xni¼1
FRPf i
Xni¼1
Af i
ð10Þ
where the output is provided in units of Wm−2 per fire pixel cluster(Fig. 12c,d). The FRPf flux and FRPp flux are strongly correlated forboth the sum method (R=0.83) and the single retrieval method(R=0.89). Furthermore, a strong rank correlation (Rrank sum=0.89and Rrank single=0.66) suggests that there is a strong monotonicallyincreasing relationship between the FRPf and FRPp fluxes. While lim-ited by a small sample size, Fig. 12c,d shows that the magnitude ofFRPf flux ranges from ~3000 to 10,000 Wm−2, and the FRPP fluxranges from ~20 to 80 Wm−2. Obviously, the magnitude of theFRPf flux (based on retrieved fire area) is more realistic for thelarge fire clusters used in this study.
Along with an improved quantification of fire intensity, FRPf fluxcan be used to examine the basic properties of a fire event by differ-entiating large fires burning at a low FRPf from small fires burning ata high FRPf. For example, the cluster fire area in case #5 is one of thelargest (~0.38 km2), while the FRPf flux is one of the smallest(~3900 Wm−2). In fact, both large VZA cases (#5 and #6) have thesmallest FRPf fluxes, which are expected because they are nighttime

278 D. Peterson et al. / Remote Sensing of Environment 129 (2013) 262–279
cases. Therefore, the general fire evolution and smoke plume charac-teristics in case #5may be considerably different than case #1, whichcontains a relatively small fire cluster area (~0.01 km2) with a muchlarger FRPf flux (~10,000 Wm−2). These types of comparisons dem-onstrate the potential utility of the sub-pixel retrieval for providing adetailed characterization of any given fire event, and show that FRPfflux may be useful for providing improved estimates of initial smokeplume buoyancy and injection heights. However, more observationalanalysis is needed to support this hypothesis.
8. Summary and applications to future satellite missions
In an effort to provide a fire area and temperature-based FRPproduct, this study has developed a MODIS sub-pixel retrieval algo-rithm for fire area and temperature, which are used to calculateFRPf and FRPf flux. The retrieval was designed such that it can berun on any MODIS granule across the globe and a radiative transfermodel was used to account for atmospheric effects. Using a lookuptable approach, the retrieval can be run at both the pixel and clusterlevels and corrections are made for overlapping pixels. Currently, the4 and 11 μm background temperatures are direct inputs from theMODIS fire product (collection 5).
For the first time, the AMS sensor, flown aboard the NASA IkhanaUAS, allowed the retrieved MODIS sub-pixel fire area results to beassessed using high spatial resolution data. This initial assessmentshowed that pixel clustering should be implemented to reduce errorsthat are difficult to characterize on a per-pixel basis, such as thosefrom PSF differences, and the clustering sum of individual retrievalsmethod may have the greatest relevance to future operational algo-rithms. In addition, a strong correlation (R=0.93) was found betweenthe fire area/temperature-based FRPf and the current pixel-basedMODIS FRPp. This suggests that a sub-pixel retrieval of FRPf has thesame merit as the current FRPp, but contributes information that thecurrent MODIS product is lacking. As an example, the combination ofFRPf and retrieved fire area (FRPf flux)may offer a reliable characteriza-tion of thermal buoyancy for estimates of smoke plume height, at leastfor medium to large fires (>1000 m2). Improved plume height esti-mates have the most value for these large fire events due to the in-creased chance of injection above the boundary layer.
Over the next decade, the new generation of satellite sensors, suchas VIIRS (http://jointmission.gsfc.nasa.gov/viirs.html) and GOES-R(http://www.goes-r.gov/), will replace the current generation sensors,including MODIS. The sub-pixel algorithm described in this paper isdesigned for easy application to these future sensors, provided thebasic spectral properties are similar. The VIIRS and GOES-R fire detec-tion algorithms, currently being designed and evaluated, will performsub-pixel fire characterization (e.g. Schmidt et al., 2011). However, incontrast to MODIS, the VIIRS sensor will provide a finer pixel resolutionof about 750 m across the entire scan (nadir and off-nadir), reducingoff-nadir pixel growth (Csiszar et al., 2011), and thereby enhancingany potential FRPf product. If the sub-pixel algorithm developed inthis study becomes operational, the approximate size of the fire frontcould be calculated at each observation time, which will facilitate theanalysis of meteorological impacts on fire intensity, size, and tempera-ture (e.g. Peterson et al., 2010). From the operational perspective,there is a growing need for a near-real-time fire intensity rating system(Ichoku et al., 2008a). The incorporation of FRPf will allow futurefire-rating techniques to include aspects of fire front size, which willlikely help fire suppression teams to allocate their resources more effi-ciently during a fire emergency.
The initial assessment methodology for the MODIS sub-pixel re-trieval can also be applied to future studies. In fact, as sub-pixel re-trievals are incorporated into operational satellite missions, increasingquantities of high-resolution validation data will be required. This high-lights the value of airborne-sensor-collected fire data, such as thoseobtained from the AMS sensor aboard NASA's Ikhana aircraft. Currently,
the Ikhana is flown over large fire events to support fire suppression op-erations on the ground. However, these flights also have an enormousscientific value for understanding wildfire behavior and are a potentialtool for the direct validation of FRPf. This study has shown that thegreatest potential for error occurs with small sub-pixel fires, but valida-tion data for these events are not currently available. Therefore, futureairborne missions must focus on data collection for both large andsmall fire events over a wide variety of biomass types.
Acknowledgments
We are grateful to the AMSwildfire measurement team at the NASAAmes Research Center for providing the airborne (AMS) fire data usedin this study. We thank Luke Ellison at the NASA Goddard Space FlightCenter for his work with overlapping MODIS pixels. We also thankDr. Mark Anderson, Dr. John Lenters, and Dr. Bob Oglesby at the Univer-sity of Nebraska— Lincoln and Dr. Wilfrid Schroeder at the Universi-ty of Maryland — College Park for their constructive comments. Theproject was funded by the NASA Earth and Space Science Fellowship(to D. Peterson) and the NASA New Investigator Program (to Dr. JunWang). Dr. Hyer's participation was funded by NASA Applied Scienceaward #NNX09AT09G and NASA R&A award #NNH07AF47I.
References
Ambrosia, V. G., Sullivan, D. V., & Buechel, S. (2011). Integrating sensor data andgeospatial tools to enhance real-time disaster management capabilities: Wildfireobservations. In A. K. Sinha, D. Arctur, I. Jackson, & L. Gundersen (Eds.), Societalchallenges and geoinformatics: Geological society of America special paper, 482.(pp. 1–12)Boulder, CO: The Geological Society of America978-0-8137-2482-9((pbk), Chapter 1).
Ambrosia, V. G., & Wegener, S. (2009). Unmanned airborne platforms for disaster re-mote sensing support. In Pei-Gee Peter Ho (Ed.), Geoscience and remote sensing.InTech. (pp. 91–114)978-953-307-003-2 (Chapter 5).
Ambrosia, V. G., Wegener, S., Zajkowski, T., Sullivan, D. V., Buechel, S., Enomoto, F., et al.(2011). The Ikhana UAS western states fire imaging missions: From concept to re-ality (2006–2010). Geocarto International Journal, 26. (pp. 85–101): Taylor &Francis Publishing.
Byram, G. M. (1959). Combustion of forest fuels. In K. P. Davis (Ed.), Forest fire: Controland use (pp. 61–89). New York: McGraw-Hill.
Cahoon, D. R., Jr., Stocks, B. J., Levine, J. S., Cofer, W. R., III, & Chung, C. C. (1992). Eval-uation of a technique for satellite-derived area estimation of forest fires. Journalof Geophysical Research, 97, 805–3814.
Calle, A., Casanova, J. L., & Gonzalez-Alonso, F. (2009). Impact of point spread functionof MSG-SEVIRI on active fire detection. International Journal of Remote Sensing, 30,4567–4579.
Csiszar, I. A., Schroeder, W., Giglio, L., Justice, C. O., & Ellicott, E. (2011). Quantitativeevaluation of active fire detection capabilities from VIIRS. 91st American Meteoro-logical Society Annual Meeting. Seattle, WA.
Dennison, P. E., Charoensiri, K., Roberts, D. A., Peterson, S. H., & Green, R. O. (2006).Wildfire temperature and land cover modeling using hyperspectral data. RemoteSensing of Environment, 100, 212–222.
Dozier, J. (1981). A method for satellite identification of surface temperature fields ofsubpixel resolution. Remote Sensing of Environment, 11, 221–229.
Duck, T. J., Firanski, B. J., Millet, D. B., Goldstein, A. H., Allan, J., Holzinger, R., et al. (2007).Transport of forest fire emissions from Alaska and the Yukon Territory to Nova Scotiaduring summer 2004. Journal of Geophysical Research-Atmospheres, 112.
Eckmann, T. C., Roberts, D. A., & Still, C. J. (2008). Using multiple endmember spectralmixture analysis to retrieve subpixel fire properties from MODIS. Remote Sensingof Environment, 112, 3773–3783.
Eckmann, T. C., Roberts, D. A., & Still, C. J. (2009). Estimating subpixel fire sizes andtemperatures from ASTER using multiple endmember spectral mixture analysis.International Journal of Remote Sensing, 30, 5851–5864.
Eckmann, T. C., Still, C. J., Roberts, D. A., & Michaelsen, J. C. (2010). Variations in subpixelfire properties with season and land cover in Southern Africa. Earth Interactions, 14.
Filippi, J. B., Bosseur, F., Mari, C., Lac, C., Le Moigne, P., Cuenot, B., et al. (2009). Coupledatmosphere—Wildland fire modelling. Journal of Advances in Modeling Earth Sys-tems, 1, 1–9.
Flannigan, M. D., & Vonder Haar, T. H. (1986). Forest fire monitoring using NOAA satel-lite AVHRR. Canadian Journal of Forest Research, 16, 975–982.
Flasse, S. P., & Ceccato, P. S. (1996). A contextual algorithm for AVHRR fire detection.International Journal of Remote Sensing, 17, 419–424.
Fromm, M., Lindsey, D. T., Servranckx, R., Yue, G., Trickl, T., Sica, R., et al. (2010). The un-told story of pyrocumulonimbus. Bulletin of the American Meteorological Society, 91,1193–1209.
Gao, B. C., Xiong, X. X., Li, R. R., & Wang, D. Y. (2007). Evaluation of the moderate resolutionimaging spectrometer special 3.95-mu m fire channel and implications on fire channelselections for future satellite instruments. Journal of Applied Remote Sensing, 1.

279D. Peterson et al. / Remote Sensing of Environment 129 (2013) 262–279
Giglio, L. (2010). MODIS collection 5 active fire product user's guide version 2.4. Univer-sity of Maryland, Department of Geography (pp. 1–61).
Giglio, L., Descloitres, J., Justice, C. O., & Kaufman, Y. J. (2003). An enhanced contex-tual fire detection algorithm for MODIS. Remote Sensing of Environment, 87,273–282.
Giglio, L., & Justice, C. O. (2003). Effect of wavelength selection on characterization offire size and temperature. International Journal of Remote Sensing, 24, 3515–3520.
Giglio, L., & Kendall, J. D. (2001). Application of the Dozier retrieval to wildfirecharacterization — A sensitivity analysis. Remote Sensing of Environment, 77, 34–49.
Giglio, L., Kendall, J. D., & Justice, C. O. (1999). Evaluation of global fire detection algo-rithms using simulated AVHRR infrared data. International Journal of Remote Sens-ing, 20, 1947–1985.
Gomez-Landesa, E., Rango, A., & Bleiweiss, M. (2004). An algorithm to address theMODIS bowtie effect. Canadian Journal of Remote Sensing, 30, 644–650.
Green, R. O. (1996). Estimation of biomass fire temperature and areal extent from cal-ibrated AVIRIS spectra. Summaries of the sixth annual JPL airborne earth scienceworkshop, 96–4, 1. (pp. 105–113): JPL Publication.
Hyer, E. J., & Reid, J. S. (2009). Baseline uncertainties in biomass burning emissionmodels resulting from spatial error in satellite active fire location data. GeophysicalResearch Letters, 36.
Ichoku, C., Giglio, L., Wooster, M. J., & Remer, L. A. (2008). Global characterization ofbiomass-burning patterns using satellite measurements of fire radiative energy.Remote Sensing of Environment, 112, 2950–2962.
Ichoku, C., & Kaufman, Y. J. (2005). A method to derive smoke emission rates fromMODIS fire radiative energy measurements. IEEE Transactions on Geoscience andRemote Sensing, 43, 2636–2649.
Ichoku, C., Martins, J. V., Kaufman, Y. J., Wooster, M. J., Freeborn, P. H., Hao, W. M., et al.(2008). Laboratory investigation of fire radiative energy and smoke aerosol emis-sions. Journal of Geophysical Research-Atmospheres, 113.
Jordan, N. S., Ichoku, C., & Hoff, R. M. (2008). Estimating smoke emissions over the USSouthern Great Plains using MODIS fire radiative power and aerosol observations.Atmospheric Environment, 42, 2007–2022.
Justice, C. O., Giglio, L., Korontzi, S., Owens, J., Morisette, J. T., Roy, D., et al. (2002). TheMODIS fire products. Remote Sensing of Environment, 83, 244–262.
Kahn, R. A., Li, W. H., Moroney, C., Diner, D. J., Martonchik, J. V., & Fishbein, E. (2007).Aerosol source plume physical characteristics from space-based multiangle imag-ing. Journal of Geophysical Research-Atmospheres, 112, 20.
Kaiser, J. W., Suttie, M., Flemming, J., Morcrette, J. J., Boucher, O., & Schultz, M. G.(2009). Global real-time fire emission estimates based on space-borne fire radia-tive power observations. ECMWF and AER (pp. 1–4).
Kaufman, Y. J., Ichoku, C., Giglio, L., Korontzi, S., Chu, D. A., Hao, W. M., et al. (2003). Fire andsmoke observed from the Earth Observing System MODIS instrument — Products, vali-dation, and operational use. International Journal of Remote Sensing, 24, 1765–1781.
Kaufman, Y. J., Justice, C. O., Flynn, L. P., Kendall, J. D., Prins, E. M., Giglio, L., et al. (1998).Potential global fire monitoring from EOS-MODIS. Journal of GeophysicalResearch-Atmospheres, 103, 32215–32238.
Kaufman, Y. J., Kleidman, R. G., & King, M. D. (1998). SCAR-B fires in the tropics: Propertiesand remote sensing from EOS-MODIS. Journal of Geophysical Research-Atmospheres,103, 31955–31968.
Kelha, V., Rauste, Y., Hame, T., Sephton, T., Buongiorno, A., Frauenberger, O., et al.(2003). Combining AVHRR and ATSR satellite sensor data for operational borealforest fire detection. International Journal of Remote Sensing, 24, 1691–1708.
Kopacz, M., Mauzerall, D. L., Wang, J., Leibensperger, E. M., Henze, D. K., & Singh, K.(2011). Origin and radiative forcing of black carbon transported to the Himalayasand Tibetan Plateau. Atmospheric Chemistry and Physics, 11, 2837–2852.
Koren, I., Remer, L. A., & Longo, K. (2007). Reversal of trend of biomass burning in theAmazon. Geophysical Research Letters, 34.
Langaas, S. (1993). A parameterized bispectral model for savannah fire detection usingAVHRR night images. International Journal of Remote Sensing, 14, 2245–2262.
Lavoue, D., Liousse, C., Cachier, H., Stocks, B. J., & Goldammer, J. G. (2000). Modeling ofcarbonaceous particles emitted by boreal and temperate wildfires at northern lat-itudes. Journal of Geophysical Research-Atmospheres, 105, 26871–26890.
Lee, T. F., & Tag, P. M. (1990). Improved detection of hotspots using the AVHRR 3.7-umchannel. Bulletin of the American Meteorological Society, 71, 1722–1730.
Li, Z., Kaufman, Y., Ichoku, C., Fraser, R., Trishchenko, A., Giglio, L., et al. (2001). A reviewof AVHRR-based active fire detection algorithms: Principles, limitations, and rec-ommendations. In F. Ahern, J. Goldammer, & C. O. Juctice (Eds.), Global and regionalvegetation fire monitoring from space: planning a coordinated international effort(pp. 199–225). : SPB Academic Publishing.
Li, Z., Nadon, S., & Cihlar, J. (2000). Satellite detection of Canadian boreal forest fires:development and application of an algorithm. International Journal of Remote Sens-ing, 21, 3057–3069.
Li, Z., Nadon, S., Cihlar, J., & Stocks, B. (2000). Satellite mapping of Canadian boreal for-est fires: Evaluation and comparison of algorithms. International Journal of RemoteSensing, 21, 3071–3082.
Masuoka, E., Fleig, A., Wolfe, R. E., & Patt, F. (1998). Key characteristics of MODIS dataproducts. IEEE Transactions on Geoscience and Remote Sensing, 36, 1313–1323.
Matson, M., & Dozier, J. (1981). Identification of subresolution high temperature sourcesusing a thermal IR sensor. Photogrammetric Engineering and Remote Sensing, 47,1311–1318.
Mell, W., Jenkins, M. A., Gould, J., & Cheney, P. (2007). A physics-based approach tomodelling grassland fires. International Journal of Wildland Fire, 16, 1–22.
Oertel, D., Zhukov, B., Thamm, H. P., Roehrig, J., & Orthmann, B. (2004). Space-bornehigh resolution fire remote sensing in Benin, West Africa. International Journal ofRemote Sensing, 25, 2209–2216.
Peterson, D., Wang, J., Ichoku, C., & Remer, L. A. (2010). Effects of lightning and other me-teorological factors on fire activity in the North American boreal forest: Implicationsfor fire weather forecasting. Atmospheric Chemistry and Physics, 10, 6873–6888.
Petitcolin, F., & Vermote, E. (2002). Land surface reflectance, emissivity and tempera-ture fromMODIS middle and thermal infrared data. Remote Sensing of Environment,83, 112–134.
Prins, E. M., & Menzel, W. P. (1992). Geostationary satellite detection of biomass burn-ing in South-America. International Journal of Remote Sensing, 13, 2783–2799.
Prins, E. M., & Menzel, W. P. (1994). Trends in South-American biomass burning detectedwith the GOES Visible Infrared Spin Scan Radiometer Atmospheric Sounder from1983 to 1991. Journal of Geophysical Research-Atmospheres, 99, 16719–16735.
Randerson, J. T., Liu, H., Flanner, M. G., Chambers, S. D., Jin, Y., Hess, P. G., et al. (2006).The impact of boreal forest fire on climate warming. Science, 314, 1130–1132.
Ricchiazzi, P., Yang, S. R., Gautier, C., & Sowle, D. (1998). SBDART: A research and teach-ing software tool for plane-parallell radiative transfer in the Earth's atmosphere.Bulletin of the American Meteorological Society, 79, 2101–2114.
Riggan, P. J., Brass, J. A., & Lockwood, R. N. (1993). Assessing fire emissions from tropicalsavanna and forests of central Brazil. Photogrammetric Engineering and RemoteSensing, 59, 1009–1015.
Roberts, G., Wooster, M. J., & Lagoudakis, E. (2009). Annual and diurnal african biomassburning temporal dynamics. Biogeosciences, 6, 849–866.
Roberts, G., Wooster, M. J., Perry, G. L. W., Drake, N., Rebelo, L. M., & Dipotso, F. (2005). Re-trieval of biomass combustion rates and totals from fire radiative power observations:Application to southern Africa using geostationary SEVIRI imagery. Journal of Geo-physical Research-Atmospheres, 110.
Roy, D. P., Boschetti, L., Justice, C. O., & Ju, J. (2008). The collection 5 MODIS burned areaproduct — Global evaluation by comparison with the MODIS active fire product.Remote Sensing of Environment, 112, 3690–3707.
Sapkota, A., Symons, J.M., Kleissl, J.,Wang, L., Parlange, M. B., Ondov, J., et al. (2005). Impactof the 2002 Canadian forest fires on particulate matter air quality in Baltimore City.Environmental Science & Technology, 39, 24–32.
Schmidt, C. C., Hoffman, J. P., & Prins, E. M. (2011). Detection and characterization ofbiomass burning in the GOES-R era. 91st American Meteorological Society AnnualMeeting. Seattle, WA.
Schroeder, W., Csiszar, I., Giglio, L., & Schmidt, C. C. (2010). On the use of fire radiativepower, area, and temperature estimates to characterize biomass burning via mod-erate to coarse spatial resolution remote sensing data in the Brazilian Amazon.Journal of Geophysical Research, 115, D21121.
Schroeder, W., Prins, E., Giglio, L., Csiszar, I., Schmidt, C., Morisette, J., et al. (2008). Val-idation of GOES and MODIS active fire detection products using ASTER and ETMplus data. Remote Sensing of Environment, 112, 2711–2726.
Shephard, M. W., & Kennelly, E. J. (2003). Effect of band-to-band coregistration on fire prop-erty retrievals. IEEE Transactions on Geoscience and Remote Sensing, 41, 2648–2661.
Spracklen, D. V., Logan, J. A., Mickley, L. J., Park, R. J., Yevich, R., Westerling, A. L., et al.(2007). Wildfires drive interannual variability of organic carbon aerosol in thewestern US in summer. Geophysical Research Letters, 34.
Stephens, S. L., Weise, D. R., Fry, D. L., Keiffer, R. J., Dawson, J., Koo, E., et al. (2008). Mea-suring the rate of spread of chaparral prescribed fires in northern California. FireEcology, 4, 74–86.
Tang, B. -H., Li, Z. -L., & Bi, Y. (2009). Estimation of land surface directional emissivityinmid-infrared channel around 4.0 μm fromMODIS data.Optics Express, 17, 3173–3182.
Val Martin, M., Logan, J. A., Kahn, R. A., Leung, F. Y., Nelson, D. L., & Diner, D. J. (2010).Smoke injection heights from fires in North America: Analysis of 5 years of satelliteobservations. Atmospheric Chemistry and Physics, 10, 1491–1510.
van der Werf, G. R., Randerson, J. T., Giglio, L., Gobron, N., & Dolman, A. J. (2008). Cli-mate controls on the variability of fires in the tropics and subtropics. Global Biogeo-chemical Cycles, 22.
Vermote, E., Ellicott, E., Dubovik, O., Lapyonok, T., Chin, M., Giglio, L., et al. (2009). Anapproach to estimate global biomass burning emissions of organic and black car-bon fromMODIS fire radiative power. Journal of Geophysical Research, 114, D18205.
Wang, J., Christopher, S. A., Nair, U. S., Reid, J. S., Prins, E. M., Szykman, J., et al. (2006).Mesoscale modeling of Central American smoke transport to the United States:1. “Top-down” assessment of emission strength and diurnal variation impacts.Journal of Geophysical Research-Atmospheres, 111.
Westerling, A. L., Gershunov, A., Brown, T. J., Cayan, D. R., & Dettinger, M. D. (2003). Cli-mate and wildfire in the western United States. Bulletin of the American Meteorologi-cal Society, 84, 595–604.
Wolfe, R. E., Nishihama, M., Fleig, A. J., Kuyper, J. A., Roy, D. P., Storey, J. C., et al. (2002).Achieving sub-pixel geolocation accuracy in support of MODIS land science. Re-mote Sensing of Environment, 83, 31–49.
Wooster, M. J. (2002). Small-scale experimental testing of fire radiative energy for quan-tifying mass combusted in natural vegetation fires. Geophysical Research Letters, 29.
Wooster, M. J., Roberts, G., Perry, G. L. W., & Kaufman, Y. J. (2005). Retrieval of biomasscombustion rates and totals from fire radiative power observations: FRP derivationand calibration relationships between biomass consumption and fire radiative en-ergy release. Journal of Geophysical Research-Atmospheres, 110.
Wooster, M. J., Zhukov, B., & Oertel, D. (2003). Fire radiative energy for quantitativestudy of biomass burning: Derivation from the BIRD experimental satellite andcomparison to MODIS fire products. Remote Sensing of Environment, 86, 83–107.
Zhukov, B., Briess, K., Lorenz, E., Oertel, D., & Skrbek, W. (2005). Detection and analysisof high-temperature events in the BIRD mission. Acta Astronautica, 56, 65–71.
Zhukov, B., Lorenz, E., Oertel, D., Wooster, M., & Roberts, G. (2006). Spaceborne detec-tion and characterization of fires during the bi-spectral infrared detection (BIRD)experimental small satellite mission (2001–2004). Remote Sensing of Environment,100, 29–51.