a study on financial indicators’ reliability in … study on financial indicators’ reliability...
TRANSCRIPT

6805
ISSN 2286-4822
www.euacademic.org
EUROPEAN ACADEMIC RESEARCH
Vol. IV, Issue 8/ November 2016
Impact Factor: 3.4546 (UIF)
DRJI Value: 5.9 (B+)
A Study on Financial Indicators’ Reliability in
Technical Analysis
SUBRAMANIAM A/L PONNUSAMY
Faculty of Accounting and Finance
Asia Pacific University of Technology and Innovation, Malaysia
VIKNESWARAN S/O MANUAL
Academic Leader
Asia Pacific University of Technology and Innovation, Malaysia
Abstract:
In this modernizing world, people have stated realizing the
importance money and this reason have contributed largely to the
increasing number of individuals moving into the financial world. One
of the major proportions in the financial world is investments and
money management. There are two commonly known types of
investment analysis which are the technical analysis and fundamental
analysis. This study was conducted to determine the reliability of
financial indicators that being used in technical analysis. It is to study
the capability of financial indicators to give out reliable trading
signals to investor so that they will be able to generate profit. These
indicators will be tested using their standard pre-set rules. The three
indicators chosen to be studied in this research paper are the Moving
Average Convergence/Divergence (MACD) Indicator, Relative Strength
Index Indicator and lastly the Stochastic Oscillator Indicator.
Researcher used experimental method to test the indicators and it was
found that none of the indicator was reliable in giving out reliable
trading signal using the standard pre-set rules. The researcher
investigated and found that Relative Strength Index Indicator
performed well compared to the other two. Thus, one should not rely on
indicator 100% to make their trading decision and shall consider
Subramaniam A/L Ponnusamy, Vikneswaran S/O Manual- A Study on Financial
Indicators’ Reliability in Technical Analysis
EUROPEAN ACADEMIC RESEARCH - Vol. IV, Issue 8 / November 2016
6806
applying few indicators together to make their decision whether to buy
or sell in the market.
Key words: financial indicators, technical analysis
1.0 INTRODUCTION OF STUDY
In this research paper, the researcher will be studying about
the reliability of using technical indicators in the technical
analysis using the foreign currency trading. Technical analysis
is also known to be bottom to top analysis used in investments
and trading as according to Lo, A. W (2000). For many decades,
technical analysis has been used for the purpose of investing
and trading. There is another investment analysis which is
totally the opposite of bottom to top investment and it is known
to be top to bottom or fundamental analysis. Fundamental
analysis is a type of an analysis that are performed in a way
that the interested party would get to know about the selected
company, does some background checks in the company and
monitors the performance of the company. This process is done
by studying and analysing the financial statement and annual
reports of the company in details and this analysis relates for a
longer term of investment.
1.1 Technical Analysis
What is technical analysis? Bottom to top analysis is a method
used by individuals, mostly by investors, to observe the future
movement of the price and “use the new movements to make
their final investment decision with a valid expectation of
where is the price movement about to take the market”
according to Rockefeller, B (2011). It is basically a technique
used for forecasting the movement of price and use the forecast
to make decision whether to buy or to sell. Kahn, M (2007) has
said that “technical analysis is purely based on the data driven
Subramaniam A/L Ponnusamy, Vikneswaran S/O Manual- A Study on Financial
Indicators’ Reliability in Technical Analysis
EUROPEAN ACADEMIC RESEARCH - Vol. IV, Issue 8 / November 2016
6807
from the market and response of people where they react in
similar way towards the same situations before and uses it to
make decisions”. In simple words, a user of technical analysis
tries to adapt to the change in the market and grabs that
opportunity to invest. “Technical analysis is a more simplified
version of what is happening to the price” as said by Suresh,
A.S (2013). Kahn, M (2007) has also said that “bottom to top
analysis assist investors to evaluate risk and rewards and thus
allows them to place their resources”. Suresh, A.S (2013)
mentioned that “prices from technical analysis are dependent
on the demand and supply of the market and it is the study of
the market only and what is expected from it”.
Bottom to top investment strategy also contains some
principle of its own. This has also been supported by Murphy,
J.J (1999) and the author have mentioned that “the essential
principles followed by the investors using technical analysis are
market action discounts everything, prices move in trends and
finally history repeats itself”.
What does the first principle that says market action
discounts everything? Murphy, J.J (1999) and Neely, C.J et al.
(2011) has said that “the price movements reflected in the
market is just a reflection of all the factors that could affect the
movements of the price and the technical analyst don‟t bother
with all that but all their concerns are on price movements and
not the reasons for the movement”. The factors that cause the
movement in the price in technical analysis are such as political
factor, economical factor, supply and demand and many more
which are fundamental. Neely, C.J and Weller, P.A (2011) has
also emphasized that “a bottom to top analysis user ignores
fundamentals at all cost unless they go through prism of
prices”. Prism of prices is when the fundamental comes into
play before the price reacts in the market.
The 2nd essential principle followed by the bottom to top
investment strategy is prices move in trends. According to
Murphy, J.J (1999) and Neely, C.J et al. (2011), “this principle

Subramaniam A/L Ponnusamy, Vikneswaran S/O Manual- A Study on Financial
Indicators’ Reliability in Technical Analysis
EUROPEAN ACADEMIC RESEARCH - Vol. IV, Issue 8 / November 2016
6808
is used to capture the pattern of trend to predict and allows the
traders to make decision whether to buy or sell”. Investor
believes that the movement of the prices will be significant and
they will predict it in the early stage to make their trading.
Neely, C.J et al. (2011), “this principle is such as a „mantra‟ as
the saying goes the trend is your friend”.
The third essential principle is history repeats itself and
according to Murphy, J.J (1999) and Neely, C.J et al. (2011) this
is where “it is a study of the future with the believes that the
past would be repeated in the exact similar way and also have
concluded that human behavior or psychology doesn‟t differ
much over time”. The traders use the charts from the analysis
to analyze the movement of the market from the past where the
patterns indicating a rise or fall in the past would move in the
exact same way in the future as the human psychology is very
stable.
Bottom to top investment strategy analysis involve a
very vital theory which is the Dow Theory. Dow Theory is a way
of predicting the future pattern of the market movement from
the response of the market which was revealed by Dow Jones
Industrial and Transportation averages. Charles Dow was one
of the owners and also an editor of the Wall Street Journals.
Dow Theory is very important as it is still being used as a very
foundation in technical analysis. Murphy, J.J (1999) has also
claimed that the Dow Theory is “a leading economic indicator”.
Technical analysis uses many techniques and tools to read and
predict the future movement of the prices in the market. The
tools are such as On-Balance Volume, Accumulation /
Distribution Line, Average Directional Index, Aroon, MACD,
RSI, Stochastic Oscillator and many more indicators. This
research paper will be examining only three of these indicators
which are the Moving Average Convergence/Divergence
(MACD), Relative Strength Index (RSI) and lastly Stochastic
Oscillator.

Subramaniam A/L Ponnusamy, Vikneswaran S/O Manual- A Study on Financial
Indicators’ Reliability in Technical Analysis
EUROPEAN ACADEMIC RESEARCH - Vol. IV, Issue 8 / November 2016
6809
1.2 Forex Market
Forex market is a market of foreign currency exchange market.
A study has been done by Buenrostro, E., Mateo, A. and
Ramirez, A. (2012) on FOREX Investment and Trading where
the researcher has defined on how did the foreign exchange
market was emerged. Foreign exchange markets have been
around for thousands of years till date and have been evolving
by time.
As said by Buenrostro, E., Mateo, A. and Ramirez, A.
(2012), “Forex Market is to be known as the world‟s largest
financial market because it is estimated of at least $1.5 - $4
trillion in currencies is traded on daily basis.‟ To have a
comparison of a stock exchange market and forex exchange
market, it would take three months for a stock exchange
market to reach what forex exchange market does in a day.
This is due to reasons such as the market is open for 24 hours
which means there is time restriction for investors to trade but
due to time zones, the currencies being traded would differ as
some currencies might not be active. In forex trading, the
currencies have base currencies and supporting currencies as
for example is EURUSD where EUR would be the base
currency and USD would be the supporting currency. In forex
market, it involves two different types of markets which is
Bullish and Bearish Market. Forex market is used in two
different forms which are technical analysis or fundamental or
both. Forex trading is practiced in Malaysia using many
different platforms such as ForexTime, Trade360, Plus500,
FxPro, HyMarkets, AxiaTrade, HotForex platforms and many
other platforms. Researcher have chosen Axiatrade platform to
perform the technical analysis.
2.0 PROBLEM STATEMENT
Bottom to top investment analysis strategy has been studied
since decades ago and this strategy have “showed that there

Subramaniam A/L Ponnusamy, Vikneswaran S/O Manual- A Study on Financial
Indicators’ Reliability in Technical Analysis
EUROPEAN ACADEMIC RESEARCH - Vol. IV, Issue 8 / November 2016
6810
was some profitability by using bottom to top investment
analysis strategy but it was limited by the reliability on the
trading signals” according to Papadamou, S (2001) and thus
weakened the researcher‟s conclusions. 1/3 of the researches
that was done, the profitability was on spot by using the
technical analysis strategy. This might have been caused many
issues such as indicators, misconceptions, lack of knowledge,
greed, fear, behavior and so on.
It was identified that the certainty level via technical
indicators of a bottom to top investment analysis strategy is not
reliable. Many methods have been used to identify the
prediction power of technical analysis strategy. Putting the
predictive power of this analysis aside, the persistence of the
results from technical analysis is also questioned. Levish, R and
Thomas, L (1991) have stated that “when technical analysis
users use this trading technique for a very long period it would
result in high profitability but it will eventually decline”.
From the past researcher, it was found that the
technical analysis indicators may not be as powerful as it is
being claimed. According to Larsen, J.I (2010), “moving average
indicator is very volatile as the only factor taken into account is
the difference to fluctuate by time period‟. The author also
stated that using these indicators in a large application would
be problematic. Murphy, J.J (1999) has stated that technical
analysis indicators do not go by the rules. Following the rules
would help the investors to eventually reduce the chance of poor
decision making. Researcher also said that data such as price,
volume and interest are the primary data considered rather
than the indicators which is secondary to them”. Keene, A
(2014) has said that “almost all technical indicators have
problems as they are not future based due to the development
of lag where it leads the investors to makes decision too early or
too late”.
Bowley, T (2015), Buying or selling a stock simply
because "this line crosses that line" is a recipe for disaster.

Subramaniam A/L Ponnusamy, Vikneswaran S/O Manual- A Study on Financial
Indicators’ Reliability in Technical Analysis
EUROPEAN ACADEMIC RESEARCH - Vol. IV, Issue 8 / November 2016
6811
Indicator‟s most fundamental use is to read signals and make
decision. Out of many indicators that have been listed in the
background of study, the chosen indicators in this study are
only the Moving Average Convergence Divergence (MACD)
Indicator, Relative Strength Index (RSI) Indicator and lastly
Stochastic Oscillator indicator. These indicators are chosen
specifically because these indicators are claimed to be famous,
reliable and mostly used indicators.
According to Larsen, J.I (2010), “Relative Strength Index
indicator leaves out the price patterns and thus it is too
volatile”. Meanwhile, Gold, S (2015) has said that RSI is the
most reliable and profitable indicator that is available for
investors to use. For MACD indicator on the other hand,
Rosillo, R. et. al (2013) has said that out of 4 top indicators used
to test the profitability, MACD has scored the lowest
profitability. Contrary from the study of Eric, D. (2009), MACD
is the best indicator and increases profitability. Muranaka, K
(2000) have wrote an article stating that Stochastic Oscillator
increases the accuracy of predicting the future movement of
price. Thorp, W.A (2000) mentioned that due to the market
volatility, it is difficult for an investor to take a decision via
signals given out by the stochastic oscillator indicator which are
said to be noisy.
3.0 RESEARCH OBJECTIVE
The main objective of this research paper is to study the
reliability of using each one of these indicators in the bottom to
top decision analysis in making profit during trading using the
standard rules;
To examine the reliability of using Moving Average
Convergence/Divergence (MACD) indicators in technical
analysis using the standard rules.
Subramaniam A/L Ponnusamy, Vikneswaran S/O Manual- A Study on Financial
Indicators’ Reliability in Technical Analysis
EUROPEAN ACADEMIC RESEARCH - Vol. IV, Issue 8 / November 2016
6812
To examine the reliability of using the relative strength
index indicator in technical analysis using the standard
rules.
To examine the reliability of using the Stochastic
oscillator indicator in technical analysis using the
standard rules.
4.0 RESEARCH QUESTION
The main research question in this research paper is;
To study about the reliability of using financial
indicators in bottom to top investment strategy analysis
in currency market to make profit
Other research questions are as follows:
To what extend does Moving Average
Convergence/Divergence (MACD) indicator is useful n
effective as a tool to be used in technical analysis by the
investors to make profit
To what extend does the relative strength index (RSI)
indicator is effective in the decisions made by the
investor to make profit
To what extend does Stochastic Oscillator indicator is
effective and useful in the technical analysis strategy to
make profit in the market
5.0 LITERATURE REVIEW
5.1 Technical Analysis (DV)
Firstly, what is technical analysis? Technical analysis is a
study of market where the movement of price is represented in
different types of charts such as bar chart, candlestick chart
and line chart. These charts represent the price movement with
the openings and the closings of price for each timeframe
chosen. Market consists of three different types of source which
is price, volume, trend and interest. Technical analysis was first

Subramaniam A/L Ponnusamy, Vikneswaran S/O Manual- A Study on Financial
Indicators’ Reliability in Technical Analysis
EUROPEAN ACADEMIC RESEARCH - Vol. IV, Issue 8 / November 2016
6813
introduced in the 1900‟s and it was developed by Charles Dow
through the Dow Theory. From the Dow Theory, principles such
as price trending, charting, support level and resistance levels
were derived. Technical analysis is an analysis used to analyze
and predict the future movement of assets or currency from the
past which is supported by the technical analysis philosophies.
There are three philosophies that are involved in technical
analysis which are market action discounts everything, price
moves in trends and history repeats itself.
Since technical analysis is made up of charts, it is a
graphical representation of price movement over a certain time
period that was chosen by the investor. Each one of the chart
has a different type of phycology impact for investors when it is
in use and it‟s very subjective depending on the convenient of
the investor but the purpose of the charts is still the same
which is to ease the predicament of the market movement by
investors. The three main types of charts found are the line
chart, bar chart and candlestick chart.
5.2 Hypothesis Formulation
From the above literature review, the following hypotheses can
be generated.
H0 = The Moving Average Convergence/Divergence (MACD), a
financial indicator which uses the standard preset rules in
showing a reliable trading signals for generating profit is
unreliable.
H1 = The Moving Average Convergence/Divergence (MACD), a
financial indicator which uses the standard preset rules in
showing a reliable trading signals for generating profit is
reliable.
H0 = The Relative Strength Index (RSI), a financial indicator
which uses the standard preset rules in showing a reliable
trading signals for generating profit is unreliable.
Subramaniam A/L Ponnusamy, Vikneswaran S/O Manual- A Study on Financial
Indicators’ Reliability in Technical Analysis
EUROPEAN ACADEMIC RESEARCH - Vol. IV, Issue 8 / November 2016
6814
H1 = The Relative Strength Index (RSI), a financial indicator
which uses the standard preset rules in showing a reliable
trading signals for generating profit is reliable
H0 = The Stochastic Oscillator, a financial indicator which uses
the standard preset rules in showing a reliable trading signals
for generating profit is unreliable.
H1 = The Stochastic Oscillator, a financial indicator which uses
the standard preset rules in showing a reliable trading signals
for generating profit is reliable.
6.0 METHODOLOGY
In this research study, the researcher will be examining the
reliability of the three chosen financial indicators that are
commonly used by investors in Malaysia to make investment
through bottom to top investment strategy analysis in different
markets such as Forex, Options, Stocks and so on. The three
chosen financial indicators are Moving Average
Convergence/Divergence (MACD) indicator, Relative Strength
Index (RSI) indicator and lastly the Stochastic Oscillator
indicator. These three indicators would be the Independent
Variable (IV) in this research paper, whereas the reliability of
these indicators in bottom to top or also known as technical
analysis would be the Dependent Variable (DV).
This chapter is comprised of how the research is
designed in this study, what are the 3 different financial
indicators used, how these indicator variables are measured,
sampling design, data collection method and finally the data
analysis procedure.
6.1 Research Design
This research study will be undergoing research design of Meta-
Analysis. This research paper is carried out using quantitative
method. Quantitative method is a research method that used to
explain the issue or topic by collecting numerical data that are
Subramaniam A/L Ponnusamy, Vikneswaran S/O Manual- A Study on Financial
Indicators’ Reliability in Technical Analysis
EUROPEAN ACADEMIC RESEARCH - Vol. IV, Issue 8 / November 2016
6815
analyzed using mathematically based method. This research
methodology would be able to provide a better analytical
research and results for the investors when they use financial
indicators for bottom to top investment strategy analysis.
Researcher also believes that qualitative research method
would be able to provide more reliable research results.
Researcher will be using primary data and also self-reviewing
assessment for further clarification. Researcher will be trading
using forex trading platform to obtain results.
7.0 DATA ANALYSIS
In the data analysis, researcher will be using financial
indicator‟s formulae to identify the average of market price
movements for EURUSD currency throughout the two weeks.
To add on top of that, the researcher will also be calculating the
gains or losses that have been made from the trades on daily
basis for every trade and for each one of the indicators
separately. Finally, after two weeks of trading, the researcher
will be adding up the number of times profit was made for the
two week and divides them by the total number of trades placed
multiplied with 100 for each indicator to derive at efficiency or
how reliable are the indicators for an investor to use them as a
main financial indicator during their investment period.
Researcher will be trading from 5 trades to 8 trades every day
for 10 days in two weeks for each chosen indicator. The trades
will be carried out for a two weeks long. The formulae will be
used to calculate three different times for the three different
indicators. The formulae to calculate the efficiency or how
reliable the indicators are as follow;

Subramaniam A/L Ponnusamy, Vikneswaran S/O Manual- A Study on Financial
Indicators’ Reliability in Technical Analysis
EUROPEAN ACADEMIC RESEARCH - Vol. IV, Issue 8 / November 2016
6816
8.0 FINDINGS AND INTERPRETATION
8.1 Percentage of Profit and loss
Table 11 – Percentage of Profit and Loss
From the Table 11 above, the percentage of profit for Moving
Average Convergence/Divergence (MACD Indicator, Relative
Strength Index and Stochastic Oscillator Indicator is 29%, 45%
and 45% respectively while the percentage of loss is 71%, 55%
and 55% respectively. The percentage of profit was calculated
by taking the number of profit trades divided by the total
number of trades placed during the two weeks of trading period
while the percentage of loss was calculated by taking the
number of loss trades divided by the total number of trades
placed during the two weeks of trading period. For an indicator
to be reliable to be used by investors should at least be valued
at 50% to be considered that the indicator is reliable and the
indicator could be used by investor to generate profit. Any
percentage below 50% would be considered as unreliable as the
risk taken by the investor by relying on the indicator is too high
compared to the rewards expected by the investors.
From the result obtained in the above table, Stochastic
Oscillator Indicator and Relative Strength Index Indicator have
obtained the highest percentage of profit trades which is valued
at 45% while Moving Average Convergence/Divergence
Indicator scored lower with 29%. From this result, the
researcher can conclude that all three financial indicators are
Financial Indicator Total number
of trades
Profits from
the trades
Loss from the
trades
Percentage of
Profit
Percentage of
Loss
Stochastic Oscillator 127 57 70 45 55
Moving Average
Convergence/Divergence
(MACD)
76 22 54 29 71
Relative Strength Index
(RSI)87 39 48 45 55

Subramaniam A/L Ponnusamy, Vikneswaran S/O Manual- A Study on Financial
Indicators’ Reliability in Technical Analysis
EUROPEAN ACADEMIC RESEARCH - Vol. IV, Issue 8 / November 2016
6817
not reliable but Stochastic Oscillator and Relative Strength
Index Indicator has performed better than Moving Average
Convergence/Divergence Indicator. To obtain a more accurate
result between the chosen financial indicators, researcher have
performed other test to confirm this result as it will be
described and shown below.
8.2 Total Net Profit or Net Loss
Moving Average
Convergence / Divergence
(MACD)
Relative Strength
Index (RSI)
Stochastic
Oscillator
Total Net Loss or
Net Profit ($2,059) ($948) ($1,400)
Table 12 – Net Profit or Net Loss
Table 12 above shows the total net loss that was made by each
one of the indicator from the trades placed by trading signals
released by them. Researcher had an opening balance of
$100,000 USD before the 29th August 2016. Researcher had a
balance of $95,593 USD after the 14th September 2016 which
shows the trading account was on the net loss. The net loss was
contributed by the three indicators. The net loss or net profit
was calculated by taking all the end result whether profit or
loss in dollars and totaled up for every one of the financial
indicator.
The indicator Moving Average Convergence/Divergence
(MACD), Relative Strength Index (RSI), Stochastic Oscillator
Indicators have recorded a net loss of $2059 USD, $948 USD
and $1400 USD respectively. Moving Average
Convergence/Divergence (MACD) Indicator has recorded the
highest losses followed by the Stochastic Oscillator Indicator
and lastly by the Relative Strength Index (RSI) Indicators with
the net loss of only $948 USD. By comparing these three
financial indicators, Relative Strength Index (RSI) Indicator
have outperformed the other two financial indicators by making
the least net loss.

Subramaniam A/L Ponnusamy, Vikneswaran S/O Manual- A Study on Financial
Indicators’ Reliability in Technical Analysis
EUROPEAN ACADEMIC RESEARCH - Vol. IV, Issue 8 / November 2016
6818
8.3 Average Net Profit or Net Loss
Moving Average
Convergence/Divergence (MACD) Relative Strength Index (RSI) Stochastic Oscillator
Time
Series
Graph
AverageProfit Average Loss Average Profit Average Loss Average Profit Average Loss
$11 ($302) $57 ($171) $8 ($132)
Average
Net
Profit
or Net
Loss
($291) ($114) ($124)
Table 13 – Average Net Loss or Net Profit
Table 13 above displays the average earning and losses for the
three financial indicators daily and the average net loss for
each indicator. The average net profit and net loss was derived
by adding up the average profit and average loss. The average
profit for the indicator should be high while the average loss for
indicator should be as low as possible and the average net loss
should be also in the lowest value to obtain the best financial
indicator among these three indicators.
From the Table 13 above, Moving Average
Convergence/Divergence (MACD) Indicator have recorded an
average profit of $11 USD, average loss of -$302 USD and thus
the average net loss was recorded at -$291 USD. The Relative
Strength Index Indicator have recorded an average profit of $57
USD, average loss of -$171 USD and thus average net loss was
recorded at -$114 USD. Stochastic Oscillator on the other hand
have recorded an average profit of $8 USD, average loss of -
$132 USD and thus the average net loss was recorded at -$124
USD. It can be concluded that Relative Strength Index (RSI)
Indicator have again outperformed the other two indicators by
having highest average profit of $57 USD, average loss of -$171
USD and thus average net loss was recorded at -$114 USD
which is the lowest value among other indicators.
Subramaniam A/L Ponnusamy, Vikneswaran S/O Manual- A Study on Financial
Indicators’ Reliability in Technical Analysis
EUROPEAN ACADEMIC RESEARCH - Vol. IV, Issue 8 / November 2016
6819
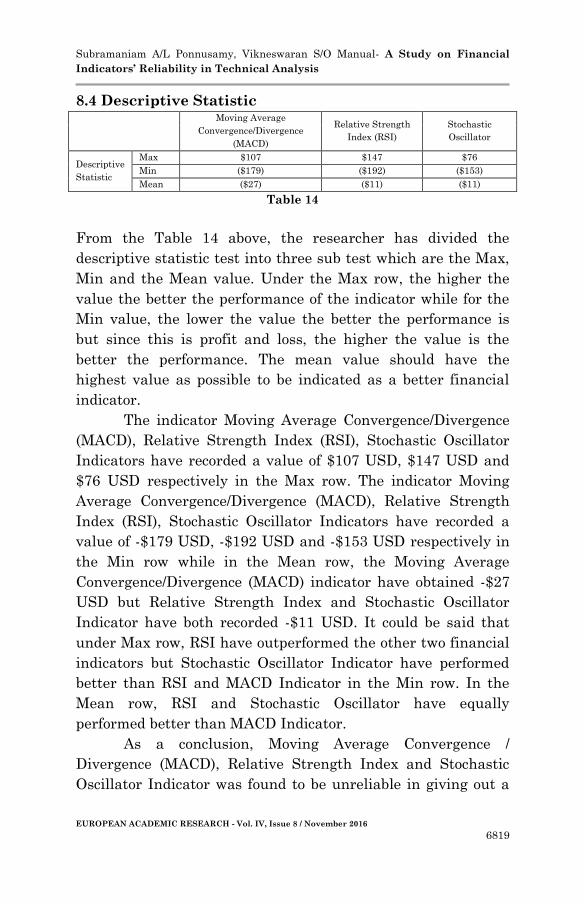
8.4 Descriptive Statistic
Moving Average
Convergence/Divergence
(MACD)
Relative Strength
Index (RSI)
Stochastic
Oscillator
Descriptive
Statistic
Max $107 $147 $76
Min ($179) ($192) ($153)
Mean ($27) ($11) ($11)
Table 14
From the Table 14 above, the researcher has divided the
descriptive statistic test into three sub test which are the Max,
Min and the Mean value. Under the Max row, the higher the
value the better the performance of the indicator while for the
Min value, the lower the value the better the performance is
but since this is profit and loss, the higher the value is the
better the performance. The mean value should have the
highest value as possible to be indicated as a better financial
indicator.
The indicator Moving Average Convergence/Divergence
(MACD), Relative Strength Index (RSI), Stochastic Oscillator
Indicators have recorded a value of $107 USD, $147 USD and
$76 USD respectively in the Max row. The indicator Moving
Average Convergence/Divergence (MACD), Relative Strength
Index (RSI), Stochastic Oscillator Indicators have recorded a
value of -$179 USD, -$192 USD and -$153 USD respectively in
the Min row while in the Mean row, the Moving Average
Convergence/Divergence (MACD) indicator have obtained -$27
USD but Relative Strength Index and Stochastic Oscillator
Indicator have both recorded -$11 USD. It could be said that
under Max row, RSI have outperformed the other two financial
indicators but Stochastic Oscillator Indicator have performed
better than RSI and MACD Indicator in the Min row. In the
Mean row, RSI and Stochastic Oscillator have equally
performed better than MACD Indicator.
As a conclusion, Moving Average Convergence /
Divergence (MACD), Relative Strength Index and Stochastic
Oscillator Indicator was found to be unreliable in giving out a
Subramaniam A/L Ponnusamy, Vikneswaran S/O Manual- A Study on Financial
Indicators’ Reliability in Technical Analysis
EUROPEAN ACADEMIC RESEARCH - Vol. IV, Issue 8 / November 2016
6820
reliable trading signals for investors to generate profit using
the standard preset rules. Among these three financial
indicators, Relative Strength Index (RSI) Indicator was found
to be performing better than the other two financial indicators
tested. Relative Strength Index (RSI) Indicator has performed
well in keeping the lowest loss value throughout the whole two
trading week, the maximum profit hit was also higher and
finally the average earning of using this indicator was also
higher than Moving Average Convergence/Divergence (MACD)
and Stochastic Oscillator Indicator.
9.0 HYPOTHESIS AND OBJECTIVE TESTING
9.1 Moving Average Convergence/Divergence (MACD)
Indicator
The hypothesis developed for this indicator is as follows;
H0 = The Moving Average Convergence/Divergence
(MACD), a financial indicator which uses the standard
pre-set rules in showing a reliable trading signals for
generating profit is unreliable
H1 = The Moving Average Convergence/Divergence
(MACD), a financial indicator which uses the standard
pre-set rules in showing a reliable trading signals for
generating profit is reliable
The objective developed for this indicator is as follows;
To what extend does Moving Average
Convergence/Divergence (MACD) indicator is useful n
effective as a tool to be used in technical analysis by the
investors to make profit
The instrument used to measure the hypothesis and to
determine where the researcher achieved the objective of this
research study is by using the overall percentage of profit made
by the indicator throughout the two weeks of trading period. An
Subramaniam A/L Ponnusamy, Vikneswaran S/O Manual- A Study on Financial
Indicators’ Reliability in Technical Analysis
EUROPEAN ACADEMIC RESEARCH - Vol. IV, Issue 8 / November 2016
6821
indicator to be reliable in releasing a reliable trading signals
must score at least 50%. Moving Average
Convergence/Divergence (MACD) financial indicator have
achieved an overall profit percentage of 29% and thus it could
be concluded that the research has accepted the null or H0
hypothesis of the Moving Average Convergence/Divergence
(MACD), a financial indicator which uses the standard pre-set
rules in showing a reliable trading signals for generating profit
is unreliable. Researcher was also able to achieve the objective
of this research of studying the indicator and got to know how
effective is the indicator as tool to be used in technical analysis
to generate profit.
This research result is supported by a study where it
indicated that Moving Average Convergence/Divergence
(MACD) financial indicator gives out a lot of signals which are
not reliable in a short period, does not generate profit, average
rate of return are low and profitable signals released are low
(Pradipbhai, N.P., 2013). The researcher used experimental
types of research to derive into the result. To add on top of that,
as per (Manesh, G., 2016), the author has indicated that
Moving Average Convergence/Divergence Indicator is not
reliable most of the time, it can‟t be used to forecast movement
of the market and the indicator is least useful when the market
movement fluctuates drastically. Chakrabarty, A. et al (2014)
have performed another study on the A Flexible Approach
Towards Multi-frequency Re-engineering of the Moving
Average Convergence Divergence Indicator using the Diebold–
Mariano test and out-of-the sample mean square error make
the research more viable. In this study, the researcher used the
normal pre-set standard rule of the indicator to determine the
signals ability for profitability and identified that the outcome
of the of the profitability is uncertain thus not reliable.
Subramaniam A/L Ponnusamy, Vikneswaran S/O Manual- A Study on Financial
Indicators’ Reliability in Technical Analysis
EUROPEAN ACADEMIC RESEARCH - Vol. IV, Issue 8 / November 2016
6822
9.2 Relative Strength Index (RSI) Indicator
The hypothesis developed for this indicator is as follows;
H0 = The Relative Strength Index (RSI), a financial
indicator which uses the standard preset rules in
showing a reliable trading signals for generating profit
is unreliable
H1 = The Relative Strength Index (RSI), a financial
indicator which uses the standard preset rules in
showing a reliable trading signals for generating profit
is reliable
The objective developed for this indicator is as follows;
To what extend does the relative strength index (RSI)
indicator is effective in the decisions made by the
investor to make profit
The instrument used to measure the hypothesis and to
determine where the researcher achieved the objective of this
research study is by using the overall percentage of profit made
by the indicator throughout the two weeks of trading period. An
indicator to be reliable in releasing a reliable trading signals
must score at least 50%. Relative Strength Index (RSI)
financial indicator have achieved an overall profit percentage of
45% and thus it could be concluded that the research has
accepted the null or H0 hypothesis of the Relative Strength
Index (RSI), a financial indicator which uses the standard pre-
set rules in showing a reliable trading signals for generating
profit is unreliable. Researcher was also able to achieve the
objective of this research of studying the indicator and got to
know how effective is the indicator as tool to be used in
technical analysis to generate profit.
Relative Strength Index (RSI) Indicator was studied by
(Lashkary, Z.H., et al, 2010) on the journal titled as Technical
analysis of FOREX by RSI Indicator which was stated that RSI
signals are not reliable because the signals given by the

Subramaniam A/L Ponnusamy, Vikneswaran S/O Manual- A Study on Financial
Indicators’ Reliability in Technical Analysis
EUROPEAN ACADEMIC RESEARCH - Vol. IV, Issue 8 / November 2016
6823
indicator is not constant for buy action and sell action. The
study proved that the indicator was giving out more buy signals
rather than sell signals and this study was conducted for 10
years long. Senft, E (2016) have released a secial report on RSI
mentioning that RSI Indicator are not dependable due to the
signals released. The signals released by the indicator is said to
be too early which causes the traders to lose money in trades or
investment rather than generating profit and the author also
mentioned that traders shall not follow the standard pre-set
rules where overbought area should be sold and oversold area
should be bought.
9.3 Stochastic Oscillator Indicator
The hypothesis developed for this indicator is as follows;
H0 = The Stochastic Oscillator, a financial indicator
which uses the standard preset rules in showing a
reliable trading signals for generating profit is
unreliable
H1 = The Stochastic Oscillator, a financial indicator
which uses the standard preset rules in showing a
reliable trading signals for generating profit is reliable
The objective developed for this indicator is as follows;
To what extend does Stochastic Oscillator indicator is
effective and useful in the technical analysis strategy to
make profit in the market
The instrument used to measure the hypothesis and to
determine where the researcher achieved the objective of this
research study is by using the overall percentage of profit made
by the indicator throughout the two weeks of trading period. An
indicator to be reliable in releasing a reliable trading signals
must score at least 50%. Stochastic Oscillator financial
indicator have achieved an overall profit percentage of 45% and
thus it could be concluded that the research has accepted the

Subramaniam A/L Ponnusamy, Vikneswaran S/O Manual- A Study on Financial
Indicators’ Reliability in Technical Analysis
EUROPEAN ACADEMIC RESEARCH - Vol. IV, Issue 8 / November 2016
6824
null or H0 hypothesis of the Stochastic Oscillator, a financial
indicator which uses the standard pre-set rules in showing a
reliable trading signals for generating profit is unreliable.
Researcher was also able to achieve the objective of this
research of studying the indicator and got to know how effective
is the indicator as tool to be used in technical analysis to
generate profit.
This finding was supported by (Grue and Øksendal,
1997) on a journal titled as A stochastic oscillator with time-
dependent damping where the results of the research showed
the Stochastic Oscillator Indictor does not provide a viable
signal due to the noises created by the indicator itself.
Moreover, Ni, Y. et al., (2015) conducted a research titled
Momentum Indicators in the Chinese Market and used
Stochastic Oscillator to run the study. The researcher has
stated that Stochastic Oscillator Indicator provide very reliable
signals and performs very well in the prediction of share
market price movement of companies in China.
As a conclusion, all three indicators which are the
Moving Average Convergence/Divergence (MACD) Indicator,
Relative Strength Index (RSI) Indicator and Stochastic
Oscillator Indicator does not provide a reliable trading signals
to investor and the trader as well in order to generate profit in
their investments and trading. Out of the results obtained from
this research, the indicators could be ranked from the least
performing indicator to the high performing indicator which
would be the Moving Average Convergence/Divergence (MACD)
Indicator followed by Stochastic Oscillator Indicator and then
Relative Strength Index (RSI) Indicator. The reason that the
indicators were not able to perform as per expectation could be
caused by few reasons. The first and most important reason is
because of the volatility of the market. The volatility of market
is unpredictable as the market could be moved by many reasons
such as news announcements, Nonfarm payroll and so on which
could make the market unpredictable (Yell, T. 2015). Other
Subramaniam A/L Ponnusamy, Vikneswaran S/O Manual- A Study on Financial
Indicators’ Reliability in Technical Analysis
EUROPEAN ACADEMIC RESEARCH - Vol. IV, Issue 8 / November 2016
6825
reason for the indicator for not perform well is because of the
big player in the market, the speculator, who trades or invest in
the market where their size of their investments could make
the market move in their direction. Other than that, signals
released by the indicators could be lagging at the same time too
early for the trade or investment to be placed. Perchanok, K.
and Hrytsyuk, I. (2013) have mentioned “indicators that shows
overbought or oversold zone in their chart would tend to stay in
that zone for a longer time period and trades should not take
places as it will only bring higher uncertainty of profitability”.
This has indicated the standard pre-set rules of the all three
indicators tested in this study was not reliable might have been
caused by this reason as when the price is on the overbought
zone, the trading signal shows that the trader should short/sell
where it has a high possibility that the price might just
continue to rise. Furthermore, indicator can be lagging most of
the time which could also be the reason why the indicators were
not giving out reliable trading signals and this is supported by
Krivo, R. (2012) where the author stated that indicators are
lagging behind the market. Lagging indicator could be said as
the trading signal moves at least 2 times slower than the real
price movement where by the time the trader enters trade, it
would already be too late for the trader to make profit as the
movement could be in a different direction by then. Other
causes for unreliable trading signals released by the indicators
is because of the external conditions in the country that would
affect the currency such as economic condition, interest rates,
political conditions, inflation rate, public debts, terms of trade
and current account deficit. There are journals and articles that
goes against my findings where it states that these indicators
are reliable. These indicators can be reliable when the
assumption such as economic condition, interest rates, political
conditions, inflation rate, public debts, terms of trade and
current account deficit are low and stable which is literally
impossible. Indicators used by itself is unreliable and for an
Subramaniam A/L Ponnusamy, Vikneswaran S/O Manual- A Study on Financial
Indicators’ Reliability in Technical Analysis
EUROPEAN ACADEMIC RESEARCH - Vol. IV, Issue 8 / November 2016
6826
indicator to be used to receive a reliable trading signal, the
indicator should be integrated with other indicators. This is
because one indicator could only be one form of energy in the
financial market thus the probability of generating profit
making is low. The main objectives of this research were to
study the reliability of the three indicators in the technical
analysis in generating profit using the standard pre-set rules.
This study is very important because amateur and scalping
traders who have recently joined trading or even into investing
would blindly belief that these indicators would be able to
generate them profit because the theories that was used to
develop these indicators have strongly suggested them this
idea. It is very important for traders to take note that these
indicators would only be following these beliefs when there are
certain criteria that must be fulfilled as for example, having a
perfect economic condition. It is also essential for the
academician to mention this issue to their students so that the
newer generation would have a smoother learning curve in
trading and investing.
Recommendation for Further Research
Further research should be conducted to determine the
reliability on the trading signals after using integration of few
different types of indicators to generate profit. According to
Amadeo, K. (2016), lagging indicator should be used together
with different types of indicator such as leading and cycle
indicators to have a better chance of generating profit as it
provides different types energies in the market. In spite of the
drastic growth of the usage of technical analysis in this new era
(Elmerraji, J., 2015), there is a very little research that have
been conducted to explore the impacts of using the indicators
alone or integrated to receive trading signals, strength and
weaknesses of financial indicators in technical analysis, chart
pattern techniques and other so claimed reliable trading
techniques should be tested. It is also necessary for the further

Subramaniam A/L Ponnusamy, Vikneswaran S/O Manual- A Study on Financial
Indicators’ Reliability in Technical Analysis
EUROPEAN ACADEMIC RESEARCH - Vol. IV, Issue 8 / November 2016
6827
research to be conducted for at least 1 year to obtain a more
reliable set of data‟s. Further research should also be able to
explore many other indicators to check on the reliability of
those indicators by stand-alone and by integration. Researcher
would also like to address that a further research could be done
using other currency pair as this research was restricted to
EUR/USD currency pair only. Lastly, further research should
be done in a way that the research paper would be beneficial for
the academician and would give a positive impact on the
economic growth.
10.0 RECOMMENDATIONS AND CONCLUSION
In the effort of traders or investors to generate profit in the
financial market such as forex, index, stock market,
commodities and so on, the traders need to understand that
trading and investing both have so many criteria to be fulfilled
in order to generate consistent profit. First and most important
rule that must fulfilled by traders is controlling their
phycological mind games by acting discipline in their trading
strategies and sticking to one reliable technique. Traders
should also prepare money and risk management strategy
before entering a trade and this is to make sure the trader
keeps a detailed record of cash flow. The risk management
allows the trader to set a stop loss order where it is the
maximum amount the trader is willing to loss for that specific
trade.
This research was developed for the purpose of
determining the reliability of using financial indicator as a
guide in providing a reliable trading signals which would help
or assist traders and investors to generate profit which was also
the objective of this study. Researcher have used technical
analysis as a tool to progress in this study. Technical analysis is
a strategy that has a visualized price movement represented in
different type of charts such as bar, candlestick and line chart.

Subramaniam A/L Ponnusamy, Vikneswaran S/O Manual- A Study on Financial
Indicators’ Reliability in Technical Analysis
EUROPEAN ACADEMIC RESEARCH - Vol. IV, Issue 8 / November 2016
6828
The financial market that was chosen for the testing was the
forex market where it is the foreign currency exchange market
using the Meta Trader 4 platform and the platform provider is
the AxiaTrade.co. This study has chosen Moving Average
Convergence/Divergence (MACD) Indicator, Relative Strength
Index Indicator and Stochastic Oscillator Indicator as the
independent variable. From the test that was performed to
measure the independent variable, it was identified that none
of the chosen indicator that were reliable due to score of below
50%. Even though all the chosen indicators were found to be
unreliable, Relative Strength Index (RSI) Indicator could still
be said as a better indicator compared to the other two after
pursuing further test. Indicator was found not reliable due to
few misconceptions, lagging, economic problem, news
announcement and so on.
REFERENCE
1. Amadeo, K. (2016) 3 lagging indicators to watch right now.
Available at: https://www.thebalance.com/lagging-economic-
indicators-list-index-and-top-3-3305860 (Accessed: 24
October 2016).
2. Andrew, K. (2014). The World’s Best Technical Indicator:
The Ichimoku Cloud. Available:
http://www.alphashark.com/wp-
content/uploads/2014/02/Ichimoku-Cloud-E-Book.pdf. Last
accessed 5th June 2016.
3. Appel, G. (2003). Become you own technical analyst: How to
identify significant market turning points using MACD
Indicator or MACD.Summer. 1 (1), p27-p36.
4. Bhandari, B. (2011). TRADING TECHNIQUES Trading
stocks with MACD.Futures. 1 (1), p.32-36.

Subramaniam A/L Ponnusamy, Vikneswaran S/O Manual- A Study on Financial
Indicators’ Reliability in Technical Analysis
EUROPEAN ACADEMIC RESEARCH - Vol. IV, Issue 8 / November 2016
6829
5. Bowley, T. (2015). The Power Of The MACD. Available:
https://stockcharts.com/articles/tradingplaces/2015/07/the-
power-of-the-macd.html. Last accessed 5th June 2016.
6. Brown, S.J. et al. (1998). The Dow Theory: William Peter
Hamilton's Track Record Reconsidered. The Journal of
Financial Research. 53 (4), p1311-p1333.
7. Buenrostro, B. et al. (2012). FOREX Investment and
Trading. Available: https://www.wpi.edu/Pubs/E-
project/Available/E-project-100412-
095613/unrestricted/Group8.IQP.10.1.pdf. Last accessed 7th
June 2016.
8. Chakrabarty, A., De, A. and Dubey, R. (2014) „A flexible
approach towards multi-frequency re-engineering of the
moving average Convergence divergence indicator‟, Global
Journal of Flexible Systems Management, 15(3), pp. 219–
234. doi: 10.1007/s40171-014-0068-7.
9. Chong, T.T.L et al.. (2008). Technical analysis and the
London stock exchange: testing the MACD and RSI rules
using the FT30. Applied Economies Letters. 1 (15), p1111–
p1114.
10. Clements, M. (2010) RELATIVE STRENGTH INDEX
Measuring the speed of the market. Available at:
http://www.technicalanalyst.co.uk/wp-
content/uploads/2014/02/TTAJAN2010_7063.pdf (Accessed:
14 October 2016).
11. Credit Suisse. (2010). Technical Analysis -
Explained. Available: https://www.credit-
suisse.com/pwp/pb/pb_research/technical_tutorial_de.pdf.
Last accessed 7th June 2016.
12. Daigler, R.T. et al. . (1981). A multiple Discriminant
Analysis of technical indicators on the New York Stock
Exchange. The Journal of Financial Research. 4 (3), p169-
p180.

Subramaniam A/L Ponnusamy, Vikneswaran S/O Manual- A Study on Financial
Indicators’ Reliability in Technical Analysis
EUROPEAN ACADEMIC RESEARCH - Vol. IV, Issue 8 / November 2016
6830
13. Deng, S. S. (2014). Integrated model of multiple kernel
learning and differential evolution for EUR/USD
trading. TheScientificWorld. 14 (12), p1-p12.
14. Dolvin, S.D.. (2014). THE EFFICACY OF TRADING
BASEÍJ ON MOVING AVERAGE INDICATORS: AN
EXTENSION. Summer. 1 (1), p52-p57.
15. DowTheoryForecasts. (2015). THE DOW THEORY: More
than 100 years of practical guidance to stock investors.
Indiana: Horizon Publishing Company. p46-p81.
16. Elmerraji, J. (2015) Does technical trading really work?
Technical analysis 101. Available at:
https://www.thestreet.com/story/11089457/1/does-technical-
trading-really-work.html (Accessed: 24 October 2016).
17. Eric, D. et al.. (2009). Application of MACD and RVI
indicators as functions of investment strategy optimization
on the fi nancial market.ZbradEkonfakRij.. 27 (1), p171-
p194.
18. Evens, S. (1999) „Momentum And Relative Strength
Index‟, Stock And Commodities, 17(8), pp. 1–6.
19. FADLALLA, A. et al.. (2014). Predicting Next Trading Day
Closing Price of Qatar Exchange Index Using Technical
Indicators and Artificial Neural Networks. Intelligent
Systems in Accounting, Finance and Management. 21 (1),
p209–p223.
20. Folger, J.. (2015). Building a system with simple technical
tools.Futures. 1 (1), p36-p40.
21. Geetha, E. and Swaaminathan, T.M. (2015) „An analysis on
MACD – compatible technical indicator for stock price
movements‟, Asian Journal of Research in Business
Economics and Management, 5(9), p. 38. doi: 10.5958/2249-
7307.2015.00171.1.
22. Gold, S.. (2016). The Viability of Six Popular Technical
Analysis Trading Rules in Determining Effective Buy and
Sell Signals: MACD, AROON, RSI, SO, OBV, and
ADL. Journal of Applied Financial Research. 1 (1), p8-p27.

Subramaniam A/L Ponnusamy, Vikneswaran S/O Manual- A Study on Financial
Indicators’ Reliability in Technical Analysis
EUROPEAN ACADEMIC RESEARCH - Vol. IV, Issue 8 / November 2016
6831
23. González, A.R. et al.. (2011). CAST: Using neural networks
to improve trading systems based on technical analysis by
means of the RSI financial indicator. Expert Systems with
Applications. 38 (1), p11489–p11500.
24. Grue, J. and Øksendal, B. (1997) „A stochastic oscillator
with time-dependent damping‟, Stochastic Processes and
their Applications, 68(1), pp. 113–131. doi: 10.1016/s0304-
4149(97)83373-x.
25. Jawade, A.A. et al.. (2015). Performance of Oscillators:
Index Futures. SCMS Journal of Indian Management. 1 (1),
p51-p61.
26. John Wiley and Sons. (2016). Foundations of Technical
Analysis: Computational Algorithms, Statistical Inference,
and Empirical Implementation. Available:
http://onlinelibrary.wiley.com/doi/10.1111/0022-
1082.00265/abstract. Last accessed 7th June 2016.
27. Krivo, R. (2012) The Benefits of Using a Lagging Indicator.
Available at:
https://www.dailyfx.com/forex/education/trading_tips/post_o
f_the_day/2012/02/17/The_Benefits_of_Using_a_Lagging_In
dicator.html (Accessed: 24 October 2016).
28. Larsen, J.I. (2010). Predicting Stock Prices Using Technical
Analysis and Machine Learning. Available: http://www.diva-
portal.org/smash/get/diva2:354463/FULLTEXT01.pdf. Last
accessed 7th June 2016.
29. Lo, A.W. et al. (2000). Foundations of Technical Analysis:
Computational Algorithms, Statistical Inference, and
Empirical Implementation. The Journal of Finance. 4 (4),
p1707- p1716.
30. LuckScout. (2016). Pros and Cons of Using Stochastic
Indicator in Forex Trading. Available:
http://www.luckscout.com/stochastic-indicator-in-forex-
trading/. Last accessed 5th June 2016.
31. Manesh, G. (2012) Has Macd Always Been a Reliable
Indicator in Fx Trading? Available at:
Subramaniam A/L Ponnusamy, Vikneswaran S/O Manual- A Study on Financial
Indicators’ Reliability in Technical Analysis
EUROPEAN ACADEMIC RESEARCH - Vol. IV, Issue 8 / November 2016
6832
https://www.dukascopy.com/fxcomm/fx-article-contest/?Has-
Macd-Always-Been-A=&action=read&id=997 (Accessed: 24
October 2016).
32. Michael, K. (2007). A Beginner’s Guide to Charting
Financial Markets. London: Harriman House. p1-p69.
33. Monica, G. (2010). Drawbacks Of Relative Strength Index
(RSI).Available: http://www.benzinga.com/forex/forex-
101/114675/drawbacks-of-relative-strength-index. Last
accessed 7th June 2016.
34. Murphy, J.J. (1999). Technical Analysis Financial Markets
A Comprehensive Guide To Trading Methods And
Applications. New York: New York Institute of Finance. p6
– p387.
35. Neely, C.J. and Weller, P.A.(2011). Technical Analysis in the
Foreign Exchange Market. Available:
https://research.stlouisfed.org/wp/2011/2011-001.pdf. Last
accessed 7th June 2016.
36. Neftci, S.N. (1991). Naive Trading Rules in Financial
Markets and Wiener-Kolmogorov Prediction Theory: A
Study of "Technical Analysis”. The Journal of Business. 64
(4), p549-p571.
37. Ni, Y. et al.. (2015). Momentum in the Chinese Stock
Market: Evidence from Stochastic Oscillator
Indicators. Emerging Markets Finance & Trade. 51 (1), p99-
p110.
38. Papadamou, S. and Tsopoglou, S.(2001). Investigating the
profitability of technical analysis systems on foreign
exchange markets", Managerial Finance. University of
Macedonia. 27 (8), p63 - p78
39. Penn, D. (2009) The Three Secrets to Trading Momentum
Indicators. United States: Marketplace Books Inc.
40. Perchanok, K. and Hrytsyuk, I. (2013) „The encyclopedia of
the indicator RSI (relative strength index) 2013. By Kirill
Perchanok and Iryna Hrytsyuk. The encyclopedia of the
indicator RSI (relative strength index). 2011. Library of

Subramaniam A/L Ponnusamy, Vikneswaran S/O Manual- A Study on Financial
Indicators’ Reliability in Technical Analysis
EUROPEAN ACADEMIC RESEARCH - Vol. IV, Issue 8 / November 2016
6833
congress control number: 2011916105‟, Corporate
Governance: The international journal of business in society,
13(2), pp. 218–219. doi: 10.1108/14720701311316698.
41. Pinoy Investor. (2016). Technical Analysis (Part 1):
Introduction.Available:
http://www.pinoyinvestor.com/smartinvestor/technical-
analysis-part-1-introduction/. Last accessed 7th June 2016
42. Porfiri, M. et al.. (2008). Master-Slave Global Stochastic
Synchronization of Chaotic Oscillators. Applied Dynamical
Systems. 7 (3), p825–p842.
43. Pradipbhai, N.P. (2012) „Comparison between exponential
moving average based MACD with simple moving average
based MACD of technical analysis‟, International Journal of
Scientific Research, 2(12), pp. 189–197. doi:
10.15373/22778179/dec2013/60.
44. Quigley, C.M. (2015). The Key To Understanding Stock
Market Movement .Available:
http://www.financialsense.com/sites/default/files/users/u111/
pdfs/2015/dow-theory-the-key-to-stock-market.pdf. Last
accessed 7th June 2016.
45. Rockefeller, B. (2011). Technical Analysis For Dummies. 2nd
ed. Indiana: Wiley Publishing Inc.. p46-p81.
46. Rosillo, R. et al.. (2013). Technical analysis and the Spanish
stock exchange: testing the RSI, MACD, momentum and
stochastic rules using Spanish market companies. Applied
Economics. 45 (1), p1541–p1550.
47. Rudik, N.I. (2013) „The encyclopedia of the indicator RSI
(relative strength index)20131By Kirill Perchanok and
Iryna Hrytsyuk.The encyclopedia of the indicator RSI
(relative strength index). 2011. Library of congress control
number: 2011916105‟, Corporate Governance: The
international journal of business in society, 13(2), pp. 218–
219. doi: 10.1108/14720701311316698.
48. Senft, E. (2016) „RSI: Trader‟s Secret Weapon‟, Indicator
Warehouse, 1(1), pp. 2–15.

Subramaniam A/L Ponnusamy, Vikneswaran S/O Manual- A Study on Financial
Indicators’ Reliability in Technical Analysis
EUROPEAN ACADEMIC RESEARCH - Vol. IV, Issue 8 / November 2016
6834
49. Siligardos, G.E (2008). Leader Of The MACD. Available:
http://traders.com/Documentation/FEEDbk_docs/2008/07/Ab
stracts_new/Siligardos/siligardos.html. Last accessed 2nd
June 2016.
50. StockCharts. (2016). What is Technical Analysis?. Available:
http://stockcharts.com/school/doku.php?id=chart_school:over
view:technical_analysis. Last accessed 7th June 2016.
51. Suresh A.S. (2013). A Study on Fundamental and Technical
Analysis. International Journal of Marketing, Financial
Services & Management Research. 2 (5), p15 17..
52. Thorp, W.A. (2016). ID'ing When to Buy and Sell Using the
Stochastic Oscillator. Available:
http://www.aaii.com/journal/article/id-ing-when-to-buy-and-
sell-using-the-stochastic-oscillator. Last accessed 7th June
2016.
53. Thorp, W.A. (2016). Measuring Internal Strength: Wilder's
RSI Indicator. Available:
http://finance.wharton.upenn.edu/~bodnarg/courses/nbae/re
adings/Forex%20forecasting.pdf. Last accessed 7th June
2016.
54. Tradeciety. (2016). MACD – How To Use The MACD
Correctly.Available: http://www.tradeciety.com/tips-how-to-
use-the-macd/. Last accessed 6th June 2016.
55. YAZDI, S.H.M., LASHKARY, Z.H. and ISMAIL, I. (no
date) Technical analysis of FOREX by RSI Indicator.
Available at:
file:///C:/Users/User/Downloads/Technical_analysis_of_FOR
EX_by_RSI_Indic.pdf (Accessed: 22 October 2016).
56. Yell, T. (2015) Deciding Which Currency Pair to Trade When
Big News Hits. Available at:
https://www.dailyfx.com/forex/education/trading_tips/trend_
of_the_day/2015/02/12/How-to-Trade-The-News-2015.html
(Accessed: 24 October 2016).