a study of the relationship among certain measures of
TRANSCRIPT

Loyola University Chicago Loyola University Chicago
Loyola eCommons Loyola eCommons
Master's Theses Theses and Dissertations
1959
A Study of the Relationship Among Certain Measures of A Study of the Relationship Among Certain Measures of
Quantitive and Verbal Abilities, and Achievement in Freshman Quantitive and Verbal Abilities, and Achievement in Freshman
Engineering Drawing, Mathematics and English in a Public Junior Engineering Drawing, Mathematics and English in a Public Junior
College College
Harold Constantine Messinides Loyola University Chicago
Follow this and additional works at: https://ecommons.luc.edu/luc_theses
Part of the Education Commons
Recommended Citation Recommended Citation Messinides, Harold Constantine, "A Study of the Relationship Among Certain Measures of Quantitive and Verbal Abilities, and Achievement in Freshman Engineering Drawing, Mathematics and English in a Public Junior College" (1959). Master's Theses. 1642. https://ecommons.luc.edu/luc_theses/1642
This Thesis is brought to you for free and open access by the Theses and Dissertations at Loyola eCommons. It has been accepted for inclusion in Master's Theses by an authorized administrator of Loyola eCommons. For more information, please contact [email protected].
This work is licensed under a Creative Commons Attribution-Noncommercial-No Derivative Works 3.0 License. Copyright © 1959 Harold Constantine Messinides

I I I j I . !
I
•
A STUDY OF THE RFJ:.ATIONSHIP AMONG CERTAIN MEASURES OF QUANTITATIVE
AND VERBAL ABILITIES, AND ACHIEVliNENT IN FRESHMAN
ENGINEERING DRAWING, MATHEmTICS AND ENGLISH
IN A PUBLIC JUNIOR 'COLLIDE
'.
by
Harold Constantine Messinides
A Thesis Submitted to the Faculty of the Graduate School
of Loyola Uni versi ty in Partial liUlfillment of
the Requirements for the Degree of
Master of Arts
February
1959
,
~J..,
,t;;~i.i.(~"'~"''''' 'C" , t ) t r' 'He en § tie. ttl" '. 'rw' 'Obtt tP t6Sw"*etae¢§',y-.',t
LIFE •
Harold Constantine Messinides was born in Chicago, Illinois, July 19, , 1915.
He was graduated from Nickolas Senn High School, Chicago, Illinois, June,
1934. His degree, Bachelor of Science in Mechanical Engineering, was
received from the University of Illinois, February 1952. He began graduate
work at Loyola University in August, 1954.
Following a period of employment as an engineer in industry, the author
I accepted a teaching position in the Chicago Public School System. He has been
a full-time instructor in engineering drawing at the Wright Branch of the
Chicago City Junior College, since Septem~r1953.
He has written an article, "Introducing Design Considerations into
'Drawing Courses," Journal of Engineering Drawing, Vol. 21, no. 1, 44-47,
which was based on a paper presented at the mid-winter meeting of the
Engineering Graphics Division of the American SOCiety for Engineering
Education, January, 1956.'
ii
..••• "' ••.• ~ .• -. ···--~-~·-~--~~ _______ ~_· .... i .. _. ----,---• ...,.-" --_,, _____ '

, ~ .
. t *. rt - tfn'j' rtf db 'so' 1 l' j r enb,. 5 '71)-_' 'we. ','=.,_ ft' m f.rri'S· ow tt' ?Nt at t tt t ws" .......
Chapter
I.
TABIE OF CONTENTS •
THE FROBLEM AND ITS SETTmG • • • • • . . . . . . . • • • • •
Purpose of this research-Problems of the public junior college--Increasing enrollments and limited space-Lack of readiness of some studentsDescription of the engineering drawing, mathematics and English courses--Comparative data of Wright Junior College students--The questions to be investigated.
II. REVIEW OF THE RELATED LITERATURE • • • • • • • • • • • • •
studies in technical. areas reviewed by C. G. Patterson--Predictive validity studies cited by D. B. Stuit and others--Predicting attritionsurvival at :Marquette Universit:>~, a study by J. P. Malloy and others--The "Pre-Engfneering Inventory" investigated by F. Lord--G. E. Ellis' study of engineering drawing as a predictor--A junior college study by J. A. Owen--The A.C.E. Psychological Exam reviewed by R. Berdie, A. B. Crawford and othersThe problem of remedial students by K. E. Eble-M. D. Engelhart on the problems of terminal and transfer students.
rlage
1
17
III. DESIGN OF THE INVESTIGATION • • • • • • • • • • • • • • • • • 27
The population and sample. defined-Data and BourcesGoodness of fi t test of normali ty of the variables -W.ethodology: Contingency tables; Analysis of variance with single base of classification; Wert's two by two analysis of variance with adjustment for disproportionality; Pearson correlation coefficients.
iii

Chapter
IV. RESULTS AND DISCUSSION • • • • • • • • • • • • • • • • • • • •
v.
Attribute, registration in remedial classes related to achievement in engineering drawing, and gradepoint average--Effectof English greater than effect of mathematics--A.C.E. Psychological Exam scores related to achievement-A "Q minus L" pattern also related to achievement.
SUMMARY AND IMPLICATIONS •• • • • • • • • • • • • • • • • •
The problem--Population and sample--Methodology-Attribute, registration in remedial courses (mathematics and English) found to be related to low achievement-Attribute, registration in English
found to be more significant than that of mathematics--A.C.E. Psychological Exam scores found to be related to achievement--An A.C.E. sub-score pattern (attribute, "Q" minus "LIf) found to be related to achievement--Implications for the population--Recommendations. :.
1v
Page
h2
66

~
f
,
LIST OF TABLES •
\
Table Page
I. A.C.E. MEDIAN SCCRES OF WRIGHT JUNIOR COLLEGE
II.
UI.
IV.
V.
VI.
VII.
VIII.
IX.
X.
XI.
XII.
nIl.
ENTRANTS •.••••••••••••••••• • • • •
PERCENTILE RANKING ON A.C .E. PSYCHOLOOICAL TEST OF ENTERING CHICAGO CITY JtlNICR COLLEGE STtTr.F..NTS AS CC~A.'qED 1ITTH NATIQ.'\.AL JUNICR COLlSGE liCFJJS, ~ 1952 TO S--~ 1955 •••••••• •
A CaJPARISCN OF THE TIlO ENGINEERING DRA"'1ING CotJRSTi'--S
2
3
DnTOLVED IN THIS STUDY • • • • • • • • • • • ••• 7
A COMPARISON OF THE THREE ENGLISH COURSES INVOLVED IN THIS ~TUUY •• • • • • • • • • • • • • • • • .: .
A COMPfl.RISON OF THE MATHEMATICS COURSES Il-l""VOLVED IN THIS STUDY . . . . . .~ . . . . . . . . . . . • •
"
MATHEMATICS ENROLIMENT AT WRIG1tT JUNIOR COr:LIDE COMPARED WITH OHIO STATE UNIVERSITY • • • • • • •
PERCENT ENROLLMENT IN REMEDIAL ENGLISH COURSES FOR THREE SELECTED SCHOOLS •••••• • • • • • •
RELATIONSHIP OF A.C .E. SCORES TO SUCCESS IN ENGINEERING EDUCATION • • • • • • • • • • • • •• •
PRE-ENGINEERING INVENTORY AND ACADEMIC ACHIEVEMENT • •
A.C .E. SUB-8CORE CORRELATIONS WITH ENGLISH AND MATHEMATICS ••••••••••••••••
DISTRIBUTION OF ENGINEERING DRAWING GRADES BY REGISTRATION IN NUMBER OF REMEDIAL CLASSES
MEANS OF ENGINEERING DRAWING GRADES CLASSIFIED BY MATHEMATICS AND ENGLISH COURSES •••••
• ••
• ••
• •• ANALYSIS OF VARIANCE OF ENGINEERING DRA'VING GRADES
CLASSIFIED BY YATHEMATICS AND ENGLISH COURSES •• • •
v
10
11
13
14
18
21
23
43
44
45
~------------------------------------------------------------~

~ . ./ .. -i Table
vi
P~e
XIV. MEANS OF FINAL GRADES IN ENG INEERING DR~raNG • • • • -46 ..
XV. ANALYSIS OF VARIANCE OF ENGINEERING DRAW1NG GRADES WITH MEANS ADJUSTED FOR DISPROPORTIONALITY ••• ~7
XVI. DATA FOR ENGINEERING mAWING GRADES CLASSIFIED BY REGISTRATION IN MATHEMATICS COURSES • • • • • • • 49
XVII. ANALYSIS OF VARIANCE OF ENGINEERING DRN.mIG GRADES CLASSIFIED BY REGISTRATION IN FOUR MATHEMATICS COURSES • • • • • • • -. • • • • • • • • • .• • • • 50
XVIII. DATA FOR ENGINEERING DRAWING GRADES CLASSIFIED BY REGISTRATION IN ENGLISH COURSES • • • • • • • • • 50
XIX. ANALYSIS OF VARIANCE OF ENGINEERING DRAWING GRADES CLASSIFIED BY REGISTRATION IN ENGLISH COURSES • • 51
xx.
XXI.
DISTRIBUTION OF FINAL GRADES IN ENGLISH BY REGISTRATION IN NUMBER OF REMEDIAL COURSES. • •
DIS'IRIBUTION OF FINAL GRADE~ IN MATHEMATICS BY REGISTRATION IN NUMBER OF REMEDIAL COURSES • ••
XXII. DISTRIBUTION OF CASES BY GRADE-POINr AVERAGE ACCrnIlING TO REGISTRATION IN NUMBER OF RE1!EDIAL COURSES • • • • • • • • • • • • • • • •
xxrn. DIS'IRIBUTION OF NUMBER OF FINAL GRADES lESS THAN "C"
52
53
54
BY REGISTRATION IN NUMBER OF REMEDIAL CLASSES • • 55
XXIV. 'MEANS FOR THE GRADE-POINT AVERAGES OF ENGINEERING IRAWING, MATHEMATICS AND ENGLISH BY MATHEMATICS AND ENGLISH COURSES • • • • • • • • • • • • • • • 56
1:'£!{ • ANALYSIS OF VARIANCE OF GRADE-POINT AVH'..1UGES WITH ADJUSTMENT FOR DISPROPORTICNALITY .. • • • • • • • 57
XXVI. DIS'IRIBUTION OF THE GHADE-POINT AVF...RAC1E OF FINAL GRADES IN ENGINEERING DRAWING, MATHEMA'rICS AND ENGLISH BY A.C.E. TOTAL SCORE. • • • • • • • • • 59
xxvn. DISTRIBUTION OF THE NUMBER OF FINAL GRADES BEWI£ "C" BY A.C.E. TO'l'AL SCORE • • • • • • • • • • • • 60
XXVIII. DISTRIBUTION OF FINAL GHADES IN ENGINEERING DRKJtlJ'JG BY A.C .E. TOTAL SCORE • • • • • • • • • • • • • • 61

vii
Table Page
XXIX. PREDICTIVE VALIDITY OF A.C.E. PSYCHOLOOICAL Ell\! FOR
xxx.
XXXI.
FINAL GRADES IN ENGINEERING DRAWING; AND GRADE-POINT AVERAGES • •• • • • • • • • • • • • • . . .
DISTRIBUTION OF A.C.E. SCORES EXPRESSED AS A "Q MINUS Lit PATTERN, BY FINAL GRADES IN ENG INEERING DRAWDJG • • • • • • • • • • • • •
DISTRIBUTION OF A.C.E. SCORES EXPRESSED AS A irQ MINUS Lit PATrERN; BY THE GRADE-POINT AVERAGE· OF DRAWTIm, MATHEMATICS AND ENGLISH •••••
• •
• •
62
6.3

-~ ,--.--'"
CHAPTER I •
THE PROBI.aEM AND ITS SET.r INa
The purpose of this research is to augment the utility of certain test
results in counseling and programming of students who elect the engineering and
technical curricula at a public junior college; thereby, it is hoped that the
attrition rate in these curricula may be minimized.
Constant effort must be made in the educational field to find the solution.':
to educational problems. Ckle problem of pressing importance is the lack of
readiness for college of high school graduates. Although this problem is
affecting most colleges, it is more often the concern of the ta~-supported
schools, especially the junior college.
Engineering and technical education continues to increase in importance
because of the demands of both an expanding economy and the state of our
national security. However, engineering colleges are not significantly
increasing their undergraduate facilities; and many are raising their entrance
standards. Technical institutes are few in number. And an increasing nll1'nber
of high school graduates are seeking a college education in engineering and
technical areas.
One of the results of this situation is that the public junior colleges are
receiving an increasing proportion of the students in the engineering and
technical fields. Consequently, the ratio of demand to available classroom
1
----~-..~~~_..:__~. ""' .. -................. _, "'.'_' ..... 1."",,_ ...... -..... , ...... _ ..... "· .... 4 ___ ......,"'_· - ...... - ...... --.--.'",.-_. -----,--.~.~--••.•. -.... .,

I
I I ~
2
space for courses in these fields oontinues to increase. 'l'hd b(tst \150 or
available educational facil1 ties would be promoted by • better understanding or "
• the entrance and placement test results, so as to effectively counsel entering
students into classes for which the student is ready.
In order to make this study more meaningful, a brief deSCription of the
setting of the problem follows:
The students involved in this study all attended the Wright branch of the
Chicago City Junior Col~ege. Tb1s branch 1s the largest, and 1s located in a
northwest residential area of the city. However, Wright students are drawn
from a variety of socio-economic neighborhoods and high schools. <he basis for
comparison of entering wr;ght students with the students of other junior
colleges, is the ~~rican Council on Education Psychological Ex~~nation.
TABIE I
A.C .E. MEDIAN SCORES OF WRIGHT JUNIOR C01IEGE ENTRANTSl
Date Q L Total N
September 19$4 39 56 94 838 February 1955 40 57 97 608
September 19" 40 57 97 1413
Februa,ry 19,6 39 58 97 766
September 19,6 39 58 96 513
A more detailed comparison of the entering students of the Chicago City
lnepartment of Examinations, ·Chicago City Junior College.
;.

'.
, i I I
I 1 I t.
I , I
.! I !
3
Junior College ,'lith other junior college students is given by the follo-.rlng
data, also from the Willis report:
• TABLE II
, PERCENTIIE RANKnm ON A.C .E. PSYCHOLOOICAL TEST OF ENTERING CHICAGO
,.--
CITY JUNIOR COLLEGE STUDENTS AS COMPARED WITH NATIONAL JUNI<E COLLIDE
NORMS, SEPTEMBER 19,2 TO ~TEMBER 19".2
National Number of Percent of junior Chicago Chicago
college City Junior Junior percentile College College
rank students students
. 90-99 827 8.3
80-89 833 :. 8.3 "
70-79 835 .' 8.3
60-69 1016 10.1
,0-59 1024 10.2
40-49 986 9.8
30-39 1108 11.1
20-29 1113 11.1
10-19 1045 10.4
0:-9 1242 12.4
2It should be noted that the above comparison is, of course, only with students entering colleges which administer and report results of the A.C.E. Psychological Exam.

4
Community colleges draw most of, their students from the surrounding
neighborhoods. A signif,icant percentage of the Chicago City Junior College
• enrollment consists of students from transitional areas and this partly
accounts for the skewed distribution shown in Table II.
The Chicago City Junior College is a part of the common school system of
nlinois and, therefore, all applicants with a diploma from an nlinois high
school are admitted and take the entrance examinations. Wright, in common
wi th the other branches, ofters two types of curricula. (De is intended to
serve the student who, after two years, hopes to transfer to a four-year -
senior college and continue his studies toward a professional or liberal arts
degree. The other type is the terminal two-year curriculum, intended to serve
the student who is not interested in transfer for a four year degree, or whose
ability level is best served by tenninal-t~~ curricula. Many students, how
ever, resist being counseled into the terminal curricula despite low entrance
test scores (in the areas of mathematics and English, as well as low A.C.E.
scores). Such students consider terminal curricula undesirable simply because
. they would rather be }mown as "engineering students" than "terminal-technical tt
students. The fact that they may not have the ability to successfully pursue
engineering subjects seems to be given little consideration, even where this
is brought to the attention of the student. HOWever, this attitude may be
realistiC, paradoxical as it seems, inasmuch as some or these stUdents seem to
be interested only in the attending of college. The result of this situation
is the enrollment in transfer curricula of many students who have small chance
of success but who, in some cases, might be better educated in the terminal
curricula.

~.~,~"~, __ .~. __ ----~u.--"--~~-----"--"~~." .. """"",,,,,,,,--.. --~----~----______ ~ I
! , I
I i
I I f t I i
, l , l'
I .' j j
r
I
i i
! . i : , ! I I I
., ..
An interesting aspect ot this situation concerns the Un1versitr of
nlinois undergraduate '. branch (Navy Pier) where, until recently, all applying
students were accepted, even for the difficult pre-professional curricula, ,
despi te low entrance test scores and low rank in high school. Lately, however, ,.-
the Universit.1 of Illinois has been successfully persuading poorly prepared
students not to enter the University of Illinois. Instead, these students are
encouraged to attend other colleges,'including the various branches of the
Chicago City Junior College. In addition, probation students tend to
gravitate to the junior college. The net result to the Chicago City Junior
College is to aggravate an educational problem which already appears to defy
solution.
In the face of this situation, the college administration recently
adopted the granting of the Associate of Arts degree, together with more
rigorous graduation requirements (a "C" average in the required sixty credit
hours of college level3 courses). The old requirement was a D plus average.
At about the same time probation rules were modified so as to require the
students to maintain a higher average grade. This action was followed by a
sharp increase in the number of probation cases, and drop-outs.
Other drop-outs can be attributed to: a) loss of interest in college
work, b) transfers to other schools, c) military service, d) employment. In
'\ this last group are many students who are employed part or full time while
\. attending Wright, but who then find it difficult to maintain required academic
3Excl uding remedial courses such as English 98 and Math 95 and 96.

. I f.
f "
8't mt Sth t) • t .~,. , M t t . Mr. rrtt "t S, $ 1m t * 'tt « t) UI. it'·", NC' ... "l,'"",, .....
,...----------'!'"------------------------..,.,.'" 6
standards. Some of these return as part-time evening students, and a
reasonable number graduate.
• The following datum further illustrates the dilemma: at Wright only
eleven percent of the first semester entrants register for the third semester,
and the fourth semester enrollment is comparably small. The drop-out rate
for all causes is high, and consequently, the number of students who graduate
from the city junior college is disappointingly low.
Summing up, then, it seems that an excessive number of entering freshmen
have not been successful in maintaining minimum acceptable academic standards.
For the entering freshman electing any of the engineering or technical
curricula at wright Junior College, engineering drawing, mathematics and
English are a required and important part of the student's program. Of the
seven engineering and technical curricula listed in the Chicago City< Junior
College catalogue, one does not involve chemistry; and in four curricula
chemistry is listed in the second, or a later semester. On the other hand,
engineering drawing, mathematics and English are required first semester
subjects in all except the chemical engineering curriculum, where engineering
drawing is listed in the fourth semester. In addi tion, enrollment in
chemical engineering is very low at Wright Junior College. Because of the
above ;reasons, this study eliminates chemistry from the criteria of
achievement, but does include engineering drawing,mathematics and English.
Many Chicago area high schools do not offer technical or IOOchanical
drawing. In an attempt to make the teaching of the college engineering
drawing courses more effective, students are placed in one of two drawing
courses according to the number of semesters of bigh school dra\ving they have
'"'1~-~---''''''''''''----''''''' "'!'tr.--"+ - ___ .... ,,_.0, "", ..... , • ..-..,...' .... , • .,..,1.,-, ..... .,.., """!!!\\lIl'I'*""''''''·· ..",,---,.,... w~. 'Y". """ ,-'~. "W,... ~ ____ 4---··-· ----~ t'\;~t:~::*,~ .. " _

I I' i r i
b ) t" • t r &,. _ tAtt*itr '&e21 -t',trtttriYM'WO)t ·,t,rt?'?' te?t. ("'it-. 'm,,,. t."Mltr.",,,t&hw '-,~t"'f~-'.d&t\e,""'" .Je·."s,,'
7
taken. At Wright this placement is made at the time entering freshmen are
counseled. StudentS electing the engineering or technical curricula are "
• counseled by two faculty members of the engineering drawing department. The
, wri ter is one of these. A comparison of the two drawing courses is made in
Table III.
TABIE ill
A COMPARISON OF THE TWO ENGINEERING DRAWING COURSES
INVOLVED IN THIS STUDY
Prerequisite
Credit course
Class hOurs/ week
Credi t hours
Text book
Achievement tests of comparable difficulty?
Course acceptable to engineering schools?
Engrg. dwg. 130
1 year high school plane geometry
Yes
6
3
French "Engr. Dw'g." 8th edition
Unit tests in Engr. Draw. from E.T.S.
Engrg. drrg. 131
2 years high school dray,1.ng
Yes
6
3
Same
Yes, from same battery of tests
Yes Yes (For example, I.I.T., N.U., U. of I.)
The principal difference between the two courses is that, in the 130
course, the first two weeks are used to introduce the student to fundanentals
in the use of instruments and in "orthographic projection." This is done
because some students in the 130 course may have had no high school drawing,
although others may have had one, two or three semesters.

8
Final course grades in the engineering drawing courses tor the members of
this study were determine,d as follows: all drawing assignments = ,0%; all 4' '
tests = ,0%. The tests involved are standardized objective tests which are
administered throughout the semester and cover topics such as: orthographl.c
projection; dimensioning} sections and conventions; isometric drawing; oblique
drawing; threads and fasteners; developments, etc. These tests were developed
by the Cormni ttee on Advanced Credits of the Drawing DivisiC?n of the American
Society for Engineering Education, with the aid of Education Testing Service.
There is some indication that students, who may be designated as low-verbal,
have difficulty in comprehending the questions on this series of objective
tests. The final exam in the drawing courses is a U.5. A.F • I. Test of 105 i te!:lS ,
an objective and standardized instrument covering all the subject matter of a
college drawing course.
Class work usually consists ot a series of' one draw1ng per week, with a
fevr assignments requiring one and one-half or two weeks each. Typical of thes~
assignments are the following:
5:1.
(a) The student works 'from a dimensioned pictorial rendering ot an object
and, using his judgment, produces a working orthographic drawing
involving accepted standardized' use of sections and conventions;
dimensiOns; and prOjected views, both principal and auxiliary.
4Tests include both objective tests and drawing tests in a ratio of about
5American Standards Association.

~~ __ td_._ri~._;-; •• '~w~!.*we.Jt •• M __ •• m __ ;_;~5 __ t.b •• __ .1S"'t~5.Z.j.m.r.t$ •.• t3.0 .... tt~rt.a.t_··~*e •• _*.W~ .. M5!~._._T ____ tt __ W_= ____ , ___ ! ____ ,~
I
I
1
t ;
t
r , I
9
(b) The student is given the size and location dimensions of two duct
openings I and eonstruets the development of the transition surface
that would connect the two duct openings. The-theory of the
rotation of lines in space is introduced With this type of problem. I
(e) The student is given one undimensioned orthographic view of a simple
assembly of machine parts, such as a stuffing-box and gland. 6.
The actual dimensions are determined b,y the student's using a series
of equations of proportional parts based on a given shaft diameter.
The student must then render a complete set of drawings conveying ~ll
the information necessary to manufaeture the assembled device.
Certainly, spatial and vi~ualizing abilities are utilized in the
execution of such problems as indicated above; and they are also used in under
standing the many illustrations in the text on the black-board. But it does
not follow that better than average spatial and visualizing ability alone will
indicate sueeess in engineering drawing.
However, the basic objective of the engineering drawing course is to aid
the student in developing the ability to communicate ideas in a graphical
language. This objective has a parallel in the English courses, where the
student must develop the abi 11 ty to eommunieate ideas wi th the wri t ten word.
Is it ,pOSSible then, that there are factors common to both the English and the
6 A widely used deviee where 1 t is desired to permit shafts to rotate or
reciprocate and where a different fluid pressure exists between opposite sides of a seal, through which the shaft passes.
~~ 1'" ••• ~ ... ~ ~"-'-~~_ ... --.. ...... .-. __ ._~".",_ ... __ .......... _._----•• _,, ______ ...,.,~~- .. '-~
' .. '
...... stth'?e.t"W:$'M' r_*' 1st *'1*7511 • nt!" ftn l' t'"7 •
I i
! I
I I I l \ i
!
10
draWing courses? lIight these factors evidence themselves by some significant
relationship between readiness in English and achievement in engineering
• drawing? .And what of the all too common attitude of the technically inclined
student to deprecate the importance of language skills? TO succeed in
engineering drawing, the student must be able to comprehend the written word in
a college level text book, and the spoken word of his drawing instructor's
lectures. These were some of the questions inveStigated in the present study.
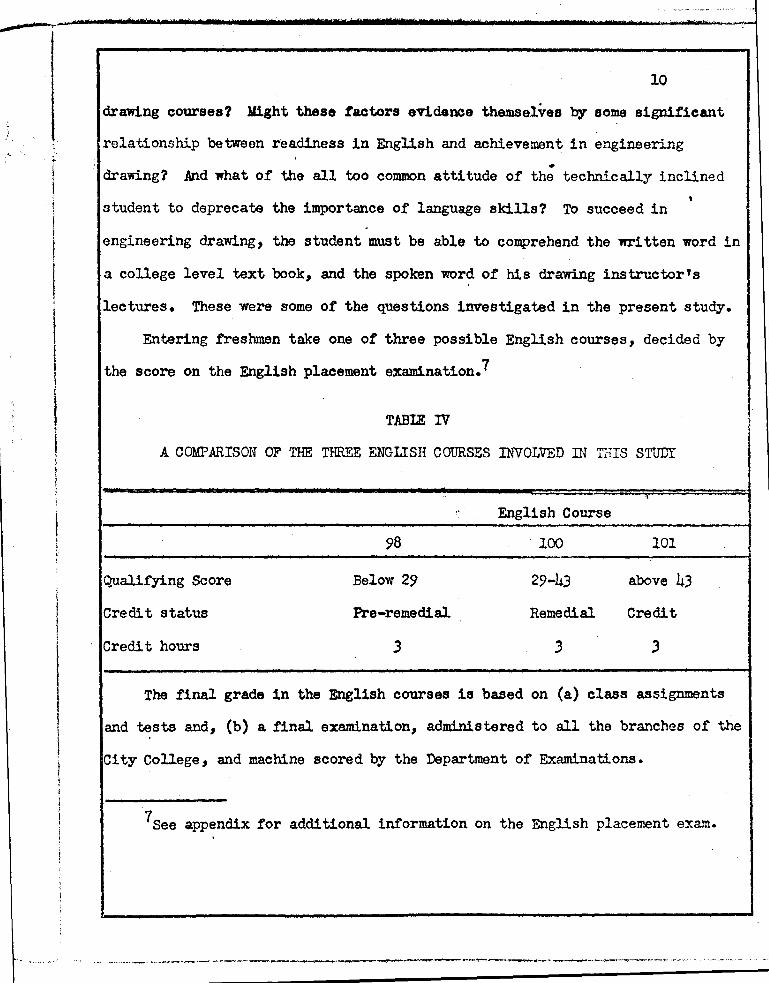
Entering freshmen take one of three possible English courses, decided by
the score on the English placement examination.1
TABU IV
A. COMPARISON OF THE THREE ENGLISH COURSES INVOLVED IN THIS STUDY
English Course
98 100 101
Qualifying Score Below 29 29-43 above 43
Credi t status Pre-remedial Remedial Credit
Credi t hours
The final grade in the English courses is based on (a) class assignments
and tests and, (b) a final examination, administered to all the branches of the
Ci ty College, and machine scored by the Department of Examinations.
7See appendix for additional information on the English placement exam.

~ I
I I I ,
I I I ! I ! i
I I
I i i !
I i i
.' I (
t
I ;
! I
! ! I I
I I I
• I I
i l , I
! I I ! ; i I , \
11
Entering freshmen take one of four possible mathematics courses depending
upon (a) placement test', score 8 and, (b) high school mathematics courses taken, ., •
as shovm in Table V.
TABIE V
A COMPARISON OF THE MATHEMATICS COURSES
INVOLVED IN THIS ,STUDY
Mathematics Course
Prerequisi te
Placement test score
Figh school mathematics
Cred! t status
Cred! t hours
95
1-18
None
No, preremedial
3
96
19-29
Less than 101
No, remedial
101 ill
30-36 ,Above 36
"
1 year 1 1/2 year algebra, algebra, 1 year 1 year geomotrj' f' ('. (' m0 try·
Yes, Yes, credit crad! t
3 3
The final grade in any of these mathematics courses is based entirely: upon
a series of locally constructed, standardized, objectively scored examinations.
Mathematics 101, while a college level course, (non-remedial) also covers
material that is covered by advanced algebra courses in high school. After
8see appendix for additional information on mathematics courses and sample items on the placement test.
____ ~. __ ~_._. ___ . _______ -.... __ . .....,.., . .,.., ._I.~_ .. ..., ..... , , __ ......... _. ____ ' ___ .. -A.~.-.----·---- .. -.. -.,- ,. -~-.-.... --

1 t
I 1 l
I
* -.'t) • ·'t t t 5n ¥' m'nt tt.strdr '* to t. S t _ s. erT' t
12
passing mathematics 101, the student then takes mathematics lll, which course
covers college algebra, trigonometry and analytical geometry, using the newer "
• integrated approach. Normally, the entering freshman, whose high school
, mathematics preparation is adequate, takes mathematics III during his first
semester, then takes mathematics 112 in his second semester, and should then be
ready for the calculus in his third semester.
It may be of interest t.o look at the mathematics enrollment for a yeu
typical of the period this study encompasses; Table VI shoW's the distribution
of this enrollment among the remedial and credit classes at \fright. For
comparison, data are included from Ohio State University.9 Ohio State's
higher proportion of remedial mathematics students does not seem to support
some of the criticisms that have been made of the worth and potential of the
junior college student.
9Xenneth E. Eble, "The Burden of the Bonehead," The Journal of Higher Education, Vol. 28, #1, (January 1957), pp. 30-37.

~;&:.b~ :: .. :: .... ~_ ... - .... M' .• " . _., * V·"'i ett' '$ 'i" t tr·_ e d*';':8 f . b '.W_ )t .. ,_." ebb· ..,,, " .. /0". '~." •.•• , ............. ,.,_
I 1
,
I I
\ I
I ,
'. , I ! , ;
f
1 , ! 1 i
I i
I I I I
f t
I ( I i ! ! !
1
i ;
I I
" ~. - t<
, " TABIE VI
• MATHEMATICS ENROLLMENT AT WRIGHT JUNICR COLlEGE
COMPARED WITH OHIO STATE UNIVERSITY
Math. Course Enrollment,
Wright College
pre-remedial 384
remedial 540
credit 1210
Ohio state
pre-remedial 1071 "
remedial 887
credit 1529
What is the comparable situation in the English courses?
13
Year
Fall, 1955
and
Spring 1 1956
"
Fall, 1956
The data in
Table VII are in terms of the percentage of beginning freshmen assigned to
remedial English courses, for September, 19,7.10
10Helen Fleming, "Jo~ Still Can't Make the Grade in College English,u story in Chicago Daily News, (September 23, 1957), p. 12.
I
,
......... ~> - .- •• ~,-."- ~-.-----,~ ... ~-~ ......... --....,.--~--...,-.. ~--..-"....,,'r, .~.-~. -~ .... - .. ----.. - ... -~--- ........ ~ ... ~--~ .. ,

l t. ,
I
I i 1
i
i t !
I I !
TABIE vn
PERCENT ENROLLMENT IN REMEDIAL ENGLISH COURSES
School
Uni versi ty of lllinois
Urbana Campus
Navy Pier
FOR THREE SELECTED SCHOOLS
Chicago Teacher's College
South Campus
North Campus
Chicago Ci ty Junior College
Wright Branch
Wilson Branch
Crane Branch
•
Enrollment
29%
26%
30%
44%
38%
41%
53%
14
The higher values for the·Crane and Wilson branches are caused by certain
socio-economic factors, involving migration to Chicago from areas in the
southern United States or people who are deficient in educational background ~
comparison to native Chicago students.
. The problem, in general, is to determine the value for predictive purposes
of test results used 1n counseling and programming entering freshmen who elect
the technical or engineering curricula at Wright Junior College. These test
results are given to counselors in the following form: I

r_,~~· ~- l
eh .'M#"'.
15
(a) Mathematics and English placement test results:
attribute 'data, ',e.g., the particular pre-remedial, remedial
• or credit course the student is required to be registered in.
(b) The A.C.E. Psychological Exam results: continuous data, i.~.,
the total, "quantitative lt and "linguistic'" scores expressed as
percentiles.
The achievement criteria involved in the investigation are the final grades in
the engineering drawing, mathematics and English courses.
The following questions will be investigated:
(a) What is the relationship between registration in remedial or crecli t
courses in mathematics and English, and acluevement in engineering
drawing?
(b) What is the relationship between re~istration in remedial c'burses in
mathematics and English, and achievement in mathematics? In English?
(c) Whpt 1S the re1 ;,ti onship between reg1 strattr, i! '"",. ",11a1 or credit
courses in mathematics and English, and achievement expressed as the
grade-point average of engineering drawing, mathematics and English?
(d) What is the relationship between the total score of the A.C .E.
~Jchological Exam and achievement in engineering? In the grade-point
average of engineering drawing, mathematics and English?
(e) What is the relationship of the "Quantitative" and "Unguistic"
subscore of the A.C .E. Psychological Exam, and achievement in
engineering drawing? In the grade-point average of enpineering
drawing, mathematics and English?
(f) 'What is the relationship between the dichotomous attribute high school

I ! i
j
r !
I f I I
• we , mn '25 • t It r 7 wrn 1 , , ~l ttl 1t
16
drawing (less than two years; two or more years), and achievement in
mathematics and,English expressed as a grade-point average? •
(g) What is the relationship between the attribute years of high school
drawing, and registration in remedial classes?
N01'E: Questions (f) and (g) are concerned with the sample, as defined in
Chapter III.

; . "I'" .. .
t !
f
CHAPTER II •
REVIEW OF THE RELATED LITERATURE . .. -
Many of the studies involving attempts to predict success in technical
courses have been reviewed b.Y C. H. Patterson (22). These studies did not
involve college level courses such as engineering drawing; how~ver , s(' n ' (If
tl e studies concerned high school meohanical dl-awing. As expected, m..'U1Y of t h
studies reviewed used measures of a space factor. Concerning the question of
whether gener al ability or intelligence can be eliminated from mElasures of
mechanical ability, Patterson makes this important point: "It appears that in
the skilled trades, as distinguished from ~killed manipulative work, • ". • '4
Imowledge and information cannot be separated ;'from mechanical ability, and this
capacity to acquire and use information and knowledge is related to
i n te l l igence • It
The relationship between high school achievement and first semester or
. first year college achievement has been the subject of many researches. Stui t
(25) cites many of these 8tudies which tend to confirm the predictive validity
of the high school record. It is reasonable to assume that placement in
remedial classes reflects, for most of such students, low high school achieve-
~nt and severely reduced chances for success in college, even after the
remedial classes have been passed. Stuit says, "English usage ability
correlated significantly with achiovement in engineering training."
Unfort unately, the stUdent most handicapped by low verbal ability (English
11

\ " . ,~~.'
, ',.' '.
~ :' .. , '. '
, "
~ . ~
I t '\
I t ( , .
I l
13
usage) frequently exhibits strong antipathy" toward the subject ot English. Ttl"
correlation between firs'~ year college and subsequent stages 'of college work •
again strongly confirms previous scholarship as having Significant predictive
validi ty.
Many studies have been made of the predictive abili ty of the American
CoUncil on Education Ps,ycho10gical Examinatio~; some results from the Stuit
study followl
TABIE VIII
RELATIONSHIP OF A.c .E. SCCRES TO SUCCESS IN ENGINEERING
EDUCATION
Predictive inaex Criterion
A.G.E.
A.G.E.
A.C.E.
A.G .E.
JiIb
NOTES:
1st semester grad~s, freshman year
1st semester grades., freshman year
. 1st year grade point average
1st year average
2nd year average
3rd year average
4th year average
(b) eight groups N range 187 to 328 (d) three groups N range 133 to 215 (c), median r = .41 (range .35 to .54) (e) median r = .34 (range .33 to .48)
N r
333 .52 "
252 .47 383 .48
(b) .41 (c)
(d) .34 (e)
144 .35
122 .40
The American Council on Education Psychological Examination alternates six
subtests in two categories, linguistic and quantitative, so as to yield two
subscores in addition to a total score. All of the Table VIII studies involved, I.
the total score. Inasmuch as first year engineering includes courses requiring

19
quanti tative, as well as linguistic, .factors the total score seems justified
as a predictive index. The separate "Q" and "Lit scores may also have a value " ..
in counseling. ,
In order to better predict attrition-survival in the first year of
engineering at Marquette, a study of the predictive ability of certain
entrance tests was undertaken in the fall of 19.52. Tests used in this study
were the American Council Psychological ~amination on Education; Minnesota
Paper Form. Board (a space test); and the Cooperative Mathematics Test (Form
Y). The sample consisted of one hundred and ninety four entering freshmen who
made up seven~ one percent of the entire entering class in the engineering
school. Furthermore thes~ one hundred and ninety four students were in the
top two-thirds of their high school classes and would ordinarily not be
required to take the entrance examinations~t Marquette, and 'therefore
constitute a select group. (It was known that the attrition rate of the
sample was only eighteen percent in contrast to thirty one percent for the
class as a whole.) The limitations or this sample are admitted by the
authors (18).
Mean scores of the survival group were Significantly larger than mean
scores of the attrition group. Correlation coefficients were found between
the f9ur tests. Also, a biserial coefficient was found for each test variable
with tile dichotomous criterion (attrition-survival). Finally, a discriminant
analysis yielded an effective predictive combination of the M.P.F.B. and tho
A.C.E.-Q tests, having a multiple correlation coefficient of 0.46.5, siSnific:o>
at the five percent level. The cooperative Mathematics Test and the A.C.E.- L
sub-test were found not to contribute significantly to prediction.

I I
· .. ~
'. ;
I
I , t \
~ i ,
J ..
* tub. " ee r ·'H * bOPst 2M ',' ",1# 1"'1' 't 'mut' •• '?' "t)-etr't.e •• le.,")t,"., f ttt.iJrW"n' ("'.)t;''I''.ltslIdt''~
20
The authors cite the correlation between the M.P.F.B. and descriptive
geometry as the basis of the value ot this test and the reason for its
contribution to the discriminant analysis. . .
Note, however, that the A.C.E.-Q ,
correlates even higher with the attrition-survival criterion than does the
Y.P.F.B. A better interpretation of the effectiveness of both the A.C.E.-Q
and the Y.P.F.B. ~ be that together they measure m~ factors found in
freshman mathematics, drawing and chemistry courses. M a result of this study
an expectancy table was constructed for the A.C.E.~ and Y.P.F.B. scores, from
which a usable estimate of a student's chances of survival is obtained. It
does not follow that a like table would have similar value at another school.
In fact, other studies have found the A.C.E.-L score to have predictive value,
in contrast to this study. Nevertheless, such an objective method of
differential prediction has definite merit~ and could be used with ~nefit at
schools not now following such selection procedures. While it is true that
junior college philosophy decrees that all who apply should be enrolled, the
needs of the junior college student are best met by' counseling the student into
those courses for which he has the readiness.
Entrance to many engineering schools has been based, in part, upon the
Pre-Engineering Inventory,l a battery of tests which attempts to measure some
combination of aptitude and achievement. However, junior college students are
not involved, the testees being a self-selected group of high ability.
IThe Pre-Engineering Inventory was prepared and administered by the Education Testing Service.
.-.--... -----.~-.-----.~---~.-----.-.--- ------~----.~----.--~ •.. -.. -.

i I
t I I t
21
These sub-tests are listed in Table IX, together with the' correlation
coefficients from'a stuq by IPrd and OOW18S (17), (here N::::26(0). "
•
TABIE IX
PRE-ENGINEERING INVENTCRY AND ACADEMIC .ACHIEVEMENT
Predictive index '1st term calculus chem- physics engr. Englis grade ave. is try draw.
General Math. ability .63 .55 .58 .58 .26 • .31
Comprehends scientific Materials .58 .47 .52 .51 .31 .33
Comprehends mechanical principles .55 .44 .48 .;a .37 .26
Tech. verbal ability .50 .4.3 .48 .43 .19 .32 .,
General verbal ability .39 .24 .31 .32 .15 .37
Spatial visualizing ability .36 .24 .28 .30 .44 .21
It is interesting to note that "General Mathematics Ability" correlates
higher with English (.31) than with engineering drawing. Factors not measured
by the tes t are involved which make it seem that "General Mathematics Ability"
predicts English achievement more than engineering drawing achievement. More
mathematics in the engineering drawing courses is one answer. The low
correlations of most sub-test scores with engineering drawing could be
attributed to: (a) tradi tional and outmoded methods of teaching the drawing
courses, (b) failure to coordinate the drawing courses with the other
engineering departments concerned, (c) excessive emphasis on drafting skills •
.. ----,---.----~---.--------- ----~--~---

~.... ) wt Ullfhrd:eMilihlhrhiCt Vh WsW'prtme'.elttMtrr.nrtttt, 'stfHfiX'tto t re,'tt; Uh '"
I
, ",
. :,.' . .-' ~
f
I .... : i
I I i t t , I ,
• i
22
Probably the most accessible evidence to support the above is an inspection of
most engineering drawing', testbooks used throughout the country. ' .
Engineering drawing as a predictive factor for SUccess in engineering
courses was the subject of a research b.Y G. E. Ellis (9). The data for this
study are from a small state institution, which rather recently changed from a
junior college to a four year agricultural and. engineering school. The
correlation coefficients obtained between the achievement grades involved,
were not considered by Ellis to be high enough for individual prediction. It
should be noted that, although the usual engineering drawing course involves
the space factor, there are other important factors (both verbal and
quanti tative) which are n~t used to a Significant extent in engineering drawing.
Therefore, one might not reasonably expect grades in engineering drawing, as
usually taught, to have predictive value.
The relationship of the visual space factor to scholastic Success in a
junior college was investigated b.Y J. A. Owen (21). ' The space factor was
~easured by using two sub-tests of the California Test of Mental Maturity,
advanced series, (a) sensing left and right, and (b) manipulntion of nro~~.
IScholastic Success was measured in terms of improvement from mid-term to final
~rades in the first semester. An analysis of variance was made classifying the
subjects (N= 54) on sex (men - women) J adjustment to collegt" (overadjusted,
Inormal, maladjusted); intelligence (high, average, low); scholastic improvement
(three categories). The results showed that the only significant relationShip
twas between intelligence and the space factor.
The results of a study of the predictive validity of the "QIt and "Lit sub
scores of the A.e.E. Psychological Examination Were reported by R. Berdie and

I _~ ........ _. r I I I !
23
others (3). The total score of the A.C .E. Psychological Exam may not be,in
comparison with the sub-scores, the best predictor for achievement in certain "
, . isubjects. This study found bigher correlations from the "Q" and "L" scores.
, Table X gives some of the data for English and mathematics for the 1949 class
of entering freshmen of contributing schools from all parts of the United
States.
Subject
English
Math
TABIE X
A.C .E. SUB-SCORE CORRELATIONS WITH ENGLISH
AND MATHEMATICS
No. Schools
11
11
N
2675 1604
r's
"Q" "L" .27 .' .46
.29
Significance
(yes) 5% l~vel (yes) 5% level
The authors of this investigation stress the importance of local
validation when they point out the "extreme and unsystematic variability" of
the data contributed by' the schools which make up the study.
Using the A.C.E. Psychological Examination, and taking the difference
between the "Q" and the ItL" sub-scores as a dichotomy, F. V. DiVesta (7)
stUdied the relationship of the sub-score pattern with educational differences'
as indicated by the college curricula students were registered in. Othor
studies of this type had hypothesized that high "Q" or high ttLII p.qtterns
reflect different personality syndromes. DiVesta, using continzenc.y analysis,
found a significant relationship existed between a IIQ minus Lit pattern and the
'-__________________________________ v<, _ •• ""~
..... , ....... _-_._-_ . ....,........---. __ ._-_ .. ~-~-..,---~-----------------.----.-.~--.---------.-.-... -... -.

I !
I J I
I
~----.-
24
chosen curriculum.
Many other research: studies investigating the predictive validity of the "
• A.C.E. Ps.ychological Examination have been made. Often these studies also use
, locally constructed and validated examinations. Typical are the studies of
.,'-
C. J. Mullins (20), S.D. Hill (14) and R. A. Jackson (15). The usual criterion
in these cases was some average of first seme~ter, or first year, achievement.
A strong criticism was made of the usefulness of the A.C.E. Psychological
Examination by CraWford and Burnham (6). Yale freshmen taking the A.C.E. made
an average score above the year's composite ninetieth percentile. Nearly fo~~-
fifths ranked above the seventy-fifth percentile, on two separate testings for
sample groups, carefully ?hosen as soholastically representative of the entire
class. A question that naturally follows is: what kind of a sample of the
American college freshman population are Yal~ freshmen? A test is ti~ually
designed for difficulty and discrimination with a certain population in mind,
and tried with a representative sample of that population.
Crawford criticizes the inclusion in the norms population of a generous
proportion of junior, teachers t and sectarian colleges. 2 true, many of the
reporting colleges have very low scores. What does this mean? It means that
teachers' and junior colleges have very low tuition rates, and m.any do not
2 Concerning standards of achievement, the A.C.E. states: "liorms describe performance on a test as it actually occurs in n particulnr group. They are not standards of satisfactory or required attninment. Educational Testing Service does not attempt to set such standards. They can be established only by those who are in a position to make such judgments on the basi s of knowledge of specific local condi tions and desired ou tcomes." (A.C.E ., "Psychological Exam. for College Freshmen Norms Bulletin, II 1952 Edition, E.T.S., 1953, p. 3).
I ~ ____________________________________________________________________ J

} f
··.1 ' .' .{
'.\ }
,1
1 I I
t i I : t i
,
I I
2$
restrict enrollment. Therefore, they are sought out by students who generally
ranked in the lower part of their high school class. The fact that they took •
the A.C.E. does not, per se, make they typical products of that junior or ,
teachers' college; it means such students may have enrolled but many may not
finish out the first year. Cri ticism of teachers' and junior colleges should
be aimed at any tendency for such schools to allow the students' lack of
motivation or ability U> influence standards.
What percent of remedial students succeed in overcoming their deficiencies
and eventually graduate trom college? Eble (8) cites some of the studies
which reveal that, for example, at OhiO State University "341 of the 894
students taking remedial English failed the course, and 90% of these failed
out of the universi ty." Eble sees the remedial program as a reflection of
"the urge (American) to educate the entire populace and the unaVOidable clash "
with their educability." Eble classifies remedial students into two groups:
(a) students who do not have the mental abili~ to do college work, and (b)
"students who are actually suffering from inadequate past training; or from
lack of attention in high school; or from freshman football, social activities,
maladjustment, or laziness." He· favors an "actual separation between the
degree-granting college restricted to students of real ability and a new kind
of colJ.ege, perhaps an extension of the junior college as now const! tuted - a
college for the less academically capable but still one which offers a program
of substantial worth. n (This latter program may prove hard to define).
In his book, "Evaluation Practices in the Chicago City Junior College, It
Engelhart (10) points up the problems created by an extremely heterogeneous
student body. "Instruction best suited to stUdents who plan ultimately to
--~----'~, ......... -- I.

......-. lr·$M. t 't
26
transfer to higher institutions is not well adapted to students who should
complete their formal e~ucation on the junior college level." The question may "
• be asked: should students be required to successfully pass their remedial
courses before registering in a credit drawing course?
In summary, none of the studies reviewed have dealt vr1 til junior college
technical and engineering curricula. Al though. there may be SOIre problems in
common between the junior college and the four year college, important
i differences do exist. The public junior college usually accepts all applic-
.. ,.I~ ."
I
ants, and the range of abilities is much greater than at the typical
engineering college. Classes in mathematics, English and engineering drawing
will contain both terminal and transfer students. The resulting situation
I creates a difficult teaching 8i tuation. It should also be noted that some of "
the reviewed stUdies show results that 8ee!Tlt.~ conflict; this would seem to
emphasize the importance of local validation of tests.

t··-
·~, • ." . .;.t--... -----*f*-).""-"""" ....... _ .... '-. ... ' .... ' _' __ 'iolli¥t"" ..... fi' ..... • .... _til!isI .... J@" .... " .... )jIl'Ii!'!.1~~ __ ,"""t·~· ~ .. !!" ... ~ .. ~·M~"O:!,!! .. ~' .. ~iibe~ .. ~_~..-~~~:::-_~:::......:.:,,:::::::--,:,'::"-..
1
I 1 ,f
CHAPTER III •
DESIGN OF THE INVESTIGATION
The population wi til which this study was concerned, consisted of all full
time day students (freshmen) who elected one of the technical or engineering
curricula from September, 1954 through September, 1956 at the i\,"right branch
of the Chicago C1ty Junior College. This was a total of five consecutive
semesters (excluding summer sessions), consisting of three fall and two spring
samest/ars. The population was estimated to be nine hundred, this
approximation being based'upon total registration in the engineering drawing
day classes for the above five semesters. For the purpose of this stu~, U10
term IIfull-time lt student defined a student whose acadomtc lond inclnliod fr":lh-
man engineering drawing, mathematics and English.
The sample consisted of all students in the population who wore
registered in the author's engineering drawing classes, less a number of cases
which were eliminated. The reasons for elimination, and the number of persons
elimtnated for each reason, are given as follows: (a) part-time students: 4;
(b) students who did not take their freshman drawing course until their third
college semester: 23; (c) students who had had a previous college drawing
course: 6; (d) students who, by taking a remedial course before taking
dra.Ylng, changed their remedial status by then qualifying for a non-remedial
course; or students who postponed taking a remedial course until after taldng
27
q;d i Q#$ @4 4,» ( i,' P.'., j J j@t'-. k t *41"*. 4j ,Qt & P4

I j
I j
28
drawing: 21; (e) students who did not complete one of the required courses,
and received one of- the incomplete grades: W, W-P, F-abs, or R: 22; (f) •
students Who withdrew from one of the required courses prior to the deadline ,
for appearing on the class list, 5; (g) transfer students who had finished ... -
all required freshman mathematics or English courses prior to taking drawing:
6; (h) students in a non-technical curriculum ,who did not take mathematics,
but who enrolled in a drawing course: 1; (j) stUdents Who took one of the
required courses outside of the population time limits: 2; (k) students for
whom complete data were not availabie at the time the data were collected, and,
therefore, could not be classified: 5.
The sample, as finally constituted, equalled one hundred and seventy-nine
cases, distributed throughout five consecutive semesters as follows: fall,
1954: 48; spring, 1955: 24; fall, 1955: -46--' , spring, 1956: 24; 'fall,
1956: 37. There were fewer students in the spring semestors, whon IMrl ftrllt
semester drawin~ courseo were offored.
The random elemont in the seleotion or the 81UUplo stolllllllld ;i'rom t.h~
conditions of registration at Wright Junior College. Students, electing the
technical or engineering curricula, were required to take engineering drawing,
mathematics and English, and were so counseled. Then, when the student
registered for the courses on his official program, the particular classes he
was to take were determined by faculty members, and were based on the supply
and demand situation in the classes being offered. Furthermore, the names of
drawing instructors were not printed on the class schedules. For these and
other reasons, it -,'{as assumed that all members of the population had an
approximately equal chance of being included in the sample.

~ __ ---. _ .. _" _ .. __ ...... ' ... re_.et_ .... · ... ' .... :eeilllloilliot .... *_zoiiioii'_ ...... ' ...... ' ... 'I111' .... IiIi ... 'illlltt.f' .... """,J!'!lI!i!i!!!!!!!I!' '!'!!!'i!!!:'!!!!1"'!! ... !!!:!-~e~II"'~' ~: ~~.~.~ ... ~. ::'!::'::""""'":::.-=:"!': ..... :::.==-.... '<':_.'_:~- ~:.~_ ....... -
I
t
I I t t ! 1
1
I ~ ,
29
Included in the sample total of one hundred and seventy-n1ne were
nineteen cases which were not in the twelve categories of eliminated cases, •
but which still deviated from the other one hundred sixty cases in some detail.
For example, some students had registered in a summer school course in "
mathematics or English just prior to starting as full-time day students in tr~
following (fall) semester; then these students had withdrawn from the summer
course. In order to keep the sample size as large as possible and to justif,y
including these nineteen cases, a comparison was made with the other one ,. hundred and sixty cases by the F-test, using grade-point averages of drawing,
mathematics and English. The results gave an F-ratio equal to 0.228, which
TIM not significant. Converting to at-value, the probability was found to be
greater than sixty percent. It was reasonable to conclude that the difference "
in the mean achievement of these two groups <?,ould have resulted from'random
sampling from a single homogeneous population. It was decided that the final
sample would include these nineteen cases.
The question ot a stratified population may be raised, in view of the
fact that the sample consisted of students in two types of engineerin8 drawing 1
classes, both of which were first semester courses. To test the hypothesis
that the students in the two drawing courses could be considered as members
of the. same homogeneous population, an analysis of variance was made of the
grade-point average of mathematics and English. The results were not
significant at the five-percent level. From the corresponding t-statistic,
lSee Chapter I, p. 8.

·.:J;:it.l!~,w.~ :""fu>t:..-. _ ... ___ ........... 1 .... · .... 'r ........ w' ... _ ... ·,·»swt_+ttw ...... _tllioll' .. ' ....... oIItt ... Ulliim_a' ...... ifIlliM ... ·.""" .' .• 1 1iI.,.e ... _Mrtlil·nlO!lilf .. 'f~.,t':'!I!!~tf't .... t'.-t_ ..... _a) ... * ... t,. __ ~..,. ....... * ,,*~.....-.....-----..-.-I
i , ,
j I I
I I , I .1 "t 1
t ~
I
~
\ 1 ,
,30
we may infer that the results of the analysis could have resulted from random
sampling of a homogeneous population in between ten and twenty percent of the
• samples. It is of interest to note that of the two groups here considered,
, those with less than four semesters of high school drawing had the greater
mean, 2.03" as compared to 1.85 i~r thOse with four semesters of drawing.
For obvious reasons, no comparison was made of achievement in engineering
drawing.
Because this study involves the attribute, registration in remedial
classes, it is appropriate that the subgroups be investigated for any
association wi. th this attribute. The null hypothesis of independence between
the attributes: (a) registration in remedial classes (none" one or two)" and
(b) the dichotomy, high school drawing, was tested, using a three by two
contingency table. A chi-square of 2.624 wis' obtained, which for the two "
degrees of freedom gi vas a p value: 0.3 > p > 0.20. The null hypothesis is
not rejected. The sub-groups may be considered as reasonably homogeneous in
the attribute registration in ~dial classes. Incidentally, these (~roYing
course sub-groups in the sample were approximately proportional to the same
sub-groups in the estimated population.
Certain characteristics of a public junior college require that the
question of a stratified population be considered again. The needs of junior
college students are usually classified and served by the two types of
curricula: (a) those for transfer students, and (b) those for terminal
students. It is reasonable to assume that there was no sound basis upon
which to differentiate students as either terminal or transfer sub-groups of
the population a"1d sample, inasmuch as: (a) a simple declaration by the

, 'I j
I I 1 I i I , i
I I !
I
31
student sufficed to m.alce the distinct1on, (b) the student's deois1011 W8.8 not
related to his readiness ,for college work, and (c) both transfer and terminal
students were enrolled in the same sections of the courses of this study,
engineering draw.l.ng, mathematics and English.
The data and sources: The following is a list of the information which
was available to counselors at the time of registration, and which might have
had predictive value:
A. Results of the mathematics placement test expressed as the course the
student must be registered in:
(a) Math lll; a five hour course; credit.
(b) Math 101; a three hour course; credit.
(c) Math 96; a three hour course; remedial.
(d) Math 9>; a three hour course; pre,..remedial.
B. Results of the English placement test expressed as the course the student
must be registered in:
(a) English 101; a three hour course J credit.
(b) English 100; a three hour.course; remedial
(c) English 98; a three hour course; pre-remedial.
C. Results of the A.C.E. Psychological Examination expressed both as
percen tiles and raw scores.
D. The number of years of drawing the student had had in high school,
expressed as a dichotomy; two years of drawing; less than two years •
• The criteria of achievement for this study, were the final grades
(A, B, C, D and F) in the engineering drawing, mathematics and English
courses. The grade-point average of these courses were also used, where

i , I
I I ,
I 1 j
1
J
' •• 'it c' r t $ t tt ." nt' g am, 'I n . .$1 tlr~p .L t"
)2
A=4, B =), C =2, D=l andF=O.
Collection of the da~a was started after February, 19.56. In no instance "
was collection of data made prior to the assignment of a final grade in the
course involved. The writer has done all of the collecting of data. All o'f
the data were obtained from offici81 records in the registrarrs or counseling
offices.
A goodness of fit test of normality was made for the variables involved.
For the A.C.E. P5,Ych010gical Examination total score, the data were put into
fourteen intervals, and the value of chi-square was found to be 11.247, which
for 14 - 3=11 D.F., gave a probability value of between 0.30 and 0 • .50. There
was no evidence that the A.C.E. total score could not be assumed to come from
a normal population.
A similar goodness of fit test was also':made for the achievement·,
vaxiables: engineering drawing, mathematics and English final grades, ymere
these three variables were combined into a grade-point average. Using twelve
intervals and combining at one of the tails, a value of 10.449 was obtained
for chi-square. With 11 - 3 = 8 D.F., this gave a probability value of
between 0.20 and 0.30. There was no evidence of significant discrepancy, and
it was reasonable to assume that the sample distribution of this variable
could have been obtained from a normally distributed population.
The distribution of the engineering drawing grades was markedly
leptokurtic, therefore symmetrical. When the goodness of fittest was applied ~.... ~.-
to this variable, with the data treated in five intervals...; a :Valu~$'os...c."-,. '0
square of 16.460 was obtained. This result indicated a :very siRb.tf~cant '1" ~ . , Ojl\;,'v 0(-1. ~
discrepancy. However, 13 • .50 of the total chi-square (16~60). was f~tbut_ J " '/~r-.. y
I I I I
I j I .1
i $ i
I
33
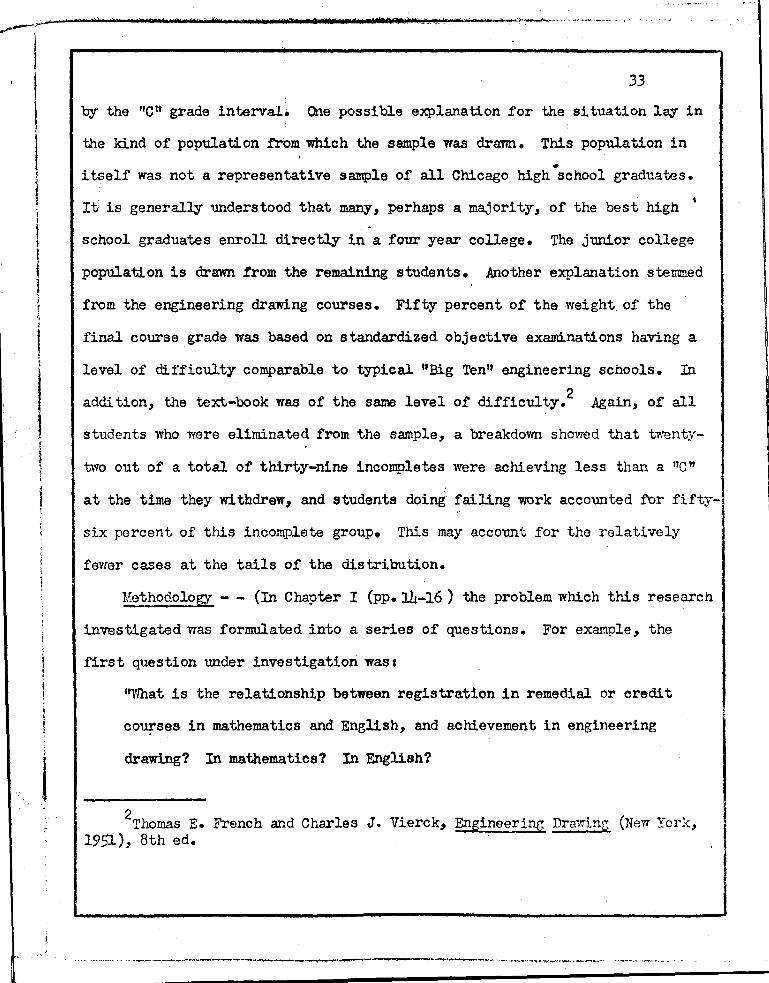
by the "ctt grade interval. One possible explanation for the 8i tuation lay' in
the ldnd of population frbm which the sample was dram. This population in ,
• itself was not a representative sample of all Chicago high school graduates.
It is generally unders.tood that many, perhaps a majority, of the best high '
school graduates enroll directly in a four year college. The junior college
population is drawn from the remaining students. Another explanation stemmed
from the engineering drawing courses. Fifty percent of the weight of the
final course grade was based on standardized objective examinations having a
level of difficulty comparable to typical ttBig Tenlt engineering schools. In
2 addi tion, the text-book was of the same level of difficulty. Again, of all
students who were eliminated from the sample, a breakdown showed that twenty-
two out of a total of thirty-nine incompletes were achieving less than a "C"
at the time they withdrew" and students doing' failing work accounted fur fifty-"
six percent of this incomplete group. This may account for the relatively
feYfer cases at the tails of the distribution.
Methodology - - (In Chapter I (PP.14-16) the problem which this research
investigated was formula.ted into a series of questions. For example, the
first question under investigation was.
"vfuat is the relationship between registration in remedial or credit
coU!ses in mathematics and English, and achievement in engineering
drawing? In mathematics? In English?
2 Thomas E. French and Charles J. Vierck" Engineering DrawinG (New York, 1951), 8th ed.

, :" The following null hypothesis was formulated:
r i
• ,<c' '. I I
f
"There is no relationship between registration in remedial courses, and
achievement in engineering drawing, mathematics and English. 1I
This null hypothesis was tested first with a 3 x 3 contingency table. '
Mathematics and English placement test results yielded the attribute data
registration in remedial classes; none, one, or two. 'Final grades in
engineering drawing were grouped; below "Cit; "C"; or above ItCH. With the
given sample, a finer grouping for achievement would have resulted in very low
theoretical frequencies in some cells of the contingency table. This treatment
did not differentiate between kinds of remedial courses; nor did it consider
the possible interaction between kinds of remedial courses. In addition, the
contingency table did not measure the degree of association between these two
variables. However, the significance of the' results indicated furtheT treat-
ment of the data by methods suc~ as analysis of variance.
The analysis of variance gave a method of testing the significance of. the
differences among more than two group means simultaneously. Was the mean
achievement of remedial students significantly different from the mean achieve-
ment of non-remedial students? In this study students were classified as
remedial or non-remedial in both mathematics and English. There was a single
classi~ication basis where all students were grouped into one of three cells:
none, one or two remedial classes. This classification ignored possible
interaction between mathematics and English course registration, as well as
the relative significance of mathematics and English. Note that the cell for
one remedial course involved either mathematics or English. To investieate
the possibility of such an interaction, a two way classification was used,

, . ,
where students were classified simultaneously into remedial or non-remedial
mathematics, and remedial or non-remedial English. This analysis of variance, ,
of course, also provide~ for a test of the differences ~ong the cell means.
Snedecor says that, where interaction exists, the two treatments (bases of
classification) have a combined effect which is different from the sum of the
effects applied separately.3 The presence of interaction would confound the
main effects and render ineffective an analysis of variance wi th one basis of
classification. The question is raised as to whether readiness in English (as
indicated by the particulnr English course) had an effect on achievement in
mathematics, and vice versa. Conversely, if interaction could be shown not to
exist, then analysis of variance, with a single basis of classification, would
be both convenient and valuable.
It was necessary to mow in advance Whether interaction was present.
Interaction mean square may be used to test main effects, When interaction is
mown to exist or is suspected. Otherwise it is appropriate to use the within . 4
mean square to represent elTor variance in testing main effects. Walker and
rev suggest an approximate method for a two-way analysis of variance wi th
unequal frequencies in the cells which is convenient for the preliminary
investigation of the presence of interaction.5
The value of the within sums of
squar.es was obtained in the usual way, but was multiplied by a correction terI!!:
3George w. Snedecor, Statistical Methods (Iowa, 1956), p. 335.
4 Francis C. Cornell, Essentials of Educational Statistics (New York, lq~b'
p. 38~~elen Y. l1alker and Joseph u.v, Statistical Inference (New York, 19Sj-)~ -I

_ ........... '--_ ....... ..-.......... ± ..... _ ......... __ $ .... "tt ... • .. __ ' ... sIlilililoilJ lilli' .... W ..... ~jojjtWIilli' -'_ ...... , _it ""9«"· ..... ".Jiillllo7111111'tm"7""!>!1!!~~"~~t #q~.~! "~A~~~'" 1:01. ._,_e _ -_~-_-_ •. _ .. ~ ;..:. .. ,
I 1
I f
where: r - nmnber of rows •
8 = number of columns
a,b,c, and d were the cell frequencies.
This correction term, when combined with the S.S. wi thin, gave the adjusted
mean square for error. The sums of squares for interaction and main effects
were then obtained by treating the cell means as single observations and
follOwing the usual procedure in analysis of variance.
Following this preliminary investigation, a two by two analysis of
variance was used which was appropriate to the nature of the data. When thes8 I
data were classified on tlro bases (remedial or credi t mathematics; remedial or I credit English) the frequencies of the cells were unequal and disproportionat~.1
Patterson ts "method of adjusting" has been shown to give the same results t".5
the "least-square method of fitting constants", and Patterson quotes W.G. 6
Cochran to this effect. Ei ther of these methods could have been applied to
the data of this study. However, there is available for the special case of a
2 x 2 classification, a method which will give the same results as Pattersonts 7
method, 'With a savings in time. Wert has developed such a method, which
involves the calculation of an adjustment term, which, when applied to SUlns of
squares for interaction and main effects, compensates for the
6 R. E. Patterson, "The Use of nisproportionate Numbers in the Sub-Classes,' JASA, XIJ (September 1946), 334-346.
7 James E. Wert, Charles O. Neidt, J. Stanley Ahmann, Statistical l,"ethocs ~ Educational and P§lchological Research, (New York, 1954), pp. 211-215.
f

'.' '
.......
1
t
j J ~
#
37
disproportionali ty of cell :t:requencies. Without this adjustment, the sums of
squares ~ould give biased estimates for all the sources of variance except for •
the within variance.8 Symbolic~, the method of Wert follows:
For the adjustment term:
'Where:
stub items
a c
Headings
b d
Total "k 4
a, b, c and d= frequencies of the cells.
~, ~, k3, ~ = row and column totals.
Xl = mean score for Kl cases.
X2 = mean score for ~ cases.
13 = mean score for K3 cases.
X4
= mean score for \ cases.
~,2 -x;. - X 2
D3,4 =X3
"";' X 4
The adjustment term is t
Total
kl k2
N
fad - be)2 [(kl ) (~) (Dl ,2)2 + (k3) (k4) (D3,4)2] -2(I\,2) (D3,4) (ad-be) ~k2k3k4)
8Ibid• -

,38
Rule for applying this term:
Positive term: subtract from 8.8. for interaction, •
add to 8.8. of each main effect.
I 1
Negative term, add to 8.8. for interaction,
subtract 'from 8.8. of each main effect.
For the sums of the squares (unadjusted):.
(total)=L L L [X2.. J . · k [~J t X Lj k J2 8.8.
k J l ~J - N r ([XkJ
2 2
[~'Jf X ) (LX k ) ij I<. 8.S. (English) = _+ 4 . k3 '. kl N
J2-! . (IX )2. ( ~, yz- [~y t' X ·EX i J 1<. S.S. (math)= K, . I< 2.
kl + ~ N
S .s. (interaction) ( L Xa )z. (~Xb )2. (tx e )2. (2 Xd /- I
- + + +' a ·b c d
[ L L::L: X . J J<. ] Z. k J L L
N
8.8. (within)=8.S. (total)-8.S. (math + English + interaction)
2 Where: ~ J: r (X )lj /( = the sum of the squared scores of the sample.
f- f f X L j k ::11 total of all scores of the sample.
a,b,c,d,kl' k2' k3 and k4 are as defined, page 37.
Contingency tables were used to investigate the relationship among the
A.C.E. Psychological Exam scores and the achievement criteria: final grades
". ,">- ____ "'.~.___.."...,.~~-"'· .... F ,, __ ;a, __ ._---................... --
, :
"'''!- -', -' ,.~,
1m -". t ') ",r.ts $ rim -: $7 * t s tt"1 » .. ,'iar 'to ''ftC, . t
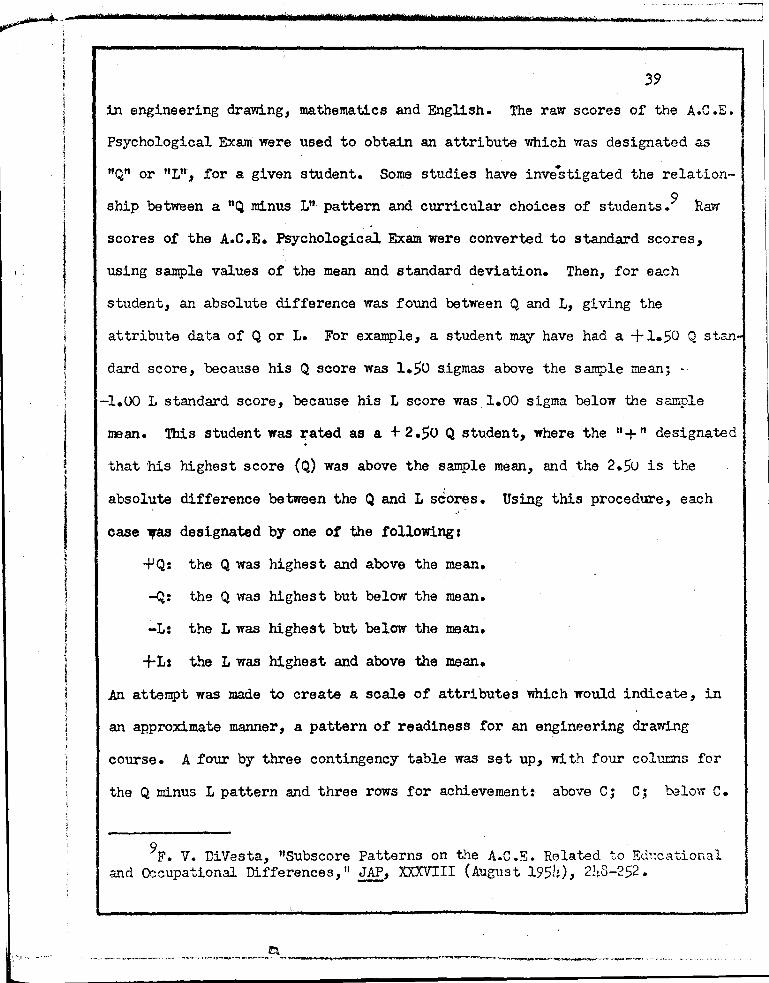
39
in engineering drawing, mathematics and English. The raw scores of the A.C.E.
Psychological Exam were used to obtain an attribute which was designated as
"Q" or "L", for a given student. Some studies have investigated the relation
ship between a "Q minus Lit pattern and curricular choices of students.9 naw
scores of the A.C.E. Psychological Exam were converted to standard scores,
using sample values of the mean and standard deviation. Then, for each
student, an absolute difference was found between Q and L, giving the
attribute data of Q or 1. For example, a student may have had a +1.50 Q stan
dard score, because his Q score was 1.,0 sigmas above the sample mean; -
-1.00 1 standard score, because his L score was 1.00 sigma below the sample
mean. This student was rated as a + 2.,0 Q student, where the "+" designated
that 'his highest score (Q) was above the sample mean, and the 2.5u is the
absolute difference between the Q and L scores. Using this procedure, each
case "as designated by one of the following:
-f-lQ: the Q was highest and above the mean.
-Q: the Q was highest but below the mean.
-L: the L was highest but below the mean.
+ L: the L was highest and above the mean.
An attempt was made to create a scale of attributes which would indicate, in
an ap'proximate manner, a pattern of readiness for an engineering drawing
course. A four by three contingency table was set up, with four colunns for
the Q minus 1 pattern and three rows for achievement: above C; C; below C.
9F• V. DiVesta, "Subscore Patterns on the A.C.E. Related to Edl!cational and O::cupational Differences," JAP, XXXVIII (August 195h), 248-252.

. '.
40
Thus, for the question under investigation, we tested the followine null
hypothesis: •
There is no relationship between a "Q minus L" attribute of the A.C.E.
Psychological Exam, and achievement in engineering drawing.
The sixth and seventh questions under investigation involved the
continuous data, scores of the A.C .E. Psycho;togical Exam and the achievement
data, final grades. To test the null hypothesis, that the sample estimate of
the correlation coefficient is from an uncorrelated population (p= 0), a
Pearson product-moment coefficient of correlation was obtained. The Q, L and
total scores of the A.C.E. Psychological Exam were separately correlated With
final grades in enginee~ing drawing, b.r means of a Lindquist correlation chru-t. j
In addition, the total score of the A.C.E. Psychological Exam was correlated I I with the composite grade-point average of £inciJ. grades in engineerlng drawinG' II1I mathematics and English.
To determine the level of significance of the calculated values, at-value
was obtained as follows:
t r ~ N-2 -
This t-value, in turn, gave the probability of such a value of r being obtained
from an uncorrelated normal population. It was recognized that allo",al'1ces Ol1st
be made in interpreting the results of such a Significance test becaLlse of the
somewhat leptokurtic distribution of the final grades in engineering
~I ____________ ---J

wvt ern. em ., 7 " OJ' ,,~'= tnt - $ n ten r " "- 'hf 7'.:'
41 drawing.
lO This limitation however, did not app17 to the grade-po:lnt aV9:rag9
variable.
I 1 1
~
i I I
10 See page 33, goodness ot f1 t test.

t. . b' '$ to 0. 5tn" 1M$' ~ ·d'bst't 'tt e , , oN ttttt t t ,,, t Nt tt cd ".'1'%''' Nt wt tr t' td "W
CHAPl'ER IV •
RESULTS AND DISCUSSION
In Chapter I" the questions to be investigated were listed. Following
the procedures detailed in the Methodology section of Chapter III, these
questions were then individually investigated.
The first question under investigation was:
I What is the relationship between registration in remadial or credit courses in
j mathematics and EngUsh and achieve ... nt in engineering drawing? In
rr~thematics? In ~~glish?·
The null hypothesis was:
There is no relationship between registration in remedial or credit courses
in mathematics and English and final grades in engineering drawing: i.e.,
a homogeneous population is postulated.
I This hypothesis was first tested b.r a 3 x 3 contingency table"
Table XI.
I I
42

I -t.i
t it
t I
i j
I
I
• * '. ~tegb 'Wke*,
Engr. draw. final grades
A, B
C
D, F
X2= 31.1391
P' '1 ¢"tt *rt ':0"*1 ' t .,'.1 .. )0, f ,. ltd '''ttn • t'#· 1 $i. tot .. Sf; )"P- )I ... _,""'_ ..... ~
TABLE XI
DISTRIBUTION OF ENGINEERING DRA'NING GRADES BY REGISTRATION IN NUMBER OF REMEDIAL CUSSES
Registration in remedial classes
None· Cile Two
(22.59) 32 (14.31) 8 (9.04) 6
(40.26) 45 (25.62) 28 (16.12 ) 9
(25.15) II (16.01) 20 (9.84) 20
88 56 35
D.F.= 4 p < 0.001
43
•
Totals
46
82
51
179
The null hypothesis was rejected. Although Chi-square indicate~
departures in either direction, an inspection of the cell frequencies shows a
tendency 1'or non-remedial students to tally in the high achievement (grades
above C) cell, in contrast to remedial students, who tend to tally out of
expected proportion in the lower achievement (grades below C) cells. The
attribute data, registration in remedial classes, originated from the
continuous scores of the mathematics and English placement examinations. The
~
~ pattern of the frequencies in Table XI is analogous to a correlation chart ,
using grouped frequencies and continuous data. An association exists between I
lThe capital "X" was used throughout to 2designate an obtained chi-square, as recommended' by i'filliam G. Cochran, liThe X Test of Goodness of Fit, II Annals ~ Mathematical Statistics, XXIII, n. 3, 315-346.
~"'> __ -"" ____ l_"'''~_'''~_''''''''''_''''''''''''; __ ----.-----"'-... "' ......... ___ ..... _ .. ___ ._ ... ~ .... "'~ __ ._., ... ,
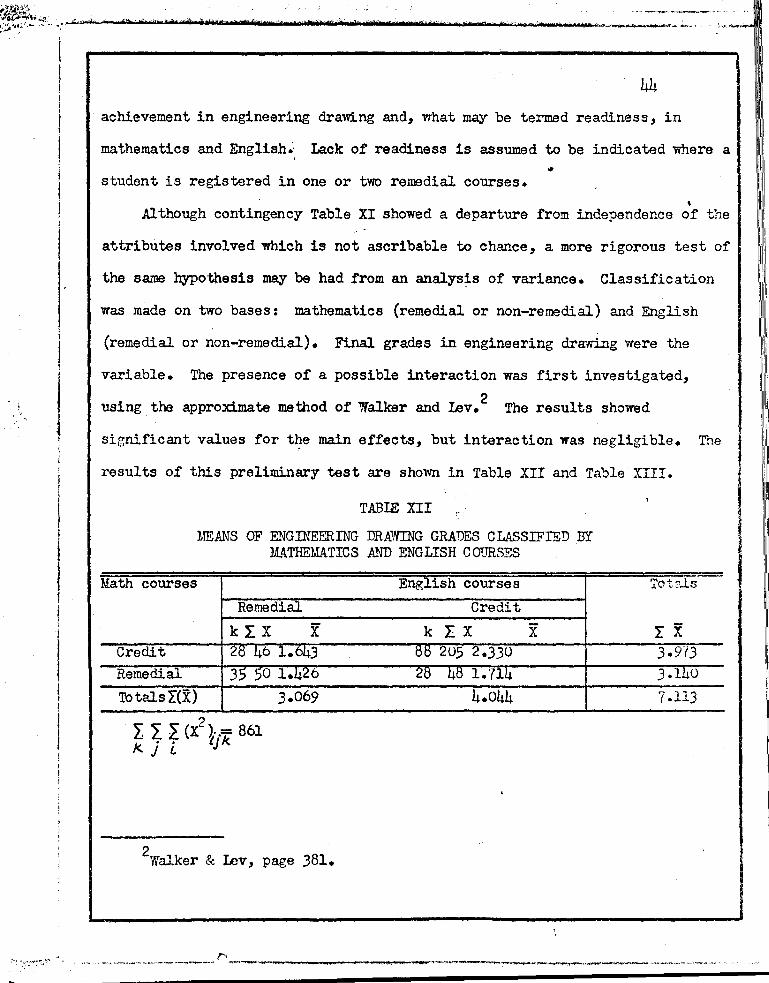
I
I i
! 1
*lh ' W'b 'lIM $" ., . ., ** •• 1; te' f, t pn t) tn') df ±t h r gMt r res' t'd <. eM t,t to .. ,., t".~ "* t ._ .... ft.' 1M ......... """, ...... "".-.l: __ .. _. ',_~"
44 achievement in engineering drawing and, what may be termed readiness, in
mathematics and Eng1ish~. Lack of readiness is assumed to be indicated where a •
student is registered in one or two remedial courses. ,
Although contingency Table XI showed a departure from independence of the
attributes involved which is not ascribable to chance, a more rigorous test of
the same hypothesis may be had from an analys~s of variance. Classification
was made on two bases: mathematics (remedial or non-remedial) and English
(remedial or non-remedial). Final grades in engineering drawing were the
variable. The presence of a possible interaction was first investigated,
2 using the approximate method of Walker and lev. The results showed
significant values for t~e main effects, but interaction was negligible. The
results of this preliminary test are shown in Table XII and Table XIII.
TABIE XII
:MEANS OF ENG llJEERING DRAWING GRADES CLASSIFIED BY MATHEMATICS AND ENGLISH COURSES
Math courses English courses
Remedial Credit
krX X k LX X Credit 2~ 46 1.643 ~t; 205 2.330 Remedial 35 50 1.426 2~ 4t; 1.714 TotalsL'(X) 3.069 4.044
2 ~ L ~ (X )'{"b 861 J<. •• J" J t.
2 Walker & Lev, page 381.
Tot:'~s
L X 3.913 3·140 7.113
i
! II
1'1
Ii

~~ ___ ""*""N ..... t ..... * ... · ....... '_tIllOlM_.·.X ___ bW*'· .. ' .... ·w.nlloit tillllllllnrlilllilloistllll' IliS ... oai'1III111i11'iliieillllWtIloit'liIIIilO .. ·'''''''· iIIIIII' 1iIroI' lliiit ..... ,', ..... l1li) .... IIIIii"iiIIII' ""1iIII0 ..... , .... · .... n ... > ... · ......... 'W""· ' .......... te' ... · ... 9'M.......;' .... · __ "'_"'Wd!~"""ol).;""' . ... "-_"'-_ ..... ;.~
i
j
j ,
f
J >'<t . , } i
Source
Math.
English
L'1ter.
Error
TABIE XIII
ANALYSIS OF VARIANCE OF ENGINEERING DRAWING GRADES CLASSIFIED BY MATHEMATICS AND ENGLISH COURSf:S
5.5. D.F. M.S. F
0.113 1 0.173 7.13
0.362 1 0.,362 14.82
-0.010 1 -0.010 -2.81
175 0.024
45
Signi.
.01
.01
no
The two by two analysis of variance for disproportionate. frequencies,
suggested by Wert, was used to test again the null hypothesis of independence
between the attribute registration in remedial courses, and final grades in i
engineering drawing. Table lIT shows the frequencies and means in a convenientl
form, preliminary to calculating the adjustment term. More specifically, we
test the differences among the four cell means. The null hypothesis assumes
that differences among the cell means could be attributed to variability in
sampling from a homogeneous population.
I J ~----________________________________________ J

46
TABLE XIV
MEANS OF· FINAL GRADESl IN ENGINEERING DRAWING •
Math. English course registration course regis.
Remedial Credit Totals
k EX X k
a b
Credit 28 46 1.643 88 205
c d
Remedial 35 50 1.426 28 48
k3 k4 Totals 63 96 1.524 116 253
X3
2 Note: L ~ ~(X ) iJ' 'k = 861
1< J L
X
1.714
k z:::x
251
98
179 349
T
lOrades expressed as follows: A = 4; B = 3; C = 2; D= 1; F = o.
C~culation of the adjustment term followed the procedure outlined in
~hapter III; substitutions gave -7.78692 from:
X
1.950
'2
UtB)(z8)-(88)(35")] fc/l,)(,,3)( '08)l+(~3)(If")(- ~57/l_2( b08)f:'St:J~28)(Z8)-(831 (1Ir.) ('3)(r.3){J"J ~ • . [ [(L8)~28)-;88);3SJ~ ] 1<- "I
/71 /- (I/t,) (t,3) (t,3) (//t,) I
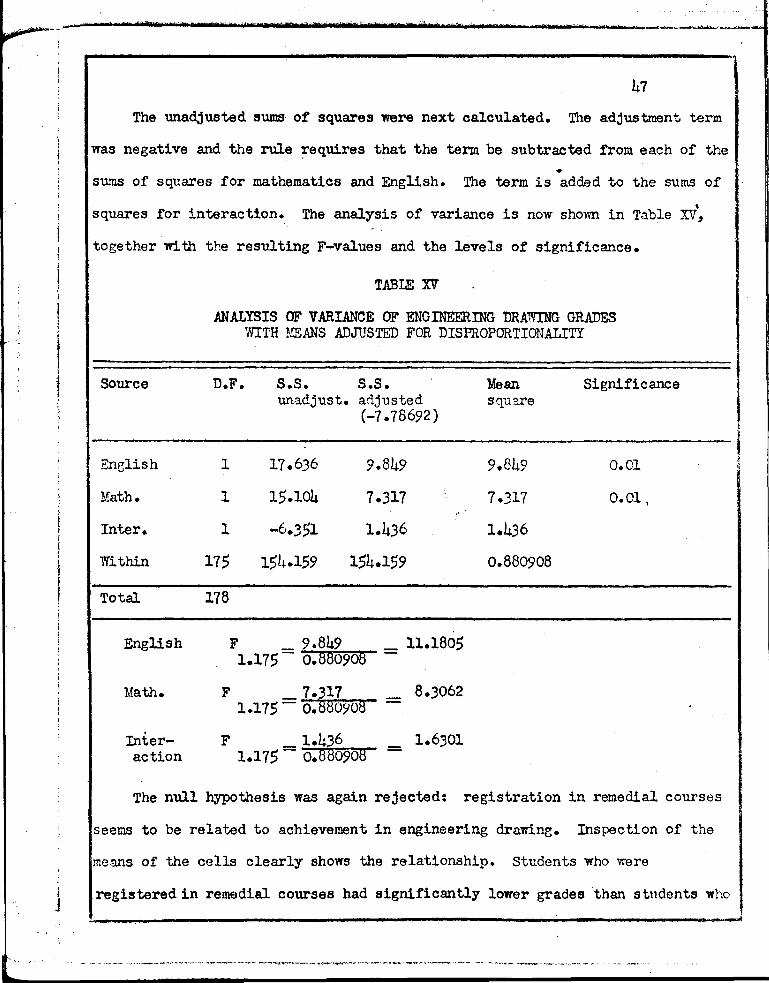
___ ~_1> .... ,..-___ -_n""_f .... " __ * ......... " .... ' .. • ..... '1_' ....... ' iIiiiI10 .......... t liIii'tIliliSrliiolo'lIior*"tliiol--.1iIIII> ... · ..... '*_""'. Siloo, ... 5 ......... 0 ... ' ____ ttt_ ... ' .... t·_· .... ' __ ' __
47
The unadjusted sums of squares were next calculated. The adjustment term
was negative and the rule ~equires that the term be subtracted from each of the •
sums of squares for mathematics and English. The term is added to the sums of
squares for interaction., ,
The analysis of variance is now shown in Table XV,
together with the resulting F-values and the levels of significance.
Source
Enelish
Math.
Inter.
Within
Total
English
Math.
Inter-action
TABLE XV
ANALYSIS OF VARIANCE OF ENGINEERING DRAWING GRADES WITH MEANS ADJUSTED FOR DISPROPORTIONALITY
D.F. S.S. S.S. Mean Significance unadjust. adjusted square
(-7.78692)
1 17.636 9.849 9.849 0.01
1 15.104 7.317 "- 7.317 0.01 so
"
1 -6.351 1.436 1.436
175 151+.159 154.159 0.880908
178
F _ 9.849 1.175 - 0.880908
= 11.1805
F 7.317 8.3062 1.175 = 0.8809UB -
F _ 1.436 1.6301 1.175 - 0.88090B -
The null hypothesis was again rejected: registration in remedial courses
seems to be related to achievement in engineering drawing. Inspection of the
means of the cells clearly shows the relationship. Students who were
j regbtered in remedial courses had significantly lower grades than students who 1
I
I ~

~.-.,., ______ """'-"""""''''_'' ___ ·_''''b __ ''''' d""-__ '.' .... ' rrt ___ ' ....... -.1 ... ' _-.... __ ......... ' .... #_ .................. ___ ...-. ..... _~_.:-___ _
i
48 . I marked' were in the credit courses of mathematics and English. The contrast is
, j "
when celJ. trc" (two remedial courses) 1s compared to cell "bit (two credit •
courses). It is interesting to note the fact that the significance of English ,
I , I is greater than that of mathematics. One possible explanation involves the 1
fact that English is required of all high school students; mathematics is not
so required. It follows that registration in remedial English could reflect
lack of abilit.y to a greater degree than does registration in remedial
mathematics. That is, the remedial mathematics student may not have taken
high school mathematics, and remedial mathematics may mean lack of. readiness,
not lack of ability.
It would be well to emphasize at this point, that students in remedial
courses have to exhibit less achievement than students in the crem t cot.:rses
in order to receive a given final grade. This situation exists because the "
remedial courses in both mathematics and English involve easier assignments
and tests to cover course material that is of a more elementary nature than
comparable assignments and tests in the credit courses. It may also be
recalled that credit mathematics 111 is a five hour course in contrast to
three hour courses in remedial mathematics ninety-five and ninety-six, and
credit mathematics 101. The effect of the above consideration is to reinforce
the significance of the differences among the cell means.
The two by two analysis of variance showed the interaction to be
insignificant, (Table XV). The main effects are not confounded, and it was
appropriate to use a single classification analysis of variance for the
engineering drawing grades.
The purpose was to gain additional information by classifying the s~~ple

I ! !
I i
I I
..--........... · ..... w_' ..... • 't .... " _' ._ .... '_ ......... ' "'M'hilOo/;'"¢oiIo;" -."' ... n t""''' ... ' _' .. itt""' ... · •. ' ..... 'filii· iIIIIot .... ", .... ' ..,.' .r> ... ,t .... · rdolio_lili· · ........ ' ...... tt_te; te_· _I i ... · .... · .... f*¥_ .......... _ .... etrt .... ~1' .......... ' · ..... (0' .... +1 ... '· .... • ... 'kb ... · ... ' ....... ~............,;.~&---ll
49
into four sub-groups, according to mathematics courses. Table XVI shows the
,data, together with the means (rounded). The null hypothesis to be tested •
again is that the differences among the cell means could have resulted from
sampling variability in a homogeneous population.
Math course
III
101
96
95
Totals
TABIE XVI
DATA FOR ENGINEERING DRA'lWTING GRADES CLASSIFIED BY REGISTRATION IN MATHEMATICS COURSES
nj ~X ~ (X2)ij
63 142 376
53 109 263
46 77 183
17 21 39
179 349 861
Draw. course X-
2.25
2.05
1.67
1,,23
1.95
The resulting F-ratio shown in Table XVII was significant beyond the one
percent level. The null hypothesis was again rejected. An inspection of the
cell means of Table XVI indicates that it may be of value to differentiate
between the effects of the two remedial mathematics courses, and that this
information may be of value in counseling and programming.
""',.,..0' -_. __ .".~, .• "'_.",., _________ .... _. __ ,,_ .. __ • __ , ... _____ "?--~_.,.,~ .~_._.., ~ __ ""I._"""'~'-'~_#_""'''''''''' ,._ .. ~_ .......... " " ..

_..-.~~? .0. C·55
,.-", .... tt'"1"''' tt rt,.~'ri'. f.tttTret 'tt"."1?ttztW'-f,t'tt't'ehWifeaimst'H'?t,f ·f i.$(t ... )t-l.»f,...!,,,-....... _~,._
" l' " , ~.~
, ,
TABIE XVII
ANALYSIS OF VARIANCE OF ENGINEERING DRAWING GRADES CLASSIFIED BY REGISTRATION TIl FOUR MATHEMAXICS
COURSES
50
Source of D.F. , Sum of Mean Significance
variation squares
Total 178 180.5415
Among 3 18.6133 Within 175 161.9342
F 6.20443 6 5 3.175 = 0.92534 = .10 0
square
6.20443 0.92534
0.01
M analysis of variance was also made for the engineering drawing grades ·1 ~ and the attribute registr~tion in English classes. Table l~III shows the data
where classification was based on the three, English courses, and Table XIX
shows the resulting analysis of variance.
-English course
101 (credit)
100 (remedial)
98 (remedial)
Totals
TABLE XVIII
DATA FCR ENGINEERING DRAWING GRADES CLASSIFIED BY REGISTRATION TIl ENGLISH COURSES
nj EX ~ (x2)ij
116 253 653 41 77 173 16 19 35
119 • 349 861
X
2.18 1.64
·1.19
1.95
,
The F-ratio shown in Table XIX was significant beyond the one-percent
level and the null hypothesis was again rejected. As with the two by two
a.."1a1ysis of variance (Table XIV), the effect of the attribute "rcs:istratl.on
... . I I •

i
I
J in English" on final grades in engineering drawing is more p~onounced than the
effect of mathematics registration.
Source of variation
Total
Among
Within
•
TABLE XIX
ANALYSIS OF VARIANCE OF ENGINEERING DRAWING GRADES CLASSIFIED BY REGIS'IRATION IN ENGLISH COURSES
178
2
176
SUl\ of squares
180.548
20.061
160.487
Mean Square
Significa.:.'1ce
0.01
F 2.176
10.0305 U.9118 -- 11.00U76, p < 0.01
"
Students registered in English course ninetY-eight usually have serious
reading difficulties. It seems reasonable to infer from the results of Table
XVIII that students who have difficulty in comprehending the spoken and written
language will have small chance of success in the engineering drawing courses.
In swnmarizing the first question under investigation, we may say that
although the distribution of the final grades in engineering drawing was
leptokurtic, the evidence indicates a significant relationship be~een the
attribute, "registration in remedia?- courses" and achievement in engineerint~ .. drawing. .AI though the statistical results may be qualified by this lep t0kll.rti·~
distribution, further investigation may remove any doubt.
The second question under investigation was:
",',bat is the relationship between the attribute, registration in remedial

" .
J
,2 mathematics and remedial English and achievement in mathematics? In English?
The Null hypothesis wass
There is no rolationship between the attributes registration in remedial \
mathematics and rerredial English and final grades in mathematics and English.
It was considered to be of supplementary interest to investigate the
above question. Although placement in a remedial section of mathematics or
English in itself indicates a deficiency in that subject, it bears repeating
that students in, for example, remedial English 98, are not measured by the
same standard as students in credit English 101. On the contrary, such
remedial course registrants could earn a ItO" grade 'Wi th lower achievement than
would be required in English 101. A three by three contingency table was set
up to test the null hypothesis of independence. Table XX shows the results.
TABLE XX "
DISTRIBUTION OF FINAL GRADES IN ENGLISH BY REGISTRATION IN NUMBER OF REMEDIAL COURSES
Final grades, Registration in remedial classes English
0 1 2
A&B (2,.04) 31 (1,.94) 13 (10.02) 7
·0 (42.23) 40 (26.87 ) 28 (16.90) 18
D&F (20.73 ) 17 (13.19) 1, (8.08) 10
Total 88 ,6 3,
2 4.4832 D.F.= 4 p> 0.30 X=
•
Total
,1
86
42
l'()'

~*~r'''''-''''-' _. _w ............. · ."'0100'''';' ,,,,,,tCIoiII.liilzkW"fs_SlIioi ....... ' .... 1iiI,.stioll,IiIot)IIIiI'MM' 1iIIi:t.· ........ ' =lIIIn ... • ..... t_' 1IiIIl,._aiiil' ""lIiIIn1i1iil1ile:IIio· .. rN ... 't' ... ttJWQ(_'~IliiIIWIi1il'i1?I101'''''' ... " ................. ___ 1 01, ..... · ..... :._* ...... '_·, __ ,.. ... ,_ ... 1 _ .. , __ _
"', .
,
i !
$3
The null hypotheSiS was retained. The departure from independence is of
a magnitude that could easily result from sampling variability. It seems •
reasonable to assume that lack of readiness in mathematics should have no
effect on achievement in English.
The question is now raised as to what effect, if any" registration in
remedial courses has upon achieVement in mathematics. Table XXI gives the
frequencies and results for testing the null hypothesis of independence.
TABLE XXI
DISTRIBUTION OF FINAL GRADES IN MATHEMATICS BY REGISTRATION IN NUMBER OF REMEDIAL COURSES
Final grades, Registration in remedial courses Totals mathematics
0 1 " 2 "
A&B (26.03) 35 (16.56) 17 (10.41) 1 53
C (34.37) 38 (21.87) 17 (13.76) 15 70
D&F (27.60) 15 (17.57 ) 22 (10.83) 19 56
Total 88 56 35 179
D.F.= 4 p < 0.001
The null hypothesis was rejected. The results indicate that the attribute
registration in remedial courses is related to achievement in mathematics.
The rerradial cases tend to fall, out of expected proportion" into the lm1'
J achievement cells. Conversely, the non-remedial cases tend to concentrate in
the higher achievement cells. In comparing the results of tins table with
Table XX, it seems reasonable to assume that difficulty in· verbal conprehcnsicnj
(indicated by remedial F.nglish) could affect the mathematics student's 3"01.11 i.y I

. , ~ , ....
1 . ".:
54
to understand lecture and text material. But, it seems les's l1k'3ly that
difficulty in understanding quantitative relationships (indicated by remedial •
mathematics) would af'fect the English student t s achievement.
The third question under investigation was:
What is the relationship between registration in remedial mathematics and
remedial English and achievement expressed as the grade-point average of
engineering drawing, mathematics and English final grades?
The null hypothesis was:
There is no relationship between the attribute registration in remedial courses
and the grade-point average of engineering drawing, mathematics and English.
The null hypothesis of independence was first tested with a three by
tpxse contingency table, Table XXII.
TABLE XXII
DISTRIBUTION OF CASES BY GRADE-POINT AVERAGE ACCORDING TO REGISTRATION IN NUMBER OF REMEDIAL COURSES
Grade-point Registration in remedial classes ave. of draw., math. & Eng.
0 1 2 , Above C (23.57) 34 (15.00) 12 (9.43 ) 2
.C (40.76) 40 (25.94) 25 (16.30) 18
Belo'N C (23.67) 14 15.06) 19 (9.27) 15
Totals 88 56 35 •
2 X = 19.tU78 D.F.= 4 p <0.001
Totals
48
83
48
1'79

,
. ,'.,.. J I' >
i I . , ,
1
'n tg".k' 1 , 3m '':? ·NN S t'r _ Pb ltflst-''j en de a P>1WM 1.... t¥¥ • *"11 .• ~ ..
55
The null hypothesis was rejected. An inspection of the frequencies
reveals that registration in remedial classes is correlated with low •
achievement. The major contribution to chi-square comes from the cells made up
of the outer rows and columns, i.e., the four corner cells.
It is possible for low achievement in one subject to be hidden by the
grade-point average. Therefore, a four by three contingency table was set up
to test the null hypothesis of independence between the attribute registration
in remedial classes and the attribute, number of final grades less thal'l a "C",
in the courses engineering drawing, mathematics and English. Table XXIII
shows the frequencies and resulting chi-square, which was very significant •
en!} cell, how-eyer, had a theoretical frequency less than five. ';\'hen the
remedial columns were combined to give a four 9Y two table, the resulting
chi-square (26.5181) was still very significant but some information was lost
in combining columns.
TABIE XXIII
DISTRIBUTION OF NUMBER OF FINAL GRADES IESS THAN "C" BY REGIS'IRATION IN NUMBER OF REMEDIAL CLASSES
No. of final Registration in remedial classes grades below
C 0 1 2
0 (46.16) 64 (29.:37) 21 (18.47 ) 9
1 (19.64) 11 (12.50) 19 (7.86) 10
2 (12.77 ) 7 (8.12) 10 (5.11) 9 3 (9.43) 6 (6.01) 6 (3.46) 1
Totals 88 56 35
i- = 32.7696 D.F.= 6 p < 0.001
,-----------_ .. _._,------_._- .
Totals
94 40 26 19
1'(9

-_.-........ _ro ___ ' ..... ' ... ¥ _' ........ ' .... * ... ·-__ ... K ... '>t_ ... 'H,.,.·W .... ·" ... J illliid'Wtf..,'iiIoI, ' ....... , i ......... nat ... nfnflOM ......... ·.t ___ t ..... 1M .. _e ..... ''''''· ............ · .. _ ...... ,t .... ' ______ • ..,.$I_ .... _-JI ¥.~_ ~ ~.r~'_._
$6
The null hypothesis was rejected. The attributes are related; remedial
registration seems to indi~ate lower achievement. •
The design of the statistical treatment has been influenced ~ the need to
obtain information that can be quickly evaluated during counseling and
programming of students at the time of registration. It was again convenient
to apply the two ~ two analysis of variance to ,the grade-point averages. The
method suggested by" Wert for dealing with disproportionate frequencies was
applied again to the attribute data, registration in remedial courses, and the
continuous data, grade-point averages. The frequencies and means are ShOlID in
Table XXIV.
Math. course regis.
Credit
TABLE XXIV
MEANS FOR THE GRADE-POINT AVF..RAGES OF ENG INEERTI'iG DRA'\"TING, MATHEMATICS AND ENGLISH BY MATBEMATICS AND ENGLISH CO\JRSES
.'
English course registration Totals
Remedial Credit
k EX 1 k :EX X k LX
a b ~ 28 49.10 1.754 88 193.66 2.201 116 242.76
c d k2
X
2.£9: =s.
Remedial 35 53.01 1.514 28 51.66 1.845 63 loh.67 l.td ):" I
I::" ,;
k3 k4 --------+-------------------+-------------------~-----------------~
Totals 63 102.11 1.621
13
=788.2002 ij k.
116 I
245.32 2.115 179 347.43 l .. ··i:~
X4

57
The calculation of the adjustment term followed the procedure shown on
page forty. The term was ,negative and would be added to S.S. for interaction, •
and subtracted from the 5.5. of each main effect (mathematics and English). ,
Table XXV is the analysis of variance of the grade-point averages which
tests the null hypothesis, that the difference in the cell means (Table XXIV)
could have resulted from sampling variability ~rom a homogeneous population.
Source
TABIE XIV
ANALYSIS OF VARIANCE OF GRADE-POINT AVERAGES WITH ADJUSTMENT Foo. DIS PROPORTIONALITY
D.F. S.s. una.djusted
s.s. adjusted
Mean square
Significance
(-4.142246) , i -----------------------------------------------------------··-i
English 1 9.964 5.822 5.822 .c. 01 ~ "
Math. 1 7.596 3.453 3.453 0.C5
Inter. 1 -4.004 0.138 0.138
Within 175 100.30018 0.57314
Total 178
English
Math.
Interaction
F 1.175
F 1.175
F 1.175
_ 5.822 - 0.~7314
_ 3.453 - 0.57314
0.138 0.57314
= 10.1586
None
The null hypothesis was rejected. The F-ratios for the main effects were
both significant. We may infer that the differences among the cell :::2<1.,'1S were
caused by lack of homogeneity in the sample, as characterized by the I • I

58
attributes registration in English and mathematics courses. The significance
level for mathematics is lower than that for English. The F-ratio for •
mathematics is lower than that for English. The F-ratio for the one-percent
level is about 6.8, whereas the obtained value for the mathematics effect
.... j . L -"",
was 6.025, placing it close to the one-percent level. Inspection of the cell
means shows the same pattern as that of Table XIV. Students registered in
both remedial mathematics and English are the low achievers; but students
in the two cells for either remedial mathematics or remedial English also
achieve less than a "c" (C= 2.0). Together, three cells involve one or two
remedial courses, and have about fift,y-one percent of the sample. These
students have a level of achievement, in three important courses, less than a
liCit; it is reasonable to assume that their main difficulty is English.
The fourth question under investigation was:
''fuat is the relationship between the A.C.E. Psychological Exam total score
and achievement in engineering drawing, mathematics and English?
The null hypothesis was:
There is no relationship between the A.C.E. Psychological Exam total score
expressed as a dichotomy (above and below the sample median), and the grade
pOint average of engineering dra;w.Lng, mathematics and English.
The null hypothesis of independence was tested in a five by two
contineency table, Table XXVI.

. i !
TABIE XXVI
DISTRIBUTION OF THE GRADE-POINT AVERAGE OF FINAL GRADES IN ENGINEERING DRAWING, MATHEMATICS AND ENGLISH BY A.C.E.
TOTAL SC ORES
·--
Grade-point A.C .E. Total score (md = 99) Totals ave. (draw. & math. & Eng.) At or below Above md.
md.
A ().04) 0 (2.96) 6 6
B (18.25) 14 (17.75) 22 )6
C (34.48) 33 (33.,2) 35 68
D (13.18) 18 (12.82 ) 8 26
F (6.05) 10 (5.9,) 2 12
Totals 75 73 148
2_ X - 17.0741 D.F. = 4 0.005 >. p">-O.OOl
The null hypothesis was rejeoted. One oe11 had a theoretical frequenoy
less than five. When the two top rows were combined the resulting chi-square
for three degrees of freedom was also significant beyond the one-half of o~e
percent level.
Achievement in the three courses was also expressed as the attribute,
number of final grades below "C". The null hypothesis of independence of tris
attribute from the dichotomized A.C.E. total score was tested in Table ~vII.

~~ ......... - ..... "".",. ___ tk _ .......... _, .......... ' :_""'O ........... 'tiW_Wh ...... H .... • ... · _t ' ............. ri ...... _e .... · .... W .... · _e _. "_'" ___ ._. "" .... _tf ....... _·_ ... • - ____ .......... _ .. ik ........ _ .. ___ ... _ ..
. .;,
60
TABIE XXVII
DISTRIBUTION OF THE NUMBER OF FINAL GRADES BEWW "C" BY A.C.E. TOTAL SO ORE •
, No. of final A.C .E. Total Bcore (md.== 99) Totals grades below C (math., draw., At or below Above md. English) md.
0 (38.53 ) 23 (37.41 ) 53 16
1 (18.25) 25 (17.15) 11 36
2 (11.15) 16 (10.85) 6 22
3 ( 1.07) 11 (6.93 ) 3 14
Totals 15 13 148
X2=
.. 26.4503 D.F. = 3 p. < 0.001 "
The null hypothesis was rejeoted. As in Table XXIII the relationship
between what might be considered a predictive attribute (A.C.E. total score)
and the attribute, number of grades below a "Cit, is indicated. The departure
of the observed from the expected frequencies again forms a familiar pattern.
students who are at, or below, the median tend to place in those cells which
may be, thought of as low achievement cells. Students above the median tend to
place in the high achievement cell (no grades below a "C").
Contingency was again used to test the null hypothesis of indc'tc::dence of
the dichotomized attribute, A.C.E. total score, and the fin~l grades in
engineering drawing.
~:':'~, ..... ~::,~ t~:'~ .. :'::;,..... ".~-. -~" "'.~ ,'~-~ .. ,"~""'i •• , '·"--7"":'<1~''1''''''_''''''''''''''''_'-''1''_~'''_'".''''_'''''''_'''''''_>'·'''''''~'''' hz' .: .... _,., ..
I
I
I.III!
I·' I

I' j , ..
,,'
i , ~
1 .. #' b' "tt tn. , , '+1' 'Nt «t ••• tr tC-d t t r t Ok . ," 'W"
61
TABLE XXVIII
DISTRIBUTION OF FINAL GRADES IN ENGINEERING DRAWING BY A.C .E. TOTAL SCORE
• ,
Engr. draw. A.C.E. total score (rod. = 99) Totals , final grade
at or below md. Above md.
A (6.08) 3 (5.92) 9 12
B (13.69) 10 (13.31) 11 21
C (35.49) 30 (34.51) 40 70
D (14.20) 21 (13.80) 7 28
F (5.54) 11 (5.46 ) 0 11
Totals 75 73 148
2 0'
X = 2403501 D.F. = 4 p <0.001
The null hypothesis was rejected. The results indicate that the
attributes may be related, and the pattern of observed frequencies is analogous
to positive correlation between the final grades and the A.C.E. total score.
To further investigate the relationship between the A.C.E. total score
and the variables, grade-point average and engineering drawing grades, Pearson
product-moment coefficients of correlation were obtained, using a Lindquist
chart.
The null hypothesis wass
The coefficient of correlation for the sample is from an UD80rrelated nor~al ,
~opulation, which has rho equal to zero. Table XXIX shows the results.
r L

62
The null hypothesis was rejected in both instances. The correlation
coefficients of the value', obtained are common i'or the A.C.E. totaJ. score and •
achievement in freshman year subjects. It was reasonable to expect the A.C.E.
total score to have a positive correlation with subjects which themselves
involve both quantitative and verbal reasoning.
The fifth question under investigation was:
What is the relationship between the quantitative and linguistic sub-scores of
the A.C .E. Psychological Examination, and achievement in engineering drawing,
mathematics and English?
The null hypothesis of zero correlation in an uncorrelated normal .
population was tested by obtaining the Pearson correlation coeffici.ents for i
T',e I both the A.C.E.-Q and L scores, with final grades in engineering drayring.
results are shown in Table XXIX.
TABIE XXIX
PREDICTIVE VALIDITY OF A.C .E. PSYCHOLCGICAL EXAM FOR FINAL GRADES IN ENGINEERING DRAWING; AND GRADE-POINT AVERAGE
Predictor Criteria N r
A.C.E. total score Grade-po1nt ave. 148 0.451
A.C .E. total score Engr. Draw. 148 0.404
A.C.E. nQ" score Engr. Draw. 14t1 0.)62
A.C.E. " V' score Ener. Draw. 148 0.345
Sign1..
0.01
0.01
0.01
0.01
g

L----~ ..... -.,.:=:::=:.t:t:. :*:*:7"':' _'~ ~ .... ":t :::' :2:, :n_ .... '-:. _'l1li.: .. -:: .. :=_, .. ':'_, .... _6""_'.*:' ._ .... :N:":lr_d .... ':_:*:7 ._ ...... :=:' :' :":'. ::. :=::.':':' ::::::::~_c _______ . -~1 [, 63 1
.,
The null hypothesis was rejected. Of interest is the fact that the f
correlation coefficient for the "L" score is close to that for the "Q" score • •
This seems to substantiate the results shown in Table XIV where lack of ,
readiness in English (i.e., registration in remedial English), was found to be
associated with low achievement in engineering drawing.
The "Q" and "1" subscores of the A.C.E. psychological Exam may be
expressed as a "QIt minus If Lit pattern so as to create an approximate scale of .
four attributes, possibly related to achievement. In Chapter III (pp. 39-40)
the procodure for treatment of these subscores was described. The resulting
distribution is shown in Table XXX.
The null hypothesis was:
Y.l1ere is no relationship between a tlQtI minus "Lit attribute and final grades
engineering drawing.
TABIE xxx:
DIS'lRIBUTION OF A.C .E. SCORES EXPRESSED AS A IIQ MINUS Lit PATTERN, BY FDML GRADES IN ENGINEERING DRAWING
Engr. draw. "Q minus . Lit Totals final grades
+1 -L -Q +Q
A&B (10.56) 17 (6.59) 4 (6.06) 2 (15.79) 1<" 39
C (18.93 ) 17 (11.83) 10 (10.88) 12 (28.36) 31 70
D&F (10.51) 6 (6.58 ) 11 (6.06) 9 (15.85) 13 1Q -'"
Totals 40 25 23 148
2 15.3768 D.F.=6 0.01<p<O.05 X =
ir. I 1

64
The null hypothesis was rejeoted. An inspection of the frequencies see;:-iS "
to indicate that the "minu~" Q and "minus V" attributes are related to low
achievement. The opposite seems true of the "plus Q" and "plus L" attributes;
that is, they tend to be related to high aohievement. Of possible sienificMce ... -
is the oontrast between the "plus Q" and "plus LIt for the top row. The
"plus L" students tally signifioantly higher than expeoted, whereas the "plus
QII students tally as expected. This tends to emphasize the importance of,
what might be termed, verbal readiness.
The null hypothesis was:
There is no relationship between a "Q minus L" attribute and the grade-point
average of engineering dra~ng, mathematics and English.
This null hypothesis of independence was tested in Table XXXI.
T ABLE XXXI .'
DISTRIBUTION OF A.C .E. SCORES EXPRESSED AS A 1IQ MINUS L" PATTERN; BY THE GRADE-POINT
AVERAGE OF DRA:liJING, MATHEMATICS A1TD ENGLISH
-Grade-point "Q minus L" Tot~.ls ave. (draw., math. & Eng.)
+L -L -Q. +Q
A &·B (11.36) 18 (7.10) 5 (6.53 ) 1 (17.01) 18 42
C (18.39 ) 19 (11.49) 10 (10.57) 10 (21.55) 29 68
D&F (10.35) 3 (6.41) 10 (5.90) 12 (15.34) 1.3 38
Totals 40 25 23 60 Ib3
2 D.F. = 6 < 0.001 X =2.3.4368 p I
I

:1"1
. i t'.," Z b t ttrt I 't '.ot, t n° 1m SSC' tHe' nth" r •• : 1 t * t . e' ... ," tn. 1 ••• eM' ' .. ~~~" ~~._ .• ,'~. 'i~,
'r
65
The null hypothesis was rejected. The £requencies seem to follow the
general arrangement o£ Tab;te XXX. Again, the "plus Ltt colunm £or the high •
and low achievement rows showed significant departures £rom expected
frequencies. This trend was true also £or the "'minus L" and "minus Qlt
columns, excepting the middle cells.
It is recognized that there are inherent l~mitations in the design o£
this treatment (Tables XXX, XXXI). Some information is lost, for example,
when a student is designated as plus "Q"- because his ItQIl score was above the
sample mean; the corresponding "vt score could have been above or balm'f the
sample mean. The results must therefore, be accepted as tentative, and
subject to further investigation.
The results of the statistical treatments in this chapter .vil1 be
summarized in Chapter V.

.,. "'\,
CHAPTER V •
SUMMARY AND IMPLICATIONS
This study has dealt l'd. th a problem of fundamental importance to the
public junior college. The problem concerns the increasing demands for
education in the engineering and technical fields and the lack of readiness
of many students to successfully cope with the academic loads in those fields.
One of the determining factors in the design of this investigation was the
desire to provide readily evaluated information for a counseling service which
nas already heavily burde~ed during registration periods.
The population of this study consisted~of all full-time, freshmen day "
stUdents who elected one of the technical or engineering curricula at the
Wright branch of Chicago City Junior College, for five consecutive semesters
from September 1954 through September 1956, excluding summer semesters.
The sample, in turn, consisted of all students in the population who were
enrolled in the author's engineering drawing classes. The conditions of
registration Were such that it was reasonable to assume that all members of
the population had an approximately equal chance to be included in the san:ple.
The investigation was concerned primarily with the identification and
evaluation of certain attributes which were possibly related"to achiever:l~mt.
Among the statistical techniques employed were: (a) analysis of variance,
(b) contingency, (c) Pearson product-moment correlation. The attributes:
66
~._ ..... \_. __ ......... ...--.._ ...... ' .. __ ''' .... ' w .......... ' .... ' ... bite ... · _rn .. ·· .... ""'· .... qt ... " 'w' ... ' ..... , ... O .... 't' ........ · ...... · r ... ' ...... iIIot .... • .... r.wpt ... " ... " ... < .. , trib ... M .... ·_t dtr .. ' .... • ....... ___ ... .,.,...._· .... • ~_t ........ , ...... ~-...... .......... 67
"registration in remedial mathematics courses t!; and, "registration in remedial
English courses" were investigated for their relationship to achievement in •
the engineering drawing~ mathematics and English courses, where final grades i
j ,
were the criterion variables. Fo~ example, a contingenc,r analysis showed that
a statistically significant relationship existed between the attribute, Itregis-II
tration in remedial courses and final grades in engineering drawing.
Significant results were also obtained where the same attribute was found to be
related to the grade-point average of engineering drawing, mathematics and
English.
The investigation of the relationship of the attribute registration in
I I
remedial courses to achievement in engineering drawing was continued, using a
two by two analysis of variance, following a method suggested by Wert, which
compensated for disproportionate frequencies •. , It was possible to test for the ',.
separate effects of the two attributes: "registration in remedial mathematicsl!~!
and "registration in remedial English", upon achievement in engineering
drawing, Simultaneously.
The results of this analysis of variance were again statistically
significant for both mathematics and English attributes. Because this
particular analysis of variance concerned achievement in the engineering
drawing course it was considered of particular interest that the effect of
English was greater than that of mathematics, although both were significant
the one percent level.
Analysis of variance with one basis of classification was used tc
investigate the relationship of the attribute registration in ~dthem~tics
courses to final grades in engineering drawing. The previous a!1ulysis 1T1 t.'1

68
tl'fO bases of classification had shown interaction to be negligible, perl1"itting . •
classification of the sample among the four mathematics :ourses. (Registration I in a particular mathematics course was related to readiness for mathematics
by the mathematics placement test: see appendix). ,
The results were again
significant. The finer grouping gave more information concerning the four
mathematics courses, which were thought of as four levels of mathematics
readiness. When a similar treatment was made of the. engineering drawing grades
with classification of the sample among the three English classes, the results
were again significant. This part of the study indicated that there was a
significant statistical relationship between the attributes "registration in
mathematics courses lt , "registration in English courses", and achievement in
engineering drawing; such that registration in remedial courses was associated ..
with low achievement in engineering dravdng.
Of subsidiary interest was the relationship of the attribute
"registration in remedial courses" to achievement in mathematics and English.
The contingency analysis for mathematics gave very significant results.
However, for English the results were not significant; this was the only non-
significant result of the entiro investigation.
The grade-point average of engineering drawing, mathematics and English
also was subjected to the same treatment given to the engineering drawing
grades. The results of both the contingency tables and the two by two
analysis of variance were statistically significant. The evidence again
revealed that the attribute "registration in remedial mathematics and rer.:ecial
Englishll was related to low achievement.
In addition to the attribute data, Ilregistration in mathe:!:?tics and

~~.~ __ -'~' _*_Hh~·_.~"~ ___ t ___ .~S.H __ f ______ ~'tg_·_2 •• t_.~t~S ••• !.'".'.e.sW'~!.' ••• f.tf.~XW •• ,., ••• t.' __ ld."'_'_'_* __ .k_W~~e_¥ ___ ! ___ 'b. __ ~
69
English courses tt , counselors at Wright received results of the A.C.E.
Psychological Exam, expressed as percentiles on the national junior college •
norms. Using the total raw score, and the sample value of the median to . ,
establish a dichotomous attribute, a separate contingency analysis was made of
final grades in engineering drawing; the grade-point average of engineering
drawing, mathematics and English; and the attribute "number of grades below
cit. In each instance, the results were significant. All of these
contingency tables indicated that placement at or below the median was
associated with low achievement.
The relationship of the A.C.E. total score to both the engineering
drawing grades and the grade-point average was investigated by obtainine
Pearson correlation coefficients. These results were significant for the null
hypothesis of zero correlation in the population. However, no inform~tion
concerning a population parameter was available. Pearson correlation
coefficients were also obtained for both the ftQII and "L" subscores with final
grades in engineering drawing. Again, these values were significant, with
that for the "L" score almost as high as the ItQ" coefficient.
The "Q" and "L" subscores of the A.C .E. Psychological Exam were treated
so as to give attributes designated as "plus-VI'; Itminus~Ln; Itminus-Q". For
exmnpie, "plus-V' deSignated the "L-score" as higher than the "Q-score" and
above the sample mean. The possibility that these attributes were related to
achievement was investigated by contingency tables. The results were
significant for both the engineering drawing grades and the grade-point
average. These results, however, were accepted with qualifications, fL:rt;·.~:'
research being desirable. I ~ _________________________________________________________________________ --J

b·
WlW' *' '~$ g kbt? t+tf'fti?#,tt,,'i
10
Summing up the results of the statistical treatments: (a) the attribute
"registration in remedial English courses" was consistently associated with 10 . •
ac~~evement in both engineering drawing and the grade-point average of ,
drawing, mathematics and English, (b) the attribute "registration in remedial
mathematics" was also consistently associated 'With low achievement with the
same courses, (c) of these two attributes, the· effect of English is more
pronounced.
To the extent that the sample represents the population of this
investigation, it may be inferred that the chances for academic success of
about twenty percent of the students was slight. These were students \
') ; characterized by being in both remedial mathematics and remedial English • . '
l
Pnother thirty-one percent were in either remedial mathematics or remedial
English, and as a group had an average of l~SS than a ,'C n, in engineeting eraw-i
ing, mathematics and English. Table XXII, on page fifty-four, illustrates the I situation. Fifty-one percent of the students who elected any of the technical j
or engineering curricula at Wright were seriously handicapped, and were
reasonably accurately identified by the mathematics and English placement
tests. In contrast, fort,y-nine percent of the population .rere registered in
the credit courses of mathematics and English. The grade-point average of the
group was above a "c ".
The results of the A.C.E. PS,Ychological Exam were also shown to have
value in identifying the readiness of s.tudents to be successful in college
work. However, it is the mathematics and English placement test results
which are rectdily evaluated. The relationship of these attributes to
achievement in engineering drawing indicated a predictive value. Therefore,

71
these attributes could be used as predictive data in counseling and progr~ing
students in the techni~a~ and engineering curricula. For example, students •
who, as a result of the placement exams, are required to be registered in ,
remedial mathematics course ninety-fi va or ninety-six, and remedial English
course ninety-eight or one hundred could be required to show some evidence of
removing their deficiencies before taking engi,neering drawing. That is, this
remedial student would be limited to les3 than the full academic load during
his first semester. In addition to the two remedial courses, the first
semester could include a reading improvement course and the required courses in
counseling and physical education. This recommendation is based on the
premise that the student ~acks the maturit,r and knowledge to make intelligent
decisions concerning his educational needs. It may be argued that such e.
remedial student may not survive the two years of junior college even with a "
program tailored closer to his needs. However, it is less than fair to accs?t
a student with academic deficiencies, then permit this student to burden 1',1,,',,-
self with a program with which he has little chance of success.
It should be emphasized that this study has shown that the low achieve-
ment of remedial students involved remedial courses taken concurrently with
courses such as engineering drawing. Further stUdies could investigate the
possibility that the remedial student, who has exhibited significant improve-
ment, could succeed in a later semester with a full program of credit courses.
Investigations in the field of education frequently have been affected by
factors which were difficult to measure and evaluate. It was recognized that
such factors were involved in this investigation. For example, achieV8nent
I!1::1Y have boen influenced by a student's employment. It is not tmcommon for

~_-.-."''''''''---* ___ '''*or.II*t •• IIooi' .. e ... t%_h ... t.alllil'IIIII' ill' III' 'iii.) ...... ' 'ililtlilil' .. , ,_' II1II.,.,. ... '. " •. 'liIf!IJiii!.-Zlt"'":",OIlll! .. !!!I!' __ IIlI'. IoliO·"""?M ......... t ' ......... ' .......... !' ............. '_ .. _ ........ .....
72
freshman students to attempt the difficult task of carrying an academic load of
sixteen to nineteen cre~ t hours, and being employed, for renumeration, for •
twenty to forty hours per week. Another factor difficult to assess was that of ,
motivation. There seemed to be a lack of perseverance on the part of many
students, considering the high aspirations expressed to counselors. It was
evident that these students had not associateq. hard work wi. th academic
achievement. Associated with these factors was the standard of values the
student brought with him when he entered the junior college. These values
were probably a reflection of the values of his family and peers. Where in
this student's pattern of values did he place education? iras education an
important factor in parental economic status? Has the junior college had an I appreciable effect upon the values of the student? Perhaps increased knowledge I
solution of t~9 educational proble::-5 I of these value standards would aid in the
related to this study.
The educational policies of a public junior college in practice are
affected by the abilities, as well as the needs, of the students. Should a
public junior college adopt the restrictive entrance policies of many private
and some public schools? This possibility is ruled out by the fact that the
public junior college is part of the "common school system," and all high
school graduates must be admitted. Two possibilities remain: (a) All
entran ts can be given an opportunity to take a full college program in their
first semester, and succeed or fail on ability, or (b) Entrants can be
classified as to readiness for college work, utilizing presently available
information. Students not ready for college work in essential areas, such as
mathematics and English, could be required to rcmedy these ctcfi'~if.'ncies befo.:e <i'

~ _____ " ....... __ , .... ~ ....... , ........ _*n_'·"'t) ........ ~t ..... _)qwn ........ ~~t~'ilooIo~ ... ~· ... ?'I' ..... " .. f' ... 'fY .... 'A""'d""!t .... >b_t' ... k ... '·· ..... It" .......... n_ ..... · ........... ··, _____ t*_ ...... t_~_ .. >., . ..-._ .... ___ ~ ... ~_'""",~_.
73
being permitted to take a full program.
It is hoped that the. results of this research may be of value in a junior •
college counseling program. In any event, the results may be of aid in
understanding the problems of the public junior college.

~~I.»'''''''''''';''i!t.''''·'''''4 __ ... t e-. ..... -·""'· ... _ ... · ... ' ... "_ ..... · ___ ""' ... Wb_· _. t .... · ....... kh'W· ... • ... • .... rt t .... ''''''0l0i' **"_ ............... ' ........ , "_""·w _ ....... t lI_.i_~ Q ...... ' '_ ..... _ •• _._._ ..... ' ).,... ... ,;.,.""'_ ......... _._. ___ , .. ,,': ........... "'.:;..
BIBLIOORAPHY •
1. J~derson, R. L. and Bancroft, T. A. Statistical Theorz ~ Research. New'York, McGraw-Hill, 1952.
2. Barr, A. A.; Davis, R. A.; and Johnson, P. O. Educational Research and Appraisal. New York, Lippincott, 1953.
3. Berdie, R., and others. "Relative Validity of the IQI and 11' Scores of the A.C.E. Psychological Exam," Educational and Psychological Measurement, XI, n. 4 (Winter, 19.51), CSU3 - 812.
2 4. Cochran, William G. "The X Test of Goodness of FIt," Annals of
Mathematical Statistics, XXIII (September 1952), 315-345.--
5. Cornell, Francis C. Essent.i.als of Educational Statistics. New York, i1iley, 1956.
6. Crawford, A. B. and Burnham, P. S. Forecasting College Achievement. Vol. 1. New Haven, Yale Universi~ Press, 1946.
7. DiVesta, F. V. IISubscore Patterns on the A.C.E. Related to Educational and Occupational Differences," Journal of Applied Psychologr, XXXVIII (August 1954), 248-252.
8. Eble, Kenneth E. "The Burden of the Bonehead," The Journal of Higher Education, XXVTII, n. 1 (January 1957), 30 =37. -
9. Ellis, G. E. "Engineering Drawing as a Predictive Factor for Success in Engineering Studies." . Unpublished Master's Thesis. Oregon State College, August, 1953.
10. Engelhart, Max D. Evaluation Practices in the Chicago City Junior Colleges. Boston, William C. BrownCo:-;-1954.
li. Fleming, Helen. "Johnny Still Can tt Make the Grade in College English, II The Chicago Daily ~ (September 23, 1957), 12.
74

f t 1 ef" f ,.,* t.
75
12. French, Thomas E. and Vierck" Charles J. Engineering Dravd.ng. 8th ad. New York, McGraw-Hill, 1951.
13. Henry, Nelson B., ed. "The Public Junior College",. 55th Yearbook of the Nat.ional SocietY' .!2!:. ~ Study of Education. Chicago, - -University of Chicago Press, 1956.
14. Hill, S. D. liThe Relationship Between Grades and a Predictive Test Battery in the School of Pharmacy of the George Washington University, It Journal £! Applied Psychology, XLI, n. 1 (February 1951), 61-62. ,
15. Jacl(son, R. A. "Prediction of the Academic Success of Freshmen, n Journal of Educational Psychology, XLVI, n. 5 (May 1955).
16. Johnson, Palmer O. Statistical Methods In Research. New York, Prentice-Hall, 1949.
17. Lord, F. and Cowles, J. T. TIThe Pre-Engineering Inventory as a Predictor of Success in Engineering College," The Journal of Applied Psycholoe;r, XXXIV, n. 1 (February 1950) , 3U-39. -- -
18. Mlllloy, J. P.; Wysocki, B. and Graham, L. F. "Predicting AttritionSurvival in First Year Engineering," Journal of Educationd~ Psychology, XLVI, n. 4 (1955), 217-221. --
19. lI.a.yo, Samuel. "Recent Techniques for An,alyzing Association in " Contingency Tables," Journal of Experimental Education, XXV, n. 3 (~!arch 1957), 203-232.
20. Mullins, C. J. ItThe Effect of Reading Ability on Two Standardized Classification Tests," Journal £[Educational PSycholof,y, XLVI, n. 3 (1955), 189-192.
21. Owen, J. A. ' nAn Investigation of the Relationship of the Visual Space Factor to Scholastic Success in Co1lege. 1t Unpublished Master's Thesis. Wayne University, June, 1953.
22 •. Patterson, C. H. "Predicting Success in Trade and Vocational School Courses," Educational and Psychological Measurement, XVI, n. 3 (Autumn 1956). -
23. Patterson, R. E. rtThe Use of Adjusting Factors in the Analysis of Data. wi th Disproportionate Sub-class Nu.mb3rs, It Thp, Jo,gp:cl. ~ t:-~~ P~erican Statistics Association, XLI (September-r~40), 33u-346~
24. Snedecor, George W. statistical l.jethods. 5th ed. Ames; low.?. stnto College Press, 1956.

I .. ~
"' b dtn·· t-tt"X 'tH rtht". trttt nritthh,) t •• b"beN't&utM. 9 t 1 rtf 1R tN' t r t • 'pM •• 6 f trt nt
76
. 25. stuit, D. B., et ale Predicting Success in Professional Schools. Washington, A.C.E., 1949.
26. Walker, Helen M. and lev, Joseph. Statistical Inference. New York Henry Holt & Co., 1953.
27.
28.
, Wert, Ja.t!les E. and Neidt, Charles o. and Ahmann, J. Stanley. Statistical
• Methods in Educational and Psychological Research. New York, Appleton--:- Century - CrOfts, 1954.
Willis, B. C. Report ~ the ChicagO sgtYJuniOr College to the Chicago Board of Education. Chicago, 19 •

r-···...; ... ''""''--· -. ----.... ' .... it .... ' ... _._ftet ............. d· .... ··i_Mti_'_U' ... '_ .... ' ........... iii11181t ...... ·O"""'ti'illliltttiliiioYh .... 't''' .... ,....,ytt_f W_, .... ' .." ...... ttillllor t ..... __ 'tN-.*· _,. ___ ··_*tc .... +rl-.. ____ · __ "'M.-_·.u. ............. ,
j "
APPENDIX I
MATHEMATICS PLACEMENT TEST
Time: 40 minutes.
Items: 60, multiple choice. , Scoring: objective, by stencil.
Cutting scores:
Above 36: mathematics Ill, credit.
36 - 29: mathematics 101, credit.
28 - 19: mathematics 96, remedial
•
18 - 1: mathematics 95, pre-remedial.
The sixty items may be classified as fol1qws:
(a) arithmetic: items 1 through 16.
(b) algebra:
(c) geometry:
items 17 through 40.
items 41 through 60.
Sample items (in the approximate order in which they appear in the test):
"91.6 + 0.85 = 1ft
n(a) 100.1 (b) 91.685 (c) 10.01 (d) 9.245 (e) 92.4.5~
"Fi ve divided by fi va equals?"
"ea) 0 (b) 1 (c) 5 (d) 2.5 (e) none of these"
"The arithmetic mean or average of 7, 14, 20, 8 and 16 is:
(a) 11 (b) 12 3/5 (c) 13 (d) 14 (e) 20"
77

~"> •. " .. , .... a h j ... ,t, t b btz -,., hr.", #' eteh' 'i' ,'to ;
It'Add: 6a -2a
• (a) 4a (b) -8a (c) 12a (d) 8a (e) none of these"
»16 x+4 4
? =
(a) 4x (b) l6x (c) 4x + 1 (d) 4x+4 (e) l2x ll .
tiThe right triangle theorem (Pythagorean) states that:
78
2 2 2 2 2 (a) A=bb/2 (b) a +b + c (c) a+b = c (d) c= a +b
(e) none of these"
,"How far does a point of the rim of a wheel of 10 inches travel in
one revolution of the wheel?
(a) 100 rr (b) 5 TT (c) 10 IT (d) 251T (e) none of these"
"The area of an isosceles triangle whose sides are 13, 13 and 10 is "
(a) 65 (b) 32 1/2 (c) 30 (d) 60 (e) none of these ll

" ...:'. ~ ,
)~t{11*i'&"". • ,_ .. Wats's 1"h i7ft t dO 'M <'trt'hx",br -r tJ ,tit' feb' t" "1'= 52 . n " eft 'r
".
APPENDIX II
ENGLISH PLACEMENT TEST
Time: 45 minutes
Items 2 100, multiple choice.
Scoring: objective, machine or stencil.
Cutting Scores:
Above 432 English 101, credit.
43 - 29: English 100, remedial.
Below 29: English 98, pre-remedial.
The 100 items were classified as follows: tt
(a) spelling: items 1 through 12; 3 minutes.
•
(b) punctuation: items 13 through 26; 7 minutes.
(c) grammar: items 27 through 38; 5 minutes
(d) sentence building: items 39 through 49; 7 minutes.
(e) diction and usage: items 50 through 60; 4 minutes.
(f) vocabulary: items 61 through 79; 4 minutes.
(g) reading comprehension: items 80 through 100; 15 minutes.
79 I ! ________ r--"

_, v ~ ~~_ ,., .'- •
•
APPROVAL SHEET
, .. -
The thesis submitted by Harold C. Messinides has been
read and approved by three members of the Department of
Education.
The final copies have been examined by the director of
the thesis and the signature 'Wl.~ich appears below verifies tl1e
fact that any nec~ssary changes have been incorporated, and
that the thesis is n01-1 given final approval i·ri th reference
to content, form, and mechanical accuracy.
The thesis is therefore accepted in partial fulfillment
of therequirel:lents for the degree of Haster of Arts •
•
F Date ~J/~
Signature ol\dVSer'
I I
~--------------------------------_I