a study of the mechanism of flexural toppling failure of...
TRANSCRIPT

Rock Mech. Rock Engng. (1997) 30 (2), 75-93 Rock Mechanics and Rock Engineering �9 Springer-Verlag 1997 Printed in Austria
A Study of the Mechanism of Flexural Toppling Failure of Rock Slopes
By
D. P. Adhikary, A. V. Dyskin, R. J. Jewell, and D. P. Stewart
Department of Civil Engineering, The University of Western Australia, Nedtands, Australia
Summary
The mechanism of flexural toppling failure of jointed rock slopes has been investigated through a series of centrifuge experiments conducted on models manufactured from two types of materials (brittle: a sand-gypsum mixture; and ductile: fibre-cement sheeting). The basal failure plane observed in the centrifuge models, has been found to emanate from the toe of the slope, and orient at an angle of 12 to 20 ~ upward from the normal to the discontinuities. A theoretical model based on a limiting equilibrium approach (Aydan and Kawamoto, 1992) has been adopted to analyse the centxifuge test data. After calibration, the model was found to accurately predict the failure load for all the tests reported in this study. Using this model, a set of charts has been prepared to assist with the analysis of slopes susceptible to flexural toppling.
1. Introduction
Toppling failures of slopes have been observed in a wide range of rock masses and can occur in both natural and excavated slopes (Muller, 1968; de Freitas and Watters, 1973; Bukovansky et al., 1976; Goodman and Bray, 1976; Wyllie, 1980; Evans, 1981; Sijing, 1981; Teme and West, 1983; Ishida et al., 1987 and Aydan and Kawamoto, 1992). Four principal types of toppling failure, namely: block, flexural, block-flexural and secondary toppling, are recognised in the published literature (Goodman and Bray, 1976; Evans, 1981). This study has concentrated solely on flexural toppling.
Flexural toppling is a mode of failure involving the bending of interacting rock columns formed by a single set of steeply dipping discontinuities, such as regular bedding planes, foliation, or joints, as depicted schematically in Fig. la. Such a discontinuity system produces a rock mass composed of a stack of rock columns which can be visualised as an array of interacting cantilever beams fixed at a certain depth, and free to bend into the excavation. In such cases, the rock columns bend forward under their own weight and transfer load to the underlying columns, thus giving rise to tensile and compressive bending stresses. Failure is initiated when the tensile (bending) stress in the toe column exceeds the tensile strength of the rock.

76 D.P. Adhikary et al.
Research into toppling failures has historically concentrated on block toppling, which is a failure mode associated with sliding and toppling of rock columns (blocks, Fig. lb) along a pre-existing basal failure plane formed by a discontinuity dipping into the excavation. Little attention has been directed towards understanding the mechanism of flexural toppling. In practice, virtually all toppling analyses (regardless of the actual mode) are undertaken using a method developed by Goodman and Bray (1976) for block toppling. Such an analysis may not be suitable, particularly, in the case of flexural toppling when the mechanism of failure is distinctly different from that associated with the more commonly assumed block toppling mechanism (i.e. there are no pre-existing flatly dipping discontinuities to form a basal failure plane).
a) Flexural toppling
b) Block toppling
Fig. l. Flexural and block toppling mechanisms
Aydan and Kawamoto (1992) investigated the underlying mechanism of flexural toppling by conducting physical model tests using a base-friction apparatus. They also developed a simple limiting equilibrium method for flexural toppling, and illustrated consistent trends from the analysis and the model tests. However, the failure levels (or effective self-weight) recorded for the models were not given, and no direct comparisons with the limiting equilibrium method were performed.
This paper describes a series of centrifuge tests on small scale manufactured models

Mechanism of Flexural Toppling Failure of Rock Slopes 77
undertaken to fully investigate the mechanism of flexural toppling. On the basis of the experimental results, the theoretical model proposed by Aydan and Kawamoto (1992) was calibrated to yield accurate predictions of slope collapse. As a result of this study, a set of charts for stability analysis of flexural toppling of rock slopes has been derived.
2. Physical Modell ing
Field studies of slope failures often do not provide an accurate insight into the underlying failure mechanism, which may be masked by geological complexities or by the failure debris itself. Hence, small scale physical modelling, where a number of experiments can be conducted at relatively small cost, is an attractive alternative for investigating mechanisms of failure.
Centrifuge modelling is useful for studying prototype behaviour at model scale where the mechanisms involved are mainly governed by body forces. The similitude of stress and strain in model and prototype is achieved by accelerating the scale model, where all linear dimensions are reduced by a factor, n, to a magnitude of ng, where g defines the free-fall acceleration. Centrifuge modelling is a well-established technique for studying a wide range of geotechnical problems, and has been used for a number of slope stability studies (Lyndon and Schofield, 1970; Smith and Hobbs, 1974; Schofield, 1977; Lyndon and Schofield, 1978; Goodings, 1979; Kim and Ko, 1982; Sugawara et al., 1983; Resnic and Znidarcic, 1990; Jewell et al., 1992; and Stewart et al., 1994).
A total of seven centrifuge tests were performed for this study, as detailed in Table 1, using the geotechnical centrifuge at the University of Western Australia (described by Fahey et al., 1990). The tests were conducted on models manufactured in the laboratory using three different techniques:
Table 1. Experimental details of foliated slope models
Test Slope height to Joint Slope Joint dip Tensile Densit~ Joint fiiction no. joint spacing spac ing ang le angle strength (kN/m) angle
ratio (mm) (deg) (deg) (kPa) (deg)
1 30 10 80 70 165-185 17 40 2* 80 4.8 63 65 11000 13 17 3 81 4.8 90 70 11000 13 17 4 33 10 61 80 1070-1140 23.8 22 5 83 4.8 90 80 11000 13 17 6 33 12 61 80 1070-1140 23.8 22 7 30 12 70 69 1070-1140 23.8 22
* The model in test 2 was undercut at the toe by 65 mm
i) Casting a single block comprised of quartz sand mixed with 2% Portland cement, cutting individual plates from the block, and then stacking them together to form a model (test 1);
ii) Cutting thin fibre-cement sheets marketed under the name Hardiflex to the required size and then stacking together to form a model (tests 2, 3 and 5); or
iii) Casting horizontal layers of a mixture of ilmenite sand and 15% gypsum on top
78 D.P. Adhikary et al.
of each other and then cutting the resulting block into the required size and shape to form the model (tests 4, 6 and 7).
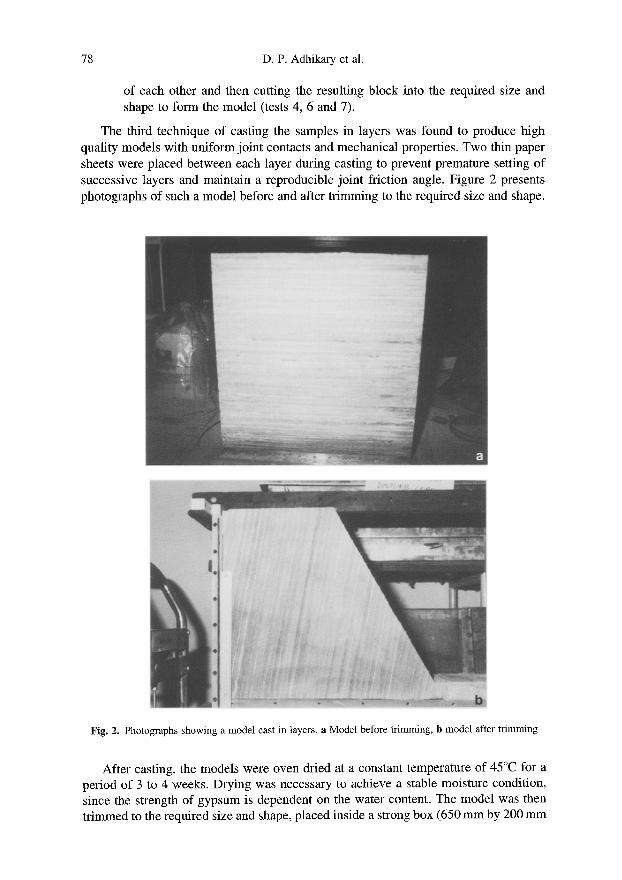
The third technique of casting the samples in layers was found to produce high quality models with uniform joint contacts and mechanical properties. Two thin paper sheets were placed between each layer during casting to prevent premature setting of successive layers and maintain a reproducible joint friction angle. Figure 2 presents photographs of such a model before and after trimming to the required size and shape.
Fig. 2. Photographs showing a model cast in layers, a Model before trimming, b model after trimming
After casting, the models were oven dried at a constant temperature of 45~ for a period of 3 to 4 weeks. Drying was necessary to achieve a stable moisture condition, since the strength of gypsum is dependent on the water content. The model was then trimmed to the required size and shape, placed inside a strong box (650 mm by 200 mm

Mechanism of Flexural Toppling Failure of Rock Slopes 79
in plan and 470 mm in height) and mounted on the centrifuge platform. Failure of the model slope was then achieved by gradually increasing the rotational speed of the centrifuge, thus increasing the acceleration field and the effective self-weight of the model. The displacement of the slope during the centrifuge test was monitored by laser displacement transducers and linear voltage displacement transducers (LVDT) mounted inside the strong box.
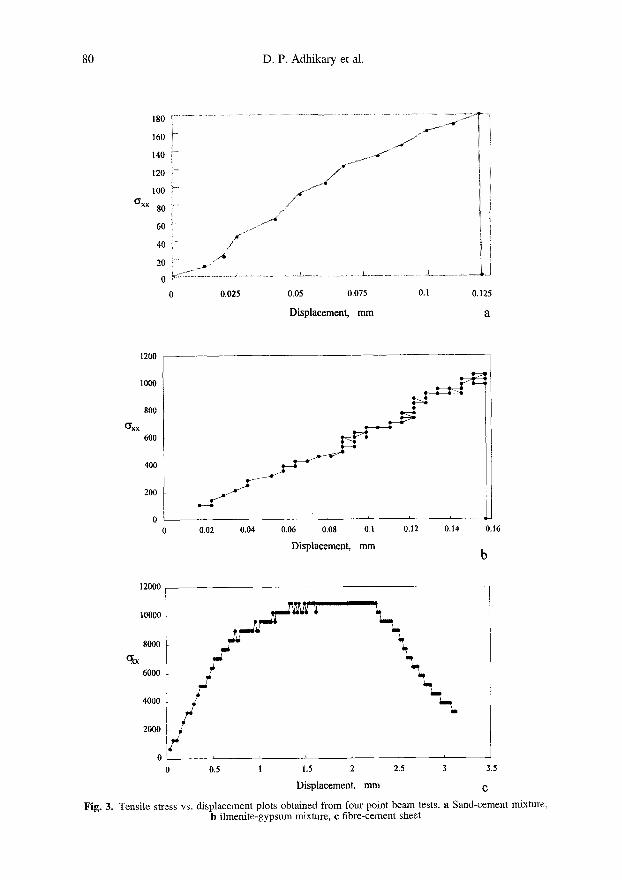
Table 1 provides details of the geometry, mechanical properties, and other experi- mental details for this series of model tests. Tensile strengths were determined by a four-point beam testing technique, and varied between 0.17 MPa and 11 MPa, depend- ing on the type of material. Typical stress-deflection curves obtained from the beam tests are presented in Fig. 3, which illustrates the brittle nature of the sand-cement (gypsum) mixture and the ductile response of the fibre-cement (Hardiflex) sheets. Uniaxial compressive strengths of the material were found to range between 3 and 4 times the tensile strengths. Joint friction angles were determined from direct shear tests on samples taken from the models. Direct shear tests were conducted at various normal loads ranging from 100kPa to 800 kPa. The joint friction values presented in Table 1 corresponds to normal loads (averaged over the slope height) generated in the centrifuge at failure g-levels.
In addition to being used to investigate the failure mechanism, tests 4 and 6 were also designed to validate the use of the centrifuge for this type of study. These two models represented one pseudo-prototype configuration (so-called modelling of models, Schofield, 1980), where the slope height, H and joint spacing, b were different, but the ratio H/b was the same. The collapse g-levels in the two tests were found to have modelled approximately the same prototype slope height (H = 0.010 x 33 x 86 = 28,4 m in model 4, and 0.012 x 33 • 73 = 28.9 m in model 6), and thus it can be concluded that the scale effect is relatively minor in this case.
Slip along joints, bending and fracturing of columns were observed during the testing. Fractures could be observed to start from the toe and then propagate back into the slope when the collapse load was reached. In the tests, the main fracture path was found to be oriented at an angle of 12 to 20 ~ above the normal to the joint dip angle. Figure 4 presents photographs of two models (test 1 and test 4) after testing. Toppling of the columns after fracturing was limited by a guard mounted close to the slope face, that was introduced to protect the laser transducers.
The fibre-cement sheets used in three of the tests were relatively flexible and ductile compared to the sand-cement (gypsum) mixtures, and deformed considerably at g-levels approaching failure. Figure 5 presents a post-failure photograph of a model (test 5) manufactured from fibre-cement sheets. Only a few sheets near the toe of the slope had developed visible fractures at the collapse load, as shown in the figure. At this point the face of the slope was touching the laser transducer guard and further movement and fracturing was prevented. Figure 5 shows three distinct zones of differing modes of deformation that were observed in the tests using fibre-cement sheets, i.e.:
i) a zone of fully developed plastic deformation with visible fractures; ii) a zone of partially developed plastic deformation without visible fractures,
where the sheets partially rebounded towards their original positions once the centrifuge stopped; and
80 D.P. Adhikary et al.
180
160
140
120
100
axx 80
6O
40
20
0
/ , : i ~:':"
i !
i . / / i !
0 0.025 0.05 0.075 O. 1 O. 125
Displacement, mm a
1200
1000
8O0
axx 6OO
4OO
2OO
0 0 0.02 0.04 0.06 0.08 0.1 0.12 0.14 0.16
Displacement, m m
12000 i '"2
IO000
\ , 8000 I
qx 6000
4000
2O00
O ' ~ ' '
0 0.5 I 1,5 2 2.5 3 3.5
Displacement, mm r
F ig . 3. Tensile stress vs. d i sp lacement plots obta ined f rom four point beam tests, a Sand-cement mixture, b i lmen i te -gypsum mixture, c f ibre-cement sheet

Mechanism of Flexural Toppling Failure of Rock Slopes 81
Fig. 4. Post-failure photographs of slope models, a Model cast from ilmenite sand and gypsum mixture, b model cast from quartz sand and Portland cement mixture
iii) a zone of elastic deformation where the sheets completely rebounded to their original position once the centrifuge stopped.
It should be noted that zone ii) is likely to occur only in materials which are relatively ductile and have significant post-peak tensile strength, as exhibited by the fibre-cement sheets (Fig. 3c). This type of behaviour may represent some weak (e.g. extremely weathered) rocks, although the majority of rocks would be expected to be very brittle in tension, similar to the sand-cement mixtures (Figs. 3a and 3b).
Figures 6 to 8 show horizontal components of slope displacement measured during the testing. The patterns of these displacements are plastic: initially increasing at a relatively small rate, before increasing at a greater rate as a specific gravity level is reached which is different for different materials. This can be attributed to the presence of a small cohesion between the layers, produced by slight roughening and bonding of

82 D.P. Adhikary et al.
Fig. 5. Post-failure photograph of a flexible slope model. (i) Zone of fully developed plastic deformation with visible fractures, (ii) zone of partially developed plastic deformation, (iii) zone of elastic deformation
the paper separation sheets during sample preparation. Small cohesions were observed in some of the direct shear tests, however their exact values could not be determined. An estimation of joint cohesion values was obtained through finite element model l ing of the tests described here (Adhikary et al., 1996). In ductile fibre-cement models (Fig. 7) another type of non-linear response was observed, with a sudden jump in the rate of slope movement as the failure load was approached. Such non-linearities can be related to the yielding limits of the material itself. From about 60 g, it is possible that a gradually increasing number of sheets were transformed into the plastic state, before
fracturing at the collapse loads.
-2
Ux m l n
-4
I i
80 - 6 1 i t
0 20 40 60 100 g-level
Fig. 6. Horizontal-displacement plots (test 4 - ilmenite-gypsum mixture)
3. Limiting Equilibrium Method
The flexural toppling of foliated rock slopes occurs essentially due to bending induced tensile stresses initiating fracture of the rock columns at the location of maximum bending moment. Comprehensive calculations of the bending moments are rather

Mechanism of Flexural Toppling Failure of Rock Slopes
-I0
Ux m i n
-20
-30 0 20 40 60 80 t00
g- level
Fig. 7. Horizontal displacement plot (test 5 - fibre-cemenl sheets)
83
-2 Ux t o n i
-4
-6
32 1Tlrll
0 20 40 60 80
g-level
Fig. 8. Horizontal-displacement plo~s (test 6 - ilmeni~e-gypsum mixture)
complex. For this reason, a limiting equilibrium method proposed by Aydan and Kawamoto (1992) has been adopted in this study. This theoretical model is based on the following assumptions:
1. Each column or layer can be treated as a cantilever beam subjected to gravity forces and side forces as shown in Fig. 9. For the sake of simplicity, the total side force is assumed to be acting at a point xhj, where h i is the height of the corresponding side of the layer under consideration, j is the number of the layer and X E (0, 1) is a parameter defining the inter-column force distribution relationship common to all columns.
2. A state of limiting equilibrium exists simultaneously across all the columns along the future fracture at least immediately prior to failure.
3. At the limiting state, the maximum tensile stress acting in each column along the future fracture plane (crxl y=b/2) is equal to the tensile strength of the material, at.
4. The fracture will follow a plane inclined upward at an angle 0 to the normal to the joint dip angle (Fig, 9a). This assumption differs from the original derivation of Aydan and Kawamoto, where 0 ---- 0 was assumed.
On the basis of these assumptions, each layer can be treated as a beam (or column) loaded by the gravity, side forces and resulting bending moments. A column subjected to such loads and bending moments in plane deformation yields the following
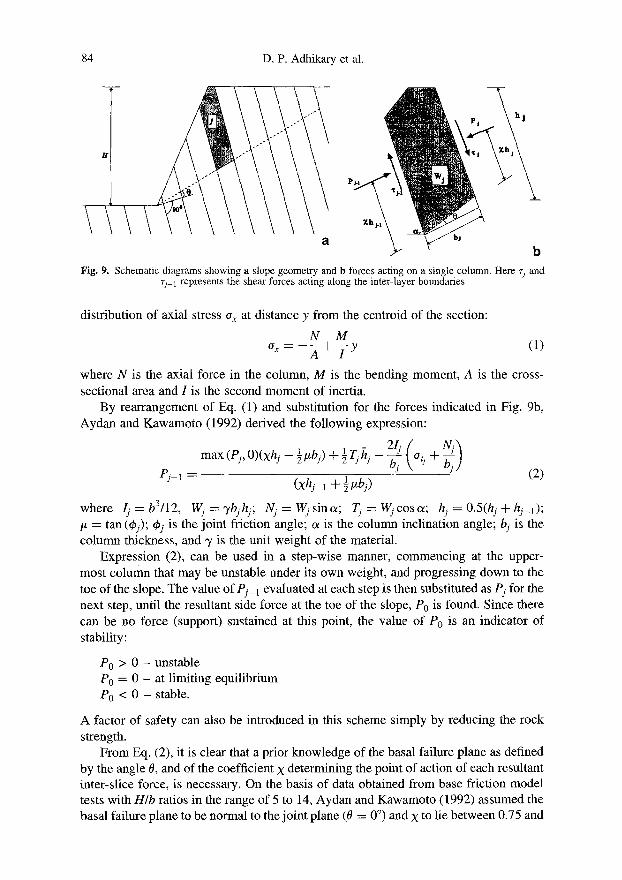
84 D, P. Adhikary et al.
P
h I
b Fig. 9. Schematic diagrams showing a slope geometry and b forces acting on a single column. Here r /and
rj-1 represents the shear forces acting along the inter-layer boundaries
distribution of axial stress a x at distance y from the centroid of the section:
N M ax- A t-~y (1)
where N is the axial force in the column, M is the bending moment, A is the cross- sectional area and I is the second moment of inertia.
By rearrangement of Eq. (1) and substitution for the forces indicated in Fig. 9b, Aydan and Kawamoto (1992) derived the following expression:
max(Pj, O)(xhj_l 1 - 2 1 j ( Nj)
ej-1 = (Xh2 1 + �89 l~bj) (2)
where Ij = b3/12, Wj = 3,bjhi; Nj = Wjsinc~; Tj = Wjcosa; hi = 0.5(hi +hj_ , ) ; /* = tan (4~j); q~j is the joint friction angle; c~ is the column inclination angle; b / i s the column thickness, and 3' is the unit weight of the material.
Expression (2), can be used in a step-wise manner, commencing at the upper- most column that may be unstable under its own weight, and progressing down to the toe of the slope. The value ofPj_ 1 evaluated at each step is then substituted as Pj for the next step, until the resultant side force at the toe of the slope, P0 is found. Since there can be no force (support) sustained at this point, the value of P0 is an indicator of stability:
P0 > 0 - unstable P0 = 0 - at limiting equilibrium P0 < 0 - stable.
A factor of safety can also be introduced in this scheme simply by reducing the rock strength.
From Eq. (2), it is clear that a prior knowledge of the basal failure plane as defined by the angle 0, and of the coefficient X determining the point of action of each resultant inter-slice force, is necessary. On the basis of data obtained from base friction model tests with HIb ratios in the range of 5 to 14, Aydan and Kawamoto (1992) assumed the basal failure plane to be normal to the joint plane (0 = 0 ~ and X to lie between 0.75 and

Mechanism of Flexural Toppling Failure of Rock Slopes 85
1.0. When applied to the centrifuge models described here (having H/b ratios of 30 to 81) those parameters resulted in grossly conservative failure loads.
In an attempt to calibrate the limit equilibrium model, calculations were performed for each centrifuge model to determine combinations of the parameters 0 and X which would yield collapse load level recorded in the experiments. The positions of the basal failure plane (0) and the position of the resultant side forces (X) were varied together to match the centrifuge test collapse loads. For each value of 0 assumed, the correspond- ing value of X to match the centrifuge collapse data is found. The results of these calculations are shown in Fig. 10 as a plot of 0 versus X. Each curve shown in the figure corresponds to a single centrifuge test, with any combination of the parameters along the curve matching the centrifuge data. The curves can be seen to intersect within a small area, at 0 = 10 to 12 ~ and X = 0.5 and 0.6 and this combination of parameters would be expected to lead to a relatively accurate limiting equilibrium analysis of flexural instability of the slopes. The value of X ~ 0.5 implies that the inter-column forces are distributed rather evenly tba'oughout the contact surfaces which seems to be a reasonable condition for well maintained inter-column contacts. SimiIarly, the value of 0 = 10 to 12 ~ compares well with the actual failure planes measured in the centrifuge models at 12 to 20 ~ above the normal to the joints. Table 2 shows comparisons between the experimental and the estimated (using the modified model parameters 0 = 11 ~ and X = 0.55) values of the failure g-levels.
2O
0 / --
~ ---- 7 - - x - - r N ~= 10 l\
/-// // ,r, ///
o. 4
I i r~ Ill
O
0.2 0.3 0.4 0.5 0.6 0.7 0.8 0.9 1
F i g . 10. Plots s h o w i n g the r e i a t ionsh ips b e t w e e n 0 and ?(
4. Construction of Design Charts
In order to facilitate a preliminary analysis of slope stability, design charts were produced by conducting a number of calculations with different sets of slope parameters. On the basis of the preceding discussion, the values of the angle 0 and the coefficient ~ were taken to be equal to 10 ~ and 0.6 respectively. Here, these values
86 D. P. Adhikary et al.
Table 2. Comparison of experimental and theoretical failure g-levels
Test no. Test 1 Test 2 Test 3 Test 4 Test 5 Test 6 Test 7
Predicted failure g-level 14 162 83 81 95 67 57 Experimental failure g-level 15 156 84 84 95 72 60
were adopted so that the model predictions would err on the safe side. The joint spacing is assumed to be constant. During each calculation, the problem was solved iteratively by increasing the unit weight by a factor, n, until the limiting equilibrium of the slope was achieved. Each calculation enabled a single point to be plotted on a chart.
The most appropriate parameters for the abscissa and the ordinate for the charts were found to be the joint dip and the non-dimensional parameter HoT respectively, where:
,ynH 2 Her -- (3)
(at/F.S.)b
and H is the slope height, b is the average joint spacing and F.S. is the factor of safety. The higher the slope height (or lower the tensile strength of the rock), the higher will be the parameter Hcr and vice versa. For a particular slope, an increase or decrease in the parameter Hc~ will result in either flatter or steeper critical slope angles respectively.
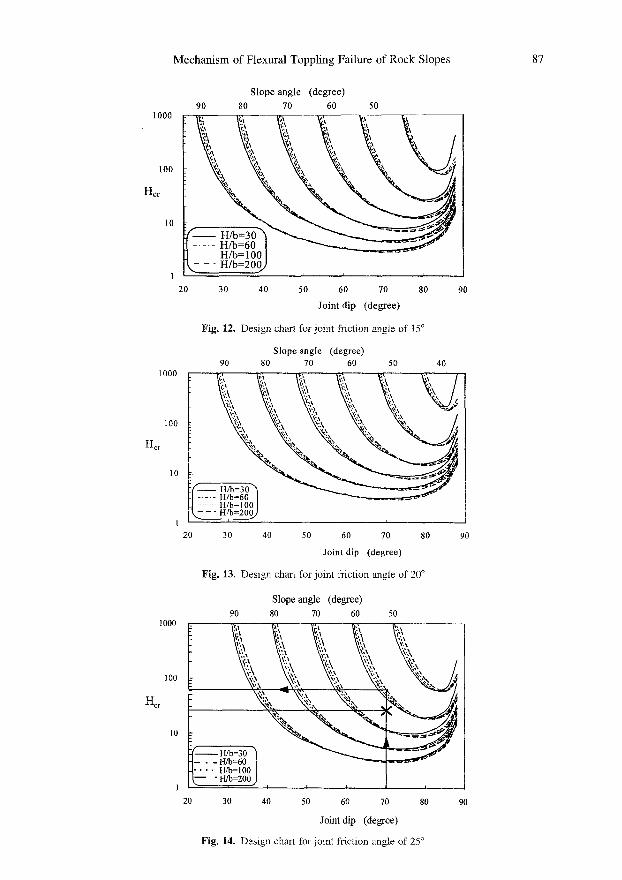
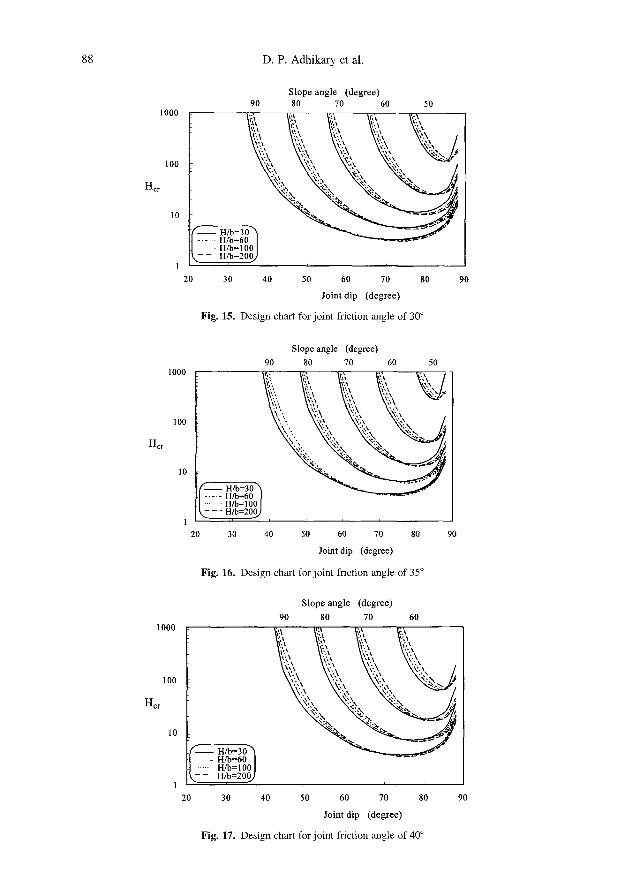
The design charts were produced for different values of slope angle, and slope height to joint spacing ratio. Separate charts were produced for different joint friction angles ranging from 10 ~ to 40 ~ and are presented as Figs. 11 to 17. In each figure, several sets of curves have been plotted tbr slope angles varying from 40 ~ to 90 ~ From these figures, it can be seen that the H/b ratio has relatively little influence on the analysis. The curve for H/b = 200 has been included as an upper bound, since further increase in H/b has minimal effect on the results. It should be noted that as the critical value of Hc~ increases, it may be necessary to consider other slope failure mechanisms as well.
From inspection of the figures, it is apparent that the most critical joint dip for
1000
100
Her
10
Slope angle (degree) 90 80 70 60 50 40
k \ \
~- -- wb=200j . . . .
20 30 40 50 60 70 80
Joint dip (degree)
Fig. l l . Design chart for joint friction angle of 10 ~
90
Mechanism of Flexural Toppling Failure of Rock Slopes 87
Slope angle (degree) 90 80 70 60 50
,000 ~ ~ ,
lOO
Her - 1
0I
20 30 40 50 60 70 80 90
Joint dip (degree)
Fig. 12. Design chartforjointfriction angle of 15 ~
Slope angle (degree) 90 80 70 60 50 40
,000 ' ' ~'4 "~ ' ;~ ~;
}:i:, ~:'., \~::: ~:~., '~:x % / '~i~, ~!, 'i..:.,., %, ~'~,, '~J.
,oo ~ , , % ~,, ~, ~, I
',~ "~ .
H/b=30 "~ H/b=6o / H/b=] 001 H/b=:00~
20 30 40 50 60 70 80
Joint dip (degree)
Fig. 13. Design chart for joint friction angle of 20 ~
Slope angle (degree) 90 80 70 60 50
,o
1
20
90
30 40 50 60 70 80 90
Joint dip (degree)
Fig. 14. Design chart for joint friction angle of 25 ~
88 D.P. Adhikary et al.
1000
100
H~
10
Her
1000
100
Hcr
10
1000
100
10
Slope angle (degree) 90 80 70 60 50 ,.,, :~:.',
H/b=30 ~ ~ . . . . . w =60
........ H/b=lO0 I n/?=2oo . . . .
20 30 40 50 60 70 80 90
Joint dip (degree)
Fig. 15. Design chart for joint friction angle of 300
Slope angle (degree) 90 80 70 60 50
H / b = 3 0 ~ It/b=60| H/b=100 J
~. H/b=200~
20 30 40 50 60 70 80 90
Joint dip (degree)
Fig. 16. Design chart for joint friction angle of 35 ~
f_......_ H/b=30"~ H/b=60 I H/b=100 I
,.~ H/b=200J
20 30
Slope angle (degree) 90 80 70 60
, L
40 50 60 70 80
Joint dip (degree)
Fig. 17. Design chart forjointfricfion angle of 40 ~
90

Mechanism of Flexural Toppling Failure of Rock Slopes 89
flexural toppling is between about 70 ~ and 85 ~ depending upon the slope geometry and joint friction angle. This compares well with field data on flexural toppling failures presented by Orr et al. (1991), showing the frequency of failure for various joint dip ranges.
On Fig. 14, an example of the procedure of using the design charts for a joint friction angle of 25 ~ is presented. For a 10 m high slope excavated in a jointed rock with joint dip of 70 ~ average joint spacing of 5 cm, tensile strength of 2 MPa, unit weight of 20kN/m 3, and the required factor of safety of 1.2 the critical slope angle may be obtained as outlined below:
First the value of the parameter Her is computed,
y n H 2 20 • 1 x 10² HcI - - ( o f l F . S . ) b - - (2000/1.2) x 0.05 = 24.0 (4)
Using the values of Hot and the joint dip, a point (X in Fig. 14) is plotted on the chart and the critical slope angle of 64 ~ is determined by interpolation between the curves for a H / b ratio of 200.
In a similar manner, the charts can also be used for determining the factor of safety of an existing slope. For example, consider a slope excavated at an angle of 60 ~ in a rock mass with the same properties as those assumed in the above example. Using the joint dip of 70 ~ slope angle of 60 ~ and H / b ratio of 200, the value of Her = 62 is determined from the chart. Then from Eq. (3) the factor of safety is calculated as:
o-t Hcl. b F . S . - - - - 3.1 (5)
TH 2 --
In using the charts, interpolation may be required, which may lead to inaccuracies. Nevertheless, the charts can be useful for preliminary design or analysis. Recognising the inherent variability of some of the input parameters, the accuracy of the charts is likely to be acceptable in many cases.
5. Conditions for Flexural Slip and Flexural Toppling
It would be expected that flexural slip between the layers occurs once the shear stress along the joint (discontinuity) exceeds the shear strength. Based on this principle, Goodman and Bray (1976) proposed a simple kinematic condition necessary for the flexural slip which precedes toppling. Assuming that the major principal stress to be oriented in the direction parallel to the slope face, it had been shown that the necessary condition for flexural slip is:
oe I> 90 ~ + ~j - / 3 (6)
where, c~ is the slope angle, q~j is the joint friction angle and/3 is the foliation angle. Figure 18 presents a plot showing the limiting condition proposed by Goodman and Bray (1976). The set of four base lines (i.e. sU'aight lines for friction angles 10 ~ 20 ~ 30 ~ and 40 ~ divide the problem into two distinctive regions: 1) a region where the flexural slip is restricted, and 2) a region where it is permitted. For any particular friction angle, flexural slip (hence toppling) is possible if one moves upward from the base line. Regions located beneath the base line may be considered to be safe against toppling.

90 D.P. Adhikary et al.
90
80
70
60 50
(degrees) 40
30
20
10
0
(degrees)
20 30 40 50 60 70 80 90
4oo
I .*J
///0 5 < . .'---e. //P'~" [ ~j=30 ~ - ~ _ ~ �9
, , ~ o * j= 200 �9 Cj = 1o ~ Solid lines -after Goodman and Bray (1976) -~ Data points - present model ~b i- joint friction angle (degrees)
I I - i I I
10 20 30 40 50 60 70 80 90
O~ (degrees)
Fig. 18. Limiting conditions of flexural toppling
90
80
70
60
5o 40 (degrees)
30
20
10
0
From Figs. 11 to 17, it may be seen that each of the curves becomes asymptotic at their limiting conditions (i.e. when g c r "-+ oo). Using the limiting equilibrium model, a set of data pertaining to infinitely large values of the parameter Hcr w a s
thus computed for sets of slope geometry and joint frictions. These data which represent the limiting conditions necessary for flexural toppling have also been plotted in Fig. 18, from which it appears that the model proposed by Goodman and Bray is rather conservative. The limiting joint foliation angles computed from the limiting equilibrium model are higher than those obtained from the Goodman and Bray model by as much as 6 ~ for joint friction angle of 10 ~ and 1.5 ~ for joint friction angle of 40 ~ .
Goodman and Bray's model only provides an indication of the possibility of fiexural slip. However, it does not address the inherent mechanism of the flexural toppling that follows the flexural slip. On the contrary, the limiting equilibrium model takes into account both conditions necessary for flexural slip and flexural toppling. Thus, from Fig. 18, it can be concluded that the balance of forces, which will prevent flexural toppling, will still be maintained in a foliated slope even though the conditions for flexural slip have been met. One possible explanation is that the limiting equilibrium analysis includes the self weight of the rock, which will always impart a component of compressive stress to the individual column. This compressive stress must then be overcome by tensile bending stress for failure to occur, even if the tensile strength is zero (i.e. when Hcr ---' ~).
However, it is equally important to note that the model parameters 0 and X were obtained from centrifuge models with small values of Hcr ranging from about 3 to 20 and joint friction values qSj ranging from 17 ~ to 40 ~ Hence these parameters may prove to be unrealistic for very high values of Hcr and low values of joint frictions (particularly when Hcr -- ' oo and 4~j = 10 ~ and thus may have lead to the discrepancies observed in Fig. 18.

Mechanism of Flexural Toppling Failure of Rock Slopes 91
6. Discussion
The limiting equilibrium method developed by Aydan and Kawamoto (1992) has been calibrated here to yield consistent predictions of stability that compare well with the results of a series of centrifuge tests on slope models. The combination of failure plane orientation, 0 = 10 ~ and side force distribution coefficient, X -- 0.6 obtained from this calibration is significantly different from those derived by Aydan and Kawamoto (0 = 0 ~ and X = 0.75 to 1.0) on the basis of a series of base friction model tests. The reason for this discrepancy is not immediately clear, but may have been influenced by the more closely jointed materials examined in this study (H/b = 30 to 83) as compared to those examined by Aydan and Kawamoto (H/b = 5 to 14). In addition, Kawamoto et al. (1983) suggested that base friction models generally offer qualitative results only when the mechanism under investigation involves deformation of the body itself.
The centrifuge tests described here were performed on models manufactured from both ductile and brittle materials. It is often accepted that slope failure in brittle materials will follow some sort of progressive mechanism, since stress concentrations at some point (possibly near the toe), will lead to a zone of failed material which rapidly loses strength. This zone will then shed considerable load to other surrounding zones and failure can propagate through the material even though the average stress along the failure path may be significantly less than the peak strength. In this case, limiting equilibrium analyses which assume simultaneous mobilisation of peak strength along the failure path (i.e. basal fracture plane) would provide non-conservative predictions of failure. It is somewhat surprising therefore that the limiting equilibrium analysis described here provides equally good predictions of failure for ductile and brittle materials. This suggests that the distribution of bending stresses is relatively uniform along the failure path, and that the assumption of limiting equilibrium is reasonable.
A detailed study of the flexural toppling mechanism has been undertaken using a finite element analysis incorporating Cosserat theory (Adhikary et al., 1996, and Adhikary, 1995), which provides an accurate representation of the response of layered media using a computationally efficient continuum analysis. That work indicated that stress redistribution due to frictional sliding along the joints does in fact lead to a remarkably uniform distribution of bending stress along the failure path as suggested here.
It is important to note that the theoretical model calibrated here against centrifuge test results should be used with some care for field problems, as there has been no consideration given to strength scale effects (e.g. Frundenthal, 1968). In this study, tensile strength was measured on beam samples having dimensions similar to the columns in the models. In field situations however, tensile strength tests might be performed on core samples significantly smaller in size than the individual layers of material comprising the rock mass and the strength of the rock mass in the field (i.e. the large-scale strength) is invariably lower than the strength measured in the laboratory specimens (i.e. the small scale strength).
7. Conclusions
Flexural toppling failures of slopes have not been investigated extensively in the past. The series of centrifuge tests reported here provide valuable data with which to

92 D.P. Adhikary et al.
understand the basic mechanism, and to assess methods of analysis. Failure of the model slopes was initiated by joint slippage, which lead to bending and ultimately fracture of the rock columns. The main fracture path was found to be oriented at an angle of 12 to 20 ~ above the normal to the joint dip angle.
After some modifications, the limiting equilibrium model proposed by Aydan and Kawamoto (1992) was found to provide relatively accurate predictions of failure loads for each of the slope models tested on the centrifuge. Based on this theoretical model, a series of designs charts have been devised to assist with the analysis of flexural toppling failures.
The good agreement between the limiting equilibrium model and the test results suggests that a state of limiting equilibrium does exist along the future fracture surface, at least immediately prior to failure.
Acknowledgments
Part of this work was supported by the Australian Research Council small grant (1995) and the Western Australia - China Economic and Technical Research Fund. The authors wish to gratefully acknowledge the value of discussions with Prof. Mark Randolph of the University of Western Australia. The technical assistance of Mr Josh White in all aspects of centrifuge testing is sincerely acknowledged.
References
Adhikary, D. P. (1995): The modelling of flexural toppling of foliated rock slopes. Ph.D. thesis, Department of Civil Engineering, University of Western Australia.
Aydan, O., Kawamoto, T. (1992): Stability of slopes and underground openings against flexural toppling and their stabilisation. Rock Mech. Rock Engng. 25 (3), 143-165.
Adhikary, D. P., Dyskin, A. V., Jewell, R. J. (1996): Numerical modelling of the flexural deformation of foliated rock slopes. Int. J. Rock Mech. Min. Sci. and Min. Abstr. 33 (6), 595-606.
Bukovansky, M., Rodriguez, M. A., Cedrun, G. (1976): Three rock slides in stratified and jointed rocks. Proc., 3rd Congress Int. Soc. of Rock Mech. Vol. IIB, Denver, Colorado, 854-858.
De Freitas, M. H., Watters, R. J. (1973): Some field examples of toppling failure. Geotechnique 23 (4), 495-514.
Evans, R. S. (1981): An analysis of secondary toppling rock failures - the stress redistribution method. J. Engng. Geol., The Geological Society, 77-86.
Fahey, M., Finnie, I., Hensley, P. J., Jewell, R. J., Randolph, M. F., Stewart, D. P., Stone, K. J. L., Toh, S. H., Windsor, C. S. (1990): Geotechnical centrifuge modelling at the University of Western Australia, Report No. Geo: 90092, Dept. of Civil Engineering, University of Western Australia, 34.
Frundenthal, A. M. (1968): Statistical approach to brittle fracture. In: Liebowitz, H. (ed.), Fracture - An advanced treatise, Academic Press, New York, pp. 591-619.
Goodings, D. J. (1979): Centrifugal modelling of slope failures, Ph.D. thesis, University of Cambridge, England.
Goodman, R. E., Bray, J. W. (1976): Toppling of rock slopes, ASCE Speciality Conference on Rock Engineering for Foundations and Slopes, Boulder Colorado, Vol. 2, pp. 201-234.

Mechanism of Flexural Toppling Failure of Rock Slopes 93
Ishida, T., Chigira, M., Hibino, S. (1987): Application of the distinct element method for analysis of toppling observed on a fissured slope. Rock Mech. Rock Engng. 20 (4), 277-283.
Jewell, R. J., Stone, K. J. L., Adhikary, D. P. (1992): Modelling of stability of rock slopes. Western Australian Conference on Mining Geomechanics, Kalgoorlie, W.A., pp. 255-261.
Kawamoto, T., Obara, Y., Ichikawa, Y. (1983): A base friction apparatus and mechanical properties of a model material (in Japanese). J. Min. Metall. Inst. of Japan 99, 1-6.
Kim, M. M., Ko, H. (1982): Centrifugal testing of soil slope models. Paper presented at Transportation Research Board Annual Meeting, Washington, D.C., USA.
Lyndon, A., Schofield, A. N. (1970): Centrifuge model test of a short term failure in London clay. Geotechnique 20 (4), 440-442.
Lyndon, A., Schofield, A. N. (1978): Centrifugal model tests of the Loadalen Landslide. Canadian Geotechn. J. 15 (1), t-13.
Muller, L. (1968): New considerations on the Vajont slide, Felsmechanik und Ingenieurgeologie 6 (1), 1-91.
Orr, C. M., Swindell, C. F., Windsor, C. R. (1991): Open pit toppling failures: examples vs. analysis. In: Beer, Booker, and Carter (ed.), Computer methods and advances in geomechanics, Balkema, Rotterdam, 469-474.
Resnick, G. S., Znidarcic, D. (1990): Centrifugal modelling of drains for slope stabilization. J. Geotechn. Engng., ASCE 116 (11), 1607-1624.
Schofield, A. N. (1980): Cambridge geotechnical centrifuge operations. Geotechniqne 30 (3), 227-268.
Sijing, W. (1981): On the mechanism and process of slope deformation in an open pit mine. Rock Mech. 14 (3), 145-156.
Smith, I. M., Hobbs, R. (1974): Finite element analysis of centrifuged and built-up slopes. Geotechnique 24 (4), 531-559.
Stewart, D. P., Adhikary, D. P., Jewell, R. J. (1994): Studies on the stability of model rock slopes. Centrifuge-94, Singapore.
Sugawara, K., Akimoto, M., Kaneko, K., Okamura, H. (1983): Experimental study on rock slope stability by the use of a centrifuge. Int. Congress on Rock Mech. of Int. Soc. of Rock Mech., Melbourne, pp. C 1-4.
Teme, C. S., West, T. R. (1983): Some secondary toppling failure mechanisms in discontinuous rock slopes. 24th US Symposium on Rock Mech., pp. 193-204.
Wyllie, D. C. (1980): Toppling rock slope failures examples of analysis and stabilization. Rock Mech. 13 (2), 89-98.
Authors' address: Dr. Deepak Prasad Adhikary, Geomechanics Group, Department of Civil Engineering, University of Western Australia, Nedlands, WA, Australia 6907.