a study of the impact of roundabouts on traffic flows and ... · pdf filea study of the impact...
TRANSCRIPT

A cooperative transportation research program betweenKansas Department of Transportation,Kansas State University Transportation Center, andThe University of Kansas
Report No. K-TRAN: KSU-09-10 ▪ FINAL REPORT▪ November 2012
A Study of the Impact of Roundabouts on Traffic Flows and Business
Eugene R. Russell, Ph.D., P.E.E. Dean Landman, Ph.D.Ranjit Godavarthy
Kansas State University Transportation Center

i
This page intentionally left blank.

ii
Form DOT F 1700.7 (8-72)
1 Report No.
K-TRAN: KSU-09-10
2 Government Accession No.
3 Recipient Catalog No.
4 Title and Subtitle
A Study of the Impact of Roundabouts on Traffic Flows and Business
5 Report Date
November 2012
6 Performing Organization Code
7 Author(s)
Eugene R. Russell, Ph.D., P.E.; E. Dean Landman, Ph.D.; and Ranjit Godavarthy
8 Performing Organization Report No.
9 Performing Organization Name and Address
Department of Civil Engineering
Kansas State University Transportation Center
2118 Fiedler Hall
Manhattan, Kansas 66506
10 Work Unit No. (TRAIS)
11 Contract or Grant No.
C1817
12 Sponsoring Agency Name and Address
Kansas Department of Transportation
Bureau of Materials and Research
700 SW Harrison Street
Topeka, Kansas 66603-3745
13 Type of Report and Period Covered
Final Report
September 2008–December 2011
14 Sponsoring Agency Code
RE-0495-01
15 Supplementary Notes
For more information write to address in block 9.
16 Abstract
For a number of years there has been a controversy regarding whether installing roundabouts in a business area are good for
business in the area, or whether they have negative impacts on business in the area. This study attempts to answer this question with
emphasis on Kansas cities, particularly Topeka, Kansas; however, it does use examples and data from other cities and studies that are
relevant to this study.
This study reviewed the literature and all sources where national data or reliable case studies addressed the issue of the impact
of roundabouts on business to serve as a basis for Kansas studies. Some data that was initially thought to be available; namely, business
profits, before and after economic data like sales taxes, property values, building permits and so forth, were not generally available and/or
beyond the scope of the project. The study concentrated on the literature, surveys to businesses, and case studies that showed
roundabouts’ ability to move traffic more efficiently. Conclusions were based on the widely accepted assumption that businesses and
business areas that have good vehicle and pedestrian access and traffic flow should prosper and grow and, conversely, businesses that do
not have good access and good traffic flow will not. Case studies that were found in the literature, and from personal contacts, are
reported in the study report. Surveys were conducted and sent to several Kansas cities as well as Carmel, Indiana, which is known to have
a great number of roundabouts in the city. Personal contact was also made with a number of business managers and/or owners in Topeka.
Since no reliable before and after corridor data could be found that would lead to definite conclusions, a task was added to do a
simulation study of a business corridor in Topeka, Kansas. The study used VISSIM software to simulate a hypothetical before and after
study of converting several traditional intersections in the corridor to roundabouts.
The most relevant study found in the literature was a study of South Goldman Road in Golden, Colorado, where four
roundabouts were built in a business corridor with many positive results which led to the conclusions that “yes, roundabouts are good for
business.” Survey results, reported in detail in the full report, were generally positive albeit mixed. For example, the survey results from
businesses in Topeka indicated that 76.9% of businesses answered that the impact of the addition of roundabouts was fair, good or very
good, and only a combined 15.2% indicated they were bad or very bad. Personal contact with business managers and owners in Topeka
found that they were of the opinion that roundabouts in their area were good for business. The simulation study of the Topeka business
area, assuming several intersections were replaced with roundabouts, showed significant reductions in delay and queuing for most all
significant traffic movements. Based on the authors’ assumption that better traffic flow and access are good for business, it was concluded
that the addition of roundabouts in this corridor would have been good for business. The overall conclusion of the study was that
roundabouts have a positive impact on traffic flows and business.
17 Key Words
Roundabouts, Traffic Flow
18 Distribution Statement
No restrictions. This document is available to the public
through the National Technical Information Service
www.ntis.gov.
19 Security Classification (of
this report)
Unclassified
20 Security Classification
(of this page) Unclassified
21 No. of pages
110
22 Price

iii
A Study of the Impact of Roundabouts on Traffic Flows
and Business
Final Report
Prepared by
Eugene R. Russell, Ph.D., P.E.
E. Dean Landman, Ph.D.
Ranjit Godavarthy
Kansas State University Transportation Center
A Report on Research Sponsored by
THE KANSAS DEPARTMENT OF TRANSPORTATION
TOPEKA, KANSAS
and
KANSAS STATE UNIVERSITY TRANSPORTATION CENTER
MANHATTAN, KANSAS
November 2012
© Copyright 2012, Kansas Department of Transportation

iv
PREFACE
The Kansas Department of Transportation’s (KDOT) Kansas Transportation Research and New-
Developments (K-TRAN) Research Program funded this research project. It is an ongoing,
cooperative and comprehensive research program addressing transportation needs of the state of
Kansas utilizing academic and research resources from KDOT, Kansas State University and the
University of Kansas. Transportation professionals in KDOT and the universities jointly develop
the projects included in the research program.
NOTICE
The authors and the state of Kansas do not endorse products or manufacturers. Trade and
manufacturers names appear herein solely because they are considered essential to the object of
this report.
This information is available in alternative accessible formats. To obtain an alternative format,
contact the Office of Transportation Information, Kansas Department of Transportation, 700 SW
Harrison, Topeka, Kansas 66603-3754 or phone (785) 296-3585 (Voice) (TDD).
DISCLAIMER
The contents of this report reflect the views of the authors who are responsible for the facts and
accuracy of the data presented herein. The contents do not necessarily reflect the views or the
policies of the state of Kansas. This report does not constitute a standard, specification or
regulation.

v
Abstract
For a number of years there has been a controversy regarding whether installing
roundabouts in a business area are good for business in the area, or whether they have negative
impacts on business in the area. This study attempts to answer this question with emphasis on
Kansas cities, particularly Topeka, Kansas; however, it does use examples and data from other
cities and studies that are relevant to this study.
This study reviewed the literature and all sources where national data or reliable case
studies addressed the issue of the impact of roundabouts on business to serve as a basis for
Kansas studies. Some data that was initially thought to be available; namely, business profits,
before and after economic data like sales taxes, property values, building permits and so forth,
were not generally available and/or beyond the scope of the project. The study concentrated on
the literature, surveys to businesses, and case studies that showed roundabouts’ ability to move
traffic more efficiently. Conclusions were based on the widely accepted assumption that
businesses and business areas that have good vehicle and pedestrian access and traffic flow
should prosper and grow and, conversely, businesses that do not have good access and good
traffic flow will not. Case studies that were found in the literature, and from personal contacts,
are reported in the study report. Surveys were conducted and sent to several Kansas cities as well
as Carmel, Indiana, which is known to have a great number of roundabouts in the city. Personal
contact was also made with a number of business managers and/or owners in Topeka. Since no
reliable before and after corridor data could be found that would lead to definite conclusions, a
task was added to do a simulation study of a business corridor in Topeka, Kansas. The study used
VISSIM software to simulate a hypothetical before and after study of converting several
traditional intersections in the corridor to roundabouts.
The most relevant study found in the literature was a study of South Goldman Road in
Golden, Colorado, where four roundabouts were built in a business corridor with many positive
results which led to the conclusions that “yes, roundabouts are good for business.” Survey
results, reported in detail in the full report, were generally positive albeit mixed. For example,
the survey results from businesses in Topeka indicated that 76.9% of businesses answered that
vi
the impact of the addition of roundabouts was fair, good or very good, and only a combined
15.2% indicated they were bad or very bad. Personal contact with business managers and owners
in Topeka found that they were of the opinion that roundabouts in their area were good for
business. The simulation study of the Topeka business area, assuming several intersections were
replaced with roundabouts, showed significant reductions in delay and queuing for most all
significant traffic movements. Based on the authors’ assumption that better traffic flow and
access are good for business, it was concluded that the addition of roundabouts in this corridor
would have been good for business. The overall conclusion of the study was that roundabouts
have a positive impact on traffic flows and business.

vii
Acknowledgements
The authors wish to acknowledge the early work of Santosh Kumar Mummaneni, former
Kansas State University graduate student, who did some of the early work on evaluating surveys
sent back from businesses. They also wish to acknowledge Mark Lenters, president of Ourston
Roundabout Engineering, Inc., who provided a number of examples from his projects where
roundabouts have a positive impact on business and a power point from which several figures
were taken. They also wish to acknowledge Mark Johnson, MTJ Engineering, who provided
some examples from his projects and case study reports on impact of roundabouts on business
and other input that assisted the authors in writing the report.

viii
Table of Contents
Abstract ........................................................................................................................................... v
Acknowledgements ....................................................................................................................... vii
Table of Contents ......................................................................................................................... viii
List of Tables .................................................................................................................................. x
List of Figures ................................................................................................................................ xi
Chapter 1: Introduction ................................................................................................................... 1 1.1 The Need for this Study .................................................................................................. 1
1.2 Background ..................................................................................................................... 1
1.3 Research Objectives ........................................................................................................ 2 1.4 Obstacles to the Originally Envisioned Tasks ................................................................ 2
Chapter 2: Literature Review .......................................................................................................... 6
2.1 Benefits of Roundabouts ................................................................................................. 6 2.1.1 Q/A: How Do Roundabouts Affect Safety?................................................................ 6 2.1.2 Q/A: How Do Roundabouts Affect Traffic Flow? ..................................................... 7
2.2 Specific Examples of Impact on Business ...................................................................... 7 2.2.1 The Brighton, Michigan, “Story” .............................................................................. 25
2.3 Roundabout City, USA ................................................................................................. 29 2.4 Olathe Survey................................................................................................................ 33 2.5 Glens Falls, New York .................................................................................................. 36
2.6 Two Other Examples .................................................................................................... 39 2.7 Overall Conclusions from Literature Review ............................................................... 40
Chapter 3: Survey of Businesses................................................................................................... 41 3.1 Introduction ................................................................................................................... 41
3.2 Methodology ................................................................................................................. 42 3.3 Survey Results .............................................................................................................. 45
3.3.1 Topeka, Kansas ......................................................................................................... 45
3.4 Comments by Questions: Topeka, Kansas.................................................................... 47 3.5 Additional Comments ................................................................................................... 48 3.6 Newton, Kansas ............................................................................................................ 48
3.6.1 Comments by Questions: Newton, Kansas ............................................................... 51 3.7 Junction City, Kansas.................................................................................................... 52
3.8 Carmel, Indiana ............................................................................................................. 54 3.9 Conclusions from Survey .............................................................................................. 58
3.10 Follow-up Survey and Analysis on 46th
Street, Topeka ............................................... 62
Chapter 4: Roundabout Business Corridor ................................................................................... 65 4.1 Introduction ................................................................................................................... 65 4.2 QRSII Analysis ............................................................................................................. 67 4.3 SIDRA Analysis............................................................................................................ 71 4.4 Traffic Volume and Turning Movements, Hourly ........................................................ 73 4.5 Average Delay per Vehicle ........................................................................................... 75

ix
4.6 Total Vehicle Operating and Time Cost ....................................................................... 77
4.7 Total Carbon Dioxide (CO2) Emissions, Kilograms per Hour ..................................... 79 4.8 Business Entrance near the Bed Bath & Beyond Store ................................................ 80 4.9 Delay ............................................................................................................................. 82 4.10 VISSIM ......................................................................................................................... 83 4.11 Wanamaker Corridor Conclusions ................................................................................ 85
4.12 46th
Street near US-75, North of Topeka ...................................................................... 86
Chapter 5: Summary and Conclusions .......................................................................................... 91
References ..................................................................................................................................... 95

x
List of Tables
TABLE 4.1 Summary of Performance Measures ......................................................................... 85
TABLE 4.2 Performance Measures for 2008 Traffic ................................................................... 89
TABLE 4.3 Performance Measures for Projected 2034 Traffic ................................................... 89

xi
List of Figures
FIGURE 2.1 Roundabout Corridor in Golden, Colorado, on South Golden Road ........................ 8
FIGURE 2.2 South Golden Road before Improvements ................................................................ 9
FIGURE 2.3 The City’s Proposed Roundabout Corridor for South Golden Road ....................... 11
FIGURE 2.4 South Golden Road after ......................................................................................... 13
FIGURE 2.5 Accident History in the South Golden Road Corridor ............................................ 14
FIGURE 2.6 Sales Tax Revenues from 2000 to June 2009 (Partial Year) in the South Golden
Road Corridor ....................................................................................................................... 15
FIGURE 2.7 Highway 54 in Wisconsin Rapids, Wisconsin ........................................................ 16
FIGURE 2.8 Roundabout for the Wal-Mart Super Center in Monona, Wisconsin ...................... 17
FIGURE 2.9 Main Street in Mt Horeb, Wisconsin—Before (top); After (bottom) ..................... 18
FIGURE 2.10 Series of Four Roundabouts on Main Street/Springdale Street
in Mt. Horeb, Wisconsin ....................................................................................................... 19
FIGURE 2.11 Linville Road, Howard, Wisconsin, with Roundabouts Positive for School
Site and New Businesses ...................................................................................................... 20
FIGURE 2.12 Quote from Carmel, Indiana, Chamber of Commerce President .......................... 20
FIGURE 2.13 Rocky Mountain Avenue, Loveland, Colorado, 1997, Roundabout
Access to Business ................................................................................................................ 21
FIGURE 2.14 Rocky Mountain Avenue, Loveland, Colorado, 2008 Showing That Business
since 1997 Is Thriving .......................................................................................................... 21
FIGURE 2.15 Two Interchanges in Vail, 1995 ............................................................................ 22
FIGURE 2.16 Avon, Colorado, Five Roundabout Corridor Replaced Traffic Signals, 1997 ...... 23
FIGURE 2.17 Page from Merchant Business Directory ............................................................... 23
FIGURE 2.18 Second Interchange for Avon Wal-Mart in 2003 .................................................. 24
FIGURE 2.19 Avon Revenue Growth 2004 to 2009 .................................................................... 24
FIGURE 2.20 Lee Road/M23, Brighton, Michigan, As It Is Today ............................................ 25
FIGURE 2.21 The Lee Road/Brighton Area before Development ............................................... 25
FIGURE 2.22 The Lee Road /Brighton Area after the Costco/Kohls Development .................... 27
FIGURE 2.23 Property Tax Revenues for 2010 ........................................................................... 28
FIGURE 2.24 Hazel Dell Parkway Built in 1998 ......................................................................... 29
FIGURE 2.25 Carmel’s Grid System of Roads ............................................................................ 30
FIGURE 2.26 Slide Illustrating Carmel’s Thinking behind Their Promotion of Roundabouts ... 31
FIGURE 2.27 Roundabouts in a Business Area in Carmel .......................................................... 32

xii
FIGURE 2.28 Location of Two Early Roundabouts in Olathe Studied by KSU ......................... 33
FIGURE 2.29 Results of the KSU Study of AM Peak Flow of Roundabout at Ridgeview
and Sheridan Compared to All-Way Stop Control (AWSC) before ..................................... 34
FIGURE 2.30 Results of the KSU Study of AM Peak Flow of Roundabout at Rogers and
Sheridan Compared to All-Way Stop Control (AWSC) before ............................................ 34
FIGURE 2.31 A Summary of the Major Results of the 2010 Olathe Roundabout Survey .......... 35
FIGURE 2.32 Five Leg Roundabout in the Heart of Downtown Glens Falls, New York ........... 36
FIGURE 2.33 State Highway 83 and US 18, Waukesha County, Wisconsin .............................. 39
FIGURE 2.34 IH-94/County Highway N and County Highway TT,
Dane County, Wisconsin ...................................................................................................... 40
FIGURE 3.1 Page 1 of the Survey That Was Sent to Business Owners near Roundabouts ........ 43
FIGURE 3.2 Page 2 of the Survey That Was Sent to Business Owners near Roundabouts ........ 44
FIGURE 3.3 Responses of Business Owners under Each Category (in Percentage) ................... 45
FIGURE 3.4 Customers and Suppliers Opinions about Roundabout (in Percentage) .................. 46
FIGURE 3.5 Responses of Business Owners under Each Category (in Percentage) ................... 49
FIGURE 3.6 Customers and Suppliers Opinions about Roundabout (in Percentage) .................. 50
FIGURE 3.7 Responses of Business Owners under Each Category (in Percentage) ................... 52
FIGURE 3.8 Customers and Suppliers Opinions about Roundabout (in Percentage) .................. 53
FIGURE 3.9 Responses of Business Owners under Each Category (in Percentage) ................... 55
FIGURE 3.10 Customers and Suppliers Opinions about Roundabout (in Percentage) ................ 56
FIGURE 3.11 Business Owners Responses (in Percentage) Regarding the Overall Feeling
of the Roundabout Added to Their Street or Neighborhood ................................................. 61
FIGURE 4.1 Wanamaker Corridor, Topeka, Kansas ................................................................... 66
FIGURE 4.2 Current Network Configuration .............................................................................. 69
FIGURE 4.3 Roundabout Configuration ...................................................................................... 69
FIGURE 4.4 Average Speed Comparison .................................................................................... 70
FIGURE 4.5 Wanamaker, Huntoon to I-470 Off-Ramp ............................................................... 72
FIGURE 4.6a Huntoon, Current Intersection ............................................................................... 73
FIGURE 4.6b Huntoon, Hypothetical Roundabout ...................................................................... 73
FIGURE 4.6c I-470, Current Intersection..................................................................................... 74
FIGURE 4.6d I-470 with Huntoon, Hypothetical Roundabout .................................................... 74
FIGURE 4.7a Huntoon, Current Intersection ............................................................................... 75
FIGURE 4.7b Huntoon, Hypothetical Roundabout ...................................................................... 75

xiii
FIGURE 4.7c I-470, Current Intersection..................................................................................... 76
FIGURE 4.7d I-470 with Huntoon, Hypothetical Roundabout .................................................... 76
FIGURE 4.8 Key to LOS Colors on Figures. ............................................................................... 76
FIGURE 4.9a Huntoon, Current Intersection ............................................................................... 77
FIGURE 4.9b Huntoon, Hypothetical Roundabout ...................................................................... 77
FIGURE 4.9c I-470, Current Intersection..................................................................................... 78
FIGURE 4.9d I-470 with Huntoon, Hypothetical Roundabout .................................................... 78
FIGURE 4.10a Huntoon, Current Intersection ............................................................................. 79
FIGURE 4.10b Huntoon, Hypothetical Roundabout .................................................................... 79
FIGURE 4.10c I-470, Current Intersection................................................................................... 80
FIGURE 4.10d I-470 with Huntoon, Hypothetical Roundabout .................................................. 80
FIGURE 4.11 Hobby Lobby and Bed Bath & Beyond (BBB) Access onto Wanamaker ............ 81
FIGURE 4.12a BBB Ent, Current Intersection ............................................................................. 82
FIGURE 4.12b BBB Ent with Adjacent, Hypothetical Roundabout ............................................ 82
FIGURE 4.13a Still of VISSIM Simulation—Signalized ............................................................ 84
FIGURE 4.13c Still of VISSIM Simulation—Roundabout .......................................................... 84
FIGURE 4.14 US-75 and 46th
Street Vicinity .............................................................................. 87
FIGURE 4.15 US-76 and 46th
Street Vicinity with Roundabouts ................................................ 88

1
Chapter 1: Introduction
1.1 The Need for this Study
Roundabouts are relatively new. In various areas of the USA the general public and local
officials and politicians tend to be polarized, i.e., some think they are great; others think they are
no good. Two of the more controversial issues is their impact on traffic flows and, closely
related, their impact on business in the area. For example, there has been news in Topeka,
Kansas, indicating impact or perceived impacts on business. Some persons argue that drivers
avoid routes with roundabouts and adversely impact adjacent routes; others argue that they
attract added traffic. The same diversity of opinion exists regarding their impact on business. The
truth is that nobody knows because there never has been a study of this aspect of roundabout
growth, either nationally or locally.
1.2 Background
Do roundabouts cause drivers to avoid some routes and negatively affect business along
those routes, as some people and business owners believe; or do they attract vehicles because
they reduce crashes, delay, and stopping? The modern roundabout, in rounded off figures, has
proven to be a safe and efficient intersection traffic control system, reducing all crashes 40%, and
injury crashes 80%, and reducing delay and stopping 50% to 80% along with concomitant
decreases in vehicular pollutants. When roundabouts were new, there was a strong belief that
they would cause drivers to avoid them and vehicles to use and congested alternate routes and
hurt business along the roundabout route. For example, businesses near an Interstate ramp in
Junction City fought a roundabout because they believed, without any basis, that truck drivers
would avoid exiting to their business because of the proposed roundabout. More recently, there is
a counter belief that roundabouts attract traffic (and business) from other routes, causing these
roundabout routes to be congested. This could be negative or positive for businesses depending
whether they are on the roundabout route of an alternate route. This study models the effect of a
series of roundabouts on a business arterial on Wanamaker Road in Topeka.

2
1.3 Research Objectives
The object of the research for this study was to study before and after traffic flows in the
areas of roundabout implementation to determine the effect on traffic flows and the impact of
changes in flows on businesses along the routes. In addition, businesses in a wide range of
known roundabouts were contacted via a survey to get their opinions. The survey covered
Kansas cities of Topeka, Junction City, Kansas City (Missouri), Wichita and other cities in the
USA known to have a number of roundabouts.
The tasks were straightforward, i.e. review of literature and all sources where there may
be national data or reliable case studies to serve as a base for Kansas studies, interview/survey
national and local sources uncovered in to determine availability, reliability and usability of data
and case studies and collect and analyze the data. Some data that was initially thought to be
available was not generally available and/or beyond the scope of the project; namely, business
profits before and after and/or economic data like sales taxes, property values, building permits
etc. for a city or region that could be explicitly be attributed to roundabouts.
1.4 Obstacles to the Originally Envisioned Tasks
The researchers did attempt to get before and after traffic counts in Topeka and in the
cities that that we surveyed—cities with known roundabouts. We could not find comparable
counts that were taken before and after roundabouts were open for traffic. In general, there was
no way to relate, traffic count dates to roundabout opening dates. A specific example was in
Emporia, Kansas, where the roundabout is near a high school and before counts were taken when
school is in session in the after tells were taken during the summer. The roundabouts in Topeka at
37th
Street and Wanamaker, 29th
and Urish, and 21st and Urish were in commercial areas but very
little, if any, additional development occurred during the course of the study. There was no
commercial area in Kansas like that of Golden, Colorado, (covered in the review of literature)
were roundabouts could lead directly related to the activity in the area is the hypothesized that
that the economic slowdown during the period of this study may have had a significant effect on
lack of new development around the newly constructed roundabouts.

3
Another fact, widely written up in the local newspaper (the Topeka Capital Journal) was
the fact that construction of one roundabout took several months to construct, restricting access.
The researchers visited some business owners in the area and they indicated that they had lost
business during construction which they thought was entirely too long. Most indicated that it was
taking a year for their business to recover to where it was before the construction started. These
are issues that should have been, or should be studied and corrected by cities and contractors;
however, studying this issue was not within the scope of this research. However, this situation
possibly biased some survey answers toward the negative in regard to their feelings about the
benefits of roundabouts to their business.
The researchers did run across some anecdotal data in that one business owners along
Northwest 46th
Street in Topeka reported, “If a roundabout had not been built, they would no
longer be in business.” The business owner attributed this to the fact that prior to the roundabout
traffic on 46th
Street was discouraging people from making left turns in and out of the business.
The researchers did check with the Kansas Department of Revenue but they were
reluctant to provide tax information. Also, as previously mentioned, for whatever reason, there
was very little development occurred near the roundabouts that were constructed.
Finally, after getting into the study it was determined that even if all the anticipated data
could have been acquired there would be no way to attribute these gains or losses to a specific
roundabout or series of roundabouts in Topeka and other cities that were made a part of the
study.
For these above reasons, the study concentrated on the survey to businesses and the
literature assessing roundabouts proven ability to move traffic more efficiently, and not be a
“bottleneck” that shoppers would avoid and patronize businesses in areas with no roundabouts. It
is widely accepted that businesses and business areas that have good vehicular and pedestrian
traffic flows should prosper and grow. Conversely business areas that are hard to get to will not.
From the literature review, covered in Chapter 2 this study will provide additional
conclusions to either remove the “myth” that they hurt business by causing drivers to avoid the
area or, as a minimum, provide reliable conclusions to plan roundabout growth to the advantage
4
of improved safety, and more efficient traffic flow which is assumed to be neutral or
advantageous to businesses.
A recent BBC news article found on the Internet stresses the point that traffic congestion
and delays are bad for business. Although this occurred in England, it could occur with similar
results anywhere in the United States or anywhere. After a new supermarket was open in
Wrexham town center, for reasons not explained in the news article, a mini roundabout was
replaced by traffic signals. Motorist claim the signals were causing delays and business owners
were claiming that the delays were not good for business. Some of the comments that were
reported in the article that relate to traffic flow and business are as follows: (BBC news article)
They [persons interviewed] say holdups can affect surrounding streets and roads
serving Wrexham fire station, the Maelor Hospital as well as shops and offices.
Allen Groom, who works at one business on Bradley Road, said: “It's a [darn]
sight worse. A lot of times you don't feel safe crossing”
He said other motorists had started using his work’s car park to turn their vehicles
around rather than wait at the lights. He was quoted further: "That's something
that never happened before," he said, adding that he had already seen one accident
and several near misses in a few weeks.
One shop owner, who did not want to be named, said his business was being
affected, and was quoted as saying, “Cars can't stop outside anymore as there is so
much traffic.”
Since no reliable before/after corridor data could be found that could definitely be
concluded that it was directly related to area roundabouts, a task was added to do a simulation
study of a busy business corridor in Topeka-Wanamaker Road. This business corridor was
modeled using VISSIM software to simulate a before/after study of what would be the result on
traffic flow if several traffic controlled intersections were replaced with roundabouts. This
simulation study was undertaken to determine if a roundabout corridor would improve traffic
flow. Details of this part of the study can be found in Chapter 3.

5
Although this research had many obstacles that were not envisioned in the proposal, the
researchers feel that results from this study represent a significant step forward in filling a gap in
knowledge regarding the impact of roundabouts on business and is very timely.
6
Chapter 2: Literature Review
2.1 Benefits of Roundabouts
The benefits of roundabouts are many and beginning to be accepted by cities and drivers
in many localities throughout the United States. Along with the widely accepted view that safety
along with good traffic flow on access is good for business, only the safety and improve traffic
flow benefits will be mentioned here. The Insurance Institute for Highway Safety has an
excellent website which gives a quick summary of this sort of information in a Q/A format which
will be presented here. (Insurance Institute for Highway Safety web site):
2.1.1 Q/A: How Do Roundabouts Affect Safety?
Several features of roundabouts promote safety. At traditional intersections with
stop signs or traffic signals, some of the most common types of crashes are right-
angle, left-turn, and head-on collisions. These types of collisions can be severe
because vehicles may be traveling through the intersection at high speeds. With
roundabouts, these types of potentially serious crashes essentially are eliminated
because vehicles travel in the same direction. Installing roundabouts in place of
traffic signals can also reduce the likelihood of rear-end crashes and their severity
by removing the incentive for drivers to speed up as they approach green lights
and by reducing abrupt stops at red lights. The vehicle-to-vehicle conflicts that
occur at roundabouts generally involve a vehicle merging into the circular
roadway, with both vehicles traveling at low speeds—generally less than 20 mph
in urban areas and less than 30–35 mph in rural areas.
A 2001 Institute study of 23 intersections in the United States reported that
converting intersections from traffic signals or stop signs to roundabouts reduced
injury crashes by 80 percent and all crashes by 40 percent. [Persaud, Retting,
Gardner and Lord]. Similar results were reported by Eisenman et al.: a 75 percent
decrease in injury crashes and a 37 percent decrease in total crashes at 35
intersections that were converted from traffic signals to roundabouts. [Eisenman,
Josselyn, List et al.]. A study of 17 higher speed rural intersections (40 mph and
higher speed limits) found that the average injury crash rate per million entering
vehicles was reduced by 84 percent and fatal crashes were eliminated when the
intersections were converted to roundabouts. [Isebrands, H.]
Studies of intersections in Europe and Australia that were converted to
roundabouts have reported 41–61 percent reductions in injury crashes and 45–75
percent reductions in severe injury crashes. [FHWA 2000]

7
2.1.2 Q/A: How Do Roundabouts Affect Traffic Flow?
Several studies conducted by the Institute and others have reported significant
improvements in traffic flow following conversion of traditional intersections to
roundabouts. A study of three intersections in Kansas, Maryland, and Nevada,
where roundabouts replaced stop signs, found that vehicle delays were reduced
13–23 percent and the proportion of vehicles that stopped was reduced 14–37
percent. [Retting, Luttrell and Russell]. A study of three locations in New
Hampshire, New York, and Washington, where roundabouts replaced traffic
signals or stop signs, found an 89 percent average reduction in vehicle delays and
a 56 percent average reduction in vehicle stops. [Retting, Mandavelli and
Russell]. A study of 11 intersections in Kansas found a 65 percent average
reduction in delays and a 52 percent average reduction in vehicle stops after
roundabouts were installed. [Russell, Mandavelli and Rys]
A 2005 Institute study documented missed opportunities to improve traffic flow
and safety at 10 urban intersections suitable for roundabouts where either traffic
signals were installed or major modifications were made to intersections with
signals [Berg, Retting and Myers]. It was estimated that the use of roundabouts
instead of traffic signals at these 10 intersections would have reduced vehicle
delays by 62–74 percent. This is equivalent to approximately 325,000 fewer hours
of vehicle delay on an annual basis.
2.2 Specific Examples of Impact on Business
Literature specifically on the impact of roundabouts on business is scarce. The best
available and most quoted is a study done on a series of roundabouts in Golden, Colorado.
(Ariniello 2004).
Ariniello (2004) showed how a series of roundabouts were implemented in Golden a
more aesthetically pleasing area while providing efficient traffic flow and protection for
pedestrians. The series of roundabouts created a roundabout corridor that resulted in slow
moving traffic, albeit with little delay, allowing pedestrians to safely access the many businesses
in the area and resulted in a healthy business environment (Ariniello 2004).

8
(Source: Ariniello 2004)
FIGURE 2.1 Roundabout Corridor in Golden, Colorado, on South Golden Road
The following is paraphrased from the Ariniello (2004) paper. The South Golden Road
corridor service several residential areas many businesses, including several fast food restaurants
and a small shopping center. ADT was in the range of 11,000 to 12,000 vehicles per day.
Unrestricted access created a safety concern from uncontrolled left turn movements, making it
difficult and unsafe for pedestrians to cross. The city was interested in creating a safer route.
However, it was not until a 70,000 square foot grocery store was proposed to be located on South
Golden Road that they looked at different design concepts.

9
(Source: Ariniello 2004)
FIGURE 2.2 South Golden Road before Improvements
Two alternative concepts for South Golden Road were developed:
1. “Narrow the roadway, provide medians and wide detached sidewalks, and install a
new traffic signal at Utah Street, and
2. Narrow the roadway, provide medians and wide detached sidewalks, and
construct two roundabouts at Utah Street and Ulysses Street.” (Ariniello 2004)
Ourston Roundabout Engineering commented on the South Golden Road corridor and
summarized the before after conditions thusly: (Lenters Undated)
Before conditions:
unpleasant travel corridor,
wide roadways,
numerous unorganized access points,
poor safety performance due to left turns in higher speeds (suicide lane),
center turn lane (suicide turn lane), and
wide 80 pedestrian crossing (84 feet), difficult to cross without traffic signal.

10
After conditions:
vibrant community corridors—attractive for business,
slower pace but faster travel times,
improved business access,
traffic flows increased 22% since 2001,
pedestrians access to business improved,
Improve safety (greater than 50%),
50% increase in retail sales tax revenue, and
additional retail/office space constructed on the corridors since roundabout
installation.
The goals of the South Golden Road improvement were: (Hartman 2009)
Reduce speeds through the section,
Improve Aesthetics,
Improve Access for business and residential neighborhoods,
Improve safety, and
Create pedestrian friendly environment.
The options that were considered by the city were: (Hartman 2009)
traditional traffic signals with center medians, and restricted left turns,
roundabout section with center medians restricted left turns and roundabouts.
The city decided that problem with the traffic signal option was that there would be
problems providing access to all businesses and large intersections would hurt pedestrian
crossing. The roundabout option would provide better access options and better pedestrian access
(Dan Hartman 2009).
11
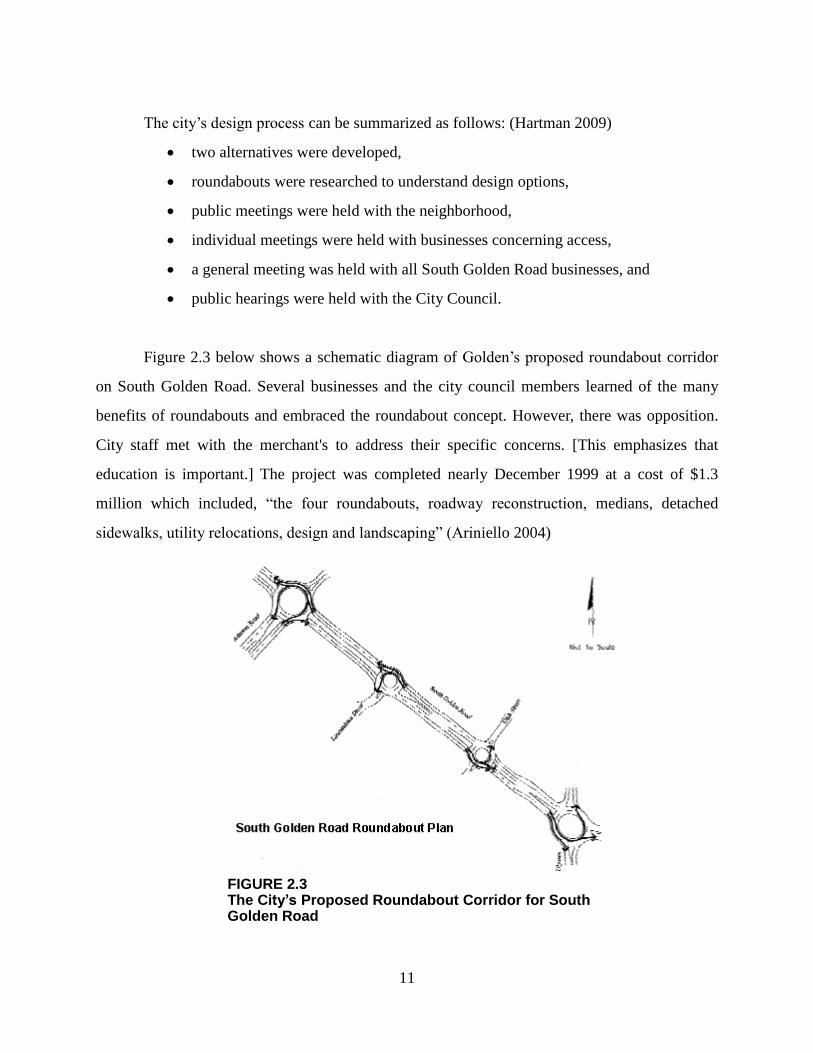
The city’s design process can be summarized as follows: (Hartman 2009)
two alternatives were developed,
roundabouts were researched to understand design options,
public meetings were held with the neighborhood,
individual meetings were held with businesses concerning access,
a general meeting was held with all South Golden Road businesses, and
public hearings were held with the City Council.
Figure 2.3 below shows a schematic diagram of Golden’s proposed roundabout corridor
on South Golden Road. Several businesses and the city council members learned of the many
benefits of roundabouts and embraced the roundabout concept. However, there was opposition.
City staff met with the merchant's to address their specific concerns. [This emphasizes that
education is important.] The project was completed nearly December 1999 at a cost of $1.3
million which included, “the four roundabouts, roadway reconstruction, medians, detached
sidewalks, utility relocations, design and landscaping” (Ariniello 2004)
FIGURE 2.3 The City’s Proposed Roundabout Corridor for South Golden Road
12
Figure 2.4 shows a picture from another source of the corridor in the after condition, and
provides a better view of the roundabouts and the businesses they serve.
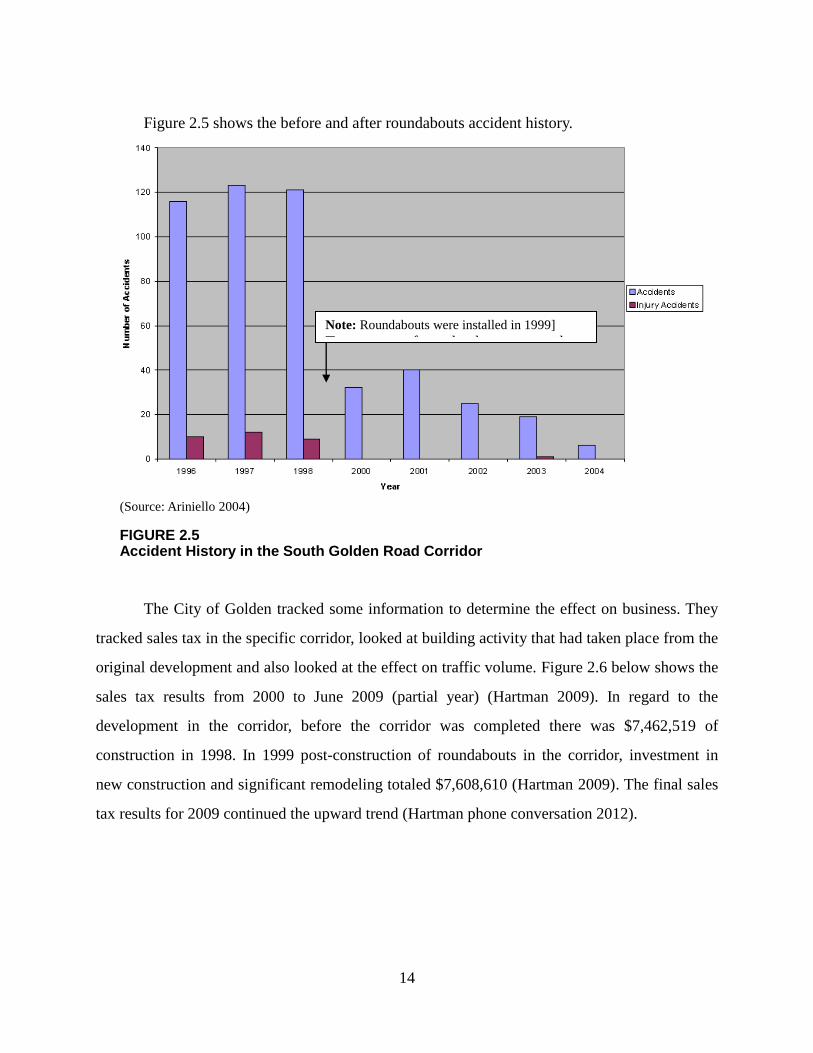
The city recorded accidents for three years before and five years after and determined the
total annual accidents were reduced from a pre-installation high of 123 accidents to 19 in 2003.
In regard to injuries, there were 31 injuries in the three-year pre-installation and only one injury
in the after period. This reduction in accidents occurred while traffic volumes increase from
11,500 vehicles per day in 1996 to 15,500 vehicles per day in 2004. (Ariniello 2004). Figure 5
presents the accident history in the corridor.
Ariniello (2004) posed the question “Are roundabouts good for business?” And made the
following statement: “While the aesthetic improvements, including underground utilities, wider
sidewalks and landscaping, certainly have contributed to a vibrant business community along
South Golden Road, the traffic and safety improvements are probably more significant in the
revitalization of the area. Faster travel times, better access control, fewer accidents, and lower
delay at business access points have contributed to an increase in economic activity.”
A description of the corridor regarding roundabouts and businesses is as follows:
South Golden Road is a typical suburban strip commercial corridor. The
installation of four roundabouts within this half-mile long arterial has resulted in
slower speeds, but lower travel times and less delay at business access points.
Accident rates have dropped by 88% and injury accidents have declined from 31
in the 3 years prior to installation to only 1 in the 4½ years after—a decline in
injury accidents rates of 93%. The improvement in traffic flow, vehicular safety
and access to businesses combined with amenities such as landscaped medians
and pedestrian walkways has stimulated economic activity. Sales tax revenues
have increased 60% since installation of the roundabouts and 75,000 square feet
of retail/office space has been built. In Golden, Colorado, businesses have said
“Yes, roundabouts are good for business.” (Ariniello 2004)

13
(Source: Lenters Undated PowerPoint)
FIGURE 2.4 South Golden Road after Condition
14
Figure 2.5 shows the before and after roundabouts accident history.
(Source: Ariniello 2004)
FIGURE 2.5 Accident History in the South Golden Road Corridor
The City of Golden tracked some information to determine the effect on business. They
tracked sales tax in the specific corridor, looked at building activity that had taken place from the
original development and also looked at the effect on traffic volume. Figure 2.6 below shows the
sales tax results from 2000 to June 2009 (partial year) (Hartman 2009). In regard to the
development in the corridor, before the corridor was completed there was $7,462,519 of
construction in 1998. In 1999 post-construction of roundabouts in the corridor, investment in
new construction and significant remodeling totaled $7,608,610 (Hartman 2009). The final sales
tax results for 2009 continued the upward trend (Hartman phone conversation 2012).
Note: Roundabouts were installed in 1999]
Type a quote from the document or the
summary of an interesting point. You
can position the text box anywhere in
the document. Use the Drawing Tools
tab to change the formatting of the pull
quote text box.]

15
(Source: Hartman 2009)
FIGURE 2.6 Sales Tax Revenues from 2000 to June 2009 (Partial Year) in the South Golden Road Corridor
Johnson and Isebrand presented some presentations on how roundabouts assist access.
The following are some examples from their presentations.
Access management along business routes in cities have long been believed to be
beneficial to traffic flow and safety and good for business. Roundabouts enhance access
management strategies are defined by the Transportation Research Board’s Access Committee, in
the report as “Systematic control of the location, spacing, design and operation of driveways,
median openings, interchanges, and street connections” (referenced in Johnson and Isebrands
2008). Roundabouts are definitely compatible with these objectives and in addition provide
flexibility to balance the sometimes competing objectives of increased safety, decreased
Partial Yr

16
congestion, and user and access needs of proposed land uses and businesses (Johnson and
Isebrands 2008).
The operational characteristics of roundabouts allow access to businesses to be located
much closer to intersections than do traditional forms of intersection traffic control such as traffic
signals. In the case of traffic signals, traffic queuing at a red light or for turning maneuvers many
times blocks business access. This concept is illustrated in Figure 2.7 where turns from a
highway can be made directly into adjacent areas. Roundabouts can be designed with a
commercial or business entrance directly off the roundabout.
(Source: MTJ Engineering, LLC, in Johnson and Isebrands)
FIGURE 2.7 Highway 54 in Wisconsin Rapids, Wisconsin
This concept is further illustrated in the paper (Johnson and Isebrands 2008) with the
conceptual layout of a roundabout serving access to a Wal-Mart supercenter on South Town
Drive/Industrial Drive in Monona, Wisconsin, as shown in Figures 2.8 and 2.9. As stated by
Johnson and Isebrands, roundabout and access management experts: “The roundabout’s
operational characteristics, low delay and improved safety, provides excellent mobility, ingress
and egress through equal opportunity for lefts, through movements and U-turns.”

17
(Source: MTJ Engineering, LLC in Johnson and Isebrands 2008,
http://www.mtjengineering.com/project/south-town-and-industrial-drive)
FIGURE 2.8 Roundabout for the Wal-Mart Super Center in Monona, Wisconsin
Another example in the Johnson and Isebrand paper was a long state trunk Highway
78/92 in Mount Horeb, Wisconsin. The roundabout at this intersection was one of the first in the
state. The village of Horeb was pleased with the operation of the roundabout on Main Street. The
flexibility of the roundabouts, and their ability to improve business access, enhanced further
development of existing businesses along this commercial corridor. In addition to improved
aesthetics, the roundabouts created safer turning movements in and out of business driveways,
including U-turns, which enhanced vehicular flows. Before and after pictures are shown below in
Figure 2. 9

18
(Source: M. T. Johnson in Johnson and Isebrands)
FIGURE 2.9 Main Street in Mt. Horeb, Wisconsin—Before (top); After (bottom)
As stated above, the city was impressed with the roundabout on Main Street and
constructed four more along a newly developing corridor on Main Street/Springdale Street.
These four roundabouts were constructed at major intersections along the corridor and they
enhanced access to businesses along the corridor. Figure 2.10 shows an aerial view of this
corridor.

19
(Source: MTJ Engineering, LLC in Johnson and Isebrands 2008)
FIGURE 2.10 Series of Four Roundabouts on Main Street/Springdale Street in Mt. Horeb, Wisconsin
Johnson and Isebrands (2008) present a number of other cases where roundabouts and
roundabout corridors enhance flow on access to commercial areas. The most significant
statement by these authors is as follows: “Roundabouts provide flexibility for accesses at and
near intersections as well as along a corridor. Furthermore, roundabouts offer the ability to meet
the safety, capacity and operational objectives of a roadway while also providing access and site
circulation opportunities not typically available with signalization.”
Mark Lenters, president of Ourston Roundabout Engineering, provided some examples of
roundabouts with positive impact on business. His suggestions, included in his power point
presentation “Roundabouts and Business” (Undated) suggested the following sites where
roundabouts were positive on business:
Linville Road, Brown County, Wisconsin
South Golden Road, Golden, Colorado
Lee Road, Brighton, Michigan
Carmel, Indiana
Vail Interchanges, Vail, Colorado
Rocky Mountain Avenue, Loveland, Colorado
Avon Road, Avon, Colorado

20
Figures 2.11 through 2.20 show examples from the slide presentation “Roundabouts and
Business”, illustrating cases where roundabouts have helped businesses and/or the economy of
an area. (Lenters 2010.)
(Source: Lenters Undated PowerPoint)
FIGURE 2.11 Linville Road, Howard, Wisconsin, with Roundabouts Positive for School Site and New Businesses
(Source: Lenters Undated PowerPoint)
FIGURE 2.12 Quote from Carmel, Indiana, Chamber of Commerce President

21
More will be written in a section below on the great success Carmel, Indiana, has had
with over 60 roundabouts in the city. It has earned the title in some circles as “Roundabout City,
USA.”
(Source: Lenters Undated PowerPoint, originally City of Loveland and Traffic Engineering
and Mc Whitney Enterprises, Inc.)
FIGURE 2.13 Rocky Mountain Avenue, Loveland, Colorado, 1997, Roundabout Access to Business
(Source: Lenters Undated PowerPoint)
FIGURE 2.14 Rocky Mountain Avenue, Loveland, Colorado, 2008 Showing That Business since 1997 Is Thriving

22
Vail and Avon, Colorado are two excellent examples of communities that experienced
significant growth and profited from roundabouts. Vail, a small resort town just off I-70 in the
mountains west of Denver, had access problems for heavy winter resort traffic getting into town.
Leif Ourston, one of the early roundabout experts in the USA (arguably the one who built the
first modern roundabout in the USA and was an early promoter) made a presentation to the city
and convinced them to build a roundabout. See Figure 2.16. This was so successful that the city
continued to build roundabouts. Access to the city and businesses contributed to growth of the
area. The town of Avon and Avon County followed with a number of roundabouts and
roundabout corridors. Figures 2.17 through 2.20 below illustrate the roundabouts and corridors.
Several other cities along the I-70 corridor have since followed suit and built a number of
roundabouts to enhance access, similar to what Vail and Avon have done.
(Source: Lenters Undated PowerPoint)
FIGURE 2.15 Two Interchanges in Vail, Colorado, 1995

23
(Source: Lenters Undated PowerPoint)
FIGURE 2.16 Avon, Colorado, Five Roundabout Corridor Replaced Traffic Signals, 1997
(Source: Lenters Undated PowerPoint)
FIGURE 2.17 Page from Merchant Business Directory

24
(Source: : Lenters Undated PowerPoint)
FIGURE 2.18 Second Interchange for Avon Wal-Mart in 2003
(Source: : Lenters Undated PowerPoint)
FIGURE 2.19 Avon Revenue Growth 2004 to 2009
25
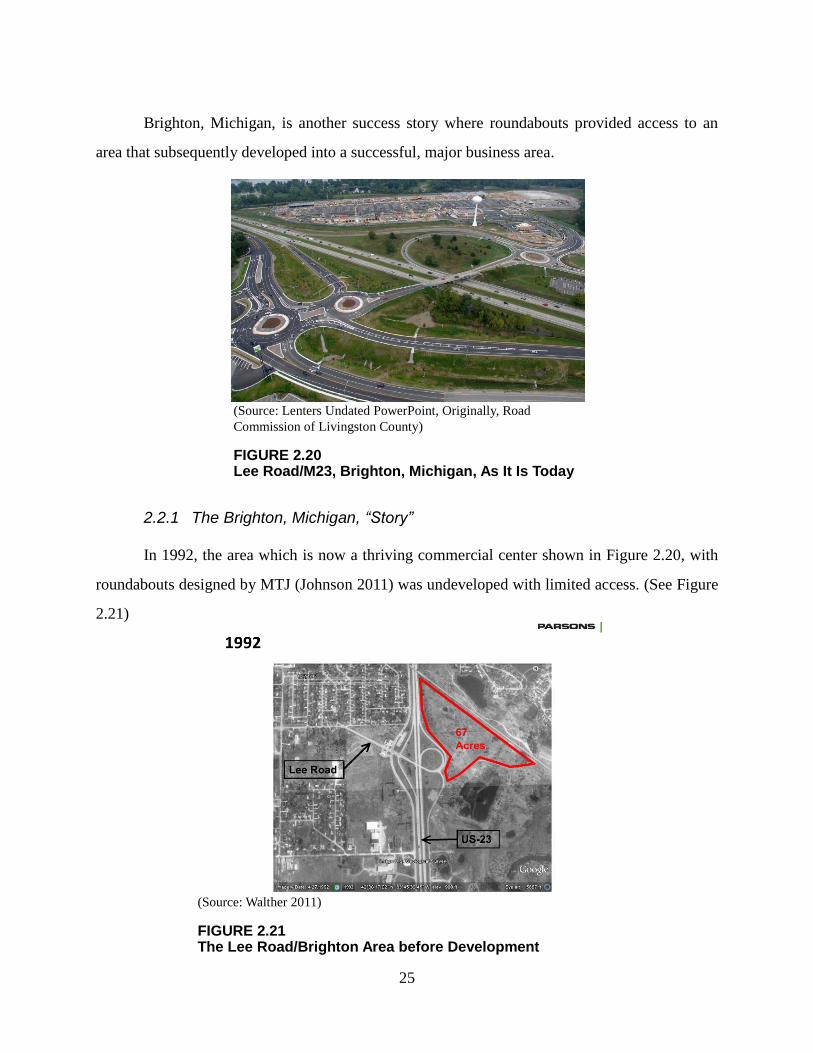
Brighton, Michigan, is another success story where roundabouts provided access to an
area that subsequently developed into a successful, major business area.
(Source: Lenters Undated PowerPoint, Originally, Road
Commission of Livingston County)
FIGURE 2.20 Lee Road/M23, Brighton, Michigan, As It Is Today
2.2.1 The Brighton, Michigan, “Story”
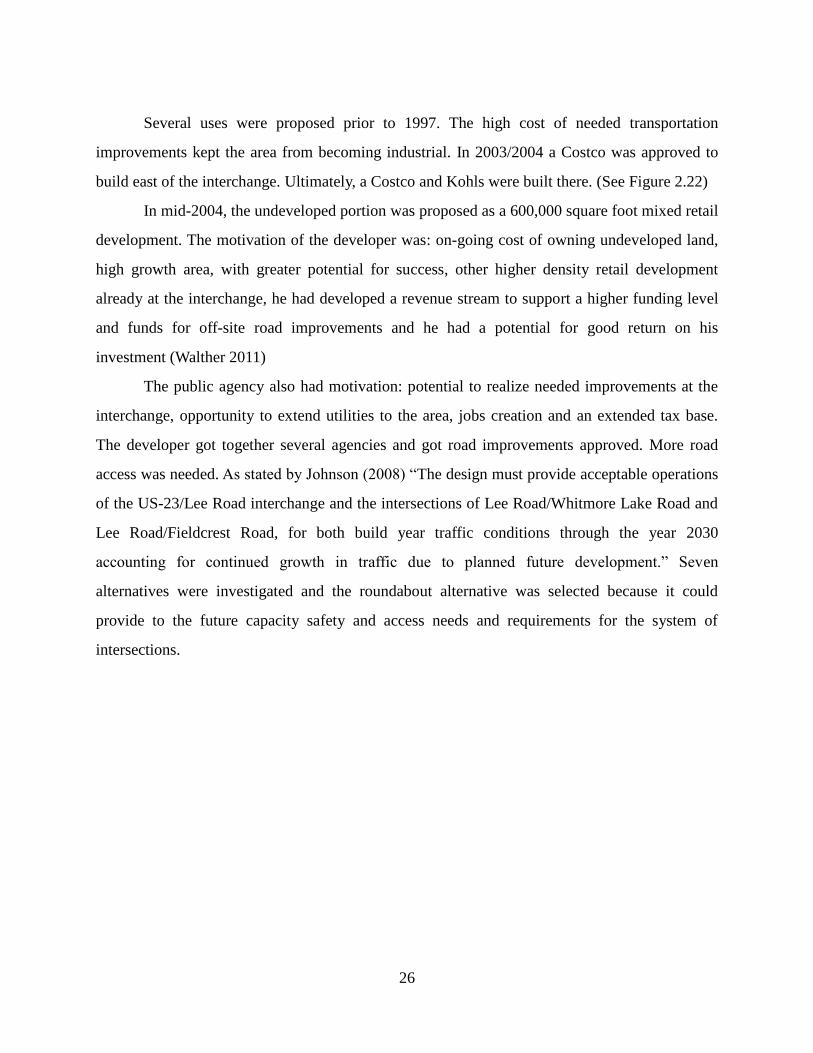
In 1992, the area which is now a thriving commercial center shown in Figure 2.20, with
roundabouts designed by MTJ (Johnson 2011) was undeveloped with limited access. (See Figure
2.21)
(Source: Walther 2011)
FIGURE 2.21 The Lee Road/Brighton Area before Development
26
Several uses were proposed prior to 1997. The high cost of needed transportation
improvements kept the area from becoming industrial. In 2003/2004 a Costco was approved to
build east of the interchange. Ultimately, a Costco and Kohls were built there. (See Figure 2.22)
In mid-2004, the undeveloped portion was proposed as a 600,000 square foot mixed retail
development. The motivation of the developer was: on-going cost of owning undeveloped land,
high growth area, with greater potential for success, other higher density retail development
already at the interchange, he had developed a revenue stream to support a higher funding level
and funds for off-site road improvements and he had a potential for good return on his
investment (Walther 2011)
The public agency also had motivation: potential to realize needed improvements at the
interchange, opportunity to extend utilities to the area, jobs creation and an extended tax base.
The developer got together several agencies and got road improvements approved. More road
access was needed. As stated by Johnson (2008) “The design must provide acceptable operations
of the US-23/Lee Road interchange and the intersections of Lee Road/Whitmore Lake Road and
Lee Road/Fieldcrest Road, for both build year traffic conditions through the year 2030
accounting for continued growth in traffic due to planned future development.” Seven
alternatives were investigated and the roundabout alternative was selected because it could
provide to the future capacity safety and access needs and requirements for the system of
intersections.

27
(Source: Walther 2011)
FIGURE 2.22 The Lee Road /Brighton Area after the Costco/Kohls Development
Roundabout interchanges as shown in Figure 2.20 were determined to be the most cost
effective and at a cost the developer could raise. Overhead separation structures were too costly,
i.e. around $16 million versus around $6 million for the roundabout option. The roundabout
intersections were desired by the community, they were an affordable solution and they were an
effective traffic operations solution. “Roundabouts were the Glue that held the project together”
(Walther 2011).
The benefits were estimated as follows:
Local Community
Significant property and use tax revenue increase. (see Figure 2.23)
Jobs created.
Utility expansion made possible.

28
Lower fire insurance premiums.
State and Federal
Income/sales taxes increase.
Michigan business tax.
Federal corporate tax.
Developer
[good] return on investment
(Source: Walther 2011)
FIGURE 2.23 Property Tax Revenues for 2010

29
2.3 Roundabout City, USA
The authors believe that there is no doubt that Carmel, Indiana, deserves the name that is
often used: Roundabout City, USA. Since 1996, population increased from 38,000 to 80,000 in
2010. Over the past eight years Carmel has invested over 500 million dollars in transportation
infrastructure. A large portion of this funding has gone in to roundabouts. Carmel currently has
63 roundabouts in place, three more under construction another 16 that are currently being
designed. (Mike 2011)
Carmel had a proven leader with exceptional vision, Mayor Jim Brainard (Mike 2011).
When Mayor Brainard took office in 1996 he had a clear understanding that safe, efficient
transportation infrastructure promotes quality of life and successful economic development. He
had studied roundabouts and was aware of their success in other areas, such as in England and
Vail, Colorado. He insisted on the inclusion of roundabouts in a Hazel Dell project in spite of
opposition from an outspoken minority
Carmel’s first roundabouts were built on Hazel Dell Parkway in 1998 and is shown in
Figure 2.24.
(Source: McBride 2011)
FIGURE 2.24 Hazel Dell Parkway Built in 1998

30
Hazel Dell Parkway was a 5 mile, four-lane boulevard, controlled by multilane
roundabouts. The recognized benefits were safety, less severe crashes, cost savings, traffic flow
efficiency, environmental benefits, and quality of life benefits and property value enhancements.
The Hazel Dell roundabouts were considered a great success. Roundabouts gained public
acceptance. In Mayor Brainard’s first term, 1996 to 1999, four roundabouts were built. Success
of several roundabouts prompted city officials to rethink the use of roundabouts and include
them in their comprehensive plan.
Carmel was laid out a 1 mile grid system was provided a blank slate for development as
shown in Figure 2.25.
(Source: McBride 2011)
FIGURE 2.25 Carmel’s Grid System of Roads

31
The plan for expanding the roadway infrastructure for the city of Carmel involved
incorporating roundabouts on the primary grid streets. Figure 2.26 shows a slide illustrating the
philosophy behind the city’s desire to promote roundabouts and all intersections where feasible.
(Source: McBride 2011)
FIGURE 2.26 Slide Illustrating Carmel’s Thinking behind Their Promotion of Roundabouts
Carmel currently has 63 roundabouts and they have decreased their signalized
intersections to only 39. In regard to accident reduction, in 2003, Carmel had 220 road miles,
which resulted in a total of 252 injury accidents. In 2008, their miles increased to 395 road miles
and significant population growth; however, the total injury accidents fell to 223. (McBride
2011)

32
In addition to the benefits to residential areas, Carmel also has a growing industrial and
business community. Figure 2.27 shows one of these the business areas served by roundabouts.
Note how the retail shops are close to the street, with parking behind the stores. Coupled with the
roundabouts, this creates a walkable, inviting retail corridor.
(Source: McBride 2011)
FIGURE 2.27 Roundabouts in a Business Area in Carmel

33
The city of Carmel has seen great growth in population and business since 1996 and has
shown that incorporating roundabouts in a well planned infrastructure plan has greatly benefited
the city, the residents and the business community.
2.4 Olathe Survey
The most comprehensive survey, perhaps the only other survey ever conducted in Kansas,
was done in Olathe. Olathe was one of the first cities in Kansas to construct roundabouts. Two of
the early ones were part of research projects by Kansas State University (KSU). The two
locations were at Rogers Road and Sheridan Street and Ridgeview Road and Sheridan Street.
The location is shown in Figure 2.28. At both intersections, modern roundabouts replaced 4-way
stop control. A traffic study had indicated that timing signals for these two adjacent intersections
would not be efficient.
(Source: Russell et al.)
FIGURE 2.28 Location of Two Early Roundabouts in Olathe Studied by KSU

34
Figures 2.29 and 2.30 below show the results for the AM peak period. The PM Peak
period results were similar.
(Source: Russell et al.)
FIGURE 2.29 Results of the KSU Study of AM Peak Flow of Roundabout at Ridgeview and Sheridan Compared to All-Way Stop Control (AWSC) before Condition
(Source: Russell et al.)
FIGURE 2.30 Results of the KSU Study of AM Peak Flow of Roundabout at Rogers and Sheridan Compared to All-Way Stop Control (AWSC) before Condition

35
The city of Olathe wanted to know how their citizens felt about roundabouts and
contracted with a firm to do a city wide survey in 2001. The results were generally positive with
a majority of respondents approving of roundabouts and a majority indicating they wanted the
city to build more roundabouts.
In 2010 the city contracted with the same firm to do the study again to determine the long
term results after several more roundabouts were built in the city. The results were again
generally positive and similar to the first survey. The summary of results is shown in Figure 2.31.
(Source: ETC Institute)
FIGURE 2.31 A Summary of the Major Results of the 2010 Olathe Roundabout Survey

36
2.5 Glens Falls, New York
Glens Falls has a five-leg intersection of US Route 9, New York Route 32 and the
southern terminus of New York Route 9L. The local street names of these routes are Hudson
Street, Glen Street, Ridge Street, and Warren Street. Glen Street comprises two legs of the
roundabout and the others one each. It is in the heart of downtown Glens Falls. The roundabout
was the first roundabout in the city and was constructed in 2007. Figure 2.32 shows an elevated
view.
(Source: Creighton Manning)
FIGURE 2.32 Five Leg Roundabout in the Heart of Downtown Glens Falls, New York
The roundabout was constructed in five weeks and opened in May 2007. At first there
was mostly opposition, especially from businesses near the intersection. In 2009 a video was
made of an interview with several business owners on the roundabout and with the police chief

37
and assistant chief. It was clear that after the roundabout had been in operation—about 2 years—
business owners had praise for the roundabout.
The video was uploaded by “AboutRoundabout” on May 17, 2009and is available on
YouTube at <http://youtu.be/zLMMGclhbEY> [last accessed December 13, 2011) and is
transcribed here. The transcription of the video interviews of business owners whose business is
on the Glens Falls, New York, downtown roundabout follows:
Hi, my name is Joe Vogel, and I run a small business down the street here. Been
in business in Glens Falls for 20 years. Warren Street has been totally redone over
the last few years and they did a wonderful job. The roundabout is a crowning
touch to the whole renovation work that they done and the roundabout, everybody
looked at it, myself included, as being kinda something that wasn’t going to work
because of the log trucks and everything else that comes through and it’s turned
into something that’s a beneficial thing to the city. It works very well.
Chris Scoville from Scoville Jewelers and our business is located right on the
roundabout in downtown Glens Falls and I was skeptical until I heard the
engineers talk about it and explain the nature of the size of the circle and the pie
shape pedestrian islands that the people could use to cross and it all made sense
and in fact since its been in existence it’s been perfect. People rave about it. It’s so
easy to cross the street and traffic moves. When we first installed it we thought,
well, maybe two hours out of the day during rush hour we might have some
problems but as it turns out, even during rush hours, cars are moving through the
circle and pedestrians are moving across the intersections without any problems. I
don’t think we had any pedestrian accidents whatsoever and maybe in the course
of what, has it been two years, maybe we had three slight fender benders.
I’m Colleen Sacala, and I own Ridge Street Coffee Co. We are located right on
Centennial Circle. And then the roundabout construction came in and you
couldn’t find a single supporter in this community or if we did they would be
tarred and feathered and made to shut up because nobody wanted the roundabout,
and since it’s opened you can’t find anyone who doesn’t support it. It makes it so
much easier to get through town. It’s now the short cut through town rather then a
place you had to get around.
I’m Mark B [hard to hear name] and I run a consulting firm in downtown Glens
Falls with 15 employees. And during the discussions that lead to the development
of the roundabout I was opposed to it. I thought it was a change that would cause
delay and disruption and I’m here to tell you that I was wrong about that. The
roundabout has been really the center piece that has tied all the aspects of
downtown together. It has improved traffic flow downtown, it has improved street
traffic flow for the retail businesses, and it has created a sense of community in a

38
very tangible way that helps make downtown Glens Falls feel the way it is as the
vibrant center of activity for the community.
I’m Mark Frost. I’m the founder/editor of the Chronicle newspaper. The
roundabout was a very controversial issue in Glens Falls when it was first
proposed. A lot of people, I would even say the majority of people, didn’t think it
would work. It’s worked absolutely the way that they said it would work; it moves
traffic. People go out of their way; I go out of my way, to get to that intersection
when I want to go across town now. And what was, I think unforeseen, by a lot of
people, as fantastic for pedestrians because it slows traffic down makes it very—
there’s always an avenue or a moment for you to cross there are bump outs so that
your space crossing the street is less and it’s worked out, it could not have worked
out any better. Plus it’s a signature thing for Glens Falls.
Glens Falls City Police Department Chief Joel Bethel. This is second in command
Captain Will Valenza. [currently 2011 chief] Well, initially we had a lot of
resistance here in Glens Falls to the roundabout, but like the project engineer said
it would work. They did a year, they did a couple years study of all the
surrounding intersections and really we see it as the best thing that has ever
happened. We said that it would never work and the project engineer said that it
would work. They were proven right. Like the engineer told me after it was in and
all the nah sayers admitted that they were wrong. The project engineer said, “Hey,
sometimes we are right,” and they were right. The center portion of the
roundabout is a truck apron and the fire trucks use the truck apron as can the
police cars operating in an emergency mode, go right over the top the roundabout.
That’s a mountable curb on the center portion of the roundabout that’s what it’s
designed for.
[Will Valenza] We haven’t had any problems maneuvering through it, the fire
department hasn’t had any problems either. We see, we see large, a large amount
of logging trucks come through here all the time. They come through here every
day. Actually it’s been, it’s a lot easier to cross now, to navigate as a pedestrian
because the crosswalks are much shorter. We’re only crossing one lane at a time
now so now there’s plenty of room for pedestrians to get through. Plenty of time
for them to get through and the most they have to get through is two lanes with a
break in between. So, so it’s been much safer for pedestrians.
[Joe Bethel] And the way the pedestrians interact with the motor vehicle traffic it
just flows all the time. My brother, in fact, does have a business here on Glens
Street and even when it was all torn up prior to them putting the roundabout in,
when there was a lot of construction and there was actually just a trench on Glens
Street there was a lot of pedestrian activity. Where people were coming downtown
to visit some of the restaurants, bars and they just wanted to see the construction
itself. So it generated a lot of activity in the essential business district even during
the preconstruction and the construction phrase.

39
[Chris Scoville] It was almost like the Civil War. I had a fellow bet me a dollar
that within a few hours of it being opened there would be an accident and I still
haven’t seen that guy he owes me a dollar and I don’t know where he is. We got a
letter one time, I won’t identify him, but there’s a business man right on this block
who would have been one of the most [venomous] opponents and a few weeks
after it opened he said to me, “I was wrong.” That he had been wrong about
thinking that it wasn’t going to work.
The authors believe that the Glens Falls roundabout and its positive impact on business as
expressed by business owners in these several interviews above, is testimony of the fact that
roundabouts are good for business.
2.6 Two Other Examples
(source MTJ Engineering, http://www.mtjengineering.com/project/state-highway-
183-and-u-s-18)
FIGURE 2.33 State Highway 83 and US 18, Waukesha County, Wisconsin

40
(source, MTJ Engineering , http://www.mtjengineering.com/project/ih-94-and-
county-highway-tt)
FIGURE 2.34 IH-94/County Highway N and County Highway TT, Dane County, Wisconsin
Figure 2.33 shows a roundabout located between two commercial malls, providing access
from a state highway. Figure 2.34 shows a project that includes two ramp terminal roundabouts
and high speed approaches for the CTH N / CTH TT roundabout. Key to this effort was
developing a design that was sensitive to ROW impacts and business access and allowing safe
residential drives to exist to ensure safety and access for all modes of transportation.
2.7 Overall Conclusions from Literature Review
The authors believe that the many reports, case studies and testimonials presented in this
literature review all point toward a conclusion that, overall, roundabouts are good for traffic flow,
access and business.
41
Chapter 3: Survey of Businesses
3.1 Introduction
At the time this project was proposed, it was the authors’ belief that a survey of
businesses would be a productive, major part of the study. In hindsight, this turned out to not be
the case. First, it was difficult to find locations where there was a roundabout corridor or a series
of roundabouts in a specific business area where the presence of the roundabouts could be
unequivocally equated to business success one way or the other. Secondly, although we did a
search and find business addresses in Kansas, where there were known roundabouts and also
sought locations around the country where there were known roundabouts, the response rate was
generally poor. In the case of only a few responses to a survey, one or two biased individuals can
slant the survey. Thirdly, in the United States we are definitely in a period of recession and as
one respondent stated, “My business is down but I attribute that more to the recession than the
roundabout.” Finally, in the case of Topeka, there was one location where construction of the
roundabouts constrained traffic flow and business access, which irritated a number of businesses
in the area and created negative publicity. Thus, the authors do not believe heavy reliance should
be made of the results of the survey either way. Another example strengthening this believe was
a follow-up that the authors did in the area of US-75 and 46th
Street—a relatively new and fast-
growing business area in Topeka—a year after the initial surveys were sent to that area—and
most of the businesses in the area were very positive in praising the roundabouts and their effect
on improving traffic flow and access. One owner even attributed the roundabout access to his
business as saving his business. (More details on this follow-up are presented to at the end of this
chapter.)
This study mainly focuses on the effects of roundabouts on nearby businesses.
Roundabouts are designs that act as an alternative to more traditional intersection controls such
as stop signs and traffic signals. There were many studies done on roundabouts as an alternative
approach to traffic signals. Excellent traffic operation and exceptional pedestrian safety has been
achieved in a business area using roundabouts (Ariniello 2004). The use of roundabouts also
minimizes many negative impacts such as costly road widening and need for expensive

42
structures. There are few, published, papers that focused on affects of roundabouts on business.
However, there are a number of case studies done on this subject (documented in Chapter 2) that
clearly indicate that the installation of roundabouts created excellent business access and
maintained and reduced negative traffic flow impacts. The authors believe that improved traffic
flow and access in a business area are good for business. Furthermore, that there is sufficient
evidence to maintain that the proper use of well-designed roundabouts will improve traffic flow
and access in business areas (evidence presented in Chapter 2). The main benefits gained from
the roundabouts are improved safety, higher traffic flows, lower accident rates, reduced travel
time, pedestrian friendly and aesthetically good area.
3.2 Methodology
The main objective of this study was to determine the after effects of roundabout
construction on nearby businesses. One method, envisioned in the beginning of the project as a
the most viable method, was a survey developed to send to the owners of specific businesses
near the roundabouts. Therefore, a survey form was designed which enquires about various
conditions after roundabout construction like traffic, traffic flow, customer vehicle access,
delivery truck vehicle access, etc. Figure 3.1 below shows the survey form that was developed
and sent to businesses near the roundabouts where the business names and addresses could be
located.

43
FIGURE 3.1 Page 1 of the Survey That Was Sent to Business Owners near Roundabouts

44
FIGURE 3.2 Page 2 of the Survey That Was Sent to Business Owners near Roundabouts
The above survey was sent to 169 local business owners near roundabouts in Carmel,
Indiana; Golden, Colorado; Indianapolis, Indiana; University Place, Washington; and Topeka,
Newton, and Junction City, Kansas. Responses were generally positive with respect to opinions
of business owners on roundabouts.

45
3.3 Survey Results
3.3.1 Topeka, Kansas
A total of 55 survey forms were distributed to 55 different businesses in Topeka, Kansas.
Thirteen survey forms were returned making the response rate for Topeka 23.6%. The new
roundabout near the businesses was described as a single roundabout in an adjoining intersection
by 84.6% of the respondents while 7.6% of the respondents said that they have several
roundabouts on the street by their business. It was indicated by 46.2% of the respondents that the
roundabout has improved the aesthetics of the street or neighborhood. However, 23.1% of the
respondents disagreed. 61.6% of the respondents answered that, overall, the roundabout(s) has
been good for traffic flow and access to street or neighborhood and 23.1% of respondents
disagreed.
Note: 1) Results based on 13 survey forms returned forms which is 23.6% response rate.
2) All graphs represent only the opinions and perceptions of respondents, who in most
cases could not be identified, and are not necessarily the actual views of customers and/or
delivery personnel. 3) Percentages calculated were based on total returned survey forms.
Therefore sum of the responses for a category might not add up to 100% if one/many of
the respondents do not respond.
FIGURE 3.3 Responses of Business Owners under Each Category (in Percentage)
The above graph (Figure 3.3) indicates that 46.2 % of the respondents think that the
traffic flow near their business is about the same and 30.8% of the respondents think that the
7.6 0 0
38.4
30.8
15.4
38.4
7.6
46.2
84.6
61.6
53.8
0
10
20
30
40
50
60
70
80
90
Traffic on Street Customer vehicles access
to business
Delivery trucks access to business
Effect on Business
more
less
same

46
traffic flow near their business is less. About 84.6 % of respondents think that there has not been
much effect of the roundabout on customer vehicle access. 61.6% of the respondents think that
the access for delivery trucks to the business remained the same after roundabout construction
and 38.4% of respondents think that delivery trucks have less access to business. About 38.4% of
the respondents feel that their business has increased because of the roundabout(s) and 53.8% of
the respondents think that there was not much (neutral) effect of roundabout on business.
Note: 1) Results based on 13 survey forms returned forms which is 23.6% response rate. 2) All
graphs represent only the opinions and perceptions of respondents, who in most cases could not be
identified, and are not necessarily the actual views of customers and/or delivery personnel.
3) Percentages calculated were based on total returned survey forms. Therefore sum of the
responses for a category might not add up to 100% if one/many of the respondents do respond.
FIGURE 3.4 Customers and Suppliers Opinions about Roundabout (in Percentage)
According to the respondents perception 38.4% of their customers don’t like the
roundabout versus 30.8% that do, with 15.4% neutral. According to the respondents perception
23.1% of their suppliers like the roundabout versus 7.6% that don’t with 53.8% neutral. (Figure
3.4)
30.8
23.1
38.4
7.6
15.4
53.8
0
10
20
30
40
50
60
Perception of customers opinion
Perception of suppliers opinion
Perc
en
tag
e
Response of business owners in Topeka, Kansas
Like
Dislike
Neutral

47
3.4 Comments by Questions: Topeka, Kansas
What is the perception regarding the overall opinion of your customers regarding the roundabout. Please share any specific comments, pro or con:
No one has ever mentioned it.
Pro: flow of traffic.
People not knowing how to drive on them.
People going too fast around them and down the ramps entering on to the
roundabouts.
Find very unnerving, especially in high volume times of day, as cars do not yield.
My patients are generally elderly.
Roundabout single lane is too narrow for emergency services fire trucks mostly
have difficulty on a single lane roundabout.
Many, especially older folks, say they hate roundabouts.
Elderly dislike but most like better flow of traffic.
If it creates a safer intersection to/from the highway then it has accomplished
something, even though access in/out of our business is more complicated.
What is the perception regarding the overall opinion of your suppliers regarding the roundabout. Please share any specific comments, pro or con:
No drivers have ever commented.
Pro—if lanes are wide enough.
I don’t know.
Semi’s take two lanes to go three. Confusing on what lane to be in. Getting
ON/OFF.
Has your opinion of roundabouts changed from the first time you heard about a roundabout going to be installed in now? How so?
Not particularly.
Roundabouts were new to the area when this one went in at 46th
and 75 Highway.
I didn’t really know anything about them. I personally like them. They keep the

48
traffic flowing and I can think of one minor wreck that’s occurred since it went in
so overall I think they are safer than stoplights or 4-way stops.
Poor city planning by closing access to our pharmacy for greater than or equal to
2 years.
Yes using roundabout took some getting used to. They work will when people
follow directions, like staying in the correct lane and not crossing over in front of
people.
Yes, better than expected.
At first, some people had difficulty figuring out the flow. After a couple months
the stopped up traffic greatly decreased and traffic flow was much better!
3.5 Additional Comments
We have a corner property with an entrance on 37th
and one on Wanamaker Road.
I notice a lot of drivers cutting through our parking lot to avoid the roundabout. It
is a daily occurrence. One time we had our parking lot barricaded off and people
still drove through the barricades and cut through and I feel like it is just to avoid
the roundabout. Never have I seen a lot of traffic backed up that would make
someone do that. I do feel like our 37th
Street entrance is too close to the
roundabout. At five o’clock traffic it does take a while to find a large enough
opening between vehicles to turn out.
Roundabout does seem to increase traffic flow. They are confusing. Big trucks
create problems for the flow of traffic. If a lot of people come from one direction
(rush hour) it is difficult to get on.
We are currently under 4 month construction for an even newer roundabout.
3.6 Newton, Kansas
A total of 17 survey forms were distributed to 17 different businesses in Newton, Kansas
to addresses that were supplied by the city engineer. Six survey forms were returned making the
response rate from Newton 35.3%. The new roundabout near the business was described as a
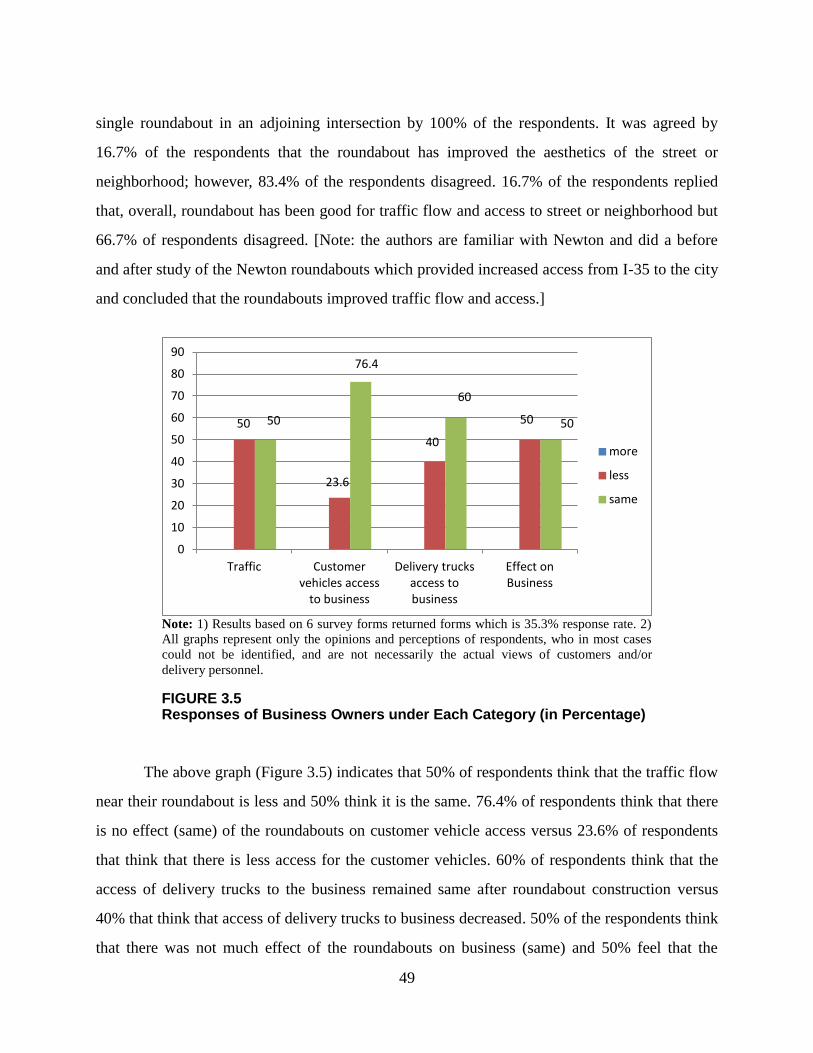
49
single roundabout in an adjoining intersection by 100% of the respondents. It was agreed by
16.7% of the respondents that the roundabout has improved the aesthetics of the street or
neighborhood; however, 83.4% of the respondents disagreed. 16.7% of the respondents replied
that, overall, roundabout has been good for traffic flow and access to street or neighborhood but
66.7% of respondents disagreed. [Note: the authors are familiar with Newton and did a before
and after study of the Newton roundabouts which provided increased access from I-35 to the city
and concluded that the roundabouts improved traffic flow and access.]
Note: 1) Results based on 6 survey forms returned forms which is 35.3% response rate. 2)
All graphs represent only the opinions and perceptions of respondents, who in most cases
could not be identified, and are not necessarily the actual views of customers and/or
delivery personnel.
FIGURE 3.5 Responses of Business Owners under Each Category (in Percentage)
The above graph (Figure 3.5) indicates that 50% of respondents think that the traffic flow
near their roundabout is less and 50% think it is the same. 76.4% of respondents think that there
is no effect (same) of the roundabouts on customer vehicle access versus 23.6% of respondents
that think that there is less access for the customer vehicles. 60% of respondents think that the
access of delivery trucks to the business remained same after roundabout construction versus
40% that think that access of delivery trucks to business decreased. 50% of the respondents think
that there was not much effect of the roundabouts on business (same) and 50% feel that the
50
23.6
40
50 50
76.4
60
50
0
10
20
30
40
50
60
70
80
90
Traffic Customer vehicles access
to business
Delivery trucks access to business
Effect on Business
more
less
same

50
business has decreased. With only two roundabouts and six responses, the authors believe no
definite conclusions can be made from the Newton responses.
Note: 1) Results based on 6 survey forms returned forms which is 35.3% response rate. 2) All
graphs represent only the opinions and perceptions of respondents, who in most cases could not be
identified, and are not necessarily the actual views of customers and/or delivery personnel.
FIGURE 3.6 Customers and Suppliers Opinions about Roundabout (in Percentage)
According to the respondents perception most of the customers (83.4%) don’t like the
roundabout versus 16.7% that do. According to the respondents perception most of the suppliers
(60%) don’t like the roundabout versus 40% that do. (Figure 3.6)
83.4
60
16.7
40
0
10
20
30
40
50
60
70
80
90
Perception of customers opinion
Perception of suppliers opinion
Perc
en
tag
e
Response of Business Owners in Newton, Kansas
Like
Dislike

51
3.6.1 Comments by Questions: Newton, Kansas
What is the perception regarding the overall opinion of your customers
regarding the roundabout? Please share any specific comments, pro or
con:
Too small for tractor trailer rigs.
Elderly visitors getting off the Interstate have a little difficulty getting off of the
roundabout.
Some confusions and trucks do not get through nearly as well.
What is the perception regarding the overall opinion of your suppliers
regarding the roundabout? Please share any specific comments, pro or
con:
Too small for my customers.
Roundabout lane is too small for trucks to maneuver through.
Has your opinion of roundabouts changed from the first time you heard
about a roundabout going to be installed in now? How so?
Saw no need for it. Confusing to the elderly beside it is sometimes dangerous
because some people don’t understand it.
Additional Comments
We got rid of a very tall and steep overpass that was quite difficult to mow and
landscape. This eliminated a lot of people feeling they were being watched from
above while at a service.
It’s been 4 years since construction and business has not returned to be the same.
It hurt our sales.

52
3.7 Junction City, Kansas
A total of 19 survey forms were distributed to 19 different businesses in Junction City,
Kansas. Two survey forms were returned making the response rate from Junction City as 10.5%.
This number is too small to make any conclusions. It is included here just for an interesting
observation; that is, each respondent canceled the other out. This is not unusual when it comes to
roundabout opinion as the subject still tends to polarize public opinion. The new roundabout near
the business was described as a single roundabout in an adjoining intersection by one respondent
and the other respondent replied that that they have several roundabouts on the street by their
business.. It was responded by one respondent that overall, roundabout has been good for traffic
flow and access to street or neighborhood and the other respondent disagreed.
Note: 1) Results based on 2 survey forms returned forms which is 10.5% response rate. 2) All
graphs represent only the opinions and perceptions of respondents, who in most cases could not be
identified, and are not necessarily the actual views of customers and/or delivery personnel.
FIGURE 3.7 Responses of Business Owners under Each Category (in Percentage)
The above graph indicates that about 50% of respondents (one) think that the traffic flow
near their roundabout is less and the remaining 50% (one) thinks that the traffic flow near their
50 50 50 50
0
10
20
30
40
50
60
Traffic on Street Customer vehicles access to business
Delivery trucks access to business
Effect on Business
more
less
same

53
roundabout is the same. [Note: From observation of the numbers of vehicles in the parking lot of
a service station near the roundabout before and after the roundabout, the authors subjective
perception is that there was more traffic and business after than before. One member of the
research team interviewed a truck driver that had just stopped at a local service station after
passing through the roundabout. He said that if drivers had trouble negotiating a roundabout,
they should not be driving. He was also unaware that the roundabout that he had used was called
a roundabout]
Note: 1) Results based on 2 survey forms returned forms which is 10.5% response rate. 2) All graphs
represent only the opinions and perceptions of respondents, who in most cases could not be identified,
and are not necessarily the actual views of customers and/or delivery personnel.
FIGURE 3.8 Customers and Suppliers Opinions about Roundabout (in Percentage)
According to the respondents’ perception, 50% (one) of the respondents like the
roundabout 50% (one) don’t like it. According to the respondents perception, 50% of the
suppliers (one) don’t like the roundabout 50% (one) is neutral (Figure 3.8).
No additional comments were provided.
0
50
0
10
20
30
40
50
60
Perception of custmers opinion
Perception of suppliers opinion
Perc
en
tag
e
Response Of Business Owners in Junction City, Kansas
Like
Dislike
Neutral

54
With only two responses, no conclusions can be made. It does show, however, that small
samples can be biased. It does show that opinions of roundabouts can be polarized. The authors
believe there will always be a small minority that do not like roundabouts no matter how much
evidence there is that they are safer and more efficient and improve traffic flows. The authors
also believe that if the roundabouts were really hurting business there would likely have been a
greater response as owners would have seized the opportunity to complain.
3.8 Carmel, Indiana
A total of 51 survey forms were distributed to 51 different businesses in Carmel, Indiana,
to addresses supplied by the city engineer. Fourteen survey forms were returned making the
response rate from Carmel as 27.4%. The new roundabout near the business was described as a
single roundabout in an adjoining intersection by 33.4% of the respondents, roundabouts in front
of their business where they have a drive directly on the roundabout by 6.7% of the respondents,
and 46.7% of the respondents said that they have several roundabouts on the street by their
business. It was agreed by 100% of the respondents that the roundabouts have improved the
aesthetics of the street or neighborhood. 85.7% of the respondents responded that, roundabouts
have been good for traffic flow and access to the street or neighborhood and 14.3% of the
respondents disagreed.

55
Note: 1) Results based on 14 survey forms returned forms which is 27.4% response rate. 2) All
graphs represent only the opinions and perceptions of respondents, who in most cases could not be
identified, and are not necessarily the actual views of customers and/or delivery personnel.
3) Percentages calculated were based on total returned survey forms. Therefore sum of the
responses for a category might not add up to 100% if one/many of the respondents do respond.
FIGURE 3.9 Responses of Business Owners under Each Category (in Percentage)
The above graph (Figure 3.9) shows that 42.9% of the respondents think that the traffic
near their roundabout is more, versus 14.3 that think it is less, and 42.8 think it is the same.
57.1% of respondents perceive that there is no effect (same) of roundabouts on customer vehicle
access, versus 28.6% of respondents perceiving that it is more, and 14.3 perceiving it is less.
78.6% of respondents perceive that the access of delivery trucks to business remained the same
after roundabout construction, versus 4.3 who perceived it is less and 7.1 who perceived it is
more. 78.6% of respondents responded that business is the same after roundabout construction
versus 21.4 that responded it is less.
42.9
28.6
7.1
0
14.3 14.3
4.3
21.4
42.8
57.1
78.6 78.6
0
10
20
30
40
50
60
70
80
90
Traffic Customer vehicles access to business
Delivery trucks access to business
Effect on Business
more
less
same

56
Note: 1) Results based on 14 survey forms returned forms which is 27.4% response rate. 2) All graphs
represent only the opinions and perceptions of respondents, who in most cases could not be identified,
and are not necessarily the actual views of customers and/or delivery personnel.
FIGURE 3.10 Customers and Suppliers Opinions about Roundabout (in Percentage)
According to the respondent’s perception 71.4% of their customers like the roundabout
versus 7.1 % that do not and 21.5% are neutral. According to the respondent’s perception 30.8%
of the suppliers (30.8%) like the roundabout versus 23.1 % who do not and 46.1 are neutral.
(Figure 3.10).
71.4
30.8
7.1
23.1 21.5
46.1
0
10
20
30
40
50
60
70
80
Perception of customers opinion
Perception of suppliers opinion
Perc
en
tag
e
Response Of Business Owners in Carmel, Indiana
Like
Dislike
Neutral

57
3.8.1 Comments by Questions: Carmel, Indiana
What is the perception regarding the overall opinion of your customers
regarding the roundabout? Please share any specific comments, pro or
con:
I have lived in Carmel for the past 15 years for a total of 24 years. The roundabout
has dramatically improved traffic flow. As residents learn more about how to use
them flow will continue to improve.
Locals prefer roundabouts. Patients from out of town get confused.
Most people enjoy them, however, our city (Carmel, Indiana) has a lot of
roundabouts. We tend to make fun of them for that reason. But it has definitely
improved traffic flow.
But hard to leave property from 7:15am to 8:30am and 4:30pm to 6:30pm.
Con—too sharp of turns and not enough clarity with directions during turns.
Disruption during construction—chief complaint.
What is the perception regarding the overall opinion of your suppliers
regarding the roundabout? Please share any specific comments, pro or
con:
Most suppliers like them but they do get lost or “turned round” sometimes.
Access to the building is more difficult.
Visibility of signage and building appliances are somewhat observed by the
roundabout and flow of traffic.
Has your opinion of roundabouts changed from the first time you heard
about a roundabout going to be installed in now? How so?
Yes it is effective. I didn’t think people would be able to follow directions.
It takes time for people to understand how they work.
Don’t stop.

58
Look to the left (not right—no traffic coming).
Proceed if clear, yield to oncoming traffic.
They work even better than I thought they would.
I was happy to have a roundabout and still am.
No Expectations.
Excited, but now understanding of roundabout and directions are not good with
drivers.
Liked the concept from the beginning.
Don’t like at all.
Concerns about improper maneuvering in roundabout area did not pan out at level
anticipated.
Additional Comments:
The landscape at the roundabout is terrible. I have seen others that have pretty
flowers and plants. This one books like weeds. Half the time, the lights are not
working and become difficult to go around the circle.
Once neighboring roundabouts open, east–west traffic should die down making
exiting from property easier. Very difficult getting out at rush hour.
3.9 Conclusions from Survey
After analysis of survey responses it can be concluded that the opinion of business
owners differs with location of roundabout. The survey analysis at different places showed
different trends with respect to the traffic, traffic flow, customer vehicle access, delivery trucks
access to business, perceived opinions of suppliers and customers.
There were mixed feelings amongst respondents regarding the existence of roundabouts.
Roundabouts are relatively new in the USA and in some areas, usually when they first appear, it
tends to be a polarizing topic, i.e. strong advocates on one side and strong opponents on the other
that “just don’t like them”. The proponents have the facts: roundabouts are safer than traditional
intersection control, they are more efficient, they are more environmentally friendly, more

59
aesthetic, and usually more cost-effective than signals on a life-cycle basis. In the authors’
opinion, more public education to these facts and more exposure to roundabouts should increase
their acceptance in the future. However, at present, as can be seen in the survey, views vary from
wide acceptance to non acceptance. Acceptance seems to increase as the number of roundabout
installations in an area increase and the length of time residents have been exposed to them. For
example, Newton has only two, and although a previous before/after Kansas State University
study of these two concluded they improved access to the city from I-135, the surveys suggest
otherwise. On the other end, Carmel, Indiana, started building roundabouts in the late 90s; today,
the city has close to 70 roundabouts. The survey from responses from Carmel were generally
positive; many very positive, with the negative comments being about relatively minor
inconveniences or non operational issues. However even in Carmel, it can be seen that there is a
minority that is negative toward roundabouts, and the authors believe there probably always will
be a minority segment in any area that will not embrace roundabouts for any number of reasons
not based on their proven benefits. From the survey responses, some think that presence of
roundabout in a location arises confusion amongst elderly, and is sometimes dangerous if people
don’t understand them, while most of the respondents encourage the construction of roundabouts
since they understand that roundabouts reduce conflict points and crashes (-40% overall, -76%
injury crashes and -90% fatal crashes is now generally accepted) and improve traffic flows
(KSU/K-TRAN studies have shown roundabouts reduce stopping, queuing, delays, etc., 50% to
90%) Survey responses clearly indicate that businesses may not have felt access had been
improved, but they were generally not negative. There were some cases, where losses were
reported after implementing roundabouts, which can be attributed more to the current global
economic recession problems. Also, there are so many factors in business success; it became
apparent to the authors as the study progressed that it would be very difficult to be certain that
the few roundabouts in the business areas studied directly related to either business increase or
decrease. Also, the authors feel that irritation over what was perceived as obstructed access
during roundabout construction, and the publicity if generated in the Topeka media, biased some
of the responses. The area of rapidly expanding businesses around US-75 and 46th
Street in north

60
Topeka is an exception where a follow up with personal interviews found that businesses were
very positive about three roundabouts in the area (details below in another section of this report).
Survey results report that elderly visitors face problems getting off the roundabouts. It is
assumed that these visitors are from areas with no roundabouts. It is assumed that not being
familiar with them, and not age, per se, is the reason some may have some problems. Some
respondents think that roundabout lanes are too narrow to accommodate small trucks to
maneuver through, which is an important aspect that requires some kind of study about ideal
width and dimensions in a roundabout. Since there have been improvements in roundabout
design and signage, the percentage of positive responses of business owners should improve in
the future.
The overall feeling of business owners on the roundabouts near their place is more
positive than negative. If one considers the ‘neutral” response as a positive, i.e., a neutral
response means that roundabouts had no negative effect, then the overall could be construed as
very positive. The same with traffic flow, i.e. a “same” could be considered positive in that
roundabouts did not decrease traffic flow or access. This is a “myth” one could hear frequently in
the early years of roundabouts, i.e. if a roundabout is built on a street, drivers will find another
route to avoid the roundabout. There is and never was any real evidence to support this,
including this study.
Businesses’ opinion of the effect of roundabouts on traffic in Topeka had indicated that
the sum of the “more” and the “same” outnumber the opinion that traffic is “less” by 53.8%
versus 30.8%. Though it is reported that the access to delivery trucks and customers is less or
same as before a roundabout construction, it is found that the business has been improved 38. 4%
“more” and only 7.6% “less” with 53.8% remaining the “same”.
Businesses’ opinion of the roundabouts in Newton, Kansas indicates that the traffic is less
on their street (50% of respondents) but 50% indicated it was the same. It has been found that the
perceived access to customers and suppliers is either less or the same and that business has not
increased. With the small size of the sample, firm conclusions should not be made. Also, the fact
that half reported less traffic and half reported the same (the authors believe the response is based
61
on the same traffic location) points out a weakness of surveys in general that responses are
perceptions that can differ among responders.
The results for Junction City, Kansas were summarized based on only two returned
survey forms which is not a significant number of returned survey forms to make a
reliable conclusion. The results are included to make the point that in small responses to the
survey can show widely varying opinions about roundabouts.
FIGURE 3.11 Business Owners Responses (in Percentage) Regarding the Overall Feeling of the Roundabout Added to Their Street or Neighborhood
Businesses opinion of the roundabout in Carmel, Indiana: 89.7% indicated that the traffic
is more or the same on their street (42.9% more, 46.8% same) which means only 10.3% felt it
had decreased. Respondents also reported access to the delivery trucks and customer vehicles has
increased. Although no increase in the business was reported, 78.6% of the businesses reported
the same and only 21.4% of respondents) reported a decrease, which could have resulted from
the state of the economy the past couple of years during this study. From the perspective of
perceived customers’ opinion, only 7.1% disliked the roundabouts. From the perspective of

62
perceived suppliers’ opinion, only 23.1% of the respondents indicated they didn’t like the
roundabout. Again, these numbers reflect the perceptions of the respondents and not results of an
actual customer or supplier survey, but they have a positive indication.
Figure 3.11 above illustrates the business owners’ overall feeling of the roundabout added
to their street or neighbourhood. It can be observed that most of the business owners (61.5% of
respondents) in Topeka felt very good or good about the roundabout added to their street or
neighborhood. It can be observed that half of the business owners (50% of respondents) in
Newton felt negatively toward the roundabout added to their street or neighborhood. About 50%
of the respondents from Junction City felt very good for the roundabout added to their street or
neighborhood and the remaining 50% of respondents felt bad. About 35.7% of the respondents
from Carmel felt the roundabout was an excellent addition to their street or neighborhood and
35.7% of respondents felt very good, i.e., 71.4% felt excellent or very good about the
roundabouts on their streets.
3.10 Follow-up Survey and Analysis on 46th Street, Topeka
During the time this research project was underway, Shawnee County, Kansas, initiated a
project to build two roundabouts on Northwest 46th
Street. This location is between 300 and 500
feet east of a roundabout that the Kansas Department of Transportation built in connection with
an interchange on US-75 at its junction with Northwest 46th
Street. This is a rapidly developing
area just north of Topeka. There are a number of businesses, including service, financial and
other activities very near the original roundabout. It was recognized by both the business
community and government officials that the traffic volumes that were occurring on 46th
Street
were reducing the access of the adjacent businesses. People were already having trouble making
left turns into and out of the businesses, particularly during the morning and evening peaks. One
of the general benefits of roundabouts is that they effectively eliminate most left turn conflicts.
A questionnaire was sent to each of the businesses in the immediate area before the
researchers were aware that the construction of the additional roundabouts was so imminent. The
responses to the questionnaire were varied and no conclusions could be drawn from the
responses. The two new roundabouts have been open for approximately one year and personal

63
interviews by the authors were made with four key businesses in the immediate area of the
roundabout. All four businesses have direct access from the west of the two new roundabouts.
The owner of the first business interviewed indicated that the additional roundabouts had
saved his business. The traffic coming off of US-75 and through the original roundabout
provided a continuous flow of vehicles that did not allow for left-turning vehicles to enter or
leave his business. He operated a service station and convenience store on the south side of 46th
Street, next to the original roundabout. He was very pleased with the addition of the roundabouts.
A second business interviewed was a credit union that was about 100 yards north of the
new roundabout. The regional manager indicated no problems had been mentioned by staff or
customers since the opening of the roundabout. She did say that she or her staff had observed one
vehicle going around that roundabout in the wrong direction and had almost caused a crash. It
didn’t appear that the construction had had any effect on business.
The third interview was a branch location of a financial business that has other branches
in Topeka and other cities in Eastern Kansas. The branch manager was very knowledgeable of
the operation of all the roundabouts in Topeka, Lawrence, and Emporia and made very specific
comments about the construction and operation of the subject roundabouts. She said that they
had had a considerable number of customers move to other branches during construction and that
they were now just about getting back to where they were before the construction began. She
was very critical of the amount of time it took to construct the roundabouts. She said that there
were many days that contractor was not around. She said that she personally liked the
roundabout but that the disruption during construction gave roundabouts a bad name, particularly
with the business community. She also added that the landscaping that was just now going on
was very attractive and added to the visual aspects of the area and her business.
The fourth interview was with the owner of the McDonalds restaurant which has access
from the west roundabout. Again, he was also very critical of the amount of time it took to
construct the two roundabouts. He believed that three months would have been a much more
reasonable time to complete construction as compared to eight months. He indicated that he lost
$150,000 since the construction started as compared to the previous year. He also indicated that
just recently he had seen his business coming back to near what it had been before construction.

64
It was his opinion that Topeka and Shawnee County never got ahead on their construction. Roads
were never widened or roundabouts built until the facility was at or about capacity. Then any
construction caused a major disruption of traffic and business.
It should be noted that the floor manager in the restaurant called roundabouts a bunch of
“crap” and said that she did not like roundabouts anywhere. With the exception of the floor
manager, each person interviewed was impressed with the operation of the roundabouts since
that have been open for traffic. They said that they had never seen any problems for semis in the
area nor had any of the drivers that brought products to their business complained. Only one
small crash was noticed. However, several noticed that vehicles coming from the south at the
west roundabout would cut across in the wrong direction to go west if there were no other
vehicles around.
In summary, all but one of the interviewees spoke favorably about the operation of the
roundabouts at this fast growing business location but all had serious complaints about various
aspects of the construction, which, in the authors’ opinion, could have detracted from the
roundabout’s favorability.
During the course of this study there was also negative publicity which made the local
newspapers regarding businesses being inconvenienced by reduced access during what they felt
was excessive roundabout construction time. The authors have no opinion on the timeliness of
roundabout construction; however, the negative newspaper publicity certainly could have had a
negative influence on the feelings of businesses towards roundabouts in general.

65
Chapter 4: Roundabout Business Corridor
4.1 Introduction
The purpose of the analysis in this chapter is to compare the travel along a corridor with
intersections that are controlled by signals to travel along the same corridor when these same
signalized intersections are replaced with roundabouts. This analysis follows the authors’ belief
(supported) by the views of other experts as expressed in the review of literature) that improved
traffic flow and access are good for business. However, this analysis should not be considered a
recommendation that roundabouts should be constructed along this corridor. There has been no
study of the space needed to place adequate roundabouts at these intersections. Further study
would be needed.
While reviewing the effects of roundabouts that were already built in commercial
corridors, the authors received a document, “Are Roundabouts Good for Business?” by Alex J.
Ariniello, LSC Transportation Consultants, Inc. This report documented the results of the
construction of four roundabouts along a commercial corridor in Golden, Colorado. While the
businesses along this corridor were skeptical about the constructions of the roundabouts, the
continued growth along the corridor would suggest that the roundabouts are good for business.
An aerial photo of the corridor, as well as other information can be found in Chapter 2.
Some of the Golden study findings were that the accident rate decreased by 88% and
injury rate decreased by 93%. Although the 85th
percentile mid-block speed decreased from 47 to
33 mph, the average time to travel through the corridor was reduced from 78 to 68 seconds.
Because of similarities, it was decided to study the Wanamaker corridor in Topeka, Kansas.
Although Golden is much smaller than Topeka, many of the development patterns, particularly in
the two corridors, are similar. Although population of the City of Golden is smaller, it is a part of
the Denver Metropolitan Area. The Wanamaker corridor is highly developed with several
signalized intersections of Wanamaker with other arterials and numerous un-signalized
intersections of Wanamaker with local streets and entrances to businesses.
Since a “before and after” study could not be done, the “after” condition was simulated
with several software packages that are available to transportation planning professionals.

66
1. QRSII is a network traffic assignment model with numerous options that can be
adapted to several modes as well as roadway and intersection configurations.
2. SIDRA is described as a micro-simulation model used to analyze complex traffic
problems in urban areas. It models traffic patterns for a single intersection which
can have several types of designs (i.e. signalized, four-way stop, roundabout, two-
way stop, etc.).
3. VISSIM is a highly realistic microscopic simulation program that allows
transportation professionals to simulate and visualize different traffic scenarios
before starting implementation.
FIGURE 4.1 Wanamaker Corridor, Topeka, Kansas

67
Each of the first two models was used for analyzing all or part of the traffic patterns
found in the corridor. VISSIM was used to provide a visual comparison of the current design
configuration of intersections within the corridor with these intersections being treated as
roundabouts. Neither the detailed design geometric data nor the turning movements for every
intersection along the corridor were collected for this analysis.
The Wanamaker Corridor, Figure 4.1 is a highly developed commercial corridor in the
western part of Topeka. Although the actual corridor is much longer, the portion used in this
study extended from a business entrance north of 12th
Street near the top of the photo to the south
to include the intersection of 19th
Street and Wanamaker. There are numerous business entrances
along the corridor that are controlled by stop signs. The intersections at Huntoon, the on-ramp to
I-470, 17th
Street, a business entrance at the northeast corner of the West Ridge Mall and 19th
Street are controlled by traffic-actuated signals. For the purpose of this research each of the
signalized intersections were replaced with a roundabout for the “after” condition. All of the
business entrances controlled by stop signs were assumed to be right turn only.
Traffic counts and turning movements were obtained from the city’s traffic engineer
department for two one-hour periods at the signalized intersections. The 11:30 to 12:30 counts
were used because this tends to be a commercial corridor rather that a commuter corridor.
Estimates were made for all of the other entrances to Wanamaker throughout the corridor. The
program QRS II has the capability of generating a vehicle trip table using an initial matrix of all
ones. The program iterates until the assigned traffic matches the counts on the various links. The
resulting trip table was used to provide turning movements at all intersections for these analyses.
It was assumed that the travel patterns will be the same for both the current layout of signals and
stop signs and the roundabouts and right turn only entrances. In other words, the trips that are not
allowed to make left turns will proceed to the next roundabout, make a U-turn and make a right
turn into the entrance that they previously used.
4.2 QRSII Analysis
Following the development of the trip table to obtain turning movements at each
intersection, the resulting trip table was assigned to the current intersection configuration and a
68
network with roundabouts at each intersection that was signalized. Figures 4.2 and 4.3 show
these two alternates. The additional links to the west (left) of Wanamaker on each network were
added to accommodate left turns that were prohibited at the entrances to the respective
businesses. These links represent available internal roads in the parking lots.
A functional class was assigned to each link to provide a comparison to the speeds (level
of service) for two configurations.
The functional classification used for this analysis is as follows:
Freeway: On- and Off-Ramps from I-470
Major: Wanamaker
Minor: Cross streets where roundabouts were placed
Collector: Other City Streets
Local: Business Entrances

69
FIGURE 4.2 Current Network Configuration
FIGURE 4.3 Roundabout Configuration
The philosophy used to develop this comparison is to eliminate left turns onto and off of
Wanamaker at all business entrances. This is not practical with the current configuration.
Eliminating about half of the access for businesses would be harmful to these businesses and
would undoubtedly create a political firestorm. However, because of the almost unlimited access,

70
the level of service for the vehicles traveling on Wanamaker and those accessing Wanamaker
from cross streets is dramatically reduced. The roundabouts that replace the signalized
intersections allow access to all businesses for vehicles by continuing to the next roundabout to
make a U-turn and then continue back to make a right turn into the business’ parking area. When
entering Wanamaker, the vehicles enter to the right and proceed to the next roundabout and make
a U-turn.
Figure 4.4 Average Speed Comparison, shows the average network speed for three of the
functional classes used for both networks. The freeway and local roadway classes are not shown
in the comparison.
FIGURE 4.4 Average Speed Comparison
The freeway speed would be heavily weighted by the on-ramp speed which as really not
a part of the analysis. Locals were not included since they were heavily weighted by the internal
parking lot sections. As can be seen in Figure 4.4, the average speeds for the current design of
Wanamaker for both the Major and Minors Arterials were approximately one-half of what they
would be if a left turns were eliminated and the signalized intersections were replaced with
roundabouts.
0.0
5.0
10.0
15.0
20.0
25.0
30.0
Major Minor Collector
Functional Class
Ave. Speed Comparison
RA
Curr.
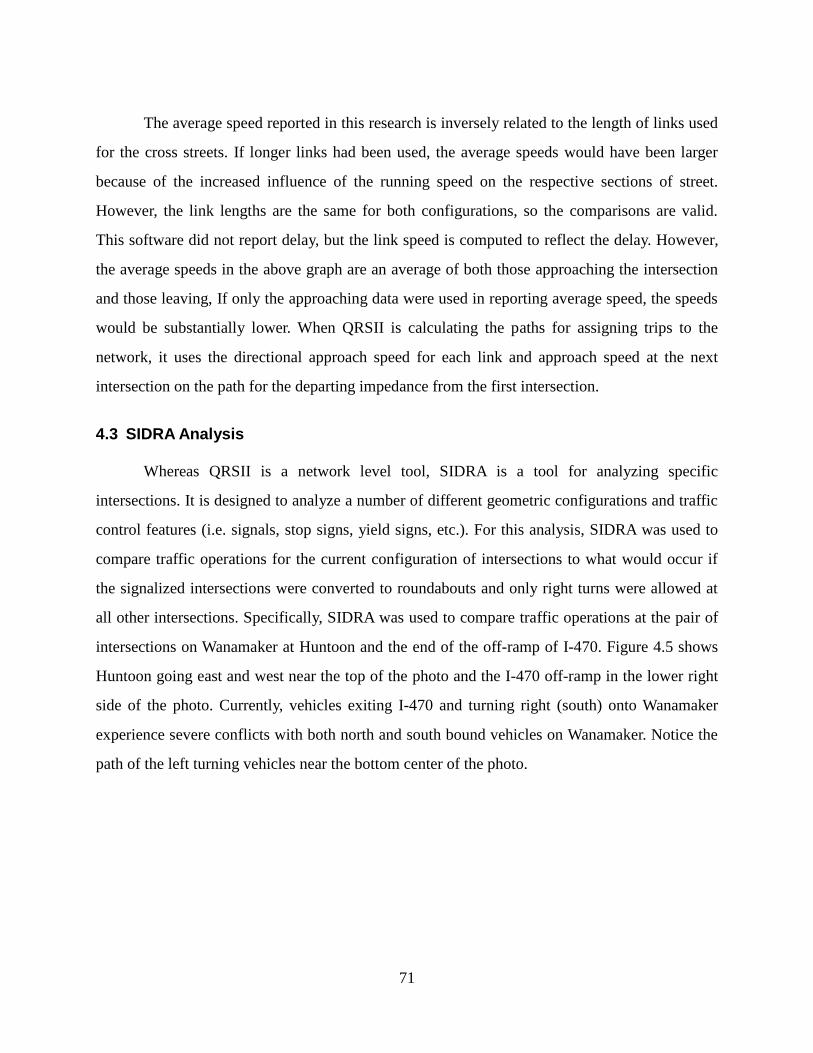
71
The average speed reported in this research is inversely related to the length of links used
for the cross streets. If longer links had been used, the average speeds would have been larger
because of the increased influence of the running speed on the respective sections of street.
However, the link lengths are the same for both configurations, so the comparisons are valid.
This software did not report delay, but the link speed is computed to reflect the delay. However,
the average speeds in the above graph are an average of both those approaching the intersection
and those leaving, If only the approaching data were used in reporting average speed, the speeds
would be substantially lower. When QRSII is calculating the paths for assigning trips to the
network, it uses the directional approach speed for each link and approach speed at the next
intersection on the path for the departing impedance from the first intersection.
4.3 SIDRA Analysis
Whereas QRSII is a network level tool, SIDRA is a tool for analyzing specific
intersections. It is designed to analyze a number of different geometric configurations and traffic
control features (i.e. signals, stop signs, yield signs, etc.). For this analysis, SIDRA was used to
compare traffic operations for the current configuration of intersections to what would occur if
the signalized intersections were converted to roundabouts and only right turns were allowed at
all other intersections. Specifically, SIDRA was used to compare traffic operations at the pair of
intersections on Wanamaker at Huntoon and the end of the off-ramp of I-470. Figure 4.5 shows
Huntoon going east and west near the top of the photo and the I-470 off-ramp in the lower right
side of the photo. Currently, vehicles exiting I-470 and turning right (south) onto Wanamaker
experience severe conflicts with both north and south bound vehicles on Wanamaker. Notice the
path of the left turning vehicles near the bottom center of the photo.

72
FIGURE 4.5 Wanamaker, Huntoon to I-470 Off-Ramp
If a roundabout replaced the existing intersection at Huntoon, the left turns off of I-470
would make a right turn, travel up the photo (north), make a U-turn at Huntoon and then proceed
south on Wanamaker.

73
The following figures and accompanying explanations compare economic and
environmental measures for the current configuration, and if a roundabout were built in place of
the signalized intersection at Wanamaker and Huntoon. The first pair of Figures 4.6a and 4.6b
shows the hourly traffic at the Huntoon and I-470 off-ramp along Wanamaker.
4.4 Traffic Volume and Turning Movements, Hourly
FIGURE 4.6a Huntoon, Current Intersection
FIGURE 4.6b Huntoon, Hypothetical Roundabout
Notice that all the approach volumes and turning movements are the same or essentially
the same, except the south approach. The 174 vehicles shown as making a U-turn in the south
approach of the Roundabout are the vehicles that were making a left turn from the I-470 ramp. If
a decision were made to prevent left turning vehicles from the west side of Wanamaker, wanting
to go north, there would also be vehicles making U-turns around the north leg of a roundabout at
Huntoon.

74
Figures 4.6.c and 4.6 d show the hourly traffic at the I-470 Exit Ramp.
FIGURE 4.6c I-470, Current Intersection
FIGURE 4.6d I-470 with Huntoon, Hypothetical Roundabout
The approach traffic on each leg is the same. However, all of the traffic coming off of I-
470 in Figure 4.6b, must turn right. The left turning vehicles in the current intersection are the
175 vehicles making a U-turn in the south approach of the Huntoon intersection in the previous
figure.
The next set of four figures, 4.7a, 4.7b, 4,7d and 4.7e, show the average delay per vehicle
during the peak hour for each movement for each approach for the traffic shown in the four
previous figures.

75
4.5 Average Delay per Vehicle
FIGURE 4.7a Huntoon, Current Intersection
FIGURE 4.7b Huntoon, Hypothetical Roundabout
The numbers on each approach are the average delay per vehicle and the color of the
respective arrow is the level of service for that approach. It can be seen that the delay on each
movement if less for the roundabout, with the left turns being significantly less. This is also true
for the south leg of the roundabout even though the approach volume is 175 vehicles greater.
Even though vehicles will travel faster when entering and passing through a signalized
intersection than a roundabout when the light is green the wait-time for the signal to turn green
reduces the overall average speed. SIDRA, the program used in this analysis, indicated that the
optimal cycle time is 108 seconds. SIDRA also shows that approximately 20 % of the left turning
vehicles in the two approaches on Wanamaker have to sit through one entire cycle. In other
words, the left turning vehicles cannot clear the intersection in the first cycle. This points out
why the arrow representing the left turns are red, indicating a level of service (LOC) of “F”. It
should be noted that in previous research by Russell, et al, for any given level of traffic,
roundabout movements generally operated at a minimum one level of service higher than
comparable movements at signals (Russell, Mandavelli and Rys 2004).

76
FIGURE 4.7c I-470, Current Intersection
FIGURE 4.7d I-470 with Huntoon, Hypothetical Roundabout
FIGURE 4.8 Key to LOS Colors on Figures.
The above figures, 4.7a,b,c, and d, show the differences in delay time for the I-470 off-
ramp that occurs when a roundabout is assumed constructed at Huntoon and the left turning
vehicles shown in the left figure are diverted to the right-turn lane and make a U-turn at
Huntoon. A delay of over 1,000 seconds really indicates an intolerable condition. Part of the
reason for this delay is that the queue of south bound vehicles from the signal at the I-470 on-
ramp (just south of the photo in Figure 4.5) blocks the left turn opportunities as well as the north
bound Wanamaker queue backing up from the Huntoon intersection. When comparing the flow
and the delay on the off-ramp, it can be seen that the delay is actually less for the right-turning
vehicles even though their number has about doubled.

77
4.6 Total Vehicle Operating and Time Cost
FIGURE 4.9a Huntoon, Current Intersection
FIGURE 4.9b Huntoon, Hypothetical Roundabout
The hourly cost in dollars per hour for each movement for each intersection configuration
is shown in the above figures. The costs for all movements, except the left turns, are substantially
the same, with the signalized option being slightly higher. The delay experienced by left turning
vehicles, except for the EB Huntoon left turn, causes the operating and time cost to the
substantially higher for the signalized option.

78
FIGURE 4.9c I-470, Current Intersection
FIGURE 4.9.d I-470 with Huntoon, Hypothetical Roundabout
Again, as with delay, the major difference in cost is elimination of the left turn. Due to
the additional right turns, the operating costs increase from $28 to $56.2 per hour and the SB
Wanamaker increases from $84.4 to $94 per hour. However the sum of the increases for these
two movements is far less than the $558 per hour that is eliminated with removing the left turn at
the end of the I-470 off-ramp.

79
4.7 Total Carbon Dioxide (CO2) Emissions, Kilograms per Hour
The CO2 emissions are substantially the same, whether the intersection is signalized or
replaced with a roundabout. (Since an actual traffic classification was not available, SIDRA
defaults were used, which take into account for greater emissions from an average mix of
vehicles accelerating from a stop, including large trucks.) The through movements are slightly
better for the signalized intersection and the turning movements are slightly better for the
roundabout.
FIGURE 4.10a Huntoon, Current Intersection
FIGURE 4.10b Huntoon, Hypothetical Roundabout
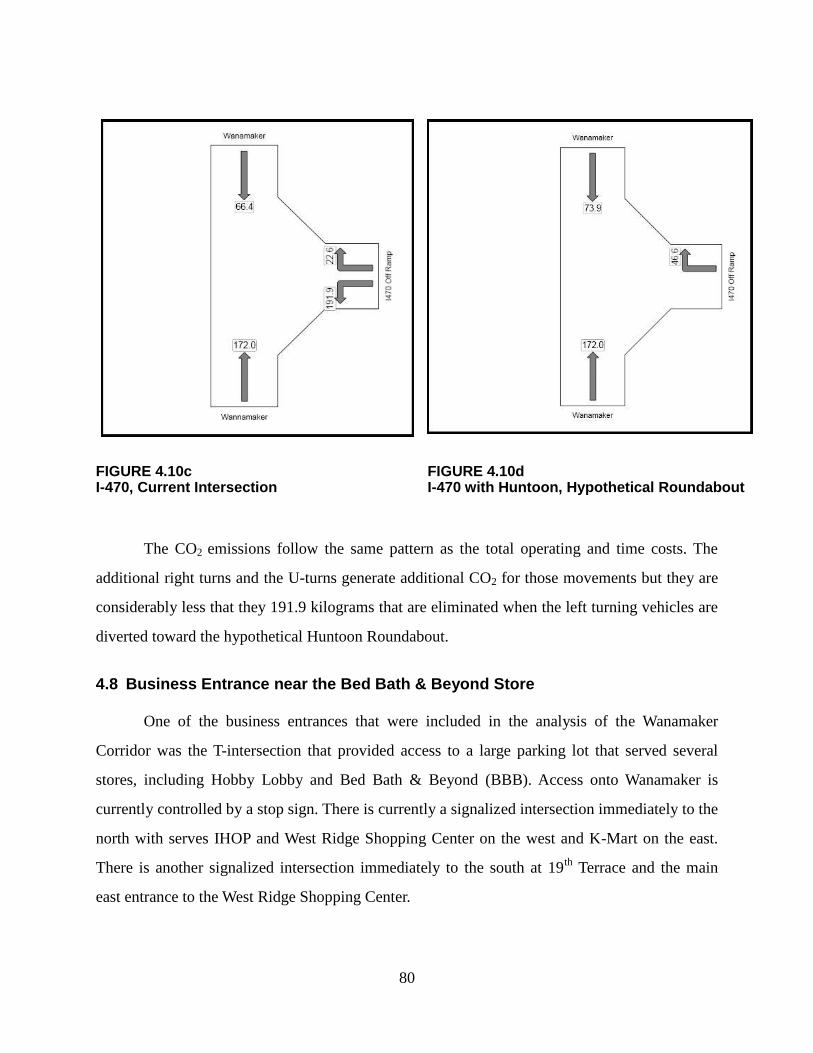
80
The CO2 emissions follow the same pattern as the total operating and time costs. The
additional right turns and the U-turns generate additional CO2 for those movements but they are
considerably less that they 191.9 kilograms that are eliminated when the left turning vehicles are
diverted toward the hypothetical Huntoon Roundabout.
4.8 Business Entrance near the Bed Bath & Beyond Store
One of the business entrances that were included in the analysis of the Wanamaker
Corridor was the T-intersection that provided access to a large parking lot that served several
stores, including Hobby Lobby and Bed Bath & Beyond (BBB). Access onto Wanamaker is
currently controlled by a stop sign. There is currently a signalized intersection immediately to the
north with serves IHOP and West Ridge Shopping Center on the west and K-Mart on the east.
There is another signalized intersection immediately to the south at 19th
Terrace and the main
east entrance to the West Ridge Shopping Center.
FIGURE 4.10c I-470, Current Intersection
FIGURE 4.10d I-470 with Huntoon, Hypothetical Roundabout
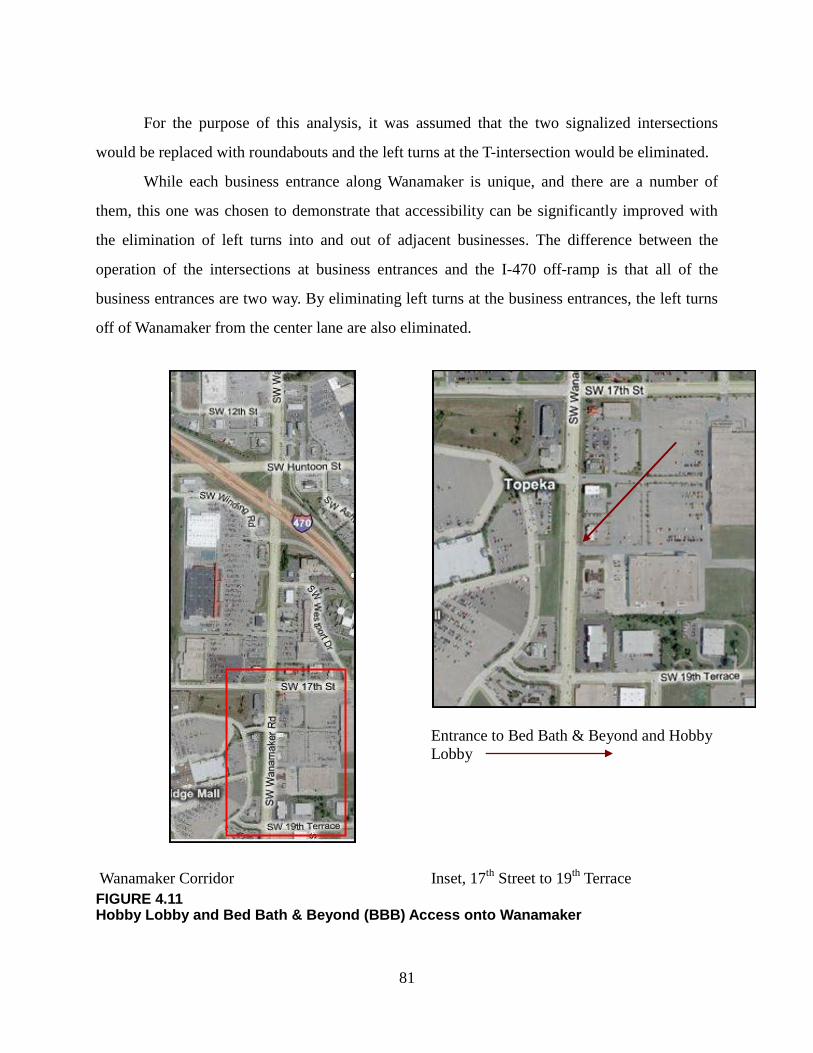
81
For the purpose of this analysis, it was assumed that the two signalized intersections
would be replaced with roundabouts and the left turns at the T-intersection would be eliminated.
While each business entrance along Wanamaker is unique, and there are a number of
them, this one was chosen to demonstrate that accessibility can be significantly improved with
the elimination of left turns into and out of adjacent businesses. The difference between the
operation of the intersections at business entrances and the I-470 off-ramp is that all of the
business entrances are two way. By eliminating left turns at the business entrances, the left turns
off of Wanamaker from the center lane are also eliminated.
Entrance to Bed Bath & Beyond and Hobby
Lobby
Wanamaker Corridor Inset, 17th
Street to 19th
Terrace
FIGURE 4.11 Hobby Lobby and Bed Bath & Beyond (BBB) Access onto Wanamaker
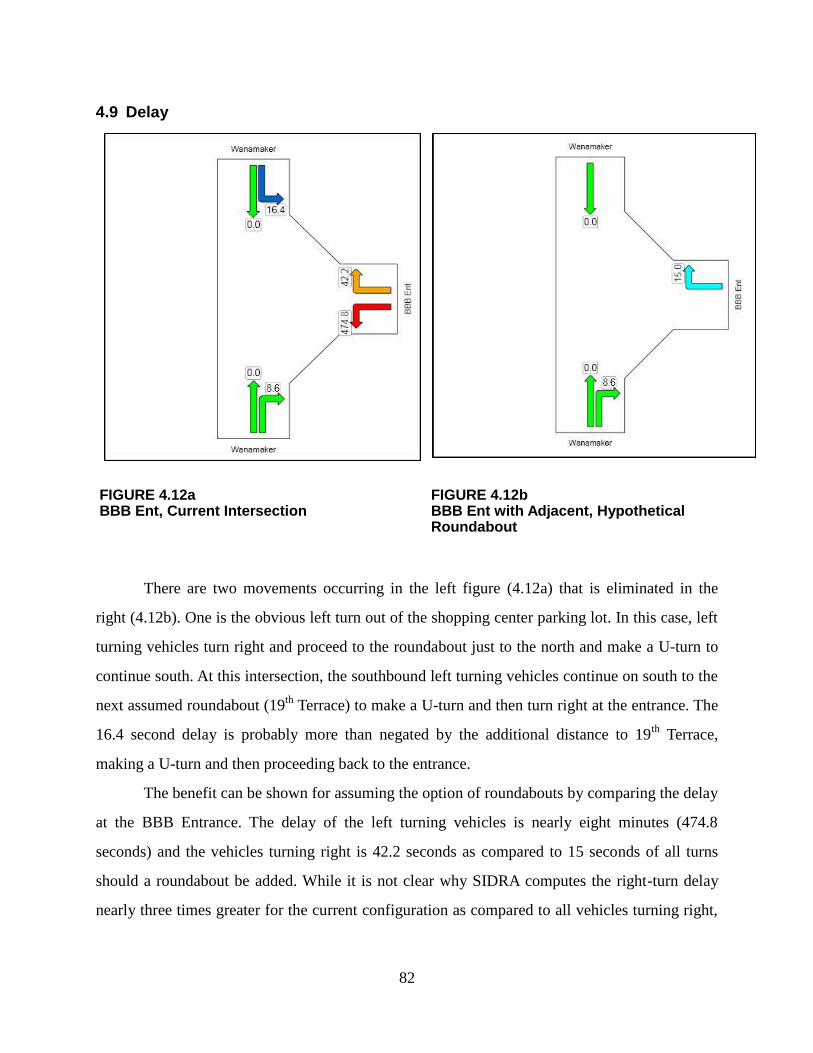
82
4.9 Delay
FIGURE 4.12a BBB Ent, Current Intersection
FIGURE 4.12b BBB Ent with Adjacent, Hypothetical Roundabout
There are two movements occurring in the left figure (4.12a) that is eliminated in the
right (4.12b). One is the obvious left turn out of the shopping center parking lot. In this case, left
turning vehicles turn right and proceed to the roundabout just to the north and make a U-turn to
continue south. At this intersection, the southbound left turning vehicles continue on south to the
next assumed roundabout (19th
Terrace) to make a U-turn and then turn right at the entrance. The
16.4 second delay is probably more than negated by the additional distance to 19th
Terrace,
making a U-turn and then proceeding back to the entrance.
The benefit can be shown for assuming the option of roundabouts by comparing the delay
at the BBB Entrance. The delay of the left turning vehicles is nearly eight minutes (474.8
seconds) and the vehicles turning right is 42.2 seconds as compared to 15 seconds of all turns
should a roundabout be added. While it is not clear why SIDRA computes the right-turn delay
nearly three times greater for the current configuration as compared to all vehicles turning right,

83
it must be that the 660 foot queue (26 vehicles) in the left turn lane has a side-friction effect on
the vehicles making a left turn.
4.10 VISSIM
A second analysis was made of the traffic in the vicinity of Wanamaker and Huntoon
using a different model. The rational is similar to that involved in the SIDRA analysis previously
made. Like SIDRA, VISSIM is used to analyze specific intersections, but can also be used to
analyze a series of intersections or a limited network. The difference is that SIDRA relies on
tables or curves, similar to the traditional capacity analysis for determining Level of Service,
Cost, Delay, etc, whereas VISSIM simulates vehicle movements that interact with other vehicles
to determine Travel Time, Delay, Queue Lengths, etc.
The hourly trip movements within the study area are divided into short period movements
that account for the variation that typically occurs with any longer time period. In this case ten
simulations were made and the outputs were averaged to determine the results used in this report.
One simulation run for each the current signalized configuration and the roundabout
configuration were used to generate a video of approximately 20 seconds each to provide a
visual aid to see how traffic moved through each configuration. A third part of the video showed
the two configurations, side by side, making a total of about 20 seconds for the view of the
simulations. A comparison of the two configurations show quite clearly that the queue is much
shorter on the I-470 off-ramp when all vehicles turn right and the southbound vehicles make a U-
turn in the roundabout at Huntoon. An observation of the actual traffic shows that there is an
even greater conflict at the intersection of the off-ramp at Wanamaker than is shown in the
simulation because of the I-470 on-ramp signal immediately south that was not included in the
simulation.
The output resulting from the simulations of the both the existing intersections on
Wanamaker at Huntoon and the I-470 off-ramp and the hypothetical roundabout on Wanamaker
at Huntoon and the I-470 off-ramp with right turns only are summarized in Table 4.1. The
average delay for all approaches at Wanamaker is reduced from 32.8 seconds to 9.5 seconds for
the hypothetical roundabout as compared to the current signalized intersection. The greatest

84
reduction is at the end of the off-ramp of I- 470 at Wanamaker, from 92.9 seconds to 11.3
seconds. What is not shown is that some of the vehicles having a 11.3 second delay at the ramp
terminal are also experienced a 9.5 seconds delay, making a U-turn at Huntoon. However, this is
considerably less time than they are experiencing with the current configuration.
FIGURE 4.13a Still of VISSIM Simulation—Signalized
FIGURE 4.13b Still of VISSIM Simulation—Roundabout

85
TABLE 4.1 Summary of Performance Measures
VISSIM
Location LOS*
Ave.
Delay
(sec)
Current Intersection W/
Signals
Wanamaker and
Huntoon C
32.8
I-470 Off-Ramp
onto
Wanamaker
F
92.9
Theoretical Roundabout
Wanamaker and
Huntoon A
9.5
I-470 Off-Ramp
onto
Wanamaker
B
11.3
* Level Of Service
4.11 Wanamaker Corridor Conclusions
Both the network level analysis using QRSII and the intersection level analysis using
SIDRA provided evidence that providing roundabouts at key locations can improve the
performance of traffic moving along the corridor. However, even greater benefits are realized for
those vehicles turning to and from other public streets and points on commercial access.
Although some drivers may find it confusing to drive by the business entrance that they want
enter and make a U-turn at the next intersection (roundabout), many more business entrances can
be accommodated within the corridor with reducing the level of service along the corridor.

86
Although crashes were not studied a part of this research, It can easily be seen that the
potential for crashes is significantly reduced with the introduction of roundabouts and right-turn
only intersections. Also, there is substantial evidence from many studies that roundabouts reduce
crashes. In general, the most reported and generally accepted figures are: 40% for all crashes,
80% for injury crashes and a predicted 90% for fatal crashes.
Schematics of intersections indicate that there are 32 points of conflict at a typical four-
legged intersection, 16 of which are right angle or nearly head-on. The four-legged roundabout
has 16 points of conflict and none of them are close to right angle. The typical T-intersection has
nine points of conflict of which three are right angle or nearly head-on. A T-intersection with no
left turns allowed has two points of conflict with none close to right angle. Based just on the
number of conflict points and the fact that some are at a more critical angle, it is fairly safe to
assume that the number and seriousness of crashes would be substantially reduced with the use
of roundabouts and eliminating left turns as much as possible.
4.12 46th Street near US-75, North of Topeka
When US-75 was relocated to its present location, 46th
was a rural, unpaved (KDOT Type
B) road that only extended one mile east of US-75. As development occurred in the area, 46th
Street was improved in both directions and paved. As traffic increased, its intersection with US-
75 became one of the highest crash locations in the area with numerous deaths resulting. Several
improvements were tried but with little improvement. In 2003, a project was completed to build
an interchange at this location with US-75 being carried over 46th
Street and a roundabout was
built to connect the four ramps of the diamond interchange with 46th
Street. This was done partly
because of the tight right-of-way restrictions caused by development near the roadways.

87
FIGURE 4.14 US-75 and 46th Street Vicinity
The figure above (4.14) shows the Google aerial photo (2010 image captured on 11-17-
2010) that was taken prior to the most recent improvements. Because of the free flow of NB US-
75 traffic that was exiting onto 46th
Street towards the east, vehicles attempting to enter 46th
Street at the Oakley Avenue were having a difficult time. Because of the both the current and
forecast increased traffic, Shawnee County planned and constructed two roundabouts to the east
of the US-75 Roundabout. One is at Northwest Oakley Avenue and the other is just east at
Northwest Fielding Road.

88
Thanks to Tom Flanagan, Shawnee County Public Works Department and Brian
Armstrong, Bartlett & West, the design consultant, for providing the analysis that lead to the
decision to build the two roundabouts. The following figure shows the two roundabouts
superimposed on an aerial of the area.
FIGURE 4.15 US-76 and 46th Street Vicinity with Roundabouts
Two other design alternatives were taken to a public hearing before the roundabout
option was chosen. On alternative (two-way stop with additional lanes for turning) was similar to
what was existing. The second was a signalized alternative.
The following tables were extracted from the displays that were prepared by the
consultant for the public hearing. The upper the table shows selected operating conditions
(performance measures) for 2008 traffic and the lower part shows the operating conditions for
the design year (2034). The alternative design is shown as rows for each of the years and the four
approaches are shown as columns.

89
TABLE 4.2 Performance Measures for 2008 Traffic
TABLE 4.3
Performance Measures for Projected 2034 Traffic
90
The performance measures for the Signal and Roundabout alternatives are similar. The
principal difference is the delay caused on 46th
Street while the cross streets (Oakley and
Hunter’s Ridge) have the right-of-way. The delay and queue length for EB 46th
Street is listed as
> 32.2 seconds and 311 feet, respectively because the queue backs up into the US-75
Roundabout and cannot be measured.
The performance measures for the two-way stop alternative is the opposite of the
signalized performance. The through movement both east and west on 46th
Street can move
continually so the delay is near zero. However, based on the consultants data, performance
measures for the approach of Oakley Avenue from the south could be interpreted as
intolerableAlso, the businesses near the intersection would possibly be closed. The county
accepted the consultants projections, and the roundabout alternative was chosen for these
locations.
The simulation shows that traffic flows with roundabouts would increase traffic flows
and some access.

91
Chapter 5: Summary and Conclusions
The authors believe that this study clearly documents a case that roundabouts have a
positive impact on businesses. Although using Kansas cities, particularly Topeka, to find and
survey businesses in areas where roundabouts had been constructed did not turn out to provide
answers as clear cut evidence as was envisioned when the proposal was written, a number of
cases found in the literature, where there was clear-cut evidence that roundabouts were good for
business, and from conversations with consultants and cases on the Internet, strengthened the
author's argument that roundabouts are good for business.
As clearly pointed out in Chapter 1, there were a number of obstacles to the originally
envisioned tasks. After investigating a number of potential sites, it was concluded that there was
no single area in Topeka, or elsewhere in Kansas ,where there were a sufficient number of
roundabouts and businesses in a clearly defined area such that before and after impact could
clearly be attributed to the roundabouts. In addition, during this period of this study the country
has been an obvious recession or business slowdown. Based on the belief that increased traffic in
a business area was good for business, an attempt was made to determine whether traffic flow in
the area had increased or decreased; however, it was found to be not possible to relate available
traffic count dates to a specific roundabout opening dates.
The authors did check with the Kansas Department of Revenue but they were reluctant to
provide tax data information. As noted above, whether negative or positive, it would not have
been able to specifically conclude that more or less tax revenue was a direct result of the
roundabouts. A question about before and after business receipts was on the survey but none of
the respondents answered the question. Finally, in Topeka there was a case where construction of
the roundabouts seemed, to affected business owners , to take an excessively long time while (in
their opinion) decreasing access to their business which angered them and resulted in negative
articles in the local media. This information came from some personal interviews the authors
conducted in the area and found that this situation had appeared to bias the business owners
against roundabouts. These and other drawbacks are clearly discussed in the report.

92
There was one “bright spot” in the Topeka area and that was a relatively new and fast
developing business area on 46th
Street near the intersection with US-75, North of Topeka. In
addition to the printed surveys that were sent to this area early in this study, follow-up personal
interviews were made in the end of the study. In general, each business was positive to very
positive. In summary, all but one of the interviewees spoke favorably about the operation of the
roundabouts at this fast growing business location but, again, all had complaints about various
aspects of the construction.
As stated in the report: for these above reasons, the study concentrated on the survey to
businesses and the literature, assessing roundabouts proven ability to move traffic more
efficiently, and not be a “bottleneck” that shoppers would avoid to patronize businesses in areas
with no roundabouts. It is widely accepted that good businesses and business areas that have
good vehicular and pedestrian traffic flows should prosper and grow. Conversely, business areas
that are hard to get to will not.
From the literature review, covered in Chapter 2, this study provides additional
conclusions to either remove the “myth” that they hurt business by causing drivers to avoid the
area or, as a minimum, provide reliable conclusions to plan roundabout use to the advantage of
improved safety, and more efficient traffic flow which is assumed to be neutral or advantageous
to businesses.
A comprehensive search of the written literature (research papers and reports) produced
only one unpublished paper on the impact of roundabouts on business. This paper has been cited
by persons all over the United States by persons interested in the subject. It is a paper which
starts out with the question, “Are roundabouts good for business?” and makes a case that they
are. This unpublished paper gave a detailed account of the effect of a series of roundabouts
constructed along an arterial in a business district in Golden, Colorado. The results documented
in this study are presented in detail in Chapter 2 of this report. Although no other formal written
papers, either published or unpublished, or uncovered, pieces of information were uncovered
from many sources that together make the case that roundabouts can be good for business.
It stands to reason that businesses rely on customers being able to easily access their
business. We are an automobile oriented society and in most cases easy access to business means

93
good access to business by automobile. Roundabouts have been in existence now in the United
States for 20 years. Although growth in the 90s has been relatively slow the rate of growth is
constantly accelerating. There have been enough reliable studies conducted in United States that
have proven that roundabouts are a a safer and more efficient form of intersection traffic control.
They also have a calming effect on traffic speeds, which can facilitate more pedestrian use in
retail corridors.
In the introduction of this report an interesting case found on the British Broadcasting
Corporation (BBC) website reported on a case in England. After a new supermarket was opened,
a mini roundabout was replaced by signals (for reasons not explained) which, judging from the
article, one can only conclude that going from the roundabout to signals caused chaos to the
traffic on the street. The signals were causing delays and business owners were claiming that the
delays were not good for business. Although this occurred in England, and others believe it could
occur elsewhere.
As pointed out in the report, studies by Kansas State University of 11 other roundabouts
in Kansas concluded that the roundabouts reduced stopping, queuing, delay and so forth 50 to
90% as compared to signals. Also, for any given level of traffic, roundabouts generally operated
at one level of service higher than a signalized intersection. So there is no doubt that roundabouts
improve traffic flow, and it follows that improved traffic flow should be good for business.
To supplement the authors belief that roundabouts improve traffic flow, a simulation
study was done on the Wanamaker corridor in Topeka comparing the present corridor with
signalized intersections to the flows that would occur on a hypothetical corridor where the major
intersections were replaced with roundabouts. It was concluded that the traffic flow and assess to
selected businesses would be improved with the roundabouts.
In searching many sources of information—published and unpublished reports, papers,
presentations and power point material from conferences and private individuals, the internet, a
400 person roundabout listserv, and personal contact with consultants—a number of cases were
found around the US in which roundabouts were good for business due to improved access.
These are documented in the report with as much detail as was possible to obtain. Taken together
94
as a whole, they add up to a conclusion that roundabouts improve traffic flow and access and are,
therefore, generally good for business.
The surveys, albeit with possible bias toward the negative in Topeka, as explained briefly
above and in more detail in the full report, were still tending to be positive with 23.1% answering
roundabouts were very good, 38.4% good, and 15.4% fair versus 7.6% bad and 7.6% very bad. A
sum of 76.9 % for combined fair, good and very good can definitely be considered positive.
Responses were very positive from Carmel, Indiana, a relatively small to medium sized
city with over 60 roundabouts and becoming known as “Roundabout City”. While most of the
business owners (38.4% of respondents) in Topeka felt “good” about the roundabout(s) added to
their street or neighborhood, in Carmel, 35.7% of the respondents answered “excellent” for the
roundabout added to their street or neighbourhood, and 35.7% of respondents answered “very
good”, and 14.3 % answered “good” i.e. 85.7% answered the roundabouts were excellent, very
good, or good, and 14.3% answered they were bad. The difference could be attributed to the fact
that Carmel has a longer history with roundabouts.
Other results of additional survey questions, and results from Newton and Junction City
are presented in detail in Chapeter 3. Results from Junction City and Newton are considered too
small to be meaningful but are included for completeness and to illustrate the problems with
small responses and few roundabouts.
The simulation of a hypothetical rounadbout corridor on Wanamaker Road—details in
Chapter 4—showed significant reductions in delay and queueing for most all significant traffic
movements. The conclusion of this section is that roundabouts would provide better traffic flow
and business access with roundabouts. As concluded in the much-cited study of the Golden,
Colorado, corridor, where four roundabouts were installed: “Faster travel times, better access
control, fewer accidents and lower delay at business access points have contributed to an
increase in economic activity” (Ariniello 2004). As shown in Figure 2.6, sales tax revenue from
businesses in the Golden, Colorado, corridor generally increased from about $1.2 million in 2000
to about $1.6 million in 2008 (Hartman 2009).
The authors’ overall conclusion is that roundabouts have a positive impact on traffic
flows and business.

95
References
An Upstate Community Fights against the Construction of a Roundabout in their Historic
Downtown—Only To Fall in Love with It after It Is Built. Produced by friends of Matt
Ryan, uploaded to YouTube May 17, 2009
[http://www.youtube.com/watch?v=zLMMGclhbEY&feature=youtu.be] last accesses
December 13, 2011
Ariniello, Alex J. 2004. “Are Roundabouts Good for Business.” Unpublished report, LSC
Transportation Consultants, Inc., 1889 York Street, Denver, CO.
Bergh, C., Retting, R.A., and Myers, E.J. 2005. Continued Reliance on Traffic Signals: the Cost
of Missed Opportunities to Improve Traffic Flow and Safety at Urban Intersections.
Arlington, VA: Insurance Institute for Highway Safety.
Bourne, Nicholas. 2011. “New Bradley Road Traffic Lights Cause Delays in Wrexham.” BBC
Wales web article. http://www.bbc.co.uk/news/uk-wales-north-east-wales-15890440. 30
November 2011, last accessed December 8, 2011.
Eisenman, S., Josselyn, J., List, G., Persaud, B., Lyon, C., Robinson, B., Blogg, M., Waltman, E.,
and Troutbeck, R. 2004. Operational and Safety Performance of Modern Roundabouts
and Other Intersection Types. Final Report, SPR Project C-01-47. Albany, NY: New York
State Department of Transportation.
ETC Institute. 2006. Roundabout Survey, Final Report, Conducted for the City of Olathe,
Kansas, April.
Federal Highway Administration. 2000. Roundabouts: An Informational Guide. Report No. RD-
00-067. Washington, DC: US Department of Transportation.
Hesch, Maxine. 2007. “Quantitatively Determining the Emissions Reduction Benefits of the
Replacement of a Signalized Intersection by a Roundabout.” Student research paper
presented at the Upstate New York Sub-Regional Junior Science and Humanities
Symposium, Academy of the Holy Name, Albany, NY.
Institute of Highway Safety. Q&A: Roundabouts—How Do Roundabouts Affect Safety?
http://www.iihs.org/research/qanda/roundabouts.html, last accessed December 6, 2011.
Isebrands, H. 2009. Crash Analysis of Roundabouts and High-Speed Rural Intersections.
Transportation Research Record 2096:1–7.

96
Johnson, Mark T. and Hillary N. Isebrands. 2008. “Access Management Considerations for High
Capacity Multi-Lane Roundabout Design and Implementation.” Paper prepared and
presented at 8th
National Access Management Conference: Sustainable Solutions for
Transportation. Baltimore, MD, July13–16.
Johnson, Mark T. 2011. Owner, MTJ Engineering. Private communication via email, December.
Lenters, Mark. 2010. President, Ourston Roundabout Engineering, Inc. “Roundabouts and
Business.” PowerPoint slide presentation, undated. Sent to authors in e-mail dated April
19.
Manning, Creighton. Glens Falls Circles-Rotaries-Roundabouts, website pictures,
http://www.photosfromonhigh.com/glensfalls.htm. Accessed December 28, 2012.
Mandavilli, Srinivas and Russell, Eugene R. “Modern Roundabouts in the United States:
Efficient Intersection Alternative for Reducing Vehicular Emissions.” 83rd Annual
Meeting of the Transportation Research Board (TRB), Washington, DC, January 11–15,
2004.
Persaud, B.N., Retting, R.A., Garder, P.E., and Lord, D. 2001. “Safety Effect of Roundabout
Conversions in the United States: Empirical Bayes Observational Before-After Study.”
Transportation Research Record 1751:1–8. Washington, DC: Transportation Research
Board.
Retting, R.A., Mandavilli, S., Russell, E.R., and McCartt, A.T. 2006. “Roundabouts, Traffic Flow
and Public Opinion.” Traffic Engineering and Control 47:268–72.
Retting, Richard A., Luttrell, Greg, and Russell, Eugene R. 2002. “Public Opinion and Traffic
Flow Impacts of Newly Installed Modern Roundabouts in the United States.” ITE
Journal 72 (9): 30–37.
Russell, Eugene R., Mandavilli, Srinivas, and Rys, Margaret. 2004. Operational Performance of
Kansas Roundabouts. K-TRAN Final Report, KSU-02-04, Kansas Department of
Transportation, Topeka.
Russell, Eugene R., Rys, Margaret, and Luttrell, Greg. 2000. Modeling Traffic Flows and
Conflicts at Roundabouts. MBTC 1099, Mack Blackwell Rural Transportation Center,
University of Arkansas (Available on MBTC web site).

97
Sathyanarayanan, Sudhakar, Russell, Eugene R., and Rys, Margaret J. Further Studies of
Roundabouts: Hutchinson, Kansas. Final Report, submitted to Mack Blackwell Research
Center, September 2002 (Available on MBTC website).
Walther, Roger K. 2011. “A Business Case for Roundabouts.” Presentation, 3rd
International
Conference, Carmel, IN.
