a study of the heat transfer in hydrogen … · a study of the heat transfer in hydrogen fueled...
TRANSCRIPT

A STUDY OF THE HEAT TRANSFER IN HYDROGEN FUELED
INTERNAL COMBUSTION ENGINE
KHALAF IBRAHIM HAMADA
Thesis submitted in fulfilment of the requirements for the award of the degree of Doctor
of Philosophy (Automotive Engineering)
Faculty of Mechanical Engineering
UNIVERSITI MALAYSIA PAHANG
JANUARY 2012

vi
ABSTRACT
Heat transfer in the internal-combustion engine is a crucial phenomenon because of it
affects the engine performance, efficiency and emissions. The aim of this thesis is to
characterize the time-averaged heat-transfer and instantaneous heat-transfer of the
direct-injection hydrogen-fueled engine. A one-dimensional model was developed
based on the gas dynamic and heat-transfer concepts for characterizing the time-
averaged heat-transfer. This model was developed using the real engine specifications
with the capabilities of GT-POWER software. The dimensionless analysis for TAHT
was performed based on the output results from one-dimensional model. The
multidimensional model based on the finite volume approach for characterizing the
instantaneous heat-transfer. The structural three-dimensional model was constructed and
then discretized using the structured hexahedron mesh. The governing equations for
reactive flow with the accompanied physical phenomena were solved numerically. A
novel subroutine was integrated to simulate the hydrogen-injection process. Simplified
single-step mechanism was considered for estimating the reaction rate of hydrogen
oxidation. The modified wall-function was used for resolving the near wall transport.
Arbitrary Lagrangian-Eulerian algorithm was adopted for solving the governing
equations. Whereas the sub-models were solved utilizing the operator splitting
approach, then it was incorporated with the main program. The influences of the engine
speed, equivalence ratio and start of injection timing were investigated. Experimental
study shows that the time-averaged heat-transfer and instantaneous heat-transfer models
are adequately accurate. The equivalence ratio and engine speed were observed to have
significant impacts on characteristics of the time-averaged heat-transfer as well as
instantaneous heat transfer. It was demonstrated that ignoring the impact of the
equivalence ratio on the time-averaged heat-transfer is unjustifiable, especially on the
heat-transfer correlation. Accordingly, the equivalence ratio was established in a new
correlation form of the time-averaged heat-transfer. The reliability of the newly
developed correlation was verified using the Taylor's correlation. The relative error was
reduced from 70 % to around 10 %. Thermal field analysis was used for demonstrating
the trends of the instantaneous heat transfer. It was observed that there is a crucial
distinction between the lean and ultra-lean mixture as well as the engine speed.
Furthermore, a non-uniform behavior was found for the impact of the equivalence ratio
on the temperature distributions. Moreover, the heat release rate, instantaneous rate of
heat loss, cumulative heat loss and heat transfer coefficient were used for monitoring the
behaviour of the instantaneous heat transfer. The instantaneous heat transfer parameters
were increased around 35% when increasing the equivalence ratio within the range of
the finest operation while these parameters are acquired within 10% increase for the
entire engine speed range. It can be comprehended that the developed models are
powerful tools for estimating the heat transfer of hydrogen-fueled engine. The
developed predictive correlation is highly recommended for predicting the heat transfer
of hydrogen-fueled engine.

vii
ABSTRAK
Pemindahan haba di dalam enjin pembakaran dalam adalah suatu fenomena penting
kerana ia mempengaruhi prestasi, kecekapan, dan emisi enjin. Tesis ini bertujuan untuk
menentukan ciri pemindahan haba berpurata masa dan juga pemindahan haba seketika
bagi enjin suntikan terus berbahan api hidrogen. Sebuah model satu dimensi telah
dibangunkan berasaskan dinamik gas dan konsep pemindahan haba bagi mencirikan
pemindahan haba berpurata masa manakala model berbilang dimensi pula telah
dibangunkan berasaskan kaedah isipadu terhingga bagi mencirikan pemindahan haba
seketika. Model berstruktur tiga dimensi telah dibangunkan dan dibahagikan kepada
isipadu kecil dengan menggunakan elemen struktur heksahedron. Persamaan menakluk
untuk medan aliran bertindakbalas beserta model fenomena fizikal telah diselesaikan
dengan menggunakan kaedah berangka. Sebuah sub-atucara asli telah disepadukan bagi
mensimulasi proses suntikan hydrogen. Persamaan fungsi dinding yang telah diubahsuai
telah digunakan untuk menyelesaikan aliran berhampiran dinding. Kesan kelajuan enjin,
nisbah kesetaraan dan permulaan pemasaan suntikan telah dikaji. Kajian eksperimen
menunjukkan bahawa pemindahan haba berpurata masa dan pemindahan haba seketika
menghasilkan ketepatan yang memadai. Nisbah kesetaraan dan kelajuan enjin didapati
mempunyai kesan yang ketara terhadap ciri pemindahan haba berpurata masa dan
pemindahan haba seketika. Telah ditunjukkan bahawa dengan mengabaikan kesan
nisbah kesetaraan ke atas pemindahan haba berpurata masa adalah tidak disokong
khususnya keatas korelasi pemindahan haba. Sehubungan dengan itu, nisbah kesetaraan
telah dihasilkan dalam bentuk korelasi baru dalam sebutan pemindahan haba berpurata
masa. Kebolehpercayaan korelasi yang baru dibangunkan telah disahkan dengan
menggunakan korelasi Taylor. Ralat relatif telah dikurangkan daripada 70% kepada
sekitar 10%. Analysis medan haba telah digunakan bagi mempamerkan ciri pemindahan
haba seketika. Berdasarkan pemerhatian, terdapat kesan perbezaan ketara antara
campuran udara-bahan api yang rendah dan sangat rendah termasuk juga kelajuan enjin.
Lebih-lebih lagi, terdapat juga sifat-sfat yang tidak seragam telah dikesan hasil daripada
kesan nisbah kesetaraan ke atas taburan haba. Tambahan pula kadar pembebasan haba,
kadar kehilangan haba seketika, kehilangan haba kumulatif dan pekali pemindahan haba
telah digunakan bagi memantau ciri pemindahan haba seketika. Parameter-parameter
pemibdahan haba seketika telah meningkat pada tahap 35% apabila nilai nisbah
kesetaraan ditingkatkan di dalam julat operasi terbaik sementara julat peningkatan yang
dikehendaki adalah dalam lingkungan 10% bagi keseluruhan julat operasi halaju enjin.
Dapat difahami bahawa, model yang telah dibangunkan adalah suatu penemuan yang
berguna yang mampu menganggarkan pemindahan haba di dalam enjin. Korelasi
jangkaan yang telah dibangunkan adalah sangat disyorkan bagi menganggarkan
pemindahan haba di dalam enjin pembakaran dalam berbahan api hidrogen.
viii
CONTENTS
Page
SUPERVISORS' DECLARATION ii
STUDENT'S DECLARATION iii
ACKNOWLEDGEMENTS v
ABSTRACT vi
ABSTRAK vii
CONTENTS viii
LIST OF TABLES xi
LIST OF FIGURES xii
NOMENCLATURES xvii
LIST OF ABBREVIATIONS xxiii
CHAPTER I INTRODUCTION
1.1 Introduction 1
1.2 Hydrogen as a Fuel 3
1.3 Problem Statement 5
1.4 Objectives of the Study 6
1.5 Scope of the Study 7
1.6 Organisation of Thesis
8
CHAPTER II LITERATURE SURVEY
2.1 Introduction 9
2.2 Trends of H2ICE 9
2.3 Hydrogen Combustion 11
2.4 Heat Transfer in SI Engines 14
2.4.1 Heat Transfer Correlations 16
2.4.2 Heat Transfer Models 25
2.5 Heat Transfer Correlations Applicable for H2ICE 29
2.6 Conclusions 35

ix
CHAPTER III EXPERIMENTAL DETIALS AND COMPUTATIONAL
MODELING
3.1 Introduction 37
3.2 Strategy of Work Frame 37
3.3 Experimental Details 39
3.3.1 Experimental Setups 39
3.3.2 Engine Combustion Analysis 46
3.4 One-Dimensional Engine Model 49
3.4.1 Model Setup 49
3.4.2 Governing Equations 55
3.4.3 Convergence Criteria 62
3.4.4 Time-Averaged Heat Transfer Correlation 64
3.5 Multidimensional Engine Model 65
3.5.1 Computational Meshing 66
3.5.2 Governing Equations 69
3.5.3 The Main Sub-models 72
3.5.4 Algorithm for Multidimensional Model 79
3.5.5 Boundary and Initial Conditions 82
3.6 Summary 83
CHAPTER IV RESULTS AND DISCUSSION
4.1 Introduction 84
4.2 Experimental Analysis of Hydrogen Combustion 85
4.2.1 In-Cylinder Pressure Traces 85
4.2.2 Mass Fraction Burned 89
4.2.3 Heat Release Rate 91
4.3 One-Dimensional Model 93
4.3.1 Model Validation 94
4.3.2 Analysis of Time-Averaged Heat Transfer 101
4.3.3 Correlations between Dimensionless Parameters 108
4.4 MULTIDIMENSIONAL MODEL 117
4.4.1 Model Validation 117
4.4.2 Parametric Analysis 122
4.5 Summary 147

x
CHAPTER V CONCLUSIONS AND FUTURE WORK
5.1 Introduction 149
5.2 Summary of Findings 149
5.2.1 One-dimensional Modelling 149
5.2.2 Multidimensional Modelling 151
5.3 Contributions of the Study 152
5.4 Recommendations for Future Work 153
REFERENCES 154
APPENDICES
A IPREP File 167
B Calibration and Testing Procedure 182
B.1 Calibration 182
B.1.1 Dynamometer 182
B.1.2 Pressure data acquisition systems 182
B.1.3 Fuel injector 183
B.1.4 Exhaust gas analyzer 185
B.2 Procedure for the Experimental Testing 186
C List of Publications 187

xi
LIST OF TABLES
Table No. Title Page
1.1 Types of heat transfer correlations for ICE applications 2
1.2 Physical properties of hydrogen versus fossil fuels 3
2.1 Summary of the sources of ignition energy for abnormal
combustion
13
2.2 Coefficients of Woschni’s Correlation 22
3.1 PROTON CAMPRO engine specifications 40
3.2 Fuel Injector specifications 41
3.3 Hydrogen fuel specifications 43
3.4 Micro-motion flow meter specifications 44
3.5 Pressure sensor specifications 44
3.6 Specifications of the GASMET Oxygen Analyzer 46
3.7 Piping system components specifications 51
3.8 Engine valves specifications 51
3.9 Parts wall temperature 52
3.10 Coefficients of Woschni’s Correlation 57
3.11 Values of The constants for k-ε turbulent model 72
4.1 Calibration parameters considered for the one-dimensional model 94
4.2 TAHT Correlations constants 112
4.3 Squares differences analysis 113
4.4 Constants of the newly developed TAHT correlations 113
4.5 The experimental operating points of the cases utilized for
validating of the multidimensional model
120
B.1 Load Sequence for Dynamometer Calibration Process 184

xii
LIST OF FIGURES
Figure No. Title Page
2.1 Identification of the combustion anomalies in DIH2ICE 14
2.2 Schematic distribution for the engine energy 15
2.3 An example correlation of time-averaged heat transfer based on
wide range of measurements for several engines
18
2.4 Comparison of predicted heat transfer coefficient for several
correlations
23
2.5 Instantaneous heat transfer coefficient measured comparing to
those of empirical equations
31
2.6 Comparison between the apparent heat release
dt
dQ and the in-
cylinder pressure difference (p-pm)
33
2.7 Comparison between the real cooling loss (estimated by
Wiebe’s function) and that one predicted by the new correlation
34
3.1 Strategy of the work frame for the current research
methodology
38
3.2 Schematic of the test cell for the experimental set up 39
3.3 Details of the PROTON CAMPRO research engine 40
3.4 The engine cylinder head showing the injector, pressure
transducer and sparkplug positions as well as the intake and
exhaust valves
41
3.5 Schematic of the integrated fuelling system 42
3.6 Experimental setup of the fuelling system 43
3.7 The test-cell (a) Overview of the tested engine coupled with the
eddy current dynamometer (b) Dynamometer control console 45
3.8 The GASMET gas analyzers system 46
3.9 One dimensional gas dynamic model for single cylinder four
strokes SI DIH2ICE
50
3.10 Engine cylinder with engine crank train details 52

xiii
3.11 Illustration of component discritization with staggered grids 59
3.12 Physical domain for the multidimensional engine model 66
3.13 Computational grid domain with hexahedral element 67
3.14 (a) Typical finite-difference cell; (b) The portion of a
momentum cell lying within the regular cell; (c) Momentum
cell (i,j), shown in dashed lines, and its associated regular cell
68
3.15 Flowchart for the injection program SETVELIN 73
3.16 Algorithm for the multidimensional model 81
4.1 Experimental traces of the in-cylinder pressure for at 3000 rpm,
θ=0.93 and SOI = 130 deg BTDC at the full-load condition
86
4.2 Experimental traces of the in-cylinder pressure for different
equivalence ratio at 3000 rpm and SOI = 130 deg BTDC at the
full-load condition
87
4.3 Experimental traces of the in-cylinder pressure traces for
different injection timing at 1800 rpm and stoichiometric
mixture condition (θ=1.0) at the full-load condition
88
4.4 Variation of the mass fraction burned for different equivalence
ratio at 3000 rpm and SOI = 130 deg BTDC at full-load
condition
91
4.5 Variation of the mass fraction burned for different injection
timing at 1800 rpm and stoichiometric condition (θ = 1.0) at
full-load condition
91
4.6 Variation of the heat release rate profiles for different
equivalence ratio at 3000 rpm and SOI = 130 deg BTDC at full-
load condition
92
4.7 Variation of the heat release rate for different injection timing
at 1800 rpm and stoichiometric mixture condition (θ=1.0) at
full-load condition
93
4.8 Comparison between predicted (simulated) and experimental
results of IMEP for the baseline hydrogen engine at SOI = 130
deg BTDC
95
4.9 Comparison between predicted (simulated) with experimental
results of the maximum in-cylinder pressure for the baseline
hydrogen engine at SOI = 130 deg BTDC
96

xiv
4.10 Comparison between predicted (simulation) and experimental
brake torque for the baseline hydrogen engine at SOI = 130 deg
BTDC
97
4.11 Comparison between measured and simulated volumetric
efficiency for the baseline hydrogen engine at different engine
speed and SOI
98
4.12 Comparison between measured and simulated engine brake
torque for the baseline hydrogen engine at different engine
speed and SOI
99
4.13 Comparison between measured and simulated engine brake
power for the baseline hydrogen engine at different engine
speed and SOI
100
4.14 Variation of heat transfer rate against the engine speed and
equivalence ratio for different SOI
102
4.15 Variation of PRHT against the engine speed and equivalence
ratio for different SOI
104
4.16 Variation of Nusselt number against the engine speed and
equivalence ratio for different SOI
106
4.17 Variation of Reynolds number against the engine speed and
equivalence ratio for different SOI
107
4.18 Comparison of the predicted (simulation) with Taylor’s
correlation results
109
4.19 Relative error of the predicted results based on results of
Taylor’s correlation
110
4.20 Comparison of simulation results and proposed correlation for
70 deg BTDC ≤ SOI ≤ 85 deg BTDC
114
4.21 Comparison of simulation results and proposed correlation for
100 deg BTDC ≤ SOI ≤ 130 deg BTDC
115
4.22 Relative error of predicted (simulation) results based on newly
developed correlations (model1 and model2)
116
4.23 Computational domain with hexahedral element for
multidimensional engine model at TDC position
118
4.24 Effect of mesh size on the comparison between simulated and
experimental in-cylinder pressure under the motoring condition
with (2000 rpm)
119
xv
4.25 Comparison between the experiment and predicted (simulation)
results of the in-cylinder pressure traces for different engine
speed and mixture strength under WOT and full-load conditions
121
4.26 The flow field with hydrogen concentration of the injection
process for different engine speed, θ = 0.7 and SOI = 100 deg
BTDC at 80 deg BTDC. (Isometric view)
124
4.27 The flow field with hydrogen concentration of the injection
process for different instants, 3000 rpm, θ = 0.5 and SOI = 100
deg BTDC. (Isometric view)
126
4.28 The flow field with hydrogen concentration of the injection
process for different equivalence ratio, 3000 rpm and SOI = 100
deg BTDC at 80 deg BTDC. (Isometric view)
127
4.29 The temperature contour at TDC position (isometric view) 128
4.30 The temperature contours for different engine speed and
instants at θ = 0.7, IT = TDC and SOI = 100 deg BTDC
129
4.31 The temperature contours for different equivalence ratio and
instants at engine speed of 3000 rpm, IT = TDC and
SOI = 100 deg BTDC
131
4.32 The temperature contours for different SOI and instants at
engine speed of 3000 rpm, θ = 0.7 and IT = TDC
133
4.33 Variation of heat release rate against crank angle for different
engine speed at θ= 0.7, IT = TDC and SOI = 100 deg BTDC
134
4.34 Variation of heat release rate against crank angle for different
equivalence ratio at engine speed of 3000 rpm, IT = TDC and
SOI = 100 deg BTDC
135
4.35 Variation of heat release rate against crank angle for different
SOI at engine speed of 3000 rpm, θ = 0.7 and IT = TDC
136
4.36 Variation of the instantaneous rate of heat loss against crank
angle for different engine speed at θ = 0.7, IT = TDC and SOI =
100 deg BTDC
137
4.37 Variation of the instantaneous rate of heat loss against crank
angle for different equivalence ratio at engine speed of 3000
rpm, IT = TDC and SOI = 100 deg BTDC
138
4.38 Variation of the instantaneous rate of heat loss against crank
angle for different SOI at engine speed of 3000 rpm, θ = 0.7
and IT = TDC
140

xvi
4.39 Variation of the cumulative heat loss against crank angle for
different engine speed at θ = 0.7, IT = TDC and
SOI = 100 deg BTDC
141
4.40 Variation of the cumulative heat loss against crank angle for
different equivalence ratio at engine speed of 3000 rpm, IT =
TDC and SOI = 100 deg BTDC
142
4.41 Variation of the cumulative heat loss against crank angle for
different SOI at engine speed of 3000 rpm, θ = 0.7 and
IT = TDC
143
4.42 Variation of the heat transfer coefficient against crank angle for
different engine speed at θ = 0.7, IT = TDC and
SOI = 100 deg BTDC
144
4.43 Variation of the heat transfer coefficient against crank angle for
different equivalence ratio at engine speed of 3000 rpm,
IT = TDC and SOI = 100 deg BTDC
145
4.44 Variation of the heat transfer coefficient against crank angle for
different SOI at engine speed of 3000 rpm, θ = 0.7 and
IT = TDC
147
B.1 The set up for calibration of the injector and the ECU system 186
B.2 Hydrogen mass flow rate against the injection duration for
injector calibration test
186
B.3 Calibration spectrums on FTIR system for emission analysis 187

xvii
NOMENCLATURES
List of Symbols
Symbol Meaning
a Crank radius; Adjustable factor in Wiebe's function; dimensionless
number used for low Mach number flows
A Area
Aeff Effective area
AFR Air/fuel ratio
Afr and Abr Empirical constants
amr Integral stoichiometric coefficient of the species m appearing as a
reactant
'mra Reaction order
Ao Flow regime flag, laminar (0), or (1) for turbulence models
Ar Reference flow area; polynomial constant
B Karmann’s model’s constant
bmr Integral stoichiometric coefficient of the species m appearing as a
product
'mrb Reaction order
Br Polynomial constant
C Constant
c Speed of sound
C1 and C2 Constants in Woschni's correlation
CD Discharge coefficient
Cf Friction factor
Cm Mean piston speed
cm Concentration of species m
Cp Specific heat at constant pressure
Cpl Pressure loss coefficient
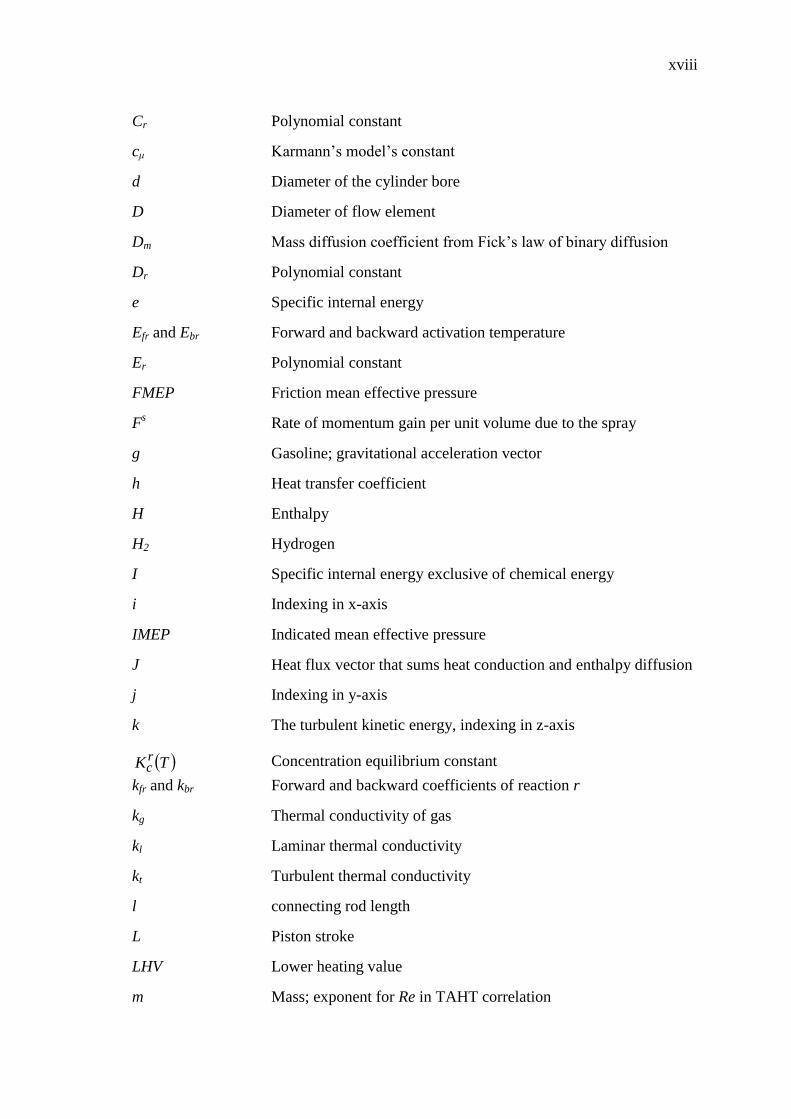
xviii
Cr Polynomial constant
cμ Karmann’s model’s constant
d Diameter of the cylinder bore
D Diameter of flow element
Dm Mass diffusion coefficient from Fick’s law of binary diffusion
Dr Polynomial constant
e Specific internal energy
Efr and Ebr Forward and backward activation temperature
Er Polynomial constant
FMEP Friction mean effective pressure
Fs Rate of momentum gain per unit volume due to the spray
g Gasoline; gravitational acceleration vector
h Heat transfer coefficient
H Enthalpy
H2 Hydrogen
I Specific internal energy exclusive of chemical energy
i Indexing in x-axis
IMEP Indicated mean effective pressure
J Heat flux vector that sums heat conduction and enthalpy diffusion
j Indexing in y-axis
k The turbulent kinetic energy, indexing in z-axis
TK rc Concentration equilibrium constant
kfr and kbr Forward and backward coefficients of reaction r
kg Thermal conductivity of gas
kl Laminar thermal conductivity
kt Turbulent thermal conductivity
l connecting rod length
L Piston stroke
LHV Lower heating value
m Mass; exponent for Re in TAHT correlation
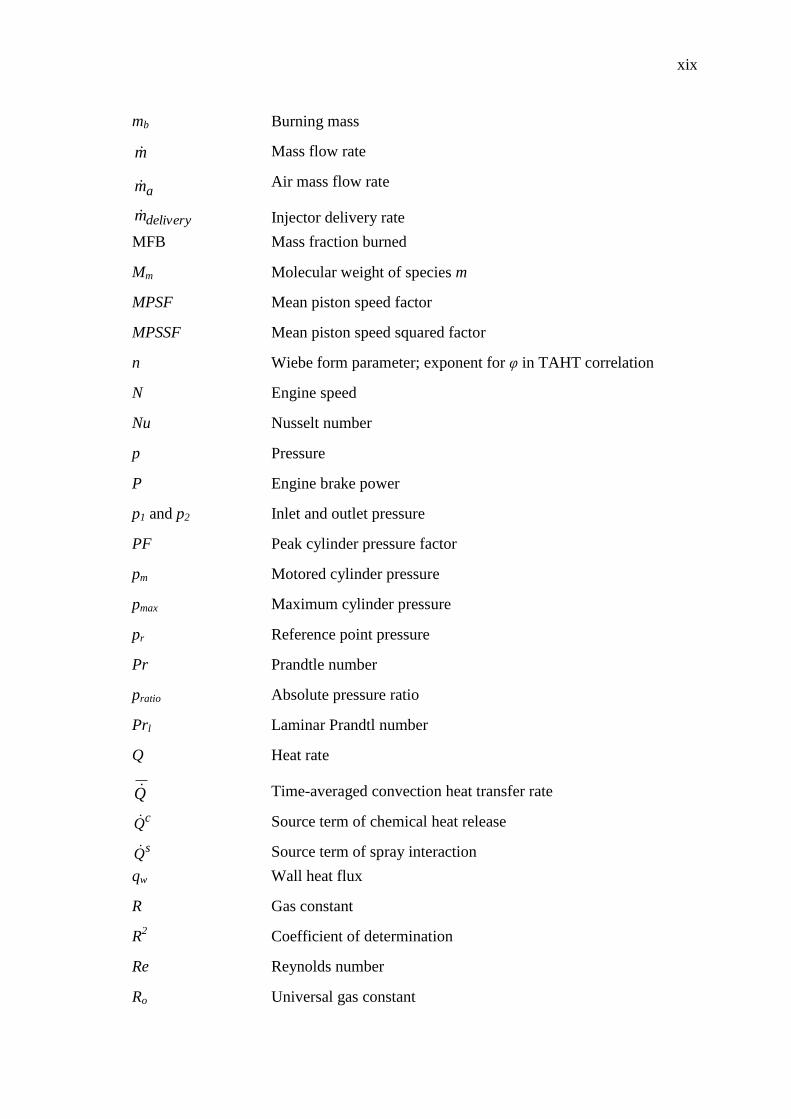
xix
mb Burning mass
m Mass flow rate
am Air mass flow rate
deliverym Injector delivery rate
MFB Mass fraction burned
Mm Molecular weight of species m
MPSF Mean piston speed factor
MPSSF Mean piston speed squared factor
n Wiebe form parameter; exponent for θ in TAHT correlation
N Engine speed
Nu Nusselt number
p Pressure
P Engine brake power
p1 and p2 Inlet and outlet pressure
PF Peak cylinder pressure factor
pm Motored cylinder pressure
pmax Maximum cylinder pressure
pr Reference point pressure
Pr Prandtle number
pratio Absolute pressure ratio
Prl Laminar Prandtl number
Q Heat rate
Q Time-averaged convection heat transfer rate
cQ Source term of chemical heat release
sQ Source term of spray interaction
qw Wall heat flux
R Gas constant
R2
Coefficient of determination
Re Reynolds number
Ro Universal gas constant

xx
RPR Reciprocal of the turbulent Prandtl number
t Time
T Temperature
TA Normalised temperature (T/1000)
Tg Cylinder gases temperature
To Upstream stagnation temperature
Tr Reference point temperature
Tw Cylinder wall temperature
u Fluid velocity vector
u1 Inlet fluid velocity
Uise Isentropic velocity
v Characteristic velocity in Reynolds number
V Volume
Vc Clearance volume
Vd Cylinder displacement volume
Vr Reference volume for Woschni's correlation
w Average cylinder gas velocity
sW Turbulent eddies rate of work on spray dispersion
x Dimension in x-axis
x Averaged spatially dimension
xb Mass burned fraction
y Dimension in y-axis; distance from the wall in the normal direction
z The distance between the crank axis and the piston pin axis;
roughness height; dimension in z-axis

xxi
Greek Symbols
Symbol Meaning
Δθinj Injection duration
Δpc Pressure rise due to combustion
o
fh m Heat of formation of species m at absolute zero
Δt Computational time step
Δx Discretised length
δm1 Dirac delta function
ηv Volumetric efficiency
θd Crankshaft position at combustion end
θs Crankshaft position at combustion start
μ Dynamic viscosity
νl Laminar kinematic viscosity
ρ Density
ρr Reference density
ρise Isentropic density
ρo Upstream stagnation density
ρm mass density of species m
s
Source term of spray
cm Source term of chemistry
Differential operator
Ψ General quantity for formulating of governing equations
κ Karmann’s model’s constant
γ Specific heat ratio
ε Turbulence energy dissipation rate
ζ Viscous stress tensor
θ Crankshaft angle
λ Air/fuel relative ratio
𝜌 Density

xxii
ωr Rate at which reaction proceeds
θ Fuel/air equivalence ratio
η Engine brake torque
χm one mole of species m
ζ Ratio of the heat transfer (hydrogen/gasoline) in Eq. 2.1 and Eq. 2.2
ζfr and ζbr Empirical constants

xxiii
LIST OF ABBREVIATIONS
1D
1D
One dimensional
3D Three dimensional
AFR Air Fuel Ratio
ALE Arbitrary Lagrangian-Eulerian
ATDC After top dead centre
BDC Bottom dead centre
BTDC Before top dead centre
CAE computer added engineering
CFD Computational fluid dynamic
CNG Comprised natural gas
DC Direct current
deg degree
DI Direct Injection
DIH2ICE Direct Injection Hydrogen Fuelled Internal Combustion engine
DOHC Double Overhead Camshaft
ECU Electronic control unit
H2ICE Hydrogen Fuelled Internal Combustion engine
ICE Internal Combustion Engine
IHT Instantaneous heat transfer
IMEP indicated mean effective pressure
MBT Minimum best timing
NOx Nitric oxides emissions
PRHT Percentage ratio of heat transfer
QSOU Quasi-Second-Order Upwind
rpm revolution per minute
SI Spark ignition
SIMPLE Semi Implicit Method for Pressure-Linked Equations
SOI Start of injection

xxiv
TAHT Time-averaged heat transfer
TDC top dead canter
WOT wide open throttle

CHAPTER ONE
INTRODUCTION
1.1 INTRODUCTION
The global utilization of fossil fuels has almost doubled in the last three
decades. Fossil fuels are currently meeting more than 90% of the total energy
demand (EIA, 2011). It is expected to increase the utilization energy resources due to
the rapid rate of developments, as well as the requirements of human comfort. This
causes the vast depletion of resources as well as the undesirable emissions. The main
source for emitting of CO2 is the fossil fuel. The CO2 is a main gas caused the
green house phenomena. The concentration of CO2 has increased by about one-
third since industrialization began and the average surface temperature of the earth
is increasing because of the global warming phenomenon (Subramanian et al.,
2007). Fuels with higher hydrogen to carbon ratio are the world target for the next
energy development. The motivation for substituting the fossil fuel by the alternative
fuels comes from the energy crisis and global warming phenomenon (Crabtree et al.,
2004). Therefore, the vitality of alternative fuel research for internal combustion
engines (ICEs) has been an upsurge. Up to two decades ago, the availability of fossil
fuels and their well-established infrastructure support exiled hydrogen fuel away
from the cycle of interest. However, when the problems of hydrocarbon fuel
availability and their destructive influence on nature had been aggregating in the last
two decades, hydrogen fuel returned back strongly and seized most of the lights
among the possible alternatives. Hydrogen represents one of the main alternatives
available at the long-term use in internal combustion engine applications. A lot of
attention at present is directed to hydrogen fuel utilization, mainly because of its
abundance and non-polluting nature. It was pointed out that hydrogen has excellent
2
characteristics as a spark ignition (SI) engine fuel (Eichlseder et al., 2003;
Subramanian et al., 2005 and Kahraman et al., 2007). The studies on the performance
of hydrogen-fuelled engines (H2ICEs) are voluminous (White et al., 2006); however,
there is some lacking in the investigation of heat transfer (Verhelst and Wallner,
2009).
The heat transfer is one of the noteworthy issues in the studies of ICEs. It has
a direct effect on the main distinguishing parameters for the engine, such as in-
cylinder pressure and temperature. The effort was devoted to developing a highly
efficient global heat transfer model for ICEs applications (Bohac et al., 1996). An
overview of the state-of-the-art shows abundance of correlations for estimation of
heat transfer in ICEs (Sanli et al., 2009). The behavior of the in-cylinder heat transfer
is a function of location and time. According to this fact, all the empirical
correlations were developed from modeling of heat transfer can be categorized into
three groups. Table 1.1 summarizes the type of heat transfer correlations for ICEs
application depending on the averaging methods in the estimation of the heat transfer
coefficient (Heywood, 1988).
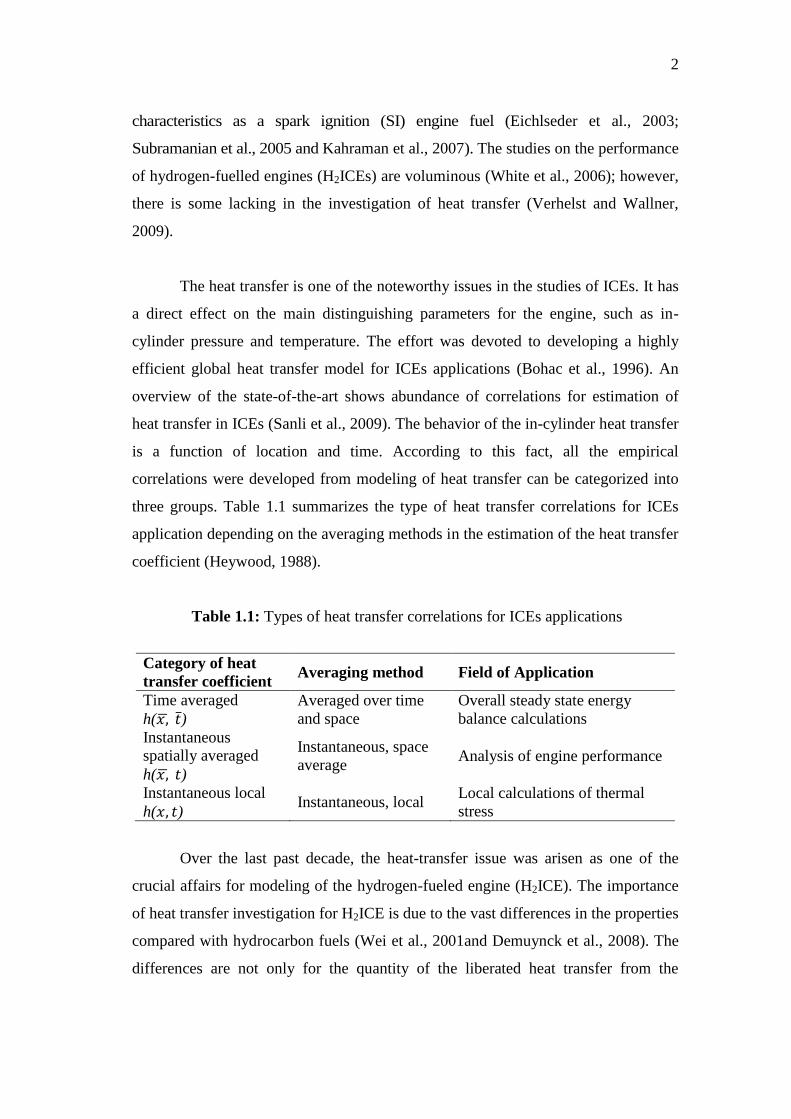
Table 1.1: Types of heat transfer correlations for ICEs applications
Category of heat
transfer coefficient Averaging method Field of Application
Time averaged
h(𝑥, 𝑡 ) Averaged over time
and space
Overall steady state energy
balance calculations
Instantaneous
spatially averaged
h(𝑥, 𝑡)
Instantaneous, space
average Analysis of engine performance
Instantaneous local
h(𝑥, 𝑡) Instantaneous, local
Local calculations of thermal
stress
Over the last past decade, the heat-transfer issue was arisen as one of the
crucial affairs for modeling of the hydrogen-fueled engine (H2ICE). The importance
of heat transfer investigation for H2ICE is due to the vast differences in the properties
compared with hydrocarbon fuels (Wei et al., 2001and Demuynck et al., 2008). The
differences are not only for the quantity of the liberated heat transfer from the

3
combustion process but also the unique behavior for the hydrogen combustion
(Shudo and Suzuki, 2002a).
1.2 HYDROGEN AS A FUEL
Hydrogen as a fuel has unique characteristics (wide flammability limit, small
quenching distance, high flame speed, etc) compared to fossil fuel. Understanding of
these properties provides keys for developing and improving of design strategies for
H2ICE. The benefits and technical challenge of the heat-transfer issues for H2ICE
revealed through investigation of hydrogen properties relevant to engine heat loss
and thermal efficiency. Hydrogen and other fossil fuels properties are listed in Table
1.2 (Wimmer et al., 2005; White et al., 2006 and Verhelst and Wallner, 2009).
Hydrogen has a high specific energy, high flame speed, small quenching distance,
high diffusion coefficient, wide range of flammability and cleans burning
characteristics. These properties are the possibility of high performance in ICE
(Verhelst and Sierens, 2001a and Cordaway, 2004).
Table 1.2: Physical properties of hydrogen versus fossil fuels
Parameter Unit Diesel Gasoline Methane Hydrogen
Density kg/m3
8301
730-7801
0.721
0.0891, 71
2,3
Stoich. air demand kgair/ kgfuel 14.5 14.7 17.2 34.3
Lower heating value MJ/kgfuel 42.5 43.5 50 120
Mixture calorific value5
MJ/m3 3.83
7
3.838
3.827
3.838
3.47
3.768
3.27
4.538
Boiling temp.3 o
C 180-360 25-215 -162 -253
Ignition limits4
λ 0.5-1.3 0.4-1.4 0.7-2.1 0.2-10
Min. ignition energy3,4,5
mJ 0.24 0.24 0.29 0.02
Self ignition temp. oC ≈250 ≈350 540 585
Quenching distance3,4,6
mm - 2 2.03 0.64
Lam. flame speed4,5
cm/s 40-80 40-80 40 200
Conductivity9 mW/m
2.K - - 34 182
Diffusion coeff.1,4
m2/s - - 1.9×10
-6 8.5×10
-6
Carbone content Mass (%) 86 86 75 0
Note 1 at 1.013 bar and 0
oC
2 at -253
3 at 1.013 bar
4 in air
5 λ=1
6 at 20
oC
7 mixture aspiration
8 air aspiration
9 at 300 K

4
The quenching distance describes the flame extinguishing properties of a fuel
when used in an ICE. It is the distance of the flame quenches due to heat losses from
the cylinder wall. The quenching distance for hydrogen fuel is smaller than other
fuels (Shudo and Nabetani, 2001). Therefore, the flame front can escape from the
combustion chamber through the intake valve more easily and backfire occurred
(Halmari, 2005). As can be seen in Table 1.2, the quenching distance of hydrogen
fuel is about one-third compared to methane and gasoline. Because of this, the
cooling losses are high and the thermal efficiency of H2ICE is lower than fossil-
fueled engines (Shudo et al., 2003 and Shudo, 2007).
Hydrogen has higher flame speed compared to all other fuels. At a
stoichiometric condition, the hydrogen flame speed is nearly 4 times higher than
hydrocarbon fuels (Wei et al., 2001). This means that hydrogen engines are more
likely the thermodynamically ideal engine cycle (Eichlseder et al., 2003). However,
it causes the increase of heat transfer due to intensify the turbulence level. Hence,
thermal boundary layer is very thin then increases the amount of heat transfer from
combustion gas to combustion chamber walls (Shudo, 2005). At leaner mixtures,
however, the flame speed decreases significantly (Natkin et al., 2003).
The wide flammability range of hydrogen can be combusted in an ICE over a
wide range of hydrogen-air mixtures (0.1 < fuel/air equivalence ratio (φ) < 7.1)
(Demuynck et al., 2008). A significant advantage of this, hydrogen can run on a lean
mixture. It is easy to get an engine to start on hydrogen (Padiyar, 1985). Under this
wide flammability range, it is expected to introduce φ for expressing of heat transfer
correlations.
Hydrogen is a remarkably light gaseous fuel that is requires the least amount
of air for stoichiometric combustion (2.39 versus 59.6 for iso-octane) on the volume
basis while the highest relative mass of air on the mass basis (Yamin, 2007). The
combustion of hydrogen is also associated with a substantial molar contraction of
around 15%. Its heating value on the mass basis is the highest but lowest on the
volume basis (Yamin and Hamdan, 2010). In addition, there is the significant
difference between its higher and lower heating values since its product of