heat-transfer and pressure drop correlations for hydrogen ... · heat-transfer and pressure drop...
TRANSCRIPT

Hard copy (HC)
Microfiche (MF)
HEAT-TRANSFER AND PRESSURE DROP CORRELATIONS FOR HYDROGEN AND NITROGEN FLOWING THROUGH TUNGSTEN WIRE MESH AT TEMPERATURES TO 5200° R
by Byron L. Siegel, Willium L. Muag, J U C ~ G. Sluby, und Willium F. Muttson
Lewis Reseurch Center Clevelund, Ohio
NATIONAL AERONAUTICS AND SPACE ADMINISTRATION WASHINGTON, D. C. JULY 1 9 6 5
https://ntrs.nasa.gov/search.jsp?R=19650019038 2018-06-14T15:59:08+00:00Z

NASA TN D-2924 w
HEAT -TRANSFER AND PRESSURE DROP CORRELATIONS FOR HYDROGEN
AND NITROGEN FLOWING THROUGH TUNGSTEN WIRE ! I
MESH AT TEMPERATURES TO 5200° R
By Byron L. Siegel, William L. Maag, Jack G. Slaby, and William F. Mattson
Lewis Research Center Cleveland, Ohio
NATIONAL AERONAUTICS AND SPACE ADMINISTRATION
For sale by the Clearinghouse for Federal Scientific and Technical Information Springfield, Virginia 22151 - Price $2.00

HEAT-TRANSFER AND PRESSURE DROP CORRELATIONS FOR HYDROGEN AND NITROGEN
FLOWING THROUGH TUNGSTEN WlRE MESH AT TEMPERATURES TO 5200' R
by Byron L. Siegel, W i l l i a m L. Maag, Jack G. Slaby, and W i l l i a m F. Mattson
L e w i s Research Center
SUMMARY c , '
28639 Correlat ions f o r var iab le property heat- t ransfer and f r i c t i o n pressure
drop data were obtained f o r forced convection of hydrogen and ni t rogen through e l e c t r i c a l l y heated tungsten wire mesh. These cor re la t ions represent t h e data of s i x d i f f e r e n t h e l i c a l l y co i led wire meshes for the following range of condi- t i ons :
(1) Mesh poros i ty of 64 t o 72.2 percent
( 2 ) Wire diameter of 0.020 t o 0.035 inch
(3) Surface temperature of 1400' t o 5200' R
( 4 ) Outlet gas temperature of 600' t o 2400' R
(5) &ss ve loc i ty f o r hydrogen of 0.4 t o 3.1 l b / ( s e c ) ( s q f t ) and f o r ni t rogen of 4.5 t o 10.2 lb / ( sec ) ( sq f t )
( 6 ) Heat f l u x of 0.5 t o 8.3 Btu / (sec) (sq i n . )
( 7 ) Pressure l e v e l o f l a tmosphere I
\ The e f f e c t of flow bypass, r e s u l t i n g from a mesh heater not f i l l i n g the flow passage, w a s inves t iga ted on a 0.030-inch-diameter w i r e mesh f o r a bypass a rea of 25 percent.
I
~ O D U C T I O N
The Lewis Research Center i s conducting research on a tungsten-water- moderated, hydrogen propelled, nuclear rocket concept. mental phase of t h i s program i s t o evaluate various types of f u e l elements and supporting s t r u c t u r e s a t simulated operating conditions.
A p a r t of the experi-

The r e s u l t s of t h i s repor t were used t o design the heating elements of a high-temperature hydrogen preheater f o r hot flow t e s t i n g . for these elements were t h a t they must have:
The prerequis i tes
(1) Capabili ty of being e l e c t r i c a l l y heated t o surface temperatures of 5500' R
( 2 ) E l e c t r i c a l res i s tance t o match an ava i lab le high-voltage power supply
( 3 ) Suf f ic ien t surface area t o t r a n s f e r the generated hea t t o the flowing gas
( 4 ) Suf f ic ien t flow area t o minimize gas pressure drop
Commercially avai lable tungsten mesh made of interwound h e l i c a l c o i l s of tungsten wire were considered appl icable as t h e heating elements f o r t h i s pre- heater, but t h e i r heat- t ransfer and pressure drop c h a r a c t e r i s t i c s were not known.
A l i t e r a t u r e survey revealed t h a t there i s a l imited amount of experimen- t a l heat- t ransfer and pressure drop data avai lable f o r forced convective flow through porous wire mesh ( r e f e r r e d t o by other authors as porous media) and the majority of these data a r e f o r constant property conditions. which summarizes the r e s u l t s of the Stanford-Office of Naval Research program on compact heat- t ransfer surfaces, provides most of the ex is t ing data on in- dividual w i r e mesh elements of d i f f e r e n t wire diameters and poros i t ies . using a t r a n s i e n t t e s t technique and constant property conditions, t h i s program determined heat- t ransfer cor re la t ions f o r each mesh. Reference 2 revised these data and obtained a general cor re la t ion f o r a l l mesh. Similar ly the isothermal pressure drop data f o r each mesh cor re la ted individual ly with the Fanning type equation, but a general cor re la t ion f o r a l l meshes w a s not obtainable. Refer- ence 3 provides the only ava i lab le var iab le property hea t - t ransfer and pressure drop data. e l e c t r i c a l l y heated tube bank a t surface temperatures up t o l l O O o R .
Referelice 1,
By
The data were obtained for s teady-state flow of a i r through an
A considerable amount of pressure drop data a re ava i lab le f o r f l u i d flow through packed beds ( r e f . 4 ) . A comparison between wire mesh and packed beds indicates the pressure drop c h a r a c t e r i s t i c s of both a r e dependent on t h e same basic parameters, t h a t is , mass veloci ty , f l u i d propert ies , and geometrical f a c t o r s . The cor re la t ions reported f o r packed beds a r e used as a basis f o r correlat ing the pressure drop data of t h i s repor t .
This r e p o r t presents experimental var iab le property pressure drop and heat- t ransfer cor re la t ions f o r h e l i c a l l y co i led wire mesh a t average surface temperatures t o 5200° R . Six d i f f e r e n t meshes were tes ted . The wire diameter varied from 0.020 t o 0.035 inch with mesh poros i t ies between 0.640 t o 0 .722 . The mass veloci ty through these mesh w a s var ied from 0.4 t o 3.1 pounds per second per square foot f o r hydrogen and from 4.5 t o 10.2 pounds per second per square foot f o r nitrogen. second per square inch.
The hea t f l u x ranged from 0.5 t o 8 .3 Btu per
2

1 Exhaust
4000: 1 Cur ren t transformer,
6 Choke flow nozzle Pnozzle-
Sight port CD-8058
Figure 1. - Schematic diagram of test section apparatus and location of instrumentation
APPARATUS AND PROCEDURE
I A schematic diagram of the f l o w system, t e s t sect ion, power supply, in- strumentation, and corresponding components associated with each, as used i n
I t h i s inves t iga t ion , i s shown i n f igure 1.
Flow System
A s may be seen i n f igure 1, hydrogen or nitrogen w a s supplied t o the f l o w system from a tube t r a i l e r a t a maximum pressure of 2400 pounds per square inch. From the t r a i l e r the gas then flowed through a prese t pressure reducer valve, a remotely operated cont ro l valve, a choked f low nozzle and an on-off valve that supplied gas d i r e c t l y t o the tes t sec t ion . The gas flow w a s metered by means of t he choked f l o w nozzle t h a t assured a constant mass flow through the t e s t s ec t ion . From the t e s t sec t ion the heated gas flowed through a t w o - b a f f l e molybdenum mixing can and i n t o a gas t o water concentric tube heat ex- changer where it was cooled below 1000° R before being exhausted i n t o the atmosphere.
For s a f e t y purposes, the e n t i r e system was purged with ni t rogen before hydrogen en tered the system, and the controls were s e t f o r f a i l s a fe operation s o i f a predetermined safe ty permissive s tops t he hydrogen f low, ni t rogen would automatical ly purge the system. In such a case, the e l e c t r i c a l t e s t power would a l s o be automatically shut down.
'
3

Diameter: 0.020
0.025 0.060
0.00372 3 x 1
23 0.0814 0.640
0.025 0.03 0.035 C-65943
Figure 2. - Tungsten wire mesh.
0.030 0.035 0.080 0.080
0.00635 0.00642 3 x 1 3 x 1
17 16 0.111 0.125 0.717 0.685
TABLF: I. - MESH GEOMETRIC PARAMETERS
69 0.0666 0.722
Mesh number
69 0.077 0.660
Wire diameter, d, in . Mandrel diameter, D, in . Equivalent diameter, De, ft Mesh s ize (length X width) ,
Number o f pa ra l l e l co i l s , N Coil pitch, p, in. / turn Porosity, E
in . X in .
0.020 0.060
0.00425 3 x 1
23 0.0666 0.722
5
0.020 0.060
0.00425 3 x 3
0.025 0.060
0.00404
4

Figure 3. - Exploded view of test section assembly.
Test Sect ion
Experiments were performed on a t e s t section consisting of mesh formed by interwound h e l i c a l c o i l s of tungsten w i r e as shown i n f igure 2 . Each end of t h e c o i l s i s sandwiched between two tungsten p la tes , approximately 0.060 inch thick, and the c o i l s a r e he l ia rc welded a t the ends of the p la tes t o provide posi t ive mechanical and e l e c t r i c a l connections.
Four d i f f e ren t 3- by 1-inch meshes were tes ted , each having a d i f f e ren t w i r e diameter and porosity. Also t e s t ed were two 3- by 3-inch meshes, one of which has the same parameters as one of the 3- by 1-inch meshes. Table I l i s t s the geometrical parameters associated with each mesh. The smaller 3- by 1-inch meshes were used for most of the data because they permitted invest igat ion of higher ranges of mass ve loc i t ies and heat fluxes and approximated the geometry of the f i n a l heater design.
Figure 3 shows an exploded view of the t e s t sect ion assembly, which con- s is ts of a 3- foot entrance t r ans i t i on section t o s t ra ighten the gas flow p r io r t o en t ry in to the t e s t section, a boron n i t r ide housing designed t o hold and e l e c t r i c a l l y insu la te the mesh bus connections and t o minimize bypass of the gas around the mesh, a water-jacketed s t a in l e s s - s t ee l outer housing, and a molybdenum can t o mix the gas pr ior t o measuring i t s temperature. O-ring near the cold end of the boron n i t r ide housing prevented leakage of the gas between the boron n i t r i d e and the s t a in l e s s - s t ee l outer support housing. No provision w a s made fo r expansion of the mesh. bowing occurred i n the f l o w direct ion, and the mesh retained a permanent s e t after cooling. This s e t could not be changed even by reversing the mesh and heating t o 5000' R a t high f l o w r a t e s .
A rubber
During i n i t i a l heating,
Power Supply
A s ing le phase 60-cycle 500-kilovolt-ampere saturable-reactor controlled
5

power supply was used t o e l e c t r i c a l l y hea t the tungsten mesh. w a s varied from 4.7 t o 50 v o l t s with a maximum curren t r a t i n g of 10 000 amperes. With bus losses , however, the maximum power t o the t es t element w a s l imi ted t o I
225 kilowatts.
Output vol tage
Instrumentation
The locat ion of t he instrumentation i s shown i n f igu re 1. The vol tage across and the cur ren t through the t e s t sec t ion were measured. The tes t sec t ion voltage was taken d i r e c t l y across the mesh t o eliminate any e r r o r caused by a voltage drop between the power supply and the t e s t sec t ion . root-mean-square voltmeter was used t o measure the tes t voltage because of the wave form produced by the sa turab le- reac tor cont ro l led power supply. was read on a precis ion ammeter through a 4000:l s t e p down cur ren t transformer. I n l e t pressure t o the t e s t sec t ion w a s measured with a ca l ib ra t ed 0- t o 100- pound-per-square-inch Bourdon tube gage. The pressure drop across the mesh was continuously recorded with a ‘1-pound-per-square-inch temperature- compensated s t ra in-gage bridge d i f f e r e n t i a l pressure transducer. a tu re w a s measured with a type K thermocouple (designat ion r e f . 5) , and the e x i t temperature was measured with a p l a t inum/plat inum-13-percent -rhodium thermocouple. can t o give a t r u e mixed bulk gas temperature. measurements a t the i n l e t t o the choked f l o w nozzle were made. The mass flow r a t e was s e t by ad jus t ing the nozzle i n l e t pressure.
A t r u e
Current
I n l e t temper-
The e x i t thermocouple w a s placed i n a baf f led molybdenum mixing Pressure and temperature
METHOD OF CALCULATION
Geometrical Factors
The mesh heating elements were made of interwound h e l i c a l tungsten c o i l s . These mesh can be completely spec i f ied by f i v e parameters: mandrel diameter D, number of p a r a l l e l c o i l s N, length of mesh b, and h e l i c a l c o i l p i t ch p. (All symbols a r e defined i n the appendix.)
wire diameter d,
The geometrical parameters and corresponding equations assoc ia ted with the ca lcu la t ion of t he hea t t r ans fe r , pressure drop, and mesh surface temperature f o r the data of t h i s repor t a r e as follows:
The length of a s ing le h e l i c a l c o i l S i s given by the equation
while t he thickness of the mesh i n the d i r ec t ion of flow is given by
L = D + Z d
6

and the to- ta l heat--transfer surface area f o r N number of c o i l s is
As = ndSN
The equivalent diameter f o r porous media i s normally defined as
4%1 - - - 4( void volume) De = AS AS
(4)
where the average flow area i s given as
A f l = *ft (5)
The porosi ty i s defined as the average porosity f o r the e n t i r e mesh volume by
( 6 ) Volume of mesh - Volume of tungsten i n mesh = E
Volume of mesh
Average Heat-Transfer Coefficients
The average heat- t ransfer coef f ic ien t was computed from the experimental data by the r e l a t i o n
where
The re l a t i on ence 6 .
where
average surface temperature Ts of between temperature and r e s i s t i v i t y The r e s i s t i v i t y w a s calculated by
v Ae 5 = - - I S
the mesh w a s determined from the of tungsten as given i n r e f e r -
( 9 )
(10)
r e s i s t i v i t y temperature r e l a t i o n
Nfi dL A, = - 4
Average screen surface temperatures from the calculated by equation ( 9 ) were v e r i f i e d by means of an o p t i c a l pyrometer t h a t w a s s ighted through a port located i n the i n l e t t r a n s i t i o n sec t ion of the t e s t sec t ion housing. operated within +300° R of the same temperature over i t s e n t i r e f r o n t a l a rea .
Optical pyrometer measurements indicated t h a t the e n t i r e mesh
7

Average F r i c t ion Pressure Drop
S t a t i c pressure taps were located i n the boron n i t r i d e tunnel c lose t o the mesh t o minimize any pressure drop due t o f r i c t i o n on the tunnel walls.
The t o t a l s t a t i c pressure drop across the mesh Dt i s made up of th ree components, a combined expansion and contract ion pressure drop, a momentum
I pressure drop, and a f r i c t i o n pressure drop.
I Neither the expansion nor the contract ion losses are experimentally separable from the f r i c t i o n pressure drop a s i n the case of tube-type flow. They a r e therefore included a s p a r t of t he f r i c t i o n pressure drop.
I The r e l a t i o n between these components i s expressed by the following equa- t ion :
where G2/g[(1/pz) - (l/pl)] i s the momentum pressure drop and D i s the
f r i c t i o n pressure drop ( including expansion and contract ion e f f e c t s ) . densi ty f o r the f r i c t i o n pressure drop ca lcu la t ions a s used i n equation (11) is evaluated from the s t a t i c pressures and t o t a l temperatures of the gas a s f o l l o w s :
The mean
1 p1 + p2 'm R T~ + T~
= -
The difference between the t o - t a l and s t a t i c temperatures of the gas w a s never more than 1/2 percent. calculat ions.
Total gas temperatures were therefore used i n these
RESULTS AND DISCUSSION
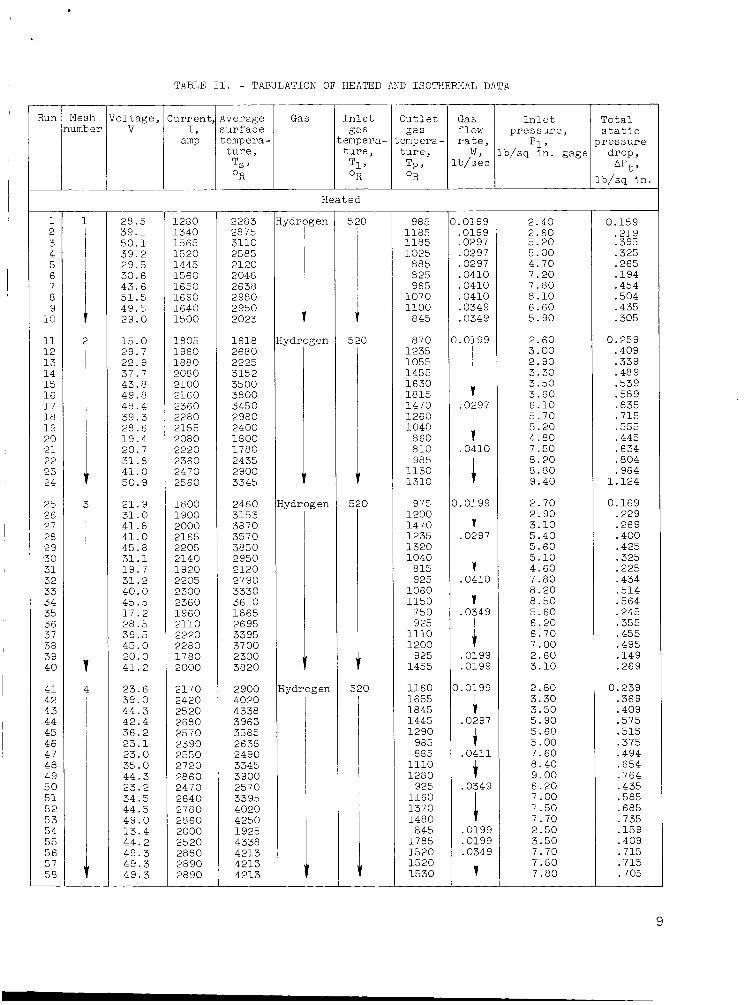
The data obtained from t h i s inves t iga t ion a r e presented i n t a b l e 11. Differences between the t o t a l e l e c t r i c a l hea t input and the hea t t r ans fe r r ed t o the gas were due t o r ad ia t ion and conduction losses t o the water-cooled buses and jacketed housing.
Heat Transfer
Flow normal t o a wire mesh hea t - t r ans fe r surface i s somewhat analogous t o flow pas t a s ing le cyl inder i n an i n f i n i t e f l u i d because the flowing f l u i d forms a laminar boundary layer on the f r o n t port ion of t he cy l inders . Proceed- ing around a cyl inder , t he flow acce le ra t e s and then decelerates , which causes separat ion o f the boundary layer from t h e surface producing a turbulent wake behind the cyl inder . The heat t r ans fe r r ed from the upstream port ion of the cylinder where the laminar boundary l aye r e x i s t s can be ca lcu la ted from the
.
0.159 .219 .395 .325 .265 .194 .454 .504 .435 .305
0.259 .409 .339 .489 .539 .589 .835 .715 .555 .445 .634 .804 .964
1.124
0.169 .229 .269 .400 .425 .325 .225 .434 .514 .564 .245 .355 .455 .495 .149 .269
0.239 .369 .409 .575 .515 .375 .494 .654 .764 .435 .585 .685 .735 .159 .409
ii
.
Gas f l o w r a t e ,
l b / sec w,
I
\
1
TABLE 11. - TABULATION OF HEATED AND ISOTHERMAL DATA
I -~ I
Run Mesh Voltage, lumber V
Current A v e r a g e s u r f a c e t enpera -
Gas I n l e t T o t a l p r e s s u r e , s t a t i c
p r e s s u r e
l b / s q i n .
T
t u r e , TS 9
OR I Heated
1 2 3 4 5 6 7 8 9 10
11 12 1 3 14 15 1 6 1 7 18 1 9 20 2 1 22 23 24
25 26 27 28 29 '3 0 3 1 32 33 34 35 36 37 38 39 40
4 1 42 43 44 45 46 47 48 49 5 0 5 1 5 2 5 3 5 4 55 56 57 58
28.5 3 9 . 1 5 0 . 1 39 .2 29 .5 30.6 4 3 . 6 51.5 49.5 29 .0
1 5 . 0 29.7 22 .9 37.7 43.8 49.8 48.4 39 .3 28.6 1 9 . 4 20.7 31.8 41 .0 50 .9
21.9 31 .0 41.8 41 .0 45.8 3 1 . 1 19 .7 31 .2 40 .0 45.5 1 7 . 2 28.5 39.5 45 .0 20 .0 41.2
23.6 39 .0 44 .3 42 .4 36 .2 2 3 . 1 2 3 . 0 3 5 . 0 44 .3 2 3 . 2 34.5 44.5 4 9 . 0 1 3 . 4 44 .2 49 .3 49 .3 49 .3
1280 1340 1565 1520 1445 1560 1650 1690 1640 1500
1805 1960 1880 2080 2100 2160 2360 2280 2155 2080 2220 2360 2470 2560
1800 1900 2000 2165 2205 2140 1920 2205 2300 2360 1960 2110 2220 2280 1780 2000
2170 2420 2520 2680 2570 2390 2550 2720 2860 2470 2640 2780 2860 2000 2520 2880 2890 2890
2283 2875 3110 2585 2 1 20 2048 2638 2980 2950 2023
1618 2680 2225 3152 3500 3800 3450 2980 2400 1800 1780 2435 2900 3345
2460 3153 3870 35 7 0 3850 2950 2120 2790 3330 3610 1865 2695 3395 3700 2300 3820
2900 4020 4338 3963 3585 2638 2490 3345 3900 2570 3395 4020 4250 1925 4338 4213 4213 4213
985 1185 1185 1025
885 825 965
1070 1100
a45
870 1235 1055 1455 1630 1815 1470 1260 1040
860 810 985
1130 1310
975 1200 1470 1235 1320 1040
815 925
1060 1150
750 9 25
1110 1200
925 1455
1160 1655 1845 1445 1290
985 885
1110 1280
925 1160 1370 1480
8 45 1785 1520 1520 1530
2 .40 2 .60 5.20 5.00 4 .70 7 .20 7 .80 8.10 6.60 5 .90
2.60 3 .00 2 .90 3 .30 3 .50 3.60 6.10 5 . 7 0 5.20 4.80 7 .50 8 .20 8 .80 9.40
2 .70 2.90 3 .10 5 . 4 0 5.60 5.10 4 .60 7 .80 8 .20 8 . 5 0 5.60 6 .20 6 . 7 0 7.00 2 .60 3.10
2.80 3 .30 3.50 5.90 5 . 6 0 5.00 7.60 8.40 9 .00 6 .20 7.00 7.50 7 . 7 0 2.50 3 .50 7 . 7 0 7 .80 7 .80
.0199
.0199
.0297
.0297
.0297
.0410
.0410
.0410
.0349
.0349
.0199
1 .0297
1 c
. O i g g
I . O r o
I
.0410
.0297
.0349
.0199
.0199
.0199
4 t t
.0297
.0411
.0349
I .0199 .0199 .0349
.c
vdr
c c ydrogen
3 en 520 ,

TABLE 11. - Continued. TABULATION OF HEATED AND ISOTHERMAL DATA
I
Run
I
59 60 61 62 63 64 65 66 67 68 69 70 71
72 73 74 75 76 77 78 79 80 81 82 83 84 85 86 87 88 89
90 91 92 93 94 95 96 97 98 99 100 101 102 103 104
105 106 107 108 109 110 111 112 113 114 115
I I/
‘ o l tage , V
22.4 14.8 19.6 13.6 16.6 9.5 24.0 26.9 22.8 16.1 11.8 30.0 32.0
16.6 23.3 31.2 12.6 18.0 23.1 28.0 10.9 17.9 24.5 11.1 14.2 20.0 24.9 12.4 16.6 23.0 29.6
41.0 46.5 49.3 37.0 42.4 46.0 8.6 17.2 26.5 47.0 16.8 26.5 32.0 13.8 21.5
4.5 7.8 11.1 13.7 28.2 7.3 11.2 19.2 25.9 5.7 11.8
1280 1094 1160 1010 1082 1121 1320 1396 1320 1280 1185 1420 1460
1000 1080 1180 960 1000 1044 1100 920 960 1040 880 880 920 1000 840 840 940 1000
3380 3480 3548 3140 3240 3340 2760 3140 3320 3780 3040 3240 3380 2760 2960
3260 4040 4440 4560 5060 4160 4520 4800 5080 3780 4320
verage u r f a c e empera- t u r e ,
TS 9
OR
4325 3500 4200 3475 3885 2365 4485 4700 4285 3280 2710 5065 5213
3203 2975 4725 2625 3420 4075 4588 2400 3515 4270 2545 3140 4010 4485 2900 3700 4430 5173
3420 3700 3835 3395 3650 3820 1085 1765 2400 3488 1780 2456 2777 1630 2225
920 1219 1522 1780 3005 1130 1510 2265 2790 992 1645
I n l e
empe t u r e
gas
T 1 f OR
Ou t l e t gas
empera- t u r e , T2 OR
1270 1070 1255 1125 1255 785 1200 1215 1115 945 8 20 1280 1335
865 1005 1195 810 945 1085 1185 7 90 9 90 1180 860 955 1135 1290 975 1130 1365 1630
1880 2090 2223 2100 2257 2400 685 885 1130 1660 915 1200 1325 865 1095
645 750 8 65 955 1480 7 40 865 1130 1405 695 920
Gas flow r a t e , w,
lb/sec
3.170 .0866 .0866 .0665 .0665 .1270 .1270 .1460
J 3.1460
J .127
I
c I
.lo70
i .0866
.0665
0.0223
G G
,0178
.0389
]I .Org .0286
t.
0.0389
J .0391
1 .0339 .0339
I n l e t p re s su re ,
P1 b/sq i n . gage
T o t a l s t a t i c r e s s u r e
drop, Apt,
b/sq i n .
10

TABLE 11. - Concluded. TABULATION O F HEATED AND ISOTHERMAL DATA
Run Mesh Vol tage , Current, Average Gas I n l e t
t u r e , t u r e ,
number V I, s u r f a c e gas amp tempera- temper a -
i i
Gas f l o w r a t e , w,
l b / sec
I I I
I n l e t p r e s s u r e ,
lb/sq i n . gage P1 ,
I so thermal
116 1 1 7 118 119 120 121
122 1 2 3 124 125 126
127 128 129 130 131
132 133 134 135 136
137 138 139 140 141 142 143
144 145 146 147 148 149
150 151 152 153 154
155 156 157 158 159 16C 1 6 1
1 I I I I 1 I 1
2 I
1
2
Iydrogen
J Iydr og en
1 1 1 J 1 1
Iydrogen
iydrogen
V i t rogen
N i t r oge r
N i t roger
N i t roger
520
I I 5i' I
520
520
5;I 510 5r 1
5 20
O u t l e t g a s
tempera- t u r e , T2 , O R
520
I 5r -I 5r I 1 5r
520
520
520
). 0124 .0178 .0232 .0285 .0338 .0391
). 0178 .0232 .0285 .0338 .0391
1.0178 .0232 .0285 .0338 .0391
1.0178 .0232 .0285 .0338 .0391
3. 0261 .0465 .0666 .0b66 .107C .127C .146C
3.0465 .0666 .086E .107C .127C .146C
0.0465 .086f .107C .127C .146C
0.0261 .046E . 0 6 6 € .086( .107( .127( .146(
1 . 3 0 2.00 2 . 7 0 3 .60 4 .60 5 . 6 0
2.00 2 .70 3.70 4.80 6.00
2 .00 2.70 3 .50 4.60 5 .80
2.00 2 .70 3.60 4 .80 5.90
0.70 1.10 1 . 9 0 2.50 3 .50 4 .50 5 . 6 0
1 . 2 0 1 . 9 0 2 .70 3 .60 4.65 5 . 9 0
1 . 2 0 2 .60 3.50 4.50 5 . 6 0
0 . 7 0 1 . 2 0 1 . 9 0 2.60 3 .50 4.60 5 .70
T o t a l s t a t i c
p r e s s u r e drop 9
Apt, lb / sq i n .
0.0210 .0415 .0550 .0770 .0875 .1070
0.0915 .1450 .1970 .2570 .3170
0.0415 .0550 .0770 .0975 .1170
0.0515 .0850 .1170 .1470 .1e70
0.0080 .0170 .0310 .0500 .0670 .0870 .1040
0.0460 .0850 .1350 .1870 .2470 .3070
0.0210 .0550 .0770 .0925 .1170
0.0090 .0230 .0410 .0700 .0990 .12m .1620
11

a n a l y t i c a l r e l a t i o n t h a t Nusselt number i s proportional t o the square r o o t of the Reynolds number (Nu a f i ( r e f . 7 ) ) . However, the downstream portion of the cylinder where t h e flow separates def ies analysis , and therefore experi- mental data must be used t o empirically pred ic t the t o t a l heat t r a n s f e r from such a surface. thickness, ve loc i ty d is t r ibu t ion , and a l s o the nature of the turbulent wake. If the cylinders are interwoven i n t o a mesh, the e f f e c t i v e heat- t ransfer area i s l e s s than the t o t a l mesh surface a rea due t o wire overlap. The absence of a general cor re la t ion f o r flow through porous media indicates t h e d i f f i c u l t y i n defining the geometrical f a c t o r s t h a t influence both the heat- t ransfer and pressure drop c h a r a c t e r i s t i c s of the system.
The presence of adjacent cylinders a f f e c t s t h e boundary layer
The usual dimensionless groups were used t o c o r r e l a t e the heat- t ransfer data by the r e l a t i o n
Nu = F[(Re)(Pr)] (13)
Variable f l u i d propert ies and mesh geometry s i g n i f i c a n t l y a f fec ted the magni- tude of these groups. The f l u i d propert ies were evaluated a t the average bulk, film, and surface temperatures t o determine which reference temperature b e s t represented the var iable property e f f e c t s . The changing geometry that the f l u i d encountered i n passing through the mesh w a s represented by the porosi ty f a c t o r included i n the def in i t ions of equivalent diameter A f l as defined i n the sect ion METHOD OF CALCULATION.
De and flow area
Figures 4(a), ( b ) , and ( e ) show the cor re la t ion of the hea t - t ransfer data on a bulk, film, and surface temperature basis , respect ively. Evaluation of the equilibrium f l u i d propert ies a t t h e surface temperature produced the b e s t cor re la t ion . The physical propert ies f o r hydrogen were taken from reference 8 and f o r nitrogen from reference 9 . The maximum deviation of the data from the correlat ing equation w a s k14 percent f o r the surface temperature cor re la t ion as compared t o +20 percent and t29 percent f o r the f i l m and bulk temperature correlat ions, respect ively.
The equation
( 1 4 ) Nus = 0.462 Res 0.53 Prs 0.40
represents the heat- t ransfer cor re la t ion of s i x h e l i c a l l y co i led wire meshes f o r the following range of propert ies and conditions:
(1) Porosity of 64 t o 72.2 percent
( 2 ) Wire diameter of 0.020 t o 0.035 inch
( 3 ) Surface temperature of 1400' t o 5200' R
( 4 ) Outlet gas temperature of 600' t o 2400' R
( 5 ) Mass ve loc i ty f o r hydrogen of 0 .4 t o 3 .1 pounds per second per square foot and f o r nitrogen of 4.5 t o 10.2 pounds per second per square foot
12

+- a 3 z ..... -
- c n c m L a 0 c
d VI L . a 3 z
VI
(b) Fluid properties evaluated at f i lm temperature. N ~ f l P r f . ~ = 0.50 Ref.552.
Reynolds number, Re,
(c) Fluid properties evaluated at surfacetemperature. N ~ , l P r f . ~ = 0.462 Ret53.
Figure 4. - Correlation of he-t-transfer data using cqu i l id r ium f l u id p r o p e r t i 6 evaluated at bulk, film, and surface temperatures.
13

(6) Heat flux of 0.5 to 8.3 Btu per second per square inch
(7) Pressure level of 1 atmosphere
Practically all of the heat-transfer data presented in the literature for I a mesh-type configuration were obtained at low-temperature constant property
conditions. program on compact heat-transfer surfaces (ref. 1). studied several woven wire mesh heat-transfer surfaces of different wire diame- ters and porosities. istics f o r each mesh but did not present a general correlation for all of the meshes. mesh test element was heated to a uniform temperature either in a furnace or by a stream of hot gas and then immediately subjected to a lower temperature gas stream. The time-temperature history of the gas leaving the test element pro- vides the information necessary to calculate the heat-transfer characteristics of the system.
The majority of these data were obtained by the Stanford-ONR These investigators
They were able to determine the heat-transfer character-
These data were obtained by a transient test technique whereby the
In reference 2, the Stanford-ONR data were revised by substituting the wire diameter d for the equivalent diameter De and applying a correction factor for that part of the surface area where the wires overlap and reduce the heat-transfer surface. The revised Stanford-ONR data for six meshes resulted in one general correlation.
Reference 3 studied air flow through electrically heated wire tube banks for variable property conditions. Their heat-transfer results based on the film temperature agreed fairly well with the single wire equation of refer- ence 10.
Figure 5 compares this report's correlation with the correlations of references 2, 3, and 10. The Prandtl number was excluded because it was similar for all investigations. A direct comparison was not possible because of the following differences :
(1) The fluid velocity for all correlations except reference 10 was based on average flow area throughout the mesh as defined by frontal area times porosity. For the single wire data of reference 10, the frontal velocity was used to characterize the flow.
(2) References 2, 3, and 10 used wire diameter as the characteristic dimension, whereas the equivalent diameter was used for the data of this in- vestigation.
(3) The data of other investigators were obtained at low temperatures under relatively constant property conditions as compared to the variable property data of this investigation.
(4) The total surface area was used to evaluate the heat-transfer coef- ficient for the data of this investigation because it was not possible to accurately define the amount of wire overlap as in reference 2.
The good agreement of the single-wire correlation of reference 10 and the
14

. 4 . 6 .8 1 Reynolds number, Re,
Figure 5. - Comparison of other correlations and data w i th correlat ion of t h i s invest i - gation.
multiwire tube bank data of reference 3 indicates that the e f f e c t of adjacent wires on heat t r a n s f e r i s not s i g n i f i c a n t i f the wires do not engage. The d i f - ferences i n the mesh cor re la t ions of reference 2 and t h i s repor t a r e indicat ive of the geometry differences between a woven w i r e mesh and an interwound c o i l mesh.
The s ignif icance of f igure 5 l i e s i n the f a c t t h a t a l l of the cor re la t ions have similar slopes approximating 0.5, which indicates t h a t the forced con- vect ive heat t ransfer f o r any mesh is primarily a funct ion of the laminar boundary layer conditions on the upstream portion of the mesh surface as defined a n a l y t i c a l l y by Nu cc C f i ( r e f . 7 ) . Deviations from t h i s square-root func- t i o n ind ica te the e f f e c t of turbulence created by the d i f f e r e n t types of mesh geometries. Differences i n the coeff ic ient C of the various cor re la t ing equations are due t o the geometrical factors such as equivalent diameter, flow area, and a c t u a l heat- t ransfer surface area. These f a c t o r s , which a r e d i f f e r e n t f o r each mesh, preclude a universal heat-transfer cor re la t ion f o r a l l meshes.
Pressure Drop
The f r i c t i o n pressure drop, as previously mentioned, i s made up of two inseparable components (1) a f r i c t i o n component, associated with the surface res i s tance of the wire mesh and ( 2 ) an expansion and contraction component, associated with the a rea changes the f l u i d encounters i n passing through the mesh. Some invest igators ( r e f s . 1, 11, 1 2 , and 13) have used the conventional Fanning equation, which i s generally used f o r f u l l y developed flow through tubes, t o c o r r e l a t e pressure drop data for mesh geometries. This has resu l ted i n individual cor re la t ions for each mesh. I n comparing wire mesh with packed beds it became apparent t h a t pressure drop i n both is dependent upon the same parameters, namely, flow r a t e , v i scos i ty and densi ty of f l u i d , porosity, packing, s ize , shape, and surface of the so l id . This indicated t h a t a pressure drop c o r r e l a t i o n similar t o that used f o r packed beds might a l s o be applicable t o wire mesh. Following i s a more detailed discussion on the methods used f o r c o r r e l a t i n g the f r i c t i o n pressure drop data.
15

.6 .
4 1 -1
Open symbols denote heated Solid symbols denote n o heat addition
~
1 a i 2 4 6 8x10³
Reynolds number, Re,
Figure 6. - Correlation of average hal f f r ic t ion factor w i th Reynolds number using conventional Fanning type correlation.
The conventional Fanning equa- t i o n used t o ca l cu la t e t he f r i c t ion - fac to r data i s expressed by
(15) f @@mDe 2 4 x 2 - - -
This equation w a s used by inves t i - gators i n references 1, 11, 12 , and 13. With the exception of t he data of reference 3, pressure drop data of the other inves t iga t ions has been isothermal. Since t h i s repor t includes pressure drop data with and without heat addi t ion f o r hydrogen and without hea t addi t ion f o r nitrogen, a var iab le property co r re l a t ion was used. Figure 6 shows f / 2 p lo t t ed . aga ins t Reynolds number f o r the heated and isothermal data for each of the
four 3- by 1-inch meshes t e s t ed . The mean f l u i d densi ty was evaluated on a bulk temperature bas i s (ey . ( 1 2 ) ) and the v i scos i ty on a surface temperature bas i s . Other combinations of evaluating f l u i d densi ty and v i scos i ty for t he heated data on bulk, f i lm, and surface temperatures were attempted but r e su l t ed i n more sca t t e r . A comparison of the var iab le property p l o t s of f i gu re 6 with similar isothermal p l o t s o f ’ r e fe rences 1 2 and 13 indica tes t he following
I s i m i l a r i t i e s e x i s t f o r meshes of d i f f e r e n t geometries but within approximately I the same porosity range:
(1) The f r i c t i o n f ac to r s a r e of the same order of magnitude
( 2 ) The slopes of the curves a r e similar f o r the same Reynolds number
(3 ) A gradual change of slopes occurs between d i f f e r e n t flow regimes with changing Reynolds number
( 4 ) The curves of the same type mesh sometimes cross
The conventional Fanning type equation although providing a means of evaluating f r i c t i o n f ac to r s of ind iv idua l mesh i s l imi ted i n use t o mesh f o r which pressure drop data has a l ready been experimentally determined. equation provides the only means of comparing the data contained herein with t h a t of other inves t iga tors . cludes the f a c t t h a t a general co r re l a t ion could be obtained by use of t h e conventional Fanning equation. e a s i l y converted t o a modified Fanning type equation, discussed later, and which has been successful ly used by previous inves t iga tors f o r packed bed geometries.
This
The complexity of t he flow through the mesh pre-
This l e d t o a method o f co r re l a t ion that can be
I I
16


Reference 4 discusses t h e fac tors t o be considered i n cor re la t ing parame- t e r s t h a t determine energy losses i n packed beds. survey of references applicable t o packed bed pressure measurements.
It f'urther gives a good
Reference 14 represents the pressure gradient by an equation of the form
2 = F(Re)
@L go:
where, f o r laminar flow, cP/& i s proportional t o the Reynolds number Re and, f o r turbulent flow, cP/& i s proportional t o the square of the Reynolds number R e 2 . I n a porous mesh, pressure losses a r e due t o both viscous shear and i n e r t i a e f f e c t s associated with laminar and turbulent flcw, respect ively. The pressure gradient according t o reference 1 4 can therefore be represented by the sum o f the e f f e c t s of both regimes weighted by the two geometry f a c t o r s a and p; t h a t i s ,
2 (a, Re + p R e 2 ) ( 1 7 )
cP --L
@mDZ & -
Dividing both s ides of equation ( 1 7 ) by Re pz/gpmD% yie lds
D@;p D2 m e = a , + p R e w
Since CL and p a r e constants dependent upon screen geometry, equation (18) i s i n the form of a s t r a i g h t l i n e ( y = mx + b ' ) .
f r i c t i o n fac tor (f = CSgpmDe/AI@) i s t h a t it i s a l i n e a r function of the Reynolds number and therefore p l o t s as a s t r a i g h t l i n e on an ar i thmetic sca le . A p l o t of the isothermal and heated data as shown i n f igure 7 indicates a s t r a i g h t l i n e can be drawn through the data of each of the four meshes as pre- d ic ted by equation (18). the addition of a porosi ty f a c t o r t o the l e f t s ide of equation (18) w a s attempted. This should provide a means of p l o t t i n g the data of a l l the meshes on a s i n g l e curve. The b e s t f a c t o r w a s found t o be a porosi ty cube term ( c 3 ) . This w a s determined t o be the optimum value, s ince l a r g e r powers of porosi ty although bringing the isothermal data c loser , caused the heated data t o re- spread s o it w a s no longer i n the order of porosity.
The advantage of t h i s form of 2
Since the mesh data p l o t i n the order of porosity,
Hence,
where a and j3 a r e 4-9 and 0.1095, respect ively, for the data of t h i s in- ves t iga t ion .
Figure 8 shows a p l o t of ~ P ~ P ~ D ~ E ~ / A L G ~ ~ as a funct ion of Reynolds number ranging from 200 t o 6000. This provides a s t r a i g h t l i n e cor re la t ion f o r
18

102 , I I I
Mesh Gas number
Reynolds number, ReS
Figure 8. - Pressure drop correlat ion oMained by modifying method used in reference 14 by porosity cube term.
t h e data of a l l the meshes for both heated and isothermal data t h a t has a spread of +25 percent. It should be noted t h a t t he v i scos i ty of the f l u i d i s evaluated a t the mesh surface temperature and the densi ty as defined by equa- t i o n ( 1 2 ) is evaluated a t the bulk temperature. Here again, a s with the con- vent ional Fanning type cor re la t ion , the heated data w a s i n bes t agreement with the isothermal data when the f l u i d propert ies were evaluated a t these temper- a tu re s .
It should be noted t h a t divis ion of both s ides of equation ( 1 9 ) by Reynolds number transforms t h i s equation i n t o a modified Fanning equation
I where a / R e i s the dominating term i n the laminar f l o w regime and p i s the dominating term i n the turbulent f l o w regime and ind ica tes the f r i c t i o n f ac to r approaches a constant f o r turbulent f low. where i n the turbulent region the f r i c t i o n f ac to r s f o r each mesh approach a constant value.
This i s c l e a r l y shown i n f igu re 6
An equation of t he form of equation ( 2 0 ) could have i n i t i a l l y been used t o obtain a cor re la t ion ; however, a p lo t of APgpmDe/&G2 aga ins t Re f o r each mesh does not p l o t as a s t r a i g h t l i ne and therefore increases the d i f f i -
19

c u l t i n obt i n i n
Figure 9. - Comparison of present correlating l ine with data of reference 3.
a cor re la t ion . Therefore, the approach previou l y d i s - cussed w a s used.
Figure 9 shows the data of reference 3 f o r flow of a i r through banks of v e r t i c a l rods using the cor re la t ion of t h i s report (eq. ( 1 9 ) ) . This ind ica tes t h a t a similar cor re la t ion might be obtained f o r d i f f e r e n t types of mesh. Due t o geometry differences a s ingle cor re la t ion f o r a l l mesh would not be ex- pected. However, i f enough data on d i f f e r e n t types of mesh were avai lable , geometry correction f a c t o r s could probably be found t h a t would enable a universal correlat ion t o be obtained.
Effect of Screen Bypass
The correlat ion of Nusselt number aga ins t Reynolds number as discussed i n the sec t ion Heat Transfer has been obtained with the mesh f i t t i n g i n t o the duct cross-sectional area such t h a t a gap of only 1/64 of an inch (about 3 percent bypass) e x i s t s along each 3-inch s i d e of the mesh. Experimental data with hydrogen as the coolant were obtained on one mesh heater of 0.030- inch-diameter wire with a bypass area of 25 percent.
By assuming t h a t a l l the heat generated i n the mesh i s t ransfer red to the
20

gas passing through the mesh, a heat balance can be made on a mesh with bypass as follows :
The amount of heat t ransfer red t o the gas can be represented by the heat- t r a n s f e r equation
where
f o r h, the hea t - t ransfer coef f ic ien t , the mesh cor re la t ion can be subs t i tu ted as
By combining equations (21) t o (24) , the following equation can be wri t ten f o r q:
0.53
*S 0.53 q = 2 O a 4 ks WMDe
1 + 0.462( )s --(-I De AflCLs “ ~ p , b
where ks and pS f o r hydrogen can be represented as approximate f’unctions of Ts by the following r e l a t i o n s :
ks = 1.8X10⁻⁷ TZe8 f o r 500° R > Ts < 3500° R (26)
= 9 . f o r 500° R > Ts < 5000’ R (27) S
For an experimental run the following data were taken LIPt. i s then solved for. However, as a means of checking the value of WM deter- mined from equation ( 2 5 ) , the t o t a l s t a t i c pressure drop f o r the mesh w a s ca l - culated w i t h equations (11) and ( 1 9 ) , where G i s based on the calculated
W, Ts, q, T1, Tz, and Hence a l l the parameters i n equation ( 2 5 ) are known except WM, which
value of WM flowing through the mesh. equations (11) and ( 1 9 ) i s then compared mesh and the bypass. The two values of within +25 percent, which w a s within the
The value of LIPt calculated from t o the experimental APt across the LPt, measured and calculated, checked range of data s c a t t e r . For the range
21

of conditions run with a 25 percent bypass area, as much as 65 percent of the flow goes through the bypass region.
To i l l u s t r a t e the d i f f i c u l t y encountered with bypass, f igure 10 compares a s e t of ex- perimental curves for a constant mass flow of hydrogen with and without bypass. heat- t ransfer eff ic iency, a heating element should be operated near i t s maximum tempera- t u r e . From f igure 10, it i s evident t h a t t o t r a n s f e r a given quant i ty of heat with bypass a much higher surface temperature i s required or f o r a given surface temperature much less hea t i s t ransferred. This could cause heater burnout i f a mesh heater were designed without consideration of flow bypass. I n order t o de- s ign a heater where the bypass a rea i s no longer ins igni f icant (-3 percent or more ) , ex- perimental bypass flow coef f ic ien ts a r e r e - quired i n addi t ion t o the hea t - t ransfer and pressure drop cor re la t ions .
For grea ter
Figure 10. - Comparison of heat t ransfer to gas with and without bypass from experi- mental data. Gas flow rate, 0.0199 pound per second; inlet gas temperature, 520' R; gas, h ydrog e n .
SUMMARY OF RESULTS
Heat t r a n s f e r and f r i c t i o n pressure drop data a t 1 atmosphere were ob- ta ined for forced convection of hydrogen and nitrogen through tungsten wire mesh e l e c t r i c a l l y heated t o surface temperatures up t o 5200O R . Outlet gas temperatures as high as 2400' R and Reynolds numbers from 200 t o 6000 with f l u i d properties evaluated a t surface temperatures were obtained. of flow bypass, r e s u l t i n g from a mesh heater not f i l l i n g a flow p s s a g e , w a s investigated for a bypass area of 25 percent. ta ined for the mesh t e s t e d i n t h i s invest igat ion:
The e f f e c t
The following r e s u l t s were ob-
1. A var iable property hea t - t ransfer cor re la t ion f o r h e l i c a l l y co i led wire mesh operating a t surface temperatures up t o 5200' R has been obtained based on mesh geometry with f l u i d propert ies evaluated a t the surface temperature.
2 . A pressure drop cor re la t ion f o r both isothermal and heated data has been obtained based on mesh geometry with f l u i d propert ies evaluated a t the surface temperature.
3. Comparison of experimental data with that of other inves t iga tors in- d ica tes a universal cor re la t ion f o r a l l types of w i r e mesh was not obtained because of the d i f f i c u l t y i n evaluating the equivalent diameter, surface area, and flow area t h a t determine the hea t - t ransfer , pressure drop, and f l u i d flow parameters.
22

4. Flow bypassing the mesh heater element can cause serious design problems. drop correlations are required to design a heater with bypass.
Experimental data in addition to the heat-transfer and pressure ~
Lewis Research Center, National Aeronautics and Space Administration,
I Cleveland, Ohio, April 15, 1965.
23

Ae
A f l
A f t
AS
b
C
cP
D
De
d
F
f
f ’
G
Q
h
I
k
L
N
Nu
P
p1
p2
AP
24
~
APPENDIX - SYMBOLS
current flow cross-sect ional area, sq f t
f l o w area, sq f t
f r o n t a l area, sq f t
surface area, sq f t
length of mesh, f t (except where otherwise noted)
constant
specif ic heat of gas a t constant pressure, Btu / ( lb) (%)
mandrel diameter, f t (except where otherwise noted)
equivalent diameter, f t ; four times void volume/surface area
wire diameter, f t (except where otherwise noted)
function
average conventional f r i c t i o n f a c t o r
average modified f r i c t i o n f a c t o r
mass ve loc i ty through mesh, lb / ( s e e ) ( sq f t )
accelerat ion due t o gravi ty , 32.2 f t / sec2
average heat- t ransfer coef f ic ien t , Btu/( s e e ) ( sq f t ) ( %)
current, amps
thermal conductivity of gas, Btu/( f t ) ( s e e ) ( % )
thickness of mesh i n d i rec t ion of flow ( c h a r a c t e r i s t i c length) , f t
number of p a r a l l e l c o i l s
Nusselt number, Me/k
pressure, lb/sq f t
i n l e t s t a t i c pressure, lb/sq f t
ou t le t s t a t i c pressure, lb /sq f t
f r i c t i o n pressure drop, lb /sq f t

I S
I T
Tb
Tb
v
I W
WM
CL
I P
E
"m
"1
"2
t o t a l s t a t i c pressure drop, lb/sq f t
Prandt l number, cpp/k
c o i l pi tch, f t / t u r n
r a t e of hea t t r a n s f e r t o gas, Btu/sec
gas constant, ( f t ) ( l b ) / ( l b ) ( %)
Reynolds number, DeG/p.
t o t a l wire length of h e l i c a l c o i l , f t
temperature, OR
average bulk temperature, (T1 + T2)/2, %
average pulk temperature of unmixed gas passing through screen,
average surface temperature, OR
T1 + T2/2,
i n l e t gas temperature, OR
o u t l e t gas temperature, OR
o u t l e t temperature of unmixed gas passing through screen, ?R
voltage
gas flow rate, lb/sec
gas flow r a t e through mesh, lb/sec
experimental screen geometry factor (viscous f l o w )
experimental screen geometry fac tor ( turbulent flow)
screen poros i ty
r e s i s t i v i t y of tungsten, ohm-ft
absolu te v i scos i ty of gas, lb/( s e c ) ( f t )
mean gas densi ty , (P1 + P2)/R(T1 + Tz), Ib/Cu f t
i n l e t gas density, lb/cu f t
o u t l e t gas densi ty , lb/cu f t
25

Subscripts:
b bulk
f f i lm
s surface
26

REFERENCES
1. Kays, W. M.; and London, A. L . : Compact Heat Exchangers. The National Press, 1955.
2 . Lapides, M. E . ; and Lawyer, J. E . : Summary of Analysis of Heat Transfer and Pressure Drop Information and Estimates Applicable t o A C - 1 Fuel Elements. General E l e c t r i c Co., Feb. 5, 1953.
3. Gedeon, Louis; and Grele, Milton D . : Forced-Convection Heat-Transfer and Pressure-Drop Character is t ics of a Closely Spaced Wire Matrix. RM E54D12, 1954.
NACA
4. Ergun, Sabri: Fluid Flow Through Packed Columns. Chem. Eng. Prog., vo l . 48, no. 2, Feb. 1952, pp. 89-94.
5. Anon.: Thermocouples and Thermocouple Extension Wires. Rev. Composite of RP1.9-RPl. 7 , I n s t r . SOC . Am., Ju ly 1959.
6. Anon.: Temperature, I t ' s Measurement and Control i n Science and Industry. American I n s t i t u t e of Physics. Reinhold Pub. Corp., 1941, p. 1318.
7. Eckert, E . R. G . : Introduction t o the Transfer of Heat and Mass. McGraw- H i l l Book Go., Inc., 1950, p. 95.
8 . Grier, Norman T . : Calculation of Transport Propert ies and Heat-Transfer Parameters of Dissociating Hydrogen. NASA TN D-1406, 1962.
9. Hilsenrath, Joseph, e t a l . : Tables of Thermal Propert ies of Gases. National Bureau of Standards Circular 564, NBS, Nov. 1, 1955.
10. McAdams, W i l l i a m H.: Inc., 1954.
Heat Transmission. Third ed., M c G r a w - H i l l Book Co.,
11. Coppage, J. E . : Heat Transfer and Flow Fr ic t ion Character is t ics of Porous Media. Tech. Rept. No. 16, Dept. Mech. Eng., Stanford Univ., Dec. 1, 1952.
1 2 . London, A. L.; Mitchell, J. W . ; and Sutherland, W . A.: Heat-Transfer and Flow-Friction Character is t ics of Crossed-Rod Matrices. J. Heat Transfer (ASME Trans.), ser. C, vol . 8 2 , no. 3, Aug. 1960, pp. 199-213.
I
I NO. 7, Oct. 1957, pp. 1558-1570.
13. Tong, L. S. ; and London, A. L.: Heat-Transfer and Flow-Friction Character- , i s t i c s of Woven-Screen and Crossed-Rod Matrices. ASME Trans., vol . 79, I
I 14. Morcom, A . R . : Fluid Flow Through Granular Materials. Trans. I n s t . Chem. Engrs., vol. 24, Mar. 1946, p. 30.
NASA-Langley, 1965 E-2821 27