a study of the connection between tv meteorologists and
TRANSCRIPT

A STUDY OF THE CONNECTION BETWEEN TV
METEOROLOGISTS AND THEIR VIEWERS
DURING SEVERE WEATHER BROADCASTS
A Thesis presented to the Faculty of the Graduate School
University of Missouri
In Partial Fulfillment
Of the Requirements for the Degree
Master of Science
By
DANIEL M. EBNER
Dr. Anthony Lupo, Thesis Advisor
December, 2013

The undersigned, appointed by the Dean of the Graduate School, have examined
the thesis entitled:
A STUDY OF THE CONNECTION BETWEEN TV METEOROLOGISTS AND
THEIR VIEWERS DURING SEVERE WEATHER BROADCASTS
Presented by Daniel M. Ebner
A candidate for the degree of Master’s of Science
And hereby certify that in their opinion, it is worthy of acceptance.
Dr. Anthony R. Lupo, Professor
Dr. Mark H. Palmer, Associate Professor
Dr. Patrick E. Guinan, Extension Associate Professor
Mr. Eric M. Aldrich, Instructor

ii
ACKNOWLEDGMENTS
The first person that I would like to thank is my brother, Nick Ebner, for going
through college and graduate school with me. Without him doing this with me,
graduate school would have been a much more difficult task. For the last five and
a half years of college, it has been great to have someone to study with and
someone there to help with ideas in the whole thesis writing process. The next
person that I want to thank is Mr. Eric Aldrich for being a mentor and a best
friend since I arrived at Mizzou. I have to thank Eric for convincing me to stay at
Mizzou and continue my education through graduate school. Eric’s support and
constant encouragement through the entire graduate school process has been
more than I can ever thank him for. I would like to thank Dr. Tony Lupo for being
my advisor and thesis committee chairman. His help on getting funding for me to
go to graduate school and all his help getting my research off the ground has been
much appreciated. I have to also thank him for letting me stop by his office
almost daily and his answering my hundreds of questions for class and all of my
research. I would also like to thank Dr. Mark Palmer and Dr. Pat Guinan for all
their help and knowledge they gave me to help put together my survey for this
research. Without their background in social science and working with the public,
I think my research would never have gotten to the point where it is today. The
last person I have to thank is my father, Jeff Ebner. He has supported me through
college in so many ways, I couldn’t even begin to list them. From sending me
money to making sure I had food to eat while I was away from home, if it were
not for him, I do not know how I would have made it through college the last five
and a half years.

iii
TABLE OF CONTENTS
ACKNOWLEDGMENTS……………………………………………..……………....ii
TABLE OF CONTENTS……………………………………………………..…………iii
LIST OF FIGURES…………………………………………………………….....……..v
LIST OF TABLES………………………………………………………..….…………viii
ABSTRACT………………………………………………………..………….…………..ix
CHAPTER 1: INTRODUCTION……………………………………………….…..…1
1.1 Severe Weather Statistics……………………………………………………….……..…1
CHAPTER 2: LITERATURE REVIEW…………………………………………….3
2.1 Relationship between the broadcasters and the viewer…………………..…..4
2.2 The public’s response to severe weather…………………………………………….5
2.3 Social media……………………………………………………………………………………7
2.4 Other forms of receiving weather information………………………………..…8
CHAPTER 3: DATA/METHODS………………………………………..…………..9
3.1 Survey……………………………….……………………………………………..........…….9
3.2 Data………………………………………………………………………………….………….11
CHAPTER 4: ANALYSIS……………………………………………………….…….15
4.1 Receiving weather information……………………………………………….………16
4.1.1 How viewers receive severe weather information…………………16
4.1.2 Why viewers trust sources of weather information………..….…18
4.1.3 Viewers and smart phones………………………………………………..….19
4.1.4 Viewers’ reactions to being sent weather information via text….21
4.1.5 Viewers and weather radios…………………………………………………24
4.1.6 Reasoning for buying or not buying a weather radio………………26
4.2 Tornado sirens and the public’s severe weather plans……………………….26
4.2.1 Ability of viewers to hear tornado sirens at work/school….……..27
4.2.2 Ability of viewers to hear tornado sirens at home…………..………29
4.2.3 The actions that viewers take when a tornado warning is
issued………………………………………………………………………………..33
4.2.4 Actions that would persuade viewers to seek shelter………..…….35
4.2.5 Does the public feel tornado sirens are an adequate way of
being warned about severe weather?....................................38
4.2.6 Viewers’ thoughts when a tornado warning is issued.……......41
4.3 Viewers’ perception of the media…………………………….……………………42
4.3.1 Why viewers trust the meteorologist they watch…………………….42

iv
4.3.2 Does the media do an adequate job informing viewers of
severe weather?.....................................................................44
4.3.2.1 Why viewers think the media does not do an
adequate job…………………………………………………………….…45
4.3.3 Viewers and their trust with the media……….………………….…46
4.3.3.1 Why viewers do not trust the media…….…………….…48
4.3.4 Viewers thoughts on whether the media over-dramatizes
severe weather………………………………………………………….….49
4.3.4.1 Why viewers do not trust the media……………….….…50
4.4 Publics’ of severe weather alerts………………………………….………………..51
4.4.1 What is a tornado watch?.............................................................52
4.4.2 What is a tornado warning?.........................................................53
4.5 Type of information viewers want to hear/see during severe weather
broadcasts………………………………….………………………………………….54
4.5.1 The type of information that viewers want to hear/see when
severe weather is approaching them……….……………………...57
4.5.2 The type of information viewers want to see during a severe
weather broadcasts………………………………………………….59
4.6 Viewer comments……………………………………………….………………………62
4.6.1 What meteorologists can do to better persuade viewers to
take immediate cover during severe weather………………..…….…62
4.6.2 Other viewer comments….………………………………………………66
4.7 Case study: Joplin, MO…………………………………………………………….….67
CHAPTER 5: CONCLUSION/RECOMMENDATIONS…..…………….……71
5.1 Conclusion and Recommendations………………………………………………….71
5.2 Future Work……………………………………………………...………………………...72
REFERENCES…………………………………………………………….……….…….77
APPENDIX A……………………………………………………………….……………78

v
LIST OF FIGURES
Figures Page
4.1 How viewers their receive weather information..............................................17
4.2 Weather information received by those living in rural areas and in the city…18 4.3 Percent of viewers who have cell phones…………………………………………………20 4.4 Viewers who owned smart phones based on age……………………………………….21 4.5 Would viewers seek shelter if sent information via text message?..................22 4.6 Percent of viewers who own weather radios……………………………………………24 4.7 Can viewers hear tornado sirens at their work/school?...................................27 4.8 Percent of viewers who cannot hear a tornado siren from their work/school
based on age…………………………………………………………………………………………28 4.9 Percent of viewers who cannot hear a tornado siren at their work/school
based on area of residence……………………………………………………………………..29 4.10 Can viewers hear a tornado siren at their homes?........................................30 4.11 Percent of viewers who cannot hear a tornado siren at home based on age
group……………………………………………………………………………………………………30 4.12 Percent of viewers who cannot hear a tornado siren from their home based
annual household income……………………………………………………………………….31 4.13 Percent of viewers who cannot hear tornado sirens from their home based on
place of residence………………………………………………………………………………….32 4.14 Actions taken by viewers during a tornado warning………………………………33 4.15 Actions that would prompt viewers to seek shelter during a tornado
warning………………………………………………………………………………………………..36 4.16 Action that would make viewers seek shelter immediately based on
gender…………………………………………………………………………………………………37 4.17 Viewers’ feeling about whether or not tornado sirens are an adequate way of
being warned about severe weather……………………………………………………….39 4.18 Viewers’ feelings about whether or not tornado sirens are an adequate way of
being warned about severe weather based on educational level………………….40

vi
4.19 Viewers’ feelings about whether or not tornado sirens are an adequate way of
being warned about severe weather based on annual household income………………………………………………………………………………………………...40
4.20 What viewers are thinking when a tornado warning is issued……………..…..41
4.21 The reasons that viewers trust the meteorologist that they watch………….…43
4.22 How viewers feel when asked if the media do an adequate job information them about severe weather……………………………………………………………………..45
4.23 Viewers who responded that they trust the meteorologist they watch expressed in percent………………………………………………………………………………47
4.24 Percentage of viewers would responded that they do not trust the
meteorologist the meteorologist they watch based on age group………………..48 4.25 Do viewers feel that the media over-dramatizes severe weather?.................49 4.26 Percent of viewers who feel severe weather coverage is over- dramatized
based on gender…………………………………………………………………………………….50 4.27 What viewers think a tornado watch is…………………………………………………..52 4.28 What viewers think a tornado warning is………………………………………………53 4.29 Percent of viewers who thought a tornado warning meant conditions were
favorable for tornadoes to develop based on education level. …………………….54 4.30 An example of how viewers were intended to answer this question………….55
4.31 An example of how most viewers answered the question…………………………56
4.32 The type of information that viewers want to hear/see when a storm is approaching them………………………………………………………………………………….58
4.33 The type of information that viewers want to hear or see during severe weather broadcasts, comparing the overall data to those living in a rural area and in the city……………………………………………………………………………………….59
4.34 The type of information do viewers want to hear during a severe weather broadcast……………………………………………………………………………………………..60
4.35 The type of information viewers want to hear during a severe weather broadcast comparing the overall data to those living in rural areas and in the city……………………………………………………………………………………………………….61
4.36 Actions that meteorologists can do to persuade viewers to seek shelter during severe weather broadcasts……………………………………………………………63

vii
4.37 Events that would make a viewer take shelter during a tornado warning, comparing the overall data to Joplin TV viewers………………………………..……68
4.38 Can viewers hear tornado sirens at work/school comparing the overall data to those who live in the Joplin TV market?......................................................69

viii
LIST OF TABLES
Table Page
Table 3.1 Analysis of the data based on gender………………………………………..……12
Table 3.2 Analysis of the data based on age…………………………………………….……13
Table 3.3 Analysis of the data based on highest educational level……………..…….13
Table 3.4 Analysis of the data based on annual household income……………..…..14
Table 3.5 Analysis of data based on TV market viewers watch…………………..……14
Table 3.6 Analysis of the data based on type of area viewers live in…………..…….15

ix
A STUDY OF THE CONNECTION BETWEEN TV
METEOROLOGISTS AND THEIR VIEWERS
DURING SEVERE WEATHER BROADCASTS
Daniel. M. Ebner
Dr. Anthony R. Lupo, Thesis Advisor
ABSTRACT
After the devastating tornadoes in Joplin, MO and in the Deep South in 2011, it
seemed appropriate to look at the impact that broadcast meteorologists (and
their TV coverage) have on their viewers during severe weather events. Broadcast
meteorologists play a vital role in the severe weather warning process and in
persuading the public to take the appropriate actions during severe weather. This
research was done by developing a survey that addressed the following questions:
1) Is the media doing everything they can persuade viewers to take shelter and
protect themselves and their property?; 2) What do you do when a tornado
warning is issued?; 3) Is there anything broadcast meteorologists can do or say
that will make you take immediate action during severe weather? The survey was
disseminated through television markets in Missouri. The goal of this research
was to find new, improved and different ways of “connecting” with viewing
during severe weather coverage. After looking at the results, we want to see if
there are specific words, images or anything else a broadcaster can do that will

x
trigger a response by viewers to take cover. It is my hope the results and analyses
from this survey will provide broadcast meteorologists with new and improved
techniques to connect with the public and to assist them in making an informed
decision during severe weather events.

1 INTRODUCTION
The purpose of this research was to evaluate whether broadcast
meteorologists can modify their delivery method to persuade viewers to seek
shelter during severe weather. The findings from this research will hopefully be
used during TV severe weather broadcasts with the ultimate goal of reducing
casualties and property damage during severe weather.
1.1 Severe Weather Statistics
It is important to look at statistics regarding deaths directly related to
severe weather. According to the National Climate Data Center (NCDC) and
during a period from 1991-2010, the United States averages 1,253 tornadoes
annually. In Missouri, there is an average of 45 tornadoes each year in the same
time period1.
The average number of fatalities related directly to tornadoes each
year in the United States is 57. In Missouri, the average number of fatalities
related to tornadoes is four each year, according to the National Weather Service
(NWS)2. The data are from the period of 1991-2010. The reason this period is
important is because it does not take into account the 2011 severe weather
season, which was a particularly deadly year due to tornadoes. A three day long
tornado outbreak occurred in the southern and eastern portions of the United
States between April 25-28, 2011. During this outbreak, there were 358
confirmed tornadoes in 21 states which was responsible for 316 fatalities (NWS
1 http://www1.ncdc.noaa.gov/pub/data/cmb/images/tornado/clim/ann-avg-torn1991-2010.gif
2 http://www.nws.noaa.gov/om/hazstats/resources/weather_fatalities.pdf

2
Deep South Assessment, 2011). The strongest tornadoes occurred during the last
day of the outbreak in Alabama, Mississippi and Georgia where several EF-4 and
EF-5 tornadoes occurred, including some that went through Tuscaloosa, Alabama
and Birmingham, Alabama (NWS Deep South Assessment, 2011). On 22 May,
2011, Joplin, Missouri was hit by a devastating EF-5 tornado that killed 161
people (NWS Joplin Assessment, 2011).
If the statistics from the 2011 severe weather season were included in
the overall tornado related fatalities rate, the average deaths each year climb
notably. There were 553 deaths related to tornadoes in 2011 which increases the
1991-2011 annual average to 80 deaths (up from an average of 57 deaths) due to
tornadoes (NWS). In Missouri, there were 161 deaths from tornadoes in 2011
which brings the annual average to 11 deaths in Missouri (up from an average of
four deaths).
Tornadoes are not the only form of severe weather to cause injuries
and fatalities. Although tornadoes cause the most destruction and are usually
perceived by the public as the severe weather phenomena that kills the most
people, that is not the case. Flooding results in the most deaths when all of severe
weather statistics are tallied. Between 1991 and 2011 flooding accounted for 86
fatalities. Lightning related fatalities are 46 annually. Statistics regarding straight
line wind related fatalities did not start until 1995. Between 1995 and 2011, an
average of 55 people perished annually from these events in the United States3.
The magnitude of wind was not included with the data, which means it is
unknown if the winds was above or below severe criteria. The criteria for a
3 Data from Jim Kramper at the National Weather Service in St. Louis, Missouri (LSX)

3
thunderstorm to be considered severe is it has to have wind greater than 58 mph,
hail greater than one inch in diameter and/or a tornado.
In Missouri, between 1991 and 2011, flooding and lightning accounted
for five and two fatalities respectively. Between 1995 and 2011, an average of one
person died annually from straight line winds in Missouri.
2 LITERATURE REVIEW
After the devastating and deadly tornadoes in Joplin, Missouri and
Tuscaloosa, Alabama in 2011, there was an increased interest in how the media
conveys severe weather information. With 161 fatalities in the Joplin, Missouri
tornado and 358 in the deep south (NWS, 2011), there is a need to understand
the connection between TV meteorologists and viewers during severe weather.
What can TV meteorologists do to help prevent such a large death toll from ever
happening again? A survey done after the 1 March 1997 tornado in Saline and
Clark county Tennessee indicates the public received their warnings from
television bulletins (Balluz et al. 2000). Another survey following the devastating
3 May 1999 tornado in Oklahoma City demonstrated that 89% of those surveyed
received tornado warning information from television weather broadcasts
(Hammer and Schmidlin 2002).
The results of these surveys propose an interesting question: What is
the relationship between TV meteorologists and their viewers? This relationship
is fundamental to the trust between viewers and TV meteorologists. It would
appear that viewers, who have a great deal of trust with their favorite
meteorologist, are more likely to heed their warnings and respond properly

4
during severe weather. Generally, this response would be to seek appropriate
shelter.
2.1 Relationship Between the Broadcaster and the Viewer
Many studies have shown how vital TV meteorologists are in the severe
weather warning process. Studies have shown that viewers form a perception of a
face-to-face relationship with “performers” in the media. One of the earliest
studies to show this relationship was by Horton and Wohl (1956). This
relationship can be seen with any public figure, including celebrities, movie stars,
athletes and even local news and weathercasters. This face-to-face relationship
was termed a “para-social relationship.”
Viewers feel a certain intimacy with people they see on TV (Horton and
Wohl, 1956). The para-social relationship a viewer builds with a “persona”
(meteorologists, in this case) is similar to the relationship built between two
friends and they feel as if they actually know this person. The more interaction
between the television meteorologist and the viewer, the deeper this intimacy
becomes (Altman and Taylor, 1973).
Another part of the relationship between TV meteorologists and their
viewers is a sense of dependability. Horton and Wohl (1956) tell how people come
to rely on these public figures to “appear on a regular basis;” they explain how
they are a “dependable event, counted on and planned for”.
Another study expands on the findings of Horton and Wohl showing that
viewers have a strong para-social interaction (PSI) with local weathercasters
(Sherman-Morris, 2005). PSI is another term for the relationship that is formed

5
between these two groups of people (Horton and Wohl, 1956). Sherman-Morris
(2005) found that the higher the degree of the PSI a viewer had with a
weathercaster, the more the viewer would trust the weathercaster.
The background and connection between the viewer and meteorologist has
been established, but the question of how viewers respond to meteorologists
during severe weather needs to be examined.
2.2 The Public’s Response
The public’s response to severe weather and warnings is very complex and
depends on the public’s perception of risk (NWS, 2011). This risk perception is
often molded by the trust between viewers and their favorite TV meteorologists.
Likewise, another factor that shapes a viewer’s decision to seek shelter is if they
trust the meteorologist they are watching. A survey in the mid-2000s indicated
the majority of respondents trusted the local TV meteorologist they watch.
Because of this trust, they would likely seek shelter if the local meteorologist
advised them to do so (Sherman-Morris 2005). Furthermore, PSI is related to
“trust in the recommendations of weathercasters” during severe weather, which
can help determine if the viewers will take the desired precautions and actions
during severe weather (Sherman-Morris 2005).
The 3 May 1999 tornado in Oklahoma City, Oklahoma was one of the most
destructive tornadoes documented. A few survey respondents said the language
used and what KWTV-9 meteorologist, Gary England, convinced them to seek
shelter. He told them they needed to be underground or needed to get out of the
path of this storm. They said Gary persuaded them to seek shelter or leave the

6
area they were in (Hammer and Schmidlin 2002). Horton and Wohl (1956) found
the more a performer “adjusts his performance to the supposed response of the
audience” the better chance the audience is to “make an anticipated response.”
One factor that influences the public response to severe weather is the “cry
wolf” effect. This occurs when the public is repeatedly told there is severe weather
and advised to seek shelter, but the warning ends up not being a threat to their
lives. Another factor that influences the public’s response to severe weather is the
“numbing” effect which causes people to feel as if they are not in imminent
danger (Schmidlin and King, 1997). This numbing effect can stem from a few
reasons: a large area being under a watch or a warning for an extended period of
time, as well as concentrated and long lasting television coverage of severe
weather. One example of this was from the 2010 New Year’s Eve tornado in St.
Louis, Missouri. On a television broadcast from KMOV-TV, a man said he had
been watching severe weather coverage all morning and finally turned it off
because it had been on for so long. He stated just after he did this, the tornado
struck his home.
Other reasons this “numbing” feeling by the public can occur are because
of the high false alarm rate (FAR) with severe weather and severe weather
warnings, particularly tornado warnings (Barnes et al., 2007). The high false
alarm rate during severe weather is also considered part of the “cry wolf effect”.
The FAR for tornado warnings was 74% and the FAR for all severe weather was
46%. These statistics were from period of 1 October 2007 to 1 April 2011 (NWS,
2011).

7
There is also a psychological and culture dimension as to whether the
viewer feels it is necessary to seek shelter during severe weather. A study in the
1970s looked at the difference in tornado deaths in the northern and southern
regions of the United States. The majority of people surveyed in the south believe
there are “external” forces that have “active” rolls in their lives; these were
described as God, fate and luck (Sims and Baumann, 1972). The opposite was the
case in the north. In the north the people surveyed were more prone to taking
responsibility for their own lives, meaning they were more willing to seek shelter
when advised to do so during severe weather. In the south, however, it was the
opposite. They felt there was fate, luck and, most importantly to them, God in
their lives and they were less likely to seek shelter when suggested to do so (Sims
and Baumann, 1972). These people believed no matter what they did, their life
was already planned out and there was nothing they could do to change it.
2.3 Social Media
In the days of social media, a TV meteorologist’s job does not end with their
television broadcasts. In this era of tablet computers and smart phones, social
media also plays an important role in warning the public of severe weather as TV
broadcasts do. Many viewers, especially the younger ones, in the age group of 18-
34, seek other ways to receive severe weather information. Social media plays a
vital role and internet sites like Facebook and Twitter provide a constant stream
of information. Young viewers are more dependent on new media and social
networking in addition to traditional television media (Farmer 2012). Social
media can be used by the viewers and meteorologists during times of severe

8
weather. Meteorologist can use social media to send out severe weather
information to quickly to their followers. Viewers can also participate in severe
weather coverage by sending pictures and weather updates about the weather
they are seeing where they are. When the meteorologists receive this information
from their viewers, they can pass it along to the rest of their followers on social
media. Social media allows for real-time information to be passed allow during
severe weather events.
2.4 Other Forms of Receiving Weather Information
Television broadcasts and social media updates are not the only sources
public receives severe weather information. One study revealed that television
broadcasts and warning sirens were the most common way of being warned
about tornadoes (Balluz et al. 2000). Many studies have shown while TV
broadcasts are the most popular way of receiving severe weather information,
many people want additional ways to verify information they are seeing on
television. In the 3 May 1999 tornado, many people used more than one indicator
before making the decision to seek shelter. A few of the indicators, besides TV
broadcasts, were outside weather conditions and phone calls from friends or
family (Hammer and Schmidlin 2002). One finding from the NWS Joplin
assessment found the majority of residents surveyed did not immediately go into
a storm shelter. Most of the residents of Joplin wanted to more information than
TV reports and tornado sirens before seeking shelter (NWS, 2011).

9
3 METHODOLGY AND DATA
A survey was developed to evaluate what TV viewers want to see during
severe weather broadcasts and what would persuade them to take immediate
shelter. This survey was used to get insight into what viewers are thinking during
severe weather. The survey was developed by the researchers at the University of
Missouri.
3.1 The Survey
There were 32 questions asked (the full survey can be seen in Appendix A).
This survey had several different types of questions: multiple choice, check all
that apply, and open-ended questions requiring a written response from the
viewer. The first seven questions were demographics to gain background
information from viewers participating in the survey. The following
demographic questions were asked:
Gender
Age
Highest educational background
Household income
TV market watched
County and state
Type of area of residence (i.e. city, suburbs, rural)
The next six questions asked how viewers received weather information and why
they used those sources:
How do you get severe weather information (sources)?
Why do you use/trust that source to gather information about severe weather?
Do you have a smart phone?

10
If you were sent information about severe weather and tornadoes in text message, would you be more likely to seek immediate shelter during severe weather?
Do you have a NOAA weather radio?
If yes to having a NOAA Weather Radio, what encouraged you to purchase one? If no, what is prohibiting you from purchasing one?
The next section of questions asked viewers about tornado sirens and their
severe weather plans:
If a tornado warning is issued, what actions do you take?
What would make you seek shelter immediately during severe weather?
Can you hear tornado sirens at your job/school?
Can you hear tornado sirens at home?
Do you feel tornado sirens are an adequate way of being warned about tornadoes?
When a tornado warning is issued, what do you think?
The next two questions asked viewers what type of information they felt was most
important during severe weather TV broadcasts:
What type of information do you want to see when a storm is approaching you (i.e. ETA, exact time, radar/maps, visual images)?
What type of information do you want to hear when a storm is approaching (i.e. county name, local landmark, school names, road/bridges, shopping centers, places of worship)?
Next, the public’s perception of the media and the TV meteorologists they watch
were examined:
Why do you trust the meteorologist you watch?
Do you feel the media does an adequate job informing viewers of severe weather?
If you do not feel the media does an adequate job, explain why.
Do you trust the media when they provide you with severe weather information?
If you do not trust the media when they provide severe weather information, explain why.
Do you feel severe weather coverage is over dramatized by the media?

11
If yes, explain why you think the media over dramatizes severe weather coverage.
Viewers were asked about their knowledge of severe weather alerts and what they mean:
What does a tornado watch mean?
What does a tornado warning mean? The final two questions were open ended questions requiring a response from
viewers:
What can a meteorologist do to better persuade you to take immediate action during severe weather?
Any other comments you have in general about meteorologists and their severe weather coverage are more than welcomed.
The last two questions were extremely important in this survey. They were
important because these questions allowed viewers to respond critically rather
than selecting answers from a list of possible responses. These responses were
invaluable because viewers were able to express their opinions about TV severe
weather coverage.
Every TV station in every TV market in Missouri was asked if they
would be willing to participate in this research. This survey was done online for
viewer convenience. Broadcast meteorologists were asked if they could post a link
to the online survey to their station Facebook pages, Twitter accounts, station
websites, blogs or any other means of getting the survey to their viewers via the
internet.
3.2 Data
A meteorologist was contacted at a total of 24 TV stations. As a side note, a
few of the stations were not actually in Missouri, but were part of TV markets that

12
provide TV broadcasts to the state of Missouri. Out of 24 stations contacted, only
12 responded saying they would participate. The list of stations that participated
is given below:
KTVI/KPLR – St. Louis, Missouri
KSDK – St. Louis, Missouri
KFVS/KBSI – Cape Girardeau, Missouri
WSIL – Harrisburg, Illinois
KRCG – Jefferson City, Missouri
KOMU – Columbia, Missouri
KYTV – Springfield, Missouri
KOAM/KFJX – Joplin, Missouri
KODE/KSNF – Pittsburg, Kansas
KSHB – Kansas City, Missouri
KQTV – St. Joseph, Missouri
KHQA – Quincy, Illinois There were 652 viewers that participated in the survey. An analysis of the data
based on demographics is listed below in Tables 3.1 through 3.6. The totals on
each table are not all equal because some respondents chose leave some of the
certain demographic questions blank.
Table 3.1: Data analysis based on gender.
Gender Number of Participants
Female 475
Male 170
Total 645

13
Table 3.2: Data analysis based on age.
Age Number of Participants
18-24 50
25-39 168
40-55 250
56-69 150
70+ 26
Total 644
Table 3.3: Data analysis based on highest educational level achieved.
Highest Educational Level Number of Participants
High School Diploma 128
Some College 226
College Degree 208
Master’s/Ph.D. 73
Total 635

14
Table 3.4: Data analysis based on annual income.
Household Income Number of Participants
$0 - $24,999 139
$25,000 – $39,999 122
$40,000 – $64,999 175
$65,000 - $99,999 119
$100,000 + 71
Total 626
Table 3.5: Data analysis based on TV market viewers watch.
TV Market Number of Participants
Cape Girardeau/
Harrisburg/Paducah
216
Columbia/Jefferson City 52
Hannibal/Quincy 41
Joplin/Pittsburg 161
Kansas City 7
Kirksville/Ottawa 2
Springfield 38
St. Joseph 1
St. Louis 40
Other 88
Total 646

15
Table 3.6 Data analysis based on type of area viewers live in.
Type of Area Lived In Number of Participants
City 234
Rural 340
Suburbs 68
Total 642
The data were analyzed statistically. First, the data were transformed into
percentages then analyzed using the chi squared analysis to test whether the data
were statistically significant between different groups in the demographics. For
example, when looking at gender, was there a difference between males and
females. The data were analyzed at the 90% confidence level (Neter et al. 1986).
4 ANALYSIS
The analysis section will go through the entire survey, question by question,
and evaluate the data received. These data were analyzed using the chi squared
test. This allowed all questions to be analyzed by each demographic category to
identify whether the distribution of the data was statistically significant between
different groups in the demographics. Each question was analyzed using the same
variable for each demographic category:
Type of area living in: compared city to rural
Age: compared 25-39 to 56-69
Gender: compared male to female
Highest educational level: compared college degree to high school degree
Household income: compared $0 - $24,999 to $65,000 - $99,999

16
TV market: compared Cape Girardeau/Harrisburg/Paducah to Joplin
Some of the questions in this survey required a written response from the
respondents. In order to statistically evaluate these questions, the responses were
broken into categories based on the responses received.
One of the demographics that would be useful broadcast meteorologists is
the question, “What type of area do you live in?” Meteorologists may change their
approach if viewers in rural areas respond better to certain things than viewers in
urban locations. This demographic was a key focus of this research.
Throughout the analysis section, quotes will be embedded from comments
of the viewers for questions that required a written response.
4.1 Receiving Weather Information
In this section, the public was asked how they receive and trusted those
sources of information.
4.1.1 How viewers receive severe weather information
The first question asked on the survey was in what ways do viewers receive
severe weather information. They were given a list of possible options: TV, radio,
NOAA weather radio, smart phone/weather apps, text messages, social media or
other.

17
Figure 4.1 How viewers receive their weather information.
In Figure 4.1, 595 (91.3%) respondents responded they received severe
weather information from TV weather reports. Smart phones and weather apps
were also used 366 (56.1%) of the respondents. The third highest response was
social media from 357 (54.7%) respondents. NOAA weather radios were used by
319 (48.9%) of those surveyed. One statistic that stands out is 90% of those
surveyed responded they received weather information from TV. One reason this
number could possibly be so high is because this survey was disseminated via TV
stations.
0
100
200
300
400
500
600
TV Radio Wx Radio Smart phones/wx
apps
Text Messages
Social Media
Other
Nu
mb
er
of
vie
we
rs
Sources of weather infromation

18
Figure 4.2 Weather information received by those living in rural areas and in the city.
Nothing significant was found when comparing rural verse city dwellers
(Figure 4.2). However, those in the city were 6% more likely to use smart
phones/weather apps to get weather information and 4% more likely to use text
messages for weather information. Those living in more rural areas were 6%
more likely to use a weather radio for weather information than those living in
the city.
4.1.2 Why viewers trust sources of weather information
The previous question asked viewers to select all sources they use to receive
weather information. The next question asked them why they trust that source
(or sources) for their weather information. This question was difficult to analyze
because viewers selected more than one source in the previous question; this
means it is hard to know which source(s) they were referring in their written
0 10 20 30 40 50 60 70 80 90
100
Pe
rce
nt
of
veiw
ers
Sources of weather information
Overall
Rural Area
City

19
answer. Overall, many of the answers said the reason they used the sources was
because they had a proven history of being reliable, up-to-date and accurate.
Here are some quotes from the respondents:
“Local people, reliable knowledge, information that is true in almost all cases.” – Male, City
“My local meteorologists provide enough information, visuals, etc that makes me feel at ease and well prepared if something does come my way.” – Male, City
One recurring theme was that viewers responded positively and had built a
strong connection with the TV meteorologist when he/she would respond to their
questions on Facebook or Twitter. The following quote reflects how viewer’s
thought it was a great way for them to receive severe weather and general
weather information.
“Very personal, in depth with details about my area, able to get individualized
responses from the people who post [on facebook]” – Male, City
4.1.3 Viewers and smart phones
Smart phones and weather applications for smart phone platforms, like
Apple and Android, offer multiple ways for viewers to receive severe weather
information. When viewers were asked if they owned a smart phone, 62% said
they did have a smart phone and 38% said they did not own a smart phone.

20
Figure 4.3 Percent of viewers who have cell phones. Statistically when looking at who owned a smart phone, there was a highly
significant difference between age groups. The younger viewers were more likely
to have a smart phone. Three out of every four of the respondents in the 18-24
age group had a smart phone compared to 56-69 group, in which 42% said they
had a smart phone as seen in Figure 4.4. There was also a statistical significance
when looking at the educational level; the higher the educational level, the
greater the chance they would have a smart phone. This was also the case with
household income. The higher the income, the likelihood the viewer owned a
smart phone increased. These results were expected by the researcher when
looking at who owned a smart phone. Comparing rural viewers to city viewers,
there was no difference between having a smart phone and not having one.
38%
62%
Do viewers have a smart phone?
No Yes

21
Figure 4.4 Viewers who owned smart phones based on age.
4.1.4 Viewers’ reactions to being sent weather information via text message
The next question asked was would viewers seek shelter if sent weather
information via text message. For this question written viewer feedback was
required. The purpose of this research was to determine what could persuade
viewers to seek shelter during severe weather. The viewers’ written comments
were put into four categories: Yes, No, Maybe and Don’t Text are seen in Figure
4.5.
0
10
20
30
40
50
60
70
80
18-24 25-39 40-55 56-69 70+
Pe
rce
nt
of
vie
we
rs
Age Group
Viewers who own smart phones

22
Figure 4.5 Would viewers seek shelter if sent information via text message?
The majority of the viewers, 67%, responded that they would be more likely to
seek shelter if they were sent severe weather information via text message. About
20% said they would not be more likely to seek shelter and approximately 10%
said they were unsure if it would persuade them to seek shelter immediately or
not.
The age group of 18-24 was most likely to seek shelter if sent information
via text message. The number of viewers who would seek shelter decreases as the
age group increases. Seventy three percent of the 18-24 age group responded yes
they would seek shelter if sent information via text; the 70+ age ground said yes
only 41% of the time. The reason for this decrease in whether viewers would seek
shelter is likely due to the older population no owning a smart phone or a cell
67%
21%
9% 3%
If You Were Sent Information Via Text Message, Would You Seek Shelter?
Yes No Maybe Don't text

23
phone with texting capabilities. When evaluating the rural versus city dwellers,
rural viewers were 4% more likely to seek shelter if sent information via text
message; however, this was not statistically significant.
When analyzing the data, most answers were either a “yes” or a “no”, but a
few interesting comments stood out that were not just a “yes” or “no”. Viewers
said that if they were sent a text message with severe weather information, they
wanted exact information in the text message to persuade them to take shelter
during severe weather. Along with text messages, a few viewers stated they had
tablet computers and would like to receive weather information on that device
because they do not have a cell phone, as seen by the following quotes from the
respondents:
“It depends on how precise it is. A text message about a tornado that is warned county-wide is not as precise as a text message that indicates exact cities or
locations in the county. The more precise the forecast, the more likely I am to seek shelter.” - Female, City
“It would prompt me to verify the weather. Many times the information is about
broad areas. I like to keep specific tabs on where I am.” – Female, Rural Area
Additional viewer quotes indicate they only wanted to receive a text message if it
were a true emergency, and did not want this service to be abused by TV stations:
“Only if it wasn't sent unless it was a TRUE EMERGENCY!!!!” – Female, City
“yes if it was not ‘overused’" – Female, Suburbs

24
4.1.5 Viewers and weather radios
NOAA weather radios are a vital tool in providing severe weather
information in a quick and timely manner. NOAA weather radios may be the only
line of weather information in the event power goes out and the public is unable
to receive important severe weather updates. Figure 4.6 shows that 56% of those
surveyed owned a NOAA weather radio.
Figure 4.6 Percent of viewers who own weather radios.
After analyzing the data whether viewers had a weather radio or not, there
was nothing significant between any of the demographics except the household
income. The higher the household income, the more likely they were to own a
weather radio. There was a difference of 17% between the $0-$24,999 and the
44%
56%
Do viewers have weather radios?
No Yes

25
$65,000-$99,999 income range of who owned a weather radio, otherwise, the
level of increase was very small, within a couple of percentages points. Those with
a higher annual household likely have more discretionary spending money to buy
things like weather radios, while those who make less would likely find it not a
necessity in their lives. When comparing city and rural viewers, those in rural
areas were 10% more likely to own a NOAA weather radio, however, this was not
statistically significant.
4.1.6 Reasoning for buying or not buying a weather radio?
There were many reasons why viewers decided to purchase or not
purchase a NOAA weather radio. Many people cite the 22 May tornado in Joplin
and other tornadoes that hit the state of Missouri in 2011 as to why they bought
weather radios indicated by quotes from respondents:
“Obtained one soon after Joplin's tornado.” – Female, City
“The spring a tornado hit Lambert airport was the worst spring I can remember and it prompted me to buy the radio for use during sleeping hours.”
– Female, Suburbs
Other quotes from viewers show that they bought them to be notified of severe
weather in the middle of the night. Another reason why viewers purchased
weather radios was because they lived in a more rural area, and that it is an
effective way to receive weather information when other forms, such as a TV
broadcast, are not available to them:

26
“All the severe weather we have at night. I like to know we can be alerted if something is going on.” – Female, Rural Area
“We live outside of town and cannot hear the weather sirens” – Female, Rural Area
When looking at the comments from 44% of those respondents who did
not have a weather radio, most of the reasoning behind why they did not have
them was because they were too expensive and others said they have other ways
of receiving adequate weather information. The following are quotes from
respondents:
“not enough money to get one” – Female, did not indicate area living in
“My smart phone has warned me well enough so no need at the time to get a weather radio.” – Male, City
4.2 The public’s reaction to severe weather
This section examines the public’s reaction to severe weather and what they
think and how they act if a severe weather warning is issued. This section will
also look at how well the public can hear tornado sirens.
Viewers were asked if they could hear tornado sirens at home and at their
work/school. Other research (Ebner, 2013) has shown many counties either do
not have tornadoes sirens in their county or, if they do, they are in the more
populated areas. On the survey, respondents were given three options if they
could hear tornado sirens: yes, no or sometimes.
27
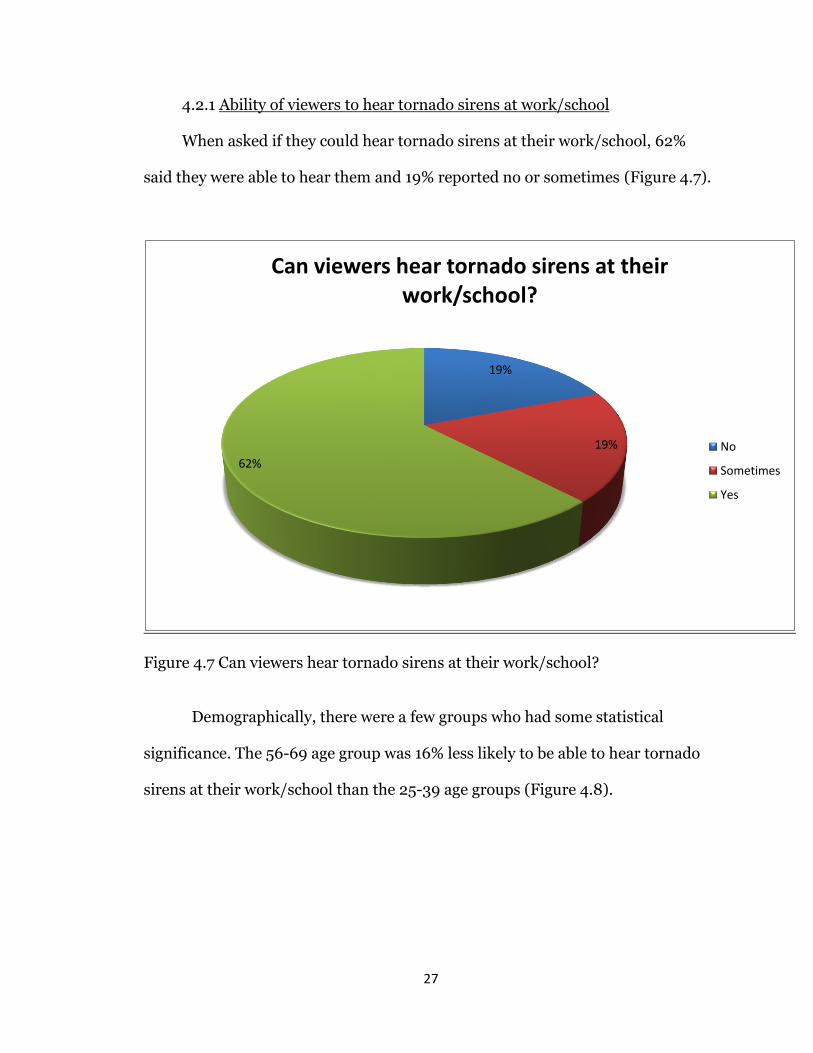
4.2.1 Ability of viewers to hear tornado sirens at work/school
When asked if they could hear tornado sirens at their work/school, 62%
said they were able to hear them and 19% reported no or sometimes (Figure 4.7).
Figure 4.7 Can viewers hear tornado sirens at their work/school?
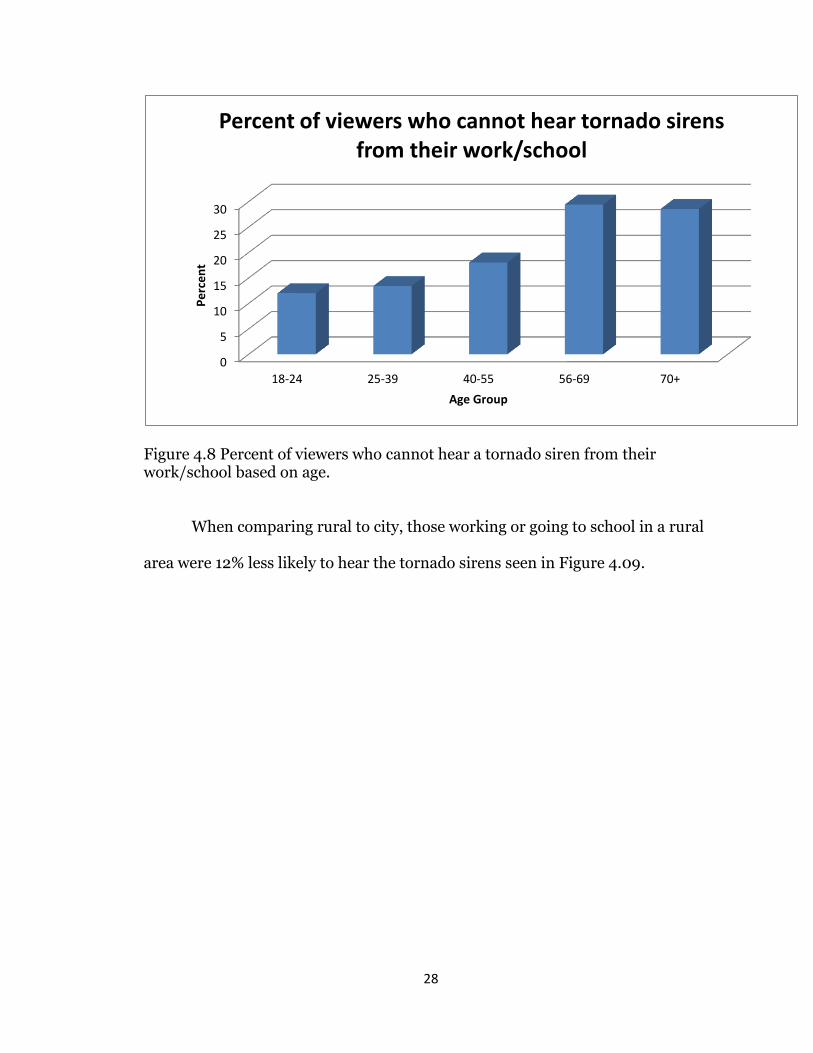
Demographically, there were a few groups who had some statistical
significance. The 56-69 age group was 16% less likely to be able to hear tornado
sirens at their work/school than the 25-39 age groups (Figure 4.8).
19%
19%
62%
Can viewers hear tornado sirens at their work/school?
No
Sometimes
Yes
28
Figure 4.8 Percent of viewers who cannot hear a tornado siren from their work/school based on age.
When comparing rural to city, those working or going to school in a rural
area were 12% less likely to hear the tornado sirens seen in Figure 4.09.
0
5
10
15
20
25
30
18-24 25-39 40-55 56-69 70+
Pe
rce
nt
Age Group
Percent of viewers who cannot hear tornado sirens from their work/school

29
Figure 4.9 Percent of viewers who cannot hear a tornado siren at their work/school based on area of residence.
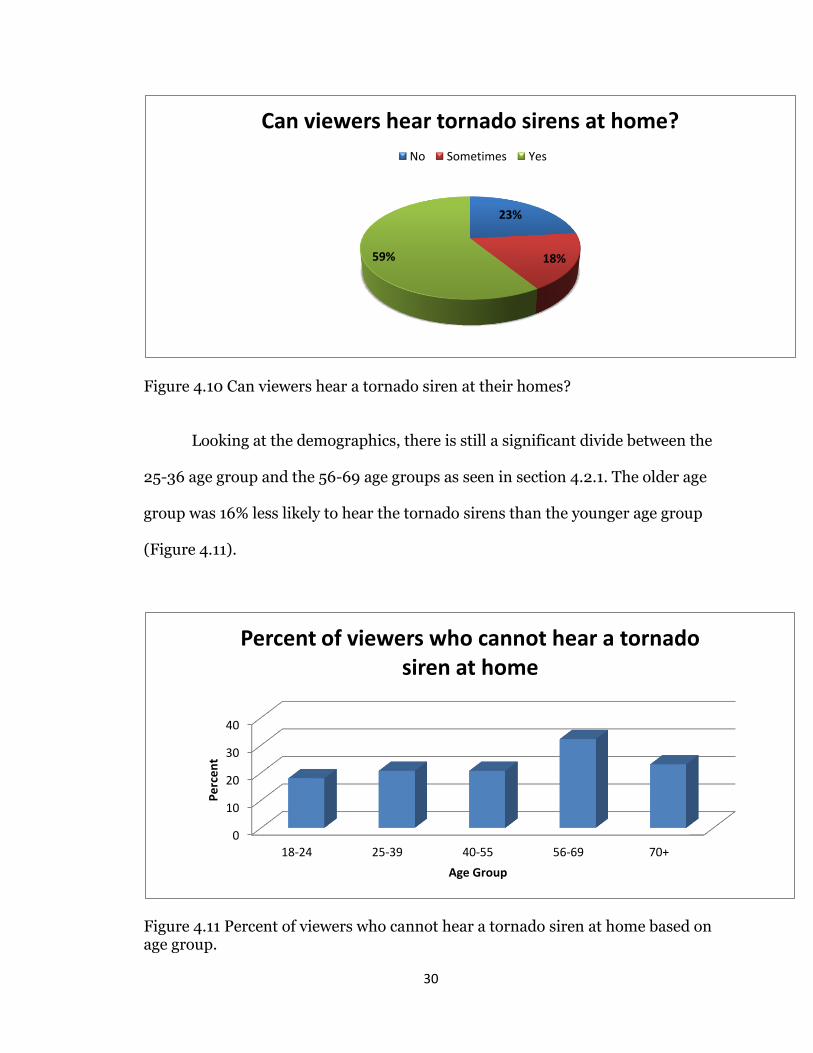
4.2.2 Ability of viewers to hear tornado sirens at home?
After asking if viewers could hear tornado sirens at home, Figure 4.10 shows
59% said they could and 23% said they could not.
0
5
10
15
20
25
30
City Rural Area Suburbs
Pe
rce
nt
Area of residence
Percent of viewers who cannot hear a tornado siren at their work/school
30
Figure 4.10 Can viewers hear a tornado siren at their homes?
Looking at the demographics, there is still a significant divide between the
25-36 age group and the 56-69 age groups as seen in section 4.2.1. The older age
group was 16% less likely to hear the tornado sirens than the younger age group
(Figure 4.11).
Figure 4.11 Percent of viewers who cannot hear a tornado siren at home based on age group.
23%
18% 59%
Can viewers hear tornado sirens at home?
No Sometimes Yes
0
10
20
30
40
18-24 25-39 40-55 56-69 70+
Pe
rce
nt
Age Group
Percent of viewers who cannot hear a tornado siren at home

31
The other demographic group that showed some significant difference was
in household income. The $65,000-$99,999 income bracket was 12% less likely
to be able to hear the tornado sirens at their homes. It’s hard to speculate why
these two demographics had such differences in whether they could hear the
sirens or not while at home (Figure 4.12). One reason, however, those in the
$65,000-$99,999 income bracket were less likely to hear tornado sirens in their
homes could be because the homes they live in might be more expensive and use
better building materials, which, in turn could make their homes more sound
proof from noises on the outside.
Figure 4.12 Percent of viewers who cannot hear a tornado siren from their home based annual household income.
0
5
10
15
20
25
30
35
$0-$24,999 $25,000-$39,999
$40,000-$64,999
$65,000-$99,999
$100,000
Pe
rce
nt
Annual Household Income
Viewers who cannot hear a tornado siren at their home

32
When comparing rural verses city dwellers, those living in the city were
31% more likely to hear the sirens at home, while those living in rural areas were
roughly 33% less likely to hear the sirens at home. When looking at just the rural
area, there was a 13% higher chance that the public could not hear sirens at their
homes compared to when they were at work seen in Figure 4.13.
Figure 4.13 Percent of viewers who cannot hear tornado sirens from their home based on place of residence.
The reason a 13% difference is significant here is because many people drive
to work or school from their home which is located in a rural area. This means
many people might be able to hear the sirens at their work or school, while not
being able to hear them when they return home. These results were expected by
the researcher. Another reason why viewers may not be able to hear a tornado
0
5
10
15
20
25
30
35
40
City Rural Area Suburbs
Pe
rce
nt
Place of Residence
Percent of viewers who cannot hear tornado sirens from their home

33
siren at their home or work is because tornado sirens are meant to be an outdoor
warning system only and are not meant to be hear indoors.
4.2.3 The actions that viewers take when a tornado warning is issued
Viewers were asked what their severe weather plan is if a tornado warning
was issued. Their responses were put into categories based on their written
answers. Those categories are as follows:
Seek shelter
Look for more information
Do nothing
Other
Figure 4.14 Actions taken by viewers during a tornado warning.
0
50
100
150
200
250
300
350
400
450
500
Seek shelter Look for more info Nothing Other
Nu
mb
er
of
vie
we
rs
Action
Actions taken during a tornado warning

34
As expected by the researcher, most of the respondents seek shelter immediately
when there is a tornado warning (Figure 4.14). However, 15% of those surveyed
said they would search for more information before they would decide to seek
shelter. To find more information, most viewers said they would either turn on
their TV and watch local media or check the radar to see if they were in
immediate danger; others said they would turn on their NOAA weather radio, a
scanner or listen to their ham radio. When looking at the data by each
demographic, there was no significance between the different demographics.
As seen in Figure 4.15, the majority of viewers seek shelter when a tornado
warning is issued, however, a few viewers stated they do not seek shelter in their
homes; they said they have to go to another location that has adequate protection
from a tornado.
Though most seek immediate shelter, as seen above, some look for
additional information before making a decision to seek shelter. Many quotes
from respondents revealed they check radar, smart phones/ weather apps or turn
to local weather reports before seeking shelter:
“[I] turn on the tv to see what's going on, if headed my way, then go to basement.” – Male, City
“Make sure to know the general track and then take shelter if it's anywhere near my area of the county.” –Male, City
“Look at radar on my phone and then decide where/ what to do.” –Female, Suburbs

35
One thing viewers said they do when a tornado warning is issued was grab
an “emergency kit” or “go” bag that has everything they would need in case a
tornado would hit their location. This is a positive sign that many people have a
plan and the appropriate items ready to go in case of severe weather. Quotes from
respondents are shown below:
“Grab the kids and the go bag and head for the shelter.” -Female, Rural Area
“Grab my purse and my emergency kit… and go into the basement.” - Female, Rural Area
4.2.4 Actions that would persuade viewers to seek shelter
To gain an understanding as to what would specifically persuade viewers to
seek shelter immediately, they were asked ask “What would make you seek
shelter immediately during severe weather?” Viewers were given four answers to
chose from: A phone call from a friend or family member, seeing the tornado (on
TV or in person), tornado siren or other.

36
Figure 4.15 Actions that would prompt viewers to seek shelter during a tornado warning.
When looking at the data overall, Figure 4.15 shows 281 (44%) of the
respondents felt that tornado sirens would be enough to persuade them to seek
shelter. One hundred and ninety five viewers (30%) said seeing the tornado on
TV or in person. Statistically speaking, there was some significance in the
different demographic categories .
There was a significant divide between men and women. Men were 18%
more likely to seek shelter if they see a tornado, whether was in person or on TV.
However, women were 14% more likely to seek shelter just based on hearing the
tornado sirens compared to men (Figure 4.16).
0
50
100
150
200
250
300
A phone call from a friend or family
member
Seeing the tornado (in person or on TV)
Tornado sirens Other
Nu
mb
er
of
vie
we
rs
Actions
Actions that would make viewers seek shelter immediately

37
Figure 4.16 Action that would make viewers seek shelter immediately based on gender.
Based on educational level, viewers that only had a high school diploma
were 10% more likely to seek shelter after receiving a phone call from a friend or
family member and 5% more likely to seek shelter after hearing just the tornado
sirens compared to those with a college degree. Those with a college degree were
15% more likely to seek shelter after finding out about a tornado from “other”
sources compared to those with only a high school diploma. It is difficult to know
what those other methods are because they were not asked to state what those
alternate ways would be.
When analyzing rural versus city, there was a significant difference in what
would persuade viewers to take shelter. In the city the public was 12% more
likely to seek shelter by just hearing a tornado siren when compared to those in
0 5
10 15 20 25 30 35 40 45 50
A phone call Seeing the tornado (in
person or on TV)
Tornado siren Other
Pe
rce
nt
Actions
Actions that would make viewers seek shelter immediately
Female
Male
38
rural areas. As seen in sections 4.2.1 and 4.2.2, those in rural areas are less likely
to hear tornado sirens at their homes and work/school. This would lead to a
conclusion that viewers in rural areas would rely less on tornado sirens as a way
to warn them about severe weather, meaning that they would likely rely on one of
the other actions (i.e. phone call, seeing the tornado on TV or in person, etc.)
before taking shelter.
4.2.5 Does the public feel tornado sirens are an adequate way of being
warned about severe weather?
Many people rely on tornado sirens, but do they feel the sirens do an
adequate job? Viewers were asked this and given three possible answers to
express their feeling about the siren system: yes, no and sometimes. Thirty seven
percent of responded tornado sirens do a good job of warning about severe
weather and 16% said the sirens are not an adequate way of being warned about
severe weather. The majority, 47%, responded tornado sirens sometimes do an
adequate job of warning about severe weather (Figure 4.17).

39
Figure 4.17 Viewers’ feeling about whether or not tornado sirens are an adequate way of being warned about severe weather.
When comparing the educational demographic, those with a high school
diploma were 19% more likely to think tornado sirens do an adequate job of
warning them about severe weather compared to those respondents who have a
college degree (Figure 4.18). Another small, but significant difference, was in the
income brackets. Those making less than $25,000 were 10% more likely to feel
sirens do an adequate job alerting to severe weather compared, to those making
between $65,000 and $100,000 (Figure 4.19). There was no statistically
significant when comparing those rural areas to urban locations.
16%
47%
37%
Are tornado sirens an adequate way of being warned about severe weather?
No
Sometimes
Yes

40
Figure 4.18 Viewers’ feelings about whether or not tornado sirens are an adequate way of being warned about severe weather based on educational level.
Figure 4.19 Viewers’ feelings about whether or not tornado sirens are an adequate way of being warned about severe weather based on annual household income.
0
10
20
30
40
50
60
High School Diploma
Some college College Degree Master's/Ph.D
Pe
rce
nt
Educational Level
Are tornado sirens an adequate way of being warned about severe weather?
No
Sometimes
Yes
0
10
20
30
40
50
60
Pe
rce
nt
Annual household income
Are tornado sirens an adequate way of being warned about severe weather?
No
Sometimes
Yes

41
4.2.6 Viewers’ thoughts when a tornado warning is issued
In order to understand what the public thinks during threatening weather,
they were asked what they think when a tornado warning is issued. They were
given four answers to chose from: Tornadoes never hit my house or happen here,
I do not need to do anything different, I must seek shelter or I should look
outside and see what is going on. These four answers were choices in the survey
because these are the four most common responses when severe weather
approaches. Overwhelmingly, Figure 4.20 shows that 461 (72%) viewers said that
they need to seek shelter when a tornado warning is issued and 165 (26%) of
viewers said that they would look outside and see what is going on.
Figure 4.20 What viewers are thinking when a tornado warning is issued.
0
50
100
150
200
250
300
350
400
450
500
I do not need to do anything different
I must seek shelter I should look outside and see what is
going on
Tornadoes never hit my house or happen
here
Nu
mb
er
of
vie
we
rs
Actions
Viewers' feelings when a torando warning is issued

42
Breaking the data down by the different demographics, there were some
significant differences between men’s and women’s responses. Women were 22%
more likely to seek shelter immediately, while men were 19% more likely to
decide to look outside and see what was going on.
Comparing rural areas to city areas, there was nothing significant
statistically in the data. Again, overwhelmingly, 73% in both areas said they need
to seek shelter, and 26% of both groups said they would look outside to see what
is going on.
One positive point to mention is that the number of people that said
tornadoes “never hit their house” was extremely low. Only three of those
surveyed responded with that tornadoes “never hit their house”.
4.3 The public’s perception of the media and TV meteorologists
This section examines the viewer’s perception and feelings toward the
media and the TV meteorologist that they watch. Many of these questions were
ones that required written feedback from viewers.
4.3.1 Why viewers trust the meteorologist that they watch
From previous research, it is known that viewers form a strong bond with the
meteorologist that they watch on TV. For this question, viewers were asked to
provide their own responses. Their written comments were taken and put into
seven categories based off their written responses:
Accurate
Always watched them
Don’t trust the meteorologist

43
They have experience/are knowledgeable about severe weather
Always keep them updated on the weather
Personable
Other
Figure 4.21 The reasons that viewers trust the meteorologist that they watch.
A meteorologist’s experience and perceived knowledge were the top reasons
why viewers trusted the meteorologist that they watch, as seen in Figure 4.21. The
second most popular response was that the meteorologist they watch was
0
20
40
60
80
100
120
140
160
180
Nu
mb
er
of
vie
we
rs
Reason
Reasons viewers trust the meteorologist that they watch

44
accurate. Quotes from viewers on why they trust the meteorologist they watch are
shown below:
“Knowledge of weather, caring demeanor, past experience” –Female, Rural Area
“Accuracy, honesty, knowledge, experience” –Female, City
The next highest response from viewers as to why they trust the meteorologist
they watch was the viewers felt that they were always kept up to date on severe
weather. Whether that was on air or by social media this was important to many
viewers. Quotes from respondents are listed below:
“They are very accurate and keep us updated minute by minute during bad weather” –Female, Rural Area
“He keeps people updated with information and current radar via TV, as well as posting information on the internet and through social media”
–Female, Rural Area
4.3.2 Does the media do an adequate job of informing viewers of severe
weather?
Viewers were asked if they thought the media does an adequate job
informing them about severe weather. Figure 4.22 shows overwhelmingly that
95% the media does an adequate job. There was nothing statistically significant
when the data was broken down and analyzed by each demographic.

45
Figure 4.22 How viewers feel when asked if the media do an adequate job information them about severe weather.
4.3.2.1 Why viewers think meteorologists do not do an adequate job.
A secondary question was asked which prompted respondents to explain
why they felt meteorologists do not do an adequate job informing them about
severe weather. There were roughly 40 comments by viewers who said they did
not feel meteorologists do an adequate job. A few comments from respondents
showed that they did think meteorologists do an adequate job because they
sensationalize severe weather for the purpose of ratings and viewership while
others said the meteorologist(s) they watch were inaccurate when providing
weather information. Quotes from respondents are listed below:
“With a few notable exceptions, it becomes just a job and a show/competition for ratings.” –Female, City
5%
95%
Adequate Job Informing About Severe Weather
No Yes

46
“They are often wrong when predicting storms and severe winter weather” –Female, Rural Area
A few of the other reasons respondents were not as satisfied with coverage
was because they said the TV station they watch ended TV coverage before severe
weather got to their location or the TV station they watch was never on air when
there was severe weather in their area. Quotes from those surveyed as seen
below:
“Sometimes they end coverage about the time it gets to our area, but at least we know what's coming.” –Female, Rural Area
“I know i trust WPSD for alot of my weather, but alot of instances i am searching for tornado warning updates, they are the only ones 'NOT' airing
breaking news, for some reason.” –Male, City
4.3.3 Viewers and their trust of the meteorologists
Because there is such a strong relationship between the viewers and the
meteorologist they watch on TV, viewers were asked if they trusted the
meteorologist when they provide the viewers with severe weather information.
Overwhelming, they responded that yes they do trust the media at 97% which is
seen in Figure 4.23.

47
Figure 4.23 Viewers who responded that they trust the meteorologist they watch expressed in percent.
Statistically, looking at the age brackets, there is a difference in those who
don’t trust the media. As age increases viewers are less likely to trust the media
when they provide severe weather coverage.
3%
97%
Do viewers trust the meteorologist they watch?
No
Yes

48
Figure 4.24 Percentage of viewers would responded that they do not trust the meteorologist the meteorologist they watch based on age group.
The 25-39 age group responded no 1% of the time, while the 56-69 age
group responded no 5.5% of the time (Figure 4.24). While this seems like a small
difference in percentage, when performing the chi squared test, it was proved
that this was statistically significant. When looking at rural verse the city, the
data falls in line with the overall data.
4.3.3.1 Why viewers do not trust the meteorologist they watch
Again, a secondary question was asked that prompted respondents to
explain why they do not trust the meteorologist they watch when that
meteorologist was providing viewers with severe weather information. There
were 11 comments total. The only common response from this question as to why
viewers did not trust a meteorologist was because they over-exaggerate severe
weather information as seen by their quotes below:
0
1
2
3
4
5
6
18-24 25-39 40-55 56-69 70+
Pe
rce
nt
Age group
Viewers who do not trust the meteorologist they watch

49
“Too often over hyped, dilutes message” –Female, Suburbs
“They too often exaggerate.” – Female, Rural Area
4.3.4 Viewers thoughts on if the media over-dramatizes severe weather
Viewers were asked if they feel that the media over-dramatizes severe
weather. The results were not conclusive. Figure 4.25 shows that 76% of the
respondents responded by saying they did not think the media over dramatizes
severe weather while 24% said that the media does.
Figure 4.25 Do viewers feel that the media over-dramatizes severe weather?
Demographically, there were some significant divides in the data. When
analyzing the gender group, men were 13% more likely to think that severe
weather coverage was over dramatized (Figure 4.26).
76%
24%
Over Dramatize Severe Weather
No
Yes

50
Figure 4.26 Percent of viewers who feel severe weather coverage is over- dramatized based on gender.
Looking at educational level, the higher the education level, the more
likely they think that the media over dramatizes severe weather coverage. Viewers
with only a high school diploma responded that yes, 15% of the time, the media
over-dramatizes severe weather coverage while 29% of those with a college
degree or higher, said the media over dramatizes coverage; this was a significant
finding statistically. Rural versus city dwellers had a small difference, which was
not significant.
4.3.4.1 Why viewers felt meteorologists over-dramatized severe weather
A secondary question was asked, which prompted respondents to explain
why they felt coverage was over dramatized. There were many more comments
on this question than the previous two. Again, many said they feel TV stations
0
5
10
15
20
25
30
35
Female Male
Pe
rce
nt
Gender
Viewers who feel severe weather coverage is over-dramatized

51
sensationalize severe weather in order to gain ratings and viewers for their
station however, others said that it depends on the station and the meteorologist.
Many viewers stated that it was different from meteorologist to meteorologist.
Quotes from respondents are seen below:
“one word ratings” –Male, Rural Area
“This is also on a meteorologist by meteorologist basis. I know some do make things more dramatic then they need to be. Others just stick to the facts.”
–Male, Rural Area
One set of comments that kept coming up was that sometimes it is alright to
“over-dramatize” severe weather because that is the only way people will listen
and take severe weather seriously. Some feel it is better to be a bit more dramatic
than under dramatic. Comments from the viewers are seen in the quotes below:
“Sometimes it is way over dramatized but then again that is how the message gets across” –Female, Rural Area
“If they do [over exaggerate], it's ok...better safe than sorry!”
-Female, Rural Area
4.4 Knowledge of severe weather alerts
Part of being a TV meteorologist is making sure that viewers understand the
different severe weather alerts. In this section, the knowledge of viewers’
understanding of severe weather alerts is examined. Viewers were asked if they
knew the definitions of a tornado watch and a tornado warning. Viewers were

52
given the same choices to select from for each question. The answers they could
select from are as follows:
Conditions are favorable for tornadoes to develop
A tornado has been spotted by a person or radar
There will definitely be a tornado today
4.4.1 What is a tornado watch?
First, viewers were asked what constitutes is a tornado watch. Ninety eight
percent of respondents knew that a tornado watch meant conditions were
favorable for tornadoes to develop (Figure 4.27). The only statistically significant
variable was in the educational level. Viewers with a only a high school diploma
were 4% more likely to think that a tornado watch meant there was an actual
tornado compared to those with a college degree. There was no difference rural
and city dwellers; however, those who lived in rural areas were 2% more likely to
think a tornado watch meant a tornado had been spotted.
Figure 4.27 What viewers think a tornado watch is.
0 100 200 300 400 500 600 700
A tornado has been spotted by a person or
radar
Conditions are favorable for
tornadoes to develop
There will definitely be a tornado today
Nu
mb
er
of
vie
we
rs
Options
What viewers think a tornado watch is

53
4.4.2 What is a tornado warning?
On the next question, viewers were asked “what is a tornado warning”.
Figure 4.28 shows that the majority, 96%, knew that a tornado warning meant a
tornado has been spotted in person or by weather radar (Figure 4.28). As in the
previous question, the only demographic where there was a significant difference
in the data was in educational level. The percentage of those with only a high
school diploma who knew what a tornado warning was only 90% compared to
those with a college degree at 97.5%. When looking at rural area verses city
dwellers, there was nothing significant in the data.
Figure 4.28 What viewers think a tornado warning is.
When comparing the two questions, the percentage of people who did not
know what a tornado warning was compared to those who did not know what a
tornado watch was showed had increase of two percent from two to four. Overall,
0
100
200
300
400
500
600
700
A tornado has been spotted by a person or
radar
Conditions are favorable for tornadoes
to develop
There will definitely be a tornado today
Nu
mb
er
of
pe
op
le
Options
What is a tornado warning?

54
the higher an educational level achieved by a viewer, the higher the chance of
knowing the difference between a tornado watch and a tornado warning. Those
with only a high school diploma were 9% more likely to think that a tornado
warning meant conditions are favorable for a tornado to develop while those that
had a college degree responded with the same answer only 2% of the time (Figure
4.29); this difference was significant.
Figure 4.29 Percent of viewers who thought a tornado warning meant conditions were favorable for tornadoes to develop based on education level.
4.5 Information in severe weather broadcasts
The next two questions the viewers were asked were what type of severe
weather information do they want to see and/or hear during severe weather
broadcasts and were given two different sets of choices to select from. The
0
1
2
3
4
5
6
7
8
9
High School Diploma
Some college College Degree Master's/Ph.D
Pe
rce
nt
Educational level
Viewers who responded that a tornado warning meant conditions were favorable for tornadoes to
develop

55
objectives for these two questions were to find out what were the most effective
words or visual cues TV meteorologists can says or do on-air that would
strengthen their connection with their viewers. For the first question, viewers
were asked to rank a set of choices one through five and for the second question
one through six based on which item was most important to them when watching
a severe weather broadcast. Selecting one was the least important to them and
selecting five (or six, depending on which question) was the most important to
them.
After analyzing these two questions a problem arose. Viewers did not
follow the instructions exactly. What was wanted from the viewers was to have
them rank the answers one through five or six, with each numerical value only
being chosen once. For example, as seen in Figure 4.30: County Name = 6, Local
Landmark = 5, School Name = 4, Road/Bridges =3, Shopping Centers = 2 and
Places of Worship = 1
Figure 4.30 An example of how viewers were intended to answer this question.

56
What most viewers actually did was rank them individually instead of as a group,
as seen in Figure 4.31, giving some answers the same numerical values as others.
For example: ETA = 5, exact time = 5, severe weather threats = 5, radar/maps =
5, visuals = 5.
Figure 4.31 An example of how most viewers answered the question.
This made the data too complicated to analyze because viewers did not follow the
directions. Perhaps, the directions for these two questions were unclear to the
viewers. We expected a ranking response which would have told us which choices
from the list were selected by the majority of the viewers. The data was weighted
and then averaged. For example, ETA was had been given a rank of a five (on a
scale of five) 410 times; 410 was then multiplied by five (as its weight) to give us a

57
numerical value of 2050. ETA was given a rank of a four, on a scale of five, 109
times. 109 was then multiplied by four (as its weight) to give us a numeral value
of 435. This same method was done for the ranks of three ,two and one. These
five numbers were added up giving us 2751 as a total weighted number for each
ranking (one through five). The total of 635 was multiplied by five (as its weight)
and it gives us a numeral value of 3175. 2751 was divided by 3175 to give us
85.51%. This same method was done for exact time, severe weather threats,
radar/maps and pictures/sky cams. Once a percentage was found, five was
multiplied by that percentage to find an average out of five. In this case,85.51%
was multiplied by five to give us a numerical value of 4.28. This average out of
five was used to find which item viewers wanted to hear/see the most during
severe weather broadcasts.
4.5.1 The type of information that viewers want to hear/see when severe weather
is approaching?
This question was asked to find out what type of information is most
important to viewers to help them make an informed decision to seek shelter
during severe weather. The answers that viewers were asked to rank 1 through 5
were:
How long until it reaches your area (example: ETA 45 minutes)
Exact time until it will reach you area (example: 5:15 pm)
What severe weather threats to expect
Radars/maps
Visuals (pictures, sky cams, etc).

58
Figure 4.32 The type of information that viewers want to hear/see when a storm is approaching them.
Overall, Figure 4.32 shows that ETA had the highest average of 4.28/5, and
the lowest average was picture/sky cams, which had an average of 3.44/5. The
only demographic category that was used to analyze for this question was the
type of area someone lives, as in seen in Figure 4.33 . When comparing rural
viewers versus those who live in the city, the statistical analysis showed that there
was no difference between the two groups.
0
1
2
3
4
5
ETA Exact Time Svr Wx Threats
Radar/Maps Pics, Skycams
Ave
rage
(o
ut
of
five
)
Type of information
Information viewers want to see during severe weather broadcasts

59
Figure 4.33 The type of information that viewers want to hear or see during severe weather broadcasts, comparing the overall data to those living in a rural area and in the city.
4.5.2 The type of information viewers want to see during a severe weather
broadcast?
This question was asked to see how meteorologists can make a severe
weather broadcast personal to viewers. It was the researcher’s hypothesis that if
TV meteorologists can make a personal connection with a place, name or
landmark that is familiar with the viewer this would be one way to help persuade
viewers to seek shelter immediately during severe weather.
The viewers were asked to rank the following choices 1 through 6 as to
which one was most important and least important. As in the previous section,
0
0.5
1
1.5
2
2.5
3
3.5
4
4.5
ETA Exact Time Svr Wx Threats
Radar/Maps Pics, Skycams
Ave
rage
(ou
t o
f gi
ve)
Information viewers want to see
Information viewers want to see during severe weather broadcast
Overall
City
Rural

60
most viewers did not follow the directions properly. The choices that they had to
choose from were as follows:
County name
Local landmark
School names
Roads/bridges
Shopping centers
Places of worship
These choices were selected because this is a wide variety of landmarks
familiar to different types of people. Those who live in more rural areas may
identify with different landmarks than those do in more urban areas. The
researcher’s hypothesis was that those in more rural areas would identify more
with shopping centers and places of worship.
Figure 4.34 The type of information do viewers want to hear during a severe weather broadcast.
0
1
2
3
4
5
6
Ave
rage
(ou
t o
f si
x)
Information
Informaton viewers want to see/hear during a severe weather broadcast

61
The choice that had the highest average at 5.28/6 was that viewers wanted
to see the county name and the lowest was hearing about shopping centers
(Figure 4.34). Again, when comparing rural viewers versus those who lived in the
city (Figure 4.35) there was no differences. There was nothing that was
statistically significant in the data. Although county name stands out as the
number one thing viewers want to hear during a severe weather broadcast, what
will be seen in the next section is that this really is not entirely true; viewers
much prefer to see something else according to their comments.
Figure 4.35 The type of information viewers want to hear during a severe weather broadcast comparing the overall data to those living in rural areas and in the city.
0
1
2
3
4
5
6
Ave
rage
(o
ut
of
six)
Information
Information viewers want to hear during a severe weather broadcast
Overall
City
Rural

62
It is impossible to draw any conclusion from the last two sections of data.
What can be seen here is that viewers want as much data as meteorologists can
provide them so that they can make an accurate and informed decision about
seeking shelter during severe weather.
4.6 Viewer Comments
The last two questions were questions that required written responses
from viewers. These two questions were extremely important to this research
because it allowed viewers to give their written opinions about TV meteorologists
and their severe weather coverage rather than select from pre-chosen options.
The two questions that were asked at the end of the survey were the following:
What can a meteorologist do to better persuade you to seek shelter during severe weather?
Any other comments that you have in general about meteorologists and their severe weather coverage are more than welcome.
Like the previous questions that required a written response from viewers,
to analyze these, they were placed in categories by the responses that they wrote.
4.6.1 What meteorologists can do to better persuade viewers to take
immediate shelter during severe weather
All the comments were put into the following categories (Figure 4.36):
Change nothing/they do a great job already
Be specific/exact with location and time
Keep them constantly updated
Look outside and see what’s going on
Spotted by person or radar
Pictures/ videos
Change in voice/action

63
Cut down on hype/drama
Other
Blank
Figure 4.36 Actions that meteorologists can do to persuade viewers to seek shelter during severe weather broadcasts.
The first suggestion as to what meteorologists can do to better persuade
viewers to seek shelter during severe weather is to be as specific and exact as
possible with the location and timing of a storm. Respondents said that this is a
critical factor when they are making the decision to seek shelter or not. Most said
that they search for more information prior to making a decision to seek shelter.
0
20
40
60
80
100
120
140
160
180
Nu
mb
er
of
vie
we
rs
Actions meteorologists can do
Actions that meteorologists can do to persuade viewers to seek shelter

64
Many said that they do not want to hear the county name as much as they want to
hear the city name, because counties are too large of an area. Viewers also want a
hyper-local view of storms. Viewers want to see the streets that a storm will cross.
This is one of the ways to make severe weather “personal” to them. If
meteorologists can make their TV broadcast personal for their viewers, they will
be more likely to heed the warnings that meteorologists give and will seek shelter.
There written responses are seen in the quotes below:
“Telling an area of the warned county that is under direct threat, i.e. Boone County north of I-70 and south of MO 124.”- Male, City
“Tell more detail of path and location... not just "east side of county" Give me more specifics about where the tornado is located. Is it in my backyard
or just in my county? I live in one of the largest counties in Missouri.” – Female, Rural Area
“Be more specific when issuing warnings. For example, saying "Tornado Warning is issued for Johnson County" doesn't narrow the gap. The county is
very wide. Be more specific stating specific city names as well as stuff like "Northeast Johnson County" or "Southern Johnson County" but don't include
the entire county.” – Male, Rural Area
“When severe weather is in my area I tend to want to know how local.. Meaning is it in my neighborhood. Butler co. is a wide area and 30 miles north or south
of me makes me think i have plenty of time to seek shelter.” -Female, Rural Area
Next, viewers said that they wanted to be constantly updated during severe
weather. Some feel like they aren’t given enough information because they live in
a rural area and that the bigger cities are the ones that get most of the severe
weather coverage focus. Others stated that TV stations go off the air after the

65
threat for the major cities is over, leaving those in rural areas to find alternate
ways of receiving the necessary information. Quotes from the viewers can be seen
below:
“…keep the weather situation updated in a timely manner” – Male, Rural Area
“Since we live so far west of TV station, the bad weather is usually gone before we get the information.”- Female, Rural Area
Along with being updated on air, many people want to be updated on
social media whether that is via Facebook or Twitter.
“Use social media sites like facebook and twitter to send weather updates,
frequently.” –Female, Rural Area
“Continuing coverage, up to date, responds to questions on social media.” -Female, Rural Area
“I would love to see more TV meteorologists use social media, especially because satellite coverage (which we have) is notoriously unreliable during storms. By
the time a storm approaches, we usually cannot count on the TV signal, so I rely upon the information on my smartphone, especially real-time Twitter updates
from the #tristatewx hashtag” – Female, Rural Area
Some viewers said that for them to make an informed decision they want
to know if a tornado has actually been spotted or is only radar-indicated. They
said that depending on if it was actually on the ground or just spotted on radar,
this would influence their decision making process of whether to seek shelter or
not.
“I think it is very helpful when the meteorologist says if a tornado has actually touched ground or not. That way we are completely sure we are under shelter
and ready.” – Female, Rural Area

66
“Let me know if there is something actually on the ground or if it is just possible rotation. However, I have 2 small kids, so once there is a warning, we are in the
basement.” – Female, Rural Area
“To let them know that one has been spotted and the location where it was seen. Or if it is the radar seeing rotation and one hasn't been spotted yet.”
- Female, Rural Area
Respondents also stated that if there was a tornado they would like to see live
video of it, if possible. Viewers said that video would influence their decision
making process when deciding if they needed to seek shelter or not.
“Live coverage of the tornado through chaser tv, tower cam, or some other source. When it's just a map some viewers don't grasp the danger.”
– Male, Rural Area
“Give live footage, even if remote non-human cameras”. –Male, Suburbs
Many viewers said that meteorologists do a good job with the severe
weather coverage and there is nothing that needs to be changed.
“Keep doing what they are doing, which is a good job!” – Male, Rural Area
4.6.2 Other viewers comments
The final question that was asked was for any other comments that the
viewers had about severe weather. Generally these comments were along the
same lines as the previous questions and most comments were repeats of what
has already been stated in above sections.

67
4.7 Case Study: Joplin, MO
Because this research was done using TV markets in Missouri, an
opportunity arose to survey the viewers in the Joplin, Missouri market. Due to
the devastating tornado that went through Joplin on 22 May 2011, these viewers
have a totally different perspective on severe weather than most of the others that
were surveyed. Due to this, Joplin made a very interesting case study in this
research to determine if their responses differ significantly than the overall
results because of their experiences with such a deadly tornado. Another
important reason for this case study is to see if there is anything that the TV
meteorologists did in Joplin that made a life-saving difference that can be shared
with other TV meteorologists. All of the questions that have already been
examined were re-examined to look for anything significant that would make
Joplin stand out within the data.
After re-analyzing the data for just the viewers in the Joplin, Missouri
market, only a few of the questions were significant, statistically, when compared
to the overall results. The first question that was much different was “What would
make you seek shelter immediately?”Twenty percent of respondents from Joplin
said that seeing the tornado on TV or in person would make them seek shelter;
this is compared to the overall survey response of 30% who would need to see the
tornado in some form before they would seek shelter.
Those who responded to tornado sirens overall was 44%, while those in
Joplin who said they would only seek shelter if they heard the sirens was
significantly less at 26%. One reason that many in the Joplin area may not seek

68
shelter when hearing tornado sirens was because of the repetitive nature of the
tornado sirens on 22 May 2011. The tornado sirens would sound, end and then
proceeded to sound again a few minutes later. This could have led to some
confusion of the public, leading them to not rely on the sirens. Forty nine percent
of those in Joplin responded with the “other” category compared to 19% from the
overall data. For this answer it is difficult to determine what “other” ways would
persuade viewers to seek shelter during severe weather, because they were not
prompted to provide any answer as to what that other way would be. In
hindsight, viewers would have been asked what those “other” events that would
make them seek shelter during severe weather (Figure 4.37).
Figure 4.37 Events that would make a viewer take shelter during a tornado warning, comparing the overall data to Joplin TV viewers.
0
5
10
15
20
25
30
35
40
45
50
A phone call from a friend
or family member
Seeing the tornado (in
person or on TV)
Tornado sirens Other
What Would Make You Seek Shelter?
Overall
Joplin/Pittsburg

69
The next question that was significantly different was “can you hear
tornado sirens at your work/school?” Overall, viewers said 19% of the time they
can hear it “sometimes,” and those in the Joplin area said they could hear the
sirens at work/school 34% of the time (Figure 4.38). Here it is hard to speculate
why there is a large difference in the “sometimes” answer.
Figure 4.38 Can viewers hear tornado sirens at work/school comparing the overall data to those who live in the Joplin TV market?
When looking at NOAA weather radios, there was no difference between
Joplin and the overall data. However, when asking viewers why they have a
weather radio, many of them said the reason why they now have a weather radio
was due to the Joplin tornado. Viewer’s quotes are seen below:
“The Joplin tornado was the deciding factor in finally purchasing a NOAA radio” – Female, Rural Area
0
10
20
30
40
50
60
70
No Sometimes Yes
Pe
rce
nt
Can viewers hear tornado sirens at work/school?
Overall
Joplin/Pittsburg

70
Though Joplin’s data for the most part was not significantly different from
the overall responses, the comments that came from those viewers give a lot of
insight into what the meteorologist in Joplin did well on 22 May 2011. One
comment from a viewer stated that the meteorologist she watched continuously
repeated that viewers needed to seek shelter to stress how serious of a situation
the tornado was and can be expressed in the following viewer quotes:
“tell us to [seek shelter] and keep reiterate it like Doug Heady did when the EF5 hit us in 2011” – Female, City
“I just want to say the way Doug Heady handled his coverage of the tornado that hit Joplin was phenomenal. If it had not been for him I would not have
seeked shelter as quickly as I had. It tore up my neighborhood. It is because of him and of course God that my daughter and I are alive and ok.”
-Female, City
One thing that was hoped to be gained from this research was feedback
from viewers, particularly in Joplin, about what the meteorologists did on 22 May
2011 that directly lead viewers to seek shelter prior to the tornado striking.
Though many comments from viewers referred to that tornado, there were not
many comments that stated what the meteorologists in Joplin did that helped
save their life. If this survey were done again, the viewers in Joplin would have
explicitly been asked what the meteorologists in that market did well on 22 May.
This question would be asked to gain better insight in what meteorologists can do
better during severe weather broadcasts.
Out of all of the information and written feedback that was given in this
research, the following quote sums up the relationship and bond that is formed
between viewers and the meteorologist that they watch every day:

71
“MY meteorologist is Doug Heady with KOAM Joplin/Pittsburg. I feel as if he is a close friend or part of my family even though I have never met him in person! I am a fan of his Facebook page and read his updates and blog regularly. I trust
he will be on top of any weather situation that arises. If he says he is not concerned with a particular weather set-up, but he'll keep his eye on it, I'm
comforted by that...knowing that if the circumstances should change, he will be live on television or updating his Facebook status with new information. He has established a great amount of trust with my family. When Doug speaks, we pay
attention!” – Female, City
5 CONCLUSIONS/RECOMMENDATIONS
5.1 Conclusion and Recommendations
Broadcast meteorologists play a vital role in the severe weather warning
process. The things they say and do during their severe weather broadcasts
directly affect their viewers’ decision making process about whether they will seek
shelter. This research went directly to those viewers and asked them what is most
important when TV meteorologists provide severe weather coverage. Six hundred
and fifty-two viewers in multiple TV markets in Missouri were asked questions
about severe weather and what is most important during severe weather. The
goal of this research was to find ways that TV meteorologists can personally
connect with viewers to help persuade them to seek shelter during severe weather
situations. The implication of being personal with the viewers is the more
personally connected the viewer feels with the meteorologist they watch, the
more likely that viewer will trust him or her and will likely follow their
instructions during severe weather situations.
The most important recommendation that can be made from this research,
that will directly make a personal connection with TV viewers and influence them

72
to seek shelter, is to be as specific as possible with location of severe weather.
Most viewers said that when they watch severe weather coverage, they do not
care as much about what counties will be affected as much as they care about
what cities will be affected. Many viewers stated counties are far too large of an
area when discussing severe weather. They said many times when part of the
county is under a severe weather warning, it is not part of the county that they
live in. Most said that they relate much better to what is happening in cities
around them. Viewers overwhelmingly said they wanted to see a more local view
of approaching storms. This more local approach can be done through place base
warnings (i.e. street names, school names, etc.). Many viewers suggested they
wanted to hear street names that will be affected. Along with the exact location of
the storm and exact location of where a storm is moving, viewers said that they
wanted to know when a storm would arrive at their location. This is also a
determining factor if people make a decision to seek shelter. The implication of a
place based warning is that viewers will have a personal connection with different
places, locations or streets and that personal connection with that place would
likely influence their decision to seek shelter. For instance, parents with children
that go to school will most likely make a personal connection with that school
because it is near to their house. If viewers are aware that a severe storm is near a
school their children attend (which is near their house), they will likely feel the
need to seek shelter for their own safety.
The next most important thing to viewers is that TV meteorologists keep
them constantly updated about severe weather both on and off the air. Some

73
viewers felt that rural areas did not get as much severe weather coverage and
attention as the urban locations. Viewers stated they would like TV
meteorologists to stay on-air until the threat is over, even for storms that are
away from major population areas. Many viewers stated a way for them to remain
constantly updated is from posts on social media. Over 50% of those surveyed
said they use social media to receive weather information. Social media is one
way for TV meteorologists to “personally connect” with their viewers. The
stronger this personal connection, the more viewers will trust a meteorologist
and the more likely they are to seek shelter. Many viewers responded by saying
they enjoy it when they can dialog with TV meteorologists via Facebook, Twitter
and other social media outlets.
Finally, the most important recommendation that can be made to TV
meteorologists is that they express to their viewers when a tornado has been
spotted by radar or in person (on the ground). Viewers expressed a need to know
this to help influence their decision-making process as to whether to seek shelter
or not. Most viewers said that if they knew there was a tornado spotted on the
ground, they would immediately seek shelter in their safe place. If a tornado has
been spotted or if it is just rotation in the atmosphere, viewers wanted to see
video or pictures of the storms. Thirty percent of viewers said that if they saw live
video of a storm that was moving toward their location or live video of a tornado,
this would persuade them to take immediate shelter.
One main focus of this research was looking at rural versus urban areas.
This is because it is the easiest demographic for TV meteorologists to relate to

74
while providing severe weather information. When analyzing most of the
questions, there was not much that was statistically significant between these two
locations. One thing that was significant was that those living in rural areas were
30% less likely to hear the tornado sirens at their residence and 9% less likely to
hear them at their work. This means if the rural population is less likely to hear
the tornado sirens from their location, they will rely on other means for severe
weather information; most likely this indicated that they will turn on their TV in
search of information. This means TV meteorologists should consider staying on-
air even when severe weather is not affecting larger cities, because those in more
rural areas have less reliable ways to receive weather information than those in
larger cities. Many viewers rely on their smart phones for severe weather
information. Those in rural areas said they would “maybe” seek shelter if sent
information about severe weather via text message and 6% said they would not
seek shelter. The reason for this is because those in rural areas are 4% less likely
to have smart phones. Overall, for viewers to make an informed decision, they
wanted to be given as many pieces of information as possible.
5.2 Future Work
There are many possible avenues for further research on this topic. One
would be to expand this research to more TV markets in areas that experience
high occurrences of severe weather. Other research could focus more on the
social media and other technology away from the TV. Another route would be to
survey those who have been affected by large severe weather events (mainly
tornadoes) and ask them what TV meteorologists did well and not so well in their

75
opinion. Going straight to the viewers is the best way to find out what
meteorologists can do better during severe weather.
Social media has become such an important part of many people’s lives;
looking at how TV meteorologists can warn viewers on Facebook, Twitter, etc.
might be a future research project. As technology develops, the public looks for
the next best electronic device, and with that, a new way for them to receive
weather information on that device. Examining the interaction between the
meteorologists and their viewers and how they use social media during severe
weather broadcasts will continue to be an important topic to research as
technology develops. One question that should be looked at in future is how can
a meteorologist manage updating social media while they are providing severe
weather updates over the air without sacrificing the current quality of their
broadcast on TV.
Along with how meteorologists can manage social media and TV
broadcast, looking at the positive and negative aspects of social media, smart
phones and other digital technologies and how they impact the sharing of severe
weather information with the TV meteorologist during severe weather. Are the
viewer’s reports accurate in time and space? If they are accurate, meteorologists
can use the information from their viewers to pass along real-time storm
information to others during severe weather situations. However, it has been
seen in many cases of breaking news that information passed along via social
media is often wrong. Finding ways to accurately and quickly verify severe

76
weather information that is given to a meteorologist by their viewers is something
that could be looked at in the future.
Another way this research can be continued is by looking at each question
that was asked in this survey and determine why certain demographic groups had
such vast differences from the overall data. For instance, why was the $65,000-
$99,999 income bracket 12% less likely to be able to hear the tornado sirens at
their homes? Investigating these differences in demographics can help
meteorologist better warn the public during severe weather situations.

77
REFERENCES
Altman, I and Taylor, D., 1973. Social penetration: The development of interpersonal relationships. New York: Holt, Rinehart and Winston.
Balluz, L., Schieve, L., Holmes, T., Kiezak, S., Malilay, J. 2000. Predictors for people’s response to a tornado warning: Arkansas, 1 March 1997. Disasters 24 (1): 71-77.
Barnes, L. R., Gruntfest, E. C., Hayden, M. H., Schultz, D. M., Benight, C. 2007:
False alarms and close calls: A conceptual model of warning accuracy. Wea. Forecasting, 22, 1140 1147.
Ebner, N, 2013. “A study of emergency management policy regarding the use of
tornado sirens in the state of Missouri.” A Thesis prepared for the faculty of the University of Missouri, 62 pages.
Hammer, B., Schmidlin, T.W., 2002. Response to warnings during the May 1999
Oklahoma City Tornado: reasons and relative injury rates. Weather and Forecasting 17 (3), 577–581.
Horton, D., Wohl, R.R., 1956. Mass communication and para-social interaction:
observations on intimacy at a distance. Psychiatry 19, 215–229. Neter J., W. Wasserman and G. A. Whitmore, 1988. Applied Statistics, 3rd Ed.
Boston, MA. Allyn and Bacon, 1006 pp.
NWS (2011). “NWS Central Region Service Assessment Joplin, Missouri Tornado
– May 22, 2011.” National Weather Service. NWS (2011). “The Historic Tornadoes of April 2011.” National Weather Service. Shefner-Rogers, C. L., Rogers, E. M., & Singhal, A. (1998). Parasocial interaction
with the television soap operas “Simplemente Maria” and Oshin.” Keio Communication Review, 20, 3-18.
Schmidlin, T. W. and King, P. S., 1997: Risk factors for death in the 1 March 1997
Arkansas tornadoes. Quick Response #98. Natural Hazards Research Applications and Information Center: Boulder, CO.
Sherman-Morris, K., 2005. Tornadoes, television and trust-A closer look at the
influence of the local weathercaster during severe weather. Environmental Hazards, 6 (4), pp. 201-210.
Sims, J. H. and D. D. Baumann, 1972. Science, New Series, Vol. 176, No. 4042,
1386-1392
78
APPENDIX A
This is the survey that was used for this research. It was developed after
talking to all four of my thesis committee members. The survey was put together
online through a survey company called Fluid Surveys. Below is exactly as it was
seen online.
Connection Between TV Meteorologists and Their Viewers
My name is Dan Ebner and I am a Master’s student at the University of Missouri. This survey will
look at the connection between TV meteorologists and their viewers during severe weather
broadcasts. The purpose of this survey is to see what TV meteorologists can do better or
different during severe weather to help alert and persuade viewers to take cover during life
threatening weather. To participate in this survey, you must be at least 18 years of age or older.
Participation is this research is strictly voluntary. No personal or identifying information will be
collected during this research. Thank you so much for your help! If you have any questions
about this research, please feel free to contact me via email: [email protected]
What is your gender?
Male
Female
What is your age?
18-24
25-39
40-55
56-69
70+

79
What is your highest educational background?
High School Diploma
Some college
College Degree
Master's/Ph.D
What is your household income?
$0 - $24,999
$25,000 - $39,999
$40,000 - $64,999
$65,000 - $99,999
$100,000 +
From which city do you get your television news and weather?
St. Louis
Kansas City
Springfield
Cape Girardeau/Harrisburg/Paducah
Hannibal/Quincy
Columbia/Jefferson City
Kirksville/Ottawa
Joplin/Pittsburg
St. Joseph
Other
In what county and state do you live in? i.e. St. Louis County, Missouri or Johnson County, Kansas

80
What type of area do you live in?
City
Rural Area
Suburbs
How do you get severe weather information (check all that apply)?
TV
Radio
NOAA Weather Radio
Smart phones or weather apps
Text messages
Social media
Other, please specify... ______________________
Why do you use/trust that source to gather information about
severe weather?
Do you have a smart phone?
Yes
No
If you were sent information about severe weather and tornadoes
via text message, would you be more likely to seek immediate
shelter during severe weather?
Do you have a NOAA Weather Radio?
Yes

81
No
If yes to having a NOAA Weather Radio, what encouraged you to
purchase one? If no, what is prohibiting you from purchasing one?
If a tornado warning is issued, what actions do you take?
What would make you seek shelter immediately during severe
weather?
Tornado sirens
Seeing the tornado (in person or on TV)
A phone call from a friend or family member
Other, please specify... ______________________
Can you hear tornado sirens at your job/school?
Yes
No
Sometimes
Can you hear tornado sirens at home?
Yes
No
Sometimes
Do you feel tornado sirens are an adequate way of being warned
about tornadoes?
Yes

82
No
Sometimes
What type of information do you want to hear/see when a storm is
approaching you? Rank them "1" being the least important - "5" being the most important to you
1 2 3 4 5
How long until it reaches your area (example: ETA 45 minutes)
Exact time it will reach your area (example: 5:15 pm)
What severe weather threats to expect
Radars/maps
Visuals (pictures, sky cams, etc.)
What would you like to hear during severe weather TV broadcasts? Rank them "1" being the least important - "6" being the most important to you
1 2 3 4 5 6
County Name
Local Landmarks
School Names
Roads/Bridges
Shopping Centers
Places of Worship
Why do you trust the meteorologist that you watch?
Do you feel the media does an adequate job informing you of
severe weather?
Yes
83
No
If you do not feel that the media does an adequate job, explain why.
Do you trust the media when they provide you with severe weather
information?
Yes
No
If you do not trust the media when they provide severe weather
coverage, explain why.
Do you feel that severe weather coverage is over dramatized by the
media?
Yes
No
If yes, explain why you think the media over dramatizes severe
weather
What does a tornado watch mean?
Conditions are favorable for tornadoes to develop
A tornado has been spotted by a person or radar
There will definitely be a tornado today

84
What does a tornado warning mean?
Conditions are favorable for tornadoes to develop
A tornado has been spotted by a person or radar
There will definitely be a tornado today
When a tornado warning is issued, what do you think?
Tornadoes never hit my house or happen here
I do not need to do anything different
I must seek shelter
I should look outside and see what is going on
What can a meteorologist do to better persuade you to take
immediate cover during severe weather?
Any other comments that you have in general about meteorologists
and their severe weather coverage are more than welcomed.