a study of suppliers and distributors
TRANSCRIPT

Technology Practices and Usage In The
A Study of Suppliers and Distributors
PROMOTIONAL PRODUCTS INDUSTRY
ResearchYour Research Authority
Conducted by

TABLE OF CONTENTS
Usage Of Smartphones And Mobile Tablets
QR Codes
Social Media
Usage Of Accounting Software And Order Management Systems
Business Email Software Or Service
CRM Software
Industry Identifiers
Infrastructure And Budget
Product Search Tool Usage And Methods (Distributors Only)
Website And Online Presence (Distributors Only)
Product Catalogs, Images And Websites, ePSA Standards,Artwork Practices And sm@rt Codes (Suppliers Only)
Demographics
PG1
PG7
PG10
PG17
PG22
PG24
PG27
PG30
PG32
PG37
PG39
PG45

USAGE OF SMARTPHONES AND MOBILE TABLETS

PG2
What type of smartphone do you currently use?(Please check all that apply)
What type of smartphone do you plan to purchase in the immediate future?(Please check all that apply)
1A
1
5.0%
2.5%
12.1%
4.2%
35.1%
25.5%
28.0%
6.80%
5.10%
16.50%
4.20%
26.30%
25.50%
24.50%
None
Other
Basic mobile phone w/o data plan
MicrosoA
iPhone
Android
Blackberry
Distributors (N=711)
Suppliers (N=239)
2.6%
12.7%
4.4%
36.7%
26.6%
29.3%
5.1%
3.4%
3.8%
46.4%
29.4%
6.8%
Other
Basic mobile phone w/o data plan
MicrosoA
Iphone
Android
Blackberry
Distributors (N=235)
Suppliers (N=229)
4
1.
What type of Smartphone do you currently use? (Please check all that apply)
1a.
What type of Smartphone do you plan to purchase in the immediate future? (Please check all that apply)
N=number of respondents
N=number of respondents
iPhone

PG3
Do you plan to provide any of the above smartphones to your salespeople?
For those who said they plan to provide salespeople with smartphones, they specified that they wanted to provide the following:
• 37% of distributors and 26.3% of suppliers stated they
plan to provide the iPhone
• 15.2% of distributors and 24.6% of suppliers plan to
provide the Blackberry
• 37% of distributors and 17.5% of suppliers plan to
provide the Android
• 10.9% of distributors and 31.6% of suppliers plan to
provide various “other” smartphones
2
2A
For those who said they plan to provide salespeople with Smart Phones, they specified that they wanted to provide the following:
• 37% of distributors and 26.3% of suppliers stated that they
provided the iPhone • 15.2% of distributors and 24.6% of suppliers provided the
Blackberry • 37% of distributors and 17.5% of suppliers provided the
Android • 10.9% of distributors and 31.6% of suppliers provided various
“other” Smart Phones
22%
78%
34%
66%
YES NO Distributors (N=760)
Suppliers (N=240)
5
2.
Do you plan to provide any of the above Smartphones to your salespeople?
N=number of respondents

3A
3
PG4
Which of the following mobile tablets are you currently using this year?(Please check all that apply)
Which of the following mobile tablets are you planning to purchase this year?
50.0%
3.3%
0.5%
1.6%
13.2%
33.0%
4.4%
60.10%
2.20%
0.40%
1.10%
12.70%
24.60%
3.60%
None
Other
MicrosoA Tablet
Blackberry Tablet
Kindle or other e-‐Reader
iPAD or iPAD2
Android (Galaxy, Xoom, etc.)
Distributors (N=552)
Suppliers (N=182)
6
3a.
3.
Which of the following Mobile Tablets are you currently using this year? (Please check all that apply)
Which of the following Mobile Tablets are you planning to purchase this year?
18.50%
54.70%
7.70% 7.70% 5.90% 7.30%
23.30%
8.70%
65.20%
26.10%
3.30% 1.10% 6.50%
1.10%
Android iPAD or iPAD2 Kindle or e-‐Reader
Blackberry Tablet
MicrosoA Tablet Other None
Distributors (N=287)
Suppliers (N=92)
N=number of respondents
N=number of respondents

4
4A
PG5
Do you plan to provide any of the above mobile tablets to your salespeople?
If yes to above, please specify which one:
YES 9.2%
NO 90.8%
Distributors (N=752)
YES 24.1%
NO 75.9%
Suppliers (N=87)
4.
4a.
Do you plan to provide any of the above “Mobile Tablets” to your salespeople?
If yes to above, please specify which one?
7
*N=number of respondents
YES 9.2%
NO 90.8%
Distributors (N=752)
YES 24.1%
NO 75.9%
Suppliers (N=87)
4.
4a.
Do you plan to provide any of the above “Mobile Tablets” to your salespeople?
If yes to above, please specify which one?
7
*N=number of respondents
Android Blackberry iPad Microsoft Tablet Samsung Other
Distributors(N=67)
13.4% 3% 53.7% 3% -- 26.9%
Suppliers (N=25)
4% 4% 48% -- 8% 36%
N=number of respondents
N=number of respondents

PG6
5
6
Which industry-specific mobile apps do you use?(Compiled from an open-ended question)
What percentage of your time do you spend working mobile or remotely?
13.4%
35.8%
27.6%
17.3%
5.9% 6.9%
38.5%
30.8%
15.8%
8.1%
NONE 1-‐10% 11-‐25% 26-‐50% 51% or more
Distributors (N=762)
Suppliers (N=247)
Distributors(N=119, 15% of 770 respondents
specified mobile apps)
Suppliers(N=23, 9% of 248 respondents
specified mobile apps)
Zoom catalog 4.2% Zoom catalog 47.8%
SAGE 57.1% SAGE 13.0%SanMar 16.8% SanMar 8.7%Other 5.9% Other 4.3%PDSA 1.7% PDSA 4.3%ESP/ASI 5.9% ESP/ASI 4.3%PPAI/PCT 5% PPAI/PCT 8.7%Logomark 2.5% Logomark 4.3%Distributor Central 0.8% Distributor Central 4.3%
N=number of respondents
N=number of respondents

QR CODES

Marke[ng Pieces
Business Cards
Catalogs Product Samples
Website Other None
18.0%
10.8%
6.5% 6.3% 10.1%
5.3%
70.2%
43.4%
15.7%
31.4%
20.2% 21.1%
7.4%
45.5%
*N=number of respondents
Distributors (N=749)
Suppliers (N=235)
10
7.
In which of the following have you used QR Codes for your business? (Please check all that apply) 7
8
PG8
In which of the following have you used QR codes for your business?(Please check all that apply)
Do you:
Distributors Suppliers
Have a QR code reader on smartphone 44.4%(N=741)
56.3%(N=240)
Have a Microsoft Tag reader on smartphone 12.3%(N=648)
17.2%(N=203)
N=number of respondents
N=number of respondents

9
PG9
Have you:
Distributors Suppliers
Scanned a QR code or a Microsoft Tag 41.7%(N=743)
57.4%(N=242)
Created a QR code for your company 25.3%(N=738)
47.7%(N=239)
Used a QR code in marketing pieces 21.3%(N=731)
48.5%(N=239)
Put a QR code on your business card 9.4%(N=725)
12.6%(N=230)
N=number of respondents

SOCIAL MEDIA

54.5%
45.5%
66.1%
33.9%
USE SOCIAL MEDIA DO NOT USE SOCIAL MEDIA
N=number of respondents
Distributors (N=770)
Suppliers (N=248)
10.
13
SoSocial Media Users:
13
10
10A
PG11
Social Media Users:
Which of the following social media sites do you use for business?(Please check all that apply)
82.8%
42.7%
76.4%
17.7%
2.1% 3.1% 1.7%
8.8% 2.6%
4.1%
91.3%
65.6%
70.6%
45.6%
2.5% 2.5% .6% 5.6%
.0% 5.0%
Distributors (N=419)
Suppliers (N=160)
14
For Distributors who chose “Other”, the social media sites mentioned were Vimeo, Merchant Circle, and Meetup.
For Suppliers who chose “Other”, the responses were too varied to quantify.
Which of the following social media sites do you use for their business? (Please check all that apply)
10a. N=number of respondents
N=number of respondents
PG12
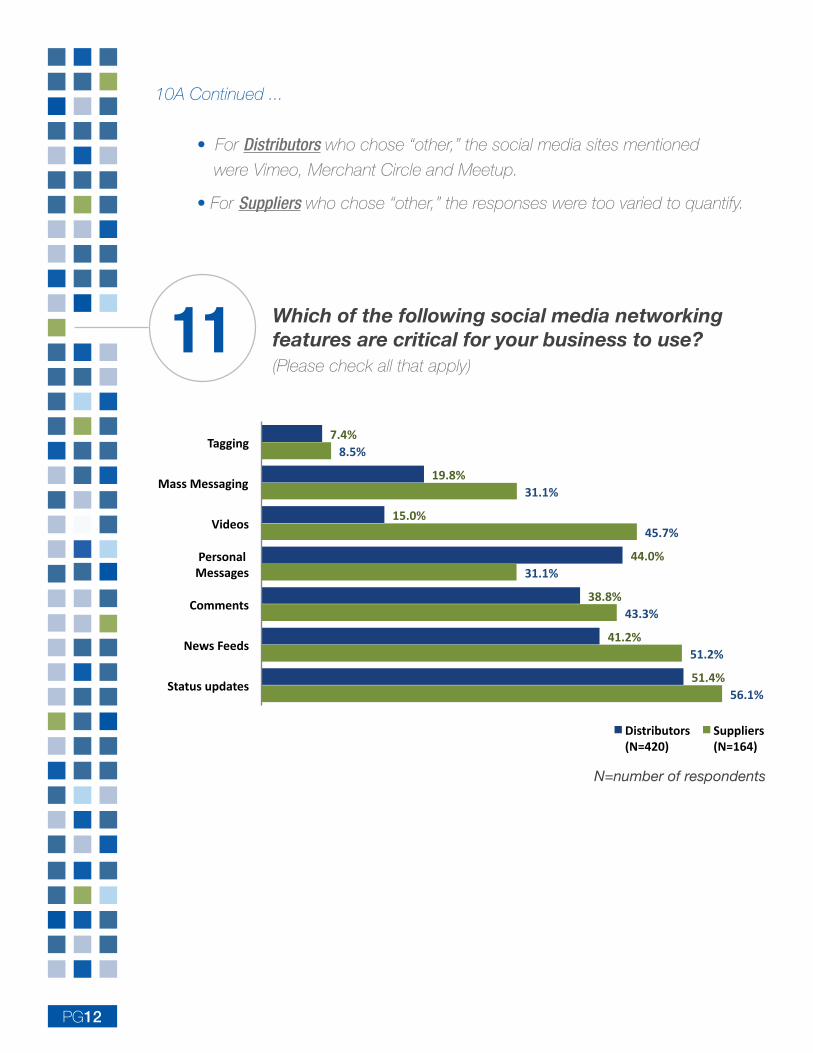
56.1%
51.2%
43.3%
31.1%
45.7%
31.1%
8.5%
51.4%
41.2%
38.8%
44.0%
15.0%
19.8%
7.4%
Status updates
News Feeds
Comments
Personal Messages
Videos
Mass Messaging
Tagging
Distributors (N=420)
Suppliers (N=164)
15
Which of the following social media networking features are critical for your business to use? (Please check all that apply)
11. 11
Which of the following social media networking features are critical for your business to use?(Please check all that apply)
10A Continued ...
• For Distributors who chose “other,” the social media sites mentioned
were Vimeo, Merchant Circle and Meetup.
• For Suppliers who chose “other,” the responses were too varied to quantify.
N=number of respondents

PGBPG13
12 Which of the following social media tactics are important to drive more business or customers?(Please check all that apply)
Distributors Suppliers
Spread the word 3.92(N=398)
3.91(n=157)
Feature research & statistics 3.19(N=370)
3.11(N=152)
Feature new product types 3.75(N=390)
3.90(N=156)
Feature new applications 3.21(N=365)
3.27(N=145)
Show trends 3.48(N=378)
3.17(N=152)
Values represent the MEAN scores (5 = Most Important, 1 = Least Important)N=number of respondents
ca
6
Email ampaigns
P
63.9%
75.5%
Promoting on your website
63.9%74.2%
Twitter "Follow Me
feature
29.2%
%
46.
e' Facebo
"Like" fea
67.6%
5%
6
ook ature
Uprom
pro
53.3
67.7%
Distributors(N=377)
Use motional
ducts
3%
32.3%
Suppliers(N=155)
s
Email campaigns Promo[ng on your website
Twiaer "Follow Me' feature
Facebook "Like" feature
Use promo[onal products
63.9% 63.9%
29.2%
67.6%
53.3%
75.5% 74.2%
46.5%
67.7%
32.3%
Distributors (N=377)
Suppliers (N=155)
17
13.
Which of the following actions do you take to drive traffic to their social media sites? (Please check all that apply)
13 Which of the following actions do you take to drive traffic to your social media sites?(Please check all that apply)
N=number of respondents

PGAPG14
14 In which of the following instances do you see an impact that you can attribute to social media?(Please check all that apply)
Distributors(N=350)
Suppliers(N=144)
Increase volume of business 36.9% 33.3%Increase in number of contacts 88.9% 92.4%
N=number of respondents
15 How many employees does your business specifically employ to manage your social media sites?
None
1 employee
2 emplooyees
3 or more employees
63.6%
27.6%
4.4%
4.4%
37.7%
44.7%
10.7%
6.9%
N=numberof respondents
Suppliers (N=159)
Distributors (N=409)
15.
How many employees does your business specifically employ to manage your social media sites?
19
N=number of respondents
PGB
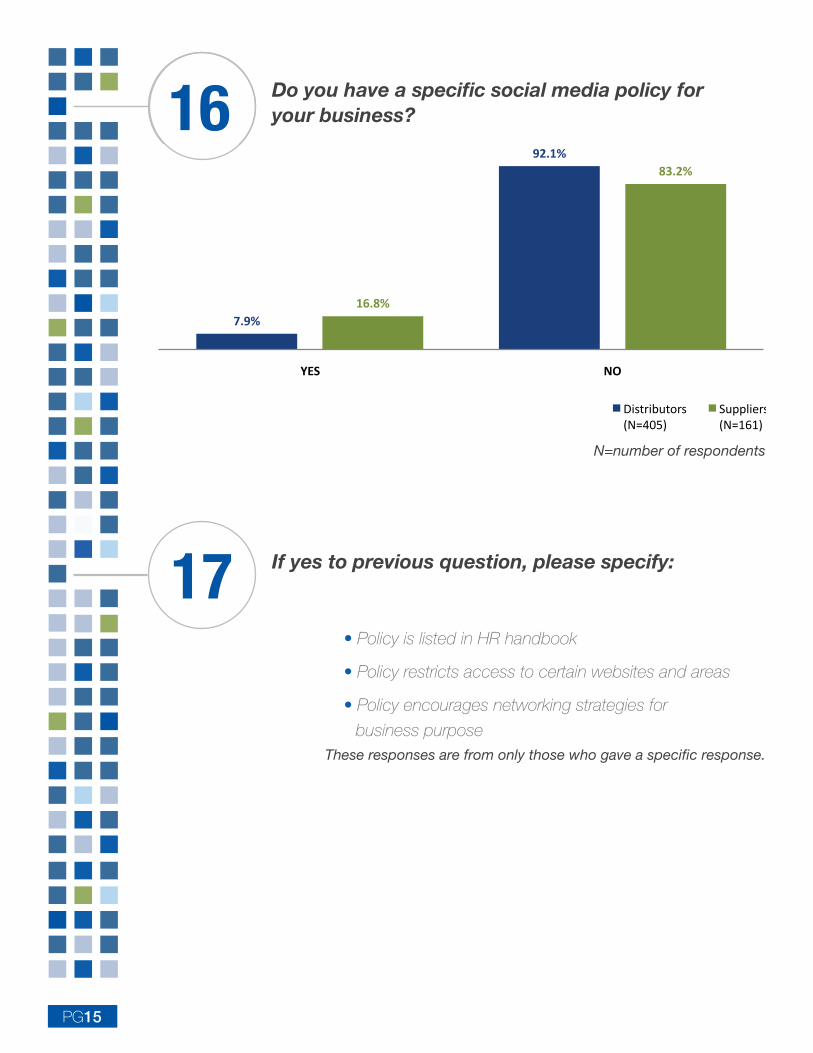
7.9%
92.1%
16.8%
83.2%
YES NO
Distributors (N=405)
Suppliers (N=161)
20
16.
Do you have a specific social media policy for your business?
17.
If yes, to previous question, please specify:
Policy is listed in HR handbook Policy restricts access to certain websites and
areas Policy encourages networking strategies for
business purpose **These responses are from only those who gave a specific response.
PG15
16 Do you have a specific social media policy for your business?
17 If yes to previous question, please specify:
• Policy is listed in HR handbook
• Policy restricts access to certain websites and areas
• Policy encourages networking strategies for
business purpose
N=number of respondents
These responses are from only those who gave a specific response.

PGAPG16
18 Are your salespeople required to use social media?
YES 12%
NO 64%
No Salespeople
24%
Distributors (N=408)
YES 8%
NO 87%
No Salespeople 5%
Supliers (N=159)
use social media?
YES 12%
NO 64%
No Salespeople
24%
Distributors (N=408)
YES 8%
NO 87%
No Salespeople 5%
Supliers (N=159)
use social media?
N=number of respondents
4%
88%

USAGE OF ACCOUNTING SOFTWARE AND ORDER MANAGEMENT SYSTEMS

PGA
19
PG18
What accounting software do you use?
20.8%
13.0%
0.1%
3.4%
61.8%
0.4%
0.3%
0.1%
51.0%
7.3%
5.7%
3.7%
28.2%
0.8%
2.9%
0.4%
Other
Quicken
Microso_ Great Plains
Peachtree Accoun`ng
Quickbooks
lakeshore
MAS90 and 200
Essent
Suppliers (N=244)
Distributors (N=715)
19.
What accounting software do you use?
20.8%
13.0%
0.1%
3.4%
61.8%
0.4%
0.3%
0.1%
51.0%
7.3%
5.7%
3.7%
28.2%
0.8%
2.9%
0.4%
Other
Quicken
Microso_ Great Plains
Peachtree Accoun`ng
Quickbooks
lakeshore
MAS90 and 200
Essent
Suppliers (N=244)
Distributors (N=715)
19.
What accounting software do you use?
N=number of respondents

PGB
19A
PG19
What accounting software do you use if you chose “other” in the previous question?
Distributors
(N=111 who had specified responses) Suppliers
(N=80 who had specified responses) N % N % Custom 17 15% Custom 18 23% ASI (unspecified) 19 17% ASI (unspecified) 16 20% e-Quantum 12 11% EFI Logic 1 1% Microsoft 10 9% Business Works 6 8% MYOB 7 6% Microsoft 5 6% Account Edge 4 4% Sage (unspecified) 4 5% DemandBridge 3 3% Visual 4 5% Kramer 3 3% Accountmate 3 4% Filemaker 2 2% Macola 3 4% iPromoteU 2 2% SAP 3 4% Netsuite 2 2% Navision 2 3% OrderMaster 2 2% QuickBooks 2 3% SAP 2 2% D&B 1 1% Shopworks 2 2% DAC 1 1% Xebra 2 2% Datapro 1 1% Responses are quantified from open-ended responses . Note: When respondents specified ASI or SAGE, the responses were left as is because respondents did not specify which ASI product it was (e.g. OrderMaster/ESP) and also did not mention if it was a SAGE online product when they listed SAGE
N=number of respondents

PGA
20
PG20
What order management system do you use?
41.7%
0.0%
0.0%
0.0%
0.0%
4.1%
2.1%
3.3%
1.7%
0.8%
16.9%
2.5%
26.9%
0.0%
20.7%
3.9%
3.2%
0.3%
3.2%
0.1%
1.3%
15.7%
5.8%
0.6%
26.5%
0.1%
4.5%
14.0%
Other
OrderMaster
Profit Maker
Business Works
Quicken
Great Plains
PeachTree
SAGE Online
Distributor Central
Lakeshore
QuickBooks
Essent
ESP
Custom
Distributors (N=709)
Suppliers (N=242)
25
20.
What order management system do you use?
N=number of respondents

PGBPG21
20A What order management system do you use if you chose “other” in the previous question?
Distributors (N=94 who had specified responses)
Suppliers (N=62 who had specified responses)
N % N % AIA 2 2.1% ASI 18 29.0% Custom 16 17.0% Custom 12 19.4% e-Qauntum 13 13.8% SAGE 6 9.7% Filemaker 6 6.4% Netsuite 4 6.5% Xebra 5 5.3% Basecamp 1 1.6% ISIS 4 4.3% MAS 3 4.8% ASI 3 3.2% Visual 3 4.8% Excel 3 3.2% Accountmate 2 3.2% iPromoteU 3 3.2% Filemaker 2 3.2% Microsoft 3 3.2% Macola 2 3.2% MYOB 3 3.2% Microsoft 2 3.2% @ease 2 2.1% Navision 2 3.2% AccountEdge 2 2.1% Antera Software 1 1.6% None 29 30.8% None 4 6.5%
This table is quantified from open ended responses. Note: When respondents specified ASI or SAGE, the responses were left as is because respondents did not specify which ASI product it was (e.g. Order Master or ESP and also did not mention if it was a SAGE online product when they listed SAGE
N=number of respondents

BUSINESS EMAIL SOFTWARE OR SERVICE

PGB
21
21A
PG23
What business email software or service do you use?
What business email software or service do you use if you chose “other” in the previous question?
Distributor(N=714)
Suppliers(N=242)
Internet Service Provider 12.2% 7%Hotmail 1.3% 1.2%
MSN 1.5% 0%
Yahoo 7.3% 1.2%
Google mail 8.7% 5.4%
Qualcomm Eudora 5% 0%MAC mail 0.4% 0.8%Microsoft Entourage for MAC 0.4% 0%Linux KDE 0.1% 0%Microsoft Exchange/Outlook 49.6% 72.7%Other 13.4% 11.6%
N=number of respondents
Distributors (N=73 who had specified responses)
Suppliers (N=21 who had specified responses)
Internet Service Provider 17 23.2% Internet Service Provider 7 33.3%AOL 16 21.9% Microsoft Live Mail 5 23.8%Go Daddy 14 19.1% Thunderbird 2 9.5%Microsoft Live Mail 5 6.8% Bluetie 1 4.8%Thunderbird 5 6.8% Distributor Central 1 4.8%Constant contact 3 4.1% Goldmine 1 4.8%Google 2 2.7% Lotus 1 4.8%Data Serv 1 1.3% Sea Monkey 1 4.8%Distributor Central 1 1.3% Vertical Response 1 4.8%N/A 9 12.3% N/A 1 4.8%*Table is quantified from open‐ended responses. Note: Internet Providers varied from Comcast, Verizon, ATT, TW, Earthlink, etc.)
N=number of respondents

CRM SOFTWARE

PGB
37.6%
1.2%
10.7%
50.0%
1.0% 0.3% 2.7%
0.5% 0.2%
27.4%
17.7%
26.9%
2.3%
12.5%
3.2% 1.9% 1.4% 2.8% 2.8% 1.4%
17.6%
27.3%
Distributor (N=587)
Suppliers (N=216)
31
22.
What CRM (Customer Relationship Management) software or services do
you use?
PG25
22 What CRM (Customer Relationship Management) software or services do you use?
N=number of respondents
17.6%

PG26
* Table is quantified from open-ended responsesN=number of respondents
22A What CRM do you use if you chose “other” in the previous question?
Distributors (N=170 who had specified responses)
Suppliers (N=41 who had specified responses)
CRM 2 1.2% Salespad 1 2.4% Custom 4 2.4% ASI 6 14.6% Zoho 4 2.4% Custom 3 7.3% e-mail 3 1.8% SAGE 3 7.3% Excel 3 1.8% Visual CRM 3 7.3% Filemaker 3 1.8% Actionware 1 2.4% @ease 2 1.2% Antera Software 1 2.4% Ace of Sales 2 1.2% Volusion 1 2.4% Avidian 2 1.2% CRS – Wilke Thornton 1 2.4% E-quantum 2 1.2% Highrise 1 2.4% Facilis 2 1.2% Infor Visual CRM 1 2.4% Maximizer 2 1.2% Infotrac 1 2.4% Ordermaster 2 1.2% Intuitive MRP 1 2.4% Quickbooks 2 1.2% QuickBooks 1 2.4% None 135 79.4% None 16 39.0% *Table is quantified from open-ended responses

INDUSTRY IDENTIFIERS

PGBPG28
23 Which industry identifiers do you use to identify your company?(Please check all that apply)
Note: The ASI identifier is not as commonly used by PPAI distributor members as seen above. This finding is unusual compared to previous years and signifies the changing make-up of PPAI distributors. PPAI has been recruiting members from various peripheral markets and this finding is indicative of that.
70.60%
45.10% 47.00% 43.70%
4.40%
87.30%
75.00% 71.20%
88.10%
4.20%
Distributor (N=705)
Suppliers (N=236)
34
23.
Which industry identifiers do you use to identify your
company? (Please check all that apply)
N=number of respondents
Note: The ASI identifier is not as commonly used by PPAI distributor members as
seen above. This finding is unusual compared to previous years and signifies the
changing make-up of PPAI distributors. PPAI has been recruiting members from
various peripheral markets and this finding is indicative of that.

PG29
23A What industry identifier do you use if you chose “other” in the previous question?
These are quantified from open ended responsesN=number of respondents
4.2% of Distributors(N=32)
4.8% of Suppliers(N=12)
ARA 6 18.8% PPPC 4 33.3%
None 4 12.5% ARA 2 16.7%
Distributor Central 3 9.4% APPA 1 8.3%
NNEP 2 6.3% Distributor Central 1 8.3%Press-A-Print 2 6.3% IMA/IGCC 1 8.3%SAAGNY 2 6.3% NNEP 1 8.3%SPPA 2 6.3% None 1 8.3%All of the above 1 3.1% SAGGNY 1 8.3%

INFRASTRUCTURE AND BUDGET

PG31
Distributor (N=706)
Suppliers (N=243)
None 70.7% 29.6%
One 12.2% 27.6%
2 to 4 3.0% 16.9%
5 to 10 0.8% 5.8%
More than 10 0.1% 6.2%
Outsourced 13.2% 14.0%
*N=number of respondents
Less than 1% 1-‐2% 3-‐4% 5-‐7% 8-‐10% More than 10%
23.9% 24.6% 21.8%
15.2%
9.1%
5.3%
14.5%
28.1%
23.0%
19.1%
8.1% 7.2%
Distributor (N=702)
Suppliers (N=235)
37
24.
What percent of your net sales is spent on technology
infrastructure?
25.
How many IT professionals does your company employ?
24
25
What percent of your net sales is spent on technology infrastructure?
How many IT professionals does your company employ?
Distributor(N=706)
Suppliers(N=243)
None 70.7% 29.6%1 12.2% 27.6%
2 to 4 3% 16.9%
5 to 10 0.8% 5.8%
More than 10 0.1% 6.2%
Outsourced 13.2% 14%
N=number of respondents
N=number of respondents

PRODUCT SEARCH TOOL USAGE AND METHODS
(Distributors Only)

PG33
All free ones 7 18.9% Promo Marketing 7 18.9% None 5 13.5% SAGE 4 10.8% ARA 2 5.4% Press A Print 2 5.4% Trade Only 2 5.4%
AAPN 1 2.7% ASI call-‐in 1 2.7% Business Journals 1 2.7% Co-‐branded web sites of suppliers 1 2.7% Juggler 1 2.7% NNEP 1 2.7% Promo Corner 1 2.7%
SAGE Online 71.6%
UPIC 16.7%
ESPOnline 24.0%
Distributor Central 34.3%
SearchStar 0.6%
ZOOM catalog 6.5%
PMDM 8.2%
Other 4.5%
Distributors (N=693)
27.
Which of the following Product Search Tools do you currently use?
27a. 4.5% of 693 Distributors who chose “Other” use the following Search Tools:
19.9%
4.1%
30.7%
21.1%
12.9%
5.6%
5.7%
Free
Up to $200
$201 to $500
$501 to $1000
$1001 to $2499
$2500 and above
Do not subscribe
N=700, *N=number of respondents
26.
How much does it cost for you to subscribe annually to a product search tool/package?
39
How much does it cost for you to subscribe annually to a product search tool/package?
Which of the following product search tools do you currently use?27
26
N=700; *N=number of respondents
N=693; *N=number of respondents

PG34
Promocan 1 2.7% N=37, *N=number of respondents
Catalogs 14 25.0% Competitors 1 1.8%
Internet 6 10.7% ESP 1 1.8% None 6 10.7% Info Line 1 1.8% SAGE 5 8.9% Juggler 1 1.8% Distributor Central
3 5.4% Logomall 1 1.8%
28.50%
18.20%
14.20%
16.60%
15.40%
14.20%
43.00%
8.60%
4.50%
67.60%
7.60%
PromoMarke`ng.com
ASI Register®
PPAI Expo PlanIT (PPAI Show Directory)
PPAI Navigator (membership directory)
PROMOCorner.com (Promo`on Corner)
Virtual Tradeshows
Industry shows
ASI Media File®
ASI Info-‐Line
Internet (Google and other search engines)
other
N=714, *N=number of respondents
40
28a.
28.
What other method(s) do you use for product search? (Check all that apply)
7.6% of 714 Distributors chose “Other” and they use the following methods for product search:
4.5% of 693 Distributors who chose “other” specified using the following search tools:
What other method(s) do you use forproduct search?(Please check all that apply)
28
27A
N Percentage All free ones 7 18.9% Promo Marketing 7 18.9% SAGE call in 4 10.8% ARA 2 5.4% Press A Print 2 5.4% Trade Only 2 5.4% AAPN 1 2.7% ASI call-in 1 2.7% Business Journals 1 2.7% Co-branded web sites of suppliers 1 2.7% Juggler 1 2.7% NNEP 1 2.7% Promo Corner 1 2.7% Promocan 1 2.7% None 5 13.5%
N=number of respondents
N=714; *N=number of respondents

PGBPG35
Other methods used by Distributors for product searches:
Please rate the following types of technology products and tools that you use in your business: 29
28AN Percentage N Percentage
Catalogs 14 25.0% Competitors 1 1.8%Internet 6 10.7% ESP 1 1.8%None 6 10.7% Info Line 1 1.8%SAGE 5 8.9% Juggler 1 1.8%Distributor Central 3 5.4% Logomall 1 1.8%Press-A-Print 3 5.4% PPB 1 1.8%Referral 3 5.4% Promo companies 1 1.8%Personal Experience 2 3.6% Proprietary 1 1.8%All available 2 3.6% Replink 1 1.8%Magazines 2 3.6% Retail 1 1.8%
N=56; *N=number of respondents
Distributors N Mean ScoresProduct Search/Research Tool 705 4.50Accounting Software 704 3.85Artwork Creation and Management Tools 703 3.82Presentation Tool 701 3.47Order Management Tools 698 3.38E-Commerce Tools 697 2.86Web Development Tools 692 2.83Social Media 700 2.65
Values shown are MEAN scores (5 = Most Important 1 = Least Important )N=number of respondents

Distributors N Mean Scores
Product Search / Research Tool 705 4.50 Accounting Software 704 3.85 Artwork Creation and Management Tools 703 3.82 Presentation Tool 701 3.47 Order Management Tools 698 3.38 E-Commerce Tools 697 2.86 Web Development Tools 692 2.83 Social Media 700 2.65
*Values shown are MEAN scores (5 = Most Important 1 = Least Important ) **N=number of respondents
YES 6.0%
NO 94.0%
42
Are you currently trading online with suppliers using ePSA standards? 30
.
Please rate the following types of technology products and tools that you use in your business.
N=684 *N=number of respondents
29.
PG36
Are you currently trading online with suppliers using ePSA standards? 30
N=684; *N=number of respondents
WEBSITE AND ONLINE PRESENCE
(Distributors Only)
PG38
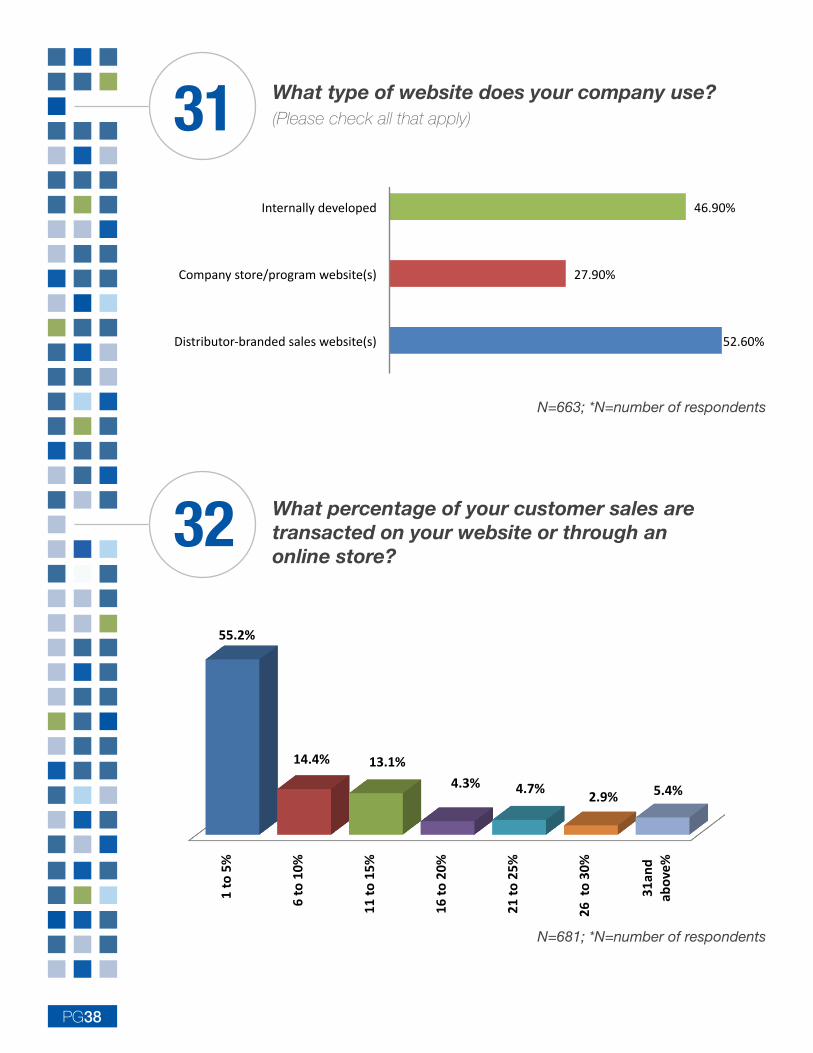
What type of website does your company use? (Please check all that apply)
What percentage of your customer sales are transacted on your website or through an online store?
32
31
52.60%
27.90%
46.90%
Distributor-‐branded sales website(s)
Company store/program website(s)
Internally developed
N=663, *N=number of respondents
1 to 5%
6 to 10%
11 to
15%
16 to
20%
21 to
25%
26 to 30
%
31an
d ab
ove%
55.2%
14.4% 13.1%
4.3% 4.7% 2.9% 5.4%
N=681, N=number of respondents
44
31.
32.
What is the percentage of your sales from customers transacted on your website or through an online store?
What type of website does your company use? (Please check all that apply)
N=663; *N=number of respondents
N=681; *N=number of respondents

PRODUCT CATALOGS, IMAGES AND WEBSITES, ePSA STANDARDS, ARTWORK PRACTICES AND sm@rt CODES
(Suppliers Only)

PG40
How do you make your product catalog available to your customers?(Please check all that apply)
0.8% of 243 suppliers who chose “other” use the following methods:
33
33A
Distributor Central 1 14.3%
New website 1 14.3% Send Catalog when we send samples 1 14.3% Trade Shows 1 14.3% Zoom Catalog 1 14.3% No catalog 2 28.6%
N=7, *N=number of respondents
81.50%
66.70%
24.70%
42.80%
79.40%
59.30%
0.80%
On the internet
On our website
Through a web service
Export files to customers
Provide hard copies of the catalog
Through promo`onal products industry research tools
other
N=243, *N=number of respondents
46
How do you make your product catalog available to your customers?
(Please check all that apply) 26.
26a.
0.8% of 243 Suppliers who chose “Other” use the following methods: N Percentage
Distributor Central 1 14.3%New website 1 14.3%Send catalog when we send samples 1 14.3%Tradeshows 1 14.3%Zoom Catalog 1 14.3%No Catalog 2 28.6%
N=7; *N=number of respondents
N=243; *N=number of respondents

PG41
Where are your products images created and stored? (Please check all that apply)
How frequently do you provide updated product pricing to your search tool providers (e.g. ASI, SAGE, etc.)?
35
34
In-‐hou
se server
Artwork service
prov
ider
Prod
uct d
atab
ase
prov
ider
Other
89.80%
11.00% 13.10% 5.70%
N=293, *N=number of responses
other, 5.8%
We export files with current pricing on a quarterly basis,
7.8%
We export files with current pricing on a bi-‐annual basis,
7.4%
We provide updated pricing when we have changes,
68.3%
We use a service to update pricing with various providers;
1.2%
We do not provide product pricing to
any product database provider;
9.5%
N=243, *N=number of respondents
47
28.
27.
How frequently do you provide updated product pricing to your search tool
providers (e.g. ASI, SAGE, etc.)
Where are your products images created and stored? (Please check all that apply)
N=293; *N=number of respondents
N=243; *N=number of respondents

PG42
If you take orders on your website, who do you take orders from?(Please check all that apply)
What percentage of your sales come from customer orders transacted on your website?37
36
18.90%
87.10%
21.20%
Supplier reps Distributor customers End-‐user customers
N=132, N=number of respondents
64.9%
9.0% 10.0% 2.4% 4.3% 2.8%
6.6%
1 to 5% 6 to 10% 11 to 15% 16 to 20% 21 to 25% 26 to 30% 31% and above
N=211, *N=number of respondents
48
29.
30.
If you take orders on your website, who do you take orders from?
(Please check all that apply)
What is the percentage of your sales from customer orders transacted on your website?
N=132; *N=number of respondents
N=211; *N=number of respondents

PG43
Are you currently trading online with distributors using ePSA standards?
In what applications do you process artwork? (Please check all that apply)39
38
yes 17%
No 83%
23.30%
4.20%
33.50%
73.30%
10.60%
88.10%
38.10%
30.90%
4.20%
5.50%
2.50%
3.00%
0.40%
4.20%
0.80%
QuarkXPress
Adobe FrameMaker
Adobe InDesign
Adobe Photoshop
Adobe Pagemaker
Adobe Illustrator
Adobe Acrobat
Corel Draw
Corel Photo Paint
Macromedia FreeHand
Microso_ PhotoDraw
PaintShop Pro
Micrografx Designer
AutoCAD
Other
N=236, *N=number of respondents
49
32.
31.
In what applications do you process artwork? (Please check all that apply)
Are you currently trading online with distributors using ePSA standards?
N=239; *N=number of respondents
N=236; *N=number of respondents

=
YES 6.3%
NO, 93.7%
50
PG44
Are you using sm@rt Codes for the following:
Do you actively request sm@rt art from your distributors?41
40
In catalog; 20.10%
Sales literature; 10.10%
Website; 13.20% Not aware of
sm@rt Codes; 71.70%
On social media sites; 1.90%
In industry product search
tools; 5.00%
33.
34.
Are you using sm@rt Codes for the following?
Do you actively request sm@rt art from your distributors?
N=238; *N=number of respondents

DEMOGRAPHICS

PGAPG46
What is the sales volume range of your company?
11.8%
29.5%
36.0%
9.8%
5.3%
3.9%
1.4%
0.9%
1.2%
0.1%
Below $15,000
$15,000-‐$50,000
$50,001-‐$250,000
$250,001-‐$500,000
$500,001-‐$1,000,000
$1,000,001-‐$2,500,000
$2,500,001-‐$5,000,000
$5,000,001-‐$10,000,000
$10,000,001-‐$15,000,000
$15,000,001 and above
DISTRIBUTORS N=769, *N=number of respondents
4.6%
6.5%
7.4%
4.6%
10.6%
13.4%
14.4%
16.7%
3.2%
2.8%
6.0%
6.0%
1.9%
1.9%
Below $50,000
$50,000-‐$100,000
$100,001-‐$250,000
$250,001-‐$500,000
$500,001-‐$1,000,000
$1,000,001-‐$2,500,000
$2,500,001-‐$5,000,000
$5,000,001-‐$10,000,000
$10,000,001-‐$15,000,000
$15,000,001-‐$20,000,000
$20,000,001-‐$50,000,000
$50,000,001-‐$100,000,000
$100,000,001-‐$250,000,000
$250,000,001 and above
SUPPLIERS N=216, *N=number of respondents
What is the sales volume range of your company?
52
N=769; *N=number of respondents
N=216; *N=number of respondents
DISTRIBUTORS
SUPPLIERS

PG47
Are you a member of PPAI?
78%
88.3%
22%
11.7%
Distributors (N=693)
Suppliers (N=247)
*N=number of respondents Member Non member
Are you a member of PPAI?
53
N=number of respondents