a study of new england seismicity - boston college
TRANSCRIPT
10/30/2017 NESN - Weston Observatory - Boston College
https://www.bc.edu/research/westonobservatory/nesnbc98c.html 1/15
A STUDY OF NEW ENGLAND SEISMICITY
Quarterly Earthquake Report
July September 1998
NEW ENGLAND
SEISMIC NETWORK
Weston Observatory
381 Concord Road
Weston, MA 02493
Earth Resources Lab
Massachusetts Institute of Technology
42 Carleton Street
Cambridge, MA 02142
NEW ENGLAND SEISMIC NETWORK
John E. Ebel, Principal Investigator M. Nafi Toksöz, Principal Investigator
bc home > research > weston observatory >
A – Z B C N EWS MAP S D I R E C TOR I E S
10/30/2017 NESN - Weston Observatory - Boston College
https://www.bc.edu/research/westonobservatory/nesnbc98c.html 2/15
Weston Observatory Dept. of Geology and Geophysics Boston College 381 Concord Road Weston, MA 02493 Email: [email protected] Award # 1434HQ98AG01943
Earth Resources Lab Dept. of Earth, Atmospheric, and Planetary Sciences Massachusetts Institute of Technology 42 Carleton Street Cambridge, MA 02142 Email: [email protected] Award # 1434HQ98AG01926
Prepared by Charles Doll, Jr. Email: [email protected] and Susan O'Connor
Email: [email protected] March 2000
for United States Geological Survey
905 National Center 12201 Sunrise Valley Drive Reston, Virginia 20192
Notice
Network operation supported by the U.S. Geological Survey (USGS), Department of the Interior, under USGS awardnumber 1434HQ98AG01943 and award number 1434HQ98AG01926. The views and conclusions contained in thisdocument are those of the authors and should not be interpreted as necessarily representing the official policies, eitherexpressed or implied, of the U.S. Government.
Quarterly Earthquake Report July September 1998
Table of ContentsIntroductionCurrent Network Operation and StatusSeismicityData ManagementTables
Explanation of TablesTable 1 Project PersonnelTable 2 Seismic StationsTable 3 Earthquake Hypocenter ListTable 4 Earthquake Phase Data ListTable 5 Microearthquakes and Other Nonlocatable Events
FiguresNESN Station MapNESN StrongMotion Station MapNESN Quarterly Seismicity MapNESN Cumulative Seismicity Map
AcknowledgmentsReferences
Introduction
The New England Seismic Network (NESN) is operated collaboratively by the Weston Observatory (WES) of BostonCollege and the Earth Resources Lab (ERL) of the Massachusetts Institute of Technology. The mission of the NESN is tooperate and maintain a regional seismic network with digital recording of seismic ground motions for the followingpurposes: 1) to determine the location and magnitude of earthquakes in and adjacent to New England and report feltevents to public safety agencies, 2) to define the crust and upper mantle structure of the northeastern United States, 3)to derive the source parameters of New England earthquakes, and 4) to estimate the seismic hazard in the area.
This report summarizes the work of the NESN for the period July September 1998. It includes a brief summary of thenetwork's equipment and operation, and a short discussion of data management procedures. A list of participatingpersonnel is given in Table 1. There were 8 earthquakes that occurred within or near the network during this reportingperiod. Phase information for these earthquakes is included in this report.
Return to Table of Contents
10/30/2017 NESN - Weston Observatory - Boston College
https://www.bc.edu/research/westonobservatory/nesnbc98c.html 3/15
Current Network Operation and Status
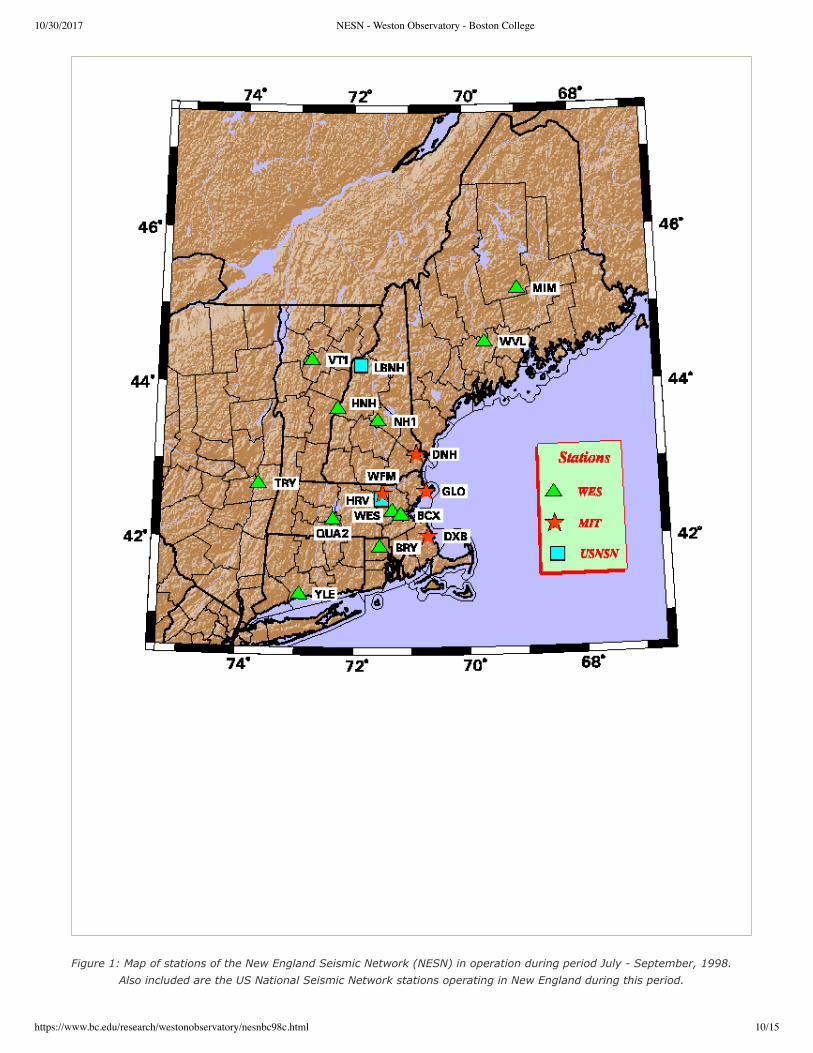
The New England Seismic Network currently consists of 11 broadband threecomponent, 4 shortperiod vertical, and 8strongmotion stations. The coordinates of the stations are given in Table 2, and maps of the weak and strongmotionnetworks are shown in Figures 1 and 2, respectively.
WES operates 11 stations with broadband instruments consisting of Guralp CMG40T threecomponent sensors. Groundmotions recorded by these sensors are digitized at 100 sps with 16bit resolution. Additional gainranging provides 126dB dynamic range. These stations are operated in dialup mode with waveform segments of suspected events transmittedin digital mode to Weston Observatory for analysis and archiving. WES is continuing to upgrade its recording stationswith 4 more broadband instruments scheduled for installation in 1999. WES also maintains 8 SMA1 strongmotioninstruments in New England.
ERL at MIT currently operates 4 shortperiod stations, all located within 100 km of Boston. The short period instrumentshave 1.0 Hz L4C vertical seismometers. Data recorded by these seismometers is transmitted continuously in analog modeto ERL and digitized (12bit) into a PC at 50 sps. Personnel at ERL are in the process of installing a new threecomponent,high dynamic range instrument at Station WFM. The instrument has a CMG40T sensor and transmits 3channel, 24bitdata at 100 sps continuously to a central processor (Pentium PC) at ERL. Waveform windows of suspected events areextracted from the data stream, analyzed and archived. WES and ERL record some stations in analog format onhelicorders to provide additional data for analysis.
Return to Table of Contents
Seismicity
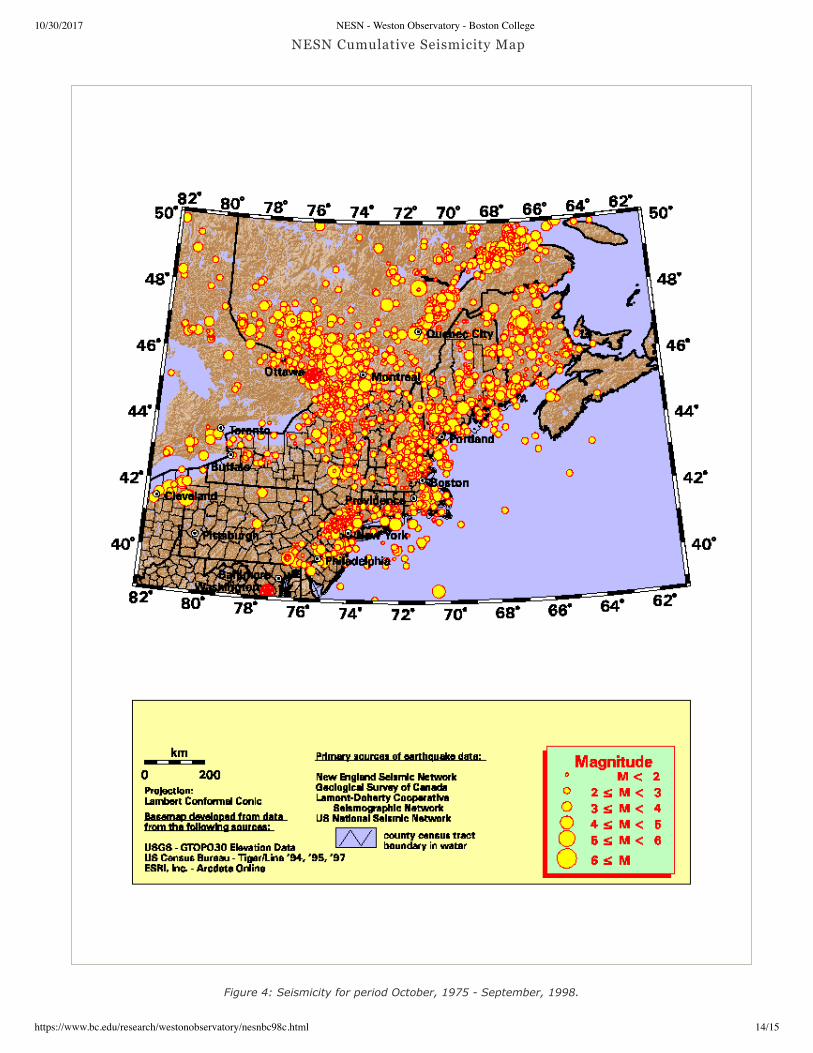
There were 8 earthquakes that occurred in or adjacent to the NESN during this reporting period. A summary of thelocation data is given in Table 3. Figure 3 shows the locations of these events. Figure 4 shows the locations of all eventssince the beginning of network operation in October, 1975.
Table 4 gives the station phase data and detailed hypocenter data for each event listed in Table 3. In addition to NESNdata, arrival time and magnitude data sometimes are contributed for seismic stations operated by the Geological Surveyof Canada (GSC), the LamontDoherty Cooperative Seismographic Network., and the US National Seismic Network. Finallocations for this section were computed using the program HYPO78. For regional events (those too far from the NESN toobtain accurate locations and magnitudes) phase data are given for NESN stations, but the entry in Table 3 lists thehypocenter and geographic location information adopted from the authoritative network.
Return to Table of Contents
Data Management
Recent event locations are available via FTP at: SEISMOEAGLE.BC.EDU. Waveform data are saved in Nanometrics, ASCII,and SEED formats and are available via SEISMOEAGLE.BC.EDU or through personal contact. Earthquake lists can befingered at [email protected]. Weston Observatory maintains two web pages with information about localearthquakes: "http://www.bc.edu:80/bc_org/avp/cas/wesobs/" and "http://seismoeagle.bc.edu/". The latter page is stillunder contruction. Currently available on the seismoeagle web page is the full catalog of northeastern earthquake activityto 1991. This will be updated as new Northeastern U.S. Seismic Network Bulletins are produced.
The entire MIT/ERL earthquake database can be accessed through the World Wide Web using the address "http://wwwerl.mit.edu/NESN/homepage.html". For extraction of waveforms (recorded by the MIT stations of the NESN throughMarch 1995) and hypocenter data, use our database search engine. Link to "Seismic Event Server at MIT ERL (SESAME)"and then click on "Interactive query form" under the heading "Custom Materials". Alternatively, the more recent localearthquake data, recorded by the MIT stations, may be accessed by logging in to our anonymous FTP directory ("ftpsunda.mit.edu"). To be added to the list of users permitted to access this FTP directory, contact Charles Doll. Thewaveform files are in SAC format at both sites. Waveforms are downloaded as a Unixcompressed tar volume from ourwebsite and as individual, Unixcompressed, station files from our FTP site.
For more information on matters discussed in this report or general earthquake information (reports, maps, catalogs,etc.) consult our websites wwwerl.mit.edu/NESN and www.bc.edu:80/bc_org/avp/cas/wesobs/ or contact:
Charles Doll MIT Earth Resources Lab

10/30/2017 NESN - Weston Observatory - Boston College
https://www.bc.edu/research/westonobservatory/nesnbc98c.html 4/15
42 Carleton Street
Cambridge, MA 02142
Voice: 6172537863 / FAX: 6172536385 / Email: [email protected]
Prof. John Ebel
Weston Observatory
381 Concord Road
Weston, MA 02493
Voice: 6175528319 / FAX: 6175528388 / Email: [email protected]
Return to Table of Contents
Explanation of Tables
Table 1: List of personnel operating the NESN
Table 2: List of Seismic and Strong Motion Stations
1. Code = station name2. Lat = station latitude, degrees north3. Long = station longitude, degrees west4. Elev = station elevation in meters5. Location = geographic location6. Operator = network operator
Table 3: Earthquake Hypocenter List
1. Date = date event occurred, Yr (year)/Mo (month)/Dy (day)2. Time = origin time of event, Hr (hour):Mn (minute):Sec (second) in UCT (Universal Coordinated Time, same as Greenwich Mean Time)
3. Lat = event location, latitude north in degrees4. Long = event location, longitude west in degrees5. Depth = event depth in kilometers6. Mag = event magnitude7. Int = event epicentral intensity8. Location = event geographic location
Table 4: Earthquake detailed hypocenter and phase data list
Table Header: detailed hypocenter data
1. Geographic location2. DATE = date event occurred, yr/mo/dy (year/month/day)3. ORIGIN = event origin time (UCT) in hours, minutes, and seconds4. LAT N = latitude north in degrees and minutes5. LONG W = longitude west in degrees and minutes6. DEPTH = event depth in kilometers7. MN = Nuttli Lg phase magnitude with amplitude divided by period8. MC = signal duration (coda) magnitude
WES: 2.23 Log(FMP) + 0.12Log(Dist) 2.36 (Rosario, 1979)MIT: 2.21 Log(FMP) 1.7 (Chaplin et al., 1980)
9. ML = local magnitude
WES: calculated from WoodAnderson seismograms (Ebel, 1982)GSC (Geological Survey of Canada): Richter Lg magnitude
10. GAP = largest azimuthal separation, in degrees, between stations11. RMS = root mean square error of travel time residual in seconds12. ERH = standard error of epicenter in kilometers13. ERZ = standard error of event depth in kilometers14. Q = solution quality of hypocenter
A = excellentB = goodC = fairD = poor

10/30/2017 NESN - Weston Observatory - Boston College
https://www.bc.edu/research/westonobservatory/nesnbc98c.html 5/15
Table Body: earthquake phase data
1. STN = station name2. DIST = epicentral distance in kilometers3. AZM = azimuthal angle in degrees measured clockwise between true north and vector pointing from epicenter to station4. Description of onset of phase arrival
I = impulsiveE = emergent
5. R = phase
P = first P arrivalS = first S arrival
6. M = first motion direction of phase arrival
U = up or compressionD = down or dilatation
7. K = weight of arrival
0 = full weight (1.0)1 = 0.75 weight2 = 0.50 weight3 = 0.25 weight4 = no weight (0.0)
8. HRMN = hour and minute of phase arrival9. SEC = second of phase arrival10. TCAL = calculated travel time of phase in seconds11. RES = travel time residual (error) of phase arrival12. WT = weight of phase used in hypocentral solution13. AMX = peaktopeak ground motion, in millimicrons, of the maximum envelope amplitude of verticalcomponent signal,
corrected for system response14. PRX = period in seconds of the signal from which amplitude was measured15. XMAG = Nuttli magnitude recorded at station16. FMP = signal duration (coda), in seconds, measured from first P arrival17. FMAG = coda magnitude recorded at station
Table 5: Microearthquakes and other nonlocatable events
1. Date = date event occurred, Yr (year)/Mo (month)/Dy (day)2. Sta = nearest station recording event3. Arrival Time = phase arrival time, Hr (hour):Mn (minute):Sec (second)
Return to Table of Contents
TABLE 1
WESTON OBSERVATORY PERSONNEL
Name Network Position voice phone email address
John E. Ebel Principal Investigator 6175528319 [email protected]
Alan Kafka Research Seismologist 6175528300 [email protected]
Susan O'Connor Seismic Analyst 6175528337 [email protected]
Edward Johnson Project Engineer 6175528332 [email protected]
Patricia Tassia Administrative Secretary 6175528311 [email protected]
W. Richard Ott, S.J. Assistant to the Director 6175528335 [email protected]
Weston Observatory 6175528300 6175528388 (FAX)
MIT/ERL PERSONNEL
NameNetwork Position voice phone email address
M. Nafi Toksöz Principal Investigator 6172537852 [email protected]
Charles Doll Research Seismologist 6172537863 [email protected]
Charles Doll Seismic Analyst 6172536290 [email protected]
Sara Brydges Administrator 6172537797 [email protected]
Earth Resources Lab 6172538027 6172536385 (FAX)
Return to Table of Contents

10/30/2017 NESN - Weston Observatory - Boston College
https://www.bc.edu/research/westonobservatory/nesnbc98c.html 6/15
TABLE 2
SEISMIC STATIONS OF THE NEW ENGLAND SEISMIC NETWORKCode Lat Long Elev (m) Location Operator
BCX 42.3350 71.1705 61.0 Chestnut Hill, MA WES
BRY 41.9178 71.5388 380.0 Smithfield, RI WES
DNH 43.1225 70.8948 24.0 Durham, NH MIT
DXB 42.0610 70.6992 8.0 Duxbury, MA MIT
GLO 42.6403 70.7272 15.2 Gloucester, MA MIT
HNH 43.7050 72.2860 180.0 Hanover, NH WES
MIM 45.2436 69.0403 140.0 Milo, ME WES
NH1 43.5473 71.5743 402.0 Sanbornton, NH WES
QUA2 42.2789 72.3525 168.0 Belchertown, MA WES
TRY 42.7311 73.6669 131.0 Troy, NY WES
VT1 44.3317 72.7536 410.0 Waterbury, VT WES
WES 42.3850 71.3220 60.0 Weston, MA WES
WFM 42.6106 71.4906 87.5 Westford, MA MIT
WVL 44.5648 69.6575 85.0 Waterville, ME WES
YLE 41.3100 72.9269 9.14 New Haven, CT WES
STRONG MOTION STATIONS OF THE NEW ENGLAND SEISMIC NETWORKCode Lat Long Location Operator
SM1 44.90 67.25 Dennysville, ME WES
SM2 44.49 73.10 Essex Junction, VT WES
SM3 41.45 71.33 Newport, RI WES
SM4 42.38 71.32 Weston, MA WES
SM5 42.66 71.30 Lowell, MA WES
SM6 42.30 71.34 Natick, MA WES
SM7 42.39 71.54 Hudson, MA WES
SM8 44.48 69.61 North Vassalboro, ME WES
Return to Table of Contents
TABLE 3
EARTHQUAKE HYPOCENTER LIST NEW ENGLAND AND ADJACENT REGIONS
July - September 1998Date
Yr/Mo/DyTime
Hr:Mn:Sec Lat Long Depth (km) Mag Int Location
1998/07/07 09:41:42.44 43.2115 71.6683 .17 2.1 NH, W of Concord
1998/07/09 01:52:15.30 44.6763 73.6460 .17 2.3 NY, W of Plattsburgh
1998/07/15 07:08:05.13 47.0000 66.6463 5.0 4.3 NB, Miramichi Region
1998/07/30 08:57:24.22 46.2171 74.7200 34.96 4.0 PQ, Ste Agathedes Monts
1998/08/24 19:27:35.71 44.0405 75.8023 1.56 2.9 NY, Near Watertown
1998/09/05 05:19:56.12 44.3475 68.6405 5.0 2.3 ME, Near Blue Hill Falls
1998/09/16 07:49:10.63 44.9258 67.2036 5.0 2.6 ME, Approx 30 km NE of Machias < /td>
1998/09/25 19:52:52.48 41.471 80.483 5.0 5.2 OH,30 km N of Sharon (USGS location )
Return to Table of Contents
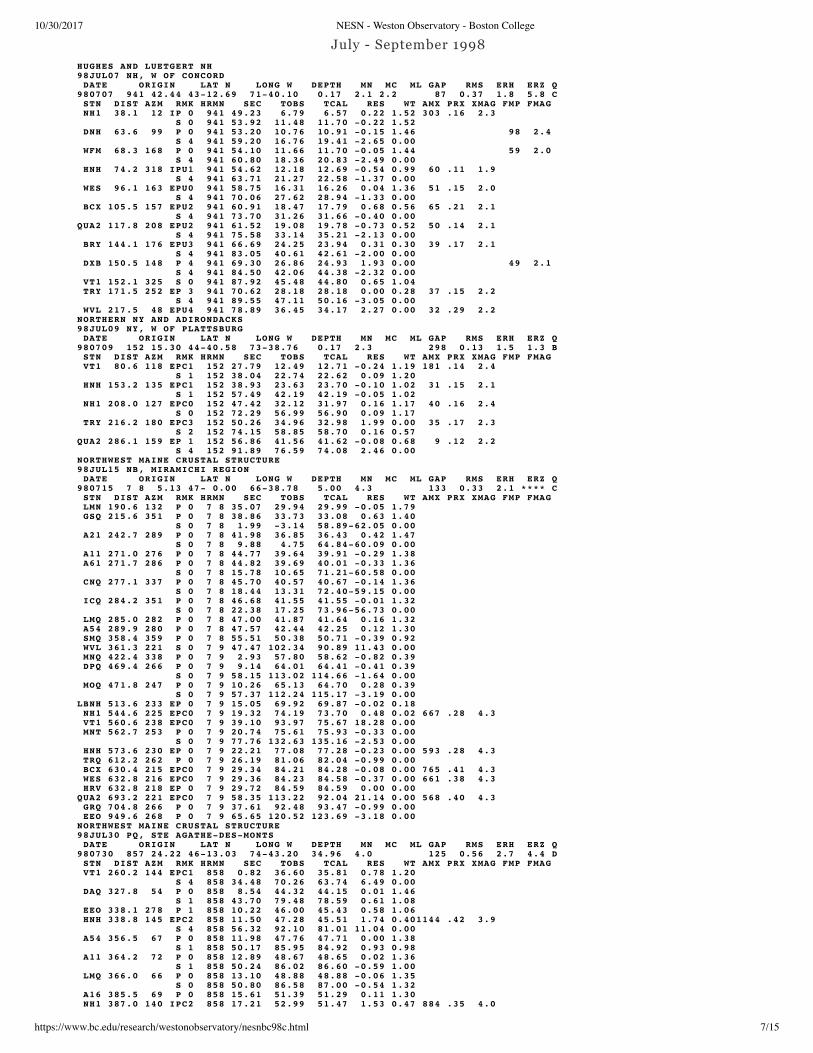
TABLE 4
EARTHQUAKE PHASE DATA LIST NEW ENGLAND AND ADJACENT REGIONS
10/30/2017 NESN - Weston Observatory - Boston College
https://www.bc.edu/research/westonobservatory/nesnbc98c.html 7/15
July - September 1998 HUGHES AND LUETGERT NH 98JUL07 NH, W OF CONCORD DATE ORIGIN LAT N LONG W DEPTH MN MC ML GAP RMS ERH ERZ Q 980707 941 42.44 43-12.69 71-40.10 0.17 2.1 2.2 87 0.37 1.8 5.8 C STN DIST AZM RMK HRMN SEC TOBS TCAL RES WT AMX PRX XMAG FMP FMAG NH1 38.1 12 IP 0 941 49.23 6.79 6.57 0.22 1.52 303 .16 2.3 S 0 941 53.92 11.48 11.70 -0.22 1.52 DNH 63.6 99 P 0 941 53.20 10.76 10.91 -0.15 1.46 98 2.4 S 4 941 59.20 16.76 19.41 -2.65 0.00 WFM 68.3 168 P 0 941 54.10 11.66 11.70 -0.05 1.44 59 2.0 S 4 941 60.80 18.36 20.83 -2.49 0.00 HNH 74.2 318 IPU1 941 54.62 12.18 12.69 -0.54 0.99 60 .11 1.9 S 4 941 63.71 21.27 22.58 -1.37 0.00 WES 96.1 163 EPU0 941 58.75 16.31 16.26 0.04 1.36 51 .15 2.0 S 4 941 70.06 27.62 28.94 -1.33 0.00 BCX 105.5 157 EPU2 941 60.91 18.47 17.79 0.68 0.56 65 .21 2.1 S 4 941 73.70 31.26 31.66 -0.40 0.00 QUA2 117.8 208 EPU2 941 61.52 19.08 19.78 -0.73 0.52 50 .14 2.1 S 4 941 75.58 33.14 35.21 -2.13 0.00 BRY 144.1 176 EPU3 941 66.69 24.25 23.94 0.31 0.30 39 .17 2.1 S 4 941 83.05 40.61 42.61 -2.00 0.00 DXB 150.5 148 P 4 941 69.30 26.86 24.93 1.93 0.00 49 2.1 S 4 941 84.50 42.06 44.38 -2.32 0.00 VT1 152.1 325 S 0 941 87.92 45.48 44.80 0.65 1.04 TRY 171.5 252 EP 3 941 70.62 28.18 28.18 0.00 0.28 37 .15 2.2 S 4 941 89.55 47.11 50.16 -3.05 0.00 WVL 217.5 48 EPU4 941 78.89 36.45 34.17 2.27 0.00 32 .29 2.2 NORTHERN NY AND ADIRONDACKS 98JUL09 NY, W OF PLATTSBURG DATE ORIGIN LAT N LONG W DEPTH MN MC ML GAP RMS ERH ERZ Q 980709 152 15.30 44-40.58 73-38.76 0.17 2.3 298 0.13 1.5 1.3 B STN DIST AZM RMK HRMN SEC TOBS TCAL RES WT AMX PRX XMAG FMP FMAG VT1 80.6 118 EPC1 152 27.79 12.49 12.71 -0.24 1.19 181 .14 2.4 S 1 152 38.04 22.74 22.62 0.09 1.20 HNH 153.2 135 EPC1 152 38.93 23.63 23.70 -0.10 1.02 31 .15 2.1 S 1 152 57.49 42.19 42.19 -0.05 1.02 NH1 208.0 127 EPC0 152 47.42 32.12 31.97 0.16 1.17 40 .16 2.4 S 0 152 72.29 56.99 56.90 0.09 1.17 TRY 216.2 180 EPC3 152 50.26 34.96 32.98 1.99 0.00 35 .17 2.3 S 2 152 74.15 58.85 58.70 0.16 0.57 QUA2 286.1 159 EP 1 152 56.86 41.56 41.62 -0.08 0.68 9 .12 2.2 S 4 152 91.89 76.59 74.08 2.46 0.00 NORTHWEST MAINE CRUSTAL STRUCTURE 98JUL15 NB, MIRAMICHI REGION DATE ORIGIN LAT N LONG W DEPTH MN MC ML GAP RMS ERH ERZ Q 980715 7 8 5.13 47- 0.00 66-38.78 5.00 4.3 133 0.33 2.1 **** C STN DIST AZM RMK HRMN SEC TOBS TCAL RES WT AMX PRX XMAG FMP FMAG LMN 190.6 132 P 0 7 8 35.07 29.94 29.99 -0.05 1.79 GSQ 215.6 351 P 0 7 8 38.86 33.73 33.08 0.63 1.40 S 0 7 8 1.99 -3.14 58.89-62.05 0.00 A21 242.7 289 P 0 7 8 41.98 36.85 36.43 0.42 1.47 S 0 7 8 9.88 4.75 64.84-60.09 0.00 A11 271.0 276 P 0 7 8 44.77 39.64 39.91 -0.29 1.38 A61 271.7 286 P 0 7 8 44.82 39.69 40.01 -0.33 1.36 S 0 7 8 15.78 10.65 71.21-60.58 0.00 CNQ 277.1 337 P 0 7 8 45.70 40.57 40.67 -0.14 1.36 S 0 7 8 18.44 13.31 72.40-59.15 0.00 ICQ 284.2 351 P 0 7 8 46.68 41.55 41.55 -0.01 1.32 S 0 7 8 22.38 17.25 73.96-56.73 0.00 LMQ 285.0 282 P 0 7 8 47.00 41.87 41.64 0.16 1.32 A54 289.9 280 P 0 7 8 47.57 42.44 42.25 0.12 1.30 SMQ 358.4 359 P 0 7 8 55.51 50.38 50.71 -0.39 0.92 WVL 361.3 221 S 0 7 9 47.47 102.34 90.89 11.43 0.00 MNQ 422.4 338 P 0 7 9 2.93 57.80 58.62 -0.82 0.39 DPQ 469.4 266 P 0 7 9 9.14 64.01 64.41 -0.41 0.39 S 0 7 9 58.15 113.02 114.66 -1.64 0.00 MOQ 471.8 247 P 0 7 9 10.26 65.13 64.70 0.28 0.39 S 0 7 9 57.37 112.24 115.17 -3.19 0.00 LBNH 513.6 233 EP 0 7 9 15.05 69.92 69.87 -0.02 0.18 NH1 544.6 225 EPC0 7 9 19.32 74.19 73.70 0.48 0.02 667 .28 4.3 VT1 560.6 238 EPC0 7 9 39.10 93.97 75.67 18.28 0.00 MNT 562.7 253 P 0 7 9 20.74 75.61 75.93 -0.33 0.00 S 0 7 9 77.76 132.63 135.16 -2.53 0.00 HNH 573.6 230 EP 0 7 9 22.21 77.08 77.28 -0.23 0.00 593 .28 4.3 TRQ 612.2 262 P 0 7 9 26.19 81.06 82.04 -0.99 0.00 BCX 630.4 215 EPC0 7 9 29.34 84.21 84.28 -0.08 0.00 765 .41 4.3 WES 632.8 216 EPC0 7 9 29.36 84.23 84.58 -0.37 0.00 661 .38 4.3 HRV 632.8 218 EP 0 7 9 29.72 84.59 84.59 0.00 0.00 QUA2 693.2 221 EPC0 7 9 58.35 113.22 92.04 21.14 0.00 568 .40 4.3 GRQ 704.8 266 P 0 7 9 37.61 92.48 93.47 -0.99 0.00 EEO 949.6 268 P 0 7 9 65.65 120.52 123.69 -3.18 0.00 NORTHWEST MAINE CRUSTAL STRUCTURE 98JUL30 PQ, STE AGATHE-DES-MONTS DATE ORIGIN LAT N LONG W DEPTH MN MC ML GAP RMS ERH ERZ Q 980730 857 24.22 46-13.03 74-43.20 34.96 4.0 125 0.56 2.7 4.4 D STN DIST AZM RMK HRMN SEC TOBS TCAL RES WT AMX PRX XMAG FMP FMAG VT1 260.2 144 EPC1 858 0.82 36.60 35.81 0.78 1.20 S 4 858 34.48 70.26 63.74 6.49 0.00 DAQ 327.8 54 P 0 858 8.54 44.32 44.15 0.01 1.46 S 1 858 43.70 79.48 78.59 0.61 1.08 EEO 338.1 278 P 1 858 10.22 46.00 45.43 0.58 1.06 HNH 338.8 145 EPC2 858 11.50 47.28 45.51 1.74 0.401144 .42 3.9 S 4 858 56.32 92.10 81.01 11.04 0.00 A54 356.5 67 P 0 858 11.98 47.76 47.71 0.00 1.38 S 1 858 50.17 85.95 84.92 0.93 0.98 A11 364.2 72 P 0 858 12.89 48.67 48.65 0.02 1.36 S 1 858 50.24 86.02 86.60 -0.59 1.00 LMQ 366.0 66 P 0 858 13.10 48.88 48.88 -0.06 1.35 S 0 858 50.80 86.58 87.00 -0.54 1.32 A16 385.5 69 P 0 858 15.61 51.39 51.29 0.11 1.30 NH1 387.0 140 IPC2 858 17.21 52.99 51.47 1.53 0.47 884 .35 4.0

10/30/2017 NESN - Weston Observatory - Boston College
https://www.bc.edu/research/westonobservatory/nesnbc98c.html 8/15
S 4 858 68.44 104.22 91.61 12.61 0.00 A61 388.5 65 P 0 858 15.86 51.64 51.65 -0.01 1.29 S 1 858 55.50 91.28 91.93 -0.66 0.94 TRY 396.3 168 EPC1 858 16.32 52.10 52.62 -0.51 0.941713 .79 4.1 S 4 858 67.68 103.46 93.66 9.81 0.00 A64 408.6 64 P 0 858 18.20 53.98 54.13 -0.17 1.23 S 0 858 60.68 96.46 96.35 0.08 1.23 A21 416.8 67 P 0 858 19.41 55.19 55.14 0.05 1.21 S 1 858 61.51 97.29 98.15 -0.86 0.86 WVL 437.8 115 EPC4 858 18.95 54.73 57.74 -3.02 0.00 845 .44 4.0 S 4 858 82.28 118.06 102.78 15.26 0.00 MIM 455.4 104 PC0 858 24.20 59.98 59.91 0.05 1.10 S 4 858 87.92 123.70 106.64 17.03 0.00 WFM 476.2 147 EP 3 858 30.40 66.18 62.48 3.69 0.00 S 4 858 91.30 127.08 111.22 15.85 0.00 QUA2 476.8 157 EPC0 858 27.35 63.13 62.55 0.56 1.03 385 .43 3.8 S 4 858 92.11 127.89 111.34 16.50 0.00 EFO 503.1 226 P 1 858 29.25 65.03 65.80 -0.76 0.70 S 1 858 80.48 116.26 117.12 -0.86 0.69 WES 504.9 148 EPC1 858 29.53 65.31 66.02 -0.71 0.70 561 .45 3.9 S 4 858 99.89 135.67 117.51 18.15 0.00 BCX 516.0 147 EPC4 858 48.16 83.94 67.40 16.55 0.00 DXB 563.0 145 EP 4 858 54.10 89.88 73.19 16.69 0.00 MNQ 651.2 43 P 0 858 47.75 83.53 84.09 -0.55 0.54 LMN 769.1 93 P 1 858 62.05 97.83 98.64 -0.80 0.16 NORTHERN NY AND ADIRONDACKS 98AUG24 NY, NEAR WATERTOWN DATE ORIGIN LAT N LONG W DEPTH MN MC ML GAP RMS ERH ERZ Q 980824 1927 35.71 44- 2.43 75-48.14 1.56 2.9 193 0.62 5.5 8.3 D STN DIST AZM RMK HRMN SEC TOBS TCAL RES WT AMX PRX XMAG FMP FMAG TRQ 261.6 22 P 3 1928 13.26 37.55 38.43 -0.88 0.49 S 4 1928 47.35 71.64 68.41 3.23 0.00 HNH 285.0 98 EPC3 1928 15.58 39.87 41.33 -1.49 0.34 52 .16 2.8 S 0 1928 49.91 74.20 73.56 0.58 1.85 GRQ 285.2 359 P 4 1928 19.78 44.07 41.35 2.71 0.00 MOQ 314.7 63 P 0 1928 20.57 44.86 45.00 -0.28 1.68 S 1 1928 55.92 80.21 80.10 -0.14 1.26 QUA2 341.9 125 EP 0 1928 23.96 48.25 48.36 -0.14 1.49 91 .31 2.9 S 2 1928 60.28 84.57 86.07 -1.56 0.46 NH1 344.6 99 EP 1 1928 25.09 49.38 48.69 0.69 1.07 93 .20 3.1 S 2 1928 63.33 87.62 86.67 0.95 0.67 DPQ 377.0 39 P 0 1928 28.33 52.62 52.69 -0.07 1.24 S 3 1928 68.55 92.84 93.79 -0.95 0.29 EEO 386.5 318 P 0 1928 29.94 54.23 53.85 0.37 1.16 S 4 1928 68.24 92.53 95.86 -3.33 0.00 WES 408.0 117 S 4 1928 82.22 106.51 100.58 5.90 0.00 91 .55 2.9 SOUTHEAST MAINE CRUSTAL MODEL 98SEP05 ME, NEAR BLUE HILL FALLS DATE ORIGIN LAT N LONG W DEPTH MN MC ML GAP RMS ERH ERZ Q 980905 519 56.12 44-20.85 68-38.43 5.00 2.3 2.7 164 0.52 3.9 6.2 D STN DIST AZM RMK HRMN SEC TOBS TCAL RES WT AMX PRX XMAG FMP FMAG WVL 84.2 284 EP 0 520 10.36 14.24 13.62 0.60 1.79 67 .13 2.0 S 0 520 19.79 23.67 24.25 -0.60 1.75 MIM 104.5 342 IP 0 520 12.70 16.58 16.84 -0.28 1.71 60 .14 2.1 127 2.7 S 0 520 26.49 30.37 29.97 0.36 1.71 NH1 251.9 249 EPC1 520 36.00 39.88 36.87 3.01 0.10 31 .18 2.4 S 4 520 65.77 69.65 65.62 4.03 0.00 HNH 301.0 256 EPC4 520 46.17 50.05 42.92 7.10 0.00 20 .20 2.3 S 4 520 81.57 85.45 76.39 9.00 0.00 MOQ 305.4 291 P 0 520 39.71 43.59 43.46 -0.02 0.94 WES 307.8 225 EPC0 520 39.91 43.79 43.76 0.02 0.93 13 .15 2.3 S 4 520 74.20 78.08 77.90 0.16 0.00 LMN 345.0 61 P 0 520 43.85 47.73 48.36 -0.63 0.77 S 4 520 79.95 83.83 86.08 -2.25 0.00 QUA2 378.9 233 P 4 520 42.11 45.99 52.54 -6.58 0.00 25 .32 2.5 S 4 520 60.18 64.06 93.52-29.51 0.00 A21 381.8 348 P 0 520 48.73 52.61 52.90 -0.29 0.65 S 4 520 89.72 93.60 94.16 -0.56 0.00 DPQ 414.5 309 P 0 520 53.42 57.30 56.93 0.36 0.52 S 4 520 94.37 98.25 101.34 -3.09 0.00 GSQ 521.0 13 P 0 520 66.45 70.33 70.09 0.23 0.11 SOUTHEAST MAINE CRUSTAL MODEL 98SEP16 ME, APPROX 30 KM NE OF MACHIAS DATE ORIGIN LAT N LONG W DEPTH MN MC ML GAP RMS ERH ERZ Q 980916 749 10.63 44-55.55 67-12.22 5.00 2.6 3.0 168 0.66 3.9 4.4 D STN DIST AZM RMK HRMN SEC TOBS TCAL RES WT AMX PRX XMAG FMP FMAG MIM 148.8 284 IPC0 749 34.24 23.61 23.88 -0.29 2.97 82 .14 2.5 132 2.8 S 0 749 53.18 42.55 42.50 0.02 2.97 WVL 200.1 257 EPC3 749 43.14 32.51 30.47 2.03 0.50 64 .17 2.5 167 3.0 S 3 749 60.01 49.38 54.23 -4.87 0.00 LMN 214.1 61 P 0 749 42.58 31.95 32.20 -0.25 2.49 A11 346.3 318 P 1 749 59.90 49.27 48.52 0.74 1.12 A21 363.4 328 P 1 749 61.81 51.18 50.62 0.56 1.02 A54 374.9 319 P 0 749 63.09 52.46 52.04 0.36 1.30 A61 379.7 324 P 0 749 63.42 52.79 52.64 0.14 1.26 NH1 381.5 246 EPC2 750 2.35 51.72 52.86 -1.14 0.61 34 .16 2.9 144 3.1 S 4 750 53.65 103.02 94.09 8.93 0.00 MOQ 399.9 276 P 0 750 5.58 54.95 55.13 -0.32 1.11 S 3 750 46.64 96.01 98.13 -2.37 0.21 HNH 427.6 252 EPC3 750 11.39 60.76 58.56 2.17 0.16 25 .21 2.8 S 4 750 68.71 118.08 104.23 13.80 0.00 WES 435.8 230 EPC2 750 11.19 60.56 59.57 0.98 0.41 17 .25 2.5 S 4 750 50.94 100.31 106.03 -5.74 0.00 GSQ 443.5 1 P 1 750 11.90 61.27 60.51 0.75 0.58 S 0 750 58.18 107.55 107.71 -0.18 0.79 VT1 445.6 261 EPC4 749 22.34 11.71 60.77-49.08 0.00 S 4 749 49.05 38.42 108.18-69.79 0.00 DAQ 458.9 317 P 1 749 72.32 61.69 62.41 -0.88 0.50 DPQ 475.2 294 P 0 750 14.54 63.91 64.43 -0.52 0.55 S 3 750 63.24 112.61 114.68 -2.07 0.12 CNQ 491.0 352 P 1 749 76.51 65.88 66.38 -0.53 0.33 QUA2 509.3 235 S 4 751 69.90 179.27 122.17 57.04 0.00 MNQ 634.1 349 P 0 749 94.47 83.84 84.05 -0.21 0.00 SOUTH & COASTAL NEW ENGLAND, CHIBURIS, 1979

10/30/2017 NESN - Weston Observatory - Boston College
https://www.bc.edu/research/westonobservatory/nesnbc98c.html 9/15
98SEP25 OH, OHIO-PENNSYLVANIA BORDER (NESN LOCATION POOR) DATE ORIGIN LAT N LONG W DEPTH MN MC ML GAP RMS ERH ERZ Q 980925 1952 25.78 40-33.17 82-54.98 5.00 5.4 4.7 326 0.18 74.9 **** D STN DIST AZM RMK HRMN SEC TOBS TCAL RES WT AMX PRX XMAG FMP FMAG EEO 744.3 25 P 4 1954 11.88 106.10 98.03 8.07 0.00 S 4 1954 69.30 163.52 174.49-10.97 0.00 TRY 808.2 73 IPU0 1954 11.87 106.09 105.92 0.17 2.78 YLE 846.0 84 EP 4 1954 17.12 111.34 110.58 0.76 0.00 668 4.4 TRQ 924.9 47 P 0 1954 26.08 120.30 120.33 -0.03 1.10 S 4 1954 98.26 192.48 214.18-21.70 0.00 VT1 936.1 63 EPD4 1954 2.34 96.56 121.71-25.17 0.00 MNT 936.3 54 P 0 1954 27.39 121.61 121.74 -0.13 0.92 HNH 946.6 68 IPD0 1954 28.62 122.84 123.00 -0.19 0.76 BRY 966.3 81 IPD0 1954 30.85 125.07 125.44 -0.37 0.41 WES 989.2 78 IPD0 1954 33.46 127.68 128.27 -0.60 0.032659 .44 5.4 0 4.9 NH1 995.5 70 IPD0 1954 34.94 129.16 129.04 0.12 0.00 BCX1002.0 79 IPU0 1954 35.24 129.46 129.85 -0.39 0.004283 .66 5.4 0 4.6 DPQ1064.8 50 P 0 1954 42.29 136.51 137.60 -1.09 0.00 WVL1175.4 68 IPU0 1954 56.52 150.74 151.25 -0.52 0.00 855 4.7 A111263.6 54 P 0 1954 67.36 161.58 162.14 -0.57 0.00
Return to Table of Contents
TABLE 5
MICROEARTHQUAKES AND OTHER NON-LOCATABLE EVENTSDate
Yr/Mo/DySta
Arrival Time
Hr:Mn:Sec
None recorded this quarter
Return to Table of Contents
NESN Station Map
10/30/2017 NESN - Weston Observatory - Boston College
https://www.bc.edu/research/westonobservatory/nesnbc98c.html 10/15
Figure 1: Map of stations of the New England Seismic Network (NESN) in operation during period July September, 1998.Also included are the US National Seismic Network stations operating in New England during this period.

10/30/2017 NESN - Weston Observatory - Boston College
https://www.bc.edu/research/westonobservatory/nesnbc98c.html 11/15
Return to Table of Contents
NESN Strong-Motion Station Map

10/30/2017 NESN - Weston Observatory - Boston College
https://www.bc.edu/research/westonobservatory/nesnbc98c.html 12/15
Figure 2: Map of strongmotion stations of the New England Seismic Network (NESN) in operation during period July September, 1998.
Return to Table of Contents
NESN Quarterly Seismicity Map

10/30/2017 NESN - Weston Observatory - Boston College
https://www.bc.edu/research/westonobservatory/nesnbc98c.html 13/15
Figure 3: Earthquake epicenters located by the NESN during period July September, 1998.
Return to Table of Contents
10/30/2017 NESN - Weston Observatory - Boston College
https://www.bc.edu/research/westonobservatory/nesnbc98c.html 14/15
NESN Cumulative Seismicity Map
Figure 4: Seismicity for period October, 1975 September, 1998.

10/30/2017 NESN - Weston Observatory - Boston College
https://www.bc.edu/research/westonobservatory/nesnbc98c.html 15/15
Updated: July 12, 2011
Maintained by: Weston Observatory
Accessibility | Contact | Feedback
© 2017 The Trustees of Boston College. Legal
Return to Table of Contents
Acknowledgments
We would like to thank the Undergraduate Research Opportunities Program (UROP) of MIT for its support to the network.
Our map database has been developed inhouse using ARCINFO and in part basemap data provided by ESRI, Inc.
(Arcdata Online), USGS GTOPO30 Elevation Data, and TIGER/Line '94, '95, and '97 (US Census Bureau) spatial data.
References
Chaplin, M.P., Taylor, S.R., and Toksöz, M.N. (1980), A coda length magnitude scale for New England, Earthquake Notes,51, 1522.
Ebel, J.E. (1982), ML measurements for northeastern United States earthquakes, Bull. Seism. Soc. Am., 72, 13671378.
Rosario, M. (1979), A coda duration magnitude scale for the New England Seismic Network, Master's Thesis, BostonCollege, 82 pp.
Return to Table of Contents