a study of multistage/multifunction column for fine
TRANSCRIPT
A STUDY OF MULTISTAGE/MULTIFUNCTION COLUMN FOR FINE PARTICLESEPARATION
Annual Technical Report
Reporting Period: 07/01/1996 through 06/30/1997
Author: Shiao-Hung Chiang
Report Issue Date: 09/15/1997
DE-FG22-94PC94217
Chemical and Petroleum Engineering DepartmentUniversity of PittsburghPittsburgh, PA 15261
I
DISCLAIMER
This report was prepared as an account of work sponsored by an agency of the United
States Government. Neither the United States Government nor any agency thereof, nor any of
their employees, makes any warranty, express or implied, or assumes any legal liability or
responsibility for the accuracy, completeness, or usefulness of any information, apparatus, product,
or process disclosed, or represents that its use would not infringe privately owned rights.
Reference herein to any specific commercial product, process, or service by trade name,
trademark, manufacturer, or otherwise does not necessarily constitute or imply its endorsement,
recommendation, or favoring by the United States Government or any agency thereof. The views
and opinions of authors expressed herein do not necessarily state or reflect those of the United
States Government or any agency thereof.

II
ABSTRACT/EXECUTIVE SUMMARY
A non-agitated multi-stage column was constructed and applied to wastewater treatment.
Preliminary oil/water separation tests were performed. Excellent separation results verifies the
multi-function feature of the multi-stage column. Hydrodynamic behavior is considered as the
underlying cause for the separation performance. Therefore, a series of experiments were carried
out to investigate the hydrodynamic parameters, including gas holdups and liquid circulating
velocities. The experimental data will be used to create a mathematical model to simulate the
multi-stage column process. The model will further shed light on the future scale-up of the
MSTLFLO process.

III
TABLE OF CONTENTS
Page
Disclaimer.................................................................................................................................. I
Abstract/Executive Summary..................................................................................................... II
1.0 Introduction............................................................................................................…..........1
2.0 Results and Discussion.................................................................................................….... 2
3.0 Conclusion and Work Forecast....................................................................................…….23
4.0 Reference......................................................................................................................……25
Appendix A ……………………………………………………………………………………….27
Appendix B………………………………………………………………………………………..33

1
1.0 INTRODUCTION
The overall objective of the research program is to explore the potential application of a
new invention involving a multistage column equipped with concentric draft-tubes (hereafter
referred to as the multistage column) for fine coal cleaning and other fluid/particle separation
processes. The research work will identify the design parameters and their effects on the
performance of the separation process. The results of this study will provide an engineering basis
for further development of this technology in coal cleaning and in the general areas of fluid/particle
separation.
In the second year of the project, we focus our research efforts on the wastewater
treatment tests program, to demonstrate the multifunction features of the multistage column.
In compliance with DOE grant Amendment No. M003, the project schedule is adjusted. Table 1.1
shows work accomplished to date.
Table 1.1 Project Schedule
1994 1995 1996 1997 1998Tasks
7 9 12 3 6 9 12 3 6 9 12 3 6 9 12 3 6
1. Project Planning
2. Equipment
3. Hydrodynamic Tests
4. Separation Tests
5. Conventional Column Tests
6. Data Analysis
7. Reports
Notes: Quarterly Technical Progress Report; Annual Report; Final Report.

2
2.0 RESULTS AND DISCUSSION
2.1 Task 1: Project Planning
This task was completed in September 1994[1].
2.2 Task 2: Equipment Design and Construction
During the reporting period, the objective of task 2 is to modify an axisting multistage
column system in our lab for general use in wastewater treatment. This unit includes a multistage
flotation column, a gas supply system and associated ancillaries. The experiment equipment
construction was completed in the first quarter of the reporting year.(2) The column configuration
is depicted in Figure 2.2.1. The column wall is fabricated from 4-inch schedule 40 Excelon R-
4000 transparent PVC pipes connected by Lasco PVC flanges. The total height of the column is
2.95 m and the diameter is 0.1 m. Inside the column, three set of concentric draft-tubes and
baffle cones (see Figure 2.2.2) were installed to create multiple loop flow patterns. The diameter
ratio of draft tube to column is 0.75. The length of each draft tube is approximately 0.62 m. The
draft tubes are separated by cone baffles so that each draft tube functions as a stage. The length of
each draft tube is approximately 0.61 m. The baffle cones are machined from opaque PVC rods.
Previous study showed that a clearance of approximately 1.5 - 2.0 inches between the bottom rim
of the draft tube and top of the cone baffle was optimal in terms of liquid directing effect(3). A
small clearance of 1 mm is left between the edge of the cone baffle and the inside wall of the
column to allow net liquid flow downwards and to avoid two phase flow flooding. A distributor
section is added to improve the bottom stage gas holdup. For each stage, two 1/4 inch NPT holes
are tapped to install conductivity probes which are 18 inches apart. Four 1/8 inch NPT holes are

3
From house air
12
3
4
5
6
7
8
9
10
11
12
Clean Water
Drain
1 Air filter2 Gas regulator3 Gas flowmeter4 Sparger5 Draft tube6 Cone baffle7 Liquid distributor8 Liquid control arm9 Liquid flowmeter10 Static mixter11 Pump12 Feed tank
Figure 2.2.1 Multistage Flotation Column for Waste Water Treatment

4
Figure 2.2.2 Cone Baffle

5
10
Unit: cm
Figure 2.2.3 Column geometry

6
tapped 18 inch apart (two through draft tube) to insert the pressure taps. Detailed geometry of the
column is shown in Figure 2.2.3.
The gas sparger is machined from a porous sintered metal tube supplied by the Mott
Metallurgical Corporation. The mean pore size is 10 microns and sparger is 1 inch in diameter and
6 inches long. The sparger is mounted at the center of the threaded bottom flanges where the gas
line entered the column.
2.3 Task 3: Hydrodynamic Tests
The objective of this task is to pursue a basic understanding of the hydrodynamic behavior and
to characterize the flow and mixing conditions in the multistage separation column. This task was
completed in December 1995(4) for the previous version of the agitated column for solid-solid
separations. The hydrodynamic tests for the newly constructed column for liquid-liquid separation
has begun in this year.
2.3.1 Local Gas Holdup Measurement
Gas Holdup is an important parameter affecting the flotation processes. Local gas holdup
deference determines the liquid circulation velocity and local interfacial area. In this work, gas
holdup is measured in terms of hydrostatic pressure difference using a manometer. U-tube
manometer is used to measure the overall gas holdup and an inverted U-tube is employed to
measure the local gas holdups in the riser or downcomer. The following equations are used to
calculate the overall gas holdup and local gas holdup(5):

7
ε
ρρ
overall
Bm
Wm W
B
H H H
H=− −
(2-1)
and
εLocalmH
HL= (2-2)
where Hm denotes the manometer reading; HB is the liquid surface height; HL is the distance
between two pressure taps; ρW and ρm are the density of water and indicating fluid receptively.
The schematic of manometer setups and the derivations of above equations are explained in
Appendix A.
In this work, two pairs of 1/8 inch pressure tabs were inserted 18 inches apart into the
each stage. One pair is in the annular region and the other tap through the draft tube. Gas holdups
of all three stages are measured.
2.3.2 Results and Discussion on Gas Holdup
The effects of both superficial gas velocity and liquid feed rate on local gas holdups were
studied. Since 2-Ethyl-hexanol (2-EH) is used in actual flotation experiments, gas holdup
measurements are carried out with and without frother. For each condition, gas holdups in riser
and downcomer are measured in all three stages. Experimental results are plotted in Figures 2.3.1-
2.3.4.
Experimental results show that, within the operating range, the gas holdups increase
linearly with the increase of superficial gas velocity. Linear increase of gas holdups with superficial
gas velocity is an indication of bubbly flow. The addition of frother greatly increases the gas
holdup. The system with frother is more sensitive to the superficial gas

8
Superficial Gas Velocity, cm/s
0 1 2 3 4 5
Gas
Hol
dup
0.00
0.02
0.04
0.06
0.08
0.10
0.12
0.14
0.16
0.18
0.20
Top Stage
Middle Stage
Bottom Stage
Bottom Stage
Top StageMiddle Stage
Water/Air System, VL=0 cm/s
DOWNCOMER
RISER
Figure 2.3.1 Local Gas Holdups in Different Stages (Water/Air, without liquid feeding)

9
Superficial Gas Velocity, cm/s
0 1 2 3 4 5
Gas
Hol
dup
0.00
0.02
0.04
0.06
0.08
0.10
0.12
0.14
0.16
0.18
0.20
Top StageMiddle Stage
Bottom Stage
Bottom Stager
Top StageMiddle Stage
Water/Air System, VL=0.85 cm/s
DOWNCOMER
RISER
Figure 2.3.2 Local Gas Holdups in Different Stages (Water/Air, with liquid feeding)

10
Superficial Gas Velocity, cm/s
0 1 2 3 4 5
Gas
Hol
dup
0.0
0.1
0.2
0.3
0.4
0.5
0.6
Top Stage
Middle Stage
Bottom Stage
Bottom Stager
Top Stage
Middle Stage
Water/2-EH/Air System, VL=0 cm/s
DOWNCOMER
RISER
Figure 2.3.3 Local Gas Holdups in Different Stages (Water/2-EH/Air, without liquid feeding)

11
Superficial Gas Velocity, cm/s
0 1 2 3 4 5
Gas
Hol
dup
0.0
0.1
0.2
0.3
0.4
0.5
0.6
Top Stage
Middle Stage
Bottom Stage
Bottom Stager
Top Stage
Middle Stage
Water/2-EH/Air System, VL=0.85 cm/s
DOWNCOMER
RISER
Figure 2.3.4 Local Gas Holdups in Different Stages (Water/2-EH/Air, with liquid feeding)

12
velocity. It is also evident that the riser gas holdup is always greater than the downcomer holdup
whereby the loop flow is induced.
In general, the gas holdups in all three stages are quite comparable, resulting in relatively
uniform axial holdup distribution compared to bubble columns and single stage Air-Loop-Reactors
(ALRs)(6). Nevertheless, the gas holdups differences between stages are still noticeable, especially
at higher gas flow rate and in the presence of frother. As in bubble columns and ALRs, the gas
holdup at the column top is usually greater than that at the bottom, near gas sparger. This is due
to the fact that gas bubbles undertake an isothermal expansion during their rising. However, gas
holdup also depends on the local coalesce/breakup conditions which may promote or hinder the
bubble growth. In pure water system, the coalesce is dominant. The big bubbles in the top stages
leave the dispersion very rapidly and result in reduced gas residence time, consequently reduced
gas holdup(7). Therefore, the gas holdup in the top stage is slightly smaller than that of bottom.
On the other hand, with the presence of the frother, bubble coalescence is not as significant in the
top stage due to reduced surface tension. At high gas velocity (> 3cm/s), the gas holdup is over
50% where individual rising of the bubbles is replaced by a sophisticated bubble collision and rising
behavior. The liquid circulation becomes poor because the gas holdup in the downcomer is too
high. Under this condition, bubbles are stable and stagnant. Consequently, the gas holdup is
higher in the top than in the other stages.
The riser-downcomer gas holdup difference is larger in the water/air system than in the
frother/air/water systems where the downcomer gas holdup is high because bubbles are small and
readily entrained downward by the liquid.
The effect of liquid feed rate was also examined. A downward superficial liquid velocity
was superimposed on the flow of the fluid. Experimental results indicate that the feed of liquid

13
from top help break the stagnant bubbles and improve liquid circulation. Also, the gas holdup and
other hydrodynamic behavior becomes visually similar in all three stages. This is expected to
benefit the flotation performance.
As described above, the gas holdup is an important parameter used to examine
hydrodynamic behavior of the column. Many factors, including mean bubble sizes, surface tension,
liquid velocity, etc, interact with each other. The interrelationships between these factors are
complicated(8). Therefore, further investigation on liquid circulation velocity and bubble sizes are
needed to establish a hydrodynamic model.
2.3.3 Liquid Circulation Velocity
The liquid circulation velocity is measured using tracer response technique. A dampened
sinusoidal type of response as depicted in Figure 1 is detected at some location down stream the
tracer injection point. The time difference td between adjacent peaks is taken as the mean
circulation time. The mean linear liquid velocity can be calculated using the following
equation(9,10):
ud
tLelectrode
d
= (2-3)
The superficial liquid velocity and mean linear liquid velocity can be mutually converted using the
following equation
uU
LL
r
=−1 ε
(2-4)

14
Figure 2.3.1 Typical Response to Pulse Input of Tracer in Loop Flow Reactor
In the multiple draft tube case, the distance traveled by circulating fluid in one loop path is
2(Hdr+HT+0.5HB). The superficial velocity in the riser and the downcomer can be calculated using
the following expressions (see Appendix B for detailed derivation):
UH H H
t ARrdr T B
dr
d=+ +
− +−
0 51
1.ε
ε(2-5)
and U U ARd r= (2-6)
In this study, conductivity probes are used as the detecting electrodes. The measurements
are performed with an analog conductivity meter (Cole-Parmer 19100) equipped with a flat-bed
recorder (Linseis L-120E). The tip of the probes are covered by fine screen caps to avoid small
bubbles entering the conductivity cell and causing interference. Saturated Potassium Chloride
(KCl) at room temperature is used as the tracer because of its high solubility and conductivity.
Two (2) conductivity probes are installed 18 inches apart in each stage.

15
2.4 Task 4: Separation Tests
To demonstrate the multifunction features of the multistage column, the separation tests in
Task 4 have focused on the investigation of wastewater treatment since April 1996. The goal of
this phase of the study is to examine the potential application of the column to the general areas of
fluid/particle separation and evaluate the effectiveness of the multistage column in these processes.
2.4.1 Objective and Scope
The objective of this phase of our study is to explore the potential application of the
multistage column for wastewater treatment. The experimental work focused on identifying the
effect of operating parameters on the column performance as a wastewater treatment device and
demonstrating its multifunctional features in the removal of contaminants (such as dispersed oil)
from wastewater.
2.4.2 Experimental
A simulated wastewater sample was prepared by adding a pre-determined amount of a light
mineral oil (LMO) with a density of 874 kg/m3 at 250C. The oil/water mixture was emulsified in a
50 gallon feed tank by pumping and recycling through a static mixer for about 60 minutes. Based
on our previous experience, the oil-water emulsion prepared in this manner was stable and no
coalescence of oil droplets was expected. The initial oil concentration in water was set to be about
500 mg/L. 2-Ethyl-1-hexanol (2-EH) was used as frother. The superficial gas velocity varied over
a range up to 4.0 cm/s and liquid feed rate was tested up to 5 liter/min.
The oily water was fed to the top of column and water level was adjusted to keep the
overflow rate to be less than 5% of the feed one. Gas bubbles were generated by a vertical
perforated metal sparger (mean pore size of 10 µm), which was located at the bottom of the

16
column. Gas bubbles passed through each contactor upward in contact with the down-flowing oily
wastewater simulant stream. The gas-lift action caused a circulation (or loop flow) of fluids
around each draft tube. The treated water left the bottom of the column via the clean water
discharge line, while the oil-laden foam overflowed into the foam discharge tank. Clean water
samples were collected and analyzed for oil content using an NDIR based OCMA-220 oil content
analyzer.
Operating conditions are summarized in Table 2.4.1
Table 2.4.1 Operating Conditions
Parameters Conditions
Superficial gas velocity (V), 10-2 m/s 0.5 - 4.0
Feed rate, liter/min 1-5
Reagent dosage (C), mg/L 0.0 - 20.0
Temperature, o C 25
2.4.3 Preliminary Oily Water Treatment Tests
Tests were performed in the multistage column to study the effects of various operating
conditions on the oily water clean-up performance. The oil removal efficiency, η, is the
performance criterion and defined as
η =−
×C C
Co f
o
100% (7)
where C0 and Cf are the initial and final oil concentrations, respectively.

17
2.4.3.1 Batch Operation
When oily water feed rate was zero, the clean up process was a batch operation. A
comparison of oil removal efficiency (ORE) between the multistage column and a conventional
open column was plotted in Figure 2.4.1. The superficial gas velocity was chosen to be 2.9 cm/s
and frother dosage was 15 ppm.
Test results showed that oil removal was much faster and more complete in the multistage
column than in the open column. Within 5 minutes flotation time, the oil removal efficiency
achieved 90% in the multistage column, contrasting to 80% oil removal at 25 minutes in a
conventional column. The results obtained in the batch tests provided information on choosing
feed rate for further investigation of continuos operation.
2.4.3.2 Continuous Operation
Continuos operations of the multistage column were conducted at feed rates ranging over
1-5 liter/min. Typical results were shown in Figure 2.4.2. In all cases, the oil content in the clean
water stream is less than 40 ppm (which is equivalent to 92% oil removal).
In both low and high feed rate cases, higher superficial gas velocity favored the oil removal.
This was primarily due to the facts that higher superficial gas velocity corresponded to higher gas
holdup. In the presence of frother, the gas bubbles were sizing uniformly and didn’t change much
with the increasing gas flow rates. Therefore, higher holdup implied higher interfacial area which
had significant positive influences on oil removal. The only exception was found at low feed rate
(1 liter/min) and high superficial gas velocity (>3 cm/s) which led to a decrease in oil removal.
Experimental observation indicated the liquid circulation in the first stage was poor in the low feed
rate case at high superficial gas velocities because the both the central region and the annular

18
Flotation Time, min
0 5 10 15 20 25 30
Oil
Rem
oval
Effi
cien
cy, %
0
10
20
30
40
50
60
70
80
90
100
MSTLFLO
Open Column
SGV=2.9 cm/s
C0=500 ppm
CF=15 ppm
Figure 2.4.1 Comparison of Oil Removal Efficiency between MSTLFLO and Open Column in Batch Operation

19
Superficial Gas Velocity, cm/s
0 1 2 3 4 5
Oil
cont
ent,
ppm
20
40
60
80
100
Feed rate = 1l/min
Feed rate = 4 l/min
C0=500 ppm
CF=15 ppm
Figure 2.4.2 Oil Content vs. Superficial Gas velocity in Continuous Operations

20
Superficial Gas Velocity, cm/s
0 1 2 3 4 5
Oil
cont
ent,
ppm
20
40
60
80
100
Top stageMiddle stage
Bottom stage
Feed rate = 1l/minC0=500 ppm
Figure 2.4.3 Oil Content in Difference Stages

21
Oil
Rem
oval
Effi
cien
cy, %
0
10
20
30
40
50
60
70
80
90
100
Takahashi (1979)
Gebhardt (1994)
Gu, et al (1996)
Conventional Conventional MSTLFLO
Column Column
Figure 2.4.4 Comparison with Data from Literature

22
region were occupied almost entirely by gas so that the driving force for liquid circulation was
greatly diminished. Similar phenomena were observed when investigating the oil contends of
samples withdrawn from different stages at low feed rates (see Figure 2.4.3).
It was seen in Figure 2.4.2 that at feed rate of 4 liter/min, the oil removal efficiency was as
high as 92%. Considering the total volume of the column and its gas holdup, the average
residence time of the feed liquid at 4 liter/min was only 3-5 min at high superficial gas velocities.
This shows that the oil clean up performance in the continuous operation is comparable to that of
the batch operation.
A comparison of oil removal efficiencies with other reported data in open literature is
shown in Figure 2.4.4(11). It was found that the separation efficiency of the multistage column is
superior to the conventional columns not only for the dispersed air flotation operation[12] but also
for the dissolved air flotation[13].
The excellent performance of the multistage flotation column in emulsified oil clean up
again verified the original multistage separation design concept. More importantly, it reveals the
broad potential applications of this novel column in the general areas of fluid/particle separations.
2.5 Task 5: Conventional Column Tests
Only batch tests of oil cleaning were carried out in the conventional column and the results
were reported in section 2.4.3.1.
2.6 Task 6: Data Analysis
Experimental results were analyzed and discussed qualitatively in section 2.4.
Mathematical treatments will be presented upon the completion of the hydrodynamic tests.

23
3.0 CONCLUSION AND WORK FORECAST
In the past year, efforts were mainly devoted to investigate the performance of the non-
agitated multistage column for wastewater treatment. The research accomplishments lead to the
following conclusions:
(1) A non-agitated multistage column has been constructed based on the modification of the
previous agitated column.
(2) Gas holdups have been investigated under different operating conditions. Two phase
bubbly flow is the dominant flow regime in the multistage column. Gas holdup are greatly
improved by the addition of frother. Gas holdup differences between riser and downcomer
is larger in pure water system than in the frother/water system. Moreover, the liquid feed
from column top helps break up the big stagnant bubbles and improves the liquid
circulation in the top stage.
(3) Liquid circulation velocity measurement has just been started. Conductivity tracer
response method was applied in the study.
(4) Preliminary oil/water separation tests were performed. Results show that, in the batch
tests, the oil removal efficiency was 95% at 5 minutes flotation time; in the continuous
tests, oil removal efficiency was over 95% at low gas velocities and 90% at high gas
velocities (>3cm/s).
Based on the DOE grant Amendment No. M003, the research project will be extended to
June, 1998. The research work in the next year will include the following:
(1) Examine the liquid circulation velocities at different levels of surfactant dosages.

24
(2) Measure the gas bubble sizes and distribution using photographic/image analysis
methods.
(3) Establish correlation for oil cleaning kinetic constant with hydrodynamic parameters.
(4) Build a mathematical model to simulated the 3-stage oil cleaning process.
(5) Propose criteria for multistage column scale-up.
(6) Summarize the entire research project and provide final report.

25
4.0 REFERENCES
1. “A Study of Multistage/Multifunction Column for Fine Particle Separation”, QuarterlyTechnical Progress Report, (July 8 - September 30, 1994), Chemical & PetroleumEngineering Department, University of Pittsburgh, Submitted to U.S. Department of Energy,PETC, January 20, 1995.
2.“A Study of Multistage/Multifunction Column for Fine Particle Separation”, Quarterly
Technical Progress Report, (July 1 - September 30, 1997), Chemical & PetroleumEngineering Department, University of Pittsburgh, Submitted to U.S. Department of Energy,FETC, October 20, 1996.
3. Guelcher, S. A., “A Hydrodynamic Study of A Novel Multi-stage Loop-Flow FlotationColumn” (unpublished M. S. Thesis, Dept. Of Chemical and Petroleum Engineering, School ofEngineering, University of Pittsburgh, April, 1996) pp. 89-91.
4.“A Study of Multistage/Multifunction Column for Fine Particle Separation”, AnnualTechnical Progress Report, (July 1, 1995 - June 30, 1996), Chemical & PetroleumEngineering Department, University of Pittsburgh, Submitted to U.S. Department of Energy,FETC, July 26, 1996.
5. Gu, X., “An Investigation of A Novel Multi-stage Loop-Flow Separation Column”(unpublished M. S. Thesis, Dept. Of Chemical and Petroleum Engineering, School ofEngineering, University of Pittsburgh, November 1995) pp. 87-92
6. Merchuk, J.C. and Yehuda, S., “Local Hold-Up and Liquid Velocity in Air-Lift Reactors,”AIChE Journal, Vol. 27, No. 3, May, 1981, pp. 377-388.
7. Orazem, M. E. And Erickson, L.E., “Oxygen-transfer Rates and Efficiencies in One and Two-stae Airlift Towers,” Biotechnology and Bioengineering, Vol. XXI, pp. 69-88, 1979.
8. Siegel, M. H., Merchuk, J.C., and Schugerl, K., “Air-Lift Reactor Analysis: InterrelationshipsBetween Riser, Downcomer, and Gas-Liquid Separator Behavior, Including Gas RecirculationEffects,” AIChE Journal, Vol. 32, No. 10, October 1986, pp. 1585-1596.
9. Chisti, M. Y., Halard, B., and Moo-Young, M., “Liquid circulation in airlift reactors,”Chemical Engineering Science, Vol. 43, No. 3, (1988), pp. 451-457.
10. Lu, W. J., et al, “Liquid velocity and gas holdup in threee-phase internal loop airlift reactorswith low-density particles,” Chemical Engineering Science, Vol. 50, No. 8, (1995), pp. 1301-1310.

26
11. Gu. X. and Chiang, S. H., “Removal of Emulsified Oil Particles Using MSTLFLOProcess,” Presented at AIChE Annual Meeting, Chicago, November 1996.
12. Takahashi, T., Miyahara, T., and Nishizaki, Y., “Separation of Oily Water by BubbleColumn” Journal of Chemical Engineering of Japan, Vol. 12, No. 5, 1979, pp. 394-399.
13. Gebhardt, J. E., Mankosa, M. J., and Ilubred, G.L, “removal of Oil from Produced Waterby Microcel Column Flotation”, Internal Report, Control International, Inc., Salt Lake City,Utah, 1994.

27
APPENDIX A
DERIVATION OF EQUATIONS FOR GAS HOLDUP CALCULATION
A-1 Overall Gas Holdup
The manometer setup of overall gas holdup measurement is shown in Figure A-1. The
overall gas holdup is obtained by solving the following force balance equations.
Fluid statics gives
P P H gm M1 0== ++ ρρ (A-1)
P P H g H gD D W W2 0== ++ −−ρρ ρρ (A-2)
where P0 is the atmospheric pressure.
Since the air pocket is sealed in the connecting tubing, we have
P P1 2== (A-3)
Therefore,
ρρ ρρ ρρm m D B W WH g H g H g== −− (A-4)
ρρ ρρ ρρm m D B W WH H H== −− (A-5)
Based on the definition of gas holdup, the density of the dispersion can be expressed as
ρ ρ εD W Overall= −( )1 (A-6)
The substitution of equation (A-6) into equation (A-3) leads to

28
ρ ρ ε ρm m W Overall B W WH H H= − −( )1 (A-7)
The rearrangement of the above equation yields
ε
ρρ
Overall
Bm
Wm W
B
H H H
H=
− −(A-8)
which is the desired equation.

29
Air
Atmosphere
2
Dispersion
HB Hm
1
HW
Figure A-1 The manometer Setup for Overall Gas Holdup Measurement

30
A-2 Local Mean Gas Holdup
The local mean gas holdup is measured by an inverted manometer arrangement which is
depicted in Figure A-2. If P1 and P2 are the pressures of the two locations along the column
respectively, the fluid statics gives
P P H gA M l1 == ++ ρρ (A-8)
P P H gA M r2 == ++ ρρ (A-9)
where PA is the pressure of the air sealed in the manometer; Hl and Hr are the liquid levels in the
left leg and right leg of the manometer, respectively.
∆∆P P P H g H H gD L m r l== −− == == −−2 1 ρρ ρρ ( ) (A-10)
From Figure A-2
H H H Hr l L m−− == −− (A-11)
The substitution of equation A-11 in equation A-10 gives
ρρ ρρD L m L mH H H== −−( ) (A-12)
Again, substitute equation (A-5) in (A-12),
ερ ρ
ρlocalm L m m
W L
H HH
= −−
1 (A-13)
In this case, the indicator in the manometer is just the liquid in the column, so

31
ρρ ρρm W== (A-14)
Therefore, equation (A-13) becomes the desired form
ε localm
L
HH
= (A-15)
The validity of equations (a-7) and (a-15) is based on the assumption that the dynamic component
of the measured pressure and the frictional losses are negligible.

32
Air
Air
Hm
Hl
1
Hr
Dispersion HL
2
Figure A-2 The manometer Setup for Local Mean Gas Holdup Measurement
33
APPENDIX B
DERIVATION OF EQUATIONS FOR LIQUIDCIRCULATION VELOCITY CALCULATION
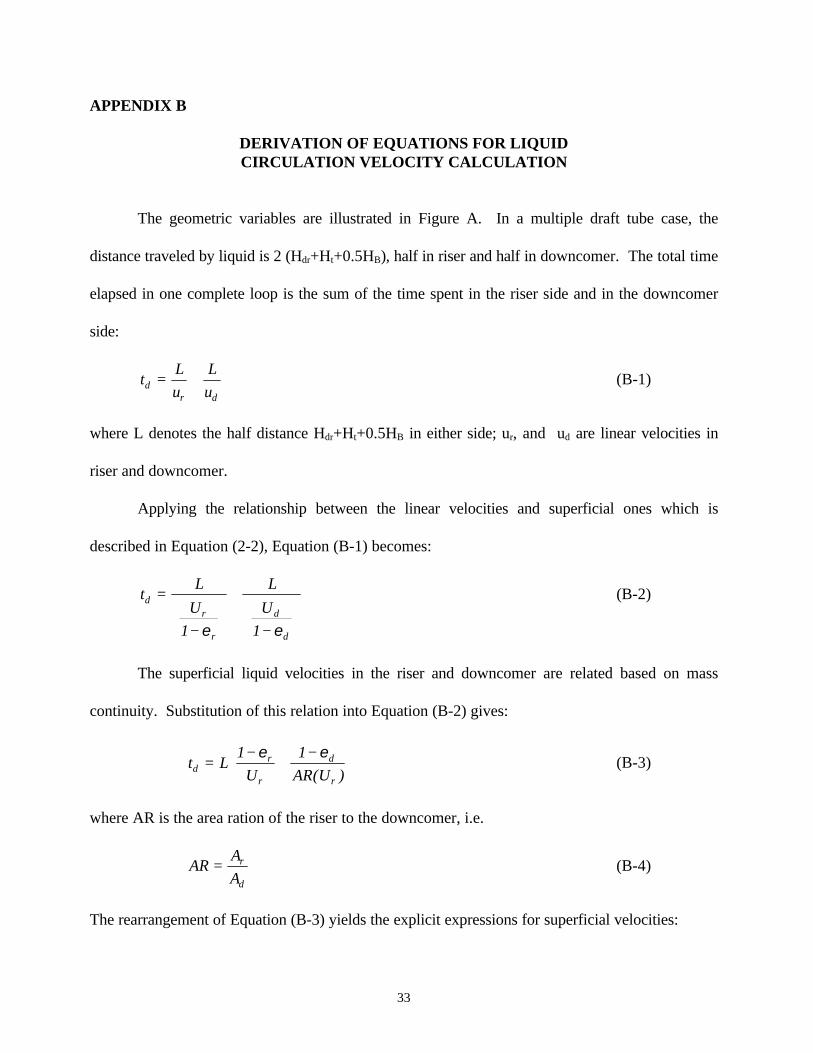
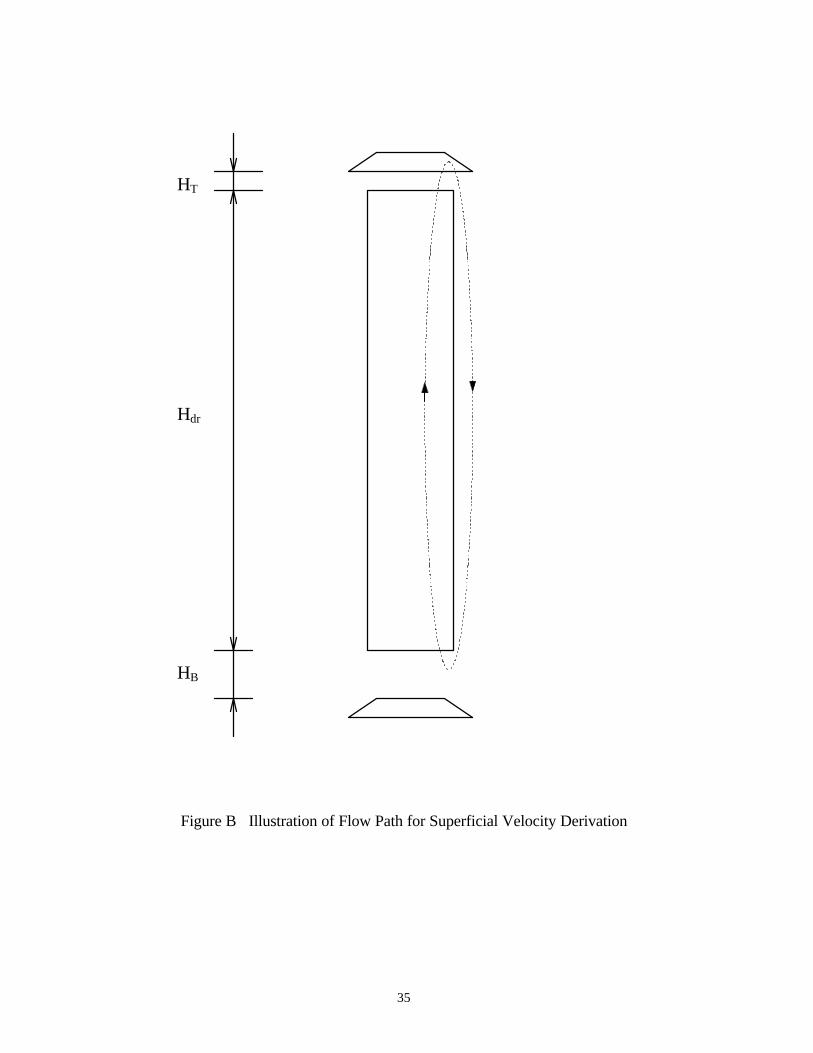
The geometric variables are illustrated in Figure A. In a multiple draft tube case, the
distance traveled by liquid is 2 (Hdr+Ht+0.5HB), half in riser and half in downcomer. The total time
elapsed in one complete loop is the sum of the time spent in the riser side and in the downcomer
side:
tLu
Lud
r d
= + (B-1)
where L denotes the half distance Hdr+Ht+0.5HB in either side; ur, and ud are linear velocities in
riser and downcomer.
Applying the relationship between the linear velocities and superficial ones which is
described in Equation (2-2), Equation (B-1) becomes:
tL
U
L
Ud
r
r
d
d
=
−
+
−
1 1ε ε
(B-2)
The superficial liquid velocities in the riser and downcomer are related based on mass
continuity. Substitution of this relation into Equation (B-2) gives:
t LU AR Ud
r
r
d
r
=−
+−
1 1ε ε( )
(B-3)
where AR is the area ration of the riser to the downcomer, i.e.
ARAA
r
d
= (B-4)
The rearrangement of Equation (B-3) yields the explicit expressions for superficial velocities:

34
ULt ARrd
rd= − +
−
11ε ε
(B-5)
and
U U ARd r= (B-6)
35
Figure B Illustration of Flow Path for Superficial Velocity Derivation
Hdr
HB
HT