a strong-motion database from the peru–chile subduction zone
DESCRIPTION
paperTRANSCRIPT

J Seismol (2011) 15:19–41DOI 10.1007/s10950-010-9203-x
ORIGINAL ARTICLE
A strong-motion database from the Peru–Chilesubduction zone
Maria C. Arango · Fleur O. Strasser ·Julian J. Bommer · Ruben Boroschek ·Diana Comte · Hernando Tavera
Received: 6 March 2010 / Accepted: 29 July 2010 / Published online: 21 August 2010© Springer Science+Business Media B.V. 2010
Abstract Earthquake hazard along the Peru–Chile subduction zone is amongst the highest inthe world. The development of a databaseof subduction-zone strong-motion recordings is,therefore, of great importance for ground-motionprediction in this region. Accelerograms recordedby the different networks operators in Peru andChile have been compiled and processed in a uni-form manner, and information on the source pa-rameters of the causative earthquakes, fault-plane
M. C. Arango · J. J. Bommer (B)Department of Civil and Environmental Engineering,Imperial College London, London SW7 2AZ, UKe-mail: [email protected]
F. O. StrasserSeismology Unit, Council for Geoscience,Private Bag X112, Pretoria 0001, South Africa
R. BoroschekDepartment of Civil Engineering,University of Chile, Blanco Encalada 2002,Santiago, Chile
D. ComteDepartment of Geophysics, University of Chile,Blanco Encalada 2002, Santiago, Chile
H. TaveraSeismology Department,Geophysical Institute of Peru, Calle Badajoz 169,Urb Mayorazgo IV Etapa, Ate, Lima, Peru
geometries and local site conditions at the record-ing stations has been collected and reviewed toobtain high-quality metadata. The compiled data-base consists of 98 triaxial ground-motion record-ings from 15 subduction-type events with momentmagnitudes ranging from 6.3 to 8.4, recorded at59 different sites in Peru and Chile, between 1966and 2007. While the database presented in thisstudy is not sufficient for the derivation of anew predictive equation for ground motions fromsubduction events in the Peru–Chile region, it sig-nificantly expands the global database of strong-motion data and associated metadata that canbe used in the derivation of predictive equationsfor subduction environments. Additionally, thecompiled database will allow the assessment ofexisting predictive models for subduction-typeevents in terms of their suitability for the Peru–Chile region, which directly influences seismichazard assessment in this region.
Keywords Peru–Chile subduction zone ·Strong-motion database · Ground-motionprocessing · Site classes · Source and pathparameters
1 Introduction
The development of a strong-motion databasefrom subduction events along the Peru–Chile
20 J Seismol (2011) 15:19–41
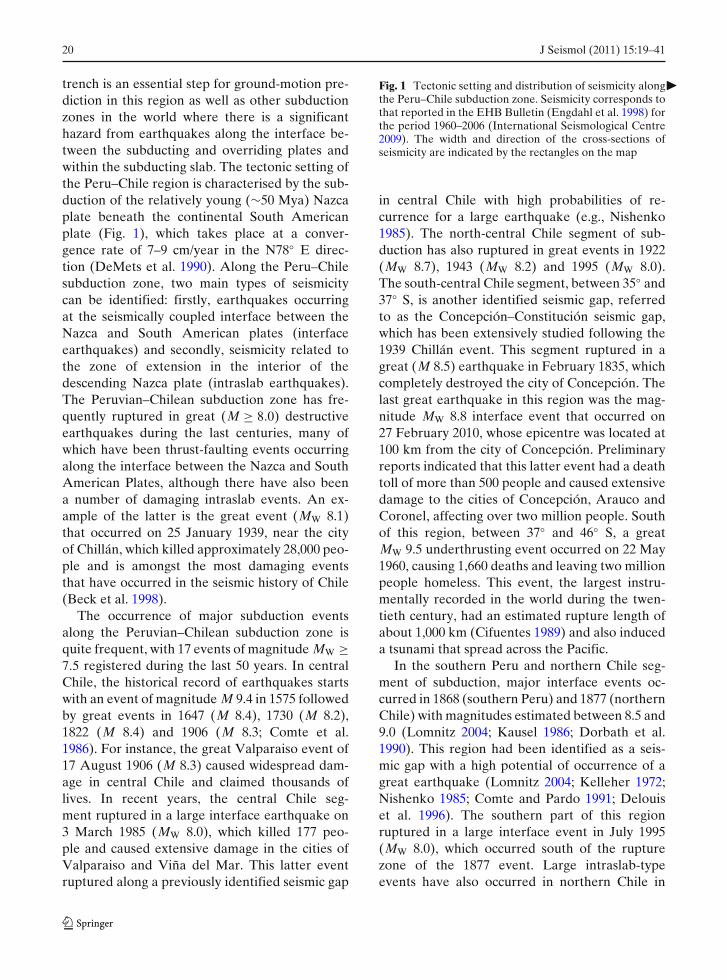
trench is an essential step for ground-motion pre-diction in this region as well as other subductionzones in the world where there is a significanthazard from earthquakes along the interface be-tween the subducting and overriding plates andwithin the subducting slab. The tectonic setting ofthe Peru–Chile region is characterised by the sub-duction of the relatively young (∼50 Mya) Nazcaplate beneath the continental South Americanplate (Fig. 1), which takes place at a conver-gence rate of 7–9 cm/year in the N78◦ E direc-tion (DeMets et al. 1990). Along the Peru–Chilesubduction zone, two main types of seismicitycan be identified: firstly, earthquakes occurringat the seismically coupled interface between theNazca and South American plates (interfaceearthquakes) and secondly, seismicity related tothe zone of extension in the interior of thedescending Nazca plate (intraslab earthquakes).The Peruvian–Chilean subduction zone has fre-quently ruptured in great (M ≥ 8.0) destructiveearthquakes during the last centuries, many ofwhich have been thrust-faulting events occurringalong the interface between the Nazca and SouthAmerican Plates, although there have also beena number of damaging intraslab events. An ex-ample of the latter is the great event (MW 8.1)that occurred on 25 January 1939, near the cityof Chillán, which killed approximately 28,000 peo-ple and is amongst the most damaging eventsthat have occurred in the seismic history of Chile(Beck et al. 1998).
The occurrence of major subduction eventsalong the Peruvian–Chilean subduction zone isquite frequent, with 17 events of magnitude MW ≥7.5 registered during the last 50 years. In centralChile, the historical record of earthquakes startswith an event of magnitude M 9.4 in 1575 followedby great events in 1647 (M 8.4), 1730 (M 8.2),1822 (M 8.4) and 1906 (M 8.3; Comte et al.1986). For instance, the great Valparaiso event of17 August 1906 (M 8.3) caused widespread dam-age in central Chile and claimed thousands oflives. In recent years, the central Chile seg-ment ruptured in a large interface earthquake on3 March 1985 (MW 8.0), which killed 177 peo-ple and caused extensive damage in the cities ofValparaiso and Viña del Mar. This latter eventruptured along a previously identified seismic gap
�Fig. 1 Tectonic setting and distribution of seismicity alongthe Peru–Chile subduction zone. Seismicity corresponds tothat reported in the EHB Bulletin (Engdahl et al. 1998) forthe period 1960–2006 (International Seismological Centre2009). The width and direction of the cross-sections ofseismicity are indicated by the rectangles on the map
in central Chile with high probabilities of re-currence for a large earthquake (e.g., Nishenko1985). The north-central Chile segment of sub-duction has also ruptured in great events in 1922(MW 8.7), 1943 (MW 8.2) and 1995 (MW 8.0).The south-central Chile segment, between 35◦ and37◦ S, is another identified seismic gap, referredto as the Concepción–Constitución seismic gap,which has been extensively studied following the1939 Chillán event. This segment ruptured in agreat (M 8.5) earthquake in February 1835, whichcompletely destroyed the city of Concepción. Thelast great earthquake in this region was the mag-nitude MW 8.8 interface event that occurred on27 February 2010, whose epicentre was located at100 km from the city of Concepción. Preliminaryreports indicated that this latter event had a deathtoll of more than 500 people and caused extensivedamage to the cities of Concepción, Arauco andCoronel, affecting over two million people. Southof this region, between 37◦ and 46◦ S, a greatMW 9.5 underthrusting event occurred on 22 May1960, causing 1,660 deaths and leaving two millionpeople homeless. This event, the largest instru-mentally recorded in the world during the twen-tieth century, had an estimated rupture length ofabout 1,000 km (Cifuentes 1989) and also induceda tsunami that spread across the Pacific.
In the southern Peru and northern Chile seg-ment of subduction, major interface events oc-curred in 1868 (southern Peru) and 1877 (northernChile) with magnitudes estimated between 8.5 and9.0 (Lomnitz 2004; Kausel 1986; Dorbath et al.1990). This region had been identified as a seis-mic gap with a high potential of occurrence of agreat earthquake (Lomnitz 2004; Kelleher 1972;Nishenko 1985; Comte and Pardo 1991; Delouiset al. 1996). The southern part of this regionruptured in a large interface event in July 1995(MW 8.0), which occurred south of the rupturezone of the 1877 event. Large intraslab-typeevents have also occurred in northern Chile in

J Seismol (2011) 15:19–41 21
Section 1-1’
-80o -76o -72o -68o -64o -60o
-35o
-30o
-25o
-20o
-15o
-10o
Lon E
Lat N
Seismicity 1960 - 2006 (EHB Catalogue)
Depth of events0-75 km 450-525 km75-150 km 525-600 km150-225 km 600-675 km225-300 km 675-750 km300-375 km >750 km375-450 km
1
Section 2-2’
Section 3-3’
0 200 400 600 800 1000
0
100
200
300
Distance from the trench [km]
Hyp
ocen
tral
Dep
th [k
m]
0 200 400 600 800 1000
0
100
200
300
Distance from the trench [km]
Hyp
ocen
tral
Dep
th [k
m]
0 200 400 600 800 1000
0
100
200
300
Distance from the trench [km]
Hyp
ocen
tral
Dep
th [k
m]
0 200 400 600 800 1000
0
100
200
300
Distance from the trench [km]
Hyp
ocen
tral
Dep
th [k
m]
0 200 400 600 800 1000
0
100
200
300
Distance from the trench [km]
Hyp
ocen
tral
Dep
th [k
m]
0 200 400 600 800 1000
0
100
200
300
Distance from the trench [km]
Hyp
ocen
tral
Dep
th [k
m]
Section 5-5’
Section 4-4’
Section 6-6’
1’
2
2’
3’
1
3
4’4
5’5
6’6
NAZCA PLATE
PACIFICOCEAN
78 mm/year
Peru
SOUTH AMERICANPLATE
80 mm/year
Chile
Peru-Chile Trench
Events used in this study
Relative plate motions

22 J Seismol (2011) 15:19–41
December 1950 (MW 8.0) and 13 June 2005 (MW
7.8). The northern part of this seismic gap rup-tured in a great interface event on 23 June 2001(MW 8.4), along the rupture area associated withgreat 1868 southern Peru event. The 2001 eventhad a death toll of 80 causalities and caused se-vere damage in the cities of Ocoña, Arequipa,Tacna and Moquegua. Along the central region ofPeru, the subduction processes have caused greatearthquakes in 1746 (M 8.5), 1940 (MW 8.1), 1942(MW 8.0), 1966 (MW 8.1), 1970 (MW 7.8), 1974(MW 8.1), 1996 (MW 7.7) and 2007 (MW 8.0), caus-ing thousands of deaths. The Central Peru seg-ment of the subduction zone, between the ruptureareas of the 1974 (MW 8.1) Lima event and the1996 (MW 7.7) Nazca event (Tavera and Bernal2005), had also been identified as another seismicgap. This gap last ruptured in a MW 8.0 event on17 August 2007 in the Pisco region of CentralPeru, causing 595 deaths and extensive damage inthe cities of Pisco, Chincha and Cañete (Taveraet al. 2008).
In view of the threat that both interface andintraslab-type events pose to the Peru–Chile re-gion, the compilation of a strong-motion databaseof subduction events that can be used as the basisof future ground-motion prediction studies is ofprime relevance. In Chile, the first strong-motioninstruments were deployed in the 1970s by theCivil Engineering Department of the Universityof Chile (RENADIC network), which recordedthe 3 March 1985 (MW 8.0) Valparaiso earthquakeand associated aftershocks amongst other events.Presently, the RENADIC network consists of20 analogue and 15 digital stations installed inNorthern and Central Chile. A second network(DGF-DIC) was deployed by the Departmentsof Geophysics and Civil Engineering of theUniversity of Chile and the Swiss SeismologicalService as a part of a project to study the north-ern Chile seismic gap and has been in operationsince 2001. The DGF-DIC network consists of11 digital instruments installed in Northern Chile,from Arica to Antofagasta. These two networkshave recorded several large events, amongstothers those on 13 June 2005 (MW 7.8) and 23June 2001 (MW 8.4). The Geophysical Institute ofPeru (IGP) deployed the first strong-motion in-struments in Lima, which recorded the 1966, 1970,
1971 and 1974 Peruvian events. Currently, strong-motion networks in Peru are operated by IGP, theJapan–Peru Centre for Seismic Research and Dis-aster Mitigation (CISMID), the South AmericanRegional Seismological Centre CERESIS, theCatholic University of Peru (PUCP), and thePeruvian state water company (SEDAPAL).Recent significant events recorded by these net-works include the 23 June 2001 (MW 8.4) and 15August 2007 (MW 8.0) Pisco event.
This paper presents the work performed inorder to develop a database of strong-motionrecords from events along the Peru–Chile subduc-tion zone and associated information (metadata).The strong-motion data recorded by the differentnetworks operators in Peru and Chile have beencompiled and processed in a uniform manner,and information on the source parameters ofthe causative earthquakes, fault-plane geometriesand local site conditions at the recording stationshas been collected and reviewed. Earthquake pa-rameters from different reporting agencies andpublished studies were examined to define re-liable source parameters, fault-plane geometriesand distance metrics. Additionally, geological andgeotechnical information at the recording siteswere collected from different sources, and siteswere classified according to various schemes.
2 Database description
The compiled database consists of 98 triaxialground-motion recordings from 15 subduction-type events with moment magnitudes rangingfrom 6.3 to 8.4, recorded at 55 different sites inPeru and Chile, between 1966 and 2007. Theseaccelerograms have been made available by localnetworks in Chile and Peru including the NationalAccelerographic Network of Chile (RENADIC,23 records), the DGF-DIC network jointly oper-ated by the Departments of Geophysics and CivilEngineering of the University of Chile (sevenrecords), the IGP (eight records) and the CISMID(12 records). Additionally, strong-motion recordsfrom the 1985 Valparaiso (Chile) sequence andfrom the 1966, 1970, 1971 and 1974 Peruvianevents available at the COSMOS Virtual DataCentre (http://db.cosmos-eq.org) were also in-

J Seismol (2011) 15:19–41 23
-84o -80o -76o -72o -68o
-36o
-32o
-28o
-24o
-20o
-16o
-12o
-8o
Lon E
LatN
INTERFACEINTRASLAB
PERU
CHILE
13-06-2005 [MW 7.8]
23-06-2001 [MW 8.4]
31-05-1970 [MW 8.0]
17-10-1966 [MW 8.1]
03-03-1985-A [MS 6.4]
15-10-1997 [MW 7.1]
03-03-1985 [MW 8.0]
09-04-1985 [MW 7.1]
04-03-1985 [MW 6.3]
25-03-1985 [MW 6.4]
05-01-1974 [MS 6.6]03-10-1974 [MW 8.1]
09-11-1974 [MW 7.1]
15-08-2007 [MW 8.0]
07-11-1981 [MW 6.9]
-78o -76o -74o -72o -70o
-18o
-16o
-14o
-12o
-10o
SEDAPALIGPCISMIDCERESISPUCP
ANC
NNA
MAY
CDL-CIPCAL
PUCPRINCER
ANR
MOL
CSM
ANC
PCNICA2
TAC1TAC2
MOQ1MOQ2
MOQ3
AQPAQP-2
ZAR
LMO
GEO
a
-70o -68o
-22o
-20o
-18o
RENADIC
DGF-DIC
MEJI
CALA
LOA
TCP
PICA
IQU
PIS
CUY
PUTRE
ACOPOCO-1
IQUIIQC
ACA
ARIEPOCO-2
b
-74o -72o -70o
-36o
-34o
-32o
RENADIC ILLA
VIL
SFDO
LIGPAP
ZAP
LLAY
LLO
SANT
MEL
CHI
CAU
TALCCON
ILO
HUA
COL
PICH
RAP
QUIN
SFELISIVMAR
VENVALM UTFSM
END
c
a
b
c
Fig. 2 Location of the strong-motion stations used in thisstudy. The panels show the stations located in a Central andSouthern Peru; b Northern Chile and c Central Chile. The
locations and focal mechanisms of the events contributingdata to this study are also shown
24 J Seismol (2011) 15:19–41
cluded in this database (48 records). The locationof the strong-motion stations operating along thePeru–Chile subduction zone, from which record-ings are presented in this study, is shown in Fig. 2.The majority of the data from these agencies havebeen released in unprocessed format; however, ina few cases, strong-motion records to which somelevel of processing has already been applied werealso included. All strong-motion data included inthis database are from either free-field stations orinstruments at the base of structures, at a totalof 59 sites. In the context of this study, free-fieldrecordings are defined as those obtained at sta-tions in small shelters, isolated from any buildinginfluence. The other recordings are obtained frominstruments at the basement of structures up to
three storeys in height, although five recordingsobtained at stations located at the basement ofstructures with more than three storeys were in-cluded in this database.
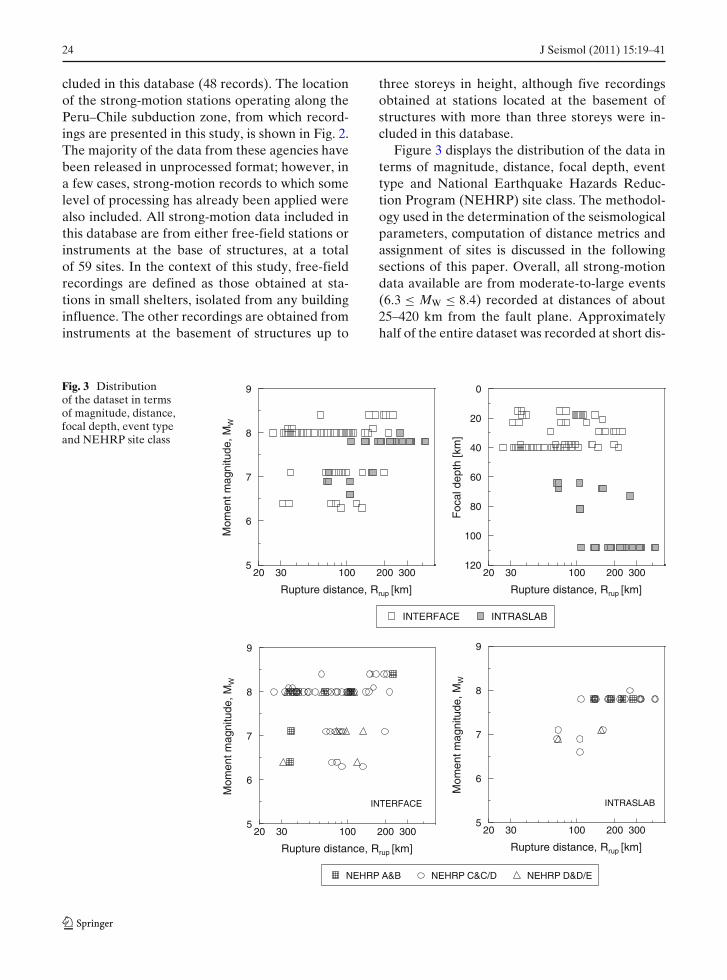
Figure 3 displays the distribution of the data interms of magnitude, distance, focal depth, eventtype and National Earthquake Hazards Reduc-tion Program (NEHRP) site class. The methodol-ogy used in the determination of the seismologicalparameters, computation of distance metrics andassignment of sites is discussed in the followingsections of this paper. Overall, all strong-motiondata available are from moderate-to-large events(6.3 ≤ MW ≤ 8.4) recorded at distances of about25–420 km from the fault plane. Approximatelyhalf of the entire dataset was recorded at short dis-
Fig. 3 Distributionof the dataset in termsof magnitude, distance,focal depth, event typeand NEHRP site class
20 30 100 200 3005
6
7
8
9
Rupture distance, Rrup [km]
Mom
entm
agni
tude
,MW
INTERFACE INTRASLAB
20 30 100 200 300
0
20
40
60
80
100
120
Rupture distance, Rrup [km]
Foc
alde
pth
[km
]
20 30 100 200 3005
6
7
8
9
Rupture distance, Rrup [km]
Mom
ent m
agni
tude
,MW
NEHRP A&B NEHRP C&C/D NEHRP D&D/E
20 30 100 200 3005
6
7
8
9
Rupture distance, Rrup [km]
Mom
entm
agni
tude
,MW
INTERFACE INTRASLAB

J Seismol (2011) 15:19–41 25
tances (Rrup ≤ 100 km), and consequently, a sig-nificant number of the ground motions are of largeamplitudes; the level of peak ground acceleration(PGA) recorded during these events varies withina range of approximately 20–700 cm/s2. Similarly,most of the data included in the dataset comefrom events with magnitudes MW 8 ± 0.3 andMW 7 ± 0.2. The distribution of focal depth withrespect to rupture distance for recordings fromboth interface and intraslab-type events is shownin the upper right panel of Fig. 3. The majorityof the data from interface events was recorded atdistances ranging from about 30 to 200 km, whilethe intraslab dataset includes ground motionsrecorded at distances Rrup greater than 100 km.The lower panels of Fig. 3 show the distributionof the data for interface and intraslab events byNEHRP site class. As seen from this figure, mostof the strong-motion records available are fromsites classified as NEHRP class C, C/D and D.Only one record from a NEHRP class D/E siteis available and no data was recorded at very softsites (NEHRP class E).
A greater emphasis has been placed on compi-ling and reviewing the available metadata, whichentailed an evaluation of the earthquake-relatedparameters (i.e., magnitude, location and faultmechanism), classification of subduction eventsby type (i.e., interface or intraslab), computationof source-to-site distance metrics and characteri-sation of site conditions at recording stations usingdifferent parameters (i.e., surface geology de-scriptors, shear-wave velocity profiles, natural siteperiod and normalised response spectral shapes).Site classes were assigned to the stations in Peruand Chile following various classification schemesused in ground-motion prediction equations forsubduction-zone environments, such as theNEHRP classification used by Atkinson andBoore (2003, 2008), the New Zealand (NZ) siteclassification scheme used by McVerry et al.(2006) and the Japanese (JP) scheme used byZhao et al. (2006b).
2.1 Earthquake-related parameters
The earthquake-related information was collectedfrom various reporting agencies and publicationsand ranked by preferred importance order. The
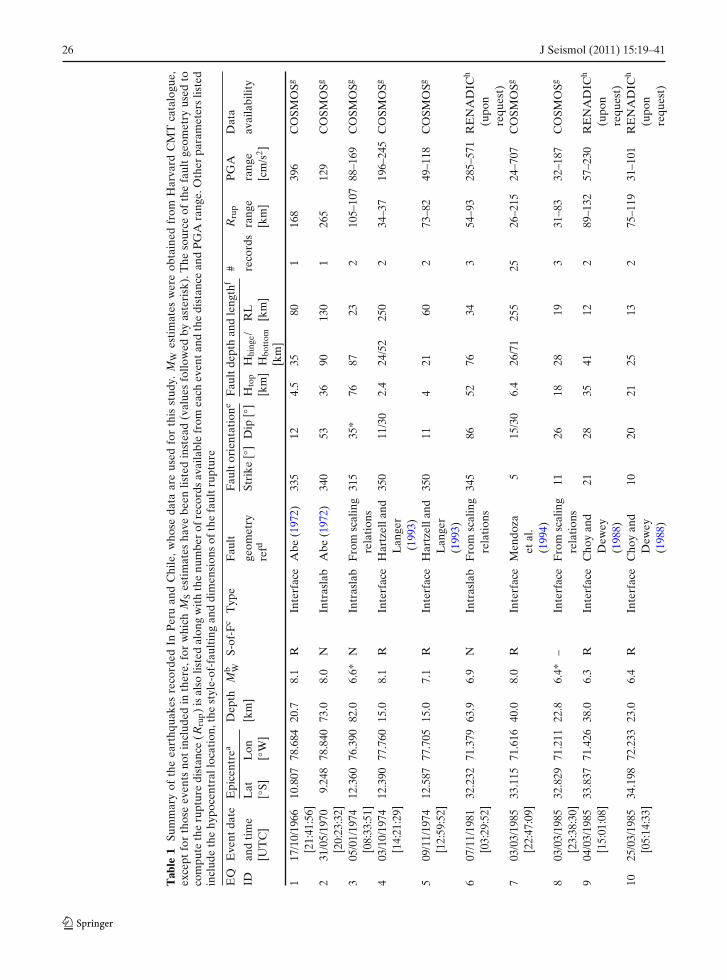
epicentral locations and depths of the events usedin this study were selected as follows: specialstudies of mainshock and aftershock sequenceswith accurate relocations, determinations pub-lished in the Centennial catalogue (Engdahl andVillaseñor 2002) and locations and depths deter-mined by the International Seismological Centre(ISC). For the more recent events not included inthe ISC catalogue, the location estimated by theNational Earthquake Information Center (NEIC)was adopted. Regional determinations reportedby local agencies (e.g., Department of Geophysics,University of Chile; IGP) were also used in thisstudy when appropriate. The moment magnitude(MW) estimates and focal mechanism solutionsfor the earthquakes whose data are used in thisstudy were obtained from the Harvard CentroidMoment Tensor database (CMT) when available,which was generally the case for the large earth-quakes included herein with magnitude greaterthan 5.0 which occurred after 1976. For all pre-1976 events, moment magnitudes and focal mech-anism solutions were collected from individualstudies (e.g., Hartzell and Langer 1993; Pachecoand Sykes 2002; Abe 1972). Other instrumen-tal measures of magnitude were collected fromthe online-catalogues of the different reportingagencies (i.e., ISC and NEIC) and were also in-cluded in the metadata. Surface-wave magnitude(MS) and body-wave magnitude (mb) estimates ofthe Peruvian–Chilean earthquakes determined bythe ISC were collected; however, in cases whereISC magnitude determinations were not available,those estimated by NEIC were used instead. Noestimates of moment magnitude (MW) were avail-able for the 5 January 1974 (MS 6.6) event andthe 3 March 1985 (MS 6.4) aftershock. It was,therefore, assumed that MS estimates for theseevents were equivalent to moment magnitude es-timates (MW). This approximation was validatedby plotting moment magnitude values against thedifferent magnitude scales for the events withMW, MS and mb data reported. The characteristicsof the events contributing data to the presentstudy are listed in Table 1; their locations and focalmechanisms are shown in Fig. 2.
Additionally, the earthquake events were clas-sified in terms of the physical processes with whichthey were associated (i.e., interface or intraslab
26 J Seismol (2011) 15:19–41
Tab
le1
Sum
mar
yof
the
eart
hqua
kes
reco
rded
InP
eru
and
Chi
le,w
hose
data
are
used
for
this
stud
y.M
Wes
tim
ates
wer
eob
tain
edfr
omH
arva
rdC
MT
cata
logu
e,ex
cept
for
thos
eev
ents
not
incl
uded
inth
ere,
for
whi
chM
Ses
tim
ates
have
been
liste
din
stea
d(v
alue
sfo
llow
edby
aste
risk
).T
heso
urce
ofth
efa
ult
geom
etry
used
toco
mpu
teth
eru
ptur
edi
stan
ce(R
rup)
isal
solis
ted
alon
gw
ith
the
num
ber
ofre
cord
sav
aila
ble
from
each
even
tand
the
dist
ance
and
PG
Ara
nge.
Oth
erpa
ram
eter
slis
ted
incl
ude
the
hypo
cent
rall
ocat
ion,
the
styl
e-of
-fau
ltin
gan
ddi
men
sion
sof
the
faul
trup
ture
EQ
Eve
ntda
teE
pice
ntre
aD
epth
Mb W
S-of
-Fc
Typ
eF
ault
Fau
ltor
ient
atio
neF
ault
dept
han
dle
ngth
f#
Rru
pP
GA
Dat
a
IDan
dti
me
Lat
Lon
[km
]ge
omet
rySt
rike
[◦]
Dip
[◦]
Hto
pH
hing
e/R
Lre
cord
sra
nge
rang
eav
aila
bilit
y[U
TC
][◦
S][◦
W]
refd
[km
]H
bott
om[k
m]
[km
][c
m/s
2 ][k
m]
117
/10/
1966
10.8
0778
.684
20.7
8.1
RIn
terf
ace
Abe
(197
2)33
512
4.5
3580
116
839
6C
OSM
OSg
[21:
41:5
6]2
31/0
5/19
709.
248
78.8
4073
.08.
0N
Intr
asla
bA
be(1
972)
340
5336
9013
01
265
129
CO
SMO
Sg
[20:
23:3
2]3
05/0
1/19
7412
.360
76.3
9082
.06.
6*N
Intr
asla
bF
rom
scal
ing
315
35*
7687
232
105–
107
88–1
69C
OSM
OSg
[08:
33:5
1]re
lati
ons
403
/10/
1974
12.3
9077
.760
15.0
8.1
RIn
terf
ace
Har
tzel
land
350
11/3
02.
424
/52
250
234
–37
196–
245
CO
SMO
Sg
[14:
21:2
9]L
ange
r(1
993)
509
/11/
1974
12.5
8777
.705
15.0
7.1
RIn
terf
ace
Har
tzel
land
350
114
2160
273
–82
49–1
18C
OSM
OSg
[12:
59:5
2]L
ange
r(1
993)
607
/11/
1981
32.2
3271
.379
63.9
6.9
NIn
tras
lab
Fro
msc
alin
g34
586
5276
343
54–9
328
5–57
1R
EN
AD
ICh
[03:
29:5
2]re
lati
ons
(upo
nre
ques
t)7
03/0
3/19
8533
.115
71.6
1640
.08.
0R
Inte
rfac
eM
endo
za5
15/3
06.
426
/71
255
2526
–215
24–7
07C
OSM
OSg
[22:
47:0
9]et
al.
(199
4)8
03/0
3/19
8532
.829
71.2
1122
.86.
4*–
Inte
rfac
eF
rom
scal
ing
1126
1828
193
31–8
332
–187
CO
SMO
Sg
[23:
38:3
0]re
lati
ons
904
/03/
1985
33.8
3771
.426
38.0
6.3
RIn
terf
ace
Cho
yan
d21
2835
4112
289
–132
57–2
30R
EN
AD
ICh
[15:
01:0
8]D
ewey
(upo
n(1
988)
requ
est)
1025
/03/
1985
34.1
9872
.233
23.0
6.4
RIn
terf
ace
Cho
yan
d10
2021
2513
275
–119
31–1
01R
EN
AD
ICh
[05:
14:3
3]D
ewey
(upo
n(1
988)
requ
est)

J Seismol (2011) 15:19–41 27
1109
/04/
1985
34.0
6071
.589
38.0
7.1
RIn
terf
ace
Cho
yan
d0
2133
4326
936
–197
21–1
58C
OSM
OSg
[01:
57:0
1]D
ewey
(198
8)12
15/1
0/19
9731
.020
71.2
3068
.07.
1N
Intr
asla
bF
rom
scal
ing
173
8054
8243
372
–161
50–3
47R
EN
AD
ICh
[01:
03:3
5]re
lati
ons
(upo
nre
ques
t)13
23/0
6/20
0116
.200
73.7
5029
.08.
4R
Inte
rfac
eP
ritc
hard
310
11/2
57.
525
/70
310
762
–231
31–3
30R
EN
AD
ICh
[20:
33:1
5]et
al.
(upo
n(2
007)
requ
est)
1413
/06/
2005
20.0
1069
.240
108.
07.
8N
Intr
asla
bD
elou
isan
d17
515
/35
105.
411
5/13
211
023
108–
420
18–7
08C
ISM
IDi
[22:
44:3
2]L
egra
ndR
EN
AD
ICh
(200
7)(u
pon
requ
est)
1515
/08/
2007
13.4
9076
.850
18.0
8.0
RIn
terf
ace
Jian
dZ
eng
323
273.
552
190
1337
–139
19–4
88C
ISM
IDi
[23:
40:5
9](2
007)
IGP
j(u
pon
requ
est)
Rre
vers
e,N
norm
al,H
top
dept
hto
top,
Hbo
ttom
dept
hto
bott
om,R
Lru
ptur
ele
ngth
asm
easu
red
alon
gth
est
rike
a Epi
cent
relo
cati
ons
and
dept
hsfr
omth
efo
llow
ing
refe
renc
es:E
ngda
hlan
dV
illas
eñor
(200
2)[E
vent
s1,
2,6,
8],L
ange
ran
dSp
ence
(199
5)[E
vent
s3,
4,5]
,Cho
yan
dD
ewey
(198
8)[E
vent
s7,
9,10
,11]
,[3]
Par
doet
al.(
2002
a)[E
vent
12],
Tav
era
etal
.(20
02)
[Eve
nt13
],D
elou
isan
dL
egra
nd(2
007)
[Eve
nt14
],T
aver
aet
al.(
2008
)[E
vent
15]
bM
wes
tim
ates
are
take
nfr
omth
eC
MT
cata
logu
e.F
orev
ents
earl
ier
than
1976
,the
valu
esre
port
edco
me
from
the
follo
win
gre
fere
nces
:Abe
(197
2)an
dSt
aude
r(1
975)
[Eve
nts
1,2]
,Lan
ger
and
Spen
ce(1
995)
[Eve
nt3]
,Har
tzel
land
Lan
ger
(199
3)[E
vent
s4,
5]c St
yle-
of-F
ault
ing:
R,N
follo
win
gth
eW
ells
and
Cop
pers
mit
h(1
994)
defi
niti
ons
dF
ault
plan
edi
men
sion
sof
even
tsof
unkn
own
geom
etry
have
been
defi
ned
usin
gth
eSt
rass
eret
al.(
2010
)sc
alin
gre
lati
ons
for
subd
ucti
on-z
one
even
tse F
ault
plan
eor
ient
atio
nfr
omth
ese
lect
edfa
ult
mod
el.E
vent
sfo
rw
hich
afi
nite
sour
cem
odel
isno
tav
aila
ble,
the
stri
kean
ddi
pha
vebe
ense
lect
edfr
omth
etw
ose
tsof
angl
esre
port
edin
the
Har
vard
CM
Tca
talo
gue
(see
text
for
expl
anat
ion)
.Tw
odi
pva
lues
are
repo
rted
for
hing
edfa
ultm
odel
sf F
orm
ulti
-seg
men
tmod
els,
the
dept
hto
the
hing
ein
the
faul
tis
also
repo
rted
(Hhi
nge)
g Stro
ng-m
otio
nre
cord
sdo
wnl
oada
ble
atht
tp://
db.c
osm
os-e
q.or
ghIn
tere
sted
read
ers
shal
lcon
tact
the
4thau
thor
rega
rdin
gst
rong
-mot
ion
reco
rds
avai
labi
lity
(bor
osch
@ce
c.uc
hile
.cl)
i Stro
ng-m
otio
nre
cord
sdo
wnl
oada
ble
atht
tp://
ww
w.c
ism
id-u
ni.o
rg/
j Inte
rest
edre
ader
ssh
allc
onta
ctth
e6th
auth
orre
gard
ing
stro
ng-m
otio
nre
cord
sav
aila
bilit
y(h
erna
ndo.
tave
ra@
igp.
gob.
pe)

28 J Seismol (2011) 15:19–41
activity). The earthquake classification was madeon the basis of focal mechanism, epicentral lo-cation, depth and relative position with respectto the trench axis. The dominant mechanism ofinterface-type earthquakes corresponds to thrustfaulting on shallow-dipping planes that are ori-ented approximately parallel to the trench axis. Atdepths greater than the coupled plate interface,the stress regime changes from compressional totensional and thus normal faulting prevails. Thesenormal mechanism events are associated with in-traslab activity occurring within the subductedNazca slab, at some distance down-dip fromthe seismically coupled interface. At intermedi-ate depths, two types of intraslab earthquakeshave been identified in this region (e.g., Lemoineet al. 2002): slab-push and slab-pull, which areassociated with down-plate compression and ex-tension, respectively. Along the Peru–Chile sub-duction zone, the occurrence of slab-pull eventsis relatively common in comparison with slab-push events, although some slab-push events haveoccurred in North-Central Chile (the 15 October1997 Punitaqui earthquake) and Central Peru (the5 and 29 April 1991 earthquakes).
The differentiation between interface and in-traslab events was performed using the definitionsof style-of-faulting of Wells and Coppersmith(1994) and the event depth and location with re-spect to the trench axis. As seen in Table 1, theinterface events in this catalogue have a reversemechanism and are limited to a maximum depthof 40 km, which is consistent with the maxi-mum depth extent of the seismically coupled zonefound along different segments of the Peru–Chilesubduction zone (e.g., Comte et al. 1994; Comteand Suárez 1995; Tichelaar and Ruff 1991). Onthe other hand, intraslab-type events in Table 1have a normal mechanism and occur within theNazca slab at depths from about 60 to 110 km.The location of these events in 3D space combinedwith information regarding their focal mechanism(Fig. 1 and lower left panel of Fig. 2) allows a fairlyunambiguous classification between interface andintraslab events, particularly since the geometryof the subducting Nazca slab has been extensivelydocumented. The geometry of the subductingNazca plate is characterised by variations in thedip angle along the strike of the trench (Barazangi
and Isacks 1976; Jordan et al. 1983; Cahill andIsacks 1992). Between latitude 8◦ and 45◦ S, thesubducting Nazca plate is divided into four seg-ments: northern and central Peru, from 8◦ to 15◦ S,where the subducted Nazca plate has a shallow dipof about 10◦; southern Peru and northern Chile,from 15◦ to 27◦ S, where the Nazca Plate descendswith a dip of 25◦ to 30◦. In Central Chile, from27◦ to 33◦ S, the slab is again relatively flat, witha shallow dip angle of about 10◦, and in southernChile, from 33◦ to 45◦ S, the dip of the subductedslab increases to 30◦.
The depth extent of the seismically coupledplate interface along the Peru–Chile subductionzone is similarly well-documented. It has beenestimated from the maximum depth of shallow-dipping reverse events (e.g., Tichelaar and Ruff1991; Suárez and Comte 1993; Comte et al. 1994;Comte and Suárez 1995) and from the depth tran-sition from compressional to extensional stressregime (e.g., Comte and Suárez 1995; Pardo et al.2002b). Based on the maximum depth of large(MW > 6) under-thrusting events located teleseis-mically, Tichelaar and Ruff (1991) suggested thatthe maximum depth of the seismically coupledzone between plates along Chile extends downto 48–53 km and that there is a change in themaximum depth north of latitude 28◦ S, where thecoupled zone extends to depths of 36–41 km. Incontrast, studies using both locally and teleseis-mically recorded data in Northern Chile (Comteet al. 1994; Comte and Suárez 1995) suggestthat the coupling zone, as defined by the maxi-mum depth observed for shallow-dipping reverseevents, extends consistently to about 40 ± 10 kmand no variations along the strike of the trenchare appreciable. The maximum depth of the cou-pling zone may, however, extend up to 60 ±10 km, if the depth transition from compres-sional to tensional stress regime observed alongthe upper part of the subducting slab is consid-ered (Comte and Suárez 1995). This transitionof stress field along the Northern Chile segmentoccurs at depths greater than the maximum depthat which shallow-dipping reverse events are ob-served (∼40 km). Along the Central Chile seg-ment of the subduction zone, the maximum depthof the plate interface has also been estimatedto be about 60 km (Pardo et al. 2002a), which

J Seismol (2011) 15:19–41 29
is in agreement with the aforementioned studiesalong different segments of the Chilean subduc-tion zone.
2.2 Station information and assignmentof site conditions
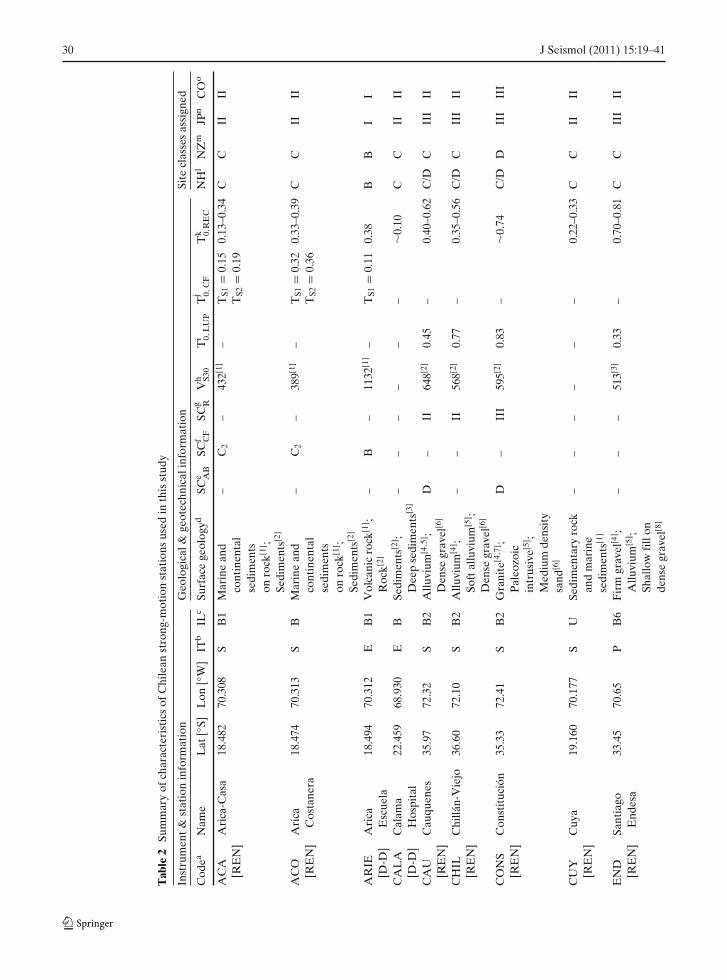
The coordinates of the stations used in this study,type of instrument and instrument housing arelisted in Tables 2 and 3 and their geographicaldistribution is shown in Fig. 2. For the stations inCentral Chile that recorded the 1985 Valparaisoearthquake sequence, some of which are no longerin operation, the station coordinates listed corre-spond to those reported by Campbell et al. (1989,1990), which were validated against satellite im-agery (i.e., Google Earth) to ensure accuracy. In-formation on the type and location of instrument(i.e., type of building) was also obtained fromthese references, from the accelerogram headingsand from the websites of the network operators(IGP, CISMID, RENADIC and DGF-DIC). In-formation on the majority of the Peruvian stationsincluded herein has already been presented inTavera et al. (2008).
Tables 2 and 3 also summarise all geologicaland geotechnical information collected for thesites contributing data to this study. Site condi-tions assigned to the stations in Central Chilewere based on information collected from a num-ber of references including descriptions of thesurface geology (EERI 1986; Çelebi 1987, 1988;Campbell et al. 1989, 1990, Midorikawa et al. 1991;Midorikawa 1992), the site categories follow-ing the Chilean seismic design code assigned byRiddell (1995) and NEHRP site classes assignedby Atkinson and Boore (2003) to the Chileansites whose data were included in the regressiondatabase for subduction-zone events. Shear-wavevelocity (VS) profiles obtained by Araneda andSaragoni (1994), Midorikawa et al. (1991) andMidorikawa (1992) in addition to the natural pe-riod of the Chilean sites determined by Luppichini(2004) using the records of the 1985 Valparaisoearthquake, were also used. Site conditions at thestrong-motion stations in Northern Chile are stillunder investigation and geological and geotech-nical information for a number of these stations
has not yet been made available to the widerengineering community. It is believed, however,that recording sites in Northern Chile can be clas-sified as NEHRP class C, with an average shear-wave velocity over the top 30 m, VS30, between400 and 600 m/s (Boroschek and Comte 2006).Therefore, site conditions assigned to these siteswere only based on information from descriptionsof the local geology (SNGM 1982), VS profilesobtained from spectral analysis of surface waves(SASW) measurements at the stations in Aricaand Poconchile (Cortez-Flores 2004), and naturalsite periods estimated by site response analysis forthe Arica and Poconchile stations (Cortez-Flores2004).
Site conditions assigned to the stations inCentral and Southern Peru were based on de-scriptions of the surface geology (EERI 2007;Bernal and Tavera 2007a, b) and the site cate-gory (i.e., rock, soil or firm ground) assigned byRodriguez-Marek et al. (2007). Shear-wave veloc-ity (VS) profiles obtained from SASW measure-ments at the stations in Ica (Rosenblad and Bay2008) and the stations in Moquegua and Tacna(Cortez-Flores 2004), as well as the VS profilesestimate by Bernal and Tavera (2007a, b) usingan infinite flat-layered half-space model were alsoused. Additionally, the natural site period as in-terpreted from the microzonation map of Lima(Aguilar Bardales and Alva Hurtado 2007) andthat estimated by site response analysis for theMoquegua and Tacna sites (Cortez-Flores 2004)were included. Information on the site conditionsof the majority of the Peruvian stations includedherein has been also been reported in Tavera et al.(2008).
Besides the site information collected, the spec-tral shapes of the records were considered bynormalising the response spectra by their PGAvalue (for all records) and by dividing the spectrarecorded at soil stations by the spectrum obtainedon rock, for stations sufficiently close to one an-other. The natural period for each site computedfrom earthquake records, T0,REC, was also esti-mated and used as a guide for the assignationof site classes, following the empirical site clas-sification approach (JP) adopted by Zhao et al.(2006a) which defines the site period as that cor-responding to the highest H/V response spectral
30 J Seismol (2011) 15:19–41
Tab
le2
Sum
mar
yof
char
acte
rist
ics
ofC
hile
anst
rong
-mot
ion
stat
ions
used
inth
isst
udy
Inst
rum
ent&
stat
ion
info
rmat
ion
Geo
logi
cal&
geot
echn
ical
info
rmat
ion
Site
clas
ses
assi
gned
Cod
eaN
ame
Lat
[◦S]
Lon
[◦W
]IT
bIL
cSu
rfac
ege
olog
ydSC
e AB
SCf C
FSC
g RV
h S30
Ti 0,
LU
PT
j 0,C
FT
k 0,R
EC
NH
lN
Zm
JPn
CO
o
AC
AA
rica
-Cas
a18
.482
70.3
08S
B1
Mar
ine
and
–C
2–
432[
1]–
TS1
=0.
150.
13–0
.34
CC
IIII
[RE
N]
cont
inen
tal
TS2
=0.
19se
dim
ents
onro
ck[1]
;Se
dim
ents
[2]A
CO
Ari
ca18
.474
70.3
13S
BM
arin
ean
d–
C2
–38
9[1]
–T
S1=
0.32
0.33
–0.3
9C
CII
II[R
EN
]C
osta
nera
cont
inen
tal
TS2
=0.
36se
dim
ents
onro
ck[1]
;Se
dim
ents
[2]A
RIE
Ari
ca18
.494
70.3
12E
B1
Vol
cani
cro
ck[1]
;–
B–
1132
[1]–
TS1
=0.
110.
38B
BI
I[D
-D]
Esc
uela
Roc
k[2]
CA
LA
Cal
ama
22.4
5968
.930
EB
Sedi
men
ts[2]
;–
––
––
–∼0
.10
CC
IIII
[D-D
]H
ospi
tal
Dee
pse
dim
ents
[3]C
AU
Cau
quen
es35
.97
72.3
2S
B2
Allu
vium
[4,5] ;
D–
II64
8[2]
0.45
–0.
40–0
.62
C/D
CII
III
[RE
N]
Den
segr
avel
[6]C
HIL
Chi
llán-
Vie
jo36
.60
72.1
0S
B2
Allu
vium
[4];
––
II56
8[2]
0.77
–0.
35–0
.56
C/D
CII
III
[RE
N]
Soft
allu
vium
[5];
Den
segr
avel
[6]C
ON
SC
onst
ituc
ión
35.3
372
.41
SB
2G
rani
te[4,
7] ;D
–II
I59
5[2]
0.83
–∼0
.74
C/D
DII
III
I[R
EN
]P
aleo
zoic
intr
usiv
e[5] ;
Med
ium
dens
ity
sand
[6]C
UY
Cuy
a19
.160
70.1
77S
USe
dim
enta
ryro
ck–
––
––
–0.
22–0
.33
CC
IIII
[RE
N]
and
mar
ine
sedi
men
ts[1]
EN
DSa
ntia
go33
.45
70.6
5P
B6
Fir
mgr
avel
[4];
––
–51
3[3]
0.33
–0.
70–0
.81
CC
III
II[R
EN
]E
ndes
aA
lluvi
um[5]
;Sh
allo
wfi
llon
dens
egr
avel
[8]

J Seismol (2011) 15:19–41 31
HU
AH
uala
ñe34
.97
71.8
2S
B1
Allu
vium
[4,7] ;
B–
II52
7[2]
0.38
–∼0
.36
C/D
CII
II[R
EN
]D
ense
grav
el[6]
ILL
AIl
lape
l31
.63
71.1
7S
B1
Allu
vium
[4,7] ;
E–
II61
3[2]
0.25
–0.
16–0
.22
CC
IIII
[RE
N]
Den
segr
avel
[6]IL
OIl
oca
34.9
372
.18
SB
1A
lluvi
um[4,
5,7] ;
D–
II55
5[2]
0.33
–0.
22–0
.43
C/D
CII
II[R
EN
]Sa
nd[6]
IQU
Iqui
que-
Idie
m20
.215
70.1
40S
BSe
dim
ents
[2]–
––
––
–∼0
.50
CB
III
II[R
EN
]IQ
UC
Iqui
que-
Inp
20.2
1770
.149
SB
Sedi
men
ts[2]
––
––
––
∼0.5
3C
CII
III
[RE
N]
IQU
IIq
uiqu
e20
.214
70.1
38E
BR
ock[
2] ;R
ock[
3]–
––
––
–∼0
.40
BC
II
[D-D
]H
ospi
tal
ISID
San
Isid
ro32
.90
71.2
7S
UA
lluvi
um[1]
D–
–78
9[2]
0.33
–0.
37C
CII
II[R
EN
]L
IGL
aL
igua
32.4
571
.25
SB
1A
lluvi
um[4,
7] ;D
–II
620[
2]0.
29–
–C
CII
II[R
EN
]D
ense
grav
el[6]
LL
AY
Lla
yL
lay
32.8
470
.97
SB
1So
ftal
luvi
um[4,
7] ;E
–II
610[
2]0.
67–
∼1.
0D
DII
III
I[R
EN
]G
rave
land
soft
lime[
6]L
LO
Llo
lleo
33.5
871
.61
SB
1Sa
ndst
one
and
––
II30
5[2]
0.53
–0.
42–0
.52
C/D
CII
III
[RE
N]
volc
anic
rock
[4,7] ;
Den
sesa
nd[6]
LO
AE
lLoa
22.6
3668
.152
SU
Vol
cani
cro
ck[1]
––
––
––
∼0.1
2B
CI
I[R
EN
]M
EJI
Mej
illon
es-
23.1
0370
.446
EB
Sedi
men
ts[2]
;–
––
––
–0.
33–0
.85
CD
III
III
[D-D
]H
ospi
tal
very
deep
sand
s[3]
ME
LP
Mel
ipill
a33
.68
71.2
2S
B1
Allu
vium
[4];
C–
II72
4[2]
0.30
–0.
20–0
.35
CC
IIII
[RE
N]
Den
sesa
nd[6]
;G
rani
te[7]
PA
PP
apud
o32
.51
71.4
5S
B1
Gra
nite
[4,7] ;
B–
I51
7[2]
0.34
–0.
26–0
.36
C/D
CII
II[R
EN
]W
eath
ered
rock
[6]P
ICA
Pic
a–
20.4
9269
.330
EB
Sedi
men
ts[2]
––
––
––
∼0.3
5C
CII
II[D
-D]
Hos
pita
l

32 J Seismol (2011) 15:19–41
Tab
le2
(con
tinu
ed)
Inst
rum
ent&
stat
ion
info
rmat
ion
Geo
logi
cal&
geot
echn
ical
info
rmat
ion
Site
clas
ses
assi
gned
Cod
eaN
ame
Lat
[◦S]
Lon
[◦W
]IT
bIL
cSu
rfac
ege
olog
ydSC
e AB
SCf C
FSC
g RV
h S30
Ti 0,
LU
PT
j 0,C
FT
k 0,R
EC
NH
lN
Zm
JPn
CO
o
PIC
HP
ichi
lem
u34
.38
72.0
2S
B1
Slat
es,s
ands
tone
,B
–I
623[
2]0.
33–
∼0.2
3C
BII
I[R
EN
]lim
esto
ne[4,
7] ;R
ock[
6]P
ISP
isag
ua19
.595
70.2
12S
USh
allo
wfi
llon
––
––
––
0.10
–0.3
3C
BII
I[R
EN
]w
eath
ered
rock
[3]P
OC
O1
Poc
onch
ile1
18.4
5670
.067
SB
Mar
ine
and
–C
2–
511[
1]–
TS1
=0.
240.
21–0
.57
CC
IIII
[RE
N]
cont
inen
tal
TS2
=0.
22se
dim
ents
onro
ck[1]
PO
CO
2P
ocon
chile
218
.457
70.1
07E
BM
arin
ean
d–
C2
––
–T
S1=
0.24
0.21
CC
IIII
[D-D
]co
ntin
enta
lT
S2=
0.22
sedi
men
tson
rock
[1]P
UP
utre
18.1
9769
.574
SU
Wea
ther
edro
ck[3]
––
––
––
0.38
–0.5
6C
BII
III
[RE
N]
QU
INQ
uint
ay33
.20
71.6
8S
SP
aleo
zoic
––
I59
5[2]
0.50
-0.
48–0
.66
CB
III
[RE
N]
intr
usiv
es[5]
;R
ock[
6]R
AP
Rap
el34
.03
71.5
8R
TSe
dim
ents
[4,7] ;
B–
I30
10[2]
0.40
–0.
10–0
.29
AA
II
[RE
N]
Pal
eozo
icin
trus
ives
[[5] ;
Roc
k[6]
SAN
TSa
ntia
go33
.47
70.6
7S
B3
Fir
mgr
avel
[4];
––
––
0.65
–0.
66–0
.91
CC
III
II[R
EN
]A
lluvi
um[5]
SFD
OSa
nF
erna
ndo
34.6
071
.00
SB
1A
lluvi
um[4,
7] ;D
–II
543[
2]0.
36–
0.22
–0.4
6C
CII
II[R
EN
]D
ense
grav
el[6]
SFE
LSa
nF
elip
e32
.75
70.7
3S
B1
Allu
vium
[4,7] ;
D–
II50
2[2]
0.50
–∼0
.12
CC
IIII
[RE
N]
Den
segr
avel
[6]T
AL
Tal
ca35
.43
71.6
7S
B1
Allu
vium
[4,7] ;
E–
II59
8[2]
0.83
–0.
17C
CII
III
[RE
N]
Den
segr
avel
[6]T
CP
Toc
opill
a22
.104
70.2
14E
UR
ock[
2]–
––
––
–∼0
.10
BB
II
[D-D
]
J Seismol (2011) 15:19–41 33
UT
FSM
Val
para
iso
33.0
371
.60
SB
1V
olca
nic
rock
[4,7] ;
B–
I14
21[2]
1.00
–0.
78–0
.87
AA
II
[RE
N]
UT
FSM
Roc
k[6]
VA
LM
DV
alpa
rais
o33
.03
71.6
4S
RF
ill[4,
6] ;So
il[7] ;
D–
III
360[
3]0.
67–
–D
DII
III
I[R
EN
]E
lAlm
endr
alA
rtif
icia
lfill
[8]V
EN
TV
enta
nas
33.0
371
.62
SB
6L
oose
sand
[4];
D–
III
331[
2]0.
67–
0.76
–1.0
DD
III
III
[RE
N]
Allu
vium
[5];
Sand
[6,7]
VIL
Los
Vilo
s31
.92
71.5
0S
B1
Sedi
men
tary
B–
I12
15[2]
––
0.26
AB
II
[RE
N]
rock
[4,7] ;
Roc
k[6]
VM
AR
Viñ
ade
lMar
33.0
271
.55
SB
10A
lluvi
uman
d–
–II
I27
3[3]
0.50
–0.
50–0
.80
DD
III
I[R
EN
]sa
nd[4]
;San
d[6]
ZA
PZ
apal
lar
32.5
571
.46
SB
1R
ock[
6] ;G
rani
te[7]
B–
I60
5[2]
0.41
–∼0
.18
CB
IIII
[RE
N]
a Stat
ion
code
,fol
low
edby
the
netw
ork:
RE
N=R
EN
AD
IC;D
-D=D
GC
-DIC
bIn
stru
men
ttyp
e:E
=ET
NA
;P=P
K-1
30;R
=RF
T-2
50;S
=SM
A-1
;c In
stru
men
tloc
atio
n:B
=bui
ldin
g,fo
llow
edby
num
ber
ofst
orey
sif
know
n;S=
shel
ter;
T=t
unne
l;U
=unk
now
ndD
escr
ipti
onof
the
surf
ace
geol
ogy,
base
don
the
follo
win
gre
fere
nces
:[1]
Geo
logi
cm
apof
Chi
le(S
NG
M19
82);
[2]
Alv
aH
urta
do(2
005)
;[3]
this
stud
y;[4
]Ç
eleb
i(1
988)
;[5]
Cam
pbel
leta
l.(1
990)
;[6]
Rid
dell
(199
5);[
7]E
ER
Ire
conn
aiss
ance
repo
rt(1
986)
;[8]
Mid
orik
awa
etal
.(19
91)
and
Mid
orik
awa
(199
2)e N
EH
RP
site
clas
ses
assi
gned
byA
tkin
son
and
Boo
re(2
003,
2008
)f Si
tecl
asse
sas
sign
edby
Cor
tez-
Flo
res
(200
4)fo
llow
ing
the
Rod
rigu
ez-M
arek
etal
.(20
01)
site
clas
sifi
cati
onsc
hem
e:B
=Roc
k;C
2=Sh
allo
wst
iffs
oil
g Soil
clas
ses
assi
gned
byR
idde
ll(1
995)
follo
win
gth
e19
93C
hile
anse
ism
icde
sign
code
prov
isio
nshA
vera
gesh
ear-
wav
eve
loci
tyov
erth
eto
p30
m,i
nm
/s,d
eter
min
edfr
om:[
1]V
spr
ofile
sob
tain
edby
Cor
tez-
Flo
res
(200
4)us
ing
SASW
;[2]
VS
prof
iles
dete
rmin
edby
Ara
neda
and
Sara
goni
(199
4);V
Spr
ofile
sob
tain
edby
Mid
orik
awa
etal
.(19
91)
and
Mid
orik
awa
(199
2).F
orca
lcul
atio
npu
rpos
es,w
hen
VS
data
wer
eav
aila
ble
atde
pths
<30
m,t
heV
Sva
lue
ofth
ela
stla
yer
was
assu
med
cons
tant
to30
mde
pth
i Pre
dom
inan
tsit
epe
riod
,in
seco
nds,
dete
rmin
edby
Lup
pich
ini(
2004
).V
alue
slis
ted
asre
port
edby
Rui
zan
dSa
rago
ni(2
005)
j Pre
dom
inan
tsi
tepe
riod
dete
rmin
edby
Cor
tez-
Flo
res
(200
4).T
S1w
ases
tim
ated
asth
epe
riod
corr
espo
ndin
gto
the
max
imum
rati
oof
resp
onse
spec
tra
atth
esu
rfac
eov
erth
ere
spon
sesp
ectr
aof
outc
rop
inpu
tmot
ion
and
TS2
corr
espo
nds
toth
ech
arac
teri
stic
site
peri
odca
lcul
ated
from
the
equa
tion
TS
=4H
/V
SkP
redo
min
ants
ite
peri
odca
lcul
ated
from
acce
lero
gram
byco
nsid
erin
gth
eH
/Vra
tio
ofth
ere
spon
sesp
ectr
a,fo
llow
ing
the
appr
oach
ofZ
hao
etal
.(20
06a)
.The
low
eran
dup
per
boun
dari
esof
the
inte
rval
repo
rted
corr
espo
ndto
the
max
imum
and
min
imum
valu
esof
the
natu
rals
ite
peri
odfo
und
whe
nus
ing
mul
tipl
ere
cord
sfr
omth
esa
me
stat
ion.
Val
ues
are
only
liste
dfo
rth
ose
reco
rds
who
seve
rtic
alco
mpo
nent
isav
aila
ble
l Site
clas
sac
cord
ing
toth
eN
EH
RP
(199
7)pr
ovis
ions
used
inan
alys
esm
Site
clas
sas
sign
edfo
llow
ing
the
New
Zea
land
site
clas
sifi
cati
on,w
hich
isba
sed
onsu
rfac
ege
olog
y,ge
otec
hnic
alpr
oper
ties
,nat
ural
site
peri
odan
dde
pth
tobe
droc
k(s
eeM
cVer
ryet
al.2
006
for
deta
ils)
nSi
tecl
ass
assi
gned
follo
win
gth
eZ
hao
etal
.(20
06b)
sche
me,
cons
ider
ing
the
natu
ralp
erio
dof
the
site
oSi
tecl
ass
assi
gned
toco
mpu
teth
ede
sign
load
spr
escr
ibed
byth
e19
96C
hile
anse
ism
icco
de

34 J Seismol (2011) 15:19–41
Tab
le3
Info
rmat
ion
onP
eruv
ian
stro
ng-m
otio
nst
atio
nsus
edin
this
stud
y
Cod
eN
ame
ITL
at[◦
S]L
on[◦
W]
Loc
Surf
ace
geol
ogya
SCb R
MV
c S30
Td 0,
CIS
Te 0,
RE
CN
Hf
NZ
gJP
hC
Oi
[m/s
]
AN
C[I
GP
]A
ncon
D11
.776
77.1
50U
Allu
vial
grav
el(s
oil)
[2]S
280[
5]0.
2–0.
30.
300.
10C
/DC
IIII
AN
R[C
ER
]A
sam
blea
D12
.123
76.9
76B
Allu
vial
grav
el(s
oil)
[2]F
G20
5[5]
0.2–
0.3
0.50
0.15
DC
IIII
Nac
iona
lde
Rec
tore
sC
AL
[CIS
]C
alla
oE
12.0
6077
.150
SSo
ftso
il[1] ;
Soft
clay
[2];
S75
[5]0.
5–0.
60.
530.
52D
/EE
IVII
IG
ranu
lar
fill
over
fine
stra
tifi
edso
ils[3]
CD
L-C
IP[C
IS]
CD
L-C
IPE
12.0
9277
.049
SD
ense
,sti
ffgr
avel
depo
sit
FG
0.1–
0.2
0.82
0.30
DC
III
II(L
ima
Con
glom
erat
e)[1]
;A
lluvi
algr
avel
(soi
l)2]
CE
R[C
ER
]C
eres
isE
12.1
0376
.998
UA
lluvi
algr
avel
(soi
l)[2]
FG
0.1–
0.2
0.28
0.45
DC
III
IIC
SM[C
IS]
Cis
mid
D12
.013
77.0
50B
1D
ense
,sti
ffgr
avel
depo
sit
FG
184[
5]0.
2–0.
30.
050.
10C
CII
I(L
ima
Con
glom
erat
e)[1]
;A
lluvi
algr
avel
(soi
l)[2]
GE
O[I
GP
]G
eolo
gica
lA
12.0
876
.95
UC
oars
ede
nse
grav
el–
CB
IIII
Inst
itut
eH
UA
[IG
P]
Cas
aH
uaco
–A
12.1
376
.98
UA
lluvi
alde
posi
ts–
CB
IIII
Las
Gar
deni
asIC
A2
[CIS
]Ic
a2
A14
.089
75.7
32B
Silt
ysa
nd,s
oil[1
]S
312
–0.
720.
48D
CII
III
LM
OL
[IG
P]
La
Mol
ina
A12
.085
76.9
48U
Allu
vial
depo
sits
Uni
vers
idad
(sof
tcla
ysan
dsa
nd)[4
]A
grar
iaM
AY
[IG
P]
May
oraz
goD
12.0
5576
.944
USa
ndan
dsi
lt[2]
S27
6[5]
0.2–
0.3
0.22
0.20
CC
III
MO
L[C
IS]
Mol
ina
E12
.10
76.8
9B
Shal
low
soil
R38
0[5]
0.2–
0.4
0.13
0.20
CC
III
over
lyin
gde
nse
Lim
aC
ongl
omer
ate;
Sand
[2]

J Seismol (2011) 15:19–41 35
MO
Q1
[CIS
]M
oque
ga1
A17
.187
70.9
29S
Allu
vial
depo
sits
573
0.11
–0.1
8C
BII
II(s
andy
grav
els)
[5]N
NA
[IG
P]
Ñañ
aD
11.9
8776
.389
UR
ock[
2]R
–0.
100.
22B
BI
IP
CN
[IG
P]
Par
cona
D14
.042
75.6
99U
Soil[
1]S
456
0.42
0.54
C/D
CII
III
PU
CP
[PU
CP
]U
nive
rsid
adD
12.0
7477
.080
BA
lluvi
algr
avel
(soi
l)[2]
FG
125[
5]0.
2–0.
30.
900.
90D
DII
III
Cat
olic
ade
lPer
uR
IN[C
ER
]R
inco
nada
D12
.084
76.9
21U
Fill
cons
isti
ngof
sand
,S
200[
5]0.
2–0.
30.
320.
30C
/DC
IIII
silt
and
grav
el[2]
a Des
crip
tion
ofsu
rfac
ege
olog
ypr
ofile
,bas
edon
the
follo
win
gre
fere
nces
:[1]
EE
RI
(200
7)[2
]B
erna
land
Tav
era
(200
7a,b
)[3
]in
form
atio
npr
ovid
edby
the
stro
ng-
mot
ion
netw
ork
inth
eac
cele
rogr
amhe
adin
g[4
]Esp
inos
aet
al.(
1977
)[5
]Cor
tez-
Flo
res
(200
4)bSi
tecl
ass
assi
gned
byR
odri
guez
-Mar
eket
al.(
2007
)c A
vera
gesh
ear-
wav
eve
loci
tyov
erth
eto
p30
m.F
orth
eIc
ast
atio
ns,t
his
isba
sed
onth
eV
Spr
ofile
sob
tain
edby
Ros
enbl
adan
dB
ay(2
008)
usin
gSA
SW.F
orth
eL
ima
stat
ions
,the
valu
eta
bula
ted
isa
tent
ativ
ees
tim
ate
ofV
S30
base
don
the
VS
prof
ilein
ferr
edby
Ber
nala
ndT
aver
a(2
007a
,b)
usin
gan
infi
nite
flat
-lay
ered
half
-spa
cem
odel
dN
atur
alsi
tepe
riod
(T0)
infe
rred
from
the
mic
rozo
nati
onm
apof
Lim
a(A
guila
rB
arda
les
and
Alv
aH
urta
do20
07).
Val
ues
are
not
avai
labl
efo
rth
eN
NA
stat
ion
inL
ima,
nor
for
the
Ica
stat
ions
e Pre
dom
inan
tpe
riod
calc
ulat
edfr
omac
cele
rogr
amby
cons
ider
ing
the
H/V
rati
oof
the
resp
onse
spec
tra,
follo
win
gth
eap
proa
chof
Zha
oet
al.(
2006
a).T
heto
pva
lue
corr
espo
nds
toth
eea
st-w
estc
ompo
nent
ofm
otio
n,w
hile
the
bott
omva
lue
corr
espo
nds
toth
eno
rth-
sout
hco
mpo
nent
f Site
clas
sac
cord
ing
toth
eN
EH
RP
(199
7)pr
ovis
ions
.T
henu
mbe
rin
brac
kets
corr
espo
nds
toth
eV
S30
valu
eas
sum
edw
hen
expl
icit
lyre
quir
ed,
follo
win
gth
ere
com
men
dati
ons
ofA
tkin
son
and
Boo
re(2
003)
g Site
clas
sac
cord
ing
toth
eN
ewZ
eala
ndsi
tecl
assi
fica
tion
,whi
chis
base
don
surf
ace
geol
ogy,
geot
echn
ical
prop
erti
esan
dde
pth
tobe
droc
k.Se
eM
cVer
ryet
al.(
2006
)fo
rde
tails
hSi
tecl
ass
acco
rdin
gto
the
Zha
oet
al.(
2006
b)sc
hem
e,co
nsid
erin
gV
S30
and
the
natu
ralp
erio
dof
the
site
i Site
clas
sas
sum
edto
com
pute
the
desi
gnlo
ads
pres
crib
edby
the
1977
and
2003
Per
uvia
nse
ism
icco
des

36 J Seismol (2011) 15:19–41
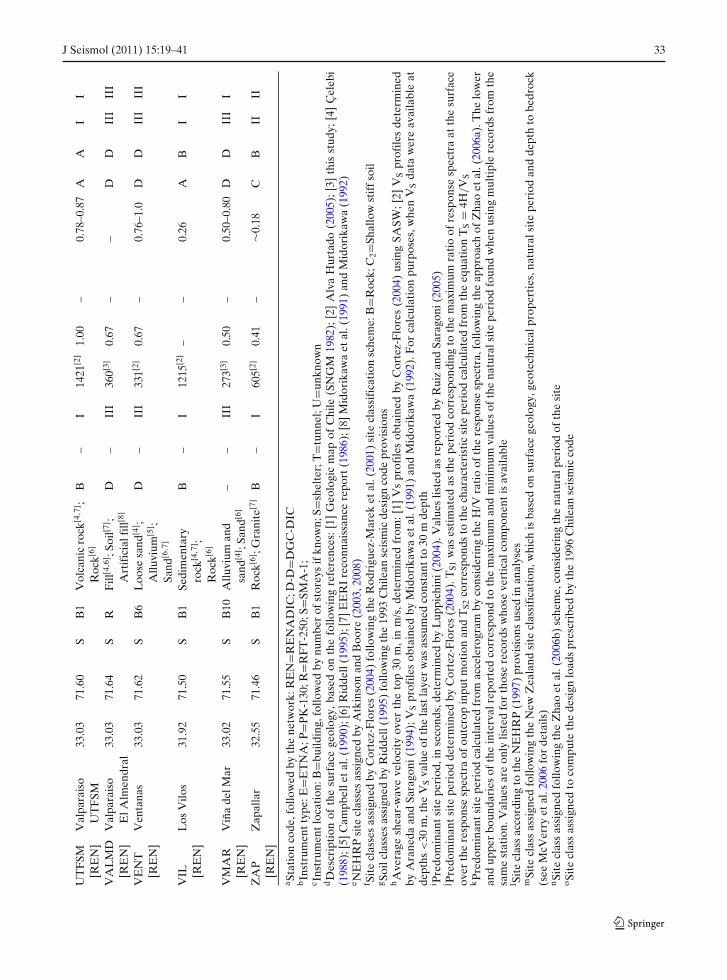
ratio. Tables 2 and 3 also list the site classes as-signed to the different stations following severalclassification schemes: the NEHRP site clas-sification, which is based on the average shear-wave velocity over the top 30 m; the New Zealandclassification scheme used by McVerry et al.(2006), which classifies sites on the basis of the sur-face geology, geotechnical properties, site periodand depth to bedrock; and the JP scheme used byZhao et al. (2006b), which uses the predominantsite period from H/V response spectral ratios.
Due to the inherent limitations of some of thesite data collected, the same level of priority wasnot given to all the various pieces of informationin the assignment of site classes. For instance,only VS profiles determined from measurementsof shear-wave velocity conducted in the field havebeen used for the direct assignment of site classes,and profiles reported from inversions (e.g., Bernaland Tavera 2007a, b) have only been used todistinguish between shallow and deep soil sitessince in several instances these profiles have beenfound to be biased towards low values, leading tosite classifications that are inconsistent with othergeological and geotechnical descriptions. Simi-larly, the VS30 values listed in Table 2, calculatedfrom the VS profiles estimated by Araneda andSaragoni (1994) at a number of sites in centralChile (i.e., LLAY, MEL, ISI), were found to bebiased towards high values. As no information asto the manner in which the VS values published inAraneda and Saragoni (1994) were obtained (i.e.,in situ measurements or numerical modelling),these VS profiles have only been used to iden-tify different soil depths. In addition, the naturalperiod (T0, CIS) derived using ambient noise mea-surements mapped in the microzonation map ofLima (Aguilar Bardales and Alva Hurtado 2007),was generally the preferred input for assigningthe JP site classes to the Peruvian sites as thepredominant period calculated directly from therecords (T0,REC) could be biased due to non-linearity effects. In some instances, however, itwas found that mapped period was inconsistentwith other site descriptors, possibly due to limita-tions of the mapping resolution. For the stations inChile, natural periods estimated by site responseanalysis (Cortez-Flores 2004) were the preferredinput.
Most of the stations in Central Chile are situ-ated on dense alluvial gravel and sand classifiedas NEHRP class C, C/D and D. There are nostations situated on soft soil (NEHRP E); how-ever, the VMAR and V-ALM stations are on deepsand and artificial fill, respectively, and, therefore,exhibit features consistent with soils of mediumdensity. These sites are classified as NEHRP D inview of the large values of the VS30 reported. Onlythree stations are located on hard rock and rock(NEHRP class A and B), and three sites are onsoft/weathered rock classified as NEHRP class C:the RAP, VIL and UTFSM stations are locatedon rock (NEHRP site class B) and ZAP, QUI,PIC sites are on soft/weathered rock (NEHRP siteclass C). Stations in Northern Chile are situatedon volcanic rock and shallow fill on weatheredrock, classified as NEHRP B and C, respectively.The most recent material in this region consistsof Quaternary alluvial and fluvial deposits andmany of the stations are located on such material.These sites are, therefore, classified as NEHRP Cby virtue of the VS30 values estimated for someof those sites (ACA, ACO, POCO1, POCO2) aswell as the shape of the normalised spectra (IQU,MEJI, PICA, CUY). The majority of the stationsin Peru used in this study are situated on allu-vial gravel, sand and silt and have been classifiedas NEHRP class C and D and only one station(NNA) is situated on rock classified as NEHRPclass B. Conversely, the station CAL is locatedclose to the coast in an area of reclaimed landover soft soil, and has been classified as NEHRPclass D/E. Another station located on reclaimedland is RIN, which is located on loose granular fillcomposed of gravel, silt and fine sand.
2.3 Record information
Processing was performed using TSPP: Collec-tion of FORTRAN programs for processing andmanipulating time series, developed by Dr DavidBoore from the United States Geological Sur-vey (Boore 2008). The ground-motion recordingswere reformatted and converted into SMC-formatfiles (see http://nsmp.wr.usgs.gov/smcfmt.html fordetails). When necessary, unevenly sampled datawere interpolated and resampled at 200 samplesper second. Before the application of any process-
J Seismol (2011) 15:19–41 37
ing procedure, non-standard noise (i.e., spuriousspikes) encountered in digitized records from ana-logue instruments (Douglas 2003) was identifiedby visual inspection of the jerk (derivative ofthe acceleration trace). Spikes identified as erro-neous, were removed by replacing the accelera-tion ordinate of the spike with the mean of thepreceding and proceeding accelerations values.For some of the analogue recordings includedin this database, instrument correction has beenalready applied by the data provider and thuswas not applied here. Instrument corrections werenot applied to the remaining records from ana-logue instruments in this database as, in somecases, complete information on the instrumentsresponse was not available and additionally, theapplication of an instrument correction can re-sult in amplification of high-frequency noise intro-duced during the digitization process (Boore andBommer 2005). As a result of the dynamic rangeof the digital instruments (natural frequencies of100 Hz or higher) corrections for instrument char-acteristics were not applied to the digital record-ings included in the database.
The records were processed in a consistentmanner, with individual components individuallyfiltered. Before performing the actual filteringof the record, an initial baseline correction wasapplied to the raw accelerogram (zeroth-ordercorrection). The mean determined from the pre-event portion of the record or the mean computedfrom the whole record if the pre-event portionwas not available was subtracted from the entireacceleration time series. After making this ini-tial baseline correction, the acceleration traceswere integrated without filtering, to check forlong-period drifts that could indicate the pres-ence of offsets in the reference baseline. Inmost cases, baseline offsets were small and thelong-period noise was removed by filtering. Therecords were then filtered using an acausal bi-directional, eighth-order Butterworth filter. Fordigital records, low-cut filter frequencies weredetermined by considering the signal-to-noise ra-tio between each channel and a model of thenoise obtained from the pre-event memory. Sincethis type of model does not account for “signal-generated” noise (Boore and Bommer 2005), theresults were checked through visual inspection
of the velocity and displacement traces ob-tained from integration of the filtered acceler-ation record. Visual inspection of these traceswas also the basis for the selection of the low-cut filter frequency when no pre-event memoryof digital records was available. For analoguerecords, fixed traces were not available to allowthe identification of low-frequency noise. There-fore, the Fourier Amplitude Spectrum (FAS)of the unfiltered accelerogram was comparedwith the noise spectrum estimated from studiesof instruments and digitising apparatus such asthose proposed by Lee and Trifunac (1990) andSkarlatoudis et al. (2003), which were used asguide for the selection of low-cut filters. Sincethese studies correspond to a particular combi-nation of accelerograph and digitiser, which doesnot correspond to that of data being processed, vi-sual examination of the velocity and displacementtraces was also used as a basis for the selection ofthe low-cut filter frequency.
In selecting low-cut filter frequencies, the filterparameter was chosen to give a signal-to-noiseratio of 2. It is noted that the comparison of theFAS of the record with that of the noise indicatesthe ratio of signal-plus-noise to noise, hence if thedesired target is a signal-to-noise ratio of 2, theratio of the record FAS to that of the noise modelshould be 3. The maximum usable period of thespectrum was then defined as 0.8 times the low-cut filter period, as suggested by Abrahamson andSilva (1997), which is broadly consistent with thelimits suggested by Akkar and Bommer (2006).On this basis, it was decided that for about 85%of the records included in the database, the spec-tral ordinates could be reliably calculated up to3 s (or up to 4 s or longer for digital records),although for a few analogue accelerograms, theusable period range could only be extended up to2 s. Finally, removal of high-frequency noise wasachieved by using high frequency cut-off filters at25 Hz for records from analogue instruments and50 Hz for records from digital instruments. Peakvalues of acceleration and velocity and accelera-tion response spectra values for 5% of the criticaldamping were then obtained from the processeddata.
The other relevant parameter for each recordis the source-to-site distance. The source-to-site

38 J Seismol (2011) 15:19–41
distance was characterised in terms of the closestdistance to the earthquake fault plane or rup-ture distance (Rrup). Fault plane dimensions andorientations were obtained from published finite-source rupture models when available (e.g., Abe1972; Hartzell and Langer 1993; Mendoza et al.1994; Choy and Dewey 1988; Pritchard et al. 2007;Ji and Zeng 2007). Events for which fault-planegeometries from finite-fault inversion were avail-able have moment magnitudes 7.1 ≤ MW ≤ 8.4and contribute 70% of the strong-motion dataincluded in the database. For the 1966 (MW 8.1)and 1970 (MW 8.0) Peruvian earthquakes, therupture areas assumed for source-to-site distancecomputations were those estimated by Abe (1972)based on early aftershocks distributions; thesetwo events only contribute two records. For theaftershocks of the 1985 Valparaiso event, withmoment magnitudes 6.3 ≤ MW ≤ 7.1, the circu-lar rupture geometries determined by Choy andDewey (1988) were used to estimate the corre-sponding rupture distances.
For the remaining events, for which neitherfinite-source models nor reliable distributions ofearly aftershocks were available, an alternativeapproach was used to estimate the distance met-rics. Fault-rupture dimensions were estimatedfrom empirical relationships between rupture areaand moment magnitude (MW) for interface andintraslab-type events that have been determinedin Strasser et al. (2010). The rupture plane wasthen located in space, assuming that the epicentrelies above the centre of a dipping plane. Thestrike, dip and rake of the fault plane were as-sumed to correspond to the preferred focal planeof the two sets of angles listed in the HarvardCMT catalogue. On the other hand, for intraslab-type events the main focal plane was assumed tobe that suggested by individual studies of theseevents. For instance, for the 15 October 1997 (MW
7.1) Punitaqui event, the orientation of the actualfault plane was estimated to be the almost verticalnodal plane of the two sets of angles reportedin the Harvard CMT catalogue, based on thebody-wave modelling for this event carried out byLemoine et al. (2001). Similarly, the orientationof the preferred focal planes for the 7 November1981 (MS 6.7) and the 5 January 1974 (MS
6.7) events used herein were those suggested by
Astiz et al. (1988) and Langer and Spence (1995),respectively. This approach is expected to bea reasonable approximation for the purpose ofsource-to-site distance calculations in view of thefact that most of the events for which this as-sumption was applied correspond to intraslabevents with magnitude 5.9 ≤ MS ≤ 6.8, whichwere recorded at large distances and thus theirfault dimensions are not likely to be very largecompared to the source-to-site distances.
3 Conclusions
A database of strong-motion recordings for thePeru–Chile region from 1966 to 2007 has beencompiled, with particular emphasis on the qual-ity of both the data and the metadata associatedwith the recordings. The development of reliableregional strong-motion databases for subductionevents is of prime importance as they increasethe confidence in the results of both regionaland global ground-motion prediction studies forsubduction regimes. While the database presentedin this study is not sufficient for the derivationof a new predictive equation for ground motionsfrom subduction-type events in the Peru–Chileregion, it significantly expands the global databaseof strong-motion data and associated metadatathat can be used in the derivation of predictiveequations for subduction environments. Indeed,the compiled database further extends the magni-tude range of the currently available global data-bases for interface events (e.g., Youngs et al. 1997;Atkinson and Boore 2003, 2008) by the inclusionof data from the 2001 (MW 8.4) Peruvian eventand further supplements the global intraslab databy the inclusion of recordings from the 2005 (MW
7.8) Chilean event. Although the database pre-sented in this paper includes strong-motion datarecorded from 1966 to 2007, the present work canbe easily extended to include more recordings andmetadata from this region as they become avail-able, including those from the MW 8.8 earthquakethat struck Chile on 27 February 2010, as thisstudy was being finalised.
The compiled database will also allow the as-sessment of the existing predictive models forsubduction-type events in terms of their suitability

J Seismol (2011) 15:19–41 39
for this region, which directly influences seismichazard assessment in this region.
Acknowledgements The doctoral research of the firstauthor, on which this paper is based, has been partiallyfunded by the Alβan Programme of the European Unionunder scholarship E05D053967CO and the COLFUTUROprogramme; their financial support is gratefully acknowl-edged. The authors thank Bertrand Delouis for providinginformation on the source process of the 13 June 2005Chilean earthquake.
We are grateful to two anonymous reviewers fortheir constructive feedback that helped to improve themanuscript.
References
Abe K (1972) Mechanics and tectonic implications of the1966 and 1970 Peru earthquakes. Phys Earth PlanetInter 5:367–379
Abrahamson NA, Silva WJ (1997) Empirical responsespectral attenuation relations for shallow crustalearthquakes. Seismol Res Lett 68(1):94–127
Aguilar Bardales Z, Alva Hurtado J (2007) Seismicmicrozonation of Lima. In: Proceedings of theinternational conference on earthquake engineering,Centro Peruano Japonés de Investigaciones Sismicas yMitigación de Desastres (CISMID), UniversidadNacional de Ingeniería, Lima, Peru. Available onlineat: http://www.cismid.edu.uni.pe/descargas/redacis/redacis32_p.pdf. Last accessed November 2009 (inSpanish)
Akkar S, Bommer JJ (2006) Influence of long-period filtercut-off on elastic spectral displacements. Earthq EngStruct Dyn 35(9):1145–1165
Alva Hurtado J (2005) Sismo de Intraplaca ocurrido enTarapacá el 13 de Junio del 2005. Presentation at theCentro Peruano Japones de Investigaciones Sismicasy Mitigacion de Desastres (CISMID), UniversidadNacional de Ingenieria, Lima, Peru (in Spanish)
Araneda C, Saragoni GR (1994) Project of geological sur-vey of strong motion site in Central Chile. Report forthe Kajima Institute of Construction Technology ofTokyo, Santiago, Chile
Astiz L, Lay T, Kanamori H (1988) Large intermediate-depth earthquakes and the subduction process. PhysEarth Planet Inter 53(1–2):80–166
Atkinson GM, Boore DM (2003) Empirical ground-motion relations for subduction-zone earthquakes andtheir application to Cascadia and other regions. BullSeismol Soc Am 93(4):1703–1729
Atkinson GM, Boore DM (2008) Erratum to: Empiricalground-motion relations for subduction-zone earth-quakes and their application to Cascadia and otherregions. Bull Seismol Soc Am 98(4):2567–2569
Barazangi M, Isacks BL (1976) Spatial distribution ofearthquakes and subduction of the Nazca platebeneath South America. Geology 4(11):686–692
Beck S, Barrientos S, Kausel E, Reyes M (1998) Sourcecharacteristics of historic earthquakes along the cen-tral Chile subduction zone. J South Am Earth Sci11(2):115–129
Bernal I, Tavera H (2007a) Peak accelerations recorded inthe City of Lima. In: The August 15, 2007 (7.0 ML)Pisco Earthquake (Preliminary report). Direcciónde Sismología, Instituto Geofísico del Perú (IGP)(in Spanish)
Bernal I, Tavera H (2007b) Peak accelerations recordedin the City of Ica. In: The August 15, 2007 (7.0ML) Pisco Earthquake (Preliminary report). Direc-ción de Sismología, Instituto Geofísico del Perú (IGP)(in Spanish)
Boore DM (2008) TSPP: a collection of FORTRAN pro-grams for processing and manipulating time series.Available online from http://www.daveboore.com/software_online.htm. Last accessed December 2009
Boore DM, Bommer JJ (2005) Processing of strong-motionaccelerograms: needs, options and consequences. SoilDyn Earthqu Eng 25(2):93–115
Boroschek R, Comte D (2006) Amplitude and fre-quency characteristics of the 2001 Southern Peru,Mw = 8.4 earthquake records. J Seismol 10(3):353–369
Cahill T, Isacks BL (1992) Seismicity and shape of the sub-ducted Nazca plate. J Geophys Res 97(B12):17503–17529
Campbell KW, Algermissen ST, Kausel E, Highland LM(1989) Processed strong-motion data for the CentralChile earthquake of March 3, 1985: fifteen accelero-graph sites owned by CHILECTRA, ENDESA,and the Department of Geology and Geophysics,University of Chile. Open-File Report 89–448, US Ge-ological Survey, 328 pp
Campbell KW, Algermissen ST, Kausel E, Highland LM(1990) Processed strong-motion data for the CentralChile aftershock of April 9, 1985: nine accelerographsites owned by CHILECTRA, ENDESA, and theDepartment of Geology and Geophysics, Universityof Chile. Open-File Report 90–46, US Geological Sur-vey, 171 pp
Çelebi M (1987) Topographical and geological am-plifications determined from strong-motion and after-shock records of the 3 March 1985 Chile earthquake.Bull Seismol Soc Am 77(4):1147–1167
Çelebi M (1988) Processed Chile earthquake records of3 March 1985 and aftershocks. Open-File report 87–195, revised October 1988, US Geological Survey,254 pp
Choy GL, Dewey JW (1988) Rupture process of an ex-tended earthquake sequence: teleseismic analysis ofthe Chilean earthquake of March 3, 1985. J GeophysRes 93(B2):1103–1118
Cifuentes IL (1989) The 1960 Chilean earthquakes. JGeophys Res 94(B1):665–680
Comte D, Pardo M (1991) Reappraisal of great historicalearthquakes in the northern Chile and southern Peruseismic gaps. Nat Hazards 4(1):23–44
Comte D, Suárez G (1995) Stress distribution and geom-etry of the subducting Nazca plate in northern Chile

40 J Seismol (2011) 15:19–41
using teleseismically recorded earthquakes. GeophysJ Int 122(2):419–440
Comte D, Eisenberg A, Lorca E, Pardo M, Ponce I,Saragoni R, Singh SK, Suárez G (1986) The 1985Central Chile earthquake: a repeat of previous greatearthquakes in the region? Science 233(4762):449–453
Comte D, Pardo M, Dorbath L, Dorbath C, Haessler H,Rivera L, Cisternas A, Ponce L (1994) Determinationof seismogenic interplate contact zone and crustal seis-micity around Antofagasta, northern Chile using localdata. Geophys J Int 116(3):553–561
Cortez-Flores A (2004) Site response of the 2001 SouthernPeru earthquake. MSc Thesis, Washington StateUniversity
Delouis B, Legrand D (2007) Mw 7.8 Tarapaca interme-diate depth earthquake of 13 June 2005 (northernChile): fault plane identification and slip distributionby waveform inversion. Geophys Res Lett 34(1):Arti-cle No. L01304
Delouis B, Cisternas A, Dorbath L, Rivera L, Kausel E(1996) The Andean subduction zone between 22 and25◦S (northern Chile): precise geometry and state ofstress. Tectonophysics 259(1–3):81–100
DeMets C, Gordon RG, Argus DF, Stein S (1990) Currentplate motions. Geophys J Int 101(2):425–478
Dorbath L, Cisternas A, Dorbath C (1990) Assessment ofthe size of large and great historical earthquakes inPeru. Bull Seismol Soc Am 80(3):551–576
Douglas J (2003) What is a poor quality strong-motionrecord? Bull Earthquake Eng 1(1):141–156
EERI (1986) The Chile earthquake of March 3, 1985—EERI reconnaissance report. Earthq Spectra 2(2):249–508
EERI (2007) Learning from earthquakes: the Pisco, Peru,earthquake of August 15, 2007. EERI Special Earth-quake Report, EERI Newsletter, October 2007
Engdahl ER, Villaseñor A (2002) Global seismicity:1900–1999. In: Lee WHK, Kanamori H, JenningsPC, Kisslinger C (eds) International handbook ofearthquake and engineering seismology. Academic,New York, pp 665–690
Engdahl ER, van der Hilst R, Buland R (1998) Global tele-seismic earthquake relocation with improved traveltimes and procedures for depth determination. BullSeismol Soc Am 88(3):722–743
Espinosa AF, Husid R, Algermissen ST, De las Casas J(1977) The Lima earthquake of October 3, 1974; in-tensity distribution. Bull Seismol Soc Am 67(5):1429–1439
Hartzell S, Langer C (1993) Importance of model para-meterization in finite fault inversions: application tothe 1974 Mw 8.0 Peru earthquake. J Geophys Res98(B12):22123–22134
International Seismological Centre (2009) EHB Bulletin.http://www.isc.ac.uk/search/bulletin/ehb.html. Last ac-cessed May 2009
Ji C, Zeng Y (2007) Preliminary results of the August 15,2007 Mw 8.0 coast of central Peru earthquake. USGeological Survey web report. Available online athttp://earthquake.usgs.gov/eqcenter/eqinthenews/2007/
us2007gbcv/finite_fault.php. Last accessed November2009
Jordan TE, Isacks BL, Allmendinger RW, Brewer JA,Ramos VA, Ando CJ (1983) Andean tectonics relatedto geometry of subducted Nazca plate. Bull Geol SocAm 94(3):341–361
Kausel E (1986) Los Terremotos de Agosto de 1868 yMayo de 1877 que afectaron el Sur del Peru y Nortede Chile. Bol Acad Chil Cienc 3:8–12
Kelleher JA (1972) Rupture zones of large SouthAmerican earthquakes and some predictions. J Geo-phys Res 77(11):2087–2103
Langer CJ, Spence W (1995) The 1974 Peru earthquakeseries. Bull Seismol Soc Am 85(3):665–687
Lee VW, Trifunac MD (1990) Automatic digitization andprocessing of accelerograms using PC. Report CE-90–03, Department of Civil Engineering, Universityof Southern California, Los Angeles, California,115 pp
Lemoine A, Madariaga R, Campos J (2001) Evidencefor earthquake interaction in Central Chile: the July1997–September 1998 sequence. Geophys Res Lett28(14):2743–2746
Lemoine A, Madariaga R, Campos J (2002) Slab-pull andslab-push earthquakes in the Mexican, Chilean andPeruvian subduction zones. Phys Earth Planet Inter132(1–3):157–175
Lomnitz C (2004) Major earthquakes of Chile: a historicalsurvey, 1535–1960. Seismol Res Lett 75(3):368–378
Luppichini N (2004) Interpretación de los acelerogramasdel terremoto de Chile Central de 1985 considerandoondas sísmicas de alta frecuencia. Civil EngineeringDissertation, University of Chile
McVerry G, Zhao J, Abrahamson N, Somerville P (2006)New Zealand acceleration response spectrum attenu-ation relations for crustal and subduction zone earth-quakes. Bull N Z Soc Earthq Eng 39(1):1–58
Mendoza C, Hartzell S, Monfret T (1994) Wide-bandanalysis of the 3 March 1985 central Chile earth-quake: overall source process and rupture history. BullSeismol Soc Am 84(2):269–283
Midorikawa S (1992) Site effects on strong-motion recordsof the 1985 Chile earthquake and their non-linear be-haviour. In: Proceedings of the 10th World Conferencein Earthquake Engineering, vol 2, Madrid, Spain,19–24 July, pp 1031–1036
Midorikawa S, Riddell R, Cruz E (1991) Strong-motionaccelerograph array in Santiago, Chile, and prelimi-nary evaluation of site effects. Earthq Eng Struct Dyn20(5):403–407
NEHRP (1997) Recommended provisions for seismicregulations for new buildings and other structures.Report FEMA 303, US Federal Emergency Manage-ment Agency, Washington, DC
Nishenko SP (1985) Seismic potential for large and greatinterplate earthquakes along the Chilean and southernPeruvian margins of South America: a quantitativereappraisal. J Geophys Res 90(B5):3589–3616
Pacheco JF, Sykes LR (2002) Seismic moment catalog oflarge shallow earthquakes, 1900 to 1989. Bull SeismolSoc Am 82(3):1306–1349

J Seismol (2011) 15:19–41 41
Pardo M, Comte D, Monfret T, Boroschek R, Astroza M(2002a) The October 15, 1997 Punitaqui earthquake(Mw=7.1): a destructive event within the subductingNazca plate in central Chile. Tectonophysics 345(1–4):199–210
Pardo M, Comte D, Monfret T (2002b) Seismotectonicand stress distribution in the central Chile subductionzone. J South Am Earth Sci 15(1):11–22
Pritchard M, Norabuena E, Ji C, Boroschek R, ComteD, Simons M, Dixon T, Rosen P (2007) Geodetic,teleseismic, and strong motion constraints on slip fromrecent southern Peru subduction zone earthquakes.J Geophys Res 112(B3):1–24
Riddell R (1995) Inelastic design spectra accounting forsoil conditions. Earthq Eng Struct Dyn 24(11):1491–1510
Rodriguez-Marek A, Bray JD, Abrahamson N (2001) Anempirical geotechnical seismic site response proce-dure. Earthq Spectra 19(3):653–675
Rodriguez-Marek A, Hurtado J, Cox B, Meneses J,Moreno V, Olcese M, Sancio R, Wartman J (2007)Preliminary reconnaissance report on the geotechni-cal engineering aspects of the August 15, 2007 Pisco,Peru Earthquake. Report of the National ScienceFoundation-Sponsored Geotechnical EarthquakeEngineering Reconnaissance (GEER) Team. Web re-port available from: http://gees.usc.edu/GEER/Peru_2007/Peru_2007_WebPage/index.htm. Last accessedNovember 2009
Rosenblad BL, Bay JA (2008) Shear wave velocity pro-files determined from SASW measurements at sitesaffected by the August 15th, 2007 earthquake in Peru.Report prepared for CERESIS, January 2008, 60 pp
Ruiz S, Saragoni G (2005) Attenuation equations forsubduction-zone earthquakes in Chile considering twoseismogenic mechanisms and site effects. Proceedings,IX Jornadas Chilenas de Sismología e Ingeniería An-tisísmica, Concepción, Chile, 16–19 November 2005.Paper No. A01–15 (in Spanish)
Skarlatoudis A, Papazachos C, Margaris B (2003) Deter-mination of noise spectra from strong motion datarecorded in Greece. J Seismol 7(4):533–540
SNGM (1982) 1:250,000 geologic map of Chile. ServicioNacional de Geologia y Mineria, Chile
Stauder W (1975) Subduction of the Nazca plate underPeru as evidenced by focal mechanisms and by seis-micity. J Geophys Res 80(8):1053–1064
Strasser FO, Arango MC, Bommer JJ (2010) Scalingof source dimensions for interface and intraslabsubduction-zone earthquakes with moment magni-tude. Seismol Res Lett (in press)
Suárez G, Comte D (1993) Comment on ‘Seismic cou-pling along the Chilean subduction zone’ by BWTichelaar and LR Ruff. J Geophys Res 98(B9):15825–15828
Tavera H, Bernal I (2005) Spatial distribution of ruptureareas and seismic gaps in western Peru. Special volumeN6 commemorating Alberto Giesecke, GeologicalSociety of Peru, pp 89–92 (in Spanish)
Tavera H, Bernal I, Strasser FO, Arango-Gaviria MC,Alarcon JE, Bommer JJ (2008) Ground motions ob-served during the 15 August 2007 Pisco, Peru, earth-quake. Bull Earthq Eng 7(1):71–111
Tavera H, Buforn E, Bernal I, Antayhua Y, VilacapomaL (2002) The Arequipa (Peru) earthquake of June 23,2001. J Seismol 6(2):279–283
Tichelaar BW, Ruff LJ (1991) Seismic coupling alongthe Chilean subduction zone. J Geophys Res 96(B7):11997–12022
Wells DL, Coppersmith KJ (1994) New empirical relation-ships among magnitude, rupture length, rupture width,rupture area, and surface displacement. Bull SeismolSoc Am 84(4):974–1002
Youngs RR, Chiou SJ, Silva WJ, Humphrey JR (1997)Strong ground motion attenuation relationships forsubduction zone earthquakes. Seismol Res Lett 68(1):58–77
Zhao J, Irikura K, Zhang J, Fukushima Y, Somerville P,Asano A, Ohno Y, Oouchi T, Takahashi T, OgawaH (2006a) An empirical site-classification method forstrong-motion stations in Japan using H/V responsespectral ratio. Bull Seismol Soc Am 96(3):914–925
Zhao JX, Zhang J, Asano A, Ohno Y, Oouchi T,Takahashi T, Ogawa H, Irikura K, Thio HK,Somerville PG, Fukushima Y (2006b) Attenuation re-lations of strong ground motion in Japan using siteclassification based on predominant period. Bull Seis-mol Soc Am 96(3):898–913