a strategy for routing the mpc8544e in a six-layer pcb - freescale
TRANSCRIPT
Author Name
Cloud Computing:Methodology, System, andApplications

2

Foreward

ii
Preface
iii

iv

Contributors
v

vi
List of Figures
1.1 FoSII . . . . . . . . . . . . . . . . . . . . . . . . . . . . . . . . 81.2 LoM2HiS Framework Architecture . . . . . . . . . . . . . . . 91.3 Host Monitoring System . . . . . . . . . . . . . . . . . . . . . 101.4 Communication Mechanism Scenario . . . . . . . . . . . . . . 111.5 Case-Based Reasoning Process Overview . . . . . . . . . . . . 141.6 Example of images for each of the three animations. . . . . . 191.7 Behavior of execution time for each POV-Ray application. . . 201.8 Pov-Ray Evaluation Configuration. . . . . . . . . . . . . . . . 211.9 POV-Ray experimental results . . . . . . . . . . . . . . . . . 221.10 POV-Ray application cost relations. . . . . . . . . . . . . . . 25
vii

viii

List of Tables
1.1 Complex Mapping Rules. . . . . . . . . . . . . . . . . . . . . 131.2 Cloud Environment Resource Setup Composed of 10 Virtual
Machines. . . . . . . . . . . . . . . . . . . . . . . . . . . . . . 181.3 POV-Ray Applications SLA Objective Thresholds . . . . . . 211.4 Measurement Intervals. . . . . . . . . . . . . . . . . . . . . . 211.5 Monitoring Cost. . . . . . . . . . . . . . . . . . . . . . . . . . 24
ix

x
Contents
I This is a Part 1
1 SOA and QoS Management for Cloud Computing 3Vincent C. Emeakaroha, Michael Maurer, Ivan Breskovic, Ivona Brandic,
and Schahram Dustdar1.1 Introduction . . . . . . . . . . . . . . . . . . . . . . . . . . . 31.2 Related Work . . . . . . . . . . . . . . . . . . . . . . . . . . 51.3 Background and Motivations . . . . . . . . . . . . . . . . . . 7
1.3.1 FoSII Infrastructure Overview . . . . . . . . . . . . . . 71.4 Design of the LoM2HiS Framework . . . . . . . . . . . . . . 8
1.4.1 Host Monitor . . . . . . . . . . . . . . . . . . . . . . . 101.4.1.1 Host Monitor Design . . . . . . . . . . . . . 101.4.1.2 Implementation of Host Monitor Component 11
1.4.2 Communication Mechanism . . . . . . . . . . . . . . . 111.4.3 Run-Time Monitor . . . . . . . . . . . . . . . . . . . . 12
1.4.3.1 Run-Time Monitor Design . . . . . . . . . . 121.4.3.2 Implementation of Run-Time Monitor Com-
ponent . . . . . . . . . . . . . . . . . . . . . 131.5 Knowledge Management . . . . . . . . . . . . . . . . . . . . 14
1.5.1 Case-Based Reasoning Overview . . . . . . . . . . . . 141.5.2 Inferring Similarity of two Cases . . . . . . . . . . . . 161.5.3 Utility Function and Resource Utilization . . . . . . . 16
1.6 Evaluations . . . . . . . . . . . . . . . . . . . . . . . . . . . . 181.6.1 Experimental Environment . . . . . . . . . . . . . . . 181.6.2 Image Rendering Application Use-Case Scenario . . . 191.6.3 Achieved Results and Analysis . . . . . . . . . . . . . 21
1.7 Conclusion and Future Work . . . . . . . . . . . . . . . . . . 25
Bibliography 27
xi

xii

Symbol Description
α To solve the generator main-tenance scheduling, in thepast, several mathematical
techniques have been ap-plied.

Part I
This is a Part
1


1
SOA and QoS Management for CloudComputing
CONTENTS
1.1 Introduction . . . . . . . . . . . . . . . . . . . . . . . . . . . . . . . . . . . . . . . . . . . . . . . . . . . . . . . . . . . . . . . 31.2 Related Work . . . . . . . . . . . . . . . . . . . . . . . . . . . . . . . . . . . . . . . . . . . . . . . . . . . . . . . . . . . . . 51.3 Background and Motivations . . . . . . . . . . . . . . . . . . . . . . . . . . . . . . . . . . . . . . . . . . . . . 7
1.3.1 FoSII Infrastructure Overview . . . . . . . . . . . . . . . . . . . . . . . . . . . . . . . . . . . . 71.4 Design of the LoM2HiS Framework . . . . . . . . . . . . . . . . . . . . . . . . . . . . . . . . . . . . . . . 7
1.4.1 Host Monitor . . . . . . . . . . . . . . . . . . . . . . . . . . . . . . . . . . . . . . . . . . . . . . . . . . . . . . 101.4.1.1 Host Monitor Design . . . . . . . . . . . . . . . . . . . . . . . . . . . . . . . . . . . . . 101.4.1.2 Implementation of Host Monitor Component . . . . . . . . . . . 11
1.4.2 Communication Mechanism . . . . . . . . . . . . . . . . . . . . . . . . . . . . . . . . . . . . . . . 111.4.3 Run-Time Monitor . . . . . . . . . . . . . . . . . . . . . . . . . . . . . . . . . . . . . . . . . . . . . . . . 12
1.4.3.1 Run-Time Monitor Design . . . . . . . . . . . . . . . . . . . . . . . . . . . . . . . 121.4.3.2 Implementation of Run-Time Monitor Component . . . . . 13
1.5 Knowledge Management . . . . . . . . . . . . . . . . . . . . . . . . . . . . . . . . . . . . . . . . . . . . . . . . . . 141.5.1 Case-Based Reasoning Overview . . . . . . . . . . . . . . . . . . . . . . . . . . . . . . . . . . 141.5.2 Inferring Similarity of two Cases . . . . . . . . . . . . . . . . . . . . . . . . . . . . . . . . . . 151.5.3 Utility Function and Resource Utilization . . . . . . . . . . . . . . . . . . . . . . . . 16
1.6 Evaluations . . . . . . . . . . . . . . . . . . . . . . . . . . . . . . . . . . . . . . . . . . . . . . . . . . . . . . . . . . . . . . . . 171.6.1 Experimental Environment . . . . . . . . . . . . . . . . . . . . . . . . . . . . . . . . . . . . . . . 181.6.2 Image Rendering Application Use-Case Scenario . . . . . . . . . . . . . . . . . 181.6.3 Achieved Results and Analysis . . . . . . . . . . . . . . . . . . . . . . . . . . . . . . . . . . . . 20
1.7 Conclusion and Future Work . . . . . . . . . . . . . . . . . . . . . . . . . . . . . . . . . . . . . . . . . . . . . 24Acknowledgments . . . . . . . . . . . . . . . . . . . . . . . . . . . . . . . . . . . . . . . . . . . . . . . . . . . . . . . . . 26
1.1 Introduction
In the recent years, Cloud computing has become a key IT megatrend thatwill take root, although it is at infancy in terms of market adoption. Cloudcomputing is a promising technology that evolved out of several conceptssuch as virtualization, distributed application design, Grid, and enterprise ITmanagement to enable a more flexible approach for deploying and scalingapplications at low cost [8].
Service provisioning in the Cloud is based on Service Level Agreements(SLA), which is a set of non-functional properties specified and negotiatedbetween the customer and the service provider. It states the terms of the
3

4 Cloud Computing: Methodology, System, and Applications
service including the quality of service (QoS), obligations, service pricing, andpenalties in case of agreement violations.
Flexible and reliable management of SLAs is of paramount importance forboth Cloud providers and consumers. On the one hand, the prevention of SLAviolations avoids penalties that are costly to providers. On the other hand,based on flexible and timely reactions to possible SLA violation threats, userinteraction with the system can be minimized enabling Cloud computing totake roots as a flexible and reliable form of on-demand computing.
In order to guarantee an agreed SLA, the Cloud provider must be ca-pable of monitoring its infrastructure (host) resource metrics to enforce theagreed service level objectives. Traditional monitoring technologies for sin-gle machines or Clusters are restricted to locality and homogeneity of moni-tored objects and, therefore, cannot be applied in the Cloud in an appropriatemanner. Moreover, in traditional systems there is a gap between monitoredmetrics, which are usually low-level entities, and SLA agreements, which arehigh-level user guarantee parameters.
In this book chapter we present a novel framework for the mapping of Low-level resource Metric to High-level SLA parameters named LoM2HiS frame-work, which is also capable of evaluating application SLA at runtime anddetecting SLA violation situations in order to ensure the application QoS.Furthermore, we present a knowledge management technique based on Case-Based Reasoning (CBR) that is responsible for proposing reactive actions toprevent or correct detected violation situations.
The LoM2HiS framework is embedded into FoSII infrastructure aimingat developing an infrastructure for autonomic SLA management and enforce-ment. Thus, LoM2HiS represents the first building block of the FoSII [16] in-frastructure. We present the conceptual design of the framework including therun-time and host monitors, and the SLA mapping database. We discuss ournovel communication model based on queuing networks ensuring the scalabil-ity of the LoM2HiS framework. Moreover, we demonstrate sample mappingsfrom the low-level resource metrics to the high-level SLA parameters. There-after, we discuss some details of the CBR knowledge management techniquethereby showing how the cases are formulated and their similarities. Further-more, we describe a utility function for calculating the quality of a proposedaction.
The main contributions of this book chapter are: (i) the design of the low-level resource monitoring and communication mechanisms; (ii) the definitionof mapping rules using domain specific languages; (iii) the mapping of the low-level metrics to high-level SLA objectives; (iv) the evaluation of the SLA atrun-time to detect violation threats or real violation situation; (v) the designof the knowledge management technique; (vi) the evaluation of the LoM2HiSframework in a real Cloud testbed with a use-case scenario consisting of animage rendering application such as POV-Ray [19].
The rest of the book chapter is organized as follows. Section 1.2 presentsthe related work. In Section 1.3 we present the background and motivation for
SOA and QoS Management for Cloud Computing 5
this research work. The conceptual design and implementation issues of theLoM2HiS framework is presented in Section 1.4. In Section 1.5 we give thedetails of the case-based reasoning knowledge management technique. Section1.6 deals with the framework evaluation based on a real Cloud testbed withPOV-Ray applications and the discussion of the achieved results. Section 1.7presents the conclusion of the book chapter and our future research work.
1.2 Related Work
We classify related work on SLA management and enforcement of Cloud basedservices into (i) Cloud resource monitoring [18, 20, 32] (ii) SLA managementincluding QoS management [4, 10, 12, 17, 24, 31] and (iii) mapping techniquesof monitored metrics to SLA parameters and attributes [6,11,29]. Since thereis very little work on monitoring, SLA management, and metrics mapping inCloud systems we look particularly into related areas such as Grid and SOAbased systems.
Fu et al. [18] propose GridEye, a service-oriented monitoring system withflexible architecture that is further equipped with an algorithm for predictionof the overall resource performance characteristics. The authors discuss howresources are monitored with their approach in Grid environment but theyconsider neither SLA management nor low-level metric mapping. Gunter etal. [20] present NetLogger, a distributed monitoring system, which monitorsand collects information from networks. Applications can invoke NetLoggersAPI to survey the overload before and after some request or operation. How-ever, it monitors only network resources. Wood et al. [32] developed a system,called Sandpiper, which automates the process of monitoring and detectinghotspots and remapping/reconfiguring VMs whenever necessary. Their moni-toring system reminds ours in terms of goal: avoid SLA violation. Similar toour approach, Sandpiper uses thresholds to check whether SLAs can be vio-lated. However, it differs from our system by not allowing the mapping of lowlevel metrics, such as CPU and memory, to high-level SLA parameters, suchas response time.
Boniface et al. [4] discuss dynamic service provisioning using GRIA SLAs.The authors describe provisioning of services based on agreed SLAs and themanagement of the SLAs to avoid violations. Their approach is limited to Gridenvironments. Moreover, they do not detail how the low-level metric are moni-tored and mapped to high-level SLAs. Theilman et al. [31] discuss an approachfor multi-level SLA management, where SLAs are consistently specified andmanaged within a service-oriented infrastructure (SOI). They present the run-time functional view of the conceptual architecture and discuss different casestudies including Enterprise Resource Planning (ERP) or financial services.But they did not address low-level resource monitoring and SLA mappings.
6 Cloud Computing: Methodology, System, and Applications
Koller et al. [24] discuss autonomous QoS management using a proxy-like ap-proach. The implementation is based on WS-Agreement. Thereby, SLAs canbe exploited to define certain QoS parameters that a service has to maintainduring its interaction with a specific customer. However, their approach is lim-ited to Web services and does not consider requirements of Cloud Computinginfrastructures like scalability. Frutos et al. [17] discuss the main approachof the EU project BREIN [7] to develop a framework, which extends thecharacteristics of computational Grids by driving their usage inside new tar-get areas in the business domain for advanced SLA management. However,BREIN applies SLA management to Grids, whereas we target SLA manage-ment in Clouds. Dobson et al. [12] present a unified quality of service (QoS)ontology applicable to the main scenarios identified such as QoS-based Webservices selection, QoS monitoring and QoS adaptation. However, they did notconsider low-level resource monitoring. Comuzzi et al. [10] define the processfor SLA establishment adopted within the EU project SLA@SOI framework.The authors propose the architecture for monitoring of SLAs considering tworequirements introduced by SLA establishment: the availability of historicaldata for evaluating SLA offers and the assessment of the capability to monitorthe terms in an SLA offer. But they did not consider monitoring of low-levelmetrics and mapping them to high-level SLA parameters for ensuring the SLAobjectives.
Brandic et al. [6] present an approach for adaptive generation of SLAtemplates. Thereby, SLA users can define mappings from their local SLAtemplates to the remote templates in order to facilitate communication withnumerous Cloud service providers. However, they do not investigate mappingof monitored metrics to agreed SLAs. Rosenberg et al. [29] deal with QoS at-tributes for Web services. They identified important QoS attributes and theircomposition from resource metrics. They presented some mapping techniquesfor composing QoS attributes from resource metrics to form SLA parame-ters for a specific domain. However, they did not deal with monitoring ofresource metrics. Bocciarelli et al. [11] introduce a model-driven approach forintegrating performance prediction into service composition processes carriedout using BPEL. In their approach, they compose service SLA parametersfrom resource metrics using some mapping techniques. But they did neitherconsider resource metrics nor SLA monitoring.
To the best of our knowledge, none of the discussed approaches deal withmappings of low-level monitored metrics to high-level SLA guarantees as thosenecessary in Cloud-like environments.
SOA and QoS Management for Cloud Computing 7
1.3 Background and Motivations
The processes of service provisioning based on SLA and efficient managementof resources in an autonomic manner are major research challenges in Cloud-like environments [8,23]. We are currently developing an infrastructure calledFoSII (Foundations of Self-governing Infrastructures), which proposes modelsand concepts for autonomic SLA management and enforcement in the Cloud.The FoSII infrastructure is capable of managing the whole lifecycle of self-adaptable Cloud services [5].
The essence of using SLA in Cloud business is to guarantee customers acertain level of quality for their services. In a situation where this level ofquality is not met, the provider pays penalties for the breach of contract.In order to save Cloud providers from paying costly penalties and increasetheir profit, we devised the Low Level Metrics to High Level SLA—LoM2HiSframework [13], which is a core component of the FoSII infrastructure formonitoring Cloud resources, mapping the low-level resource metrics to high-level SLA parameter objectives, and detecting SLA violations as well as futureSLA violation threats so as to react before actual SLA violations occur.
1.3.1 FoSII Infrastructure Overview
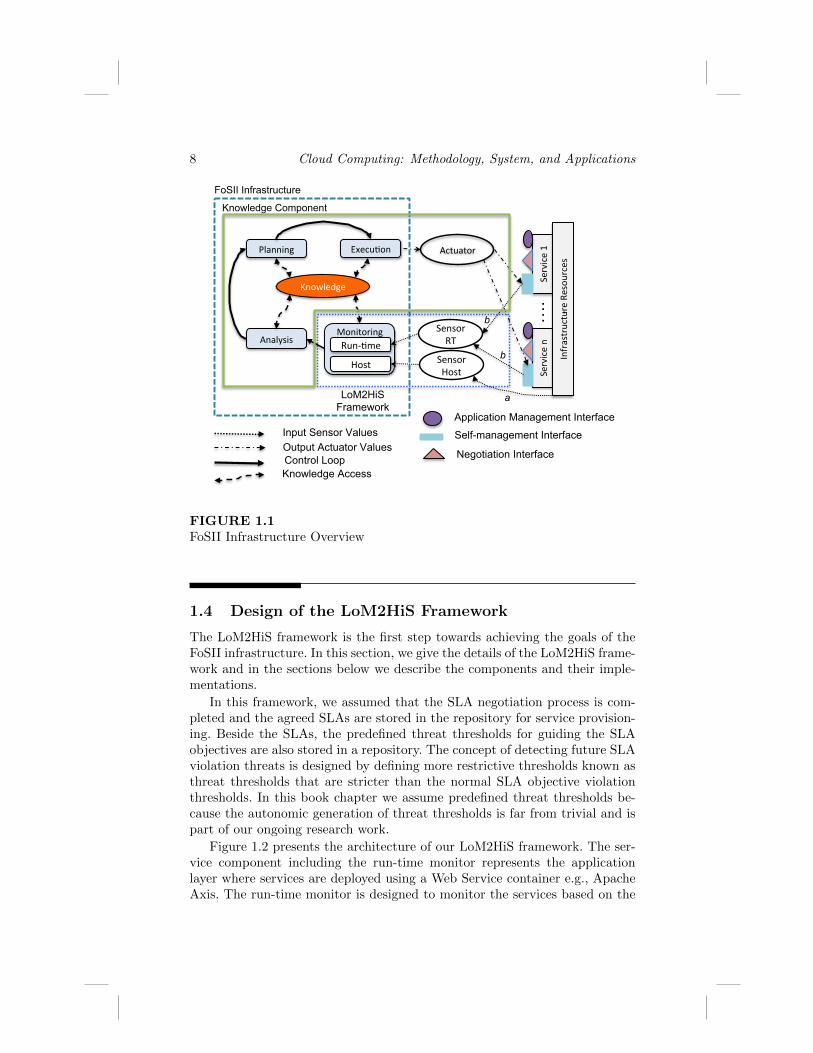
Figure 1.1 presents an overview of the FoSII infrastructure. Each FoSII serviceimplements three interfaces: (i) negotiation interface necessary for the estab-lishment of SLA agreements, (ii) application management interface necessaryto start the application, upload data, and perform similar management ac-tions, and (iii) self-management interface necessary to devise actions in orderto prevent SLA violations.
The self-management interface shown in Figure 1.1 is implemented by eachCloud service and specifies operations for sensing changes of the desired stateand for reacting to those changes [5]. The host monitor sensors continuouslymonitor the infrastructure resource metrics (input sensor values arrow a inFigure 1.1) and provide the autonomic manager with the current resourcestatus. The run-time monitor sensors sense future SLA violation threats (inputsensor values arrow b in Figure 1.1) based on resource usage experiences andpredefined threat thresholds.
Logically, FoSII infrastructure consists of multiple components workingtogether to achieve a common goal. In this book chapter we focus on theLoM2HiS framework and give some details of the knowledge managementtechnique since they are responsible for system monitoring, detection of SLAviolations and proposing of reactive actions to prevent or correct the violationsituation.
8 Cloud Computing: Methodology, System, and Applications
Monitoring Analysis
Planning Execu4on
Knowledge
Sensor RT
Sensor Host
Run-‐4me
Host
Actuator
FoSII Infrastructure
Service 1
Service n
Infrastructure Resou
rces
…. .
LoM2HiS Framework
Self-management Interface Input Sensor Values Output Actuator Values
a
b
b
Knowledge Component
Negotiation Interface
Application Management Interface
Control Loop Knowledge Access
FIGURE 1.1FoSII Infrastructure Overview
1.4 Design of the LoM2HiS Framework
The LoM2HiS framework is the first step towards achieving the goals of theFoSII infrastructure. In this section, we give the details of the LoM2HiS frame-work and in the sections below we describe the components and their imple-mentations.
In this framework, we assumed that the SLA negotiation process is com-pleted and the agreed SLAs are stored in the repository for service provision-ing. Beside the SLAs, the predefined threat thresholds for guiding the SLAobjectives are also stored in a repository. The concept of detecting future SLAviolation threats is designed by defining more restrictive thresholds known asthreat thresholds that are stricter than the normal SLA objective violationthresholds. In this book chapter we assume predefined threat thresholds be-cause the autonomic generation of threat thresholds is far from trivial and ispart of our ongoing research work.
Figure 1.2 presents the architecture of our LoM2HiS framework. The ser-vice component including the run-time monitor represents the applicationlayer where services are deployed using a Web Service container e.g., ApacheAxis. The run-time monitor is designed to monitor the services based on the

SOA and QoS Management for Cloud Computing 9
Services
Run-‐-me Monitor
Push Measured
Metrics
Notifications/ Thresholds
2. Service
Request/ Response
Agreed SLA Repository
Mapped Metrics
Host Monitor
Infrastructure Resources (Hardware)
Know
ledge Co
mpo
nent
Raw Metrics
Get SLA Get/Store Values
Resource status
Execute Rules
3.
4.
5. 6.
7.
8.
9.
FoSII Infrastructure LoM2HiS Framework 1. Definition
of Mappings
Service Provider
Service Customer
FIGURE 1.2LoM2HiS Framework Architecture
negotiated and agreed SLAs. After agreeing on SLA terms, the service providercreates mapping rules for the low-level to high-level SLA mappings (step 1 inFigure 1.2) using Domain Specific Languages (DSLs). DSLs are small lan-guages that can be tailored to a specific problem domain. Once the customerrequests the provisioning of an agreed service (step 2), the run-time monitorloads the service SLA from the agreed SLA repository (step 3). Service provi-sioning is based on the infrastructure resources, which represent the physical-,virtual machines, and network resources in a data centre for hosting Cloudservices. The resource metrics are measured by monitoring agents, and themeasured raw metrics are accessed by the host monitor (step 4). The hostmonitor extracts metric-value pairs from the raw metrics and transmits themperiodically to the run-time monitor (step 5) and to the knowledge component(step 6) using our designed communication mechanism.
Upon receiving the measured metrics, the run-time monitor maps the low-level metrics based on predefined mapping rules to form an equivalent of theagreed SLA objectives. The mapping results are stored in the mapped metricrepository (step 7), which also contains the predefined mapping rules. The run-time monitor uses the mapped values and the predefined thresholds to monitorthe status of the deployed services. In case future SLA violation threats oc-cur, it notifies (step 8) the knowledge component for preventive actions. Theknowledge component also receives the predefined threat thresholds (step 8)for possible adjustments due to environmental changes at run-time. This com-

10 Cloud Computing: Methodology, System, and Applications
ponent works out an appropriate preventive action to avert future SLA viola-tion threats based on the resource status (step 6) and defined rules [28]. Theknowledge components decisions (e.g., assign more CPU to a virtual host) areexecuted on the infrastructure resources (step 9).
1.4.1 Host Monitor
This section describes the host monitor component, which is located at theCloud infrastructure resource level. We first explain its design and later presentthe implementation details.
1.4.1.1 Host Monitor Design
The host monitor is responsible for processing monitored values delivered bythe monitoring agents embedded in the infrastructure resources. The moni-toring agents are capable of measuring both hardware and network resources.Figure 1.3 presents the host monitoring system.
Host Monitor
Resource Pool
D6
D5
D4 D3
D1
D2
Accessing measured raw metrics Broadcast Message
Resource Pool
D17
D16
D15
Resource Pool
….
FIGURE 1.3Host Monitoring System
As shown in Figure 1.3, the monitoring agent embedded in Device 1 (D1)measures its resource metrics and broadcasts them to D2 and D3. Equally,D2 measures and broadcasts its measured metrics to D1 and D3. Thus, weachieve a replica management system in the sense that each device has acomplete result of the monitored infrastructure. The host monitor can accessthese results from any device. It can be configured to access different devicesat the same time for monitored values. In case one fails, the result will beaccessed from the other. This eradicates the problem of a bottleneck systemand offers fault-tolerant capabilities. Note that a device can be a physicalmachine, a virtual machine, a storage device, or a network device. It shouldalso be further noted that the above described broadcasting mechanism isconfigurable and can be deactivated in a Cloud environment where there are
SOA and QoS Management for Cloud Computing 11
lots of devices within resource pools to avoid communication overheads, whichmay consequently lead to degraded overall system performance.
1.4.1.2 Implementation of Host Monitor Component
The host monitor implementation uses the GMOND module from the GAN-GLIA open source project [27] as the monitoring agent. The GMOND moduleis a standalone component of the GANGLIA project. We use it to monitorthe infrastructure resource metrics. The monitored results are presented in anXML file and written to a predefined network socket. We implemented a Javaroutine to listen to this network socket where the GMOND writes the XMLfile containing the monitored metrics to access the file for processing. Fur-thermore, we implemented an XML parser using the well-known open sourceSAX API [30] to parse the XML file in order to extract the metric-value pairs.The measured metric-value pairs are sent to the run-time monitor using ourimplemented communication mechanism. These processes can be done onceor repeated periodically depending on the monitoring strategy being used.
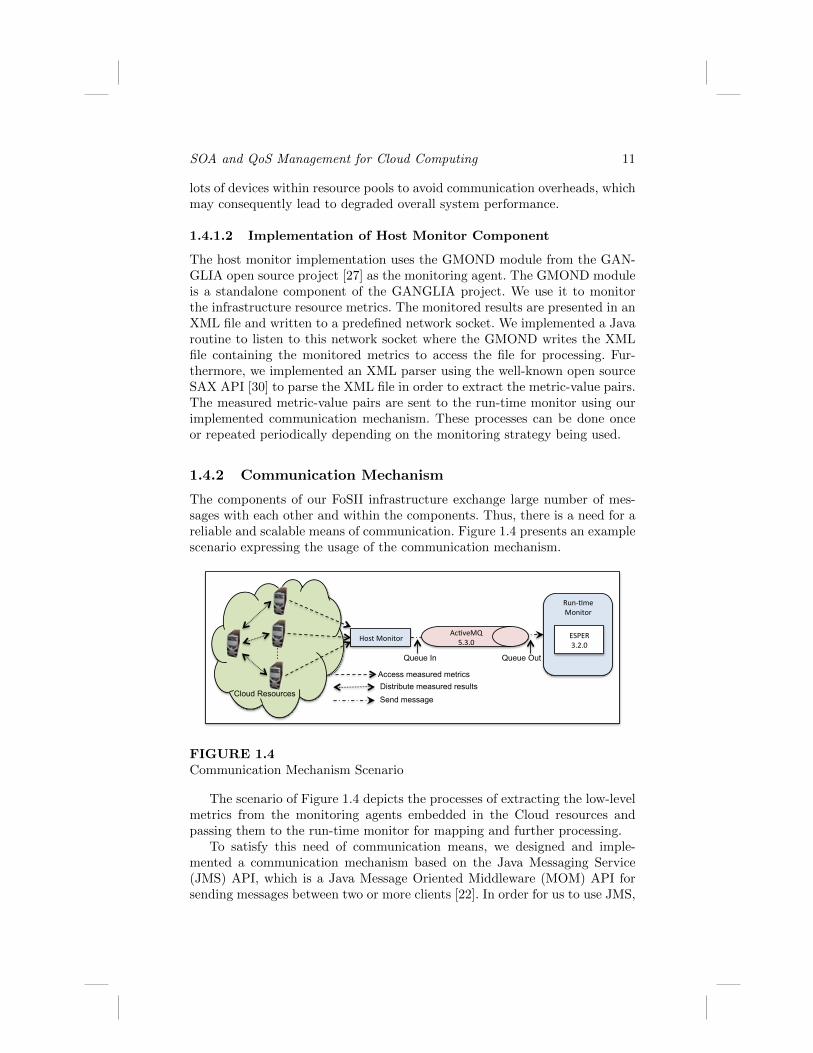
1.4.2 Communication Mechanism
The components of our FoSII infrastructure exchange large number of mes-sages with each other and within the components. Thus, there is a need for areliable and scalable means of communication. Figure 1.4 presents an examplescenario expressing the usage of the communication mechanism.
Run-‐%me Monitor
Host Monitor Ac%veMQ 5.3.0
Cloud Resources
Access measured metrics Distribute measured results
Send message
Queue In Queue Out
ESPER 3.2.0 …
.
FIGURE 1.4Communication Mechanism Scenario
The scenario of Figure 1.4 depicts the processes of extracting the low-levelmetrics from the monitoring agents embedded in the Cloud resources andpassing them to the run-time monitor for mapping and further processing.
To satisfy this need of communication means, we designed and imple-mented a communication mechanism based on the Java Messaging Service(JMS) API, which is a Java Message Oriented Middleware (MOM) API forsending messages between two or more clients [22]. In order for us to use JMS,

12 Cloud Computing: Methodology, System, and Applications
we need a JMS provider that manages the sessions and queues. Thus, we usethe well-established open source Apache ActiveMQ [3] for this purpose.
The implemented communication model is a sort of queuing mechanism.It realizes an inter-process communication for passing messages within FoSIIinfrastructure and between components of the LoM2HiS framework, due to thefact that the components can run on different machines at different locations.This queue makes the communication mechanism highly efficient and scalable.
1.4.3 Run-Time Monitor
The run-time monitor component, which is located at the application level ina Cloud environment is presented in this section. We first describe the designof the component and later explain its implementation details.
1.4.3.1 Run-Time Monitor Design
The run-time monitor performs the mappings and based on the mapped val-ues, the SLA objectives, and the predefined thresholds it continuously moni-tors the customer application status and performance. Its operations are basedon three information sources: (i) the resource metric-value pairs received fromthe host monitor; (ii) the SLA parameter objective values stored in the agreedSLA repository; and (iii) the predefined threat threshold values. The metric-value pairs are low-level entities and the SLA objective values are high-levelentities, so for the run-time monitor to work with these two values, they mustbe mapped into common values.
Mapping of low-level metric to high-level SLAs: As already dis-cussed in Section 1.4, the run-time monitor chooses the mapping rules toapply based on the service being provisioned. That is for each service typethere is a set of defined rules for performing their SLA parameter mappings.These rules are used to compose, aggregate, or convert the low-level metrics toform the high-level SLA parameter. We distinguish between simple and com-plex mapping rules. A simple mapping rule maps one-to-one from low-level tohigh-level, as for example mapping low-level metric disk space to high-levelSLA parameter storage. In this case only the units of the quantities are con-sidered in the mapping rule. Complex mapping rules consist of predefinedformulae for the calculation of specific SLA parameters using the resourcemetrics. Table 1.1 presents some complex mapping rules.
In the mapping rules presented in Table 1.1, the downtime variable rep-resents the mean time to repair (MTTR), which denotes the time it takes tobring a system back online after a failure situation and the uptime representsthe mean time between failure (MTBF), which denotes the time the system wasoperational between the last system failure to the next. Rin is the responsetime for a service request and is calculated as packetsize
availablebandwidthin−inbytes inmilliseconds. Rout is the response time for a service response and is calculated

SOA and QoS Management for Cloud Computing 13
TABLE 1.1Complex Mapping Rules.
Resource Metrics SLA Parameter Mapping Rule
downtime, uptime Availability (A) A = 1− downtimeuptime
inbyte, outbytes, packetsize,avail.bandwidthin,avail.bandwidthout Response Time (Rtotal)Rtotal = Rin + Rout (ms)
as packetsizeavailablebandwidthout−outbytes in milliseconds. The mapped SLAs are stored
in the mapped metric repository for usage during the monitoring phase.
Monitoring SLA objectives and notifying the knowledge com-ponent: In this phase the run-time monitor accesses the mapped metrics’repository to get the mapped SLA parameter values that are equivalent tothe agreed SLA objectives, which it uses together with the predefined thresh-olds in the monitoring process to detect future SLA violation threats or realSLA violation situation. This is achieved by comparing the mapped SLA val-ues against the threat thresholds to detect future violation threats and againstSLA objective thresholds to detect real violation situations. In case of detec-tion it dispatches notification messages to the knowledge component to avertthe threats or correct the violation situation. An example of SLA violationthreat is something like an indication that the system is running out of storage.In such a case the knowledge component acts to increase the system storage.Real violations probably occur if the system is unable to resolve the cause ofa violation threat notification.
1.4.3.2 Implementation of Run-Time Monitor Component
The run-time monitor receives the measured metric-value pairs and passesthem into the Esper engine [15] for further processing. Esper is a componentfor CEP and ESP applications, available for Java as Esper, and for .NET asNEsper. Complex Event Processing (CEP) is a technology to process eventsand discover complex patterns among multiple streams of event data. EventStream Processing (ESP) deals with the task of processing multiple streamsof event data with the goal of identifying the meaningful events within thosestreams, and deriving meaningful information from them.
We use this technology because the JMS system used in our communicationmodel is stateless and as such makes it hard to deal with temporal data andreal-time queries. From the Esper engine the metric-value pairs are deliveredas events each time their values change between measurements. This strategydrastically reduces the number of events/messages processed in the run-timemonitor. We use an XML parser to extract the SLA parameters and theircorresponding objective values from the SLA document and store them in

14 Cloud Computing: Methodology, System, and Applications
a database. The LoM2HiS mappings are realized in Java methods and thereturned mapped SLA objectives are stored in the mapped metrics database.
1.5 Knowledge Management
In this section we give some details about Case-Based Reasoning (CBR),which is the knowledge management technique we are currently investigat-ing for proposing reactive actions to SLA violation threats or real violationsituations. CBR was first built on top of FreeCBR [1], but is now a com-pletely independent Java framework taking into account, however, basic ideasof FreeCBR. We first explain the ideas behind CBR, describe how to infer thesimilarity of two cases, and finally derive a utility function to estimate the“goodness” of a reactive action in a specific situation.
1.5.1 Case-Based Reasoning Overview
Case-Based Reasoning is the process of solving problems based on past ex-periences [2]. In more detail, it tries to solve a case, which is a formattedinstance of a problem by looking for similar cases from the past and reusingthe solutions of these cases to solve the current one.
Rules to Engage CBR
Case Based
Reasoning
Measure Results
Trigger Selected Ac7on
No7fica7on Message
DB1 DB2
Thresholds
FIGURE 1.5Case-Based Reasoning Process Overview
As shown in Figure 1.5 the ideas of using CBR in SLA management is tohave rules stored in a database that engage the CBR system once a thresholdvalue has been reach for a specific SLA parameter. The notification informa-tion are fed into the CBR system as new cases by the monitoring component.Then, CBR prepared with some initial meaningful cases stored in database 2(Figure 1.5), chooses the set of cases, which are most similar to the new caseby various means as described in Section 1.5.2. From these cases, we select theone with the highest utility measured previously and trigger its corresponding

SOA and QoS Management for Cloud Computing 15
action as the proposed action to solve the new case. Finally, we measure in alater time interval the result of this action in comparison to the initial caseand store it with its calculated utilities as a new case in the CBR. Doing this,we can constantly learn new cases and evaluate the usefulness of our triggeredactions.
In general, a typical CBR cycle consists of the following phases assumingthat a new case was just received:
1. Retrieve the most similar case or cases to the new one.
2. Reuse the information and knowledge in the similar case(s) to solvethe problem.
3. Revise the proposed solution.
4. Retain the parts of this experience likely to be useful for futureproblem solving. (Store new case and corresponding solution intoknowledge database.)
In order to relate the cases to SLA agreement, we formalize the languageelements used in the remaining of the book chapter. Each SLA has a uniqueidentifier id and a collection of Service Level Objectives (SLOs), which arepredicates of the form
SLOid(xi, comp, πi) with comp ∈ {<,≤, >,≥,=}, (1.1)
where xi ∈ P represents the parameter name for i = 1, . . . , nid, πi the param-eter goal, and comp the appropriate comparison operator. Additionally, actionguarantees that state the amount of penalty that has to be paid in case of aviolation can be added to SLOs, which is out of scope in this book chapter.Furthermore, a case c is defined as
c = (id,m1, p1,m2, p2, . . . ,mnid, pnid
), (1.2)
where id represents the SLA id, and mi and pi the measured (m) and pro-vided (p) value of the SLA parameter xi, respectively. The measured value(m) indicates the current amount of this specific Cloud resource used by therunning application and the provided value (p) shows the amount of thisspecific Cloud resource allocated to this application. These two parametersare paramount for efficient Cloud resource management in proposing reactiveactions to prevent or correct SLA violation situation.
A typical use case for the evaluation might be: SLA id = 1 withSLO1(“Storage”, ≥, 1000, ag1) and SLO1 (“Bandwidth”, ≥, 50.0, ag1),where ag1 stands for the appropriate preventive action to execute after anSLO violation. A simple case that can be notified by the measurement com-ponent would therefore look like c = (1, 500, 700, 20.0, 30.0). A result caserc = (c−, ac, c+, utility) includes the initial case c−, the executed action ac,the resulting case c+ measured after some time interval later and the calcu-lated utility as described in Section 1.5.3.
16 Cloud Computing: Methodology, System, and Applications
1.5.2 Inferring Similarity of two Cases
To retrieve similar cases already stored in the database in order to proposean action for a new case, the similarity of the two cases has to be calculated.However, there are many metrics that can be considered in this process.
We approach this problem using a strategy similar to Euclidean distance.However, the problem with Euclidean distance, for instance, is due to itssymmetric nature and therefore cannot correctly fetch whether a case is ina state of over- or under-provisioning. Additionally, the metric has to treatparameters in a normalized way so that parameters that have a larger distancerange are not over-proportionally taken into account than parameters with asmaller difference range. For example, if the difference between measured andprovided values of parameter A always lie between 0 and 100 and of parameterB between 0 and 1000, the difference between an old and a new case can onlybe within the same ranges, respectively. Thus, just adding the differences ofthe parameters would yield an unproportional impact on parameter B.
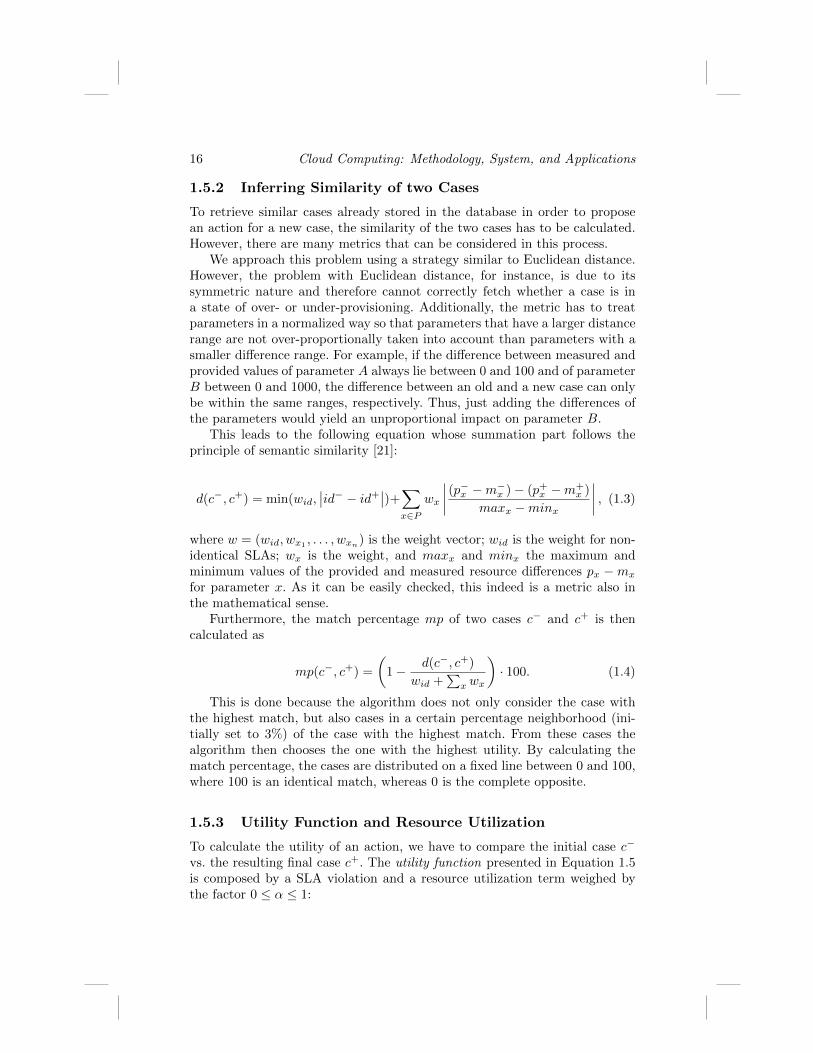
This leads to the following equation whose summation part follows theprinciple of semantic similarity [21]:
d(c−, c+) = min(wid,∣∣id− − id+∣∣)+∑
x∈Pwx
∣∣∣∣ (p−x −m−x )− (p+x −m+x )
maxx −minx
∣∣∣∣ , (1.3)
where w = (wid, wx1, . . . , wxn
) is the weight vector; wid is the weight for non-identical SLAs; wx is the weight, and maxx and minx the maximum andminimum values of the provided and measured resource differences px −mx
for parameter x. As it can be easily checked, this indeed is a metric also inthe mathematical sense.
Furthermore, the match percentage mp of two cases c− and c+ is thencalculated as
mp(c−, c+) =
(1− d(c−, c+)
wid +∑x wx
)· 100. (1.4)
This is done because the algorithm does not only consider the case withthe highest match, but also cases in a certain percentage neighborhood (ini-tially set to 3%) of the case with the highest match. From these cases thealgorithm then chooses the one with the highest utility. By calculating thematch percentage, the cases are distributed on a fixed line between 0 and 100,where 100 is an identical match, whereas 0 is the complete opposite.
1.5.3 Utility Function and Resource Utilization
To calculate the utility of an action, we have to compare the initial case c−
vs. the resulting final case c+. The utility function presented in Equation 1.5is composed by a SLA violation and a resource utilization term weighed bythe factor 0 ≤ α ≤ 1:
SOA and QoS Management for Cloud Computing 17
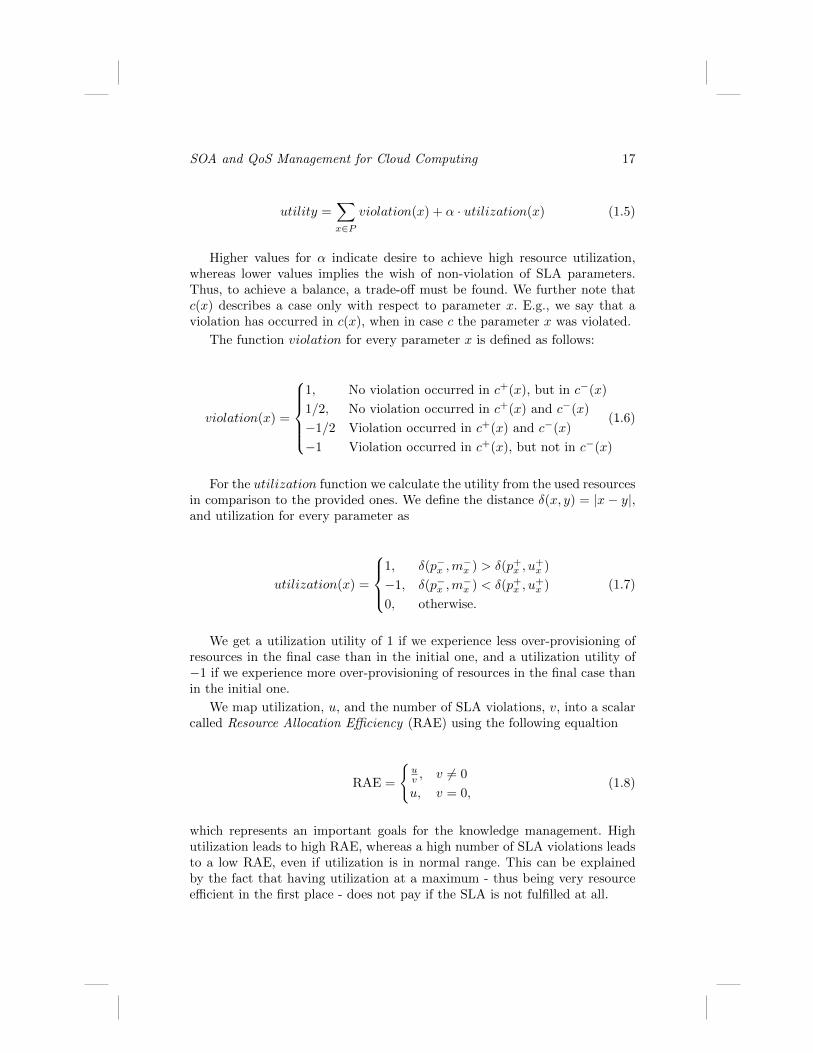
utility =∑x∈P
violation(x) + α · utilization(x) (1.5)
Higher values for α indicate desire to achieve high resource utilization,whereas lower values implies the wish of non-violation of SLA parameters.Thus, to achieve a balance, a trade-off must be found. We further note thatc(x) describes a case only with respect to parameter x. E.g., we say that aviolation has occurred in c(x), when in case c the parameter x was violated.
The function violation for every parameter x is defined as follows:
violation(x) =
1, No violation occurred in c+(x), but in c−(x)
1/2, No violation occurred in c+(x) and c−(x)
−1/2 Violation occurred in c+(x) and c−(x)
−1 Violation occurred in c+(x), but not in c−(x)
.(1.6)
For the utilization function we calculate the utility from the used resourcesin comparison to the provided ones. We define the distance δ(x, y) = |x− y|,and utilization for every parameter as
utilization(x) =
1, δ(p−x ,m
−x ) > δ(p+x , u
+x )
−1, δ(p−x ,m−x ) < δ(p+x , u
+x )
0, otherwise.
(1.7)
We get a utilization utility of 1 if we experience less over-provisioning ofresources in the final case than in the initial one, and a utilization utility of−1 if we experience more over-provisioning of resources in the final case thanin the initial one.
We map utilization, u, and the number of SLA violations, v, into a scalarcalled Resource Allocation Efficiency (RAE) using the following equaltion
RAE =
{uv , v 6= 0
u, v = 0,(1.8)
which represents an important goals for the knowledge management. Highutilization leads to high RAE, whereas a high number of SLA violations leadsto a low RAE, even if utilization is in normal range. This can be explainedby the fact that having utilization at a maximum - thus being very resourceefficient in the first place - does not pay if the SLA is not fulfilled at all.
18 Cloud Computing: Methodology, System, and Applications
1.6 Evaluations
In this section we present an image rendering use-case scenario to evaluateour approach in this book chapter. The knowledge management technique isdeveloped as an independent work and has not yet been integrated with theLoM2HiS framework. Thus our evaluations here covers only the monitoringframework.
The goal of our evaluations is to determine the optimal measurement in-terval for monitoring agreed SLA objectives for applications at runtime. Wefirst present our real Cloud experimental environment after which we discussin details the use-case scenario.
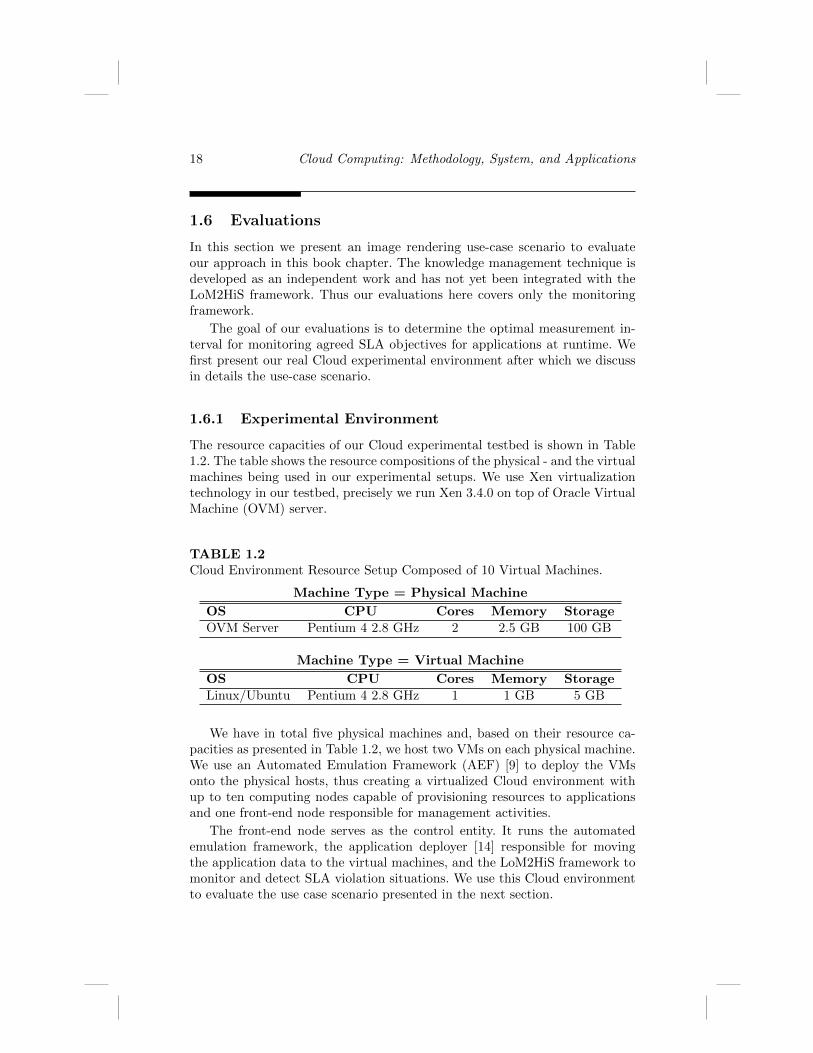
1.6.1 Experimental Environment
The resource capacities of our Cloud experimental testbed is shown in Table1.2. The table shows the resource compositions of the physical - and the virtualmachines being used in our experimental setups. We use Xen virtualizationtechnology in our testbed, precisely we run Xen 3.4.0 on top of Oracle VirtualMachine (OVM) server.
TABLE 1.2Cloud Environment Resource Setup Composed of 10 Virtual Machines.
Machine Type = Physical Machine
OS CPU Cores Memory StorageOVM Server Pentium 4 2.8 GHz 2 2.5 GB 100 GB
Machine Type = Virtual Machine
OS CPU Cores Memory Storage
Linux/Ubuntu Pentium 4 2.8 GHz 1 1 GB 5 GB
We have in total five physical machines and, based on their resource ca-pacities as presented in Table 1.2, we host two VMs on each physical machine.We use an Automated Emulation Framework (AEF) [9] to deploy the VMsonto the physical hosts, thus creating a virtualized Cloud environment withup to ten computing nodes capable of provisioning resources to applicationsand one front-end node responsible for management activities.
The front-end node serves as the control entity. It runs the automatedemulation framework, the application deployer [14] responsible for movingthe application data to the virtual machines, and the LoM2HiS framework tomonitor and detect SLA violation situations. We use this Cloud environmentto evaluate the use case scenario presented in the next section.
SOA and QoS Management for Cloud Computing 19
1.6.2 Image Rendering Application Use-Case Scenario
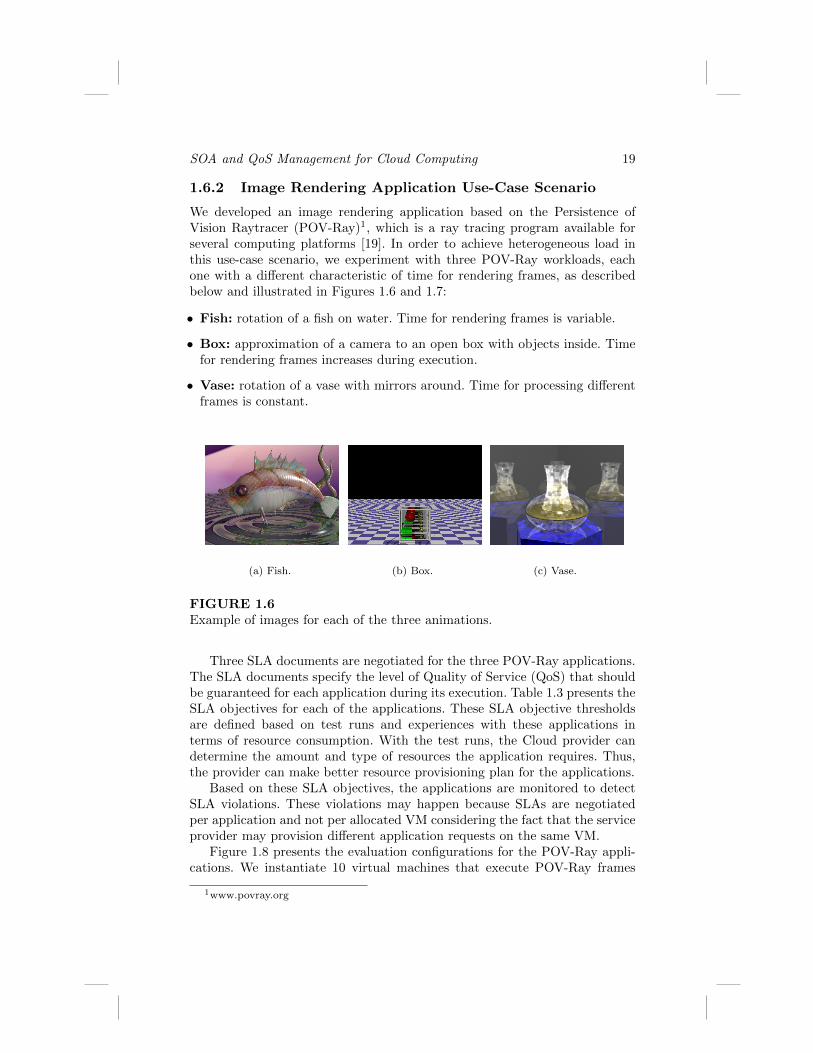
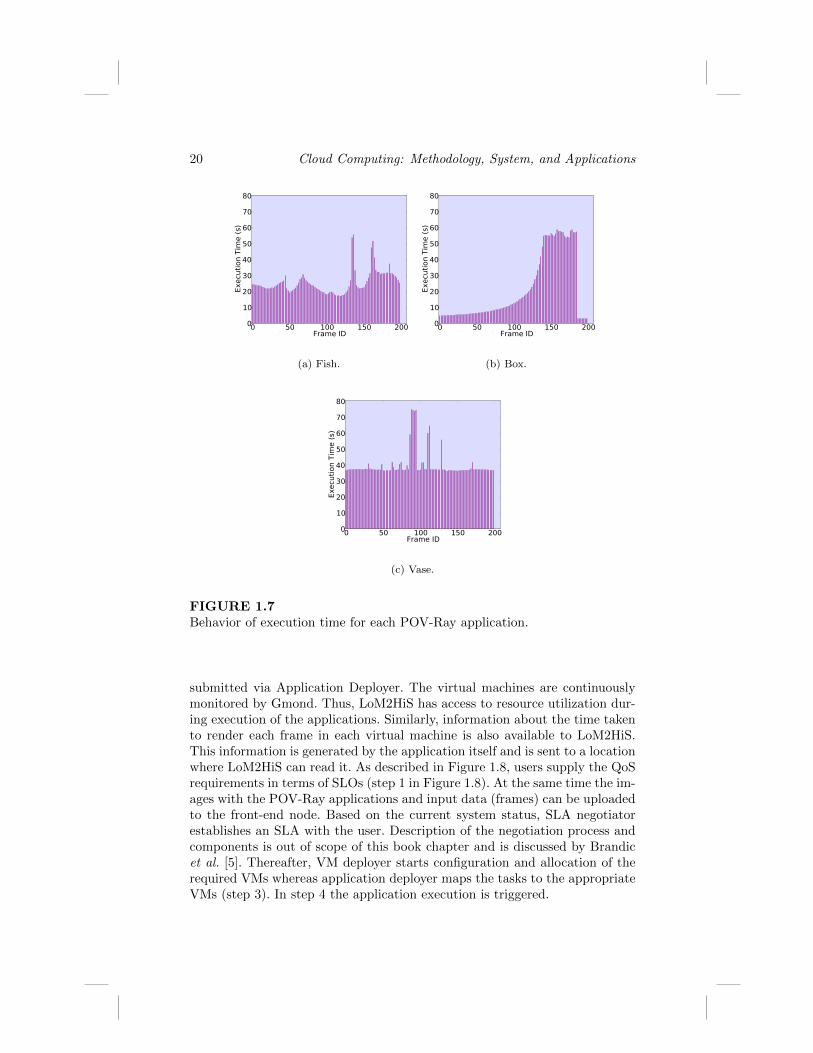
We developed an image rendering application based on the Persistence ofVision Raytracer (POV-Ray)1, which is a ray tracing program available forseveral computing platforms [19]. In order to achieve heterogeneous load inthis use-case scenario, we experiment with three POV-Ray workloads, eachone with a different characteristic of time for rendering frames, as describedbelow and illustrated in Figures 1.6 and 1.7:
• Fish: rotation of a fish on water. Time for rendering frames is variable.
• Box: approximation of a camera to an open box with objects inside. Timefor rendering frames increases during execution.
• Vase: rotation of a vase with mirrors around. Time for processing differentframes is constant.
(a) Fish. (b) Box. (c) Vase.
FIGURE 1.6Example of images for each of the three animations.
Three SLA documents are negotiated for the three POV-Ray applications.The SLA documents specify the level of Quality of Service (QoS) that shouldbe guaranteed for each application during its execution. Table 1.3 presents theSLA objectives for each of the applications. These SLA objective thresholdsare defined based on test runs and experiences with these applications interms of resource consumption. With the test runs, the Cloud provider candetermine the amount and type of resources the application requires. Thus,the provider can make better resource provisioning plan for the applications.
Based on these SLA objectives, the applications are monitored to detectSLA violations. These violations may happen because SLAs are negotiatedper application and not per allocated VM considering the fact that the serviceprovider may provision different application requests on the same VM.
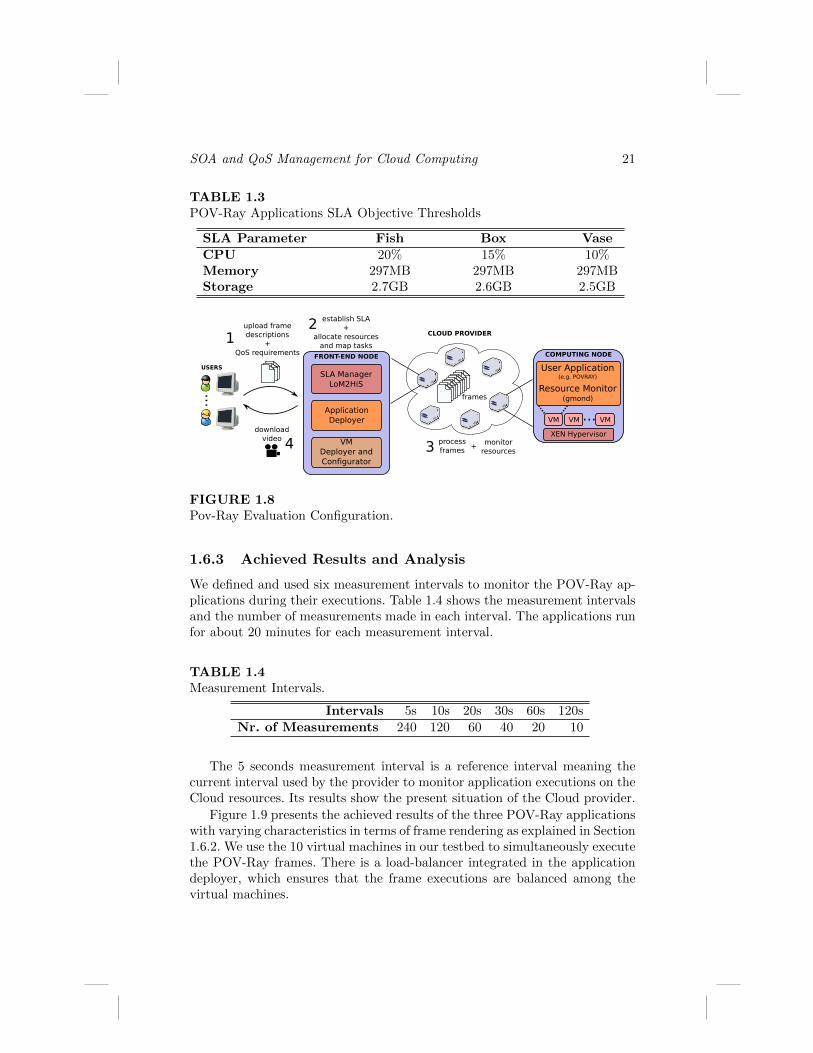
Figure 1.8 presents the evaluation configurations for the POV-Ray appli-cations. We instantiate 10 virtual machines that execute POV-Ray frames
1www.povray.org
20 Cloud Computing: Methodology, System, and Applications
0 50 100 150 200Frame ID
0
10
20
30
40
50
60
70
80
Execu
tion T
ime (
s)
(a) Fish.
0 50 100 150 200Frame ID
0
10
20
30
40
50
60
70
80
Execu
tion T
ime (
s)
(b) Box.
0 50 100 150 200Frame ID
0
10
20
30
40
50
60
70
80
Execu
tion T
ime (
s)
(c) Vase.
FIGURE 1.7Behavior of execution time for each POV-Ray application.
submitted via Application Deployer. The virtual machines are continuouslymonitored by Gmond. Thus, LoM2HiS has access to resource utilization dur-ing execution of the applications. Similarly, information about the time takento render each frame in each virtual machine is also available to LoM2HiS.This information is generated by the application itself and is sent to a locationwhere LoM2HiS can read it. As described in Figure 1.8, users supply the QoSrequirements in terms of SLOs (step 1 in Figure 1.8). At the same time the im-ages with the POV-Ray applications and input data (frames) can be uploadedto the front-end node. Based on the current system status, SLA negotiatorestablishes an SLA with the user. Description of the negotiation process andcomponents is out of scope of this book chapter and is discussed by Brandicet al. [5]. Thereafter, VM deployer starts configuration and allocation of therequired VMs whereas application deployer maps the tasks to the appropriateVMs (step 3). In step 4 the application execution is triggered.
SOA and QoS Management for Cloud Computing 21
TABLE 1.3POV-Ray Applications SLA Objective Thresholds
SLA Parameter Fish Box Vase
CPU 20% 15% 10%Memory 297MB 297MB 297MBStorage 2.7GB 2.6GB 2.5GB
USERS
CLOUD PROVIDER
...
upload framedescriptions
+QoS requirements
12
3 processframes
downloadvideo 4
XEN Hypervisor
VM VM VM...
User Application(e.g. POVRAY)
Resource Monitor(gmond)frames
establish SLA+
allocate resourcesand map tasks
monitorresources
+
COMPUTING NODE
ApplicationDeployer
SLA ManagerLoM2HiS
FRONT-END NODE
VMDeployer andConfigurator
FIGURE 1.8Pov-Ray Evaluation Configuration.
1.6.3 Achieved Results and Analysis
We defined and used six measurement intervals to monitor the POV-Ray ap-plications during their executions. Table 1.4 shows the measurement intervalsand the number of measurements made in each interval. The applications runfor about 20 minutes for each measurement interval.
TABLE 1.4Measurement Intervals.
Intervals 5s 10s 20s 30s 60s 120s
Nr. of Measurements 240 120 60 40 20 10
The 5 seconds measurement interval is a reference interval meaning thecurrent interval used by the provider to monitor application executions on theCloud resources. Its results show the present situation of the Cloud provider.
Figure 1.9 presents the achieved results of the three POV-Ray applicationswith varying characteristics in terms of frame rendering as explained in Section1.6.2. We use the 10 virtual machines in our testbed to simultaneously executethe POV-Ray frames. There is a load-balancer integrated in the applicationdeployer, which ensures that the frame executions are balanced among thevirtual machines.

22 Cloud Computing: Methodology, System, and Applications
The LoM2HiS framework monitors the resource usage of each virtual ma-chine to determine if the SLA objectives are ensured and reports violationsotherwise. Since the load-balancer balances the execution of frames amongthe virtual machines, we plot in Figure 1.9 the average numbers of violationsencountered in the testbed for each application with each measurement inter-val.
0
20
40
60
80
100
120
0 20 40 60 80 100 120Num
ber o
f SLA
Vio
latio
ns
Measurements Intervals (sec)
Fish Pov-Ray ResultCPU
MemoryStorage
(a) Fish.
0
20
40
60
80
100
0 20 40 60 80 100 120Num
ber o
f SLA
Vio
latio
nsMeasurements Intervals (sec)
Box Pov-Ray ResultCPU
MemoryStorage
(b) Box.
0
10
20
30
40
50
60
0 20 40 60 80 100 120Num
ber o
f SLA
Vio
latio
ns
Measurements Intervals (sec)
Vase Pov-Ray ResultCPU
MemoryStorage
(c) Vase.
FIGURE 1.9POV-Ray experimental results
To find the optimal measurement interval for detecting applications‘ SLAobjectives violations at runtime, we discuss the following two determiningfactors i) cost of making measurements; and ii) the cost of missing SLA viola-tions. The acceptable trade-off between these two factors defines the optimalmeasurement interval.
Using these two factors and other parameters we define a cost function (C)based on which we can derive an optimal measurement interval. The ideas of

SOA and QoS Management for Cloud Computing 23
defining this cost functions are derived from utility functions discussed by Leeet al. [26]. Equation 1.9 presents the cost function.
C = µ ∗ Cm +∑
ψε{cpu,memory,storage}
α (ψ) ∗ Cv (1.9)
where µ is the number of measurements, Cm is the cost of measurement, α (ψ)is the number of undetected SLA violations, and Cv is the cost of missingan SLA violation. The number of undetected SLA violations are determinedbased on the results of the 5 seconds reference measurement interval, whichis assumed to be an interval capturing all the violations of applications’ SLAobjectives. This cost function now forms the basis for analyzing the achievedresults of our use-case scenario.
The cost of making measurement in our testbed is defined by consideringthe intrusiveness of the measurements on the overall performance of the sys-tem. Based on our testbed architecture and intrusiveness test performed, weobserved that measurements have minimal effects on the computing nodes.This is because measurements and their processing take place in the front-end node while the services are hosted in the computing node. The moni-toring agents running on computing nodes have minimal impact on resourceconsumption. This means a low cost of making measurements in the Cloudenvironment.
The cost of missing SLA violation detection is an economic factor, whichdepends on the SLA penalty cost agreed for the specific application and theeffects the violation will have to the provider for example in terms of reputationor trust issues.
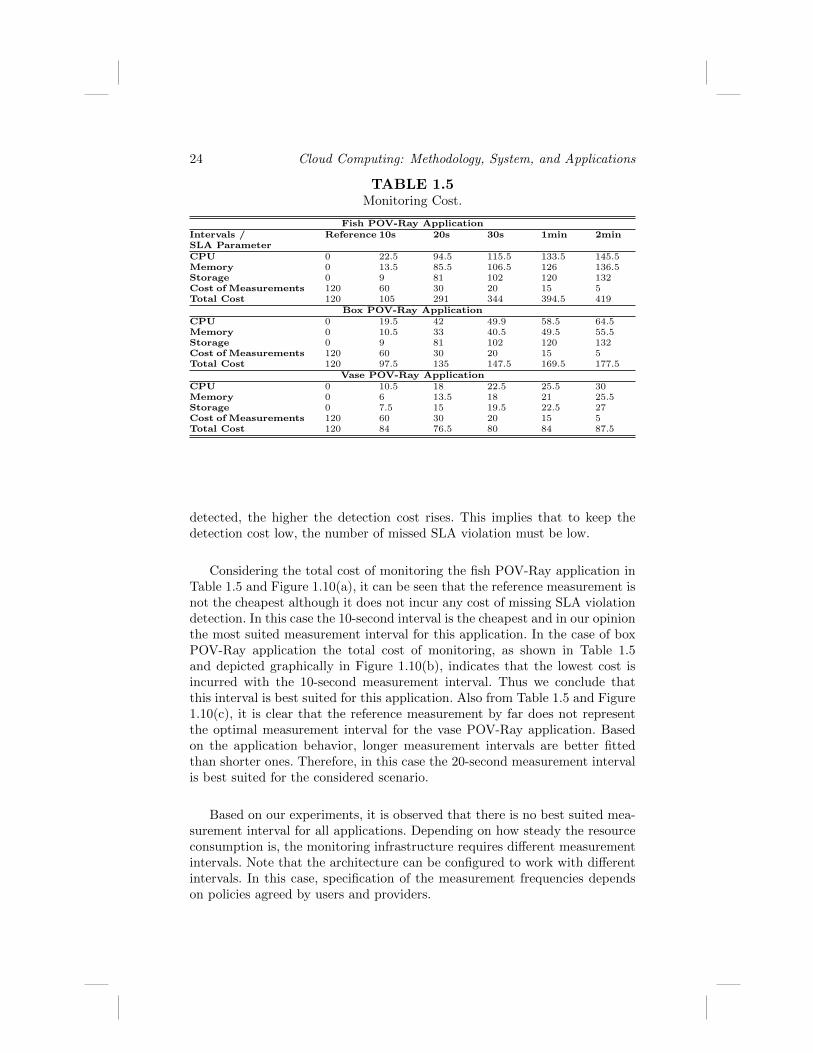
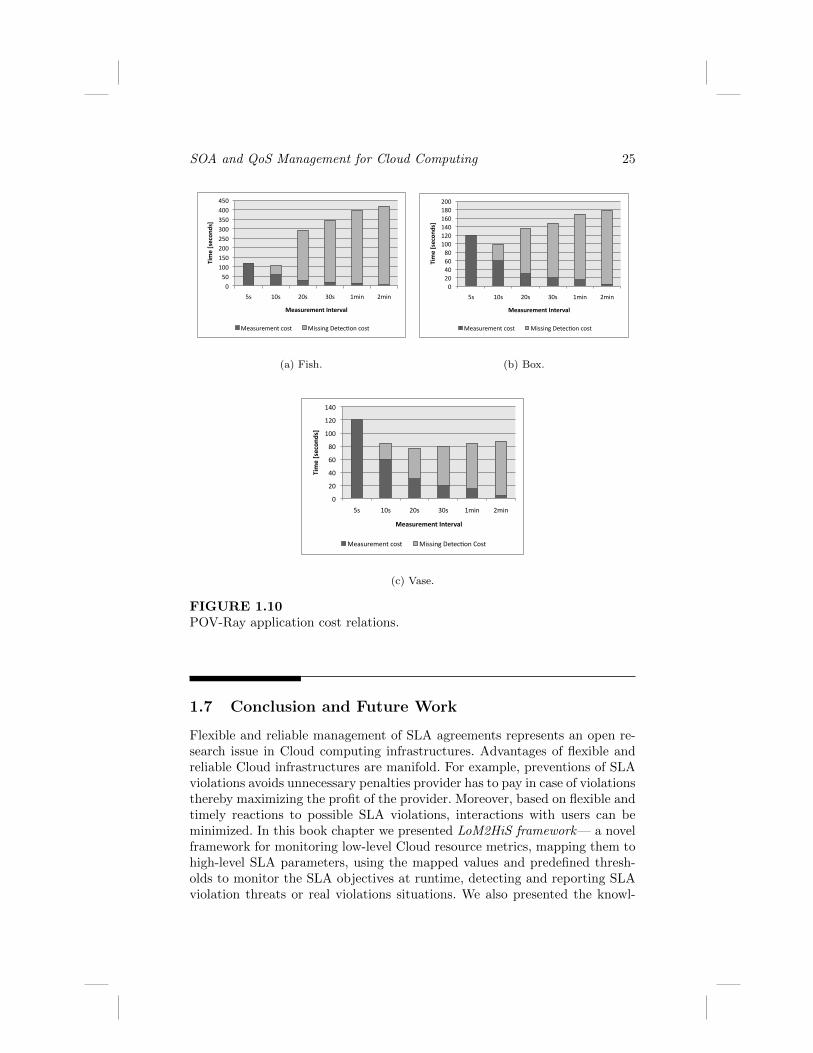
Applying the cost function on the achieved results of Figure 1.9, with ameasurement cost of 0.5 dollar and an aggregated missing violation cost of1.5 dollar, we achieve the monitoring costs presented in Table 1.5. These costvalues are example values for our experimental setup. It neither representsnor suggests any standard values. The approach used here is derived from thecost function approaches presented in literature [25,33].
The monitoring cost presented in Table 1.5 represents the cost of measure-ment for each interval and for missing to detect SLA violation situation foreach application. The reference measurement captures all SLA violations foreach application, thus it only incurs measurement cost. Taking a closer lookat Table 1.5, it is clear that the values of the shorter measurement intervalare closer to the reference measurement than those of the longer measurementinterval. This is attributed to our novel architecture design, which separatesmanagement activities from computing activities in the Cloud testbed.
The relations of the measurement cost and the cost of missing SLA viola-tion detection is graphically depicted in Figure 1.10 for the three POV-Rayapplications. From the figures, it can be noticed in terms of measurement costthat the longer the measurement interval, the smaller the measurement costand in terms of detection cost, the higher the number of missed SLA violation
24 Cloud Computing: Methodology, System, and Applications
TABLE 1.5Monitoring Cost.
Fish POV-Ray ApplicationIntervals / Reference 10s 20s 30s 1min 2minSLA ParameterCPU 0 22.5 94.5 115.5 133.5 145.5Memory 0 13.5 85.5 106.5 126 136.5Storage 0 9 81 102 120 132Cost of Measurements 120 60 30 20 15 5Total Cost 120 105 291 344 394.5 419
Box POV-Ray ApplicationCPU 0 19.5 42 49.9 58.5 64.5Memory 0 10.5 33 40.5 49.5 55.5Storage 0 9 81 102 120 132Cost of Measurements 120 60 30 20 15 5Total Cost 120 97.5 135 147.5 169.5 177.5
Vase POV-Ray ApplicationCPU 0 10.5 18 22.5 25.5 30Memory 0 6 13.5 18 21 25.5Storage 0 7.5 15 19.5 22.5 27Cost of Measurements 120 60 30 20 15 5Total Cost 120 84 76.5 80 84 87.5
detected, the higher the detection cost rises. This implies that to keep thedetection cost low, the number of missed SLA violation must be low.
Considering the total cost of monitoring the fish POV-Ray application inTable 1.5 and Figure 1.10(a), it can be seen that the reference measurement isnot the cheapest although it does not incur any cost of missing SLA violationdetection. In this case the 10-second interval is the cheapest and in our opinionthe most suited measurement interval for this application. In the case of boxPOV-Ray application the total cost of monitoring, as shown in Table 1.5and depicted graphically in Figure 1.10(b), indicates that the lowest cost isincurred with the 10-second measurement interval. Thus we conclude thatthis interval is best suited for this application. Also from Table 1.5 and Figure1.10(c), it is clear that the reference measurement by far does not representthe optimal measurement interval for the vase POV-Ray application. Basedon the application behavior, longer measurement intervals are better fittedthan shorter ones. Therefore, in this case the 20-second measurement intervalis best suited for the considered scenario.
Based on our experiments, it is observed that there is no best suited mea-surement interval for all applications. Depending on how steady the resourceconsumption is, the monitoring infrastructure requires different measurementintervals. Note that the architecture can be configured to work with differentintervals. In this case, specification of the measurement frequencies dependson policies agreed by users and providers.
SOA and QoS Management for Cloud Computing 25
0 50 100 150 200 250 300 350 400 450
5s 10s 20s 30s 1min 2min
Time [secon
ds]
Measurement Interval
Measurement cost Missing Detec6on cost
(a) Fish.
0 20 40 60 80
100 120 140 160 180 200
5s 10s 20s 30s 1min 2min
Time [secon
ds]
Measurement Interval
Measurement cost Missing Detec8on cost
(b) Box.
0
20
40
60
80
100
120
140
5s 10s 20s 30s 1min 2min
Time [secon
ds]
Measurement Interval
Measurement cost Missing Detec8on Cost
(c) Vase.
FIGURE 1.10POV-Ray application cost relations.
1.7 Conclusion and Future Work
Flexible and reliable management of SLA agreements represents an open re-search issue in Cloud computing infrastructures. Advantages of flexible andreliable Cloud infrastructures are manifold. For example, preventions of SLAviolations avoids unnecessary penalties provider has to pay in case of violationsthereby maximizing the profit of the provider. Moreover, based on flexible andtimely reactions to possible SLA violations, interactions with users can beminimized. In this book chapter we presented LoM2HiS framework— a novelframework for monitoring low-level Cloud resource metrics, mapping them tohigh-level SLA parameters, using the mapped values and predefined thresh-olds to monitor the SLA objectives at runtime, detecting and reporting SLAviolation threats or real violations situations. We also presented the knowl-

26 Cloud Computing: Methodology, System, and Applications
edge management technique based on Case-Based Reasoning for managingthe SLA violation situation and proposing preventive or corrective actions.
We evaluated our system using a use-case scenario consisting of image ren-dering applications based on POV-Ray with heterogeneous workloads. Theevaluation is focused on the goal of finding an optimal measurement intervalfor monitoring application SLA objectives at runtime. From our experimentswe observed that there is no particular suited measurement interval for all ap-plications. It is easier to identify optimal intervals for applications with steadyresource consumption, such as the ‘vase’ POV-Ray animation. However, ap-plications with variable resource consumption require dynamic measurementintervals. Our framework can be extended to tackle such applications but thiswill be in the scope of our future work.
Currently on FoSII project, we are working toward integrating the knowl-edge management with the LoM2HiS framework in order to achieve a completesolution pack for the SLA management. Furthermore, we will design and im-plement an actuator component for applying the proposed actions from theknowledge database on the Cloud resources.
Thus, in the future besides our investigation on dynamic measurement in-tervals, we will evaluate the influence of such intervals on the quality of thereactive actions proposed by the knowledge database. If the effects of measure-ment intervals are known, best reactive actions may be taken, contributing toour vision of flexible and reliable on-demand computing via fully autonomicCloud infrastructures.
Acknowledgments
This work is supported by the Vienna Science and Technology Fund (WWTF)under grant agreement ICT08-018 Foundations of Self-governing ICT Infras-tructures (FoSII). We would like to thank Marco A. S. Netto for his supportin carrying out the evaluations. The experiments were performed in the HighPerformance Computing Lab at Catholic University of Rio Grande do Sul(LAD-PUCRS)Brazil.
Bibliography
[1] FreeCBR, http://freecbr.sourceforge.net/.
[2] Agnar Aamodt and Enric Plaza. Case-based reasoning: Foundationalissues, methodological variations, and system approaches. AI Communi-cations, 7:39–59, 1994.
[3] ActiveMQ. Messaging and integration pattern provider.http://activemq.apache.org/.
[4] M. Boniface, S. C. Phillips, A. Sanchez-Macian, and M. Surridge. Dy-namic service provisioning using GRIA SLAs. In International Workshopson Service-Oriented Computing (ICSOC’07), 2007.
[5] Ivona. Brandic. Towards self-manageable cloud services. In 33rd An-nual IEEE International Computer Software and Applications Confer-ence (COMPSAC’09), 2009.
[6] Ivona Brandic, Dejan Music, Philipp Leitner, and Schahram Dustdar.Vieslaf framework: Enabling adaptive and versatile sla-management. InProceedings of the 6th International Workshop on Grid Economics andBusiness Models, GECON ’09, pages 60–73, 2009.
[7] Brein. Business objective driven reliable and intelligent grids for realbusiness. http://www.eu-brein.com/.
[8] R. Buyya, C. S. Yeo, S. Venugopal, J. Broberg, and I. Brandic. Cloudcomputing and emerging IT platforms: Vision, hype, and reality for deliv-ering computing as the 5th utility. Future Generation Computer Systems,25(6):599–616, 2009.
[9] R. N. Calheiros, R. Buyya, and C. A. F. De Rose. Building an automatedand self-configurable emulation testbed for grid applications. Software:Practice and Experience, 40(5):405–429, 2010.
[10] M. Comuzzi, C. Kotsokalis, G. Spanoudkis, and R. Yahyapour. Estab-lishing and monitoring SLAs in complex service based systems. In IEEEInternational Conference on Web Services 2009, 1009.
[11] A. D’Ambrogio and P. Bocciarelli. A model-driven approach to describeand predict the performance of composite services. In 6th InternationalWorkshop on Software and Performance (WOSP’07), 2007.
27
28 Cloud Computing: Methodology, System, and Applications
[12] G. Dobson and A. Sanchez-Macian. Towards unified QoS/SLA ontologies.In IEEE Services Computing Workshops (SCW’06), 2006.
[13] Vincent. C. Emeakaroha, I. Brandic, M. Maurer, and S. Dustdar. Lowlevel metrics to high level SLAs - LoM2HiS framework: Bridging the gapbetween monitored metrics and SLA parameters in cloud environments.In High Performance Computing and Simulation Conference (HPCS’10),2010.
[14] Vincent C. Emeakaroha, Rodrigo N. Calheiros, Marco A. S. Netto, IvonaBrandic, and Cesar A. F. De Rose. DeSVi: An architecture for detect-ing SLA violations in cloud computing infrastructures. In Proceedingsof the 2nd International ICST Conference on Cloud Computing (Cloud-Comp’10), 2010.
[15] ESPER. Event stream processing. http://esper.codehaus.org/.
[16] FoSII. Foundations of self-governing infrastructures.http://www.infosys.tuwien.ac.at/linksites/FOSII/index.html.
[17] H. M. Frutos and I. Kotsiopoulos. BREIN: Business objective drivenreliable and intelligent grids for real business. International Journal ofInteroperability in Business Information Systems, 3(1):39–42, 2009.
[18] W. Fu and Q. Huang. GridEye: A service-oriented grid monitoring systemwith improved forecasting algorithm. In International Conference onGrid and Cooperative Computing Workshops, 2006.
[19] A. S. Glassner et al. An introduction to ray tracing. Academic PressLondon, 1989.
[20] D. Gunter, B. Tierney, B. Crowley, M. Holding, and J. Lee. Netlogger:A toolkit for distributed system performance analysis. In 8th Interna-tional Symposium on Modeling, Analysis and Simulation of Computerand Telecommunication Systems (MASCOTS’00), 2000.
[21] Mark Hefke. A framework for the successful introduction of KM usingCBR and semantic web technologies. Journal of Universal ComputerScience, 10(6), 2004.
[22] JMS. Java messaging service. http://java.sun.com/products/jms/.
[23] J. O. Kephart and D. M. Chess. The vision of autonomic computing.IEEE Computer, 36(1):41–50, 2003.
[24] B. Koller and L. Schubert. Towards autonomous sla management usinga proxy-like approach. Multiagent Grid Systems, 3(3):313–325, 2007.
[25] Cynthia Bailey Lee and Allan Snavely. On the user-scheduler dialogue:Studies of user-provided runtime estimates and utility functions. Int. J.High Perform. Comput. Appl., 20(4):495–506, 2006.
SOA and QoS Management for Cloud Computing 29
[26] Kevin Lee, Norman W. Paton, Rizos Sakellariou, and A. A. FernandesAlvaro. Utility driven adaptive worklow execution. In CCGRID ’09: Pro-ceedings of the 2009 9th IEEE/ACM International Symposium on ClusterComputing and the Grid, pages 220–227, Washington, DC, USA, 2009.IEEE Computer Society.
[27] M. L. Massie, B. N. Chun, and D. E. Culler. The Ganglia distributed mon-itoring system: Design, implementation and experience. Parallel Comput-ing, 30(7):817–840, 2004.
[28] M. Maurer, I. Brandic, V. C. Emeakaroha, and S. Dustdar. Towardsknowledge management in self-adaptable clouds. In 4th InternationalWorkshop of Software Engineering for Adaptive Service-Oriented Systems(SEASS’10), 2010.
[29] F. Rosenberg, C. Platzer, and S. Dustdar. Bootstrapping performanceand dependability attributes of web services. In IEEE International Con-ference on Web Services (ICWS’06), 2006.
[30] SAX. Simple API for XML. http://sax.sourceforge.net/.
[31] Wolfgang Theilmann, Ramin Yahyapour, and Joe Butler. Multi-level slamanagement for service-oriented infrastructures. In Proceedings of the 1stEuropean Conference on Towards a Service-Based Internet, ServiceWave’08, pages 324–335, 2008.
[32] T. Wood, P. J. Shenoy, A. Venkataramani, and M. S. Yousif. Sandpiper:Black-box and gray-box resource management for virtual machines. Com-puter Networks, 53(17):2923–2938, 2009.
[33] Chee Shin Yeo and Rajkumar Buyya. Pricing for utility-driven resourcemanagement and allocation in clusters. Int. J. High Perform. Comput.Appl., 21(4):405–418, 2007.