a snapshot of drinking water and sanitation in south-eastern asia and the pacific
DESCRIPTION
World Health Organization (WHO), United Nations Children's Fund (UNICEF). 2008 This document provides an assessment of the population currently using an improved drinking-water source and basic sanitation disaggregated by urban and rural areas. It details regional and country progress towards the Millennium Development Goal (MDG) target for drinking-water supply and sanitation (target 7c) in South-East Asia and the Pacific.TRANSCRIPT

i
A Snapshot of Drinking Water and Sanitation in South-eastern Asia and the Pacific A regional perspective based on the 2008 Report of the WHO/UNICEF Joint Monitoring Programme for Water Supply and Sanitation
Prepared as a contribution to Sanitation and Water 2008
A World Vision/AusAid Conference October 27-29, 2009 Melbourne, Australia

ii
© UNICEF and World Health Organization, 2008 All rights reserved. The designations employed and the presentation of the material in this document do not imply the expression of any opinion whatsoever on the part of UNICEF or the World Health Organization concerning the legal status of any country, territory, city or area or of its authorities, or concerning the delimitation of its frontiers or boundaries. Dotted lines on maps represent approximate border lines for which there may not yet be full agreement. Indicator definitions and population estimates used for MDG monitoring sometimes differ from those used by national governments, hence the coverage estimates presented in this report may be different from those used nationally, even when based on common data sources. UNICEF and the World Health Organization do not warrant that the information contained in this document is complete and correct and shall not be liable for any damages incurred as a result of its use. UNICEF and the World Health Organization welcome requests for permission to reproduce or translate their publications – whether for sale or for noncommercial distribution. Applications and enquiries should be addressed to UNICEF, Division of Communication, 3 United Nations Plaza, New York 10017, USA (fax: +1 212 303 7985; e-mail: [email protected]) or to WHO, Office of Publications, 20 Avenue Appia, 1211 Geneva 27, Switzerland (tel: +41 22 791 3264; fax: +41 22 791 4806; e-mail: [email protected]). Data used in this document are subject to revision. Printed in New York
iii
Cover: UNICEF
Table of Contents
Introduction ………………………………………………………………… 1 Purpose of the Snapshot …………………………………………………... 1 Definitions of access to drinking water and sanitation ..………………… 1 Access to Sanitation – Basic facts and figures ………………………….. 3 Access to Drinking Water – Basic facts and figures …………………….. 4 Access to Sanitation – the sanitation ladder …………………………….. 5 Access to Drinking Water – the drinking water ladder .………………….. 6 Disparities in urban and rural sanitation coverage ………………………. 7 Disparities in urban and rural drinking water coverage …………………. 8 South-eastern Asia is on track to meet the MDG sanitation target ………. 9 South-eastern Asia is on track to meet the MDG drinking water target …. 10 Water and Sanitation in countries in the Pacific ……………………………... 11 JMP methodology …………………………………………………………… 12 Current sanitation situation at a glance … ……………………………….. 13 Current drinking water situation at a glance …………………………….. 15

1
Introduction The WHO/UNICEF Joint Monitoring Programme for Water Supply and Sanitation (JMP) is the official United Nations mechanism tasked with monitoring progress towards MDG Target 7c on drinking water and sanitation. JMP publishes updated coverage estimates every two years on the various types of drinking- water sources and sanitation facilities being used worldwide. Purpose of the Snapshot This document has been prepared by JMP as a contribution to the World Vision – AusAid Sanitation and Water 2008 Conference, October 27-29, 2008 in Melbourne Australia. It contains a set of drinking water and sanitation coverage estimates for South-eastern Asia and the Pacific based on the most recent JMP estimates (2006). This document provides an assessment of the population currently using an improved drinking-water source and basic sanitation disaggregated by urban and rural areas. It details regional and country progress towards the Millennium Development Goal (MDG) target for drinking-water supply and sanitation (target 7c) in South-eastern Asia. For half of the 22 countries in the Pacific region there are insufficient data to assess progress towards the MDG drinking water and sanitation targets. This report therefore includes only one page on the island states in the Pacific in addition to the individual country data provided in the back of the report. The estimates presented in this document are drawn from data collected by national statistics offices and other relevant institutions through national censuses and nationally representative household surveys, including Demographic and Health Surveys (DHS), Multiple Indicator Cluster Surveys (MICS) and World Health Surveys among others. Definitions of access to drinking water and sanitation MDG Target 7c calls on countries to "Halve, by 2015, the proportion of people without sustainable access to safe drinking-water and basic sanitation." The indicators used in this document to assess the proportion of people with sustainable access to safe drinking water and to basic sanitation are the official MDG indicators: The proportion of population using an improved drinking-water source, urban and rural The proportion of population using an improved sanitation facility, urban and rural. An improved drinking-water source is defined as one that, by nature of its construction or through active intervention, is protected from outside contamination, in particular from contamination with fecal matter. To allow for international comparability of estimates, JMP uses the following classification to differentiate between "improved" and "unimproved" drinking-water sources. Improved drinking water sources Unimproved drinking water sources Piped water into dwelling, plot or yard Public tap/standpipe Tubewell/borehole Protected dug well Protected spring Rainwater
Unprotected dug well Unprotected spring Small cart with tank/drum Tanker truck Surface water (river, dam, lake, pond, stream, channel, irrigation channel) Bottled water1
1 Bottled water is considered to be improved only when the household uses water from another improved source for cooking and personal hygiene; where this information is not available, bottled water is classified on a case-by- case basis.
A Snapshot of Drinking Water and Sanitation in South-eastern Asia

2
An improved sanitation facility is defined as one that hygienically separates human excreta from human contact. To allow for international comparability of estimates, JMP uses the following classification to differentiate between "improved" and "unimproved" types of sanitation facility Improved sanitation facilities2 Unimproved sanitation facilities Flush or pour-flush to:
- piped sewer system - septic tank - pit latrine
Ventilated improved pit latrine (VIP) Pit latrine with slab Composting toilet
Flush or pour-flush to elsewhere 3 Pit latrine without slab or open pit Bucket Hanging toilet or hanging latrine No facilities or bush or field (open defecation) Public or shared facilities
NB: Only users of "improved" drinking-water sources, and "improved" sanitation facilities are considered by JMP as "having access" as stated in the MDG Target. Indicator definitions and population estimates used for MDG monitoring sometimes differ from those used by national governments. Hence the coverage estimates presented in this report may differ from those used nationally, even when based on common data sources. The population estimates presented here and the urban/rural distribution of the population are those estimated by the United Nations Population Division (2006 revision). The regional analyses presented here is according to the following geographical sub-division:
South-eastern Asia Pacific (Oceania) Brunei Darussalam Cambodia Indonesia Lao People's Democratic Republic Malaysia Myanmar Philippines Singapore Thailand Timor-Leste Viet Nam
Cook Islands Federated States of Micronesia Fiji French Polynesia Guam Kiribati Marshall Islands Nauru Niue Northern Mariana Islands Palau Papua New Guinea Samoa Solomon Islands Tokelau Tonga Tuvalu Vanuatu Wallis and Futuna Islands
2 Only facilities which are not shared or public are considered improved. 3 Excreta are flushed to the street, yard or plot, open sewer, a ditch, a drainage way or other location.
A Snapshot of Drinking Water and Sanitation in South-eastern Asia

3
Access to Sanitation – Basic facts and figures
378 million South-eastern Asians had access to improved sanitation facilities in 2006. Coverage increased from 50% in 1990 to 67% in 2006.
The South-eastern Asian population without access to sanitation decreased by 32 million, from 219 million in 1990 to 187 million in 2006. Increases in coverage outpace population growth.
The rate at which South-eastern Asians gained access to sanitation, 156 million people since 1990, is sufficient to meet the MDG sanitation target.
In four of the eleven countries in South-eastern Asia sanitation coverage is less than 60%.
Figure 1: Coverage with improved sanitation facilities, South-eastern Asia, 2006
Basic Facts and Figures South-eastern Asia: in percentage
Population (millions)
Population using improved sanitation
Population using shared sanitation
Population using unimproved* sanitation
Population practising open defecation
Urban Rural Total Urban Rural Total Urban Rural Total Urban Rural Total Urban Rural Total 1990 139 301 441 74% 40% 50% 8% 4% 5% 6% 21% 17% 12% 35% 28%
2000 206 314 520 77% 51% 61% 9% 5% 6% 3% 15% 11% 11% 29% 22%
2006 253 312 565 78% 58% 67% 8% 5% 7% 4% 13% 8% 10% 24% 18%2015 326 302 628 - - 75%** - - - - - - - - -
Basic Facts and Figures South-eastern Asia: by population
Population (millions)
Population using improved sanitation
(millions)
Population using shared sanitation
(millions)
Population using unimproved* sanitation
(millions)
Population practising open defecation
(millions)
Urban Rural Total Urban Rural Total Urban Rural Total Urban Rural Total Urban Rural Total 1990 139 301 441 103 120 222 11 13 24 8 62 72 17 106 123
2000 206 314 520 158 160 318 18 15 33 7 48 55 23 91 114
2006 253 312 565 197 181 378 21 17 38 9 38 47 26 76 1022015 326 302 628 - - 471** - - - - - - - - -
* excludes shared facilities and open defecation, ** MDG target
Percentage population using an improved sanitation facility, 2006
Less than 50%
51% - 75%
76% - 90%
91% - 100%
No or insufficient data

4
Basic Facts and Figures South-eastern Asia: by population
Population (millions)
Population using improved drinking
water sources (millions)
Population using piped water on
premises (millions)
Population using other improved drinking water
sources (millions)
Population using unimproved drinking
water sources (millions)
Urban Rural Total Urban Rural Total Urban Rural Total Urban Rural Total Urban Rural Total 1990 139 301 441 129 193 322 58 12 69 71 181 253 10 108 119
2000 206 314 520 190 229 419 100 35 135 90 194 284 16 85 101
2006 253 312 565 234 253 487 134 45 178 100 208 309 19 59 782015 326 302 628 - - 546** - - - - - - - - -
* includes piped water on premises and other improved drinking water sources, ** MDG target
Access to Drinking Water – Basic facts and figures
487 million people in South-eastern Asia had access to improved drinking water sources in 2006. Coverage increased from 73% in 1990 to 86% in 2006.
The South-eastern Asian population without access to improved drinking water sources has decreased by 41 million, from 119 million in 1990 to 78 million in 2006. Increases in coverage outpaced population growth
The rate at which South-eastern Asians gained access to improved drinking water sources, 165 million people since 1990, has led to the region being very close to reaching the MDG target in 2006, nine years ahead of 2015.
In only three countries in South-eastern Asia is access to improved drinking water sources less than 75%
Basic Facts and Figures South-eastern Asia: in percentage
Population (millions)
Drinking water coverage*
Piped connections on premises
Other improved drinking water sources
Unimproved drinking water sources
Urban Rural Total Urban Rural Total Urban Rural Total Urban Rural Total Urban Rural Total 1990 139 301 441 92% 64% 73% 41% 4% 16% 51% 60% 57% 8% 36% 27%
2000 206 314 520 92% 73% 81% 48% 11% 26% 44% 62% 55% 8% 27% 19%
2006 253 312 565 92% 81% 86% 53% 14% 32% 39% 67% 54% 8% 19% 14%2015 326 302 628 - - 87%** - - - - - - - - -
Figure 2: Coverage with improved drinking water sources, South-eastern Asia, 2006 Percentage of population using an improved drinking water source, 2006
Less than 50%
51%- 75%
76% - 90%
91% - 100%
No or insufficient data

5
74 78
88
6 4
12 10
Cov
erag
e (p
erce
ntag
e)
40
58
5
4
21
13
35
24
67
50
5
7
8
17
1828
Figure 3: Trends in the proportion of population using either an improved, or shared, or unimproved
sanitation facility, or practising open defecation, urban, rural & total, 1990 – 2006
Two-thirds of the population in South-eastern Asia use an improved sanitation facility; but almost one in five practises open defecation
Access to Sanitation - the sanitation ladder
1990 2006 1990 2006 1990 2006
Improved facilities: ensure hygienic separation of human excreta from human contact.
Unimproved facilities: do not ensure hygienic separation of human excreta from human contact
Open Defecation: when human feces are disposed off in open spaces such as fields, forests, the bush, open bodies of water, the beach etc. or disposed off with solid waste
Shared facilities: are of an otherwise improved type shared between two or more households. Shared facilities include public toilets.
Whereas only 50 percent of the population in South-eastern Asia used an improved sanitation facility in 1990, in 2006 two thirds of the population (67 per cent) used one.
The practice of sharing a facility of an otherwise acceptable type is more prevalent in urban areas than in rural areas of South-eastern Asia
The proportion of the population using an unimproved sanitation facility more than halved from 17% in 1990 to 8 per cent in 2006.
The practice of open defecation in South-eastern Asia dropped from 28 per cent in 1990, to 18 percent in 2006
Urban Rural Total

6
The proportion of the population with a piped drinking water supply into their dwelling, plot or yard has doubled from 16 per cent in 1990 to 32 per cent in 2006.
The proportion of the population using an unimproved source as their main source of drinking water has almost halved from 27 per cent in 1990 to 14 per cent in 2006.
The proportion of the urban population that relies on an unimproved source remained steady at 8 percent since 1990.
41
53
3951
8 8
Cov
erag
e (p
erce
ntag
e)
144
60
67
19
36
32
16
57
54
1427
Figure 4: Trends in the proportion of population using either, a piped connection on premises, another improved
drinking water source or unimproved drinking water source, urban, rural & total, 1990-2006
Access to Drinking Water - the drinking water ladder
86 per cent of the population in South-eastern Asia uses an improved source as their main source of drinking water
Unimproved drinking water sources
1990 2006 1990 2006 1990 2006
Improved drinking w
ater sources
Piped water on
premises
Other im
proved sources
Urban Rural Total
7
0
50
100
150
200
250
300
350
1990 2006
Popu
latio
n (m
illio
ns)
Improved Shared Unimproved Open defecation
0
50
100
150
200
250
300
350
1990 2006
Popu
latio
n (m
illio
ns)
Improved Shared Unimproved Open defecation
17
106
76
26
0
20
40
60
80
100
120
Urban Rural
Peop
le (m
illio
ns)
1990 2006
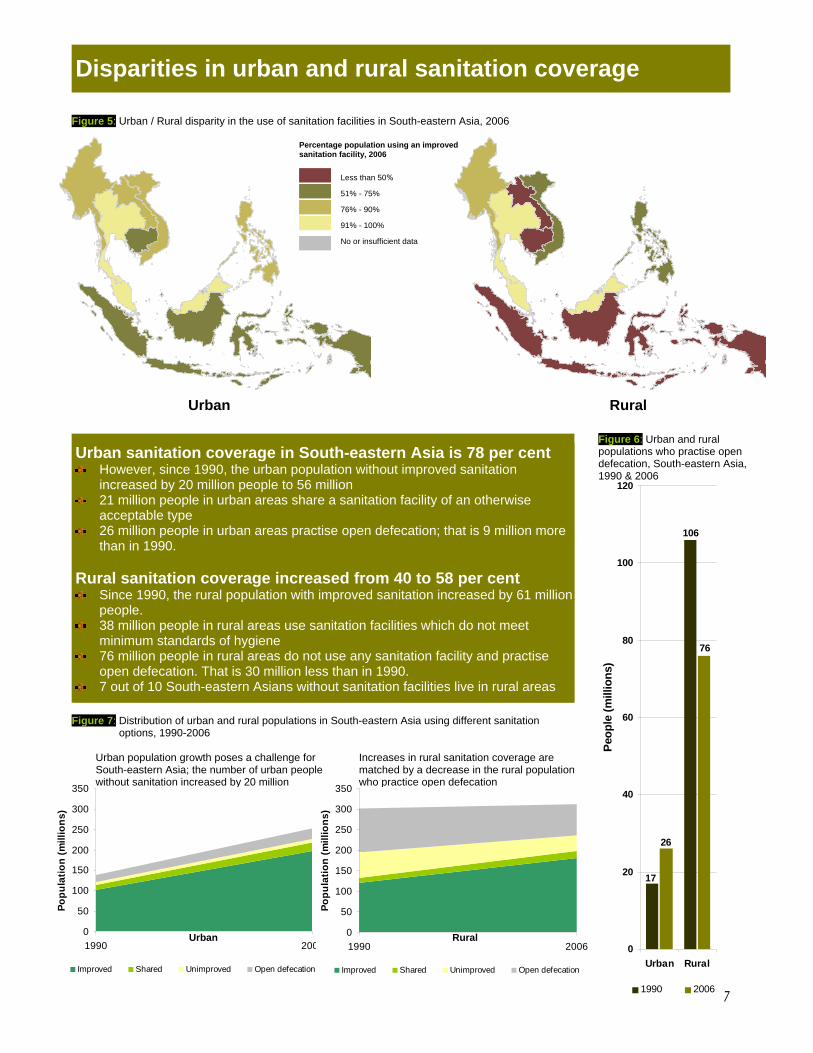
Figure 5: Urban / Rural disparity in the use of sanitation facilities in South-eastern Asia, 2006
Figure 6: Urban and rural populations who practise open defecation, South-eastern Asia, 1990 & 2006
Figure 7: Distribution of urban and rural populations in South-eastern Asia using different sanitation options, 1990-2006
Disparities in urban and rural sanitation coverage
Urban Rural
Urban sanitation coverage in South-eastern Asia is 78 per cent However, since 1990, the urban population without improved sanitation
increased by 20 million people to 56 million 21 million people in urban areas share a sanitation facility of an otherwise
acceptable type 26 million people in urban areas practise open defecation; that is 9 million more
than in 1990. Rural sanitation coverage increased from 40 to 58 per cent
Since 1990, the rural population with improved sanitation increased by 61 million people.
38 million people in rural areas use sanitation facilities which do not meet minimum standards of hygiene
76 million people in rural areas do not use any sanitation facility and practise open defecation. That is 30 million less than in 1990.
7 out of 10 South-eastern Asians without sanitation facilities live in rural areas
Urban Rural
Urban population growth poses a challenge for South-eastern Asia; the number of urban people without sanitation increased by 20 million
Increases in rural sanitation coverage are matched by a decrease in the rural population who practice open defecation
Percentage population using an improved sanitation facility, 2006
Less than 50%
51% - 75%
76% - 90%
91% - 100%
No or insufficient data

8
0
50
100
150
200
250
300
350
1990 2006
Popu
latio
n (m
illio
ns)
Piped on premises Other improved Unimproved
0
50
100
150
200
250
300
350
1990 2006
Popu
latio
n (m
illio
ns)
Piped on premises Other improved Unimproved
108
10
19
59
0
20
40
60
80
100
120
Urban Rural
Peop
le (m
illio
ns)
1990 2006
Figure 8: Urban / Rural disparity in the use of improved drinking water sources in South-eastern Asia, 2006
Figure 9: Urban and rural populations without an improved drinking water source, South-eastern Asia, 1990 &2006
Figure 10: Distribution of urban & rural populations in South-eastern Asia using different drinking water sources,1990-2006
Disparities in urban and rural drinking water coverage
Urban Rural
Urban drinking water coverage in South-eastern Asia is 92 per cent
Since 1990, 105 million people in urban areas have gained access to an improved drinking water source.
Of the 253 million people in urban areas, 134 million have a piped connection on premises, up by 76 million from 1990.
Since 1990, the urban population without access to an improved drinking water source increased by 9 million people to 19 million people in 2006
Rural drinking water coverage increased from 64 to 81 per cent
Since 1990, 60 million people in rural areas gained access to an improved drinking water source
Of the 312 million people in rural areas, 45 million have a piped connection on premises while 208 million use other improved drinking water sources.
Since 1990, the rural population without access to improved drinking water sources decreased by 49 million people to 59 million people in 2006
Three out of four South-eastern Asians without access to an improved drinking
Percentage of population using an improved drinking water source, 2006
Less than 50%
51%- 75%
76% - 90%
91% - 100%
No or insufficient data

9
Figure 12: Average number of people that gained or need to gain access to improved sanitation 1990 – 2006 and 2006 - 2015
Figure 13: Sanitation coverage trend 1990 – 2015 and coverage trend required to meet the MDG sanitation target, 2006 - 2015
Yearly 10.3 million people need to gain access to improved sanitation to meet the MDG target
10.3
9.8
0 2 4 6 8 10 12
2006 - 2015
1990 - 2006
People (millions)
50
677577
0
20
40
60
80
100
Cove
rage
(%)
1990 2006 2015
T rend required for MDG targetSanitation trend
Note: The boundaries and names shown and the designations used on this map do not imply official endorsement or acceptance by the United Nations.
No or insufficient data
On track
Not on track
Progress but insufficient
Coverage in 2006 was less than 5 per cent below the rate it needed to be for the country to reach the MDG target, or coverage was higher than 95%
Coverage in 2006 was 5 per cent to 10 per cent below the rate it needed to be for the country to reach the MDG target
Data were insufficient to estimate trends
Coverage in 2006 was more than 10 per cent below the rate it needed to be for the country to reach the MDG target, or the 1990 - 2006 trend shows unchanged or decreasing coverage
Figure 11: Progress towards the MDG sanitation target, by country, 2006
South-eastern Asia is on track to meet the MDG sanitation target
To meet the MDG sanitation target, coverage needs to increase from 67 per cent in 2006 to 75 per cent in 2015
Three countries in South-eastern Asia have already met the MDG sanitation target, two are on track for doing so, and two are not on track; for four countries there are insufficient data to assess progress towards the target.
To meet the MDG sanitation target 10.3 million people need to gain access to an improved sanitation facility.
When the MDG sanitation target is met, 157 million South-eastern Asians will still be without sanitation.
10
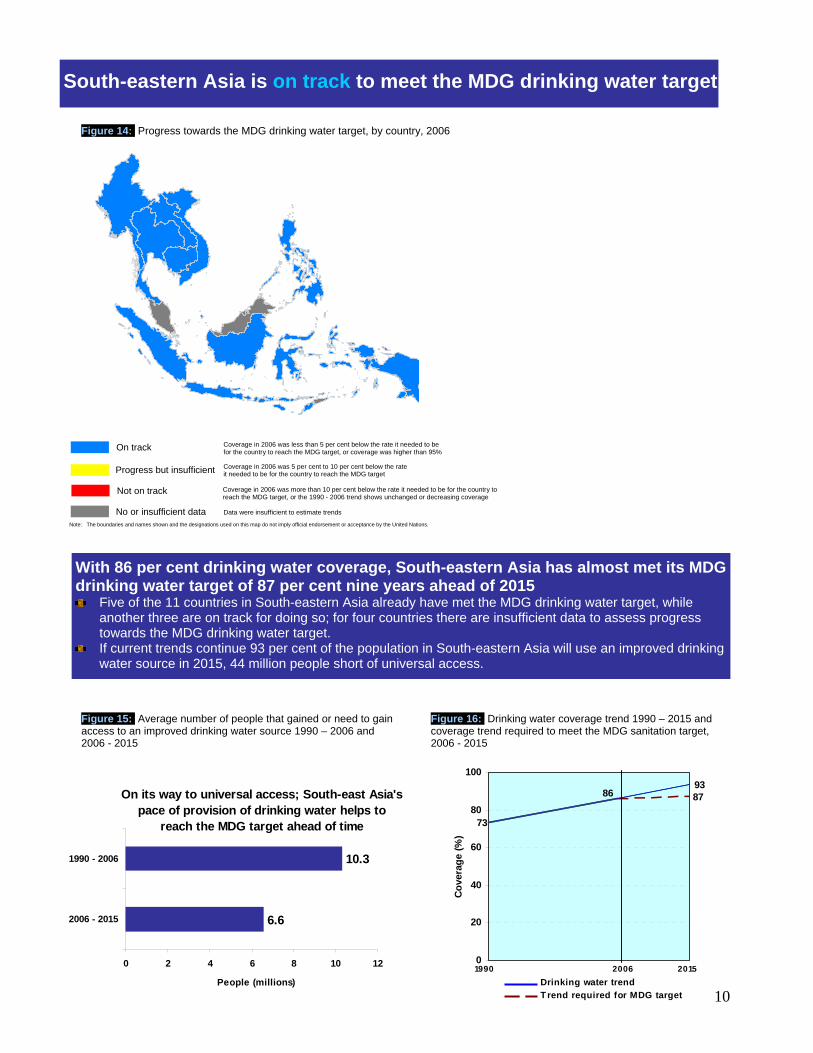
Figure 15: Average number of people that gained or need to gain access to an improved drinking water source 1990 – 2006 and 2006 - 2015
On its way to universal access; South-east Asia's pace of provision of drinking water helps to
reach the MDG target ahead of time
6.6
10.3
0 2 4 6 8 10 12
2006 - 2015
1990 - 2006
People (millions)
73
878693
0
20
40
60
80
100
Cove
rage
(%)
1990 2006 2015
T rend required for MDG targetDrinking water trend
Note: The boundaries and names shown and the designations used on this map do not imply official endorsement or acceptance by the United Nations.
No or insufficient data
On track
Not on track
Progress but insufficient
Coverage in 2006 was less than 5 per cent below the rate it needed to be for the country to reach the MDG target, or coverage was higher than 95%
Coverage in 2006 was 5 per cent to 10 per cent below the rate it needed to be for the country to reach the MDG target
Data were insufficient to estimate trends
Coverage in 2006 was more than 10 per cent below the rate it needed to be for the country to reach the MDG target, or the 1990 - 2006 trend shows unchanged or decreasing coverage
Figure 14: Progress towards the MDG drinking water target, by country, 2006
With 86 per cent drinking water coverage, South-eastern Asia has almost met its MDG drinking water target of 87 per cent nine years ahead of 2015
Five of the 11 countries in South-eastern Asia already have met the MDG drinking water target, while another three are on track for doing so; for four countries there are insufficient data to assess progress towards the MDG drinking water target.
If current trends continue 93 per cent of the population in South-eastern Asia will use an improved drinking water source in 2015, 44 million people short of universal access.
Figure 16: Drinking water coverage trend 1990 – 2015 and coverage trend required to meet the MDG sanitation target, 2006 - 2015
South-eastern Asia is on track to meet the MDG drinking water target

11
Availability of updated nationally representative data on access to safe drinking water and basic sanitation for the Small Island States located in the Pacific is limited. The JMP has data on file for 17 of the 19 countries in the region, but as is illustrated in the table below, these data are often several years old.
When available, data often are not sufficiently disaggregated by type of drinking water or sanitation facility. This complicates estimating regional averages for different steps of the drinking water and sanitation ladders. The JMP calculates regional estimates only when data are available covering more than 50 per cent of the regional population. For the Pacific Islands there were not enough data available to estimate urban coverage by piped connections and urban coverage for those sharing a sanitation facility or those practicing open defecation.
Water and Sanitation in countries in the Pacific
Country Latest nationally representative survey or census on file
Country Latest nationally representative survey or census on file
Cook Islands Census 2001 Palau Census 2000 Fiji Reported 1999 Papua New Guinea DHS 1996* French Polynesia Reported 1999 Samoa Census 2001 Guam Census 1990 Solomon Islands Reported 1999 Kiribati Census 2000 Tokelau Census 2002 Marshall Islands Census 1999 Tonga Census 1986 Federated States of Micronesia Census 2000 Tuvalu Census 2002 Niue Census 2001 Vanuatu Census 1998 Northern Mariana Islands Census 2000 * results of the PNG DHS 2006 were not yet available when the JMP 2008 report was prepared
Drinking Water Basic Facts and Figures Pacific Islands: in percentage
Population (millions)
Drinking water coverage*
Piped connections on premises
Other improved drinking water sources
Unimproved drinking water sources
Urban Rural Total Urban Rural Total Urban Rural Total Urban Rural Total Urban Rural Total 1990 1.5 5.0 6.4 92% 39% 51% - 7% - - 32% - 8% 61% 49%
2000 1.9 6.2 8.1 - 41% - - 9% - - 32% - - 59% -
2006 2.2 7.0 9.2 91% 37% 50% - 6% - - 31% - 9% 63% 50%2015 2.7 7.9 10.6 - - 76** - - - - - - - - -
** MDG target
Sanitation Basic Facts and Figures Pacific Islands: in percentage
Population (millions)
Population using improved sanitation
Population using shared sanitation
Population using unimproved* sanitation
Population practising open defecation
Urban Rural Total Urban Rural Total Urban Rural Total Urban Rural Total Urban Rural Total 1990 1.5 5.0 6.4 80% 44% 52% - 1% - 20% 34% 48% - 21% -
2000 1.9 6.2 8.1 81% 44% 52% - 1% - 19% 35% 48% - 20% -
2006 2.2 7.0 9.2 80% 43% 52% - 1% - 20% 36% 48% - 20% - 2015 2.7 7.9 10.6 - - 76%** - - - - - - - - -
* Urban and Total estimates for unimproved sanitation include the proportion of the population that shares a facility and the proportion that practices open defecation ** MDG target

12
The WHO/UNICEF Joint Monitoring Programme for Water Supply and Sanitation (JMP) is the official United Nations mechanism tasked with monitoring progress towards MDG Target 7c on drinking water and sanitation. JMP publishes updated coverage estimates every two years on the various types of drinking- water sources and sanitation facilities used worldwide. In line with the MDG indicator definition, which stipulates “use of improved facilities” as a proxy for “access to improved facilities”, the JMP measures and reports on the actual use of facilities. It is worth noting that the household surveys on which the JMP relies also measure “use” and not “access” – since access involves many additional criteria other than use. Measurability of many of these criteria at the national scale, which is the scale required by the JMP, poses a huge challenge. Data sources and MDG data base The water supply and sanitation coverage estimates presented in this report draw from data collected by national statistics offices and other relevant institutions through nationally-representative household surveys and national censuses. The survey data used are mainly drawn from Demographic and Health Surveys (DHS), Multiple Cluster Indicator Surveys (MICS), World Health Surveys (WHS), Living Standards and Measurements Surveys (LSMS), Core Welfare Indicator Questionnaires (CWIQ), Health and Nutrition Surveys, Household Budget Surveys and Reproductive Health Surveys. JMP estimates are therefore based on nationally generated and owned data, JMP assembles, reviews and assesses these household survey and census data. Population estimates The population estimates and the proportion of the population living in urban and rural areas used in this report are those estimated by the United Nations Population Division (2006 revision). These estimates may differ from national population estimates. Methodology to derive MDG coverage and progress estimates For each country, survey and census data are plotted on a time scale from 1980 to the present. A linear trend line, based on the least-squares method, is drawn through these data points to estimate coverage for 1990 and 2006. The total coverage estimates are based on the aggregate of the population weighted urban and rural coverage numbers, divided by the total population. Trend analysis at country level have been made for the following categories: Drinking water
- Piped water into dwelling, plot or yard - Improved drinking water sources
Sanitation - Improved sanitation facilities* - Open defecation
*The coverage estimates for improved sanitation facilities presented in this report are discounted by the proportion of the population that shared an improved type of sanitation facility. This ratio (the proportion of the population that shares a sanitation facility of an otherwise adequate type among two or more households) derived from the latest household survey/census is subsequently subtracted from the trend estimates of improved sanitation facilities. This results in the estimates for shared sanitation facilities. Differences with national coverage estimates Indicator definitions and population estimates used by the JMP sometimes differ from those used by national governments. Estimates have been computed by JMP to ensure compatibility between countries and over time; thus they are not necessarily the official statistics of the concerned states, which may use alternative rigorous methods.
JMP methodology

13
Sanitation coverage: Country and regional estimates by type of sanitation facility (1990 and 2006)
Region Year
Total Population
(thousands)
% Urban
Population Urban
(%) Rural (%)
Total (%)
Improved Shared UnimprovedOpen
Defecation Improved Shared UnimprovedOpen
Defecation Improved Shared UnimprovedOpen
Defecation
1990 257 66 - - - - - - - - - - - -Brunei Darussalam 2006 382 74 - - - - - - - - - - - -
1990 9,698 28 - - - - - - - - - - - -Cambodia 2006 14,197 36 62 6 1 31 19 4 0 77 28 4 0 68
1990 182,847 31 73 9 0 18 42 6 8 44 51 7 6 36Indonesia 2006 228,864 49 67 8 7 18 37 5 19 39 52 6 13 29
1990 4,076 15 - - - - - - - - - - - -Lao People's Democratic Republic 2006 5,759 21 87 5 2 6 38 1 5 56 48 2 4 46
1990 18,103 50 95 4 1 - - - - - - - - -Malaysia 2006 26,114 68 95 4 1 - 93 4 3 - 94 4 2 -
1990 40,147 25 47 6 44 3 15 2 55 28 23 3 52 22Myanmar 2006 48,379 31 85 10 4 1 81 11 0 8 82 11 1 6
1990 61,226 49 71 12 9 8 46 6 24 24 58 9 17 16Philippines 2006 86,264 63 81 13 1 5 72 10 4 14 78 12 2 8
1990 3,016 100 100 - 0 0 - - - - - - - -Singapore 2006 4,382 100 100 - 0 0 - - - - - - - -
1990 740 21 - - - - - - - - - - - -Timor Leste 2006 1,114 27 64 4 12 20 32 2 18 48 41 3 16 40
1990 54,291 29 92 5 1 2 72 3 1 24 78 4 0 18Thailand
2006 63,444 33 95 5 0 0 96 4 0 0 96 4 0 0
1990 66,173 20 62 3 17 18 21 1 45 33 29 1 40 30Viet Nam 2006 86,206 27 88 5 6 1 56 3 25 16 65 4 19 12
Pacific
1990 18 58 100 - 0 0 91 - 9 - 96 - 4 -Cook Islands
2006 14 75 100 - 0 0 100 - 0 0 100 - 0 0
1990 96 26 54 - 46 - 20 - 80 - 29 - 71 -Federated States of Micronesia 2006 111 22 61 - 39 - 14 - 86 - 25 - 75 -
1990 724 42 87 - 13 - 55 - 45 - 68 - 32 -Fiji 2006 833 51 87 - 13 - 55 - 45 - 71 - 29 -
1990 195 56 99 - 1 - 97 - 3 - 98 - 2 -French Polynesia 2006 259 52 99 - 1 - 97 - 3 - 98 - 2 -
1990 134 91 99 - 1 - 98 - 2 - 99 - 1 -Guam 2006 171 94 99 - 1 - 98 - 2 - 99 - 1 -
1990 72 35 26 7 26 41 20 2 13 65 22 4 17 57Kiribati 2006 94 52 46 13 0 41 20 2 25 53 33 8 12 47
1990 47 65 88 - 12 - 51 - 49 - 75 - 25 -Marshall Islands 2006 58 67 - - - - - - - - - - - -
1990 9 100 - - - - - - - - - - - -Nauru 2006 10 100 - - - - - - - - - - - -
1990 2 31 100 - 0 0 100 - 0 0 100 - 0 0Niue 2006 2 37 100 - 0 0 100 - 0 0 100 - 0 0
Current sanitation situation at a glance

14
Region Year
Total Population
(thousands)
% Urban
Population Urban
(%) Rural (%)
Total (%)
Improved Shared UnimprovedOpen
Defecation Improved Shared UnimprovedOpen
Defecation Improved Shared UnimprovedOpen
Defecation
1990 44 89 85 - 15 - 78 - 22 - 84 - 16 -Northern Mariana Islands
2006 82 95 94 - 6 - 96 - 4 - 94 - 6 -
1990 15 31 76 - 24 - 54 - 46 - 61 - 39 -Palau 2006 20 34 96 - 4 - 52 - 48 - 67 - 33 -
1990 4,131 13 67 10 19 4 41 1 38 20 44 2 36 18Papua New Guinea 2006 6,202 13 67 10 19 4 41 1 38 20 45 2 35 18
1990 161 21 100 - 0 0 98 - 2 - 98 - 2 -Samoa 2006 185 23 100 - 0 0 100 - 0 0 100 - 0 0
1990 314 14 98 - 2 - 18 - 82 - 29 - 71 -Solomon Islands 2006 484 17 98 - 2 - 18 - 82 - 32 - 68 -
1990 2 0 - - - - 39 - 61 - - - - -Tokelau
2006 1 0 - - - - 78 - 22 - - - - -
1990 95 23 98 - 2 - 96 - 4 - 96 - 4 -Tonga
2006 100 24 98 - 2 - 96 - 4 - 96 - 4 -
1990 9 41 83 - 17 - 74 - 26 - 78 - 22 -Tuvalu
2006 10 58 93 - 7 - 84 - 16 - 89 - 11 -
1990 149 19 - - - - - - - - - - - -Vanuatu
2006 221 24 - - - - - - - - - - - -
1990 14 0 - - - - - - - - - - - -Wallis and Futuna Islands 2006 15 0 - - - - - - - - - - - -Regional averages
1990 440,574 32 74 8 6 12 40 4 21 35 50 5 17 28South-eastern Asia 2006 565,105 45 78 8 4 10 58 5 13 24 67 7 8 18
1990 6,449 23 80 - 20 - 44 1 34 21 52 - 48 -Pacific 2006 9,175 24 80 - 20 - 43 1 36 20 52 - 48 -

15
Drinking water coverage: Country and regional estimates by type of drinking water source (1990 and 2006)
Region Year
Total Population
(thousands) % Urban Population
Urban (%)
Rural (%)
Total (%)
Total
Improved Piped
connectionsOther
improvedUn-
improvedTotal
ImprovedPiped
connectionsOther
improvedUn-
improved Total
Improved Piped
connectionsOther
Improved Un-
improved
1990 257 66 - - - - - - - - - - - -Brunei Darussalam 2006 382 74 - - - - - - - - - - - -
1990 9,698 13 - - - - - - - - - - - -Cambodia 2006 14,197 20 80 43 37 20 61 5 56 39 65 13 52 35
1990 182,847 31 92 26 66 8 63 2 61 37 72 9 63 28Indonesia 2006 228,864 49 89 34 55 11 71 7 64 29 80 20 60 20
1990 4,076 15 - - - - - - - - - - - -Lao People's Dem. Republic 2006 5,759 21 86 69 17 14 53 8 45 47 60 21 39 40
1990 18,103 50 100 98 2 0 96 - - 4 98 - - 2Malaysia 2006 26,114 68 100 98 2 0 96 87 9 4 99 95 4 1
1990 40,147 25 86 18 68 14 47 1 46 53 57 5 52 43Myanmar 2006 48,379 31 80 16 64 20 80 2 78 20 80 6 74 20
1990 61,226 49 92 37 55 8 75 8 67 25 83 22 61 17Philippines 2006 86,264 63 96 69 27 4 88 24 64 12 93 53 40 7
1990 3,016 100 100 100 0 0 - - - - - - - -Singapore 2006 4,382 100 100 100 0 0 - - - - - - - -
1990 54,291 29 98 78 20 2 94 13 81 6 95 32 63 5Thailand
2006 63,444 33 99 84 15 1 97 35 62 3 98 51 47 2
1990 740 21 - - - - - - - - - - - -Timor-Leste 2006 1,114 27 77 28 49 23 56 11 45 44 62 16 46 38
1990 66,173 20 87 38 49 13 43 1 42 57 52 8 44 48Viet Nam 2006 86,206 27 98 59 39 2 90 8 82 10 92 22 70 8
Pacific
1990 18 58 99 - - 1 87 - - 13 94 - - 6Cook Islands
2006 14 75 98 - - 2 88 - - 12 95 - - 5
1990 96 26 93 - - 7 86 - - 14 88 - - 12Federated States of Micronesia 2006 111 22 95 - - 5 94 - - 6 94 - - 6
1990 724 42 43 32 11 57 51 7 44 49 48 17 31 52Fiji 2006 833 51 43 32 11 57 51 7 44 49 47 20 27 53
1990 195 56 100 99 1 0 100 96 4 0 100 98 2 0French Polynesia 2006 259 52 100 99 1 0 100 96 4 0 100 98 2 0
1990 134 91 100 - - 0 100 - - 0 100 - - 0Guam
2006 171 94 100 - - 0 100 - - 0 100 - - 0
1990 72 35 76 46 30 24 33 13 20 67 48 24 24 52Kiribati 2006 94 52 77 49 28 23 53 22 31 47 65 36 29 35
1990 47 65 95 - - 5 97 - - 3 96 - - 4Marshall Islands 2006 58 67 - - - - - - - - - - - -
1990 9 100 - - - - - - - - - - - -Nauru 2006 10 100 - - - - - - - - - - - -
1990 2 31 100 100 0 0 100 - - 0 100 - - 0Niue 2006 2 37 100 100 0 0 100 - - 0 100 - - 0
Current drinking water situation at a glance

16
Region Year
Total Population
(thousands) % Urban Population
Urban (%)
Rural (%)
Total (%)
Total
Improved Piped
connectionsOther
improvedUn-
improvedTotal
ImprovedPiped
connectionsOther
improvedUn-
improved Total
Improved Piped
connectionsOther
Improved Un-
improved
1990 44 89 98 93 5 2 100 - - 0 98 - - 2Northern Mariana Islands 2006 82 95 98 - - 2 97 - - 3 98 - - 2
1990 15 31 73 - - 27 98 - - 2 90 - - 10Palau 2006 20 34 79 - - 21 94 - - 6 89 - - 11
1990 4,131 13 88 61 27 12 32 4 28 68 39 11 28 61Papua New Guinea 2006 6,202 13 88 61 27 12 32 4 28 68 40 12 28 60
1990 161 21 99 - - 1 89 - - 11 91 - - 9Samoa 2006 185 23 90 - - 10 87 - - 13 88 - - 12
1990 314 14 94 76 18 6 65 1 64 35 69 11 58 31Solomon Islands 2006 484 17 94 76 18 6 65 1 64 35 70 14 56 30
1990 2 0 - - - - 94 - - 6 - - - -Tokelau
2006 1 0 - - - - 88 - - 12 - - - -
1990 95 23 100 - - 0 100 - - 0 100 - - 0Tonga
2006 100 24 100 - - 0 100 - - 0 100 - - 0
1990 9 41 92 - - 8 89 - - 11 90 - - 10Tuvalu
2006 10 58 94 - - 6 92 - - 8 93 - - 7
1990 149 19 93 80 13 7 53 28 25 47 61 38 23 39Vanuatu
2006 221 24 - - - - - - - - - - - -
1990 14 0 - - - - 100 99 1 0 - - - -Wallis and Futuna Islands 2006 15 0 - - - - 100 99 1 0 - - - -Regional Averages
1990 440,574 32 92 41 51 8 64 4 60 36 73 16 57 27South-eastern Asia 2006 565,105 45 92 53 39 8 81 14 67 19 86 32 54 14
1990 6,449 23 92 - - 8 39 7 32 61 51 - - 49Pacific 2006 9,175 24 91 - - 9 37 6 31 63 50 - - 50

17