a review of losses arising during conservation of grass forage: part 2, storage losses
TRANSCRIPT

J. agric. Engng Res. (1990)45, 1-30
R E V I E W P A P E R
A Review of Losses Arising During Conservation of Grass Forage: Part 2, Storage Losses
M. B. McGEcI-IAN*
Information from the literature about hay and silage storage losses has been reviewed, compared and analysed. An attempt has been made to summarize the information in terms of relationships, suitable for incorporation in an operational research model of forage conservation.
Hay storage losses are low and can be related solely to moisture content. In contrast, silage storage losses are much larger, often 20% or more, and the subject is complex.
Silage storage losses have been subdivided according to the mechanism by which they arise into fermentation loss, air infiltration losses and effluent loss. Air infiltration losses arise when silos are filled, during the storage period, and while feeding out, and consist of both invisible losses through oxidation of nutrients, and silage which is visibly spoilt due to serious oxidation or overheating so it is unusable.
Experimental and modelling studies on the processes of fermentation of silage, air infiltration to silage, and the resulting losses, are discussed. Air infiltration losses are related to density and chop length, and information about values of these factors is also reviewed. From this information, a table of typical loss values has been assembled in relation to dry matter content, chop length, grass maturity, and the use of additives. These represent the best currently available average figures, bearing in mind some uncertainties and inconsis- tencies in the source material. However, for the forage conservation model, a long-term aim has been identified, namely, to express losses by values estimated from models of the physical processes, which are just now being developed.
Information about effluent loss was consistent across a number of sources; it could be summarized as a simple relationship between percentage loss and dry matter content.
1. Introduction In this paper, the very extensive literature on losses which take place during the
conservation of grass forage are reviewed, compared and analysed. Relationships are presented in equation, tabular or graphical form, to represent a reasonable consensus between the range of available sources, for incorporation in a new operational research model of conservation of grass forage. 1 Part 1 of the paper 2 covered losses which take place during field hay and silage making operations, while the present part 2 covers losses which take place in storage.
The main interest in storage losses is for silage where losses are large, typically 20% or more, and the subject is very complex. Of particular concern is the effect on silage losses of factors such as degree of wilt, chop length, stage of maturity of grass, and whether or not an additive has been used. However , some information about the much smaller losses which occur during the storage of hay is also reviewed.
* Scottish Centre of Agricultural Engineering, Bush Estate, Penicuik, Midlothian, EH26 0PH
Received 3 May 1988; accepted in revised form 26 August 1989
1
0021-8634/90/010001 + 30 $03.00/0 (~ 1990 The British Society for Research in Agricultural Engineering

2 LOSSES D U R I N G C O N S E R V A T I O N OF GRASS F O R A G E , 2
c oxygen concentration, fraction D digestibility (D value) of grass, %
dm D a diffusion coefficient of oxygen
through air, c m 2 s - 1
Ds diffusion coefficient through silage, c m 2 S - 1
d silage dry matter (dm) content, % F fermentation quality indicator k silage permeability, m 2 l mean chop length, mm
Pk silage buffering capacity p pressure, Pa
Notation
Ap pressure difference across a plastic sheet, Pa
q rate of flow of oxygen per unit area of section, m s -1
U permeability of plastic sheet, cm atm - 1 h - 1
x general position variable, m Z silage sugar content, % e dynamic viscosity, P a s q~ porosity r tortuosity p silage density, kg m -3
Po density at zero porosity, kg m -~
The review of information in the literature about silage storage losses was hampered by inconsistencies between authors about the meaning of some of the categories of loss. Eventually, it was found convenient for the purposes of this paper, to subdivide losses according to the main mechanism by which they arise, the fermentation process, air infiltration, and the production of effluent. Air infiltration losses were further subdivided into those arising during filling of silos, during storage, and during feeding out, and also between invisible loss caused by oxidation of nutrients, and visibly spoilt, unusable material.
2. Hay storage losses
Rees a reviewed information about the mechanism and extent of losses in hay which has been put into store at too high a moisture content from safe keeping. For good hay stored at about 20% moisture content (wet basis) he assumed storage losses of 2%, the sum of equal contributions from grass respiration and microorganism activity. Honig 4 derived a curve for hay storage losses against moisture content from a number of early German sources (Fig. 1). Klinner s derived a similar curve from various sources for both hay and silage storage losses. There are also a number of reported studies of hay storage losses for North American lucerne crops, e.g. Nelson, ~-a Rotz et al. 9°10 Losses again increase with moisture content, but are higher than in grass crops, typically around 6 - 8 % at 20% moisture content (wet basis). Higher losses may arise because the ambient temperatures immediately after harvest are very much higher where lucerne is grown, as well as due to the crop being different. Buckmaster et al. 11 have developed a model to predict lucerne hay storage losses, by consideration of the heat generation and transfer from the time of baling.
Parke et al.12 and Parke and Dumont la assumed Klinner's curve to represent hay and silage storage losses in their operational research model. For the current model, the same curve will be used, but for grass hay storage losses only, which is in reasonable agreement with the information presented by Rees a and Honig. 4 Also, because typical grass hay storage losses are so low, a more complex treatment is not justified. However , as an alternative to the normal strategy of waiting until storage moisture contents of around 20% moisture content. (wet basis) are reached before baling field dried hay, some

M. B. M c G E C H A N 3
o
ul u~
o
E
20
10
/ /
/ / H a y
, i I 515 15 25 35 45 Moisture content (wet basis)~ *I.
Silacj/
I
65 75
Fig. I. Loss o f dry matter in store for hay and silage versus moisture content. hay; s - - - , hay; 4 63, hay a
, silage and
farmers bale hay at higher moisture contents, and then allow stacked bales to dry further in the field. If the model were to be used to examine the economics of this strategy, a sub-model representing field drying of and losses from baled grass hay, similar to that developed by Buckmaster et al. 1~ for lucerne, would be required. An equation to represent respiration losses during barn drying of hay, similar to that for swaths in the field, has been discussed in Part 1 of the paper. 2
3. Silage losses related to fermentation
3.1. The silage f e rmen ta t ion process
The fermentation of silage is a complex biochemical process, about which there are a large number of reported studies. The most comprehensive description of the process is that given by McDonald. TM The following brief description is based mainly on Clark. TM
When a silo is sealed, lactic acid bacteria, present in low numbers on fresh plant material, multiply and establish themselves as the oxygen in the silo is progressively exhausted through plant and microbial oxidation processes. Aerobic bacteria, dominant in fresh herbage, are suppressed and many die. Plant sap supplies glucose and sucrose which are converted to lactic and acetic acids and the pH falls. There are two main types of lactic acid bacteria, homolactic and heterolactic; homolactic are preferable since they produce more lactic acid from a given quantity of lactose with no gaseous products, whereas a heterolactic fermentation produces lactic and other acids plus gases such as carbon dioxide (COz) which represents a loss of dry matter (dm). Competition from other anaerobic species, particularly clostridia, can be a serious problem especially in wet material, since they destroy lactic acid and amino acids producing butyric acid, amines and ammonia which are toxic, the pH rises and the silage becomes unstable. Butyric acid has an offensive smell, drastically reducing the paliatability and hence the voluntary intake of silage by ruminants. Enterobacteria and yeasts are other groups of microorgan- isms which can be active under certain conditions.

4 LOSSES D U R I N G C O N S E R V A T I O N OF GRASS F O R A G E , 2
_0
0
. ~ . ~ . ~
~ N ~ N N
. _ . . . . . . . . . . . . . . . . . .
O 0 " ~ ' ~
o o N N ~ ~ . ~ . ~
o o o o ~ • ~ ' ~ . . . .
~ o o o
N N N N N N
0 0 0 0 0 0
~ . [ . [ . ~ . [ . ~ . [
0
c -
O
e -
~ ~ ~ - ~ ~ o
+ "O
d ~ r ) .~ .
+ 8
+
0 "0 -~
" ~ ' u ' ~ 0 ~ I~ - u O ~ ~ 0 ~ , $ +
d ~ ~ - ~ ~ + ~ ' r . ,- + --~ -6 ~ Z • ,:, . + ~,,.e.o = + ,', ,., ~ , . , , -,~+ - "a ~ :£ --~-u + + . - u . ~ " ~ +
.o ~ , ~ 0 . ~ , ~ ~+ + ~+ " . ~ ' ~ ' ~ ' ~ = ~, ,~d6 + o
~ . u + + ~ + . ~ . ~ ~ ~ o o - ~
t ~ + + ~ = ' ~ + ~ u : t + : : 1'
d
+
Z O
+ ,.-,
i f + , . , + r ) ~ ' ~ ,.,,
8 + . ; ° = • .,~ ,-, 7 Z " u . - ~ 0 ..,. ~
+ ~ "n ~ . . m + "~ .'N,'~
~ . ~ t ~ _ ~ ,., = " 8 'r= .~ .?:: ~
"U t c.,I ,~ ~
0
0
0
.o
¢ tp,

M. B. McGECHAN 5
Table 2
Fermentation loss estimated from initial grass composition TM
Composition of grass, Reaction no. Nutrient Loss of % ofdm (from Table 1) loss, % dm, %
Fructrose 10-0 6 5 0.5 Glucose 5-0 4 24 1-2 Malic acid l-5 12 67 1.0 Citric acid 1.0 8 46 0-5 Serine 0-8 15 58 0.5 Argenine 1.1 16 24 0-3 Total 4.0
3.2. Losses arising f r o m silage fermentat ion reactions
The main biochemical reactions representing fermentat ion by lactic acid bacteria, as described by McDonald , 14 are listed in Table 1. The dm losses associated with these reactions are described by McDonald and Whit tenbury is and by McDonald et al.,~7 and the energy content losses are described by McDonald et al. ~8 Energy losses are generally lower than dm losses.
McDonald and Whit tenbury ~6 and McDonald et al. ~7 calculated dm losses associated with typical sets of fermentat ion reactions derived according to the composit ion of the grass crop (Tables 2 and 3). Calculated total losses were about 4%, which they regarded as a typical maximum loss level for a good lactic acid fermentat ion of a grass crop, since some fermentat ion would be by homolactic bacteria with no dm loss. They also suggest that the organic acid (citric and malic acid) content of a particular plant will have a marked effect on the total fermentat ion loss. McDonald et al. le calculated the proport ion of grass constituent fe rmented by each reaction in Table 1 by analysis of the fermentat ion products in the silage produced in an exper iment with four silos, obtaining dm loss levels below 2% (Table 4). The proport ion of fermentat ion by homolactic bacteria was relatively small.
Much higher losses occur when there is a significant fermentat ion by clostridia, both to the water soluble carbohydrate (WSC) and in the form of degradat ion of the ni trogenous (protein) fraction of the crop (Table 1).
A higher level of loss occurs when WSC is fe rmented by yeast rather than by lactic acid bacteria (Table 1). The reactions caused by enterobacter ia are complex and not well
Table 3
Fermentation loss estimated from initial grass composition 17
Composition a f t e r Reaction no. Composition of grass , hydrolysis of water (from Nutrient Loss of % of dm soluble carbohydrates Table 1) loss, % din, %
Fructan 9-0} /5-6 18 48-9 2.76 Fructrose 4.0 Fructrose 15.7 9.0 5 4.8 0.43 Sucrose 3.01. 1.1-1 2 0 0 Glucose 4.0J Glucose 5.7 4 24.0 1-36 Citrate 1.5 Citrate 1-5 9 29.7 0.45 Malate 1.5 Malate 1.5 11 32-8 0-49 Total 23.0 24.3 5.46*
* This is the total compared with composition after hydrolysis. Total loss of dm compared to initial grass composition is 4.2%
6 LOSSES DURING C O N S E R V A T I O N OF GRASS F O R A G E , 2
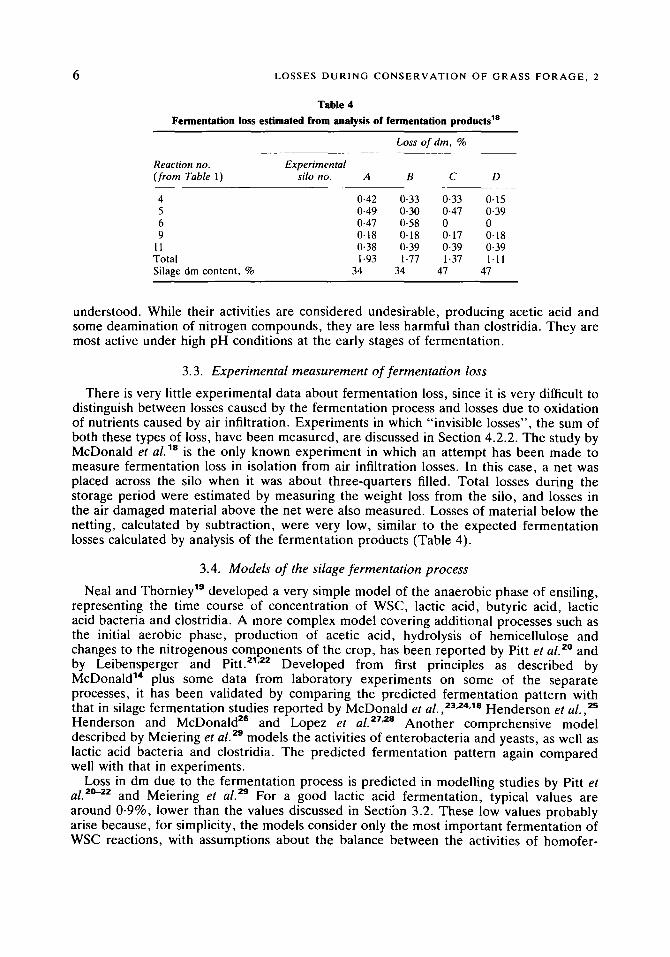
Table 4
Fermentation loss estimated from analysis of fermentation products TM
Loss of din, %
Reaction no. Experimental (from Table 1) silo no. A B C D
4 0-42 0.33 0.33 0.15 5 0-49 0.30 0.47 0.39 6 0-47 0.58 0 0 9 0-18 0.18 0.17 0.18
11 0.38 0.39 0.39 0.39 Total 1-93 1.77 1.37 1.11 Silage dm content, % 34 34 47 47
understood. While their activities are considered undesirable, producing acetic acid and some deamination of nitrogen compounds, they are less harmful than clostridia. They are most active under high pH conditions at the early stages of fermentation.
3.3. Experimental measurement o f fermentat ion loss
There is very little experimental data about fermentation loss, since it is very difficult to distinguish between losses caused by the fermentation process and losses due to oxidation of nutrients caused by air infiltration. Experiments in which "invisible losses", the sum of both these types of loss, have been measured, are discussed in Section 4.2.2. The study by McDonald et al.la is the only known experiment in which an attempt has been made to measure fermentation loss in isolation from air infiltration losses. In this case, a net was placed across the silo when it was about three-quarters filled. Total losses during the storage period were estimated by measuring the weight loss from the silo, and losses in the air damaged material above the net were also measured. Losses of material below the netting, calculated by subtraction, were very low, similar to the expected fermentation losses calculated by analysis of the fermentation products (Table 4).
3.4. Models o f the silage fermentat ion process
Neal and Thornley 19 developed a very simple model of the anaerobic phase of ensiling, representing the time course of concentration of WSC, lactic acid, butyric acid, lactic acid bacteria and ciostridia. A more complex model covering additional processes such as the initial aerobic phase, production of acetic acid, hydrolysis of hemicellulose and changes to the nitrogenous components of the crop, has been reported by Pitt et al. 2a and by Leibensperger and Pitt. 21"22 Developed from first principles as described by McDonald 14 plus some data from laboratory experiments on some of the separate processes, it has been validated by comparing the predicted fermentation pattern with that in silage fermentation studies reported by McDonald et al. ,23.24.18 Henderson et al.,2s Henderson and McDonald 2e and Lopez et al. 27"2a Another comprehensive model described by Meiering et al. ze models the activities of enterobacteria and yeasts, as well as lactic acid bacteria and clostridia. The predicted fermentation pattern again compared well with that in experiments.
Loss in dm due to the fermentation process is predicted in modelling studies by Pitt et al. 2°-z2 and Meiering et al. 2s For a good lactic acid fermentation, typical values are around 0.9%, lower than the values discussed in Sectibn 3.2. These low values probably arise because, for simplicity, the models consider only the most important fermentation of WSC reactions, with assumptions about the balance between the activities of homofer-

M . B . M c G E C H A N 7
mentative and heterofermentative bacteria; to this is added an additional loss if some clostridial fermentation occurs. However, they ignore the fermentation of organic acids and amino acids, and in the case of the model of Pitt et al. ,20-,~ fermentation of WSC by yeasts also. It can be seen from Tables 1-3 that the reactions which are not considered, although of minor importance to the fermentation pattern, account for a significant proportion of the dm loss. Hence the models as currently developed probably under- estimate fermentation loss.
3.5. Factors influencing fermentat ion quality
Factors influencing the extent of clostridial activity and the formation of butyric acid have been discussed by Mcdonald, 14 and can be illustrated by the model of Pitt et al. 20-~ Clostridial fermentation generally occurs when dm contents are low (below about 20%), or when WSC contents are low (below about 8%). WSC contents are higher in grass than in other forage crops, and also vary a little between species; they are generally higher in sunny weather conditions and in more mature crops. The buffer capacity of the crop also has an effect; clostridial fermentations are more likely to occur in legumes such as lucerne and clover which are more highly buffered, than in grass.
The effect of formic acid in reducing clostridial activity and losses in wet silage was illustrated by Henderson and McDonald a° and by Wilkins. al Ohshima et al. aa and Ohshima and McDonald an showed that formic acid additive reduced the very large losses of the nitrogen (protein) constituent from clostridial activity in lucerne silage, but the benefit in grass was much less marked. The extension of their model to simulate clostridial silage fermentation by Leibensperger and Pitt al illustrates the higher level of dm loss found with this type of fermentation.
Chopping and bruising are also thought to increase the likelihood of a favourable fermentation; nutrients are more accessible to microorganisms, lactic acid is produced more rapidly, and a stable pH is achieved in a shorter period than with long material. Murdoch et al. a4 and Murdoch 35 measured high butyric acid contents and lower rates of lactic acid production in unchopped compared with chopped or lacerated silage. Weise 36 observed a greater activity by enterobacteria in long compared with chopped material. However, Wieringa 37 noted a reduction in butyric acid fermentation from very severe laceration, but almost no effect from gentle laceration or chopping. The model of Pitt et al. a°-aa has not been found to give an adequate representation of the effect of chopping found in these experiments. Increasing the initial counts and growth rates of lactic acid bacteria, in a way which would be expected if nutrients are more readily available, makes only a very small difference to the fermentation pattern simulated by the model.
3.6. Prediction o f silage fermentat ion quality
In addition to simulation models, some simple systems have been devised to predict the likely fermentation pattern in terms of factors such as those discussed in Section 3.5.
Weissbach et al. a8 recommended using the following equation as a guide:
V = d + 8Z /Pk (1)
where F > 45 for a good fermentation, 45 > F > 35 for an uncertain fermentation, F < 35 for a poor fermentation.
The Liscombe Star System (ADAS 39) has been devised to give a guide to farmers about whether to use formic acid based additives, and at what application rate (Table 5). On the basis of information from silage fermentation studies, it effectively predicts the likely extent of clostridial activity without additive in terms of grass species, growth stage,

8 LOSSES DURING CONSERVATION OF GRASS FORAGE, 2
Table 5 "Liscombe Star System ''a9
Grass variety (sugar content)
Growth stage
Fertilizer nitrogen
Weather conditions (over several days)
Wilting
Chopping and/or bruising
Timothy/M Fescue * Perennial ryegrass, Lolium perenne ** Italian ryegrass, Lolium multiflorum *** Leafy silage 0 Stemmy mature * Heavy (125 kg/ha + ) - * Average (40-125 kg/ha) 0 Light (below 40 kg/ha) * Dull, wet (less than 2% sugar) - * Dry, clear (2-5% sugar) 0 Brilliant, sunny (3% sugar or more) * None (15% dm content) - * Light (20% dm content) 0 Good (25% dm content) * Heavy (30% dm content) ** Flail harvester or forage wagon * Double chop * * Precision/twin chop ** *
Star ratings are added for each of above six categories to determine rate of additive application: 5 stars, no additive needed; 3 or 4 stars, additive at recommended rate; 1 or 2 stars, additive at higher recommended rate; 0 stars, unsuitable conditions for making silage
fertilizer nitrogen status, weather conditions, degree of wilt and chop length. The effects of weather condition, for instance, would make a difference of up to 1% in the grass sugar content, changing the sugar content/buffering capacity quotient and hence the likely fermentation pattern.
4. Si lage losses due to air infiltration
4.1. N a t u r e o f air infi l tration losses
Losses due to air infiltration take place during filling of clamps, during the storage period, and while feeding out.
When a clamp is being filled, grass is still alive and continues to respire in a similar manner to that which occurs when wilting in swaths, except that there may be some constraint due to a reduced oxygen concentration in parts of the silo. Respiration oxidizes the WSC component of the material. After the silo is sealed, this continues with a progressively reducing oxygen concentration during the early stages of the fermentation process, until all the oxygen has been used up. Any CO2 produced by fermentation reactions tends to displace gases already present, accelerating the exhaustion of oxygen. After fermentation has taken place, grass is dead but some of the enzymes which control respiration in the live plant may still be present and some respiration under their control may continue if any oxygen is available. However, a significant proportion of respiration during storage will be by microorganisms. During the storage period, a layer of visibly spoilt unusable silage is formed immediately below the sealing sheet, known as "surface waste". There is also some evidence that invisible oxidation losses occur throughout the whole mass of silage during the storage period. After a clamp is opened, aerobic microorganisms multiply and rapidly become the main mechanism by which oxidation of nutrients occurs during the feed out period. Generally less serious invisible oxidation losses take place but on occasions there can be serious local heating and moulding, resulting in more visibly spoilt, unusable material. 40

M . B . McGECHAN 9
4.2. Experimental studies into air infiltration losses in silage clamps
4.2.1. Surface waste
Values of surface waste in horizontal clamps, sealed by plasic sheet, were measured by Bastiman and Altman 41 (Table 6) and by Mayne and Gordon. '~ Under farm conditions Bastiman and Altman 4~ observed levels of surface waste which were higher in wilted silage compared with direct cut materials; additive had no effect; comparing machines, surface waste was lowest with a flail harvester, slightly higher with a precision chop or double chop harvester and highest with a loader wagon, but in some cases the differences were so small that their significance was doubtful. Mayne and Gordon 42 found much lower levels of surface waste of under 1%, probably because of their ideal experimental conditions.
Surface waste values measured in experimental silos during the series of experiments reported by McDonald et al. ~Saa'4a'~ and Henderson et al. 2s'2s are summarized in Fig. 2. Grass was harvested with a flail forage harvester, or not chopped at all. Values are very variable, but generally higher for wilted than for wet material.
Surface waste in experimental silos was measured by Weise et al. ~ ' ~ in a study of the effects of different degrees of consolidation (density) and sealing.
4.2.2. Invisible losses arising from air infiltration and fermentation
A number of experimental studies have been reported in which "invisible loss" has been measured by comparing the weights of material put into and taken out of silos, then subtracting the weights of visibly spoilt material and effluent. However , it is impossible to distinguish between loss which has arisen due to fermentation and that due to air infiltration; nor is it possible to tell at what stage air infiltration losses have taken place, except that feed out losses may or may not be included.
Mayne and Gordon ~ reported invisible losses for three silages, unwilted, i.e. cut and picked up in a single operation by a flail harvester, unwilted precision chopped and wilted precision chopped (Fig. 3). The quantity of material taken out was measured immediately after opening the silo so there was no feed out loss. Invisible losses have also been measured by Bastiman and Altman 41 for a large number of silages stored in a range of silo types which, although made at experimental husbandry farms, represented near normal farm practice (Table 6). These included aerobic deterioration at feed out.
Table 6
Effect of harvesting machine on surface waste and invisible losses 41
Pairs of Mean loss, % dm harvester types No, of compared Surface waste Invisible loss comparisons
Flail 4.88 15-97 q Precision chop 5.02 17.43 ~ 6 S.E.D. 1.04 4.27 ) Flail 3-37 10.73 ] Double chop 4.47 12.57 ~ 3 S.E.D. 1-01 3-66 Flail 3.37 10-73 ] Loader wagon 5.60 14-80 j~ 3 S.E.D. 2.46 5-08 Precision chop 4-28 14.10 ] Loader wagon 6-12 11.20 ~ 5 S.E.D. 1.07 2.69 J

10 L O S S E S D U R I N G C O N S E R V A T I O N O F G R A S S F O R A G E . 2
20% [] [] Ca)
E "0
i ;
U
"c
15
X
®
10 X X
O ® X
® X
5 x x ~ ®e
®
0 A . I I 1 V 2 0 3 0 4 0 5 0
d ,~ x ~ .9o
rn C o ® • "~ 1 5 - • L
• - ~ ¢-
{_ • ~ ®
_~ 10 Xe ,Q
> × c X X m •
c .5 .9 ×
; x @ X X
E ~ X
~, 0 I I I 2O 3O 4 0 5O
d m c o n t e n t ) "/o
Fig. 2. Surface waste (a) and fermentation loss plus invisible air infiltration loss during storage C o) measured in experiments o f McDonald et al. la~a~a.~ and Henderson et al. 2s~6 0 , ryegrass, long; x , ryegrass, bruised or flail harvested; ®, timothy, meadow rescue or cocksfoot; 171, special treatments
including delayed sealing, applying an external source of heat and no compaction

M. B. M c G E C H A N 11
2 5
,g
2o
.~ 1 5 nl
._c 10
g .,3 5
E 11
~ _ ~_~_ _ additive ~ Additive at J recommended rate
,; ;:;::0tommended r a t e
0 t I I I I 1 I I I I I I 2 0 2 4 6 8 10
' L i s c o m b e S t a r ' r a t i n g
Fig. 3. Fermentation loss plus invisible air infiltration loss during storage. ×, unwilted flail haroested; 63, unwilted precision chopped, El, wilted precision chopped, experimental data points obseroed by Mayne and Gordon. ~ , loss in terms of factors in "Liscombe star" system at different levels o f additive application; as - - - , critical loss level (if this is exceeded the additive rate should be
increased)
Gaseous losses due to oxidation and fermentation in the edible material (i.e. excluding surface waste), measured in the fermentation studies reported by Mcdonald et al. 18"~3"~'~ and Henderson et al. 2s'2s are summarized in Fig. 2. This shows a trend towards lower losses at high dm contents.
Honig 4 has assembled average values of "residual respiration and fermentation gas formation" losses in relation to silage dm content, from a series of measurements made in Germany with farm scale silos (Fig. 4). Slightly lower loss values were found by Zimmer 47"4a with small scale gas tight experimental silos. More recently Zimmer and Wilkins 4a have collated values of in-silo losses from a series of coordinated silage wilting trials carried out in several European countries, and found a similar decrease in loss with an increase in dm content (Fig. 4). They also observed lower loss levels with formic acid treated silages than with untreated silages. This they attributed to a higher level of homolactic bacterial activity, relative to that of heterolactic bacteria, with formic acid. However, there were variations between countries in experimental techniques and in the categories of loss included in these overall loss figures.
The effect of chopped compared to long material, has been observed by Ulvesli et al. ~0 who found a reduction in storage losses from 13.5 to 4-8% with direct cut silage, and by Zimmer sl who observed a reduction in overall losses from 27-1 to 18-0%.
4.2.3. Aerob ic deterioration during f eed out
Rees s2 explored experimentally variations in loss due to aerobic deterioration in relation to temperature rise, depth, time and pH after air exposure. Henderson et alf l a also carried out experiments on aerobic stability of silages, in which pH rise, maximum temperature above ambient, and sum of temperature rise showed good correlation with dm loss. Crawshaw and Woolford ~ suggest that well preserved silages, with a higher

12 L O S S E S D U R I N G C O N S E R V A T I O N O F G R A S S F O R A G E , 2
2 5
2O
5
1 I I I V 2 0 3 0 4 0 5 0
d m c o n t e n t ; " / ,
Fig. 4. Silage storage loss in relation to dm content. Total in-silo losses including effluent: - - , farm scale4;-- , small gas-tight experimental silos4~'4a; . . . . . . . . . , "Eurowilt" trials. ~ Residual respiration
and gas fermentation losses: - - - - - , farm scale4; . . . . , small gas-tight experimental silos 47~'a
proportion of lactic acid, are more subject to this type of deterioration than badly fermented silages containing acetic or butyric acids. Almost zero losses in silages containing more than 0.5% butyric acid were observed by Ohyama et al. ss T h e effect of organic additives on reducing susceptibilty to aerobic deterioration has been found to vary. Decreased deterioration with proprionic acid at a high application rate was shown by Crawshaw and Llewelyn, ~ Crawshaw et al. 57 and by Ohyama et al. , ss and with formaldehyde by Ohyama and McDonald. sa Crawshaw et al. s7 found decreased deteriora- tion with very high application rates of formic acid, but with a formic acid dosage more like the normal for silage additives Ohyama and McDonald sa found an increase in deterioration compared with using no additive.
4.3. M o d e l s o f air infi l tration loss
Pitt ss has developed models of air infiltration during storage to both tower and horizontal (clamp) silos. These are based on diffusion theory, gas movements driven by concentration differences. They predict steady state oxygen concentrations and rates of oxidation loss in relation to position in the silo, during the storage period. For a horizontal silo, the position is just the depth below the surface. Pitt assumed a respiration rate given by the same equations as for the initial phase of ensiling (Pitt et a/.2°), i.e. appropriate to respiration of live grass material.
60 • " ~ 59 Savoie used a simplified adaptation of Pitt s tower silo model to determine the optimum thickness of polythene film covering a semicylindrical stack of silage on a flat concrete base.

M. B. M c G E C H A N 13
Buckmaster et al. el have extended Pitt's sa model to represent air infiltration during the filling of silos and during the feed out period, still assuming oxygen movement due to diffusion and the same respiration rates. Using this model of air infiltration plus the silage fermentation model of Pitt et al., 2°'-~ they predict the losses which take place during filling silos, during storage and during feed out for north American lucerne and maize crops. Losses during filling and feed out are dependent on work rates for these operations. Total losses in the range 3.7-12.6%, depending on conditions, were similar to some measured data for these crops.
Weise et al. 4s'4e discuss a model of air infiltration in a horizontal silo during filling and during the early part of the storage period. They considered gas exchange due to diffusion plus CO2 produced by the fermentation reactions. They introduced the concept of the thickness of the "endangered surface layer" which is subject to losses during filling and storage. They calculated daily work rates to keep these losses to an acceptable level.
An alternative model of air infiltration to horizontal silos during the storage period, based on gas exchange due to pressure differences is currently being developed by McGechan. ra Fermentation losses of up to 4% in grass crops, as discussed in Section 3.2., produce a volume of CO2 several times the volume of the silo; this increases the CO2 concentration in the silage gas space to over 90% at the end of the fermentation period. The higher density of this gas mixture compared to the outside air creates a hydrostatic pressure in the silo, which, due to imperfect sealing, drives gas out of the bottom and pulls air in at the top. While there is a shortage of data about parameters such as seal permeability, preliminary estimates suggest that pressure differences can account for a faster rate of air infiltration than diffusion. Also, the pressure difference model predicts a much higher oxygen concentration near the top surface of the silo, which would account for the layer of totally spoiled material found with grass crops.
A model of air infiltration at feed out driven by pressure differences is currently being developed by Hoxey. na In this case, pressure differences arise both because of high gas densities due to the presence of CO2, and low gas densities due to local heating. To link up with this a microbiological model representing the activities of microorganisms during aerobic deterioration has recently been developed by Courtin and Spoelstra. ~
4.4. Studies o f factors influencing air infiltration into silage
Losses due to air infiltration depend oN the rate of gas movement in silage. A number of workers have investigated gas movements in silage material, demonstrating relation- ships with factors such as porosity, density and chop length. Information about typical values of chop lengths and densities of silage are reviewed in Sections 4.4.4. aqd 4.4.5.
4.4.1. Gas m o v e m e n t s by dif fusion
As part of a research programme on aerobic deterioration, Rees et al. s s '~ carried out experiments in which oxygen was allowed to diffuse through samples of silage in a cylindrical chamber with one open and one closed end, held with its axis horizontal. The oxygen concentration at the closed end was measured at a set time period after the open end was exposed to the atmosphere. Assuming that there was no significant respiration to use up oxygen as it passed through the silage material, they calculated the diffusion coefficient D~ from a solution of the one-dimensional diffusion equations (Fick's Laws):
Oc q = -O~ 0---~ (2)
Oc 0% Ot = O, ax 2 (3)

14 LOSSES D U R I N G C O N S E R V A T I O N OF GRASS F O R A G E , 2
From results for silage densities ranging from 600 to 900 kg m -3 and mean chop lengths 10-29 mm, they developed the following relationship:
In Ds = - 0 - 0 0 4 7 3 p - 0 .0171 - 0 -85 (4)
They thus modelled the diffusion coefficient as an exponential function of density, and hence of porosity tp, since
dp = 1 - P l P o
In contrast for his model of air infiltration into silos by diffusion (Section 4.3.), Pitt 59 assumes Eqn (2) for the rate of diffusion flow of oxygen, and that the diffusion coefficients through air and silage are related as follows:
Ds = D . t p r (5)
Thus the rate of diffusion is constrained to be proportional to q~. The diffusion coefficient for oxygen through air, Da, is 17"81 X 10-6mZs-I at 0°C, and is approximately proportional to the square of absolute temperature, ss giving a value of 20-23 x 10 -6 m 2 s - l at 18°C. The tortuosity, r, is the ratio of the path length through air to the path length through silage, for which Pitt s9 assumed a value of 2/3 based on Bear; n7 other authors quote values for various porous media which are similar. However, the values of Ds obtained by Rees et al. n5 give values of DJ((pDa) in Eqn (5) much lower than 2/3, and varying with density and chop length (Fig. 5). It is not known whether the tortuosity is
0 36
0 .32
0 .28
0"24 v
~ 0 . 2 0
o
~ 0 1 6 2
~. 0.12
E
0 0 8
0 0 4
(9 []
®
[ ]
[ ] [ ] /x
[ ]
t h 1
(9 ,,~ []
63
600 760 860 960 looo Silage density, kg m -3
Fig. 5. Implied tortuosity from experiments of Rees et aL as --, from Eqn (4); fq, from data points, chop length <~16mm; A, chop length 17-25mm; 63, chop length >~26mm

M. B. M c G E C H A N 15
really much lower for silage than for other porous media, or whether some respiratory activity did take place in the experiments of Rees et aL es so the apparent values of Ds were lower than they should be. Nevertheless, it is quite plausible that tortuosity will vary somewhat with density and chop length.
By measuring changes in concentration of silage pore space gases, including that of an introduced radioactive inert tractor gas, Weise et al. 4 s~ estimated values of a parameter which they called the "exponent of gas exchange" from a range of silage densities and degrees of sealing. While they do not present the equations in which it is used, this parameter, with units of h - l , appears to be similar to Oc/Ot in Eqn (3), and is a measure of the resistance to gas movement by diffusion through the silage plus the seal. Values are presented for a range of silage densities, as well as three levels of sealing representing uncovered silage, silage covered by straw and silage covered wth plastic sheet.
4.4.2. Silage permeability under pressure differences
Parsons and Hoxey 8a have described a piece of apparatus to measure gas movements through silage samples under very low pressure differences of below 100 Pa. This can be used to determine the permeability of silage, according to D'Arcy 's Law:
q = ~xx (6)
A few permeability values in the range 16-207 ~m 2 were recorded for silage with densities in the range 600-800 kg m -3 and varying but unknown dm contents; a large programme of permeability measurements is planned.
4.4.3. Permeability Of polythene sheet
The rate of gas movement through polythene sheet is related to the pressure difference Ap by the permeability U in the following equation:
q = UAp (7)
as well as gas movements under pressure differences Eqn (7) can be applied to diffusion, where Ap represents the difference in partial pressure of a particular gas (such as oxygen) arising from its different concentration on either side of the sheet.
Pitt 59 quotes values of permeabilities of polythene sheet under diffusion in the range 0-004-0-32 cm atm -1 h -1 from several sources. The value of 0.32 cm atm -~ h -~ was for a 0 .152mm thick film, and this was used by Savoie ~ with a proport ionate adjustment fraction for other film thicknesses. However , Pitt argues that all the above values are too low, and that actual permeabilities would be higher due to pin-holes made by forage material. For his own model, he assumed values of 3 cm atm - t h -~ representing a medium seal, and 1 -2cmatm -~ h -~ representing a good seal, based on measurements made by Weise et al. 45"~ However , this medium seal value had been measured for a perforated steel sheet used in experiments, and this was intended to represent a layer of straw rather than a plastic sheet.
There are no known permeability measurements for plastic sheet under pressure differences, although they are likely to be higher than those for diffusion. The effect of pin-holes and leakage around the edges may be more marked also. For comparison, permeabilities for uncoated concrete tower silo material were 17-3 cm atm -~ h -~ under a pressure differential (measured by Kleis and SrivastavaSg), against 3.91 cm atm -~ h -~ with diffusion (measured by Lewallen and Brown7°).
4.4.4. Silage chop length
The chop length of silage varies between different types of harvester (e.g. flail, double chop or precision chop), and for precision chop according to the chop length setting.

16 L O S S E S D U R I N G C O N S E R V A T I O N O F G R A S S F O R A G E , 2
However, for a particular harvester and setting, chop length varies with a skewed distribution; 71 both the average and the distribution of chop length are of interest therefore. The distribution is best described by the cumulative undersize distribution by weight, although as a single parameter the median is more meaningful than the mean. Since the feed mechanism of a harvester does not achieve a perfect alignment of all particles perpendicular to the chopping blades, the actual mean or median chop length is always longer than the set chop length. The relationship between set chop length and actual chop length for different particle orientation has been derived by Freitag. 7a O'Dogherty 71 derived the mean chop length from the set chop length using a simulation model which took account of the random orientation of particles. Pitt 73 has developed an analytical model to describe this relationship, which is applicable to the small particles in a lucerne crop, as well as the longer particles in grass.
Fig. 6 shows the cumulative undersize distribution for different harvester types and settings from data reported by O'Dogherty, 74 Freitag, 7a Gordon and Unsworth, 75 Gordon ~e and Mayne and Gordon, 4a plus some median values reported by Ward et al. 77 and Miiller and Otto. 78 There is reasonably close agreement between all the sources about the distribution pattern. Typical median chop lengths are roughly 80 mm for a flail
300
150
100 BO
6 0
E 4o E ¢ -
" 2 0
o
~) 10
/ /
/ /
/ Of / / /
/ / / /
/ / / Q ~ I ®
/ / 7 . / / . ^ / j r /
e' . / / [] ® ~ / / < , "
2 I I I I I I I I I I I Od 0.5 1.0 5 10 20 4 0 60 E:) 9 0 9 5 9 9 99 .9
C u m u l a t i v e u n d e r s i z e d i s t r i b u t i o n by w e i g h t ~ ' / ,
Fig. 6. Forage harvester chop length distribution f rom a range o f sources. - - , different set chop lengths of a precision chop harvester; 7" - - - , different set chop lengths for an East German self propelled harvester; 72 ®, flail; rz], double chop; ~>, precision chop in wilted crop; x , precision chop in unwilted crop ~aS-n N, percentage undersize values for different chop length settings for one
harvester to give different throughputs. ~e Numbers against lines are set chop lengths, mm

M. B . M c G E C H A N 1 7
harvester, 60 mm for a double chop harvester and 30 mm for a precision chop harvester with a set chop length of 20 mm. Corresponding mean chop lengths, for use in Eqn (4), are roughly 55, 40 and 25 mm for the three harvester types; it will be noted that the first two of these values represent an extrapolation beyond the range of the experimental data (for different settings of a precision chop harvester) on which Eqn (4) was based. A precision chop harvester can be adjusted to give shorter median chop length settings down to about 10 mm, mean chop length for Eqn (4) roughly 8 mm.
Of all the sources, only Mayne and Gordon ~ reported differences in chop length distributions with the same precision chop harvester picking up crops of different dry matter content; shorter median and mean chop lengths were observed in wilted than unwilted grass (Fig. 6).
4.4.5. Silage density
Silage density depends on a number of factors such as chop length, dm content and stage of maturity of the grass. More mature grass contains a higher proportion of fibre and is more rigid; percentage of crude fibre can be assumed to be roughly the complement of D value, although some more precise formulae have been suggested, e.g. by Lewis. ~a
MADF = (98-8-D)/0-82 (8)
where MADF = "modified acid detergent fibre". Furthermore, density increases through- out the ensiling and storage process due to active compression by tractors being driven over the silage, passive compression by the weight of material higher up in the silage stack, and as the structure of the grass tissue collapses. The limited information available about silage density can conveniently be divided into categories representing different stages of the ensilage process.
Graphs and equations representing the density of uncompressed silage in trailers and 80 7 2 78 81 heaps reported by James, Freitag, Miiller and Otto and Miiller have been reviewed
by McGrechan a2 but this work has little relevance to storage losses. Ensiled density in a horizontal silo is that which is achieved after active compression by
a tractor driven over the forage material. Losses due to air infiltration during filling of silos, and possibly in the very early part of the storage period, are likely to be related to this category of silage density. Relative ensiled densities in relation to stack height, chop length and crude fibre content have been represented by Freitag 7z (Fig. 7) for
140
120
i/i
~ lOO "13
~ 8o
~ 60 n~
4O 0 8 0 25
Stack height, mm Median chop length,ram
&
Median chop 25 mm
Median chop length 60mm
48 65 8'o ,0020 2'5 3'5 4o Crude f ibre content , %
Fig. 7. Relatioe ensiled density in relation to stack height, chop length and crude fibre content. -- , Freitag 72 from Miiller; al ®, t'Hart et al.,~ unchopped; A, t'Hart et al.,~ chopped

18 LOSSES D U R I N G C O N S E R V A T | O N OF GRASS F O R A G E , 2
90 1400
1200
1000
•'E 8 0 0
~ (500
"o
400
200
Moisture c o n t e n t (we t b a s i s ) , * / . 80 70 60 50 40,
zero porosity
j ~
Stored density, crude
Stored \ \ \ "~. 2o-26 - , .
Ensiled density ~ "-- ~ " ~
I I I I
10 20 30 40 50 60 dm c o n t e n t , */,
Fig. 8. Silage densities in relation to dm content, - - , Freitag; 72 - - -
t h e o r e t i c a l density at z e r o p o r o s i t y
, Messer and Hawkins; aa - - - - -
measurements made by Miiller. al Miiller and Otto 7a have also presented a table of relative ensiled densities; densities of long material are about 75% of those for short chopped material, and a similar proportionate decrease in density arises from a rise of 5% in crude fibre content. Freitag 72 observed that little additional reduction in volume was achieved after two compactions. Messer and Hawkins a2 have reported ensiled densities in relation to dm content and crude fibre content (Fig. 8), but in this case active compaction was carried out by a man walking over the silage so densities were low. More recently, Mayne and Gordon 'm have reported ensiled densities of 641, 776 and 5 6 4 k g m -3, respectively for unwilted flail harvested, unwilted and wilted precision chopped silage made from perennial ryegrass with a D value in excess of 70%.
Ensiled density in a tower silo is that which is achieved with no active compression, just passive compaction by the weight of material at higher levels in the silo. Freitag 72 has reported average ensiled densities for various silo heights for silage with 35-40% dm content similar to Fig. 7. t'Hart et al. a4 have presented densities 10 h after ensiling in relation to crude fibre and chop length; these values, and the effects of variation in crude fibre and chop length, are broadly similar to those plotted by Freitag 72 (Fig. 7) . Pitt as has developed equations to calculate theoretically the densities at various points in tower silos.

M. B. M c G E C H A N 19
Stored density is that for silage which has been in store for a month or more, by which time it has compacted further under the weight of material higher up the stack and of tyres or straw bales on top of the cover, as the grass tissue structure has disintegrated. Losses due to air infiltration during most of the storage period, and during feed out, are likely to be related to this category of silage density. Tabular values for silage densities at different dm contents presented by ADAS** appear to be based on Messer and Hawkins aa curves after 18 days storage (Fig. 8). Messer and Hawkins 83 data also illustrate the effect of crude fibre content. Plots of stored density against dm and crude fibre level (Fig. 8), and against stack height (Fig. 7) presented by Freitag 72 are similar to tabular values presented by Miiller and Otto 78 and broadly similar to those of Messer and Hawkins. On the basis of data collected in 1984 and 1985, Peel et al. 87 suggest the following equations for calculating stored dm densities in terms of either dm content alone or dm content and MADF:
dm density = 45.9 + 4-96 d (9)
dm density = 133.2 + 4.11 d + 2-27 MA D F (10)
Densities calculated from Eqn (9) are similar to those presented by ADAS. as Densities calculated from Eqn (10) for alternative values of MADF show a similar trend to that found by Messer and Hawkins 8a in relation to crude fibre level, t 'Har t et al. a4 present a table of the effect of chop length and crude fibre on stored density after 10 00 h. This illustrates how the benefit of chopping in increasing density is very small at this stage of storage, the stored density of long material being 96% of that for chopped material. Similar variations, i.e. stored density for median chop length 80 mm, 97% of that with median chop length 25 mm, were reported by Freitag. 72
The theoretical density at zero porosity should be borne in mind when considering the effect of dm content on the density which can be achieved at each stage of the ensilage process. For the specific gravity of grass dm, Rees et aL es assumed a value of 1.67, quoting values of 1-42 from McRandal and McNulty, aa 1.7 from Svenson 8s and Wetterau a° and Pitt as used a value of 1.5 based on the data of Pitt et al. s~ If a value of 1-6 is assumed for the specific gravity of grass dm, the theoretical density of silage at zero porosity is as shown in Fig. 8. Stored densities very near to this theoretical density (near zero porosities) can be achieved at low dm contents and the porosity increases with increases in dm content.
4.4.6. Diffusion coefficients in relation to typical silage densities
Table 7 contains values of ensiled and stored densities selected on the basis of the above sources, with corresponding values of the diffusion coefficient Ds calculated from Eqn (4); values have been calculated for two dm contents levels, three D values, and for both a precision chop harvester with set chop length 20 mm, median chop length 30 mm, mean chop length 25 mm, and a flail harvester with median chop length 80 mm and mean chop length 55 mm. Absolute values of the densities varied between sources, so the selected values represent a compromise, but there was reasonably close agreement in the percentage change with change in chop length, D value, dm content, and between ensiled and stored density, which is reflected in the values selected. The calculated diffusion coefficients suggest that, if diffusion is the main mechanism of air infiltration, contrary to popular belief precision chopped silage is more prone to this type of loss than long material. This effect is most marked for stored material whereas for newly ensiled material the effect is smaller and the source data is perhaps not sufficiently reliable to say confidently that precision chopped material is more prone to losses during filling of silos.

20 LOSSES D U R I N G C O N S E R V A T I O N OF GRASS F O R A G E , 2
Table 7
Selected silage densities with corresponding calculated values for the diffusion coefficient D.
Wilting
Mean Ensiled Stored dm chop
content, Harvester length, D~, O , • I T I 2 S~" _ % type mm D value Density cm 2 s - ] Density c i
Wilted
Direct-cut
30 Precision 25 70 633 0-0139 690 0-0106 chop 65 550 0.0207 600 0-0163
60 468 0-0305 510 0-0250 Flail 55 70 552 0-0123 662 0.0073
65 480 0-0173 576 0-0110 60 410 0-0241 490 0.0165
20 Precision 25 70 748 0-0081 863 0-0047 (25 after chop 65 650 0-0129 750 0-0080 storage) 60 553 0-0204 638 0-0136
Flail 55 70 650 0.0077 828 0-0033 65 565 0-0115 720 0-0055 60 480 0.0173 612 0-0092
5. Silage losses through production of effluent
Effluent is produced when ensiling grass with dm content of less than about 30%. A number of workers have reported effluent production at a range of dm contents. Peters and Weissbach, 92 and Weissbach and Peters 93 have also reported an increase in quantity of effluent produced with increase in stack height, with effluent produced by silage of up to 36% dm content in tall tower silos. Their later study ~3 shows slightly higher values than their earlier study. 92 Increases in levels of effluent production with increase in stack height occur because of the higher pressures exerted on the silage material. Studies of the increase with pressure of effluent quantity produced by small herbage samples in the
94 9'5 laboratory have been reported by McDonald et al. and by Kirsch et al with grass and by Pitt and Parlange ~ with lucerne. Variations in quantity of effluent produced by silages of different chop lengths have been reported by some workers, but this effect varies between sources. Bastiman and Altman 41 measured effluent in 50 silages, fitting an exponential relationship between dm loss and dm content (Fig. 9); they found dm contents of the effluents in the range 3-2-8.8%, average 5.8%; they found no chop length effect. Mayne and Gordon ~ measured effluent production from direct cut silages with about 22% dm content harvested both by a flail and precision chop harvester. While the precision chopped silage produced a low volume of effluent with a different flow rate pattern with respect to time compared with the flail harvested silage, the loss of dm in the effluent was very similar in the two silages. Use of formic acid additive has also been shown to sometimes influence the quantity of effluent produced, but again not in a consistent manner; Henderson and McDonald 3° measured effluent produced by three silages in one experiment finding a marked increase in effluent production with formic acid in one, but almost no difference with the other two silages. Although it might be expected that the dm contents of effluent might vary with the quantity produced, no authors have reported any evidence of this.
For their model of forage conservation Corrall et al. 97 derived a curve for dm loss in relation to dm content (Fig. 9); for a precision chop harvester this was based on a stack height of 3 m selected from a table presented by Peters and Weissbach, 92 assuming the dm content of effluent to be 5% based on McDonald et al. a4 and Mo and Fyriliev) s For flail harvester material, they selected slightly lower values (Fig. 9) on the basis of experimental data for maize published by Messer and Hawkins, ~ although Peters and

M . B . M c G E C H A N 21
' I I ' ' ' ' I
L \
\\ ~ \ \
~ \ - ~- , ~ 4 \ -
• \ -
E \ " \ \ -
O \ " \ • \ ,
( J J ; J 1 , J , ; ,
15 2 0 2 5 3 0 d m c o n t e n t , * / .
Fig. 9. Effluent loss in relation to dm content. - - , Peters and Weissbach, 92 assuming effluent dm content o f 5%, also used by Corrall et al. 97 fo r precision chopped silage and by McGechan 1.1o6.1o~ for all chop lengths; . . . . , Bastiman and Airman; 4~ - - - - - , Weissbach and Peters; 93 . . . . . Corral /et al.gt flail harvested silage; ®. flail harvester silage; F:I, unwilted, precision chopped silage, Mayne and
Gordon 4a
Weissbach 9a reported that maize produced less effluent than grass with the same dm content. For the current forage conservation model, the table of Corrall et al. a7 of percentage dm loss from precision chopped silage (Fig. 9) will be assumed for all silages, regardless of chop length, as this represents the middle of the range of values in the reported studies.
6. Loss relationships for a forage conservation model
6.1. General approach
Silage storage losses are known to depend on a wide range of factors, including dm content, grass maturity, chop length, density and whether or not an additive has been used. For a run of the operational research forage conservation model, where the values of such factors are set as input data, there is a requirement to predict the level of storage loss in each category. From the information currently available, as reviewed in this paper, it is only possible to do this adequately for effluent loss. In this case, the relationship between effluent loss and dm content shown in Fig. 9 can be used. For the other loss categories, the long-term aim is to base predictions of fermentat ion and air infiltration losses on work with models of these processes, in a manner similar to that adopted by Buckmaster et al. sl for lucerne and maize silages. However , such models are not yet sufficiently developed to make confident predictions for grass silage. In particular, silage

22 LOSSES DURING CONSERVATION OF GRASS FORAGE, 2
fermentation models represent a simplification of the process which underestimates the loss which takes place and they do not adequately represent the effect of variations in chop length. Work on air infiltration models based on gas movements driven by density differences has only just commenced. For early work with the forage conservation model, tables of tentative values of surface waste and invisible losses caused by fermentation and air infiltration, in relation to the relevant factors, have been drawn up (Section 6.2.). A similar approach was adopted by Corrall et al. 97 for a previous silage conservation model. Some adjustments have been made to the values used by Corrall et al. a7 to take account of more recent experimental data, and some of the work on the mechanisms of silage fermentation and air infiltration.
6.2. Tabular values o f f e rmenta t ion and air infiltration losses
6.2.1. Surface waste
For their forage conservation model, Corrall et al. 97 assumed a value of 5% for this type of loss with wilted, precision chopped silage based on Heath et al. 1°° figures for lucerne silage, with arbitrary higher values for direct cut and flail harvested material. For the current forage conservation model, suggested values for percentage loss in the form of surface waste (i.e. unusable material) have been selected in relation to chop length and whether wilted or not (Table 8), mainly on the basis of Bastiman and Altman's 41 results. A small chop length effect has been included despite the uncertain significance of Bastiman and Altman's 41 results on this from a consideration of the diffusion effect [Eqn (4) and Table 7]. These values assume good sealing by plastic sheet and no additional loss due to delay sealing.
6.2.2. A i r infiltration loss during f i l l ing o f silage c lamps
For air infiltration loss during the filling of silage clamps Corrall et al. 97 assumed values of 1-3% for crops ensiled without additives, with the low values for direct cutting and for short chopped material. This was based on a value of 1 -2% from Zimmer 1°~ although this was only the difference between total in silo losses for horizontal and tower silos, and a value of 1% from McDonald and Whittenbury. ~s Consideration of Eqn (4) suggests, if anything, a greater susceptibility with short chopped material. Corrali et al. 97 also assumed that this type of loss would be reduced to zero when additives are used, on the basis of work by May-Brown and Harris ~°2 and by Castle and Watson. ~°3 Although May-Brown and Harris 1°2 had shown substantial lower respiratory rates in perennial ryegrass leaves when treated with formic acid, Castle and Watson ~°3 only showed the achievement of higher dm contents when additives were used.
Values of losses during filling clamps for the current forage conservation model suggested from this limited evidence are 1% when additives are used and 2% when they
Table 8
Suggested values for losses due to surface waste
dm Loss due to Harvester content, surface waste, type Wilting % %
Precision Direct cut 20 chop
Flail Wilted 30 12 Direct cut 20 6 Wilted 30 10

M. B. M c G E C H A N 23
are not, with no variation according to dm content and chop length (Table 9). This gives values of total invisible losses similar to those reported by Bastiman and Altman 4~ (Table 6).
After a silo is sealed, respiration of WSC continues until all the remaining oxygen has been used up. However , even for the least dense silage listed in Table 7, this will result in a loss of dm of only 0.12%.
6.2.3. Fermentation and invisible air infiltration losses during the storage period
In their forage conservation model, Corrall et al. s7 estimated likely levels of fermentation loss; they assumed that with additive (at one application rate only) losses would be at the base level of 4% for a lactic fermentation suggested by McDonald and Whittenbury is and McDonald et al. ;17 without additives they assumed it would be raised by clostridial activity to an extent dependent on chop length, degree of wilting and stage of maturity, to as much as 16%. However , some of the values chosen appear to be rather arbitrary on the basis of their quoted sources, ls'~7~s'l~ particularly with reference to the stage of maturity.
As an alternative for the current forage conservation model, a set of curves was derived to represent the fermentation plus invisible air infiltration losses in terms of the factors included in the Liscombe Star System 3a (Fig. 3). It was assumed that the use of additive at the standard rate would give a loss level equivalent to that with no additive and two additional stars, and two further stars would be added when using an additive at the higher application rate. Loss levels were based on those measured by Mayne and Gordon 4a with additive application rates near the standard rate of 2-5 1 t -1, star ratings were allocated for the degree of wilt and harvester type they employed, perennial ryegrass at a leafy growth stage, average fertilizer nitrogen and average weather; this gives total invisible losses broadly similar to those reported by Bastiman and Altman 41 (Tables 6 and 9) (which included aerobic deterioration with their experimental technique). In effect the Liscombe Star System indicates that if the loss level without additive rises above 15% according to these curves, sufficient additive should be used to bring the loss level below 15%.
6.2.4. Aerobic deterioration during feed-out
For their model of forage conservation Corrall et al. 97 assumed values of aerobic deterioration in relation to chop length, whether wilted and whether additive used, with higher losses with additive than without. In contrast, Rees, l°s has observed typical aerobic deterioration losses of 10% of dm or more, much higher than the levels assumed by Corrall et al.;S7 also the total invisible losses reported by Bastiman and Altman 41 (Table 6) can only be explained by assuming fairly high values of aerobic deterioration loss. For the current forage conservation model, tentative values of aerobic deterioriation loss at different dm contents, chop lengths, additive levels and maturity have been selected to give total invisible losses roughly similar to those reported by Bastiman and Altman 41 (Table 6); the values with different chop lengths and maturity are related in a manner which might be expected from the diffusion coefficient calculation with the appropriate stored density from Eqn (4) (Table 7); a 10% aerobic loss was chosen for a diffusion coefficient of 0.009 with additive at the standard rate, half this value with no additive, and a value 50% higher with additive at the higher rate (Table 9). The overall invisible losses derived in this way were slightly higher for flail harvested than precision chopped silage, the reverse of the situation observed unexpectedly by Bastiman and Altman 41 but in each case the margin was too small to be significant. The derived values demonstrate that the benefits from conditions which produce low levels of loss during the storage period are of no benefit because the same conditions also produce high levels

24 LOSSES D U R I N G C O N S E R V A T I O N OF GRASS F O R A G E , 2
Table 9 Invisible losses (fermentation loss, plus air infiltration Iosses duringfilling, storage and feed-out)
Harvester type
dm Liscombe Air infiltration content, D Star loss during
% Additive value rating filling, %
Fermentation plus invisible Aerobic air infiltration deterioration Total
loss during loss at feed- invisible storage, % out, % loss, %
Precision chop
Flail
20 None 70 5 2 (direct 65 6 2 cut) 60 6 2
Standard 70 9 1 rate 65 6 1
60 6 1 Higher 70 5 1 rate 65 6 1
60 6 1 25 None 70 6 2
65 7 2 60 7 2
Standard 70 6 1 rate 65 7 1
60 7 1 Higher 70 6 1 rate 65 7 1
60 7 1 30 None 70 7 2
65 8 2 60 8 2
Standard 70 7 1 rate 65 8 1
60 8 1 Higher 70 7 1 rate 65 8 1
60 8 1 20 None 70 3 2 (direct 65 4 2 cut) 60 4 2
Standard 70 3 1 rate 65 4 1
60 4 1 Higher 70 3 1 rate 65 4 1
60 4 1 25 None 70 4 2
65 5 2 60 5 2
Standard 70 4 1 rate 65 5 1
60 5 1 Higher 70 4 1 rate 65 5 1
60 5 1 30 None 70 5 2
65 4 2 60 6 2
Standard 70 5 1 rate 65 6 1
60 6 1 Higher 70 5 1 rate 65 6 1
60 6 1
15 2 19 12 3 17 12 5 19 9 3 13 7 6 14 7 9 17 5 4 10 3 9 13 3 13 17
12 3 17 10 4 16 10 6 18 7 5 13 5 8 14 5 11 17 3 8 12 3 12 16 3 16 20
10 4 16 8 5 15 8 7 17 5 8 14 3 10 14 3 13 17 3 12 16 3 15 19 3 19 23
22 1 25 19 2 23 19 3 24 14 2 17 11 4 16 11 7 19 9 3 13 7 6 14 7 10 18
19 2 23 15 3 20 15 4 21 11 4 16 9 6 16 9 8 18 7 6 14 5 9 15 5 12 18
15 3 20 12 4 18 12 5 19 9 6 16 7 8 16 7 10 18 5 9 15 3 12 16 3 15 19

M. B. M c G E C H A N 25
of aerobic deterioration; hence there may be little scope for reducing overall invisible losses below about 15%.
7. Silage quality changes associated with storage losses
Losses of dm from silage during storage are associated with reductions in silage quality, to an extent which varies between different categories of loss.
When fermentation losses are high due to the action of clostridia, butyric acid is formed (Table 1, reactions 19 and 20) which drastically reduces the paliatability of the silage and hence its voluntary intake by ruminant livestock. Clostridia also deplete the protein component of silage, seriously reducing its nutritive value; protein nitrogen is converted to ammonia (Table 1, reactions 21, 22, 25 and 26), and the increase in ammonia content also reduces the silage paliatability.
Serious air infiltration losses during the storage period and during feed-out produce material which is not fit to feed and should be discarded.
The material lost when there are invisible air infiltration losses, or fermentation losses caused by lactic acid bacteria, is entirely from the energy supplying component of the silage. Hence there is a small percentage decrease in the energy content and digestibility of the remaining material. Even when the fermentation losses are quite high due to the action of yeast, or because the lactic acid and malic acid contents of the herbage are high, the reduction in nutritive value is small. Losses of digestible material during the fermentation process are offset to some extent by conversion of part of the non-digestible component of the herbage into digestible material.
While effluent losses include digestible material, they also include soluble inorganic compounds ("ash"), so the reduction in quality and digestibility in the remaining material is not great.
8. Conclusions
8.1. Hay storage losses
Storage losses for hay are generally low and of relatively little importance. A relationship between hay storage losses and moisture content has been identified, which is reasonably consistent with the small number of available sources of information (Fig. 1).
8.2. Silage storage losses
Compared with hay, losses which take place during the storage of silage are large, typically 20% or more, and the subject is very complex. Information used and assumptions made in the past by a number of workers about silage storage losses is very variable and often conflicting. Nevertheless, some important trends and effects have been identified which can be used as a guide to likely loss levels. It has been helpful to subdivide silage storage losses according to the mechanisms by which they arise, into loss arising due to fermentation, losses due to air infiltration, and effluent loss. Air infiltration losses arise during filling of silos, during the storage period, and during feeding out, and are a combination of less serious invisible losses and totally spoilt unusable material.
Of all the categories, only for effluent loss can a relationship be specified with any degree of confidence on the basis of reasonably consistent source data. Research into the mechanism of silage fermentation has produced a reasonable understanding of the process which can be represented quantitatively by simulation models which have been developed. True fermentation losses are low for good lactic acid fermentation, but if

26 L O S S E S D U R I N G C O N S E R V A T I O N O F G R A S S F O R A G E , 2
clostridia dominate losses are high and the quality is severely reduced. Models can predict conditions when clostridial fermentation is likely to occur, in terms of dm content, WSC content (as influenced by grass variety, length of and weather conditions during wilting etc.) and use of additives; however, they do not predict any variation with chop length, which research has shown to have an effect. There is some experimental data for air infiltration losses, but with considerable confusion about when they occur, what factors affect susceptibility, and the distinction between true fermentation loss and invisible air infiltration loss during the storage period. Research into the mechanism of air infiltration into silage is still at an early stage, but should eventually lead to simulation models which will indicate likely loss levels; nevertheless some indication of the relative susceptibility of different silage types has emerged by linking early work with information about silage density and chop length. This suggests that, contrary to popular belief, shorter chopped silage offers less resistance to gas movement than long material, despite its higher density.
For work with a forage conservation model, it is proposed to approach incorporation of silage storage losses in two phases. For the first phase, 1'10e'1°7 loss levels in relation to factors such as dm content, chop length, grass maturity and additive use have been based on the best information currently available from reported experimental data, as follows:
(1) effluent loss according to the continuous curve in Fig. 9; (2) surface waste according to Table 8; (3) fermentation loss plus invisible air infiltration losses during filling silos, during the
storage period and during feed-out according to the last column of Table 9.
Later, when simulation models of the silage fermentation process and of air infiltration have been developed further, surface waste, fermentation loss and invisible air infiltration losses will be estimated from runs of these models.
References
1 McGechan, M. B. Operational research study of forage conservation systems for cool, humid upland climates. Part 1, Description of model. Journal of Agricultural Engineering Research (in press)
2 McGechan, M. B. A review of losses arising during conservation of grass forage: Part 1, Field losses. Journal of Agricultural Engineering Research 1989, 44:1-21
3 Rees, D. V. H. A discussion of sources of dry matter loss during the process of haymaking. Journal of Agricultural Engineering Research 1982, 27:469-479
" Honig, H. Sch~itzung der Verluste an Trockenmasse und Energie bei verschiedenen Konser- vierungsverfahren (Estimation of dm and energy losses for different conservation methods). KTBL Grunddaten der Futterwirtschaft. Manuscript Institute of Grassland Forage Research, No. 247, 1976
s Klinner, W. E. Mechanical and chemical field treatment of grass for conservation. Paper 2, Joint Conference on the Institution of Agricultural Engineers and the British Grassland Society, 1976
• Nelson, L. F. Spontaneous heating and nutrient retention of baled alfalfa hay during storage. Transactions of the American Society of Agricultural Engineers 1966, 9(4): 509-512
Nelson, L. F. Spontaneous heating, gross energy retention and nutrient retention of high density alfalfa hay bales. Transactions of the American Society of Agricultural Engineers 1972, 11(5): 575-600, 607
• Nelson, L. F. Storage characteristics and nutritive value of high density native hay bales. Transactions of the American Society and of Agricultural Engineers, 1972, 15(2): 201-205, 210
9 Rotz, C. A.; Sprott, D. J.; Thomas, J. W.; Hathaway, J. E. Preservation of baled high-moisture alfalfa hay. ASAE Paper 83-1533, American Society of Agricultural Engi- neers, St. Joseph, 1983

M. B. McGECHAN 27
lo Rotz, C. A.; Sprott, D. J.; Davis, R..I . ; Thomas, J. W. Anhydrous ammonia injection into baled forage. Applied Engineering in Agriculture 1986, 2(2): 64-69
11 Buckmaster, R. D.; Rotz, C. A.; Mertens, D. R. A model of alfalfa hay storage. Transactions of the American Society of Agricultural Engineers, 1989 32(1): 30-36
12 Parke, D.; Dumont, A. G.; Boyce, D. S. A mathematical model to study forage conservation methods Journal of the British Grassland Society 1973, 33:261-273
la Parke, D.; Dumont, A. G. A simulation model to study forage conservation systems. Dep. Note DN/SY/920/l1007, National Institute of Agricultural Engineering, Silsoe, February 1979
1, McDonald, P. The Biochemistry of Silage. Chichester: John Wiley and Sons, 1981 is Clarke, B. Biochemical and physiological changes occurring during wilting and the early stages
of ensilage. PhD Thesis, University of Edinburgh, 1974 16 McDonald, P.; Whittenbury, R. Losses during ensilage. In: Fodder Conservation (Wilkins R. J.,
ed.). Occasional Symposium No. 3, British Grassland Society 1967, pp. 76-85 17 McDonald, P.; Henderson, A. R.; Ralston, E. Energy changes during ensilage. Journal of the
Science of Food and Ariculture 1973, 24:827-834 la McDonald, P.; Henderson, A. R.; MacGregor, A. W. Chemical changes and losses during
the ensilage of wilted grass. Journal of the Science of Food and Agriculture 1968, 19" 125-132
19 Neal, H. D. St. C.; Thornley, $. H. M. A model of the anaerobic phase of ensiling. Grass and Forage Science 1983, 38:121-134
20 Pitt, R. E.; Muck, R. E.; Leibensperger, R. Y. A quantitative model of the ensilage process in lactate silages. Grass and Forage Science 1985, 40:279-303
21 Leibensperger, R. Y.; Pitt, R. E. A model of clostridial dominance in ensilage. Grass and Forage Science 1987, 42(3): 297-317
" Leibensperger, R. H.; Pitt, R. E. A manual for using the Cornell University silage fermentation model. Department of Agricultural Engineering, Cornell University, Ithaca 1988
2a McDonald, P.; Stirling, A. C.; Henderson, A. R.; Whittenbury, R. Fermentation studies on inoculated herbages Journal of the Science of Food and Agriculture 1964, 15:429-436
24 McDonald, P.; Stirling, A. C.; Henderson, A. R.; Whittenbury, R. Fermentation studies on red clover Journal of the Science of Food and Agriculture 1965, 15:549-557
Henderson, A. R.; McDonald, P.; Wooiford, M. K. Chemical changes and losses during the ensilage of wilted grass treated with formic acid. Journal of the Science of Food and Agriculture 1972, 23:1079-1087
26 Henderson, A. R.; McDonald, P. The effect of delayed sealing of fermentation and losses during ensilage. Journal of the Science of Food and Agriculture 1975, 26:653-667
2, Lopez, J.; Jorgensen, N. A.; Niedermeier, R. F.; Larson, M. J. Redistribution of nitrogen in urea-treated and soy-bean meal-treated corn silage. Journal of Dairy Science 1970, 53: 1215-1224
2a Lopez, J.; Jorgensen, N. A.; Larson, H. J.; Niedermeier, R. P. Effect of nitrogen source, stage of maturity and fermentation time on pH and organic acid production in corn silage. Journal of Dairy Science 1970, 53:1225-1232
Meiering, A. G.; Courtin, M. G.; Spoelstra, S. F.; Paldow, G.; Honig, H.; Subden, R. E.; Zimmer, E. Fermentation kinetics and toxic gas production of silages. Transactions of the American Society of Agricultural Engineers 1988, 31:613-621
ao Henderson, A. R.; McDonald, P. Effect of formic acid on fermentation of grass of low dry matter content. Journal of the Science of Food and Agriculture 1971, 26:653-667
al Willdns, R. J. Ensiled forages and their utilization by ruminants. Proceedings of 3rd World Congress on Animal Feeding, Madrid, 1978, pp. 403-412
~" Ohshima, M.; McDonald, P.; Acamovi¢, T. Changes during ensilage in the nitrogenous components of fresh and additive treated ryegrass and lucerne. Journal of the Science of Food and Agriculture 1979, 30:97-106
Ohshima, M.; McDonald, P. A review of the changes in nitrogenous components of herbage during ensilage. Journal of the Science of Food and Agriculture 1978, 29:479-505
Murdoch, J. C.; Balch, D. A.; Holdsworth, M. C.; Wood, M. The effect of chopping,

28 LOSSES DURING CONSERVATION OF GRASS FORAGE. 2
lacerating and wilting of herbage on the chemical composition of silage Journal of the British Grassland Society 1955, 10:181-188
~5 Mnrdoch, J. C. The effect of length of silage on its voluntary intake by cattle. Journal of British Grassland Society 1965, 20:54-58
ae Weise, F. Einfluss des H~ickselns auf den G~irverlauf in Feuchtsilagen (Influence of chopping on the fermentation pattern in moist silages). Das wirtschafteigene Futter 1968, 14(4): 294-303
a7 Wieringa, G. W. Some factors affecting silage fermentation. |I, Influence of degree of laceration and the bacterial flora from grass. Netherlands Journal of Agricultural Science 1959, 7(3): 237-241
as Weissbach, F.; Sehmidt, L.; Hein, E. Method of anticipating the run of fermentation in silage making based on the chemical composition of green fodder. Proceedings of XII International Grassland Congress, Moscow, 1974, p p 663-673
ADAS. Silage Liscombe Grass Bulletin 2, Liscombe EHF, Dulverton 1984 4o Woolford, M. K. The aerobic deterioration of silage. Agricultural Research Council Research
Review 1978, 4 :8-12 41 Bastiman, G.; Altman, J. B. F. Losses at various stages of silage making. Research and
Development in Agriculture 1985, 2:19-25 Mayne, C. S.; Gordon, F. J. The effect of harvesting system on nutrient losses during silage
making. 2, In-silo losses. Grass and Forage Science 1986, 4 1 : 3 4 1 - 3 5 1
McDonald, P.; Stirring, A. C.; Henderson, A. R.; Whittenbury, R. Fermentation studies on wet herbage. Journal of the Science of Food and Agriculture 1962, 13:581-590
McDonald, P.; Henderson, A. R.; Whittenbury, R. The effect of temperature on ensilage. Journal of the Science of Food and Agriculture 1966, 17:476-480
• s Weise, G.; Rettig, H.; Suckow, G. Untersuchungen zur Quantifizierung des Lufteinflusses bei der Silierung (Studies on the quantization of effects of air in the process of silage making). Archiv fOr Tierern~ihrung 1975, 25:69-82
4e Weise, G.; Rettig, H.; Suckow, G. Losses and stability of silage in dependence on the degree of air influence. Proceedings of 13th International Grassland Congress Leipzig, 1977
47 Zimmer, E. Das Anwelken in seinem Einfluss auf die N~ihrstoffverluste, insbesondere die Bildung von G~irgasen (Effect of wilting on losses, particularly gaseous losses). Tagungsbe- richt 92, Die naturwissenschaftliche Grundlagen der Silierung, Berlin 1967
'~ Zimmer, E. Biochemische Grundlagen der Einsauerung (Biochemical Principles of ensiling). Proceedings 3. General Meeting European Grassland Federation, Braunschweig 1969, pp. 113-124
Zimmer, E.; Wilkins, R. J. Efficiency of silage systems: a comparison between unwilted and wilted silage ('Eurowilt'). Sonderheft 69, Landbauforschung Volkenrode, Braunschweig 1986
• o UIvesfi, O.; Sane, O.; Breirem, K. Ensiling experiments at Stend Agricultural School 1955-61. Silage examination in the Hardaland district 1953-56. Meldinger fra Norges Landbrukscheg- skole, Vollebekk 1965, 44(13): 1-31
51 Zimmer, E. N~ihrstoffverluste bei der Vergarung von Futterpflanzen. I. Der Einfluss der Siloform auf die Hrhe der Verluste (Nutrient losses during the fermentation of forage crops). Das wirtschaftseigene Futter 1967, 13:4
s2 Rees, D. V. H. The aerobic deterioration of grass silage, and its effect on the water soluble carbohydrates and the associated heat production. Journal of the Science of Food and Agriculture 1981, 33" 499-508
Henderson, A. R.; Ewart, J. M.; Robertson, G. M. Studies on the aerobic stability of commercial silage. Journal of the Science of Food and Agriculture 1979, 30:223-228
Crawshaw, R.; Woolford, M. K. Aerobic deterioration of silage in and out of the silo. Agricultural Development and Advisory Serivce, Quarterly Review 1979, 43:167-178
ss O h y a m a , Y.; Masaki, S.; Hara, S. Factors influencing aerobic deterioration of silages and changes in chemical composition after opening silos. Journal of the Science of Food and Agriculture 1975, 26:1137-1147
ee Crawshaw, R.; Llewelyn, R. H. The aerobic deterioration of grass silages. Fifth Silage Conference, Ayr 1978, pp. 4-5
s7 Crawshaw, R.; Thorne, D. M.; Llewelyn, R. H. The effect of formic and propionic acids on the aerobic deterioration of grass silage in laboratory units. Journal of the Science of Food and Agriculture 1980, 31:685-694

M. B. McGECHAN 29
Ohyama, Y.; McDonald, P. The effect of some additives on the aerobic deterioration of silages. Journal of the Science of Food and Agriculture 1980, 26:941-948
Pitt, R. E. Dry matter losses due to oxygen infiltration in silos. Journal of Agricultural Engineering Research 1986, 35:193-205
6o Savoie, P. Optimisation of plastic covers for stack silos. Journal of Agricultural Engineering Research 1988, 41:65-73
el Buclunaster, D. R.; Rotz, C. A.; Muck, R. E. A comprehensive model of forage changes in the silo. ASAE Paper 88-1096, American Society of Agricultural Enginering, St. Joseph 1988
McGechan, M. B. Alternative models of air infiltration to silage clamps. Departmental Note 24, Scottish Centre of Agricultural Engineering, Penicuik 1989
ea Hoxey, R. P. Factors controlling the aerobic deterioration of silage. Institute of Agriculture Engineers, Jubilee Conference, Cambridge 1988
Courtin, M. G.; Spoelstra, S. F. A simulation model of the microbiological and chemical changes accompanying the initial stage of aerobic deterioration of silage. Grass and forage Science 1989 (in press)
Rees, D. V. H.; Andsley, E.; Neale, M. A. Some physical properties that affect the rate of diffusion of oxygen into silage. Journal of Agricultural Science (Cambridge) 1983, 100(3): 601-605
Rees, D. V. H.; Audsley, E.; Neale, M. A. Apparatus for obtaining an undisturbed core of silage for measuring the porosity and gas diffusion in the sample. Journal of Agricultural Engineering Research 1983, 28:107-114
sT Bear, J. Dynamics of fluids in Porous Media. New York: American Elsevier Publishing Company, 1982
ea P a r s o n s , D. J.; Hoxey, R. P. A technique for measuring the permeability of silage at low pressure gradients. Journal of Agricultural Engineering Research 1988, 40:303-307
ea Kieis, R. W.; Srivastava, R. K. Permeabilities of silo wall sections. Transactions of the American Society of Agricultural Engineers 1964, 7:20-21
70 Lewallen, M. J.; Brown, R. H. Oxygen permeability of concrete wall sections. Transactions of the American Society of Agricultural Engineers 1967, 10: 114-115, 122
71 O'Dogherty, M. J. Chop length distributions from forage harvesters and a simulation model of chopping. Journal Agricultural Engineering Research 1984, 30(2); 165-173
72 Freitag, H. Beitrag zum Bemessung und Bewerten yon Prozessen der Griinfuttersilierung (Contribution to the measurement and evaluation of processes of green forage ensiling). Arbeiten zur Mechanisierung der Pflanzen und Tierproduktion, AdL der DDR Forschungs- zentrung FOr Mechanisierung der Landwirtschaft, Schlieben/Bornim No. 8, 1985
7a Pitt, R. E. Theory of forage particle size distribution. Transactions of the American Society of Agricultural Engineers 1987, 30(5): 1246-1253
74 O'Dogherty, M. J. A review of research on forage chopping. Journal of Agricultural Engineering Research 1982, 27(3): 267-289
7s Gordon, F. J.; Unswotth, E. F. The effects of silage harvesting system and supplementation of silage-based diets by protein and methionene hydroxy analogue on the performance of lactating cows. Grass and Forage Science 1986, 41:1-8
7e Gordon, F. J. The effect of silage harvesting systems and feeding on milk production. Grass and Forage Science 1986, 4 1 : 2 0 9 - 2 1 9
Ward, S. M.; Cunney, M. B.; McNnlty, P. B. Power and chop length analysis for trailed forage harvesters. Energy in Agriculture 1985, 4:15-12
7a Miiller, M.; Otto, G. Materials and processing characteristic of grasses and grass silages. Proceedings of 13th International Grassland Congress, Leipzig, 1977
79 Lewis, M. Personal communication, 1988 8o James, R. J. 'Sitran', silage transport model. Mechanisation Group Computer Working Party
Computing Note 7, ADAS 1984 al Miiller, M. Beitrag zu verfahrenstechnischen Grundlagen der Silagebereitung (Contribution to
operational and technical fundamentals for silage making). Dissertation B, University of Rostock, 1969
a2 McGechan, M. B. Losses during forage conservation--a review of available information for use in a forage conservation system model. Dep. Note SIN/487, Scottish Institute of Agricultural Engineering, Penicuik, March 1987 (unpublished)

30 LOSSES DURING CONSERVATION OF GRASS FORAGE, 2
8a Messer, H. J. M.; Hawkins, J. C. The influence of the properties of grass silage in bulk density and horizontal pressure. Journal of Agricultural Engineering Research 1977, 22:55-64
t'Hart, C.; Bosma, A. H.; TeHe, M. G. Physical properties of ensiled grass and corn, silo capacities and silage pressures in cylindrical tower silos. IMAG Research Report 79, Wageningen 1980
Pitt, R. E. Mathematical prediction of density and temperature in ensiled forage. Transactions of the American Society of Agricultural Engineers 1983, 26(5): 1522-1532
ADAS. Earth walled silage clamps. Leaflet 840, 1985 s7 Peel, S.; Cottrill, B. R.; Hucide, C. A.; Radnor, P. Improving predictions of silage density.
British Grassland Society Winter Meeting, London, 1986 McRandal, D. M.; McNulty, P. B. Mechanical and physical properties of grasses. Transactions
of the American Society of Agricultural Engineers 1980, 23(4): 816-821 Svenson, K. Briketter och pelletor. Jord, Groda, Djur 1966, p. 165
9o Wetterau, H. Silageherstellung (Silage manufacture). VEB Deutscher Landwirtschaftverlag, Berlin 1971, pp. 219-229
91 Pitt, R. E.; Straub, R. J.; Koegel, R. H.; Bruhn, H. D. Design criteria for a forage plant fractionation press. Transactions of the American Society of Agricultural Engineers 1982, 25(1): 18-22
92 Peters, G.; Weissbach, F. Factors influencing the formation of effluent in forage ensiling. Proceedings of the 13th International Grassland Congress, Leipzig 1977, pp. 1133-1134
9a Weissbach, F.; Peters, G. Anfall chemische Zusammemsetzung und Futterwert von Silosickers- aft (Quantity, chemical composition and feed value of silage effluent). Feldwirtschaft 1983, 24(2): 78-81
94 McDonald, P.; Stirring, A. C.; Henderson, A. R.; Dewar, A. R.; Stark, G. H.; Davies, W. G.; McPherson, H. T.; Reid, A. M.; Slater, J. Studies on Ensilage. Technical Bulletin 24, Edinburgh School of Agriculture 1960
Kirsch, W.; Schmidt, K. H.; SaM, E. Einsauerungsversuch in Eisenbetonsilos mit der Hoch- druckpressvorrichtung System Schmidt DBP (Ensiling experiments in reinforced concrete silos using the Schmidt DBP high pressure device system). Futterkonservierung 1955, 1:13-26
Pitt, R. E.; Parlange, J. Y. Effluent production from silage with application to tower silos. Transactions of the American Society of Agricultural Engineers 1987, 30(4): 1198-1206, 1208
9~ Corrall, A. J.; Neal, H. D. StC.; Wilkinson, J. M. Silage in milk production; a simulation model to study the economic impact of management decisions in the production and use of silage in a dairy enterprise Technical Report 29, Grassland Research Institute, Hurley, January 1982
98 Mo, M.; Fyrileiv, E. Methods of estimating ensiling losses. Acta Agriculture Scandinavica 1979, 29:49-64
Messer H. J. M.; Hawkins, J. C. The influence of moisture content and chop length of forage maize on silage bulk density and the pressure on silo walls. Journal of Agricultural Engineering Research 1977, 22:175-182
loo Heath, M. C.; Metcalfe, D. S.; Barnes, R. F. Forages, 3rd e d Ames, Iowa: Iowa State University Press, 1973
lol Zimmer, E. Efficient silage systems. Proceedings of Occasional Symposium 11, European Grassland Federation, Brighton 1979, pp. 186-197
102 May-Brown, R.; Harris, C. E. The respiration of drying grass leaves. Annual Report of Grassland Research Institute 1974, 49
lo3 Castle, M. E.; Watson, J. N. Silage and milk production: a comparison between grass silages made with and without formic acid. Journal of the British Grassland Society 1970, 25:65-70
lo4 McDonald, P.; Whittenbury, R. The ensilage process In: Chemistry and Biochemistry of Herbage. (Butler G. W. and Bailey R. W., eds) London and New York: Academic Press, 1974
lo6 Rees, D. V. H. Personal communication, 1985 loe McGechan, M. B. Operational research study of forage conservation systems for cool, humid
upland climates. Part 2, Comparison of hay and silage sysems Journal of Agricultural and Engineering Research (in press)
107 McGechan, M. B. A cost benefit study of alternative policies for making grass silage. Journal of Agricultural Engineering Research (in press)